Kerkhoven, MN Map & Demographics
Kerkhoven Map
Kerkhoven Overview
$27,869
PER CAPITA INCOME
$80,625
AVG FAMILY INCOME
$60,729
AVG HOUSEHOLD INCOME
36.7%
WAGE / INCOME GAP [ % ]
63.3¢/ $1
WAGE / INCOME GAP [ $ ]
$14,776
FAMILY INCOME DEFICIT
0.42
INEQUALITY / GINI INDEX
837
TOTAL POPULATION
377
MALE POPULATION
460
FEMALE POPULATION
81.96
MALES / 100 FEMALES
122.02
FEMALES / 100 MALES
34.9
MEDIAN AGE
3.3
AVG FAMILY SIZE
2.5
AVG HOUSEHOLD SIZE
371
LABOR FORCE [ PEOPLE ]
65.1%
PERCENT IN LABOR FORCE
3.3%
UNEMPLOYMENT RATE
Kerkhoven Zip Codes
Kerkhoven Area Codes
Income in Kerkhoven
Income Overview in Kerkhoven
Per Capita Income in Kerkhoven is $27,869, while median incomes of families and households are $80,625 and $60,729 respectively.
| Characteristic | Number | Measure |
| Per Capita Income | 837 | $27,869 |
| Median Family Income | 203 | $80,625 |
| Mean Family Income | 203 | $90,343 |
| Median Household Income | 329 | $60,729 |
| Mean Household Income | 329 | $69,397 |
| Income Deficit | 203 | $14,776 |
| Wage / Income Gap (%) | 837 | 36.67% |
| Wage / Income Gap ($) | 837 | 63.33¢ per $1 |
| Gini / Inequality Index | 837 | 0.42 |
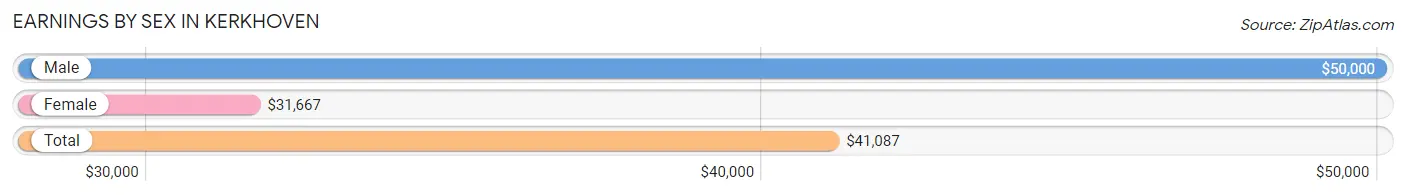
Earnings by Sex in Kerkhoven
Average Earnings in Kerkhoven are $41,087, $50,000 for men and $31,667 for women, a difference of 36.7%.
| Sex | Number | Average Earnings |
| Male | 194 (48.3%) | $50,000 |
| Female | 208 (51.7%) | $31,667 |
| Total | 402 (100.0%) | $41,087 |
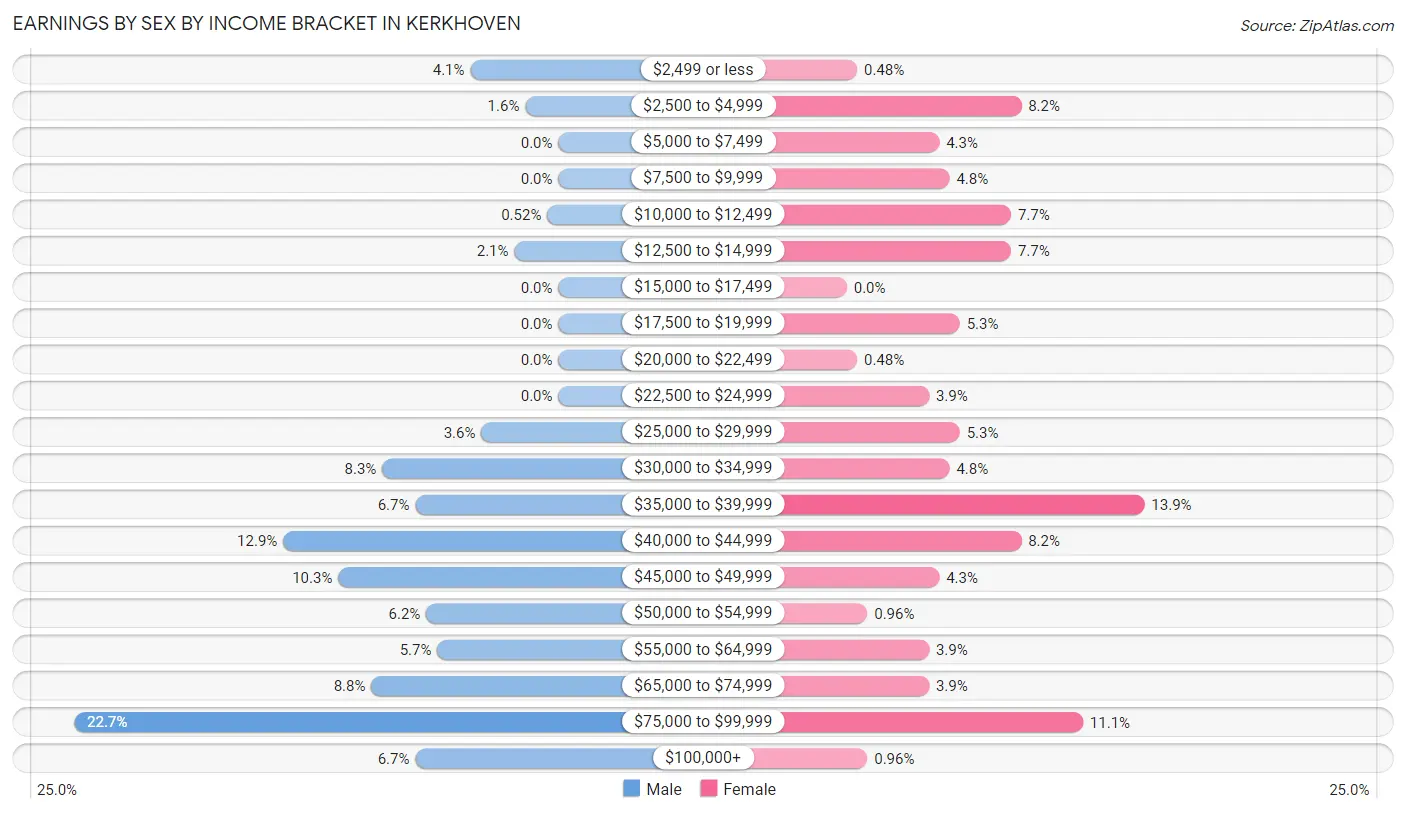
Earnings by Sex by Income Bracket in Kerkhoven
The most common earnings brackets in Kerkhoven are $75,000 to $99,999 for men (44 | 22.7%) and $35,000 to $39,999 for women (29 | 13.9%).
| Income | Male | Female |
| $2,499 or less | 8 (4.1%) | 1 (0.5%) |
| $2,500 to $4,999 | 3 (1.5%) | 17 (8.2%) |
| $5,000 to $7,499 | 0 (0.0%) | 9 (4.3%) |
| $7,500 to $9,999 | 0 (0.0%) | 10 (4.8%) |
| $10,000 to $12,499 | 1 (0.5%) | 16 (7.7%) |
| $12,500 to $14,999 | 4 (2.1%) | 16 (7.7%) |
| $15,000 to $17,499 | 0 (0.0%) | 0 (0.0%) |
| $17,500 to $19,999 | 0 (0.0%) | 11 (5.3%) |
| $20,000 to $22,499 | 0 (0.0%) | 1 (0.5%) |
| $22,500 to $24,999 | 0 (0.0%) | 8 (3.8%) |
| $25,000 to $29,999 | 7 (3.6%) | 11 (5.3%) |
| $30,000 to $34,999 | 16 (8.3%) | 10 (4.8%) |
| $35,000 to $39,999 | 13 (6.7%) | 29 (13.9%) |
| $40,000 to $44,999 | 25 (12.9%) | 17 (8.2%) |
| $45,000 to $49,999 | 20 (10.3%) | 9 (4.3%) |
| $50,000 to $54,999 | 12 (6.2%) | 2 (1.0%) |
| $55,000 to $64,999 | 11 (5.7%) | 8 (3.8%) |
| $65,000 to $74,999 | 17 (8.8%) | 8 (3.8%) |
| $75,000 to $99,999 | 44 (22.7%) | 23 (11.1%) |
| $100,000+ | 13 (6.7%) | 2 (1.0%) |
| Total | 194 (100.0%) | 208 (100.0%) |
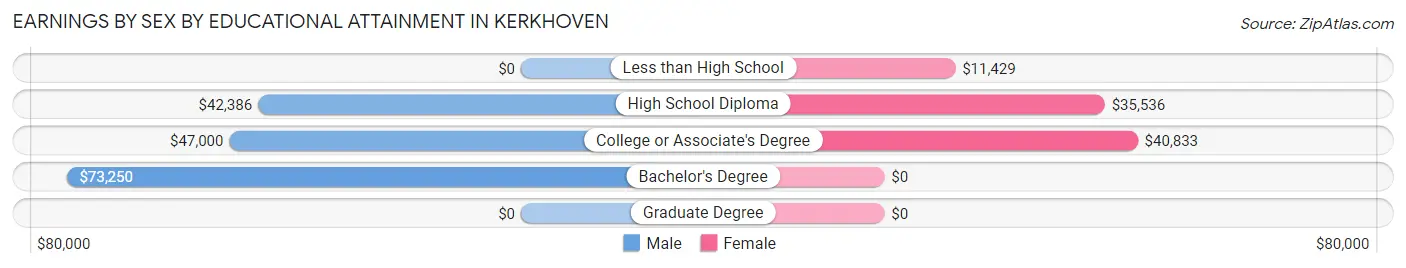
Earnings by Sex by Educational Attainment in Kerkhoven
Average earnings in Kerkhoven are $50,455 for men and $35,000 for women, a difference of 30.6%. Men with an educational attainment of bachelor's degree enjoy the highest average annual earnings of $73,250, while those with high school diploma education earn the least with $42,386. Women with an educational attainment of college or associate's degree earn the most with the average annual earnings of $40,833, while those with less than high school education have the smallest earnings of $11,429.
| Educational Attainment | Male Income | Female Income |
| Less than High School | - | - |
| High School Diploma | $42,386 | $35,536 |
| College or Associate's Degree | $47,000 | $40,833 |
| Bachelor's Degree | $73,250 | $0 |
| Graduate Degree | - | - |
| Total | $50,455 | $35,000 |
Family Income in Kerkhoven
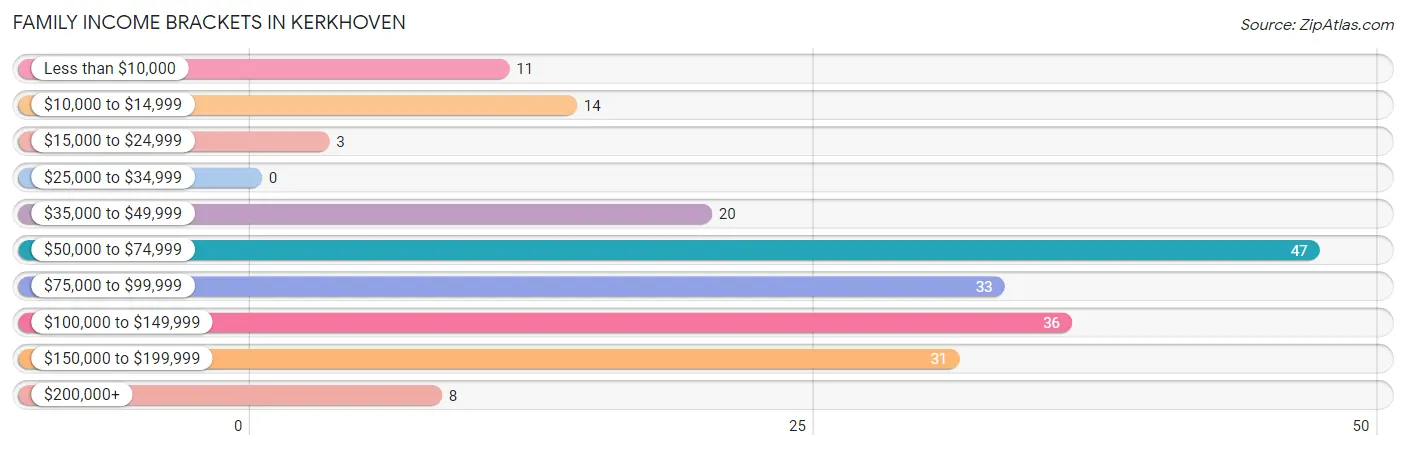
Family Income Brackets in Kerkhoven
According to the Kerkhoven family income data, there are 47 families falling into the $50,000 to $74,999 income range, which is the most common income bracket and makes up 23.2% of all families.
| Income Bracket | # Families | % Families |
| Less than $10,000 | 11 | 5.4% |
| $10,000 to $14,999 | 14 | 6.9% |
| $15,000 to $24,999 | 3 | 1.5% |
| $25,000 to $34,999 | 0 | 0.0% |
| $35,000 to $49,999 | 20 | 9.9% |
| $50,000 to $74,999 | 47 | 23.2% |
| $75,000 to $99,999 | 33 | 16.3% |
| $100,000 to $149,999 | 36 | 17.7% |
| $150,000 to $199,999 | 31 | 15.3% |
| $200,000+ | 8 | 3.9% |
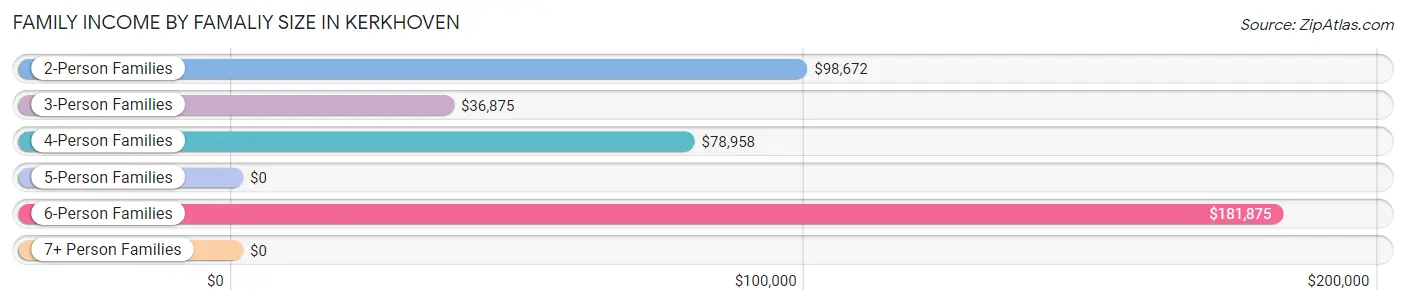
Family Income by Famaliy Size in Kerkhoven
6-person families (13 | 6.4%) account for the highest median family income in Kerkhoven with $181,875 per family, while 2-person families (95 | 46.8%) have the highest median income of $49,336 per family member.
| Income Bracket | # Families | Median Income |
| 2-Person Families | 95 (46.8%) | $98,672 |
| 3-Person Families | 39 (19.2%) | $36,875 |
| 4-Person Families | 39 (19.2%) | $78,958 |
| 5-Person Families | 6 (3.0%) | $0 |
| 6-Person Families | 13 (6.4%) | $181,875 |
| 7+ Person Families | 11 (5.4%) | $0 |
| Total | 203 (100.0%) | $80,625 |
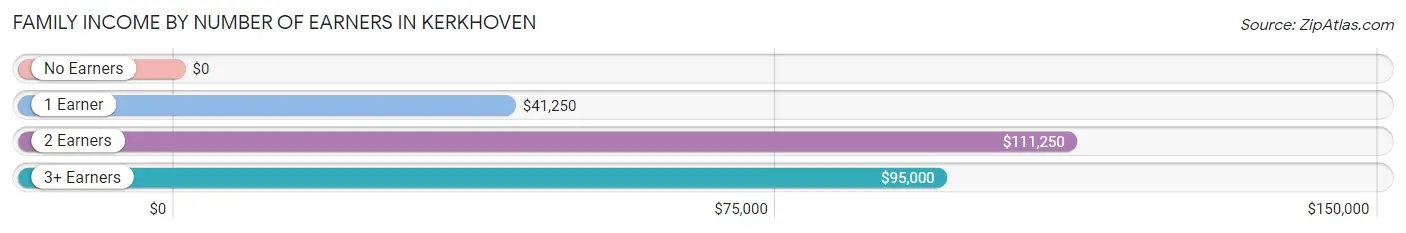
Family Income by Number of Earners in Kerkhoven
| Number of Earners | # Families | Median Income |
| No Earners | 27 (13.3%) | $0 |
| 1 Earner | 62 (30.5%) | $41,250 |
| 2 Earners | 94 (46.3%) | $111,250 |
| 3+ Earners | 20 (9.9%) | $95,000 |
| Total | 203 (100.0%) | $80,625 |
Household Income in Kerkhoven
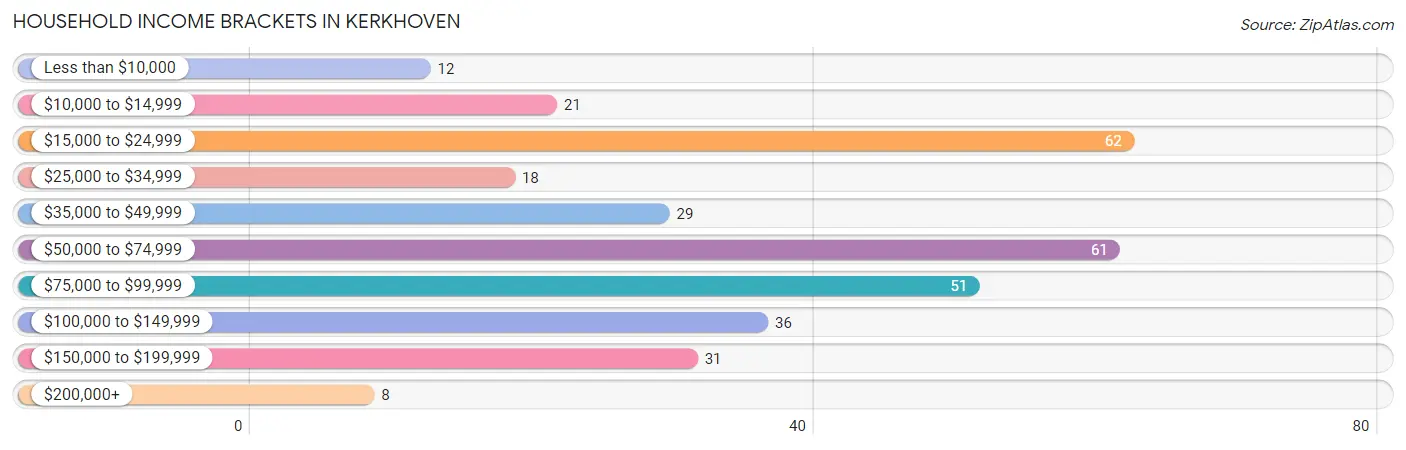
Household Income Brackets in Kerkhoven
With 62 households falling in the category, the $15,000 to $24,999 income range is the most frequent in Kerkhoven, accounting for 18.8% of all households. In contrast, only 8 households (2.4%) fall into the $200,000+ income bracket, making it the least populous group.
| Income Bracket | # Households | % Households |
| Less than $10,000 | 12 | 3.6% |
| $10,000 to $14,999 | 21 | 6.4% |
| $15,000 to $24,999 | 62 | 18.8% |
| $25,000 to $34,999 | 18 | 5.5% |
| $35,000 to $49,999 | 29 | 8.8% |
| $50,000 to $74,999 | 61 | 18.5% |
| $75,000 to $99,999 | 51 | 15.5% |
| $100,000 to $149,999 | 36 | 10.9% |
| $150,000 to $199,999 | 31 | 9.4% |
| $200,000+ | 8 | 2.4% |
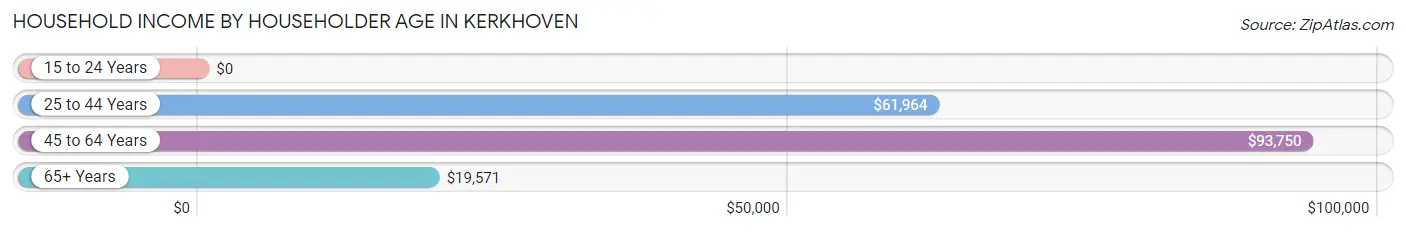
Household Income by Householder Age in Kerkhoven
The median household income in Kerkhoven is $60,729, with the highest median household income of $93,750 found in the 45 to 64 years age bracket for the primary householder. A total of 104 households (31.6%) fall into this category.
| Income Bracket | # Households | Median Income |
| 15 to 24 Years | 0 (0.0%) | $0 |
| 25 to 44 Years | 117 (35.6%) | $61,964 |
| 45 to 64 Years | 104 (31.6%) | $93,750 |
| 65+ Years | 108 (32.8%) | $19,571 |
| Total | 329 (100.0%) | $60,729 |
Poverty in Kerkhoven
Income Below Poverty by Sex and Age in Kerkhoven
With 14.4% poverty level for males and 11.7% for females among the residents of Kerkhoven, under 5 year old males and 5 year old females are the most vulnerable to poverty, with 17 males (70.8%) and 9 females (56.2%) in their respective age groups living below the poverty level.
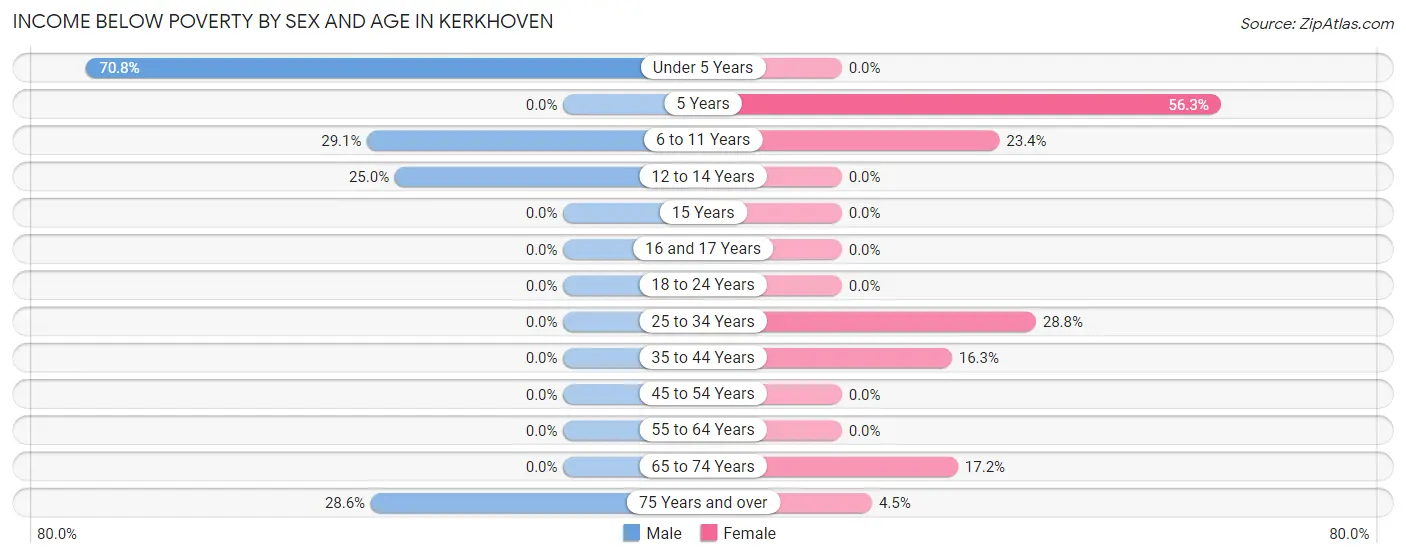
| Age Bracket | Male | Female |
| Under 5 Years | 17 (70.8%) | 0 (0.0%) |
| 5 Years | 0 (0.0%) | 9 (56.2%) |
| 6 to 11 Years | 23 (29.1%) | 11 (23.4%) |
| 12 to 14 Years | 6 (25.0%) | 0 (0.0%) |
| 15 Years | 0 (0.0%) | 0 (0.0%) |
| 16 and 17 Years | 0 (0.0%) | 0 (0.0%) |
| 18 to 24 Years | 0 (0.0%) | 0 (0.0%) |
| 25 to 34 Years | 0 (0.0%) | 17 (28.8%) |
| 35 to 44 Years | 0 (0.0%) | 8 (16.3%) |
| 45 to 54 Years | 0 (0.0%) | 0 (0.0%) |
| 55 to 64 Years | 0 (0.0%) | 0 (0.0%) |
| 65 to 74 Years | 0 (0.0%) | 5 (17.2%) |
| 75 Years and over | 6 (28.6%) | 3 (4.5%) |
| Total | 52 (14.4%) | 53 (11.7%) |
Income Above Poverty by Sex and Age in Kerkhoven
According to the poverty statistics in Kerkhoven, males aged 5 years and females aged under 5 years are the age groups that are most secure financially, with 100.0% of males and 100.0% of females in these age groups living above the poverty line.
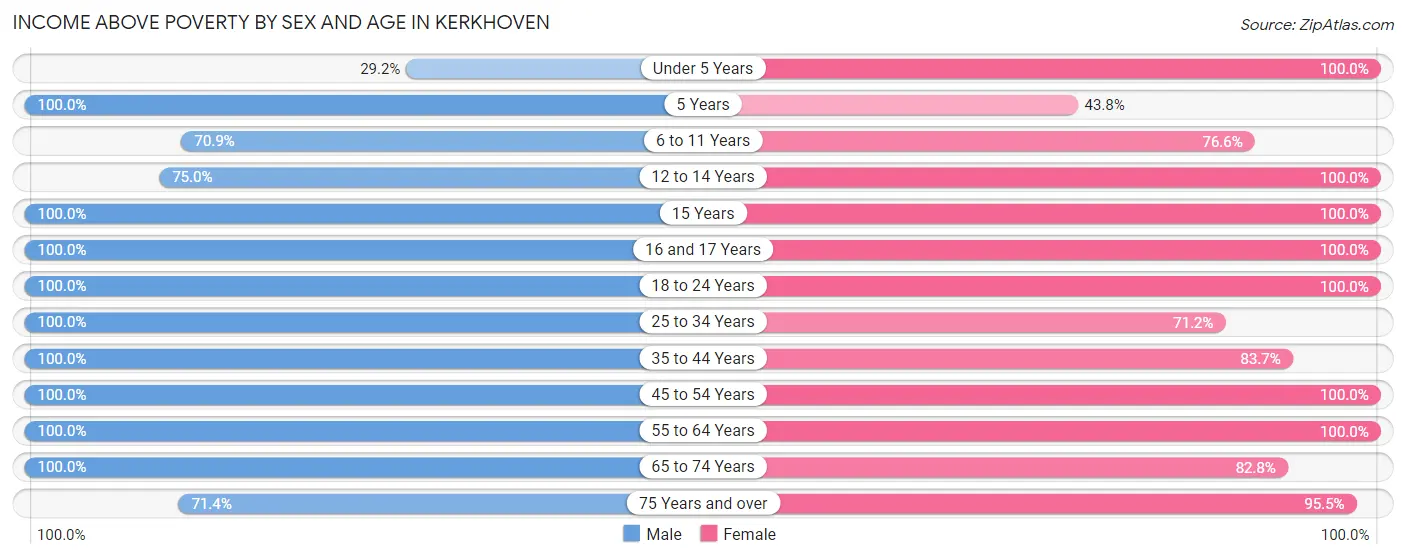
| Age Bracket | Male | Female |
| Under 5 Years | 7 (29.2%) | 34 (100.0%) |
| 5 Years | 3 (100.0%) | 7 (43.8%) |
| 6 to 11 Years | 56 (70.9%) | 36 (76.6%) |
| 12 to 14 Years | 18 (75.0%) | 19 (100.0%) |
| 15 Years | 1 (100.0%) | 4 (100.0%) |
| 16 and 17 Years | 1 (100.0%) | 9 (100.0%) |
| 18 to 24 Years | 11 (100.0%) | 22 (100.0%) |
| 25 to 34 Years | 50 (100.0%) | 42 (71.2%) |
| 35 to 44 Years | 25 (100.0%) | 41 (83.7%) |
| 45 to 54 Years | 47 (100.0%) | 24 (100.0%) |
| 55 to 64 Years | 50 (100.0%) | 72 (100.0%) |
| 65 to 74 Years | 25 (100.0%) | 24 (82.8%) |
| 75 Years and over | 15 (71.4%) | 64 (95.5%) |
| Total | 309 (85.6%) | 398 (88.2%) |
Income Below Poverty Among Married-Couple Families in Kerkhoven
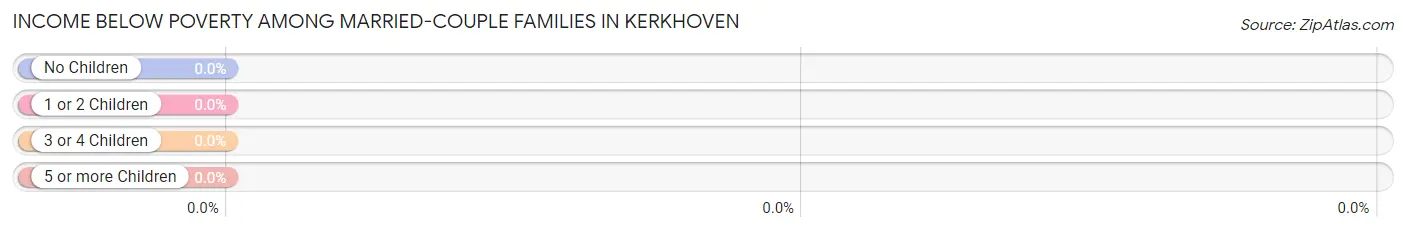
| Children | Above Poverty | Below Poverty |
| No Children | 101 (100.0%) | 0 (0.0%) |
| 1 or 2 Children | 26 (100.0%) | 0 (0.0%) |
| 3 or 4 Children | 23 (100.0%) | 0 (0.0%) |
| 5 or more Children | 5 (100.0%) | 0 (0.0%) |
| Total | 155 (100.0%) | 0 (0.0%) |
Income Below Poverty Among Single-Parent Households in Kerkhoven
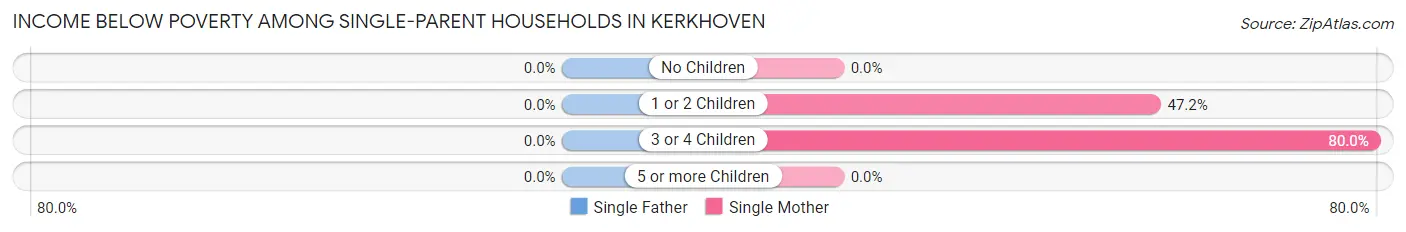
| Children | Single Father | Single Mother |
| No Children | 0 (0.0%) | 0 (0.0%) |
| 1 or 2 Children | 0 (0.0%) | 17 (47.2%) |
| 3 or 4 Children | 0 (0.0%) | 8 (80.0%) |
| 5 or more Children | 0 (0.0%) | 0 (0.0%) |
| Total | 0 (0.0%) | 25 (52.1%) |
Income Below Poverty Among Married-Couple vs Single-Parent Households in Kerkhoven
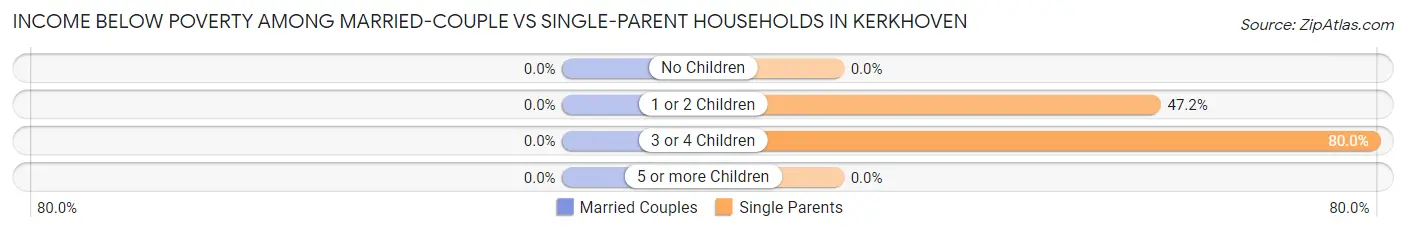
| Children | Married-Couple Families | Single-Parent Households |
| No Children | 0 (0.0%) | 0 (0.0%) |
| 1 or 2 Children | 0 (0.0%) | 17 (47.2%) |
| 3 or 4 Children | 0 (0.0%) | 8 (80.0%) |
| 5 or more Children | 0 (0.0%) | 0 (0.0%) |
| Total | 0 (0.0%) | 25 (52.1%) |
Race in Kerkhoven
The most populous races in Kerkhoven are White / Caucasian (756 | 90.3%), Hispanic or Latino (120 | 14.3%), and Two or more Races (51 | 6.1%).
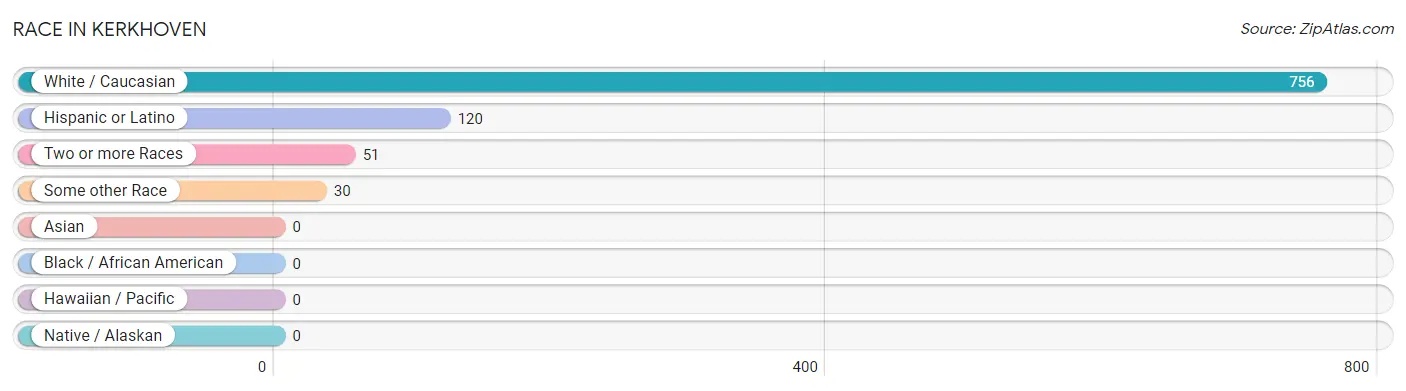
| Race | # Population | % Population |
| Asian | 0 | 0.0% |
| Black / African American | 0 | 0.0% |
| Hawaiian / Pacific | 0 | 0.0% |
| Hispanic or Latino | 120 | 14.3% |
| Native / Alaskan | 0 | 0.0% |
| White / Caucasian | 756 | 90.3% |
| Two or more Races | 51 | 6.1% |
| Some other Race | 30 | 3.6% |
| Total | 837 | 100.0% |
Ancestry in Kerkhoven
The most populous ancestries reported in Kerkhoven are German (331 | 39.6%), Norwegian (174 | 20.8%), Mexican (120 | 14.3%), Irish (83 | 9.9%), and Swedish (63 | 7.5%), together accounting for 92.1% of all Kerkhoven residents.
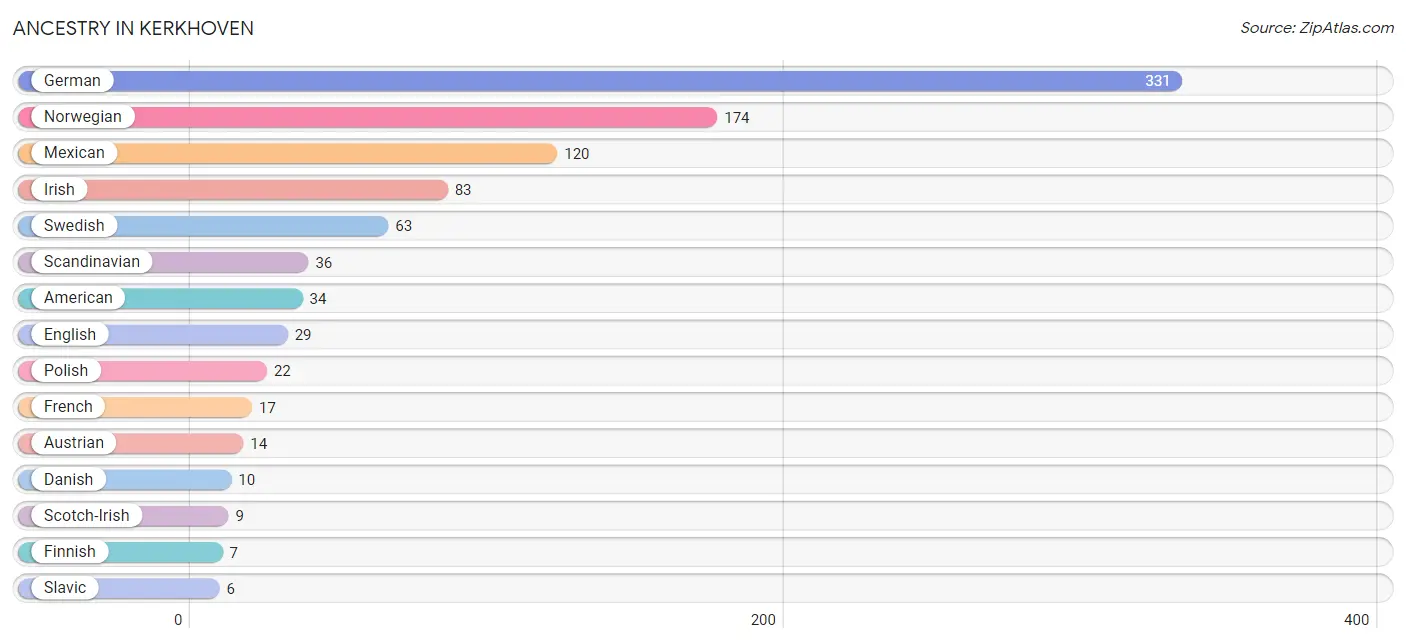
| Ancestry | # Population | % Population |
| American | 34 | 4.1% |
| Austrian | 14 | 1.7% |
| Chippewa | 1 | 0.1% |
| Czech | 1 | 0.1% |
| Danish | 10 | 1.2% |
| Dutch | 3 | 0.4% |
| English | 29 | 3.5% |
| Finnish | 7 | 0.8% |
| French | 17 | 2.0% |
| French Canadian | 5 | 0.6% |
| German | 331 | 39.6% |
| Irish | 83 | 9.9% |
| Italian | 3 | 0.4% |
| Mexican | 120 | 14.3% |
| Norwegian | 174 | 20.8% |
| Polish | 22 | 2.6% |
| Scandinavian | 36 | 4.3% |
| Scotch-Irish | 9 | 1.1% |
| Scottish | 4 | 0.5% |
| Serbian | 3 | 0.4% |
| Slavic | 6 | 0.7% |
| Swedish | 63 | 7.5% |
| Swiss | 2 | 0.2% |
| Yugoslavian | 3 | 0.4% | View All 24 Rows |
Immigrants in Kerkhoven
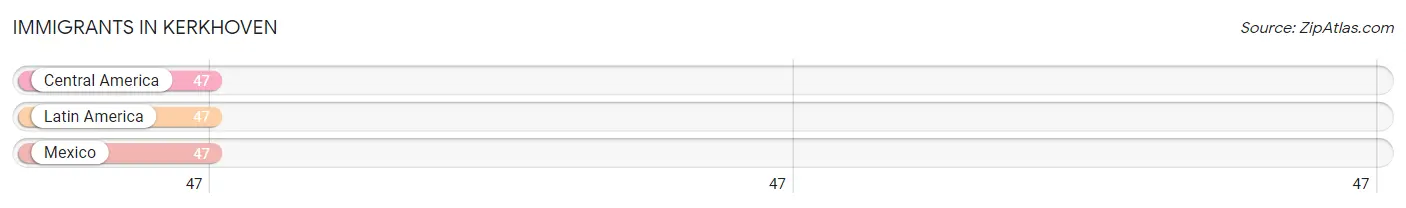
The most numerous immigrant groups reported in Kerkhoven came from Central America (47 | 5.6%), Latin America (47 | 5.6%), and Mexico (47 | 5.6%), together accounting for 16.9% of all Kerkhoven residents.
| Immigration Origin | # Population | % Population |
| Central America | 47 | 5.6% |
| Latin America | 47 | 5.6% |
| Mexico | 47 | 5.6% | View All 3 Rows |
Sex and Age in Kerkhoven
Sex and Age in Kerkhoven
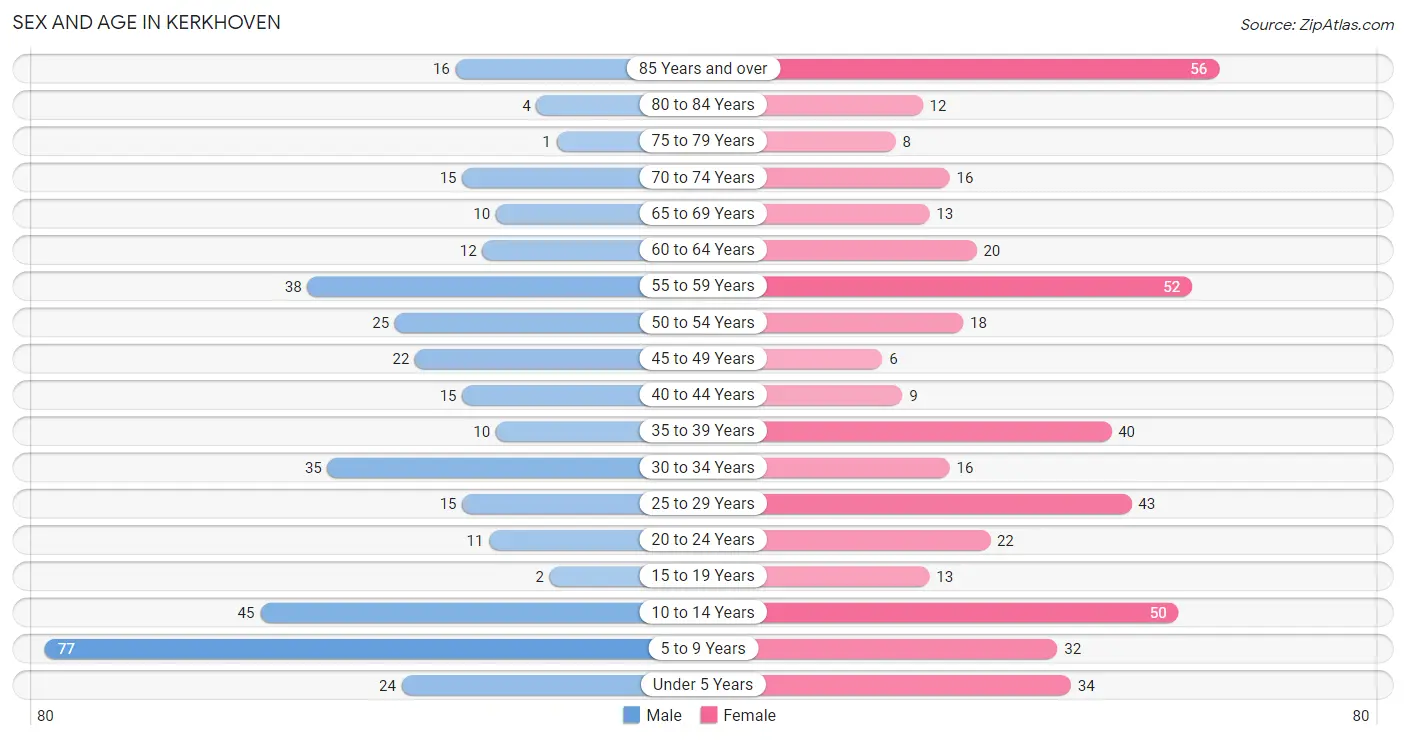
The most populous age groups in Kerkhoven are 5 to 9 Years (77 | 20.4%) for men and 85 Years and over (56 | 12.2%) for women.
| Age Bracket | Male | Female |
| Under 5 Years | 24 (6.4%) | 34 (7.4%) |
| 5 to 9 Years | 77 (20.4%) | 32 (7.0%) |
| 10 to 14 Years | 45 (11.9%) | 50 (10.9%) |
| 15 to 19 Years | 2 (0.5%) | 13 (2.8%) |
| 20 to 24 Years | 11 (2.9%) | 22 (4.8%) |
| 25 to 29 Years | 15 (4.0%) | 43 (9.3%) |
| 30 to 34 Years | 35 (9.3%) | 16 (3.5%) |
| 35 to 39 Years | 10 (2.6%) | 40 (8.7%) |
| 40 to 44 Years | 15 (4.0%) | 9 (2.0%) |
| 45 to 49 Years | 22 (5.8%) | 6 (1.3%) |
| 50 to 54 Years | 25 (6.6%) | 18 (3.9%) |
| 55 to 59 Years | 38 (10.1%) | 52 (11.3%) |
| 60 to 64 Years | 12 (3.2%) | 20 (4.3%) |
| 65 to 69 Years | 10 (2.6%) | 13 (2.8%) |
| 70 to 74 Years | 15 (4.0%) | 16 (3.5%) |
| 75 to 79 Years | 1 (0.3%) | 8 (1.7%) |
| 80 to 84 Years | 4 (1.1%) | 12 (2.6%) |
| 85 Years and over | 16 (4.2%) | 56 (12.2%) |
| Total | 377 (100.0%) | 460 (100.0%) |
Families and Households in Kerkhoven
Median Family Size in Kerkhoven
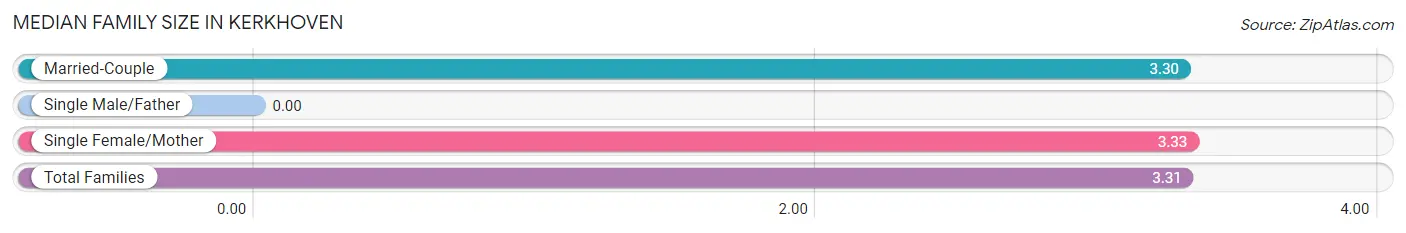
| Family Type | # Families | Family Size |
| Married-Couple | 155 (76.3%) | 3.30 |
| Single Male/Father | 0 (0.0%) | - |
| Single Female/Mother | 48 (23.6%) | 3.33 |
| Total Families | 203 (100.0%) | 3.31 |
Median Household Size in Kerkhoven
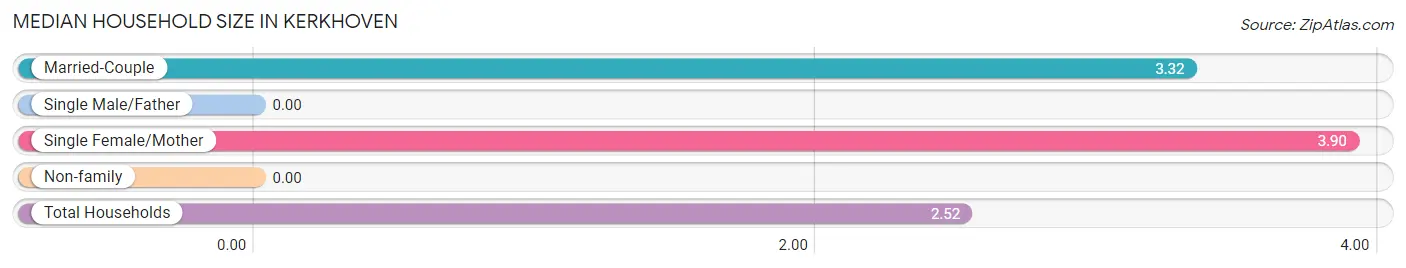
| Household Type | # Households | Household Size |
| Married-Couple | 155 (47.1%) | 3.32 |
| Single Male/Father | 0 (0.0%) | - |
| Single Female/Mother | 48 (14.6%) | 3.90 |
| Non-family | 126 (38.3%) | - |
| Total Households | 329 (100.0%) | 2.52 |
Household Size by Marriage Status in Kerkhoven
Out of a total of 329 households in Kerkhoven, 203 (61.7%) are family households, while 126 (38.3%) are nonfamily households. The most numerous type of family households are 2-person households, comprising 80, and the most common type of nonfamily households are 1-person households, comprising 126.
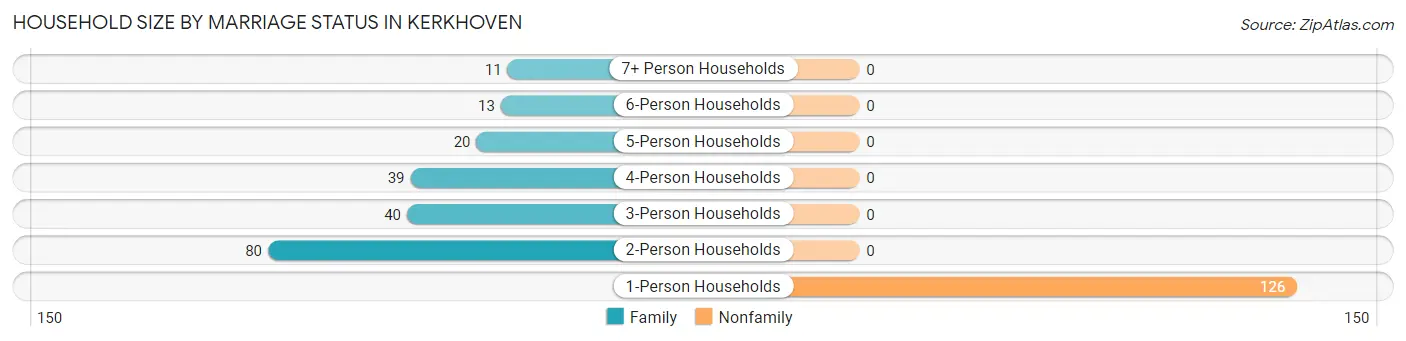
| Household Size | Family Households | Nonfamily Households |
| 1-Person Households | - | 126 (38.3%) |
| 2-Person Households | 80 (24.3%) | 0 (0.0%) |
| 3-Person Households | 40 (12.2%) | 0 (0.0%) |
| 4-Person Households | 39 (11.8%) | 0 (0.0%) |
| 5-Person Households | 20 (6.1%) | 0 (0.0%) |
| 6-Person Households | 13 (4.0%) | 0 (0.0%) |
| 7+ Person Households | 11 (3.3%) | 0 (0.0%) |
| Total | 203 (61.7%) | 126 (38.3%) |
Female Fertility in Kerkhoven
Fertility by Age in Kerkhoven
Average fertility rate in Kerkhoven is 84.0 births per 1,000 women. Women in the age bracket of 20 to 34 years have the highest fertility rate with 99.0 births per 1,000 women. Women in the age bracket of 20 to 34 years acount for 61.5% of all women with births.
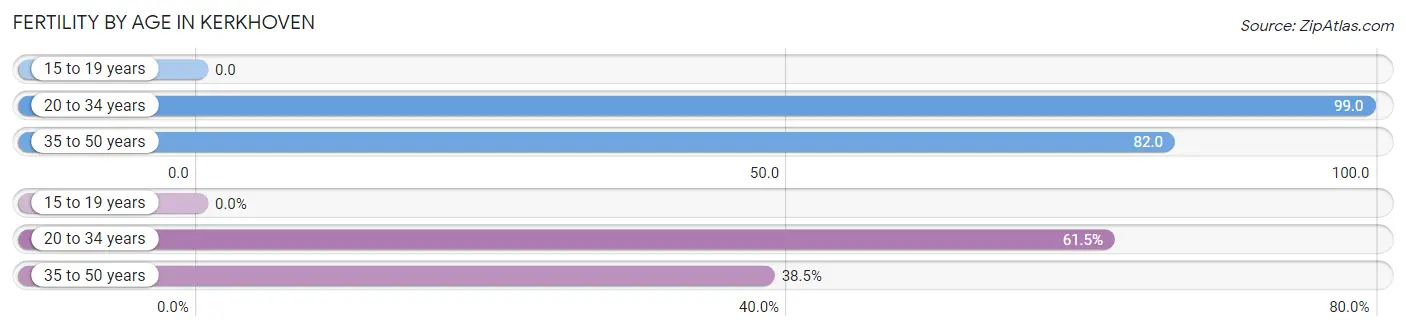
| Age Bracket | Women with Births | Births / 1,000 Women |
| 15 to 19 years | 0 (0.0%) | 0.0 |
| 20 to 34 years | 8 (61.5%) | 99.0 |
| 35 to 50 years | 5 (38.5%) | 82.0 |
| Total | 13 (100.0%) | 84.0 |
Fertility by Age by Marriage Status in Kerkhoven
53.8% of women with births (13) in Kerkhoven are married. The highest percentage of unmarried women with births falls into 20 to 34 years age bracket with 75.0% of them unmarried at the time of birth, while the lowest percentage of unmarried women with births belong to 35 to 50 years age bracket with 0.0% of them unmarried.
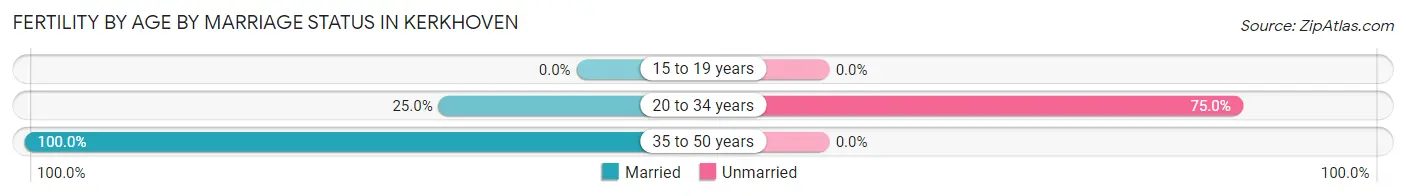
| Age Bracket | Married | Unmarried |
| 15 to 19 years | 0 (0.0%) | 0 (0.0%) |
| 20 to 34 years | 2 (25.0%) | 6 (75.0%) |
| 35 to 50 years | 5 (100.0%) | 0 (0.0%) |
| Total | 7 (53.8%) | 6 (46.2%) |
Fertility by Education in Kerkhoven
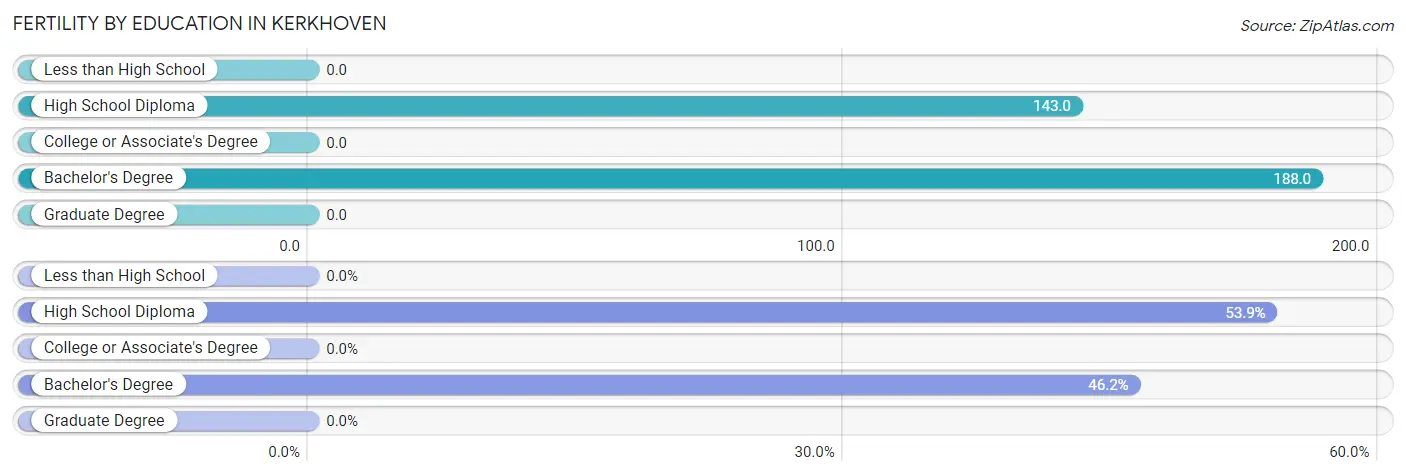
| Educational Attainment | Women with Births | Births / 1,000 Women |
| Less than High School | 0 (0.0%) | 0.0 |
| High School Diploma | 7 (53.8%) | 143.0 |
| College or Associate's Degree | 0 (0.0%) | 0.0 |
| Bachelor's Degree | 6 (46.2%) | 188.0 |
| Graduate Degree | 0 (0.0%) | 0.0 |
| Total | 13 (100.0%) | 84.0 |
Fertility by Education by Marriage Status in Kerkhoven
46.2% of women with births in Kerkhoven are unmarried. Women with the educational attainment of bachelor's degree are most likely to be married with 100.0% of them married at childbirth, while women with the educational attainment of high school diploma are least likely to be married with 85.7% of them unmarried at childbirth.
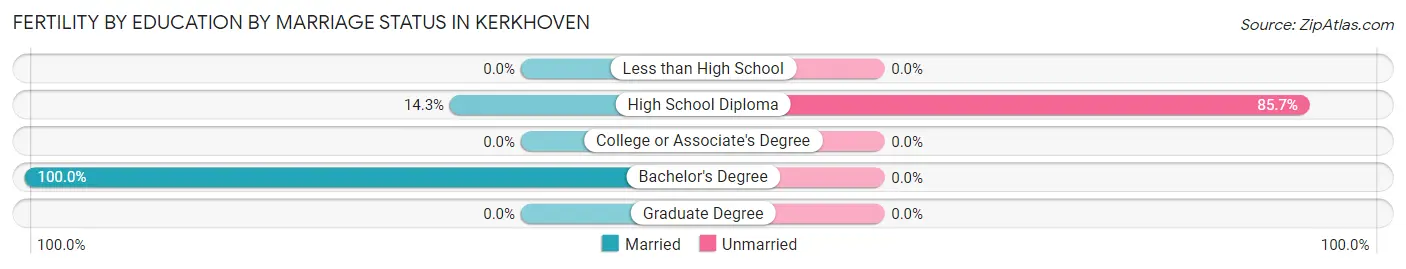
| Educational Attainment | Married | Unmarried |
| Less than High School | 0 (0.0%) | 0 (0.0%) |
| High School Diploma | 1 (14.3%) | 6 (85.7%) |
| College or Associate's Degree | 0 (0.0%) | 0 (0.0%) |
| Bachelor's Degree | 6 (100.0%) | 0 (0.0%) |
| Graduate Degree | 0 (0.0%) | 0 (0.0%) |
| Total | 7 (53.8%) | 6 (46.2%) |
Employment Characteristics in Kerkhoven
Employment by Class of Employer in Kerkhoven
Among the 342 employed individuals in Kerkhoven, private company employees (200 | 58.5%), self-employed (incorporated) (57 | 16.7%), and local government employees (45 | 13.2%) make up the most common classes of employment.
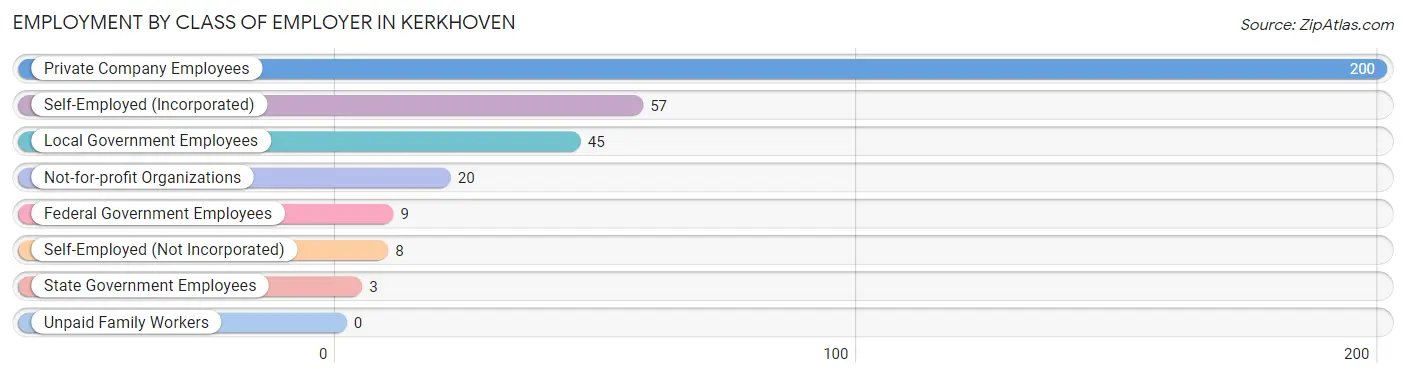
| Employer Class | # Employees | % Employees |
| Private Company Employees | 200 | 58.5% |
| Self-Employed (Incorporated) | 57 | 16.7% |
| Self-Employed (Not Incorporated) | 8 | 2.3% |
| Not-for-profit Organizations | 20 | 5.9% |
| Local Government Employees | 45 | 13.2% |
| State Government Employees | 3 | 0.9% |
| Federal Government Employees | 9 | 2.6% |
| Unpaid Family Workers | 0 | 0.0% |
| Total | 342 | 100.0% |
Employment Status by Age in Kerkhoven
According to the labor force statistics for Kerkhoven, out of the total population over 16 years of age (570), 65.1% or 371 individuals are in the labor force, with 3.3% or 12 of them unemployed. The age group with the highest labor force participation rate is 16 to 19 years, with 100.0% or 10 individuals in the labor force. Within the labor force, the 35 to 44 years age range has the highest percentage of unemployed individuals, with 22.4% or 12 of them being unemployed.
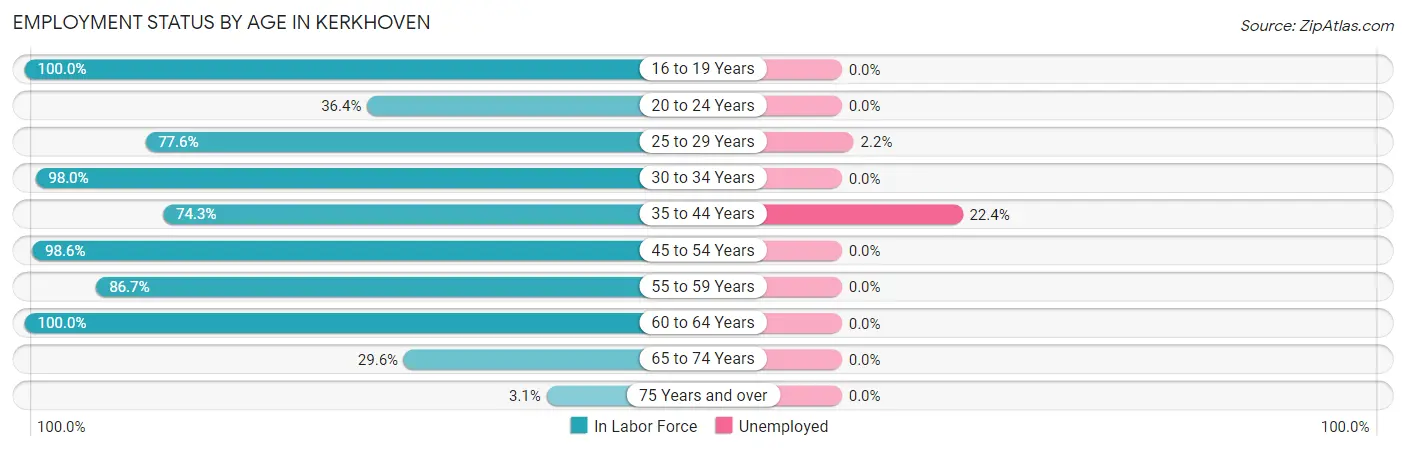
| Age Bracket | In Labor Force | Unemployed |
| 16 to 19 Years | 10 (100.0%) | 0 (0.0%) |
| 20 to 24 Years | 12 (36.4%) | 0 (0.0%) |
| 25 to 29 Years | 45 (77.6%) | 1 (2.2%) |
| 30 to 34 Years | 50 (98.0%) | 0 (0.0%) |
| 35 to 44 Years | 55 (74.3%) | 12 (22.4%) |
| 45 to 54 Years | 70 (98.6%) | 0 (0.0%) |
| 55 to 59 Years | 78 (86.7%) | 0 (0.0%) |
| 60 to 64 Years | 32 (100.0%) | 0 (0.0%) |
| 65 to 74 Years | 16 (29.6%) | 0 (0.0%) |
| 75 Years and over | 3 (3.1%) | 0 (0.0%) |
| Total | 371 (65.1%) | 12 (3.3%) |
Employment Status by Educational Attainment in Kerkhoven
According to labor force statistics for Kerkhoven, 87.8% of individuals (330) out of the total population between 25 and 64 years of age (376) are in the labor force, with 3.7% or 12 of them being unemployed. The group with the highest labor force participation rate are those with the educational attainment of college / associate degree, with 97.1% or 202 individuals in the labor force. Within the labor force, individuals with college / associate degree education have the highest percentage of unemployment, with 5.9% or 12 of them being unemployed.
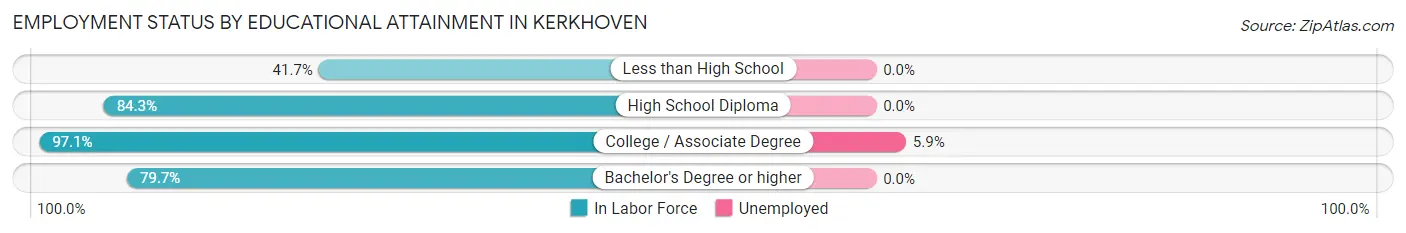
| Educational Attainment | In Labor Force | Unemployed |
| Less than High School | 10 (41.7%) | 0 (0.0%) |
| High School Diploma | 59 (84.3%) | 0 (0.0%) |
| College / Associate Degree | 202 (97.1%) | 12 (5.9%) |
| Bachelor's Degree or higher | 59 (79.7%) | 0 (0.0%) |
| Total | 330 (87.8%) | 14 (3.7%) |
Employment Occupations by Sex in Kerkhoven
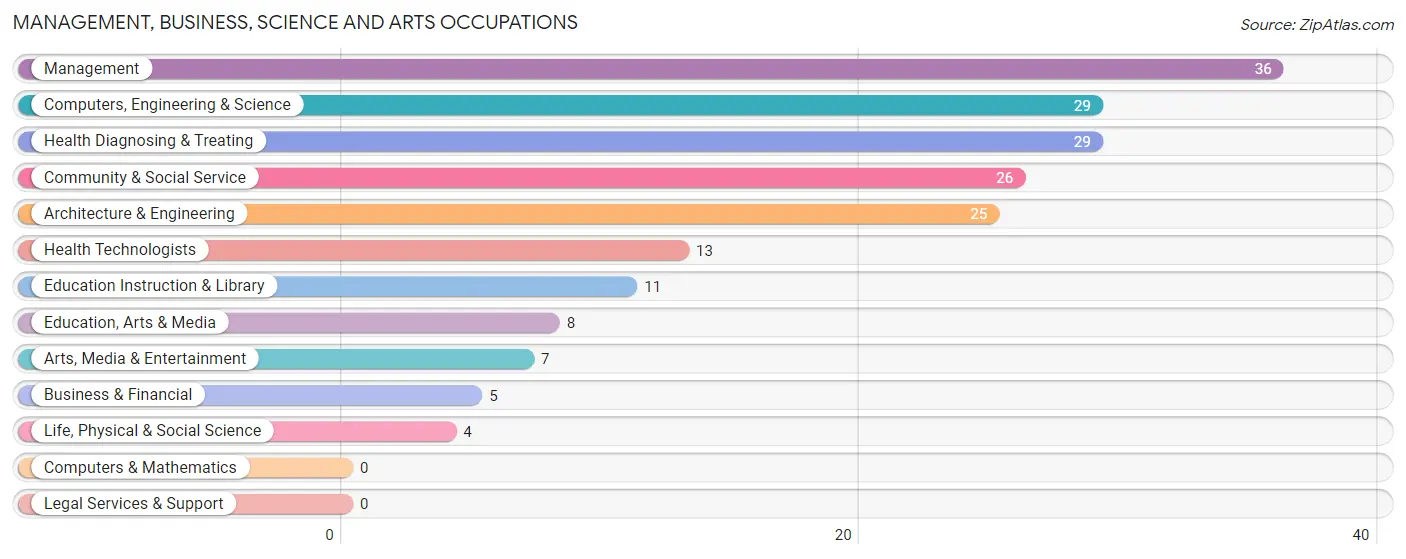
Management, Business, Science and Arts Occupations
The most common Management, Business, Science and Arts occupations in Kerkhoven are Management (36 | 10.2%), Computers, Engineering & Science (29 | 8.2%), Health Diagnosing & Treating (29 | 8.2%), Community & Social Service (26 | 7.4%), and Architecture & Engineering (25 | 7.1%).
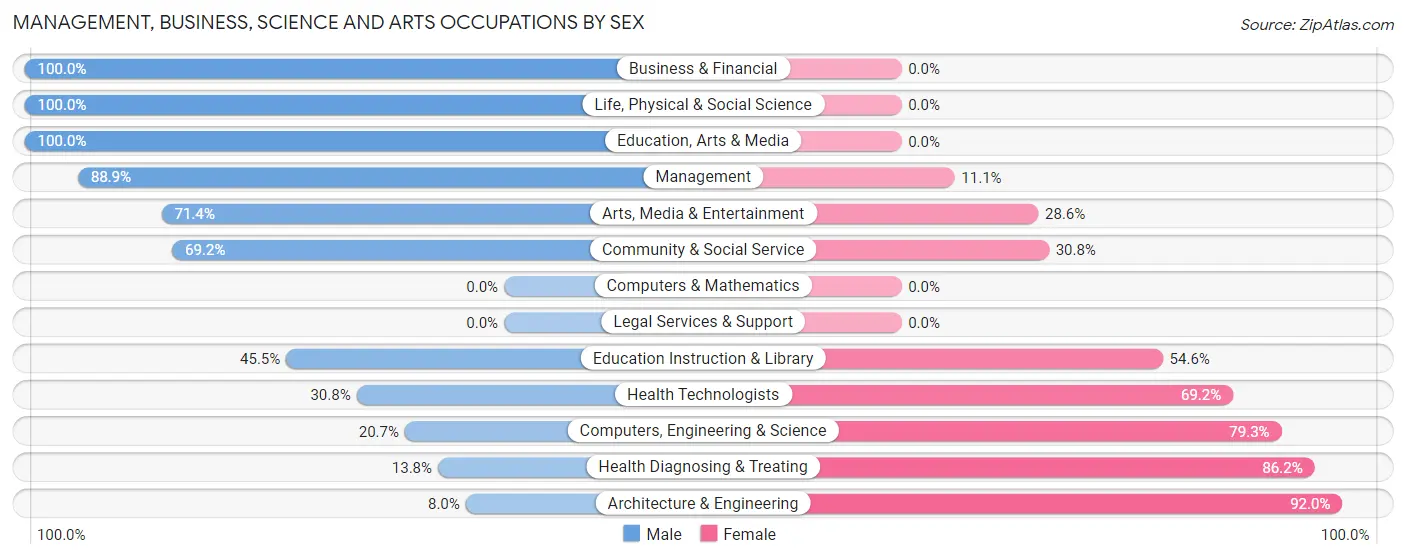
Management, Business, Science and Arts Occupations by Sex
Within the Management, Business, Science and Arts occupations in Kerkhoven, the most male-oriented occupations are Business & Financial (100.0%), Life, Physical & Social Science (100.0%), and Education, Arts & Media (100.0%), while the most female-oriented occupations are Architecture & Engineering (92.0%), Health Diagnosing & Treating (86.2%), and Computers, Engineering & Science (79.3%).
| Occupation | Male | Female |
| Management | 32 (88.9%) | 4 (11.1%) |
| Business & Financial | 5 (100.0%) | 0 (0.0%) |
| Computers, Engineering & Science | 6 (20.7%) | 23 (79.3%) |
| Computers & Mathematics | 0 (0.0%) | 0 (0.0%) |
| Architecture & Engineering | 2 (8.0%) | 23 (92.0%) |
| Life, Physical & Social Science | 4 (100.0%) | 0 (0.0%) |
| Community & Social Service | 18 (69.2%) | 8 (30.8%) |
| Education, Arts & Media | 8 (100.0%) | 0 (0.0%) |
| Legal Services & Support | 0 (0.0%) | 0 (0.0%) |
| Education Instruction & Library | 5 (45.5%) | 6 (54.5%) |
| Arts, Media & Entertainment | 5 (71.4%) | 2 (28.6%) |
| Health Diagnosing & Treating | 4 (13.8%) | 25 (86.2%) |
| Health Technologists | 4 (30.8%) | 9 (69.2%) |
| Total (Category) | 65 (52.0%) | 60 (48.0%) |
| Total (Overall) | 188 (53.3%) | 165 (46.7%) |
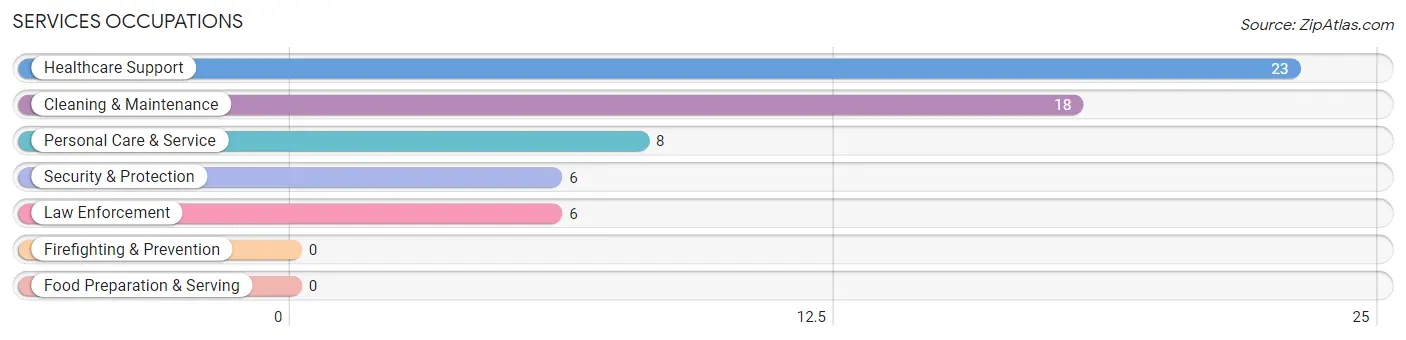
Services Occupations
The most common Services occupations in Kerkhoven are Healthcare Support (23 | 6.5%), Cleaning & Maintenance (18 | 5.1%), Personal Care & Service (8 | 2.3%), Security & Protection (6 | 1.7%), and Law Enforcement (6 | 1.7%).
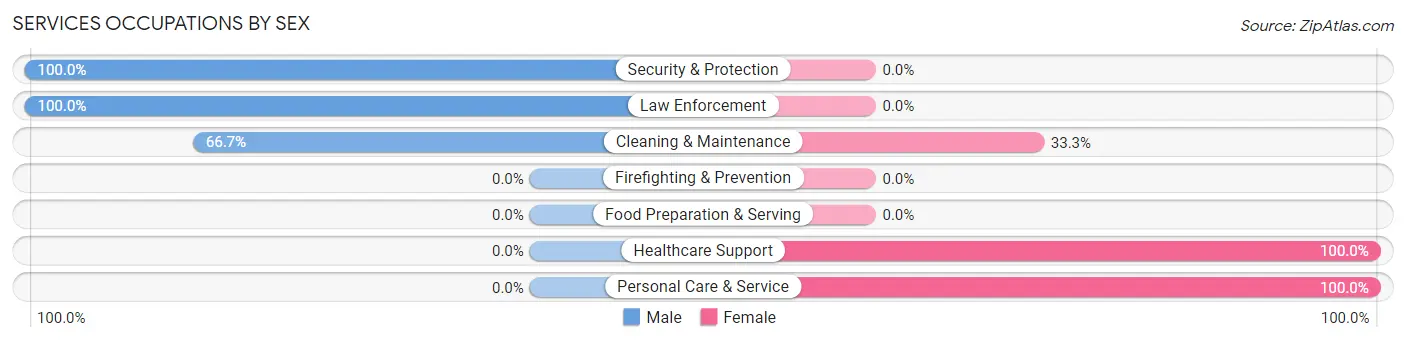
Services Occupations by Sex
Within the Services occupations in Kerkhoven, the most male-oriented occupations are Security & Protection (100.0%), Law Enforcement (100.0%), and Cleaning & Maintenance (66.7%), while the most female-oriented occupations are Healthcare Support (100.0%), Personal Care & Service (100.0%), and Cleaning & Maintenance (33.3%).
| Occupation | Male | Female |
| Healthcare Support | 0 (0.0%) | 23 (100.0%) |
| Security & Protection | 6 (100.0%) | 0 (0.0%) |
| Firefighting & Prevention | 0 (0.0%) | 0 (0.0%) |
| Law Enforcement | 6 (100.0%) | 0 (0.0%) |
| Food Preparation & Serving | 0 (0.0%) | 0 (0.0%) |
| Cleaning & Maintenance | 12 (66.7%) | 6 (33.3%) |
| Personal Care & Service | 0 (0.0%) | 8 (100.0%) |
| Total (Category) | 18 (32.7%) | 37 (67.3%) |
| Total (Overall) | 188 (53.3%) | 165 (46.7%) |
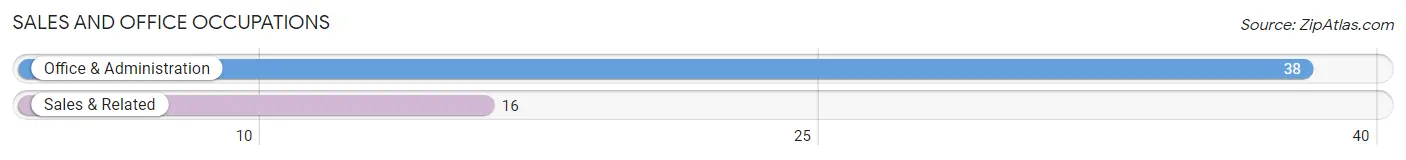
Sales and Office Occupations
The most common Sales and Office occupations in Kerkhoven are Office & Administration (38 | 10.8%), and Sales & Related (16 | 4.5%).
Sales and Office Occupations by Sex
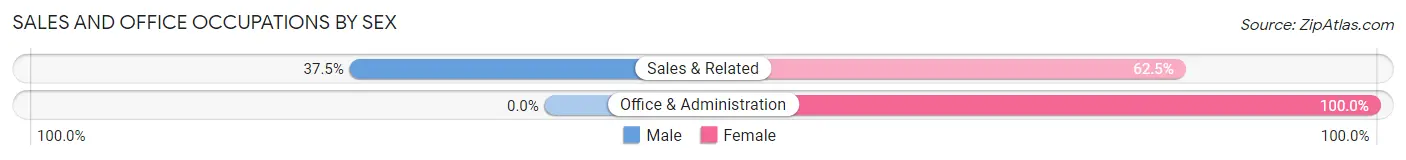
| Occupation | Male | Female |
| Sales & Related | 6 (37.5%) | 10 (62.5%) |
| Office & Administration | 0 (0.0%) | 38 (100.0%) |
| Total (Category) | 6 (11.1%) | 48 (88.9%) |
| Total (Overall) | 188 (53.3%) | 165 (46.7%) |
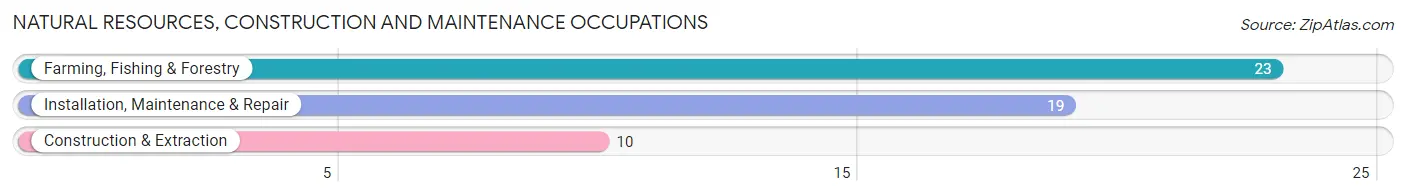
Natural Resources, Construction and Maintenance Occupations
The most common Natural Resources, Construction and Maintenance occupations in Kerkhoven are Farming, Fishing & Forestry (23 | 6.5%), Installation, Maintenance & Repair (19 | 5.4%), and Construction & Extraction (10 | 2.8%).
Natural Resources, Construction and Maintenance Occupations by Sex
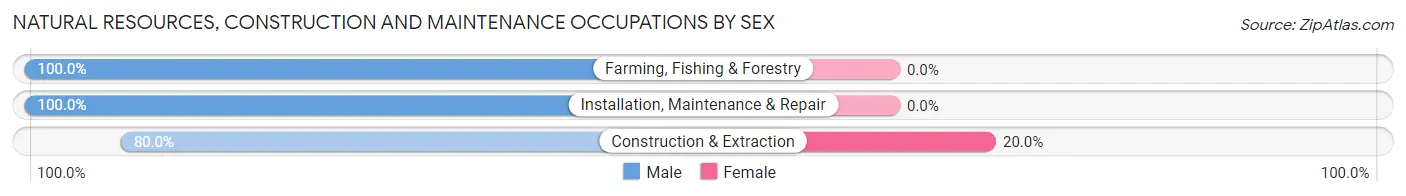
| Occupation | Male | Female |
| Farming, Fishing & Forestry | 23 (100.0%) | 0 (0.0%) |
| Construction & Extraction | 8 (80.0%) | 2 (20.0%) |
| Installation, Maintenance & Repair | 19 (100.0%) | 0 (0.0%) |
| Total (Category) | 50 (96.2%) | 2 (3.8%) |
| Total (Overall) | 188 (53.3%) | 165 (46.7%) |
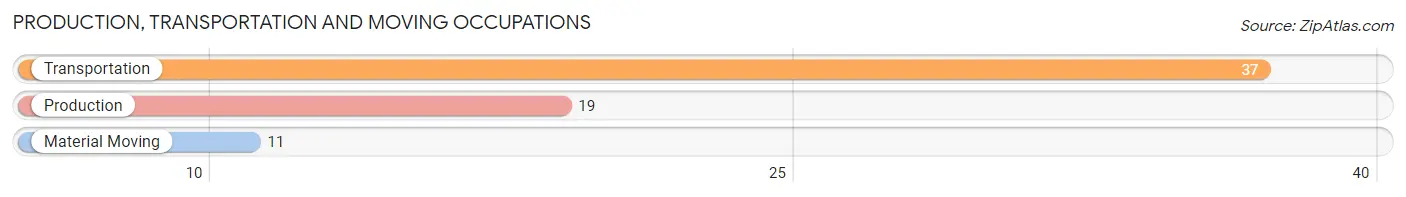
Production, Transportation and Moving Occupations
The most common Production, Transportation and Moving occupations in Kerkhoven are Transportation (37 | 10.5%), Production (19 | 5.4%), and Material Moving (11 | 3.1%).
Production, Transportation and Moving Occupations by Sex
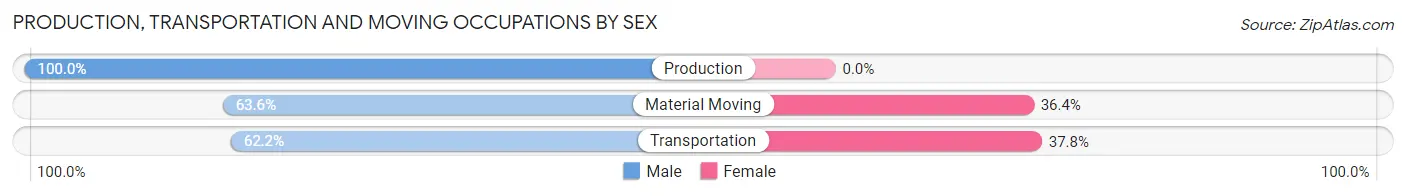
| Occupation | Male | Female |
| Production | 19 (100.0%) | 0 (0.0%) |
| Transportation | 23 (62.2%) | 14 (37.8%) |
| Material Moving | 7 (63.6%) | 4 (36.4%) |
| Total (Category) | 49 (73.1%) | 18 (26.9%) |
| Total (Overall) | 188 (53.3%) | 165 (46.7%) |
Employment Industries by Sex in Kerkhoven
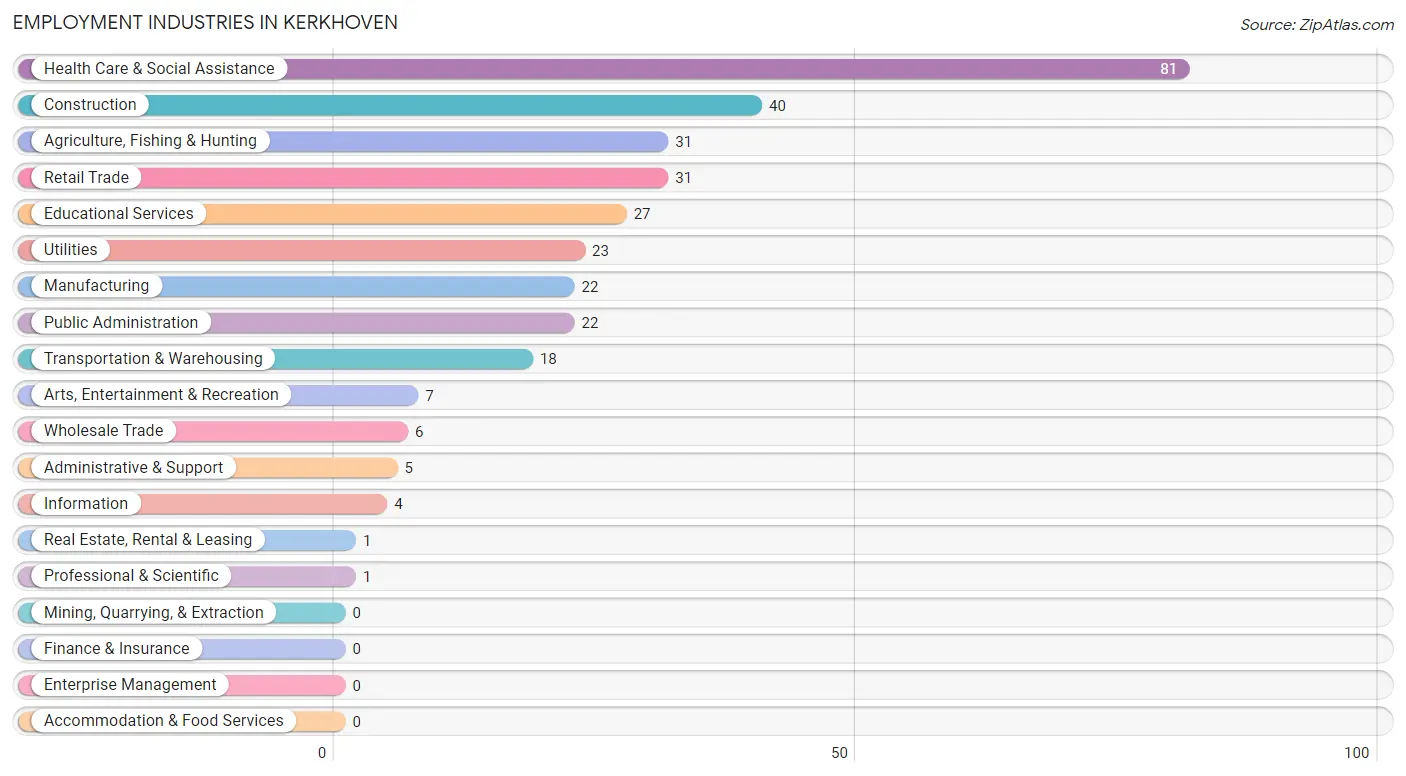
Employment Industries in Kerkhoven
The major employment industries in Kerkhoven include Health Care & Social Assistance (81 | 23.0%), Construction (40 | 11.3%), Agriculture, Fishing & Hunting (31 | 8.8%), Retail Trade (31 | 8.8%), and Educational Services (27 | 7.6%).
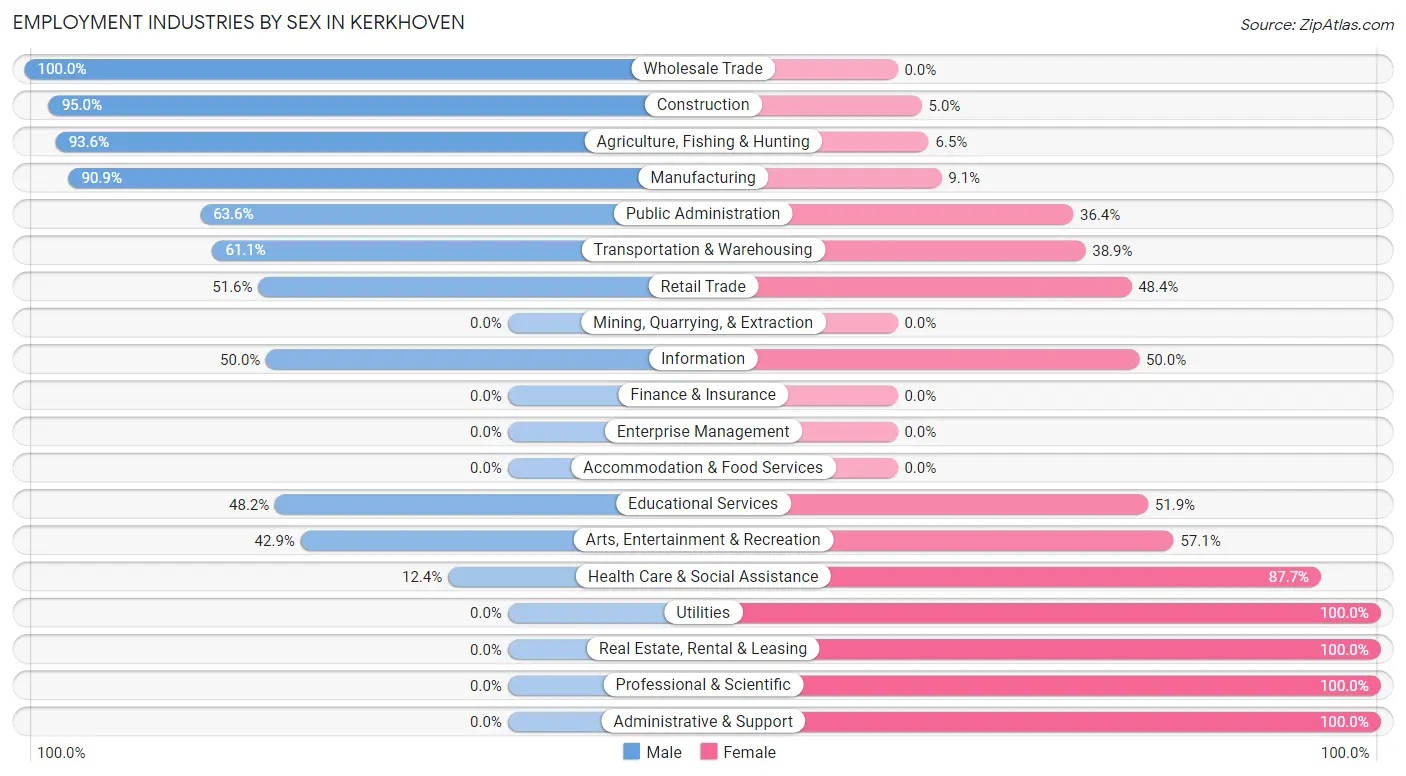
Employment Industries by Sex in Kerkhoven
The Kerkhoven industries that see more men than women are Wholesale Trade (100.0%), Construction (95.0%), and Agriculture, Fishing & Hunting (93.5%), whereas the industries that tend to have a higher number of women are Utilities (100.0%), Real Estate, Rental & Leasing (100.0%), and Professional & Scientific (100.0%).
| Industry | Male | Female |
| Agriculture, Fishing & Hunting | 29 (93.5%) | 2 (6.5%) |
| Mining, Quarrying, & Extraction | 0 (0.0%) | 0 (0.0%) |
| Construction | 38 (95.0%) | 2 (5.0%) |
| Manufacturing | 20 (90.9%) | 2 (9.1%) |
| Wholesale Trade | 6 (100.0%) | 0 (0.0%) |
| Retail Trade | 16 (51.6%) | 15 (48.4%) |
| Transportation & Warehousing | 11 (61.1%) | 7 (38.9%) |
| Utilities | 0 (0.0%) | 23 (100.0%) |
| Information | 2 (50.0%) | 2 (50.0%) |
| Finance & Insurance | 0 (0.0%) | 0 (0.0%) |
| Real Estate, Rental & Leasing | 0 (0.0%) | 1 (100.0%) |
| Professional & Scientific | 0 (0.0%) | 1 (100.0%) |
| Enterprise Management | 0 (0.0%) | 0 (0.0%) |
| Administrative & Support | 0 (0.0%) | 5 (100.0%) |
| Educational Services | 13 (48.1%) | 14 (51.8%) |
| Health Care & Social Assistance | 10 (12.3%) | 71 (87.6%) |
| Arts, Entertainment & Recreation | 3 (42.9%) | 4 (57.1%) |
| Accommodation & Food Services | 0 (0.0%) | 0 (0.0%) |
| Public Administration | 14 (63.6%) | 8 (36.4%) |
| Total | 188 (53.3%) | 165 (46.7%) |
Education in Kerkhoven
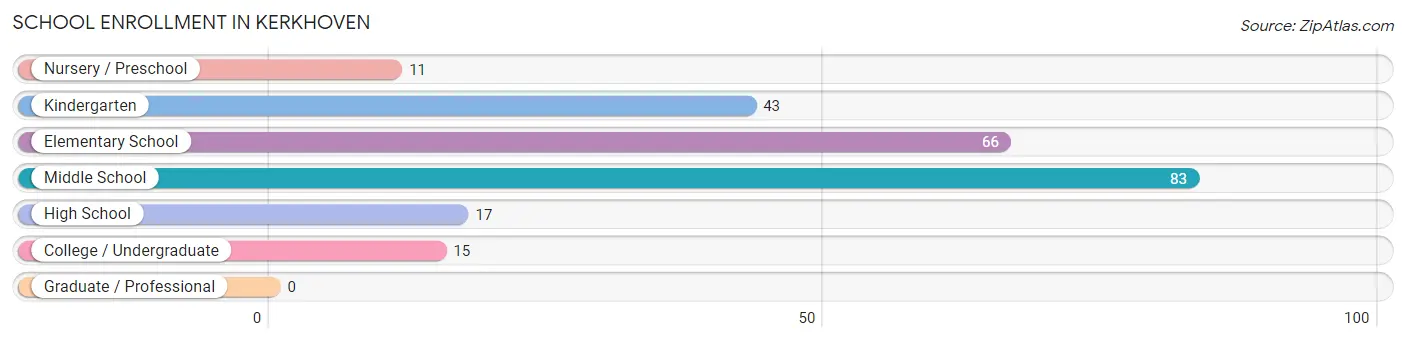
School Enrollment in Kerkhoven
The most common levels of schooling among the 235 students in Kerkhoven are middle school (83 | 35.3%), elementary school (66 | 28.1%), and kindergarten (43 | 18.3%).
| School Level | # Students | % Students |
| Nursery / Preschool | 11 | 4.7% |
| Kindergarten | 43 | 18.3% |
| Elementary School | 66 | 28.1% |
| Middle School | 83 | 35.3% |
| High School | 17 | 7.2% |
| College / Undergraduate | 15 | 6.4% |
| Graduate / Professional | 0 | 0.0% |
| Total | 235 | 100.0% |
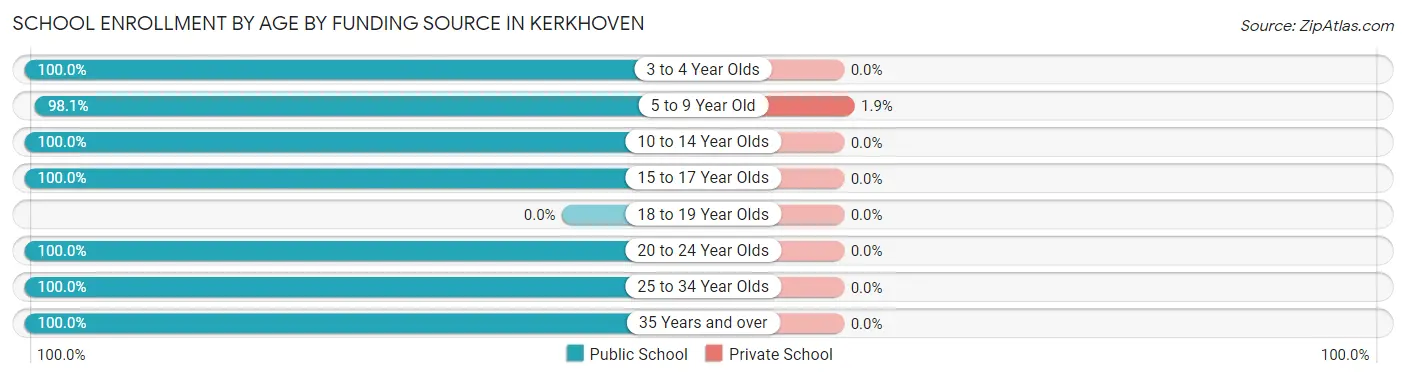
School Enrollment by Age by Funding Source in Kerkhoven
Out of a total of 235 students who are enrolled in schools in Kerkhoven, 2 (0.9%) attend a private institution, while the remaining 233 (99.1%) are enrolled in public schools. The age group of 5 to 9 year old has the highest likelihood of being enrolled in private schools, with 2 (1.9% in the age bracket) enrolled. Conversely, the age group of 3 to 4 year olds has the lowest likelihood of being enrolled in a private school, with 7 (100.0% in the age bracket) attending a public institution.
| Age Bracket | Public School | Private School |
| 3 to 4 Year Olds | 7 (100.0%) | 0 (0.0%) |
| 5 to 9 Year Old | 101 (98.1%) | 2 (1.9%) |
| 10 to 14 Year Olds | 95 (100.0%) | 0 (0.0%) |
| 15 to 17 Year Olds | 15 (100.0%) | 0 (0.0%) |
| 18 to 19 Year Olds | 0 (0.0%) | 0 (0.0%) |
| 20 to 24 Year Olds | 12 (100.0%) | 0 (0.0%) |
| 25 to 34 Year Olds | 1 (100.0%) | 0 (0.0%) |
| 35 Years and over | 2 (100.0%) | 0 (0.0%) |
| Total | 233 (99.1%) | 2 (0.9%) |
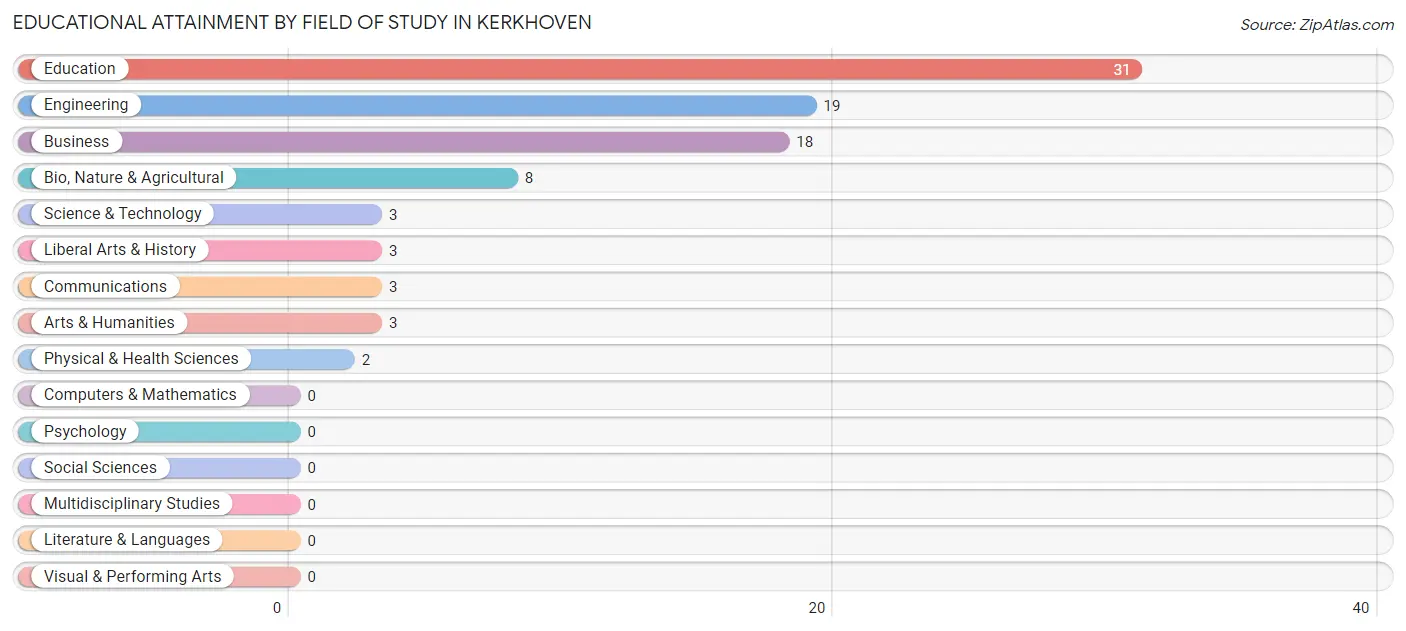
Educational Attainment by Field of Study in Kerkhoven
Education (31 | 34.4%), engineering (19 | 21.1%), business (18 | 20.0%), bio, nature & agricultural (8 | 8.9%), and science & technology (3 | 3.3%) are the most common fields of study among 90 individuals in Kerkhoven who have obtained a bachelor's degree or higher.
| Field of Study | # Graduates | % Graduates |
| Computers & Mathematics | 0 | 0.0% |
| Bio, Nature & Agricultural | 8 | 8.9% |
| Physical & Health Sciences | 2 | 2.2% |
| Psychology | 0 | 0.0% |
| Social Sciences | 0 | 0.0% |
| Engineering | 19 | 21.1% |
| Multidisciplinary Studies | 0 | 0.0% |
| Science & Technology | 3 | 3.3% |
| Business | 18 | 20.0% |
| Education | 31 | 34.4% |
| Literature & Languages | 0 | 0.0% |
| Liberal Arts & History | 3 | 3.3% |
| Visual & Performing Arts | 0 | 0.0% |
| Communications | 3 | 3.3% |
| Arts & Humanities | 3 | 3.3% |
| Total | 90 | 100.0% |
Transportation & Commute in Kerkhoven
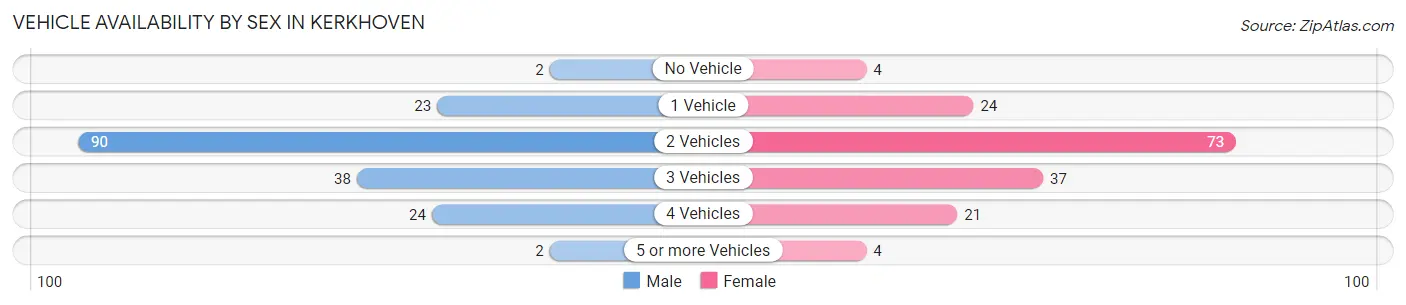
Vehicle Availability by Sex in Kerkhoven
The most prevalent vehicle ownership categories in Kerkhoven are males with 2 vehicles (90, accounting for 50.3%) and females with 2 vehicles (73, making up 55.2%).
| Vehicles Available | Male | Female |
| No Vehicle | 2 (1.1%) | 4 (2.5%) |
| 1 Vehicle | 23 (12.9%) | 24 (14.7%) |
| 2 Vehicles | 90 (50.3%) | 73 (44.8%) |
| 3 Vehicles | 38 (21.2%) | 37 (22.7%) |
| 4 Vehicles | 24 (13.4%) | 21 (12.9%) |
| 5 or more Vehicles | 2 (1.1%) | 4 (2.5%) |
| Total | 179 (100.0%) | 163 (100.0%) |
Commute Time in Kerkhoven
The most frequently occuring commute durations in Kerkhoven are 20 to 24 minutes (69 commuters, 22.3%), 5 to 9 minutes (48 commuters, 15.5%), and less than 5 minutes (40 commuters, 12.9%).
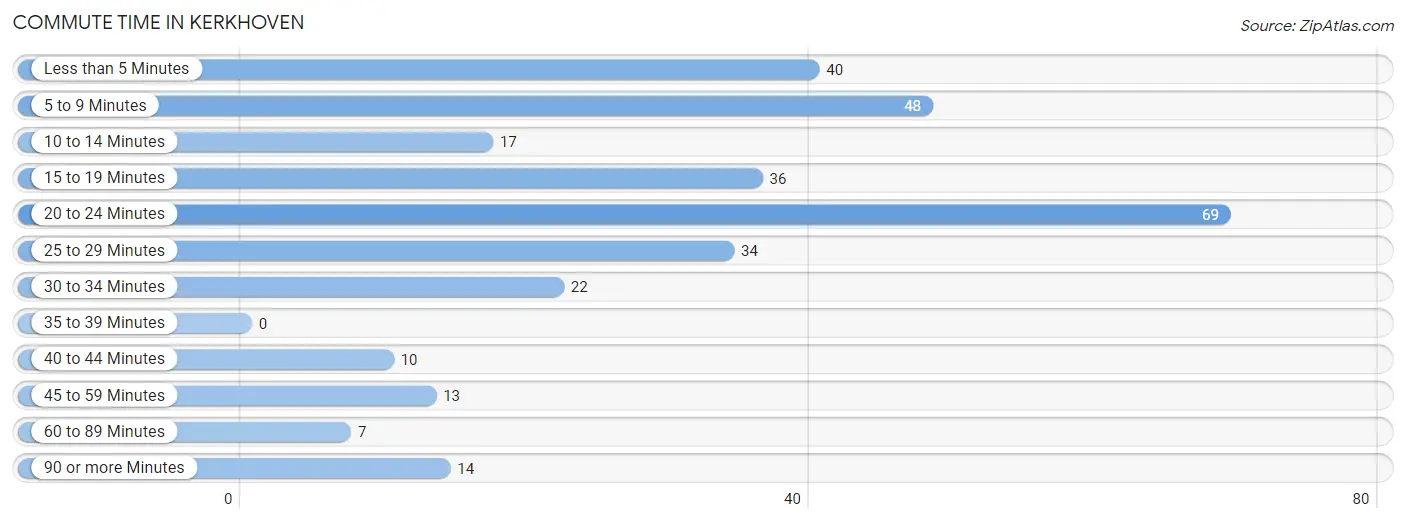
| Commute Time | # Commuters | % Commuters |
| Less than 5 Minutes | 40 | 12.9% |
| 5 to 9 Minutes | 48 | 15.5% |
| 10 to 14 Minutes | 17 | 5.5% |
| 15 to 19 Minutes | 36 | 11.6% |
| 20 to 24 Minutes | 69 | 22.3% |
| 25 to 29 Minutes | 34 | 11.0% |
| 30 to 34 Minutes | 22 | 7.1% |
| 35 to 39 Minutes | 0 | 0.0% |
| 40 to 44 Minutes | 10 | 3.2% |
| 45 to 59 Minutes | 13 | 4.2% |
| 60 to 89 Minutes | 7 | 2.3% |
| 90 or more Minutes | 14 | 4.5% |
Commute Time by Sex in Kerkhoven
The most common commute times in Kerkhoven are less than 5 minutes (29 commuters, 18.5%) for males and 20 to 24 minutes (47 commuters, 30.7%) for females.
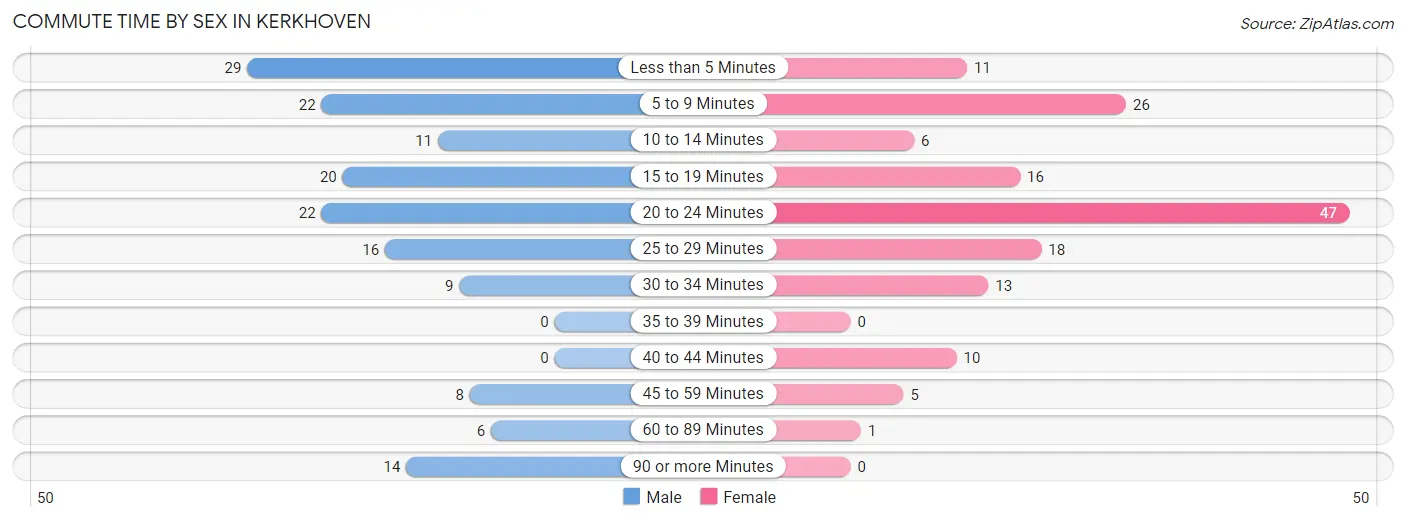
| Commute Time | Male | Female |
| Less than 5 Minutes | 29 (18.5%) | 11 (7.2%) |
| 5 to 9 Minutes | 22 (14.0%) | 26 (17.0%) |
| 10 to 14 Minutes | 11 (7.0%) | 6 (3.9%) |
| 15 to 19 Minutes | 20 (12.7%) | 16 (10.5%) |
| 20 to 24 Minutes | 22 (14.0%) | 47 (30.7%) |
| 25 to 29 Minutes | 16 (10.2%) | 18 (11.8%) |
| 30 to 34 Minutes | 9 (5.7%) | 13 (8.5%) |
| 35 to 39 Minutes | 0 (0.0%) | 0 (0.0%) |
| 40 to 44 Minutes | 0 (0.0%) | 10 (6.5%) |
| 45 to 59 Minutes | 8 (5.1%) | 5 (3.3%) |
| 60 to 89 Minutes | 6 (3.8%) | 1 (0.6%) |
| 90 or more Minutes | 14 (8.9%) | 0 (0.0%) |
Time of Departure to Work by Sex in Kerkhoven
The most frequent times of departure to work in Kerkhoven are 7:00 AM to 7:29 AM (42, 26.8%) for males and 8:00 AM to 8:29 AM (43, 28.1%) for females.
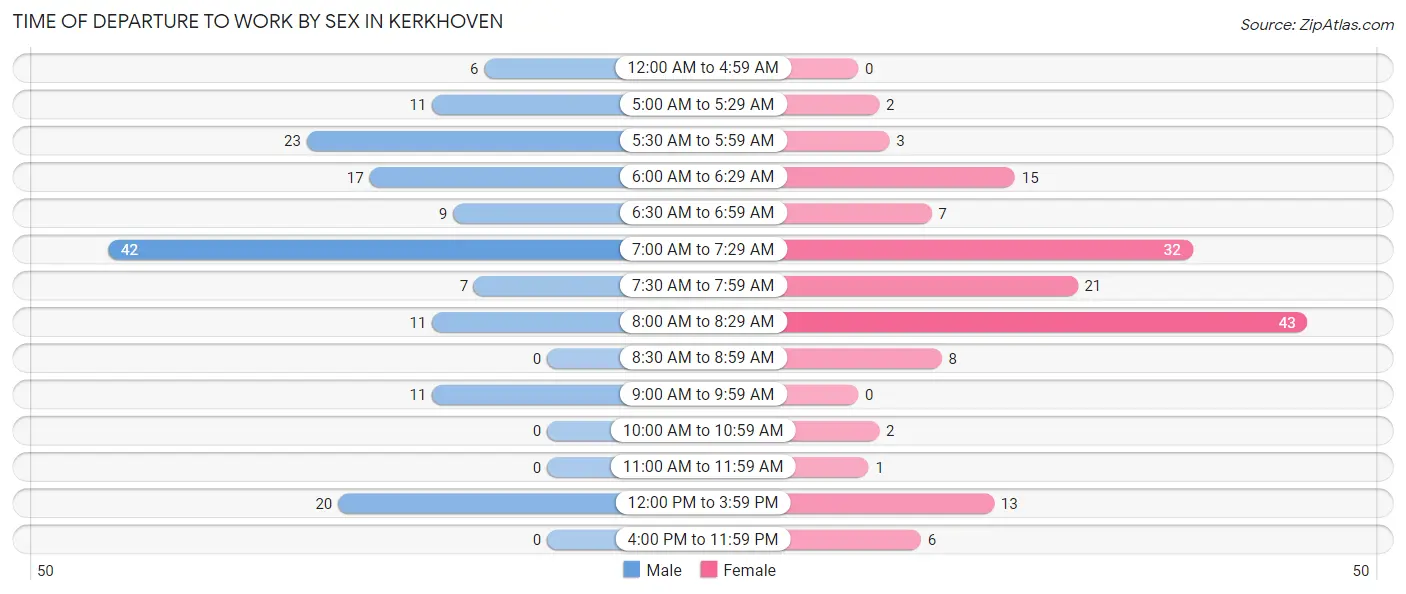
| Time of Departure | Male | Female |
| 12:00 AM to 4:59 AM | 6 (3.8%) | 0 (0.0%) |
| 5:00 AM to 5:29 AM | 11 (7.0%) | 2 (1.3%) |
| 5:30 AM to 5:59 AM | 23 (14.6%) | 3 (2.0%) |
| 6:00 AM to 6:29 AM | 17 (10.8%) | 15 (9.8%) |
| 6:30 AM to 6:59 AM | 9 (5.7%) | 7 (4.6%) |
| 7:00 AM to 7:29 AM | 42 (26.8%) | 32 (20.9%) |
| 7:30 AM to 7:59 AM | 7 (4.5%) | 21 (13.7%) |
| 8:00 AM to 8:29 AM | 11 (7.0%) | 43 (28.1%) |
| 8:30 AM to 8:59 AM | 0 (0.0%) | 8 (5.2%) |
| 9:00 AM to 9:59 AM | 11 (7.0%) | 0 (0.0%) |
| 10:00 AM to 10:59 AM | 0 (0.0%) | 2 (1.3%) |
| 11:00 AM to 11:59 AM | 0 (0.0%) | 1 (0.6%) |
| 12:00 PM to 3:59 PM | 20 (12.7%) | 13 (8.5%) |
| 4:00 PM to 11:59 PM | 0 (0.0%) | 6 (3.9%) |
| Total | 157 (100.0%) | 153 (100.0%) |
Housing Occupancy in Kerkhoven
Occupancy by Ownership in Kerkhoven
Of the total 329 dwellings in Kerkhoven, owner-occupied units account for 208 (63.2%), while renter-occupied units make up 121 (36.8%).
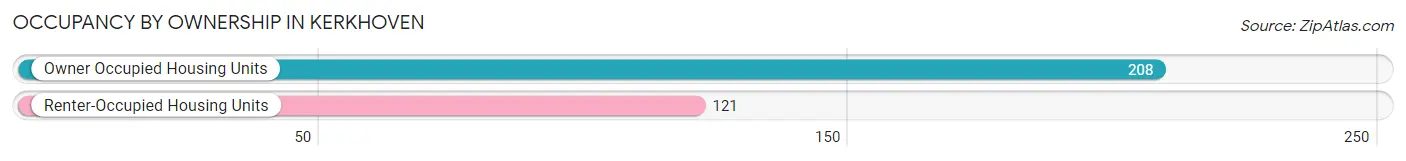
| Occupancy | # Housing Units | % Housing Units |
| Owner Occupied Housing Units | 208 | 63.2% |
| Renter-Occupied Housing Units | 121 | 36.8% |
| Total Occupied Housing Units | 329 | 100.0% |
Occupancy by Household Size in Kerkhoven
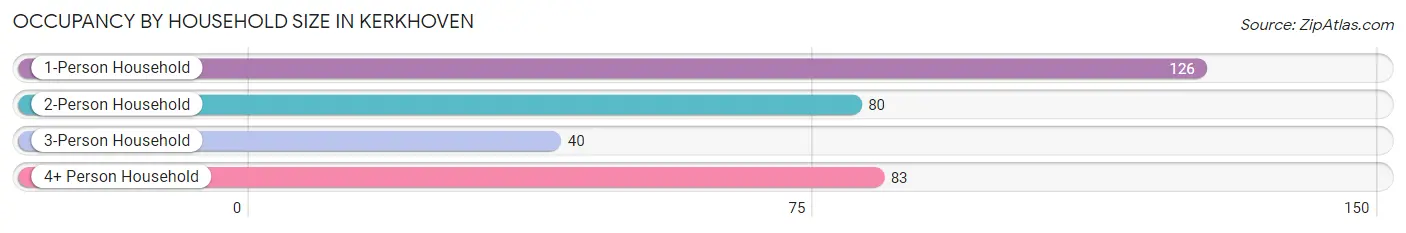
| Household Size | # Housing Units | % Housing Units |
| 1-Person Household | 126 | 38.3% |
| 2-Person Household | 80 | 24.3% |
| 3-Person Household | 40 | 12.2% |
| 4+ Person Household | 83 | 25.2% |
| Total Housing Units | 329 | 100.0% |
Occupancy by Ownership by Household Size in Kerkhoven
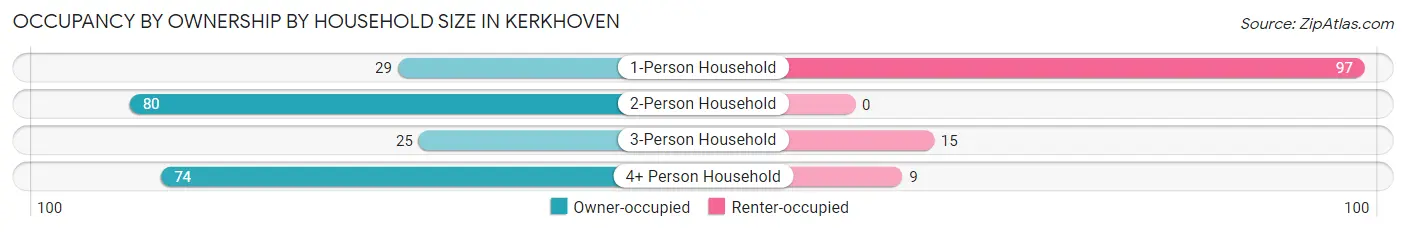
| Household Size | Owner-occupied | Renter-occupied |
| 1-Person Household | 29 (23.0%) | 97 (77.0%) |
| 2-Person Household | 80 (100.0%) | 0 (0.0%) |
| 3-Person Household | 25 (62.5%) | 15 (37.5%) |
| 4+ Person Household | 74 (89.2%) | 9 (10.8%) |
| Total Housing Units | 208 (63.2%) | 121 (36.8%) |
Occupancy by Educational Attainment in Kerkhoven
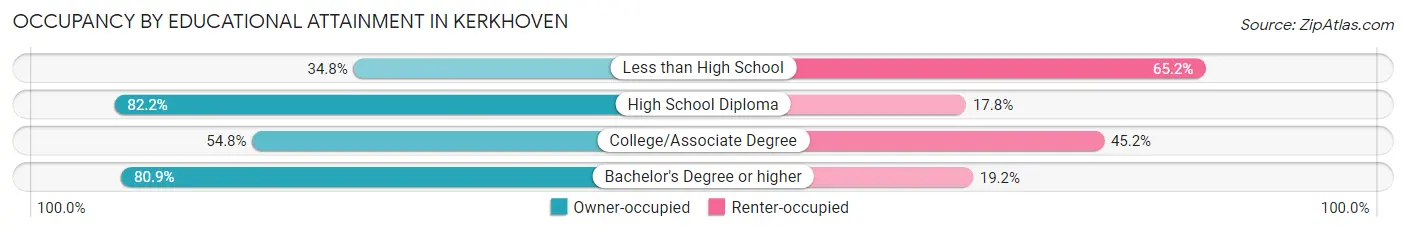
| Household Size | Owner-occupied | Renter-occupied |
| Less than High School | 8 (34.8%) | 15 (65.2%) |
| High School Diploma | 60 (82.2%) | 13 (17.8%) |
| College/Associate Degree | 102 (54.8%) | 84 (45.2%) |
| Bachelor's Degree or higher | 38 (80.8%) | 9 (19.2%) |
Occupancy by Age of Householder in Kerkhoven
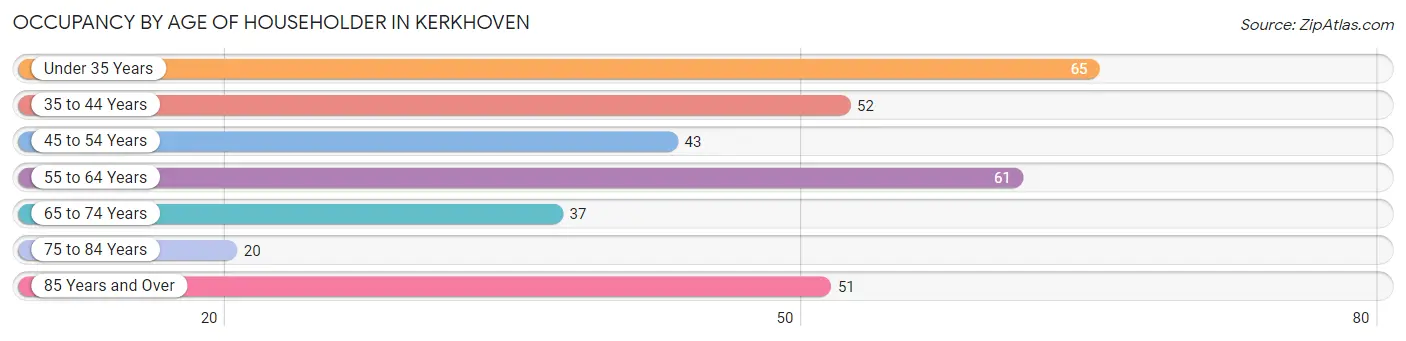
| Age Bracket | # Households | % Households |
| Under 35 Years | 65 | 19.8% |
| 35 to 44 Years | 52 | 15.8% |
| 45 to 54 Years | 43 | 13.1% |
| 55 to 64 Years | 61 | 18.5% |
| 65 to 74 Years | 37 | 11.3% |
| 75 to 84 Years | 20 | 6.1% |
| 85 Years and Over | 51 | 15.5% |
| Total | 329 | 100.0% |
Housing Finances in Kerkhoven
Median Income by Occupancy in Kerkhoven
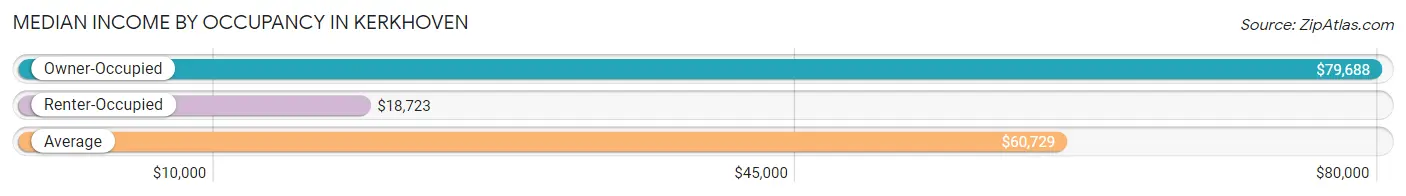
| Occupancy Type | # Households | Median Income |
| Owner-Occupied | 208 (63.2%) | $79,688 |
| Renter-Occupied | 121 (36.8%) | $18,723 |
| Average | 329 (100.0%) | $60,729 |
Occupancy by Householder Income Bracket in Kerkhoven
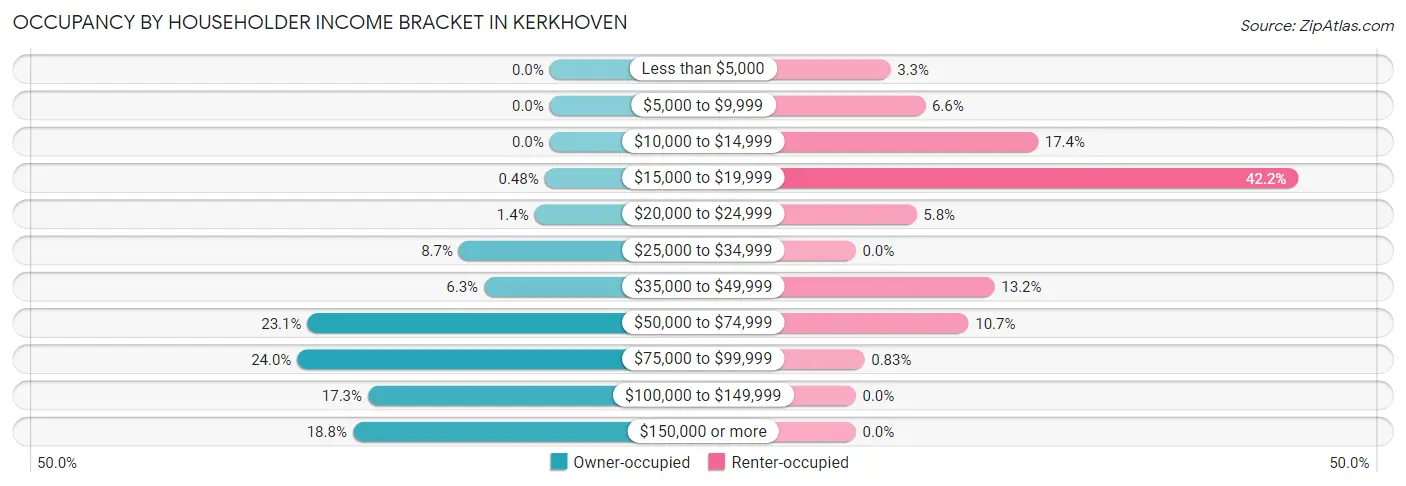
| Income Bracket | Owner-occupied | Renter-occupied |
| Less than $5,000 | 0 (0.0%) | 4 (3.3%) |
| $5,000 to $9,999 | 0 (0.0%) | 8 (6.6%) |
| $10,000 to $14,999 | 0 (0.0%) | 21 (17.4%) |
| $15,000 to $19,999 | 1 (0.5%) | 51 (42.1%) |
| $20,000 to $24,999 | 3 (1.4%) | 7 (5.8%) |
| $25,000 to $34,999 | 18 (8.6%) | 0 (0.0%) |
| $35,000 to $49,999 | 13 (6.2%) | 16 (13.2%) |
| $50,000 to $74,999 | 48 (23.1%) | 13 (10.7%) |
| $75,000 to $99,999 | 50 (24.0%) | 1 (0.8%) |
| $100,000 to $149,999 | 36 (17.3%) | 0 (0.0%) |
| $150,000 or more | 39 (18.8%) | 0 (0.0%) |
| Total | 208 (100.0%) | 121 (100.0%) |
Monthly Housing Cost Tiers in Kerkhoven
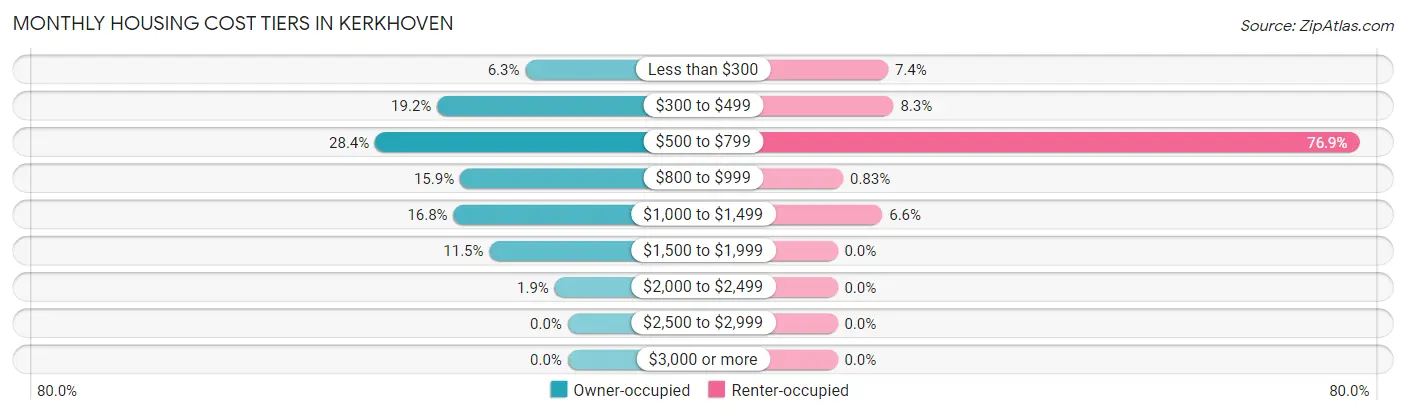
| Monthly Cost | Owner-occupied | Renter-occupied |
| Less than $300 | 13 (6.2%) | 9 (7.4%) |
| $300 to $499 | 40 (19.2%) | 10 (8.3%) |
| $500 to $799 | 59 (28.4%) | 93 (76.9%) |
| $800 to $999 | 33 (15.9%) | 1 (0.8%) |
| $1,000 to $1,499 | 35 (16.8%) | 8 (6.6%) |
| $1,500 to $1,999 | 24 (11.5%) | 0 (0.0%) |
| $2,000 to $2,499 | 4 (1.9%) | 0 (0.0%) |
| $2,500 to $2,999 | 0 (0.0%) | 0 (0.0%) |
| $3,000 or more | 0 (0.0%) | 0 (0.0%) |
| Total | 208 (100.0%) | 121 (100.0%) |
Physical Housing Characteristics in Kerkhoven
Housing Structures in Kerkhoven
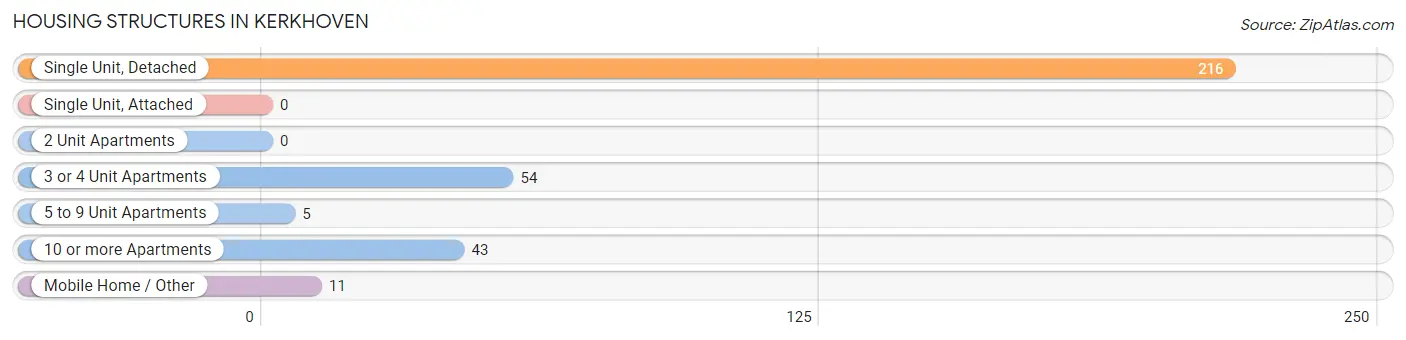
| Structure Type | # Housing Units | % Housing Units |
| Single Unit, Detached | 216 | 65.6% |
| Single Unit, Attached | 0 | 0.0% |
| 2 Unit Apartments | 0 | 0.0% |
| 3 or 4 Unit Apartments | 54 | 16.4% |
| 5 to 9 Unit Apartments | 5 | 1.5% |
| 10 or more Apartments | 43 | 13.1% |
| Mobile Home / Other | 11 | 3.3% |
| Total | 329 | 100.0% |
Housing Structures by Occupancy in Kerkhoven
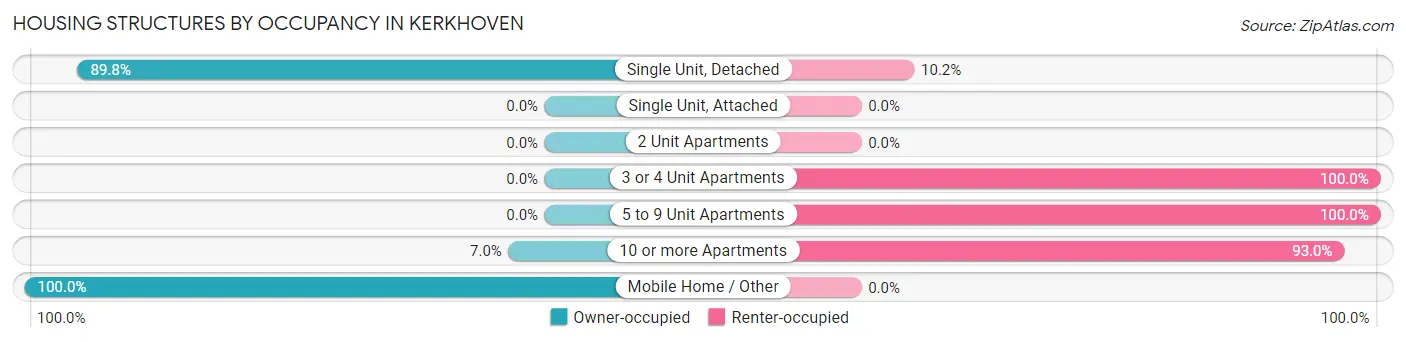
| Structure Type | Owner-occupied | Renter-occupied |
| Single Unit, Detached | 194 (89.8%) | 22 (10.2%) |
| Single Unit, Attached | 0 (0.0%) | 0 (0.0%) |
| 2 Unit Apartments | 0 (0.0%) | 0 (0.0%) |
| 3 or 4 Unit Apartments | 0 (0.0%) | 54 (100.0%) |
| 5 to 9 Unit Apartments | 0 (0.0%) | 5 (100.0%) |
| 10 or more Apartments | 3 (7.0%) | 40 (93.0%) |
| Mobile Home / Other | 11 (100.0%) | 0 (0.0%) |
| Total | 208 (63.2%) | 121 (36.8%) |
Housing Structures by Number of Rooms in Kerkhoven
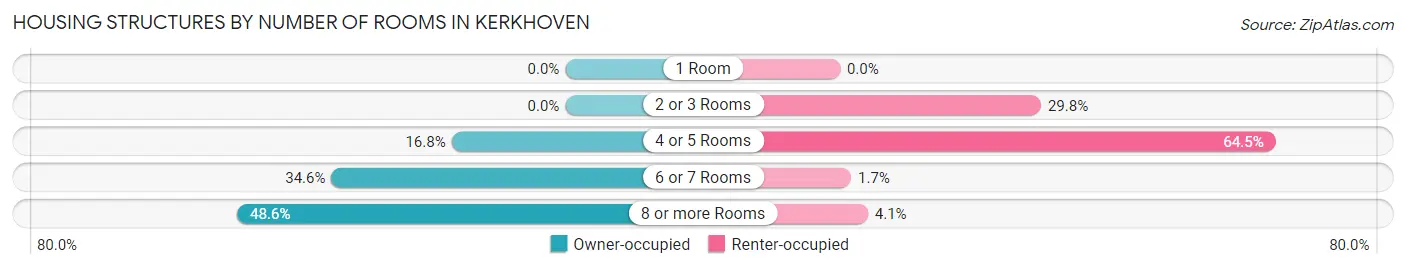
| Number of Rooms | Owner-occupied | Renter-occupied |
| 1 Room | 0 (0.0%) | 0 (0.0%) |
| 2 or 3 Rooms | 0 (0.0%) | 36 (29.7%) |
| 4 or 5 Rooms | 35 (16.8%) | 78 (64.5%) |
| 6 or 7 Rooms | 72 (34.6%) | 2 (1.7%) |
| 8 or more Rooms | 101 (48.6%) | 5 (4.1%) |
| Total | 208 (100.0%) | 121 (100.0%) |
Housing Structure by Heating Type in Kerkhoven
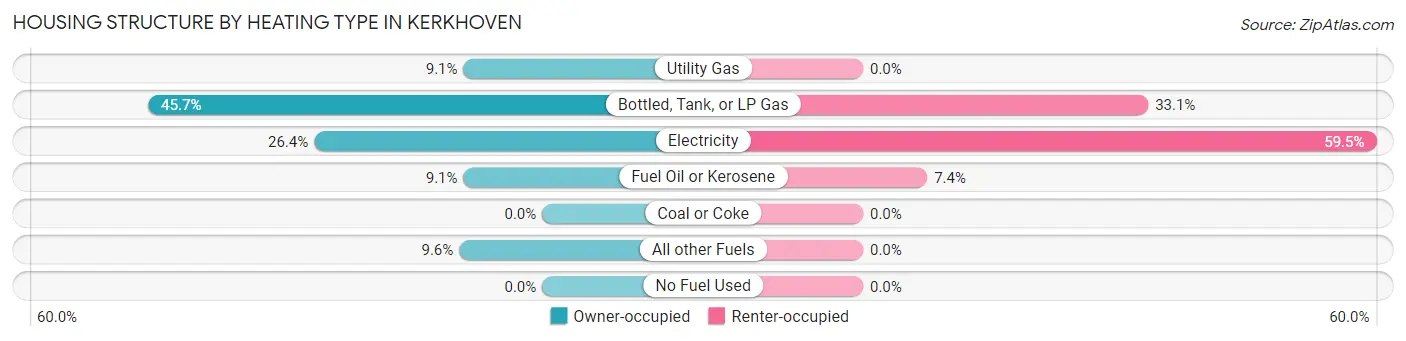
| Heating Type | Owner-occupied | Renter-occupied |
| Utility Gas | 19 (9.1%) | 0 (0.0%) |
| Bottled, Tank, or LP Gas | 95 (45.7%) | 40 (33.1%) |
| Electricity | 55 (26.4%) | 72 (59.5%) |
| Fuel Oil or Kerosene | 19 (9.1%) | 9 (7.4%) |
| Coal or Coke | 0 (0.0%) | 0 (0.0%) |
| All other Fuels | 20 (9.6%) | 0 (0.0%) |
| No Fuel Used | 0 (0.0%) | 0 (0.0%) |
| Total | 208 (100.0%) | 121 (100.0%) |
Household Vehicle Usage in Kerkhoven
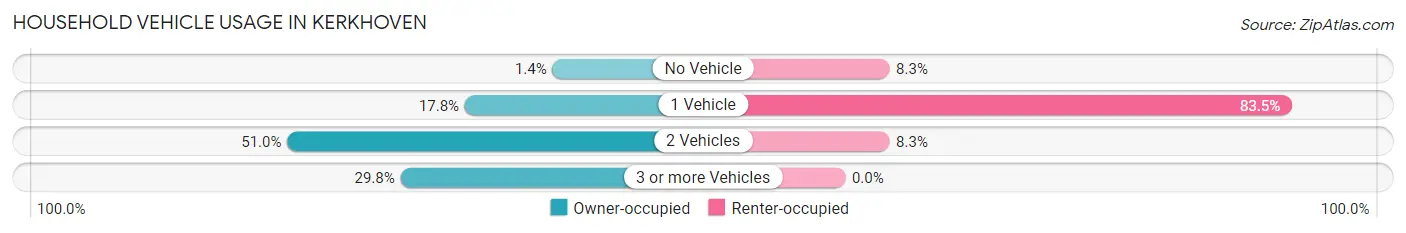
| Vehicles per Household | Owner-occupied | Renter-occupied |
| No Vehicle | 3 (1.4%) | 10 (8.3%) |
| 1 Vehicle | 37 (17.8%) | 101 (83.5%) |
| 2 Vehicles | 106 (51.0%) | 10 (8.3%) |
| 3 or more Vehicles | 62 (29.8%) | 0 (0.0%) |
| Total | 208 (100.0%) | 121 (100.0%) |
Real Estate & Mortgages in Kerkhoven
Real Estate and Mortgage Overview in Kerkhoven
| Characteristic | Without Mortgage | With Mortgage |
| Housing Units | 111 | 97 |
| Median Property Value | $124,000 | $152,900 |
| Median Household Income | $98,482 | $5 |
| Monthly Housing Costs | $550 | $0 |
| Real Estate Taxes | $1,573 | $0 |
Property Value by Mortgage Status in Kerkhoven
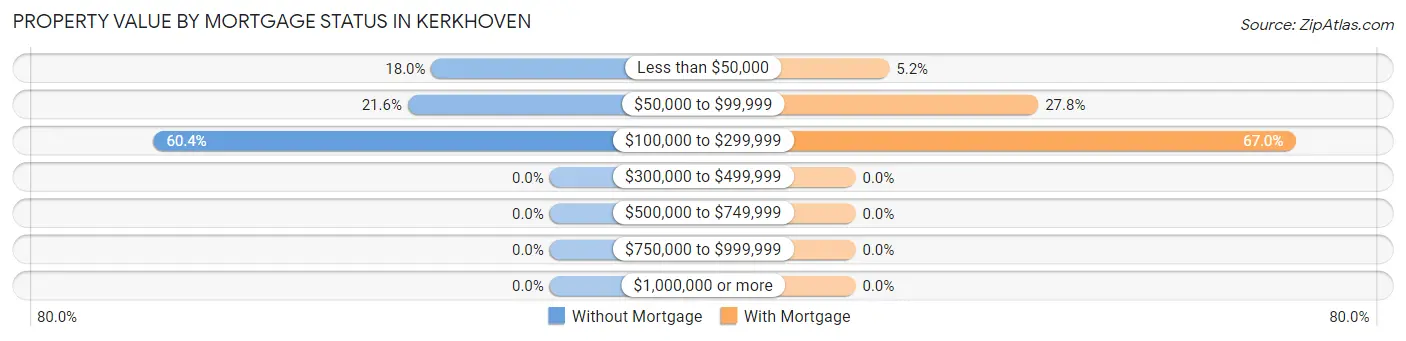
| Property Value | Without Mortgage | With Mortgage |
| Less than $50,000 | 20 (18.0%) | 5 (5.1%) |
| $50,000 to $99,999 | 24 (21.6%) | 27 (27.8%) |
| $100,000 to $299,999 | 67 (60.4%) | 65 (67.0%) |
| $300,000 to $499,999 | 0 (0.0%) | 0 (0.0%) |
| $500,000 to $749,999 | 0 (0.0%) | 0 (0.0%) |
| $750,000 to $999,999 | 0 (0.0%) | 0 (0.0%) |
| $1,000,000 or more | 0 (0.0%) | 0 (0.0%) |
| Total | 111 (100.0%) | 97 (100.0%) |
Household Income by Mortgage Status in Kerkhoven
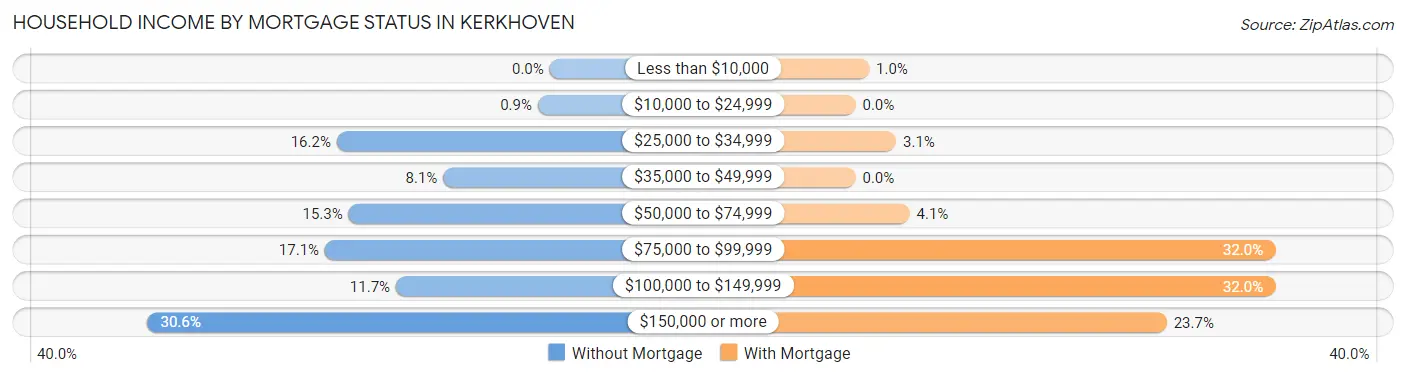
| Household Income | Without Mortgage | With Mortgage |
| Less than $10,000 | 0 (0.0%) | 1 (1.0%) |
| $10,000 to $24,999 | 1 (0.9%) | 0 (0.0%) |
| $25,000 to $34,999 | 18 (16.2%) | 3 (3.1%) |
| $35,000 to $49,999 | 9 (8.1%) | 0 (0.0%) |
| $50,000 to $74,999 | 17 (15.3%) | 4 (4.1%) |
| $75,000 to $99,999 | 19 (17.1%) | 31 (32.0%) |
| $100,000 to $149,999 | 13 (11.7%) | 31 (32.0%) |
| $150,000 or more | 34 (30.6%) | 23 (23.7%) |
| Total | 111 (100.0%) | 97 (100.0%) |
Property Value to Household Income Ratio in Kerkhoven
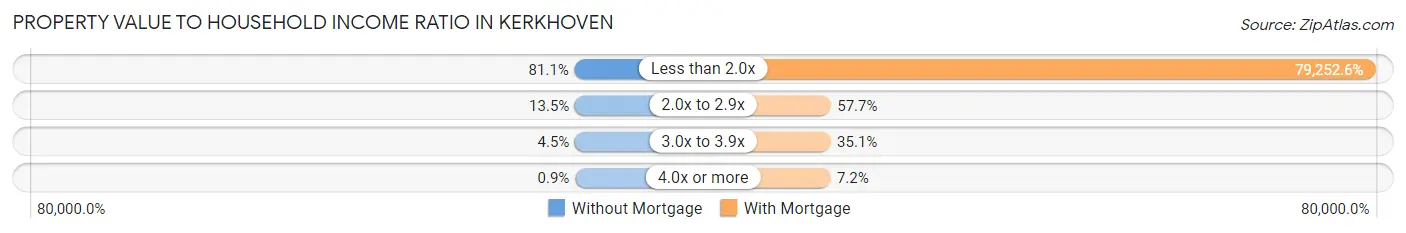
| Value-to-Income Ratio | Without Mortgage | With Mortgage |
| Less than 2.0x | 90 (81.1%) | 76,875 (79,252.6%) |
| 2.0x to 2.9x | 15 (13.5%) | 56 (57.7%) |
| 3.0x to 3.9x | 5 (4.5%) | 34 (35.0%) |
| 4.0x or more | 1 (0.9%) | 7 (7.2%) |
| Total | 111 (100.0%) | 97 (100.0%) |
Real Estate Taxes by Mortgage Status in Kerkhoven
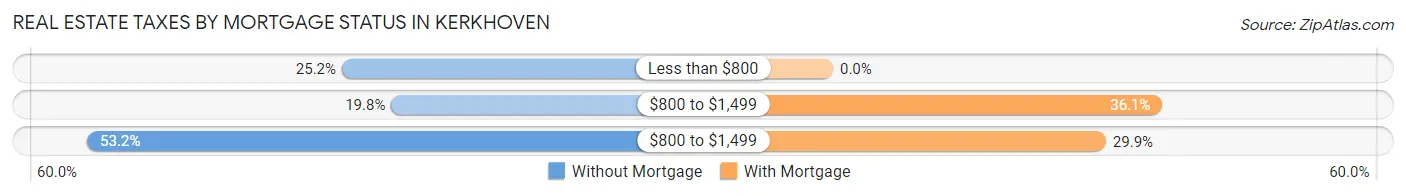
| Property Taxes | Without Mortgage | With Mortgage |
| Less than $800 | 28 (25.2%) | 0 (0.0%) |
| $800 to $1,499 | 22 (19.8%) | 35 (36.1%) |
| $800 to $1,499 | 59 (53.1%) | 29 (29.9%) |
| Total | 111 (100.0%) | 97 (100.0%) |
Health & Disability in Kerkhoven
Health Insurance Coverage by Age in Kerkhoven
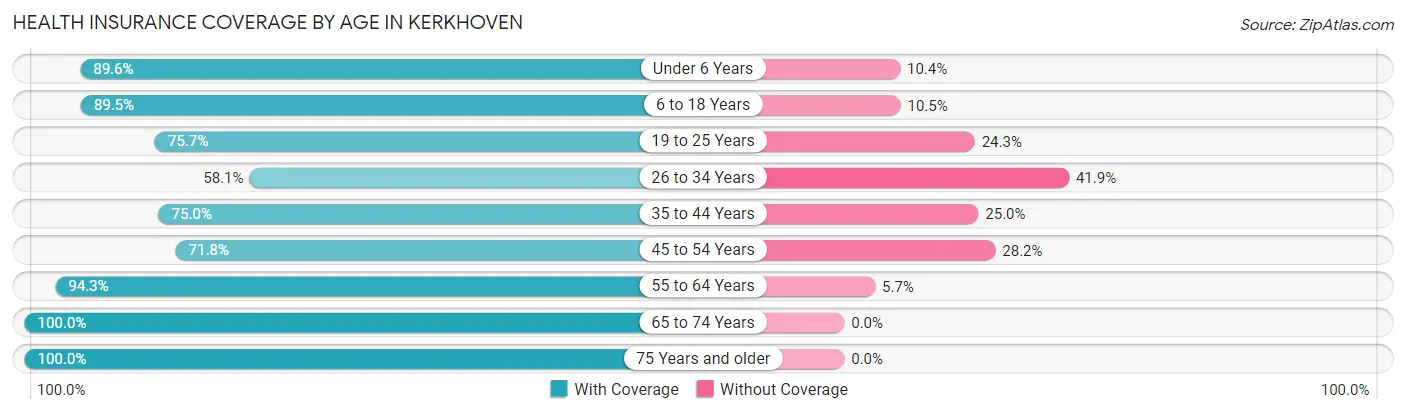
| Age Bracket | With Coverage | Without Coverage |
| Under 6 Years | 69 (89.6%) | 8 (10.4%) |
| 6 to 18 Years | 179 (89.5%) | 21 (10.5%) |
| 19 to 25 Years | 28 (75.7%) | 9 (24.3%) |
| 26 to 34 Years | 61 (58.1%) | 44 (41.9%) |
| 35 to 44 Years | 51 (75.0%) | 17 (25.0%) |
| 45 to 54 Years | 51 (71.8%) | 20 (28.2%) |
| 55 to 64 Years | 115 (94.3%) | 7 (5.7%) |
| 65 to 74 Years | 54 (100.0%) | 0 (0.0%) |
| 75 Years and older | 88 (100.0%) | 0 (0.0%) |
| Total | 696 (84.7%) | 126 (15.3%) |
Health Insurance Coverage by Citizenship Status in Kerkhoven
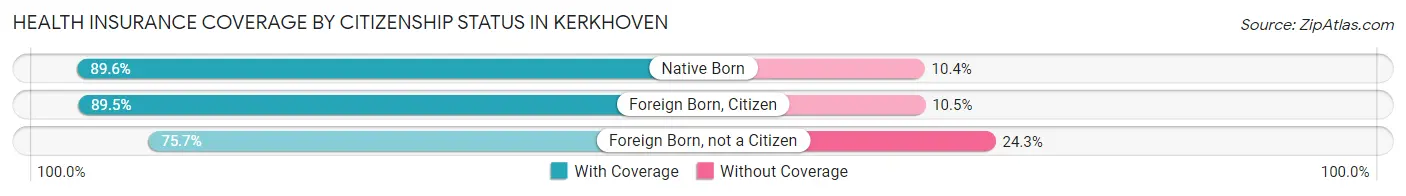
| Citizenship Status | With Coverage | Without Coverage |
| Native Born | 69 (89.6%) | 8 (10.4%) |
| Foreign Born, Citizen | 179 (89.5%) | 21 (10.5%) |
| Foreign Born, not a Citizen | 28 (75.7%) | 9 (24.3%) |
Health Insurance Coverage by Household Income in Kerkhoven
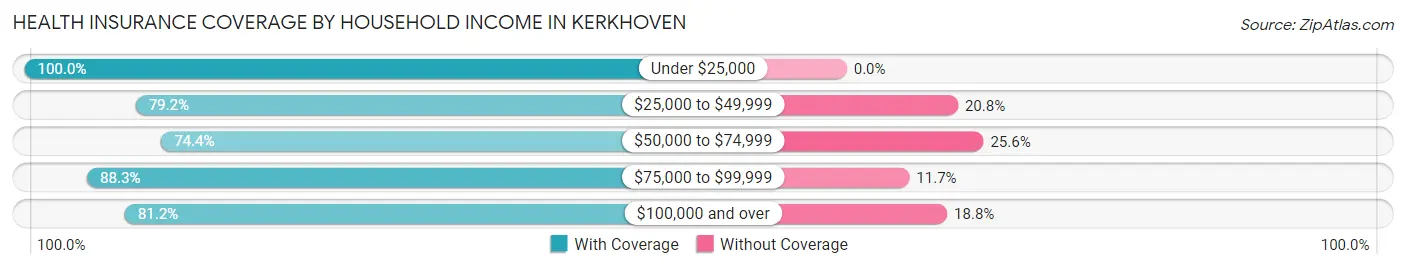
| Household Income | With Coverage | Without Coverage |
| Under $25,000 | 158 (100.0%) | 0 (0.0%) |
| $25,000 to $49,999 | 57 (79.2%) | 15 (20.8%) |
| $50,000 to $74,999 | 122 (74.4%) | 42 (25.6%) |
| $75,000 to $99,999 | 143 (88.3%) | 19 (11.7%) |
| $100,000 and over | 216 (81.2%) | 50 (18.8%) |
Public vs Private Health Insurance Coverage by Age in Kerkhoven
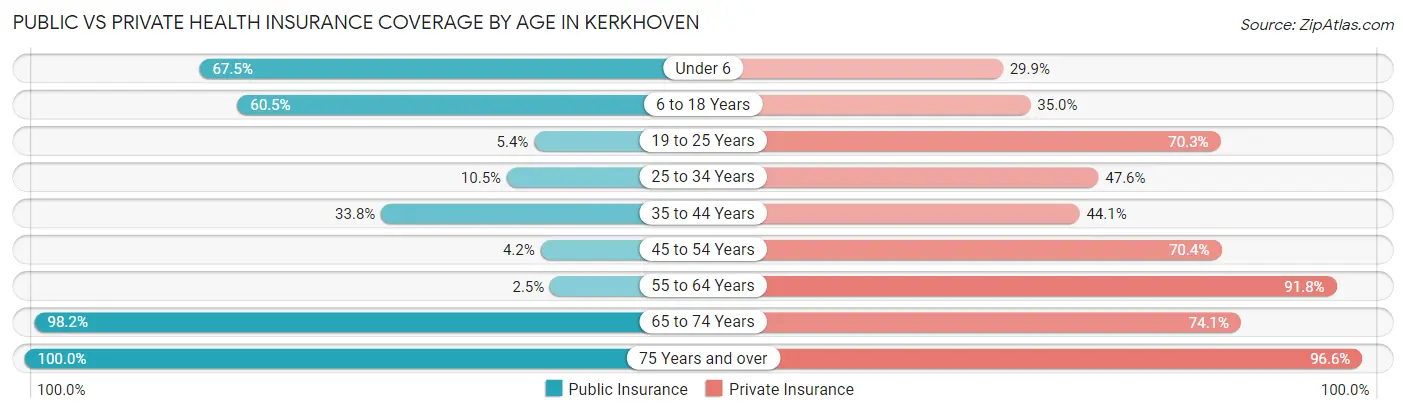
| Age Bracket | Public Insurance | Private Insurance |
| Under 6 | 52 (67.5%) | 23 (29.9%) |
| 6 to 18 Years | 121 (60.5%) | 70 (35.0%) |
| 19 to 25 Years | 2 (5.4%) | 26 (70.3%) |
| 25 to 34 Years | 11 (10.5%) | 50 (47.6%) |
| 35 to 44 Years | 23 (33.8%) | 30 (44.1%) |
| 45 to 54 Years | 3 (4.2%) | 50 (70.4%) |
| 55 to 64 Years | 3 (2.5%) | 112 (91.8%) |
| 65 to 74 Years | 53 (98.2%) | 40 (74.1%) |
| 75 Years and over | 88 (100.0%) | 85 (96.6%) |
| Total | 356 (43.3%) | 486 (59.1%) |
Disability Status by Sex by Age in Kerkhoven
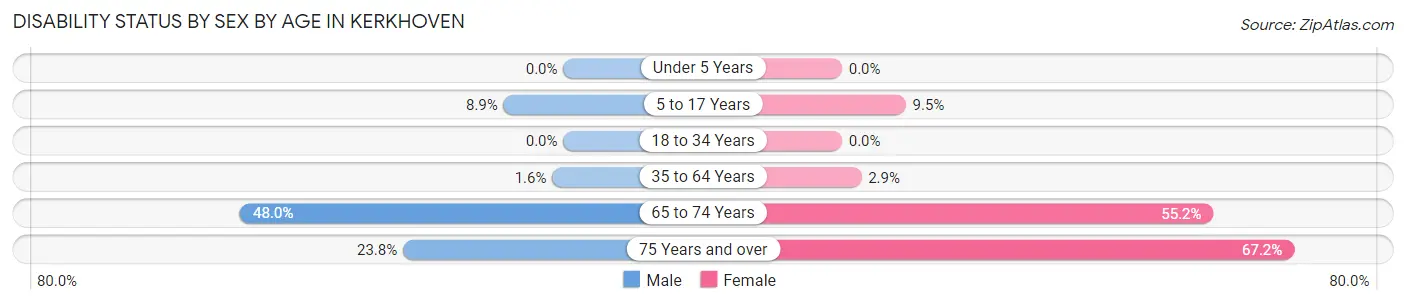
| Age Bracket | Male | Female |
| Under 5 Years | 0 (0.0%) | 0 (0.0%) |
| 5 to 17 Years | 11 (8.9%) | 9 (9.5%) |
| 18 to 34 Years | 0 (0.0%) | 0 (0.0%) |
| 35 to 64 Years | 2 (1.6%) | 4 (2.9%) |
| 65 to 74 Years | 12 (48.0%) | 16 (55.2%) |
| 75 Years and over | 5 (23.8%) | 45 (67.2%) |
Disability Class by Sex by Age in Kerkhoven
Disability Class: Hearing Difficulty
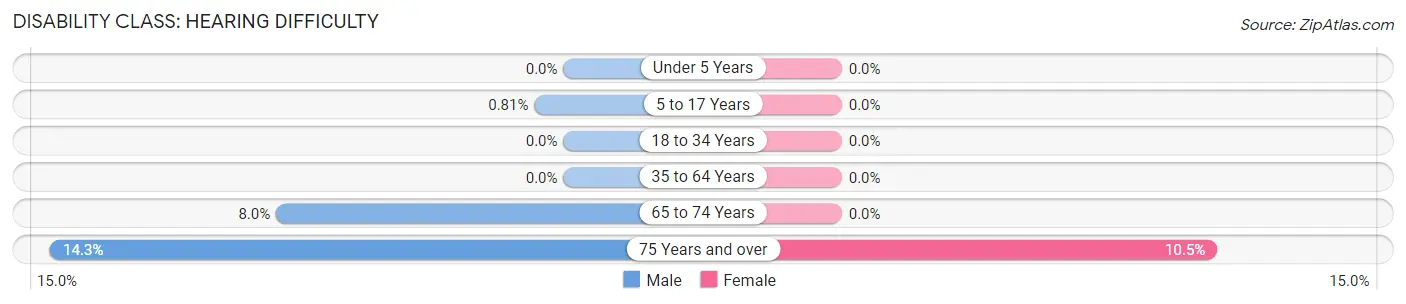
| Age Bracket | Male | Female |
| Under 5 Years | 0 (0.0%) | 0 (0.0%) |
| 5 to 17 Years | 1 (0.8%) | 0 (0.0%) |
| 18 to 34 Years | 0 (0.0%) | 0 (0.0%) |
| 35 to 64 Years | 0 (0.0%) | 0 (0.0%) |
| 65 to 74 Years | 2 (8.0%) | 0 (0.0%) |
| 75 Years and over | 3 (14.3%) | 7 (10.4%) |
Disability Class: Vision Difficulty
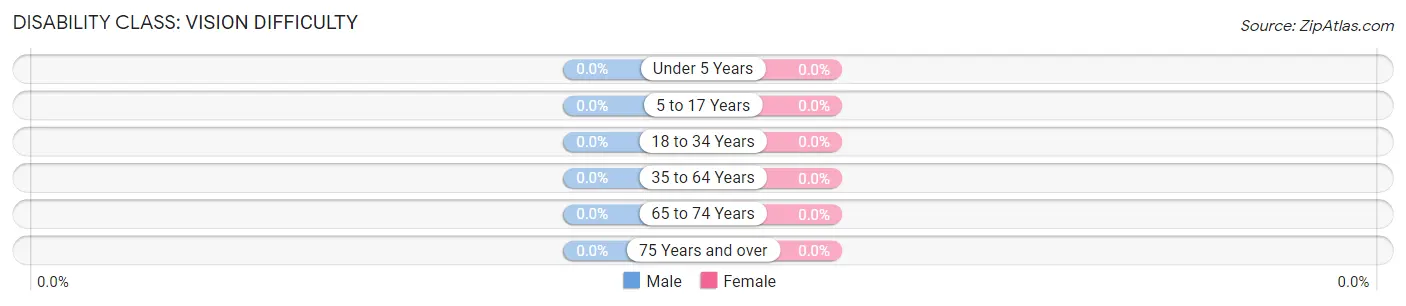
| Age Bracket | Male | Female |
| Under 5 Years | 0 (0.0%) | 0 (0.0%) |
| 5 to 17 Years | 0 (0.0%) | 0 (0.0%) |
| 18 to 34 Years | 0 (0.0%) | 0 (0.0%) |
| 35 to 64 Years | 0 (0.0%) | 0 (0.0%) |
| 65 to 74 Years | 0 (0.0%) | 0 (0.0%) |
| 75 Years and over | 0 (0.0%) | 0 (0.0%) |
Disability Class: Cognitive Difficulty
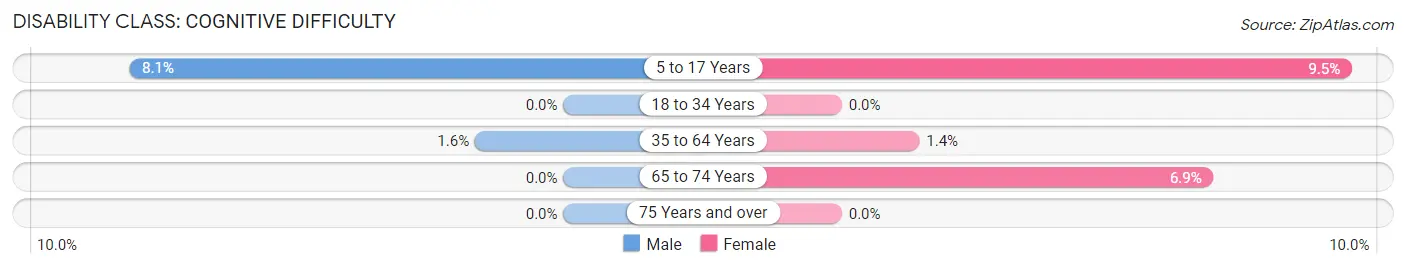
| Age Bracket | Male | Female |
| 5 to 17 Years | 10 (8.1%) | 9 (9.5%) |
| 18 to 34 Years | 0 (0.0%) | 0 (0.0%) |
| 35 to 64 Years | 2 (1.6%) | 2 (1.4%) |
| 65 to 74 Years | 0 (0.0%) | 2 (6.9%) |
| 75 Years and over | 0 (0.0%) | 0 (0.0%) |
Disability Class: Ambulatory Difficulty
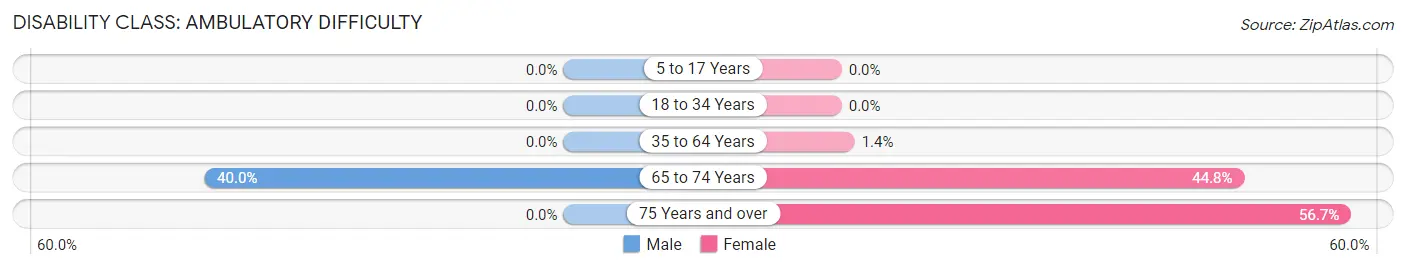
| Age Bracket | Male | Female |
| 5 to 17 Years | 0 (0.0%) | 0 (0.0%) |
| 18 to 34 Years | 0 (0.0%) | 0 (0.0%) |
| 35 to 64 Years | 0 (0.0%) | 2 (1.4%) |
| 65 to 74 Years | 10 (40.0%) | 13 (44.8%) |
| 75 Years and over | 0 (0.0%) | 38 (56.7%) |
Disability Class: Self-Care Difficulty
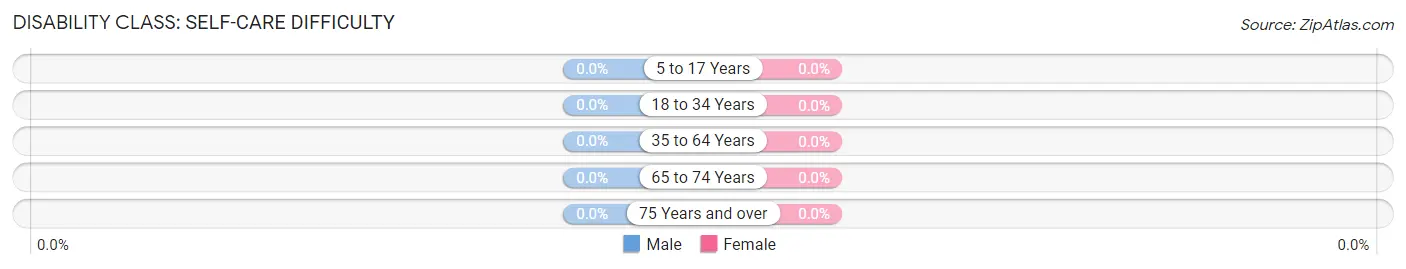
| Age Bracket | Male | Female |
| 5 to 17 Years | 0 (0.0%) | 0 (0.0%) |
| 18 to 34 Years | 0 (0.0%) | 0 (0.0%) |
| 35 to 64 Years | 0 (0.0%) | 0 (0.0%) |
| 65 to 74 Years | 0 (0.0%) | 0 (0.0%) |
| 75 Years and over | 0 (0.0%) | 0 (0.0%) |
Technology Access in Kerkhoven
Computing Device Access in Kerkhoven
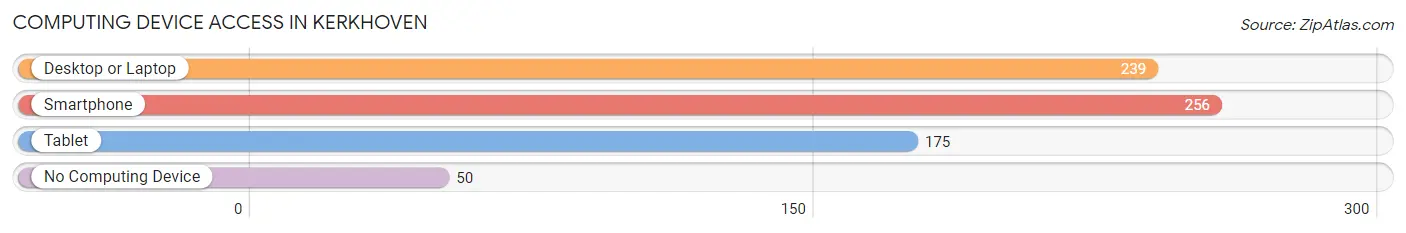
| Device Type | # Households | % Households |
| Desktop or Laptop | 239 | 72.6% |
| Smartphone | 256 | 77.8% |
| Tablet | 175 | 53.2% |
| No Computing Device | 50 | 15.2% |
| Total | 329 | 100.0% |
Internet Access in Kerkhoven
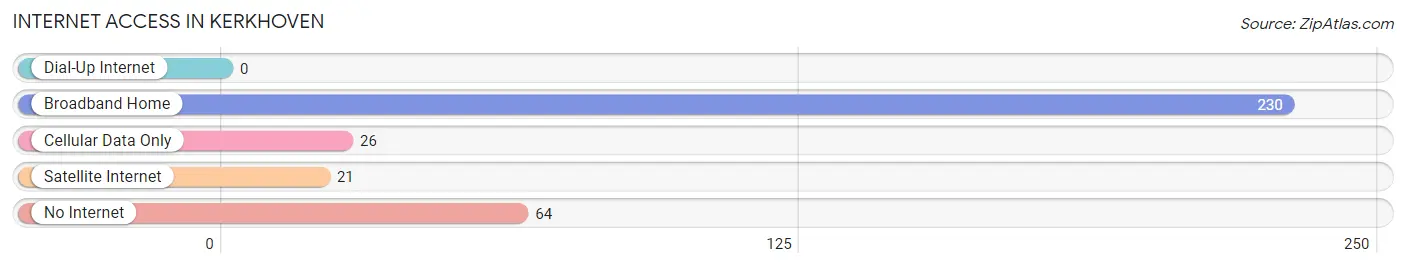
| Internet Type | # Households | % Households |
| Dial-Up Internet | 0 | 0.0% |
| Broadband Home | 230 | 69.9% |
| Cellular Data Only | 26 | 7.9% |
| Satellite Internet | 21 | 6.4% |
| No Internet | 64 | 19.5% |
| Total | 329 | 100.0% |
Kerkhoven Summary
Kerkhoven is a small city located in the western part of Minnesota, United States. It is situated in the county of Swift and is part of the Willmar Micropolitan Statistical Area. The city has a population of 1,541 as of the 2010 census.
History
Kerkhoven was founded in 1881 by a group of Dutch immigrants who had come to the area from the Netherlands. The city was named after the Dutch city of Kerkhoven, which is located in the province of North Brabant. The first settlers in the area were mostly farmers and the city was incorporated in 1887.
The city was initially a farming community, but it soon developed into a small industrial center. The first industry in the city was a flour mill, which was built in 1891. This was followed by a creamery in 1895 and a cheese factory in 1898. The city also had a brickyard, a sawmill, and a furniture factory.
In the early 20th century, Kerkhoven was a thriving community with a population of over 1,000 people. The city had a variety of businesses, including a bank, a hotel, a movie theater, and several churches.
Geography
Kerkhoven is located in the western part of Minnesota, in the county of Swift. It is situated at the intersection of U.S. Route 12 and Minnesota State Highway 23. The city is located about 50 miles west of Minneapolis and about 25 miles east of Willmar.
The city has a total area of 1.2 square miles, all of which is land. The terrain is mostly flat, with some rolling hills in the area. The city is located in the Central Plains region of Minnesota, which is characterized by flat, open land.
Economy
Kerkhoven’s economy is largely based on agriculture and manufacturing. The city is home to several large agricultural businesses, including a dairy farm, a feed mill, and a seed company. The city also has several manufacturing businesses, including a furniture factory, a plastics factory, and a metal fabrication plant.
The city also has a variety of retail businesses, including several restaurants, a grocery store, and a hardware store. The city also has a bank, a post office, and a library.
Demographics
As of the 2010 census, Kerkhoven had a population of 1,541. The racial makeup of the city was 97.2% White, 0.3% African American, 0.2% Native American, 0.3% Asian, 0.1% Pacific Islander, 0.7% from other races, and 1.2% from two or more races. Hispanic or Latino of any race were 1.7% of the population.
The median income for a household in the city was $41,250, and the median income for a family was $50,000. The per capita income for the city was $19,945. About 8.2% of families and 10.2% of the population were below the poverty line, including 13.2% of those under age 18 and 8.3% of those age 65 or over.
Common Questions
What is Per Capita Income in Kerkhoven?
Per Capita income in Kerkhoven is $27,869.
What is the Median Family Income in Kerkhoven?
Median Family Income in Kerkhoven is $80,625.
What is the Median Household income in Kerkhoven?
Median Household Income in Kerkhoven is $60,729.
What is Income or Wage Gap in Kerkhoven?
Income or Wage Gap in Kerkhoven is 36.7%.
Women in Kerkhoven earn 63.3 cents for every dollar earned by a man.
What is Family Income Deficit in Kerkhoven?
Family Income Deficit in Kerkhoven is $14,776.
Families that are below poverty line in Kerkhoven earn $14,776 less on average than the poverty threshold level.
What is Inequality or Gini Index in Kerkhoven?
Inequality or Gini Index in Kerkhoven is 0.42.
What is the Total Population of Kerkhoven?
Total Population of Kerkhoven is 837.
What is the Total Male Population of Kerkhoven?
Total Male Population of Kerkhoven is 377.
What is the Total Female Population of Kerkhoven?
Total Female Population of Kerkhoven is 460.
What is the Ratio of Males per 100 Females in Kerkhoven?
There are 81.96 Males per 100 Females in Kerkhoven.
What is the Ratio of Females per 100 Males in Kerkhoven?
There are 122.02 Females per 100 Males in Kerkhoven.
What is the Median Population Age in Kerkhoven?
Median Population Age in Kerkhoven is 34.9 Years.
What is the Average Family Size in Kerkhoven
Average Family Size in Kerkhoven is 3.3 People.
What is the Average Household Size in Kerkhoven
Average Household Size in Kerkhoven is 2.5 People.
How Large is the Labor Force in Kerkhoven?
There are 371 People in the Labor Forcein in Kerkhoven.
What is the Percentage of People in the Labor Force in Kerkhoven?
65.1% of People are in the Labor Force in Kerkhoven.
What is the Unemployment Rate in Kerkhoven?
Unemployment Rate in Kerkhoven is 3.3%.