Kenyon, MN Map & Demographics
Kenyon Map
Kenyon Overview
$30,841
PER CAPITA INCOME
$80,268
AVG FAMILY INCOME
$72,734
AVG HOUSEHOLD INCOME
39.6%
WAGE / INCOME GAP [ % ]
60.4¢/ $1
WAGE / INCOME GAP [ $ ]
0.34
INEQUALITY / GINI INDEX
1,820
TOTAL POPULATION
877
MALE POPULATION
943
FEMALE POPULATION
93.00
MALES / 100 FEMALES
107.53
FEMALES / 100 MALES
41.1
MEDIAN AGE
3.0
AVG FAMILY SIZE
2.3
AVG HOUSEHOLD SIZE
906
LABOR FORCE [ PEOPLE ]
62.6%
PERCENT IN LABOR FORCE
2.5%
UNEMPLOYMENT RATE
Kenyon Zip Codes
Kenyon Area Codes
Income in Kenyon
Income Overview in Kenyon
Per Capita Income in Kenyon is $30,841, while median incomes of families and households are $80,268 and $72,734 respectively.
| Characteristic | Number | Measure |
| Per Capita Income | 1,820 | $30,841 |
| Median Family Income | 447 | $80,268 |
| Mean Family Income | 447 | $81,647 |
| Median Household Income | 745 | $72,734 |
| Mean Household Income | 745 | $71,680 |
| Income Deficit | 447 | $0 |
| Wage / Income Gap (%) | 1,820 | 39.61% |
| Wage / Income Gap ($) | 1,820 | 60.39¢ per $1 |
| Gini / Inequality Index | 1,820 | 0.34 |
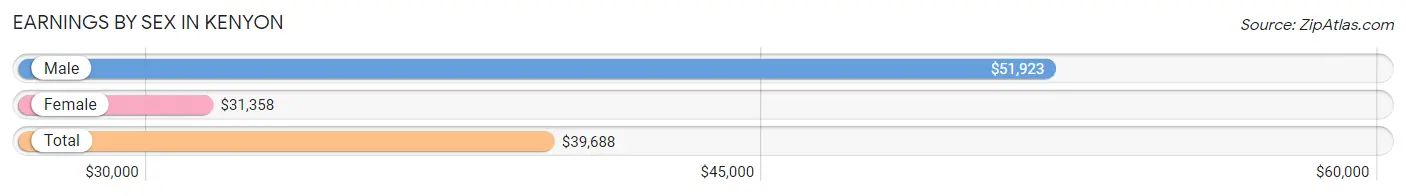
Earnings by Sex in Kenyon
Average Earnings in Kenyon are $39,688, $51,923 for men and $31,358 for women, a difference of 39.6%.
| Sex | Number | Average Earnings |
| Male | 472 (49.7%) | $51,923 |
| Female | 477 (50.3%) | $31,358 |
| Total | 949 (100.0%) | $39,688 |
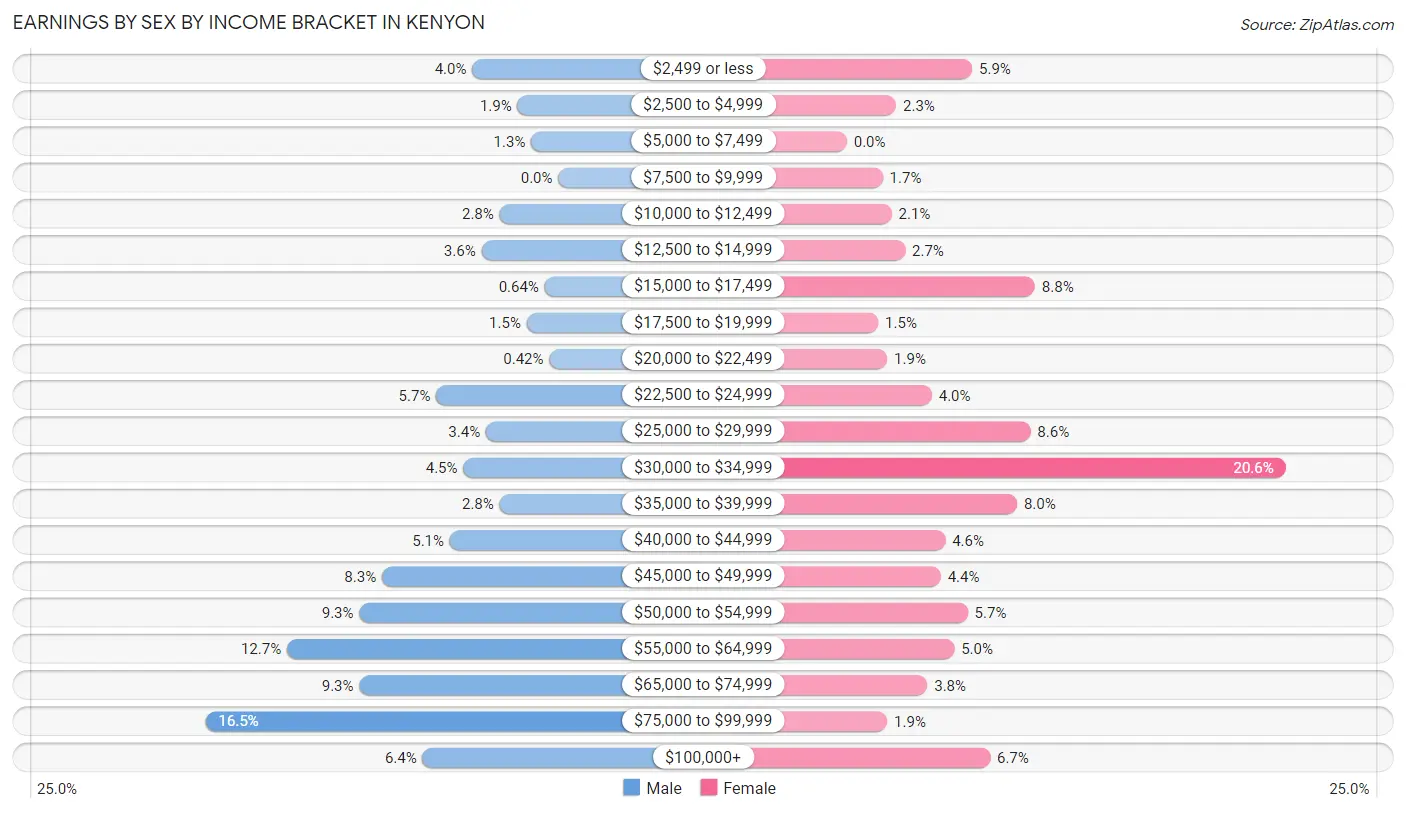
Earnings by Sex by Income Bracket in Kenyon
The most common earnings brackets in Kenyon are $75,000 to $99,999 for men (78 | 16.5%) and $30,000 to $34,999 for women (98 | 20.5%).
| Income | Male | Female |
| $2,499 or less | 19 (4.0%) | 28 (5.9%) |
| $2,500 to $4,999 | 9 (1.9%) | 11 (2.3%) |
| $5,000 to $7,499 | 6 (1.3%) | 0 (0.0%) |
| $7,500 to $9,999 | 0 (0.0%) | 8 (1.7%) |
| $10,000 to $12,499 | 13 (2.8%) | 10 (2.1%) |
| $12,500 to $14,999 | 17 (3.6%) | 13 (2.7%) |
| $15,000 to $17,499 | 3 (0.6%) | 42 (8.8%) |
| $17,500 to $19,999 | 7 (1.5%) | 7 (1.5%) |
| $20,000 to $22,499 | 2 (0.4%) | 9 (1.9%) |
| $22,500 to $24,999 | 27 (5.7%) | 19 (4.0%) |
| $25,000 to $29,999 | 16 (3.4%) | 41 (8.6%) |
| $30,000 to $34,999 | 21 (4.4%) | 98 (20.5%) |
| $35,000 to $39,999 | 13 (2.8%) | 38 (8.0%) |
| $40,000 to $44,999 | 24 (5.1%) | 22 (4.6%) |
| $45,000 to $49,999 | 39 (8.3%) | 21 (4.4%) |
| $50,000 to $54,999 | 44 (9.3%) | 27 (5.7%) |
| $55,000 to $64,999 | 60 (12.7%) | 24 (5.0%) |
| $65,000 to $74,999 | 44 (9.3%) | 18 (3.8%) |
| $75,000 to $99,999 | 78 (16.5%) | 9 (1.9%) |
| $100,000+ | 30 (6.4%) | 32 (6.7%) |
| Total | 472 (100.0%) | 477 (100.0%) |
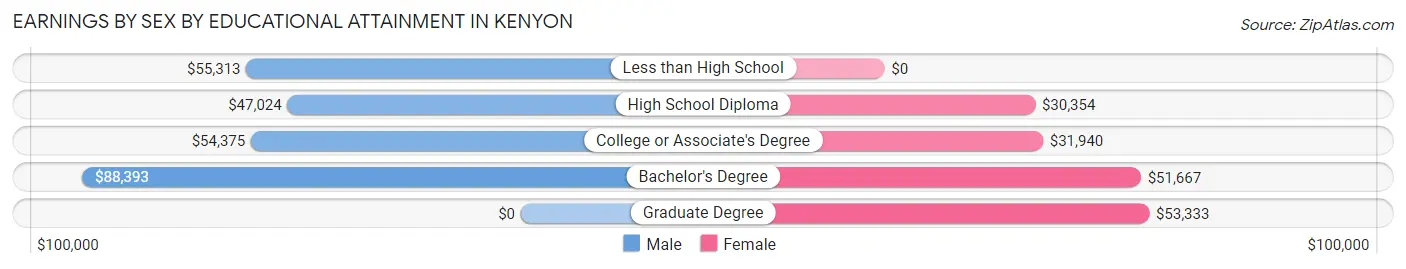
Earnings by Sex by Educational Attainment in Kenyon
Average earnings in Kenyon are $53,333 for men and $31,657 for women, a difference of 40.6%. Men with an educational attainment of bachelor's degree enjoy the highest average annual earnings of $88,393, while those with high school diploma education earn the least with $47,024. Women with an educational attainment of graduate degree earn the most with the average annual earnings of $53,333, while those with high school diploma education have the smallest earnings of $30,354.
| Educational Attainment | Male Income | Female Income |
| Less than High School | $55,313 | $0 |
| High School Diploma | $47,024 | $30,354 |
| College or Associate's Degree | $54,375 | $31,940 |
| Bachelor's Degree | $88,393 | $51,667 |
| Graduate Degree | - | - |
| Total | $53,333 | $31,657 |
Family Income in Kenyon
Family Income Brackets in Kenyon
According to the Kenyon family income data, there are 109 families falling into the $100,000 to $149,999 income range, which is the most common income bracket and makes up 24.4% of all families. Conversely, the $200,000+ income bracket is the least frequent group with only 2 families (0.4%) belonging to this category.
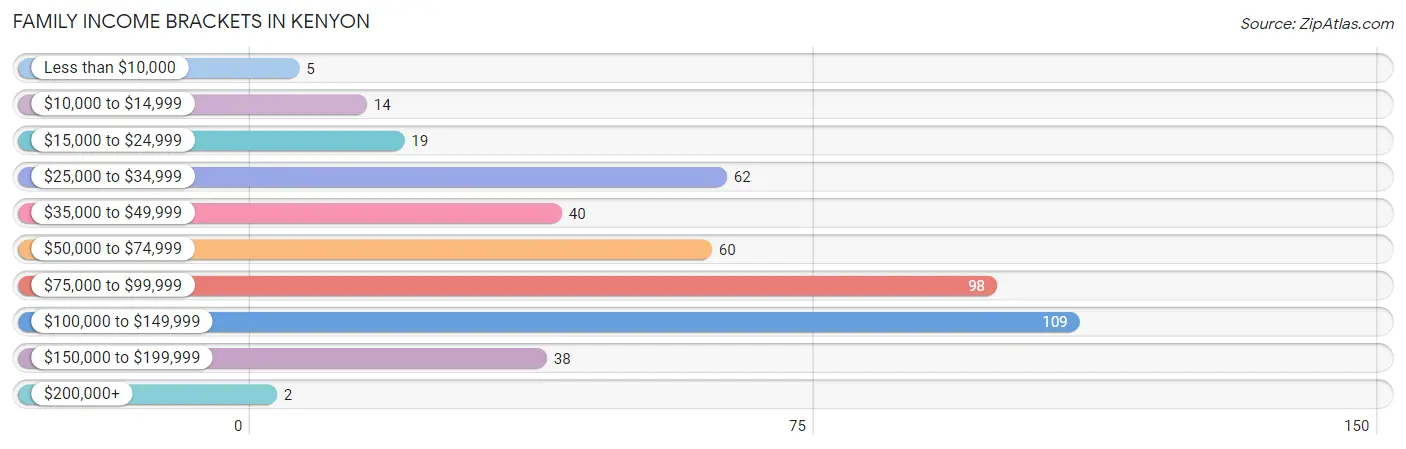
| Income Bracket | # Families | % Families |
| Less than $10,000 | 5 | 1.1% |
| $10,000 to $14,999 | 14 | 3.1% |
| $15,000 to $24,999 | 19 | 4.3% |
| $25,000 to $34,999 | 62 | 13.9% |
| $35,000 to $49,999 | 40 | 8.9% |
| $50,000 to $74,999 | 60 | 13.4% |
| $75,000 to $99,999 | 98 | 21.9% |
| $100,000 to $149,999 | 109 | 24.4% |
| $150,000 to $199,999 | 38 | 8.5% |
| $200,000+ | 2 | 0.4% |
Family Income by Famaliy Size in Kenyon
4-person families (82 | 18.3%) account for the highest median family income in Kenyon with $103,929 per family, while 2-person families (214 | 47.9%) have the highest median income of $40,250 per family member.
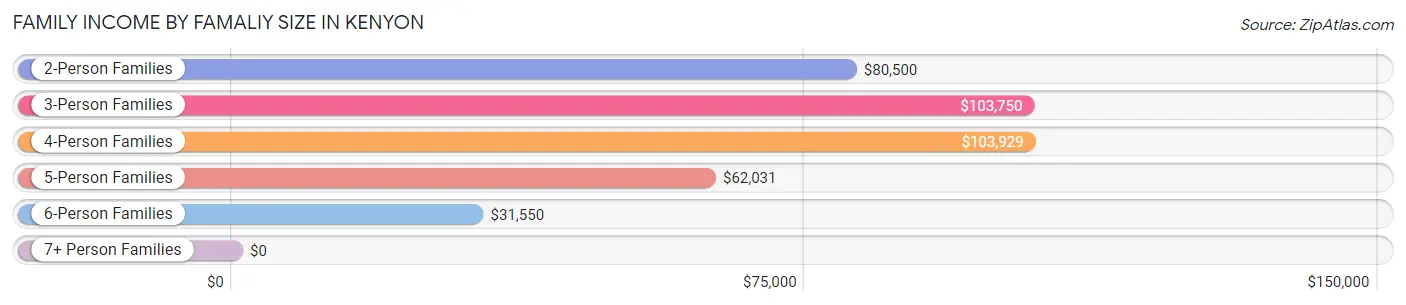
| Income Bracket | # Families | Median Income |
| 2-Person Families | 214 (47.9%) | $80,500 |
| 3-Person Families | 70 (15.7%) | $103,750 |
| 4-Person Families | 82 (18.3%) | $103,929 |
| 5-Person Families | 19 (4.3%) | $62,031 |
| 6-Person Families | 62 (13.9%) | $31,550 |
| 7+ Person Families | 0 (0.0%) | $0 |
| Total | 447 (100.0%) | $80,268 |
Family Income by Number of Earners in Kenyon
The median family income in Kenyon is $80,268, with families comprising 3+ earners (26) having the highest median family income of $118,750, while families with no earners (58) have the lowest median family income of $43,750, accounting for 5.8% and 13.0% of families, respectively.
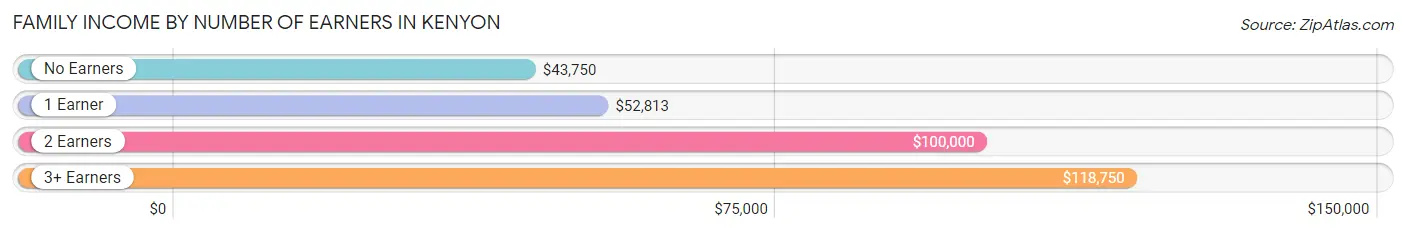
| Number of Earners | # Families | Median Income |
| No Earners | 58 (13.0%) | $43,750 |
| 1 Earner | 175 (39.2%) | $52,813 |
| 2 Earners | 188 (42.1%) | $100,000 |
| 3+ Earners | 26 (5.8%) | $118,750 |
| Total | 447 (100.0%) | $80,268 |
Household Income in Kenyon
Household Income Brackets in Kenyon
With 177 households falling in the category, the $75,000 to $99,999 income range is the most frequent in Kenyon, accounting for 23.8% of all households. In contrast, only 2 households (0.3%) fall into the $200,000+ income bracket, making it the least populous group.
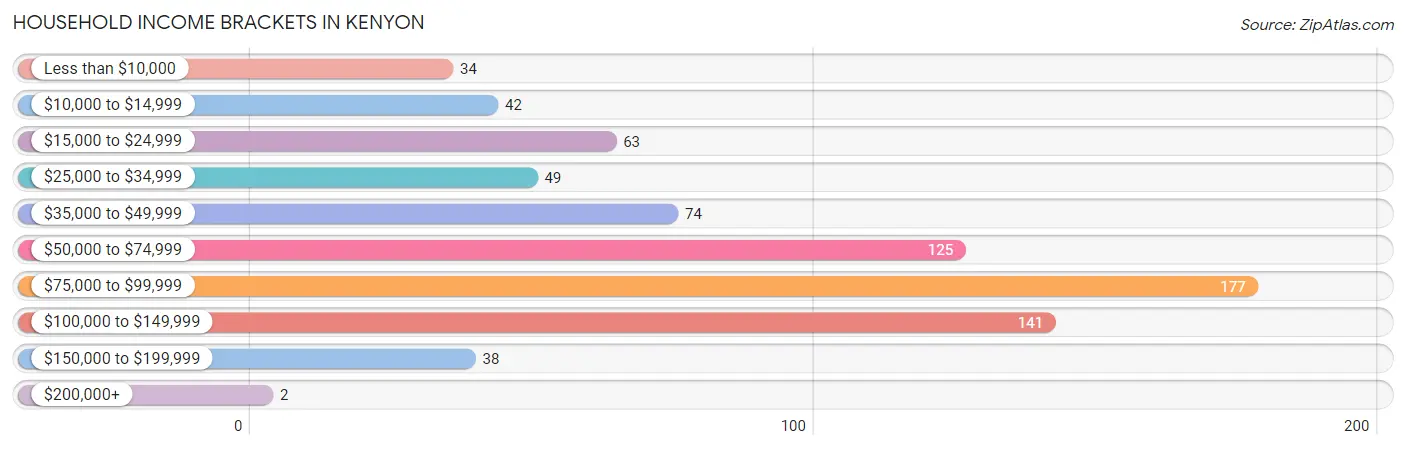
| Income Bracket | # Households | % Households |
| Less than $10,000 | 34 | 4.6% |
| $10,000 to $14,999 | 42 | 5.6% |
| $15,000 to $24,999 | 63 | 8.5% |
| $25,000 to $34,999 | 49 | 6.6% |
| $35,000 to $49,999 | 74 | 9.9% |
| $50,000 to $74,999 | 125 | 16.8% |
| $75,000 to $99,999 | 177 | 23.8% |
| $100,000 to $149,999 | 141 | 18.9% |
| $150,000 to $199,999 | 38 | 5.1% |
| $200,000+ | 2 | 0.3% |
Household Income by Householder Age in Kenyon
The median household income in Kenyon is $72,734, with the highest median household income of $84,068 found in the 25 to 44 years age bracket for the primary householder. A total of 235 households (31.5%) fall into this category. Meanwhile, the 65+ years age bracket for the primary householder has the lowest median household income of $44,167, with 218 households (29.3%) in this group.
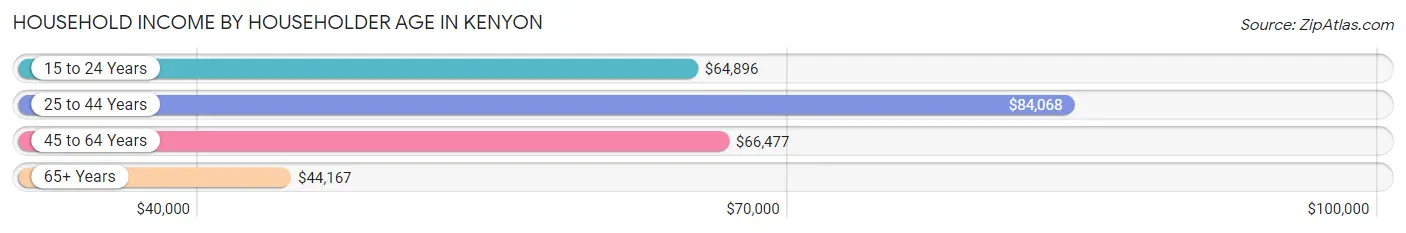
| Income Bracket | # Households | Median Income |
| 15 to 24 Years | 53 (7.1%) | $64,896 |
| 25 to 44 Years | 235 (31.5%) | $84,068 |
| 45 to 64 Years | 239 (32.1%) | $66,477 |
| 65+ Years | 218 (29.3%) | $44,167 |
| Total | 745 (100.0%) | $72,734 |
Poverty in Kenyon
Income Below Poverty by Sex and Age in Kenyon
With 13.9% poverty level for males and 20.4% for females among the residents of Kenyon, 12 to 14 year old males and 25 to 34 year old females are the most vulnerable to poverty, with 37 males (58.7%) and 57 females (43.9%) in their respective age groups living below the poverty level.
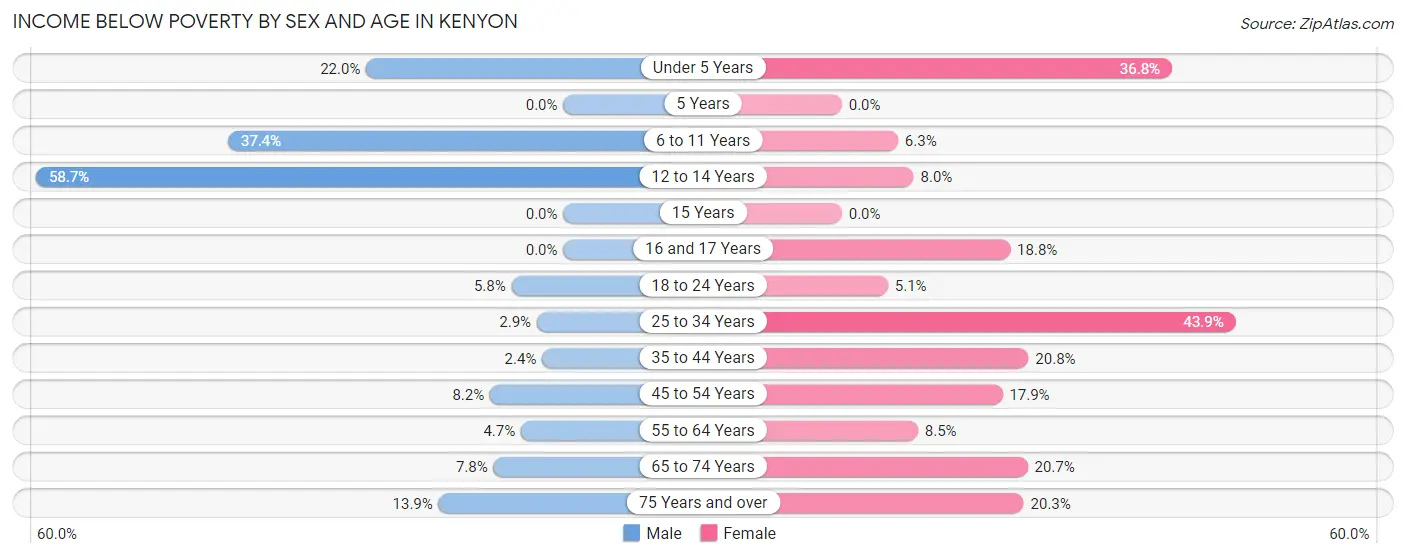
| Age Bracket | Male | Female |
| Under 5 Years | 9 (22.0%) | 25 (36.8%) |
| 5 Years | 0 (0.0%) | 0 (0.0%) |
| 6 to 11 Years | 34 (37.4%) | 3 (6.2%) |
| 12 to 14 Years | 37 (58.7%) | 2 (8.0%) |
| 15 Years | 0 (0.0%) | 0 (0.0%) |
| 16 and 17 Years | 0 (0.0%) | 3 (18.8%) |
| 18 to 24 Years | 3 (5.8%) | 4 (5.1%) |
| 25 to 34 Years | 4 (2.9%) | 57 (43.9%) |
| 35 to 44 Years | 2 (2.4%) | 16 (20.8%) |
| 45 to 54 Years | 8 (8.2%) | 22 (17.9%) |
| 55 to 64 Years | 4 (4.7%) | 10 (8.5%) |
| 65 to 74 Years | 8 (7.8%) | 18 (20.7%) |
| 75 Years and over | 10 (13.9%) | 16 (20.3%) |
| Total | 119 (13.9%) | 176 (20.4%) |
Income Above Poverty by Sex and Age in Kenyon
According to the poverty statistics in Kenyon, males aged 5 years and females aged 5 years are the age groups that are most secure financially, with 100.0% of males and 100.0% of females in these age groups living above the poverty line.
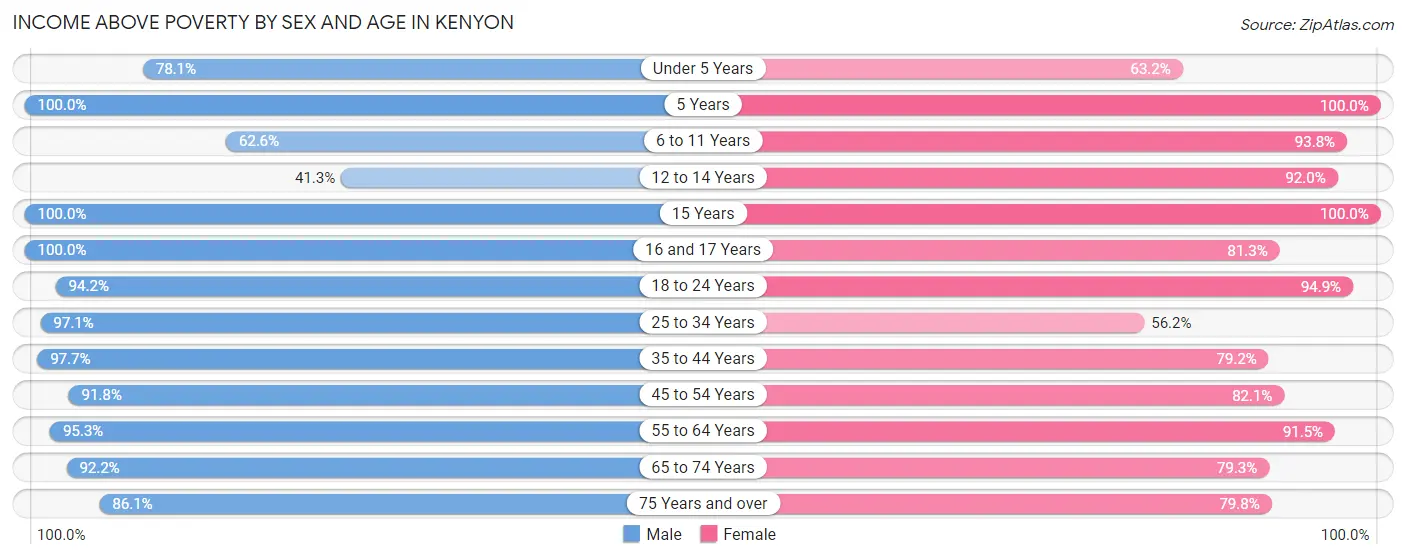
| Age Bracket | Male | Female |
| Under 5 Years | 32 (78.0%) | 43 (63.2%) |
| 5 Years | 12 (100.0%) | 3 (100.0%) |
| 6 to 11 Years | 57 (62.6%) | 45 (93.8%) |
| 12 to 14 Years | 26 (41.3%) | 23 (92.0%) |
| 15 Years | 8 (100.0%) | 11 (100.0%) |
| 16 and 17 Years | 13 (100.0%) | 13 (81.2%) |
| 18 to 24 Years | 49 (94.2%) | 74 (94.9%) |
| 25 to 34 Years | 132 (97.1%) | 73 (56.1%) |
| 35 to 44 Years | 83 (97.7%) | 61 (79.2%) |
| 45 to 54 Years | 90 (91.8%) | 101 (82.1%) |
| 55 to 64 Years | 81 (95.3%) | 108 (91.5%) |
| 65 to 74 Years | 95 (92.2%) | 69 (79.3%) |
| 75 Years and over | 62 (86.1%) | 63 (79.7%) |
| Total | 740 (86.2%) | 687 (79.6%) |
Income Below Poverty Among Married-Couple Families in Kenyon
The poverty statistics for married-couple families in Kenyon show that 4.3% or 13 of the total 305 families live below the poverty line. Families with no children have the highest poverty rate of 5.2%, comprising of 10 families. On the other hand, families with 3 or 4 children have the lowest poverty rate of 0.0%, which includes 0 families.
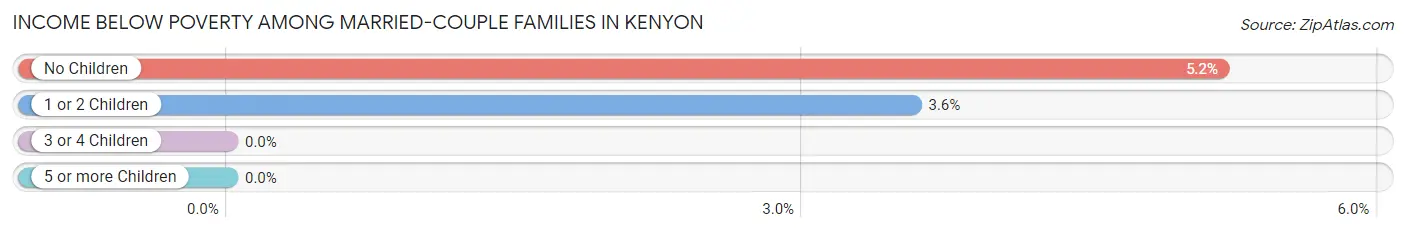
| Children | Above Poverty | Below Poverty |
| No Children | 183 (94.8%) | 10 (5.2%) |
| 1 or 2 Children | 81 (96.4%) | 3 (3.6%) |
| 3 or 4 Children | 28 (100.0%) | 0 (0.0%) |
| 5 or more Children | 0 (0.0%) | 0 (0.0%) |
| Total | 292 (95.7%) | 13 (4.3%) |
Income Below Poverty Among Single-Parent Households in Kenyon
According to the poverty data in Kenyon, 5.1% or 2 single-father households and 68.9% or 71 single-mother households are living below the poverty line. Among single-father households, those with 1 or 2 children have the highest poverty rate, with 2 households (10.5%) experiencing poverty. Likewise, among single-mother households, those with 5 or more children have the highest poverty rate, with 50 households (100.0%) falling below the poverty line.
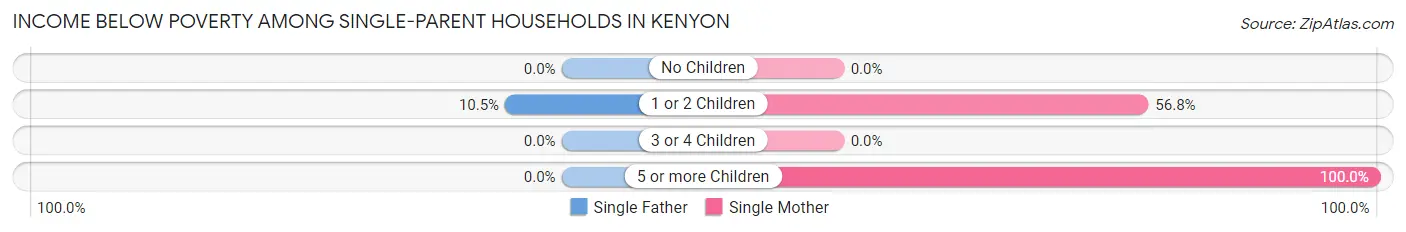
| Children | Single Father | Single Mother |
| No Children | 0 (0.0%) | 0 (0.0%) |
| 1 or 2 Children | 2 (10.5%) | 21 (56.8%) |
| 3 or 4 Children | 0 (0.0%) | 0 (0.0%) |
| 5 or more Children | 0 (0.0%) | 50 (100.0%) |
| Total | 2 (5.1%) | 71 (68.9%) |
Income Below Poverty Among Married-Couple vs Single-Parent Households in Kenyon
The poverty data for Kenyon shows that 13 of the married-couple family households (4.3%) and 73 of the single-parent households (51.4%) are living below the poverty level. Within the married-couple family households, those with no children have the highest poverty rate, with 10 households (5.2%) falling below the poverty line. Among the single-parent households, those with 5 or more children have the highest poverty rate, with 50 household (100.0%) living below poverty.
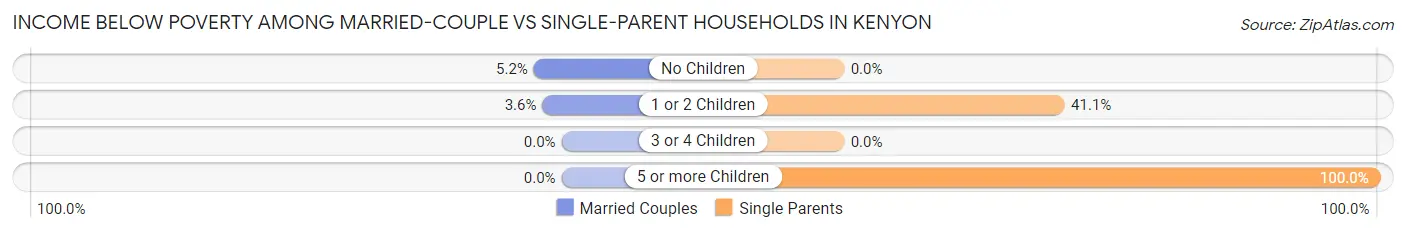
| Children | Married-Couple Families | Single-Parent Households |
| No Children | 10 (5.2%) | 0 (0.0%) |
| 1 or 2 Children | 3 (3.6%) | 23 (41.1%) |
| 3 or 4 Children | 0 (0.0%) | 0 (0.0%) |
| 5 or more Children | 0 (0.0%) | 50 (100.0%) |
| Total | 13 (4.3%) | 73 (51.4%) |
Race in Kenyon
The most populous races in Kenyon are White / Caucasian (1,548 | 85.1%), Hispanic or Latino (223 | 12.2%), and Two or more Races (179 | 9.8%).
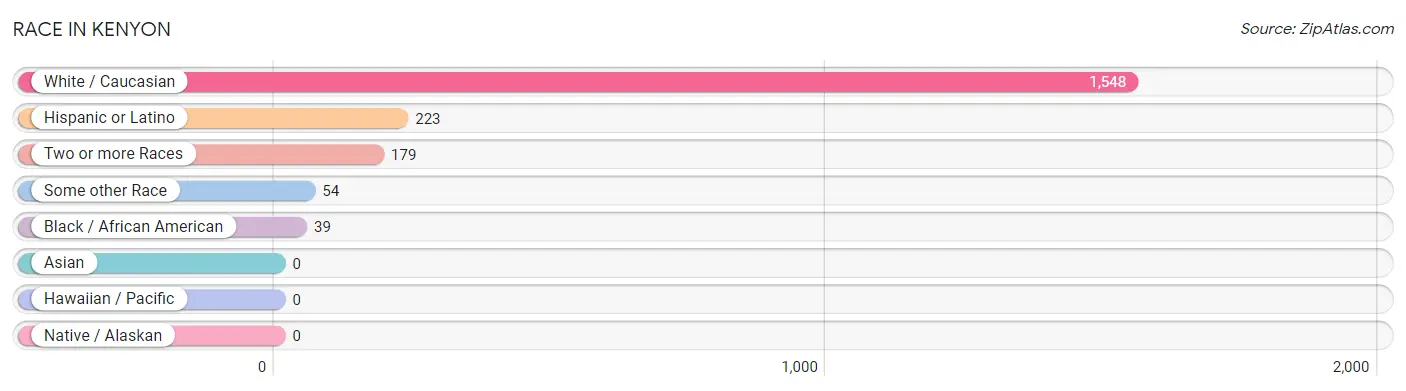
| Race | # Population | % Population |
| Asian | 0 | 0.0% |
| Black / African American | 39 | 2.1% |
| Hawaiian / Pacific | 0 | 0.0% |
| Hispanic or Latino | 223 | 12.2% |
| Native / Alaskan | 0 | 0.0% |
| White / Caucasian | 1,548 | 85.1% |
| Two or more Races | 179 | 9.8% |
| Some other Race | 54 | 3.0% |
| Total | 1,820 | 100.0% |
Ancestry in Kenyon
The most populous ancestries reported in Kenyon are German (481 | 26.4%), Norwegian (441 | 24.2%), Mexican (210 | 11.5%), Irish (102 | 5.6%), and Swedish (84 | 4.6%), together accounting for 72.4% of all Kenyon residents.
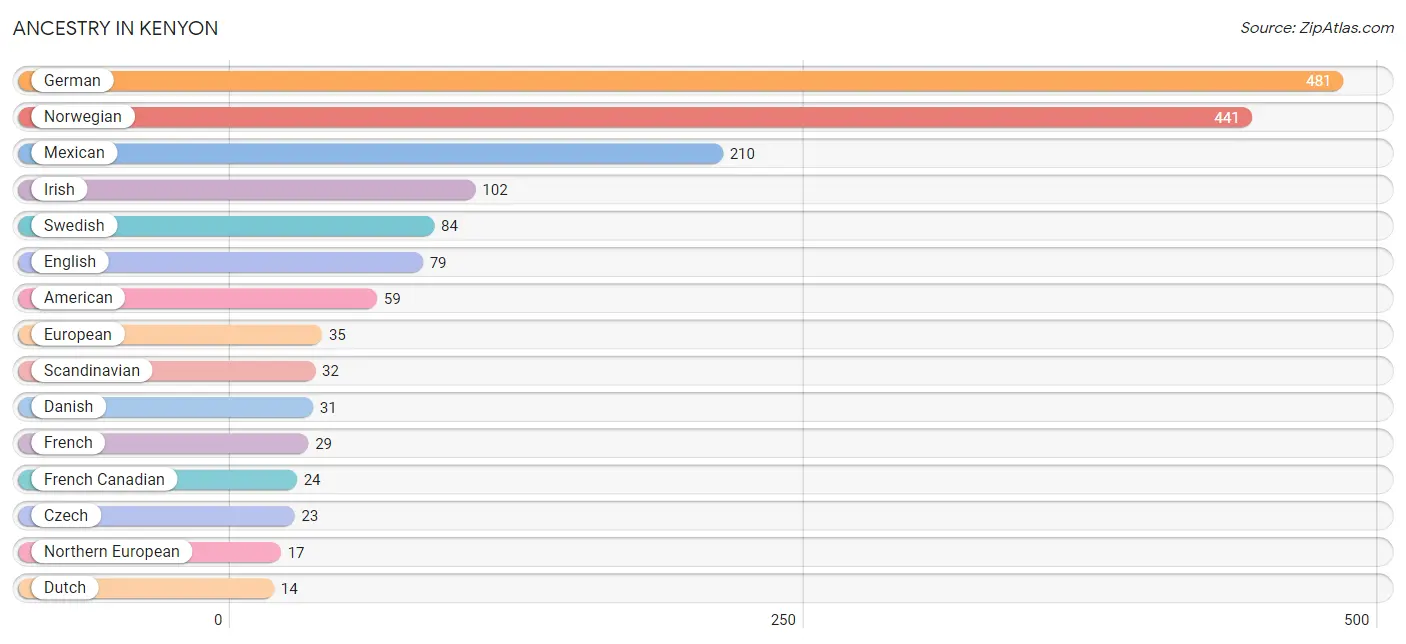
| Ancestry | # Population | % Population |
| American | 59 | 3.2% |
| Belizean | 1 | 0.1% |
| Bhutanese | 1 | 0.1% |
| Chippewa | 6 | 0.3% |
| Czech | 23 | 1.3% |
| Danish | 31 | 1.7% |
| Dutch | 14 | 0.8% |
| Eastern European | 8 | 0.4% |
| English | 79 | 4.3% |
| European | 35 | 1.9% |
| Finnish | 8 | 0.4% |
| French | 29 | 1.6% |
| French Canadian | 24 | 1.3% |
| German | 481 | 26.4% |
| Irish | 102 | 5.6% |
| Italian | 14 | 0.8% |
| Mexican | 210 | 11.5% |
| Northern European | 17 | 0.9% |
| Norwegian | 441 | 24.2% |
| Polish | 9 | 0.5% |
| Scandinavian | 32 | 1.8% |
| Scotch-Irish | 5 | 0.3% |
| Scottish | 4 | 0.2% |
| Swedish | 84 | 4.6% |
| Swiss | 8 | 0.4% |
| Ukrainian | 3 | 0.2% |
| Welsh | 3 | 0.2% |
| Yugoslavian | 2 | 0.1% | View All 28 Rows |
Immigrants in Kenyon
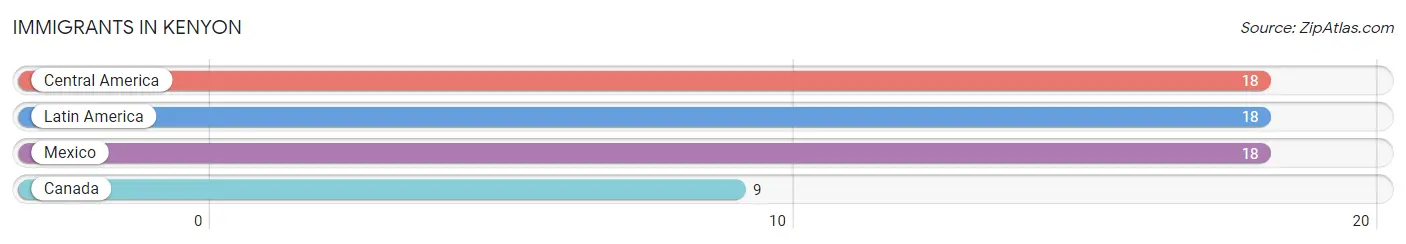
The most numerous immigrant groups reported in Kenyon came from Central America (18 | 1.0%), Latin America (18 | 1.0%), Mexico (18 | 1.0%), and Canada (9 | 0.5%), together accounting for 3.5% of all Kenyon residents.
| Immigration Origin | # Population | % Population |
| Canada | 9 | 0.5% |
| Central America | 18 | 1.0% |
| Latin America | 18 | 1.0% |
| Mexico | 18 | 1.0% | View All 4 Rows |
Sex and Age in Kenyon
Sex and Age in Kenyon
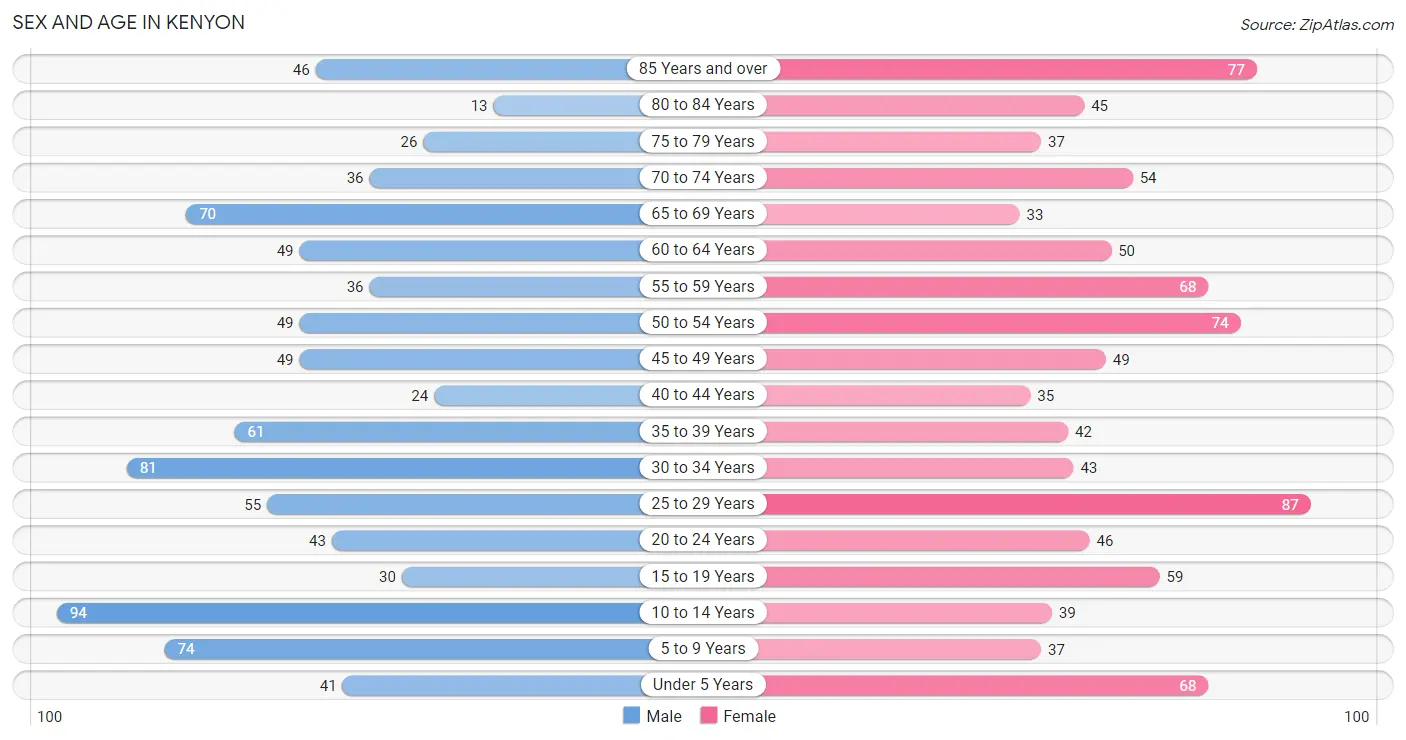
The most populous age groups in Kenyon are 10 to 14 Years (94 | 10.7%) for men and 25 to 29 Years (87 | 9.2%) for women.
| Age Bracket | Male | Female |
| Under 5 Years | 41 (4.7%) | 68 (7.2%) |
| 5 to 9 Years | 74 (8.4%) | 37 (3.9%) |
| 10 to 14 Years | 94 (10.7%) | 39 (4.1%) |
| 15 to 19 Years | 30 (3.4%) | 59 (6.3%) |
| 20 to 24 Years | 43 (4.9%) | 46 (4.9%) |
| 25 to 29 Years | 55 (6.3%) | 87 (9.2%) |
| 30 to 34 Years | 81 (9.2%) | 43 (4.6%) |
| 35 to 39 Years | 61 (7.0%) | 42 (4.4%) |
| 40 to 44 Years | 24 (2.7%) | 35 (3.7%) |
| 45 to 49 Years | 49 (5.6%) | 49 (5.2%) |
| 50 to 54 Years | 49 (5.6%) | 74 (7.9%) |
| 55 to 59 Years | 36 (4.1%) | 68 (7.2%) |
| 60 to 64 Years | 49 (5.6%) | 50 (5.3%) |
| 65 to 69 Years | 70 (8.0%) | 33 (3.5%) |
| 70 to 74 Years | 36 (4.1%) | 54 (5.7%) |
| 75 to 79 Years | 26 (3.0%) | 37 (3.9%) |
| 80 to 84 Years | 13 (1.5%) | 45 (4.8%) |
| 85 Years and over | 46 (5.2%) | 77 (8.2%) |
| Total | 877 (100.0%) | 943 (100.0%) |
Families and Households in Kenyon
Median Family Size in Kenyon
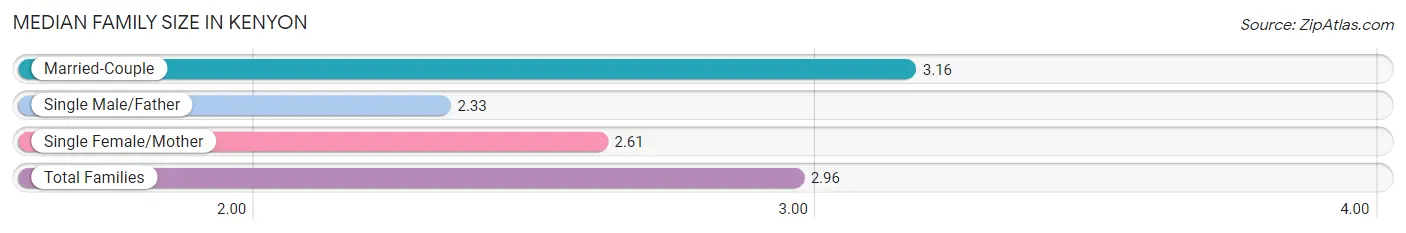
The median family size in Kenyon is 2.96 persons per family, with married-couple families (305 | 68.2%) accounting for the largest median family size of 3.16 persons per family. On the other hand, single male/father families (39 | 8.7%) represent the smallest median family size with 2.33 persons per family.
| Family Type | # Families | Family Size |
| Married-Couple | 305 (68.2%) | 3.16 |
| Single Male/Father | 39 (8.7%) | 2.33 |
| Single Female/Mother | 103 (23.0%) | 2.61 |
| Total Families | 447 (100.0%) | 2.96 |
Median Household Size in Kenyon
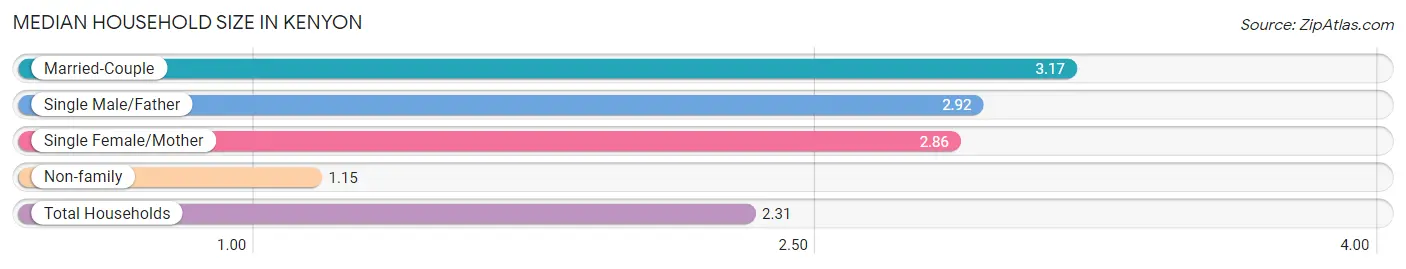
The median household size in Kenyon is 2.31 persons per household, with married-couple households (305 | 40.9%) accounting for the largest median household size of 3.17 persons per household. non-family households (298 | 40.0%) represent the smallest median household size with 1.15 persons per household.
| Household Type | # Households | Household Size |
| Married-Couple | 305 (40.9%) | 3.17 |
| Single Male/Father | 39 (5.2%) | 2.92 |
| Single Female/Mother | 103 (13.8%) | 2.86 |
| Non-family | 298 (40.0%) | 1.15 |
| Total Households | 745 (100.0%) | 2.31 |
Household Size by Marriage Status in Kenyon
Out of a total of 745 households in Kenyon, 447 (60.0%) are family households, while 298 (40.0%) are nonfamily households. The most numerous type of family households are 2-person households, comprising 189, and the most common type of nonfamily households are 1-person households, comprising 261.
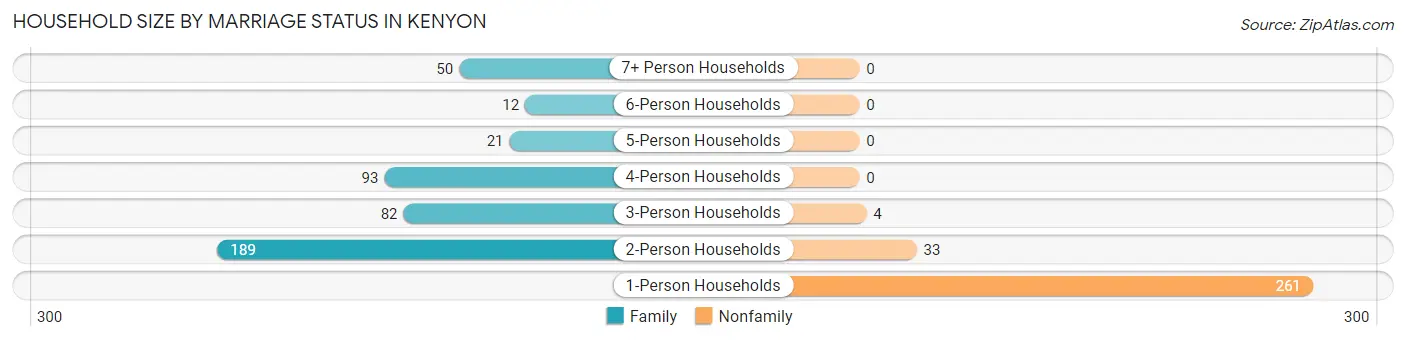
| Household Size | Family Households | Nonfamily Households |
| 1-Person Households | - | 261 (35.0%) |
| 2-Person Households | 189 (25.4%) | 33 (4.4%) |
| 3-Person Households | 82 (11.0%) | 4 (0.5%) |
| 4-Person Households | 93 (12.5%) | 0 (0.0%) |
| 5-Person Households | 21 (2.8%) | 0 (0.0%) |
| 6-Person Households | 12 (1.6%) | 0 (0.0%) |
| 7+ Person Households | 50 (6.7%) | 0 (0.0%) |
| Total | 447 (60.0%) | 298 (40.0%) |
Female Fertility in Kenyon
Fertility by Age in Kenyon
Average fertility rate in Kenyon is 221.0 births per 1,000 women. Women in the age bracket of 20 to 34 years have the highest fertility rate with 443.0 births per 1,000 women. Women in the age bracket of 20 to 34 years acount for 96.3% of all women with births.
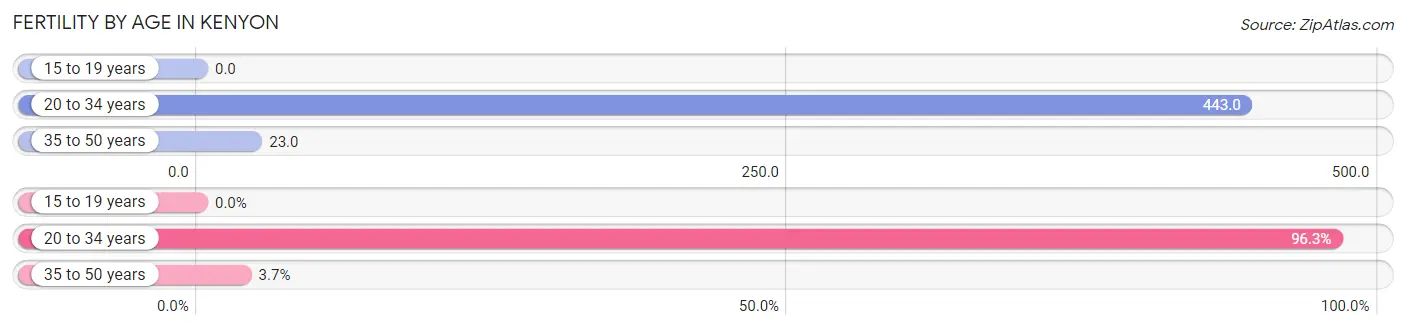
| Age Bracket | Women with Births | Births / 1,000 Women |
| 15 to 19 years | 0 (0.0%) | 0.0 |
| 20 to 34 years | 78 (96.3%) | 443.0 |
| 35 to 50 years | 3 (3.7%) | 23.0 |
| Total | 81 (100.0%) | 221.0 |
Fertility by Age by Marriage Status in Kenyon
34.6% of women with births (81) in Kenyon are married. The highest percentage of unmarried women with births falls into 20 to 34 years age bracket with 67.9% of them unmarried at the time of birth, while the lowest percentage of unmarried women with births belong to 35 to 50 years age bracket with 0.0% of them unmarried.
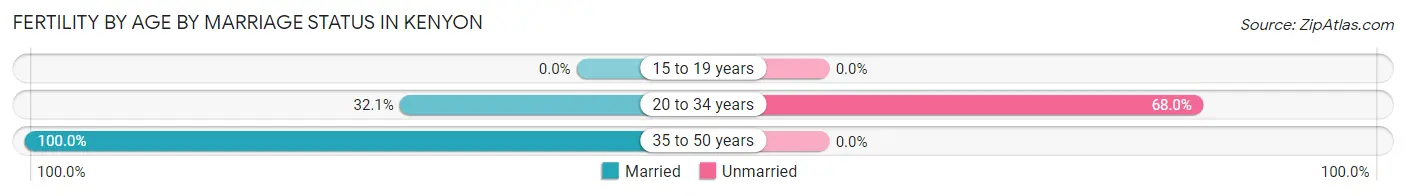
| Age Bracket | Married | Unmarried |
| 15 to 19 years | 0 (0.0%) | 0 (0.0%) |
| 20 to 34 years | 25 (32.1%) | 53 (67.9%) |
| 35 to 50 years | 3 (100.0%) | 0 (0.0%) |
| Total | 28 (34.6%) | 53 (65.4%) |
Fertility by Education in Kenyon
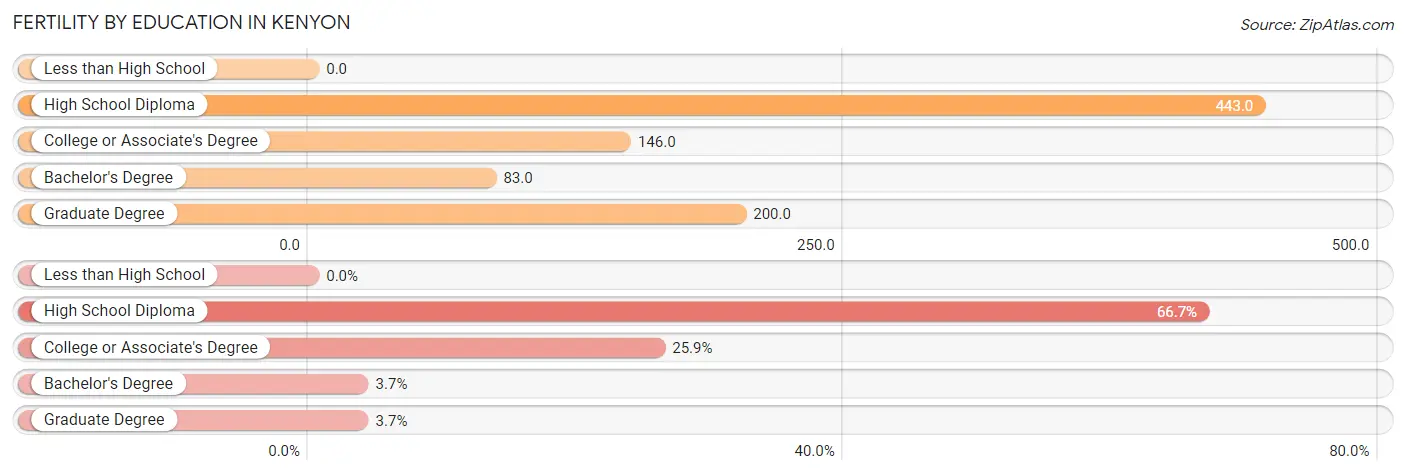
| Educational Attainment | Women with Births | Births / 1,000 Women |
| Less than High School | 0 (0.0%) | 0.0 |
| High School Diploma | 54 (66.7%) | 443.0 |
| College or Associate's Degree | 21 (25.9%) | 146.0 |
| Bachelor's Degree | 3 (3.7%) | 83.0 |
| Graduate Degree | 3 (3.7%) | 200.0 |
| Total | 81 (100.0%) | 221.0 |
Fertility by Education by Marriage Status in Kenyon
65.4% of women with births in Kenyon are unmarried. Women with the educational attainment of bachelor's degree are most likely to be married with 100.0% of them married at childbirth, while women with the educational attainment of high school diploma are least likely to be married with 92.6% of them unmarried at childbirth.
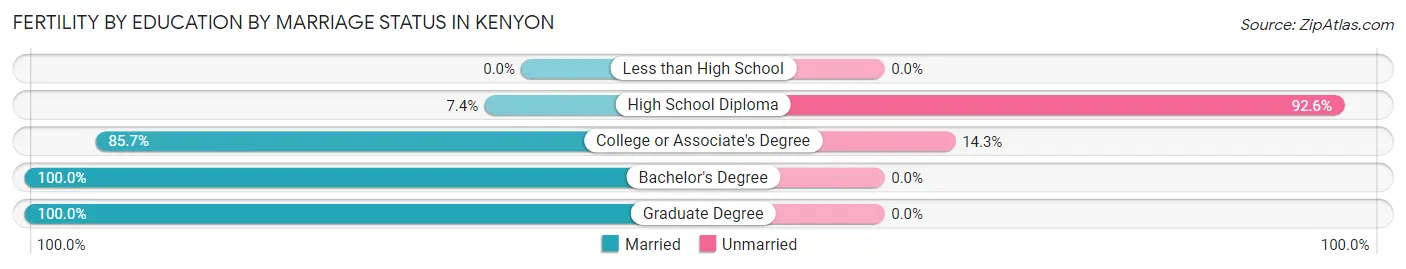
| Educational Attainment | Married | Unmarried |
| Less than High School | 0 (0.0%) | 0 (0.0%) |
| High School Diploma | 4 (7.4%) | 50 (92.6%) |
| College or Associate's Degree | 18 (85.7%) | 3 (14.3%) |
| Bachelor's Degree | 3 (100.0%) | 0 (0.0%) |
| Graduate Degree | 3 (100.0%) | 0 (0.0%) |
| Total | 28 (34.6%) | 53 (65.4%) |
Employment Characteristics in Kenyon
Employment by Class of Employer in Kenyon
Among the 878 employed individuals in Kenyon, private company employees (626 | 71.3%), not-for-profit organizations (96 | 10.9%), and local government employees (63 | 7.2%) make up the most common classes of employment.
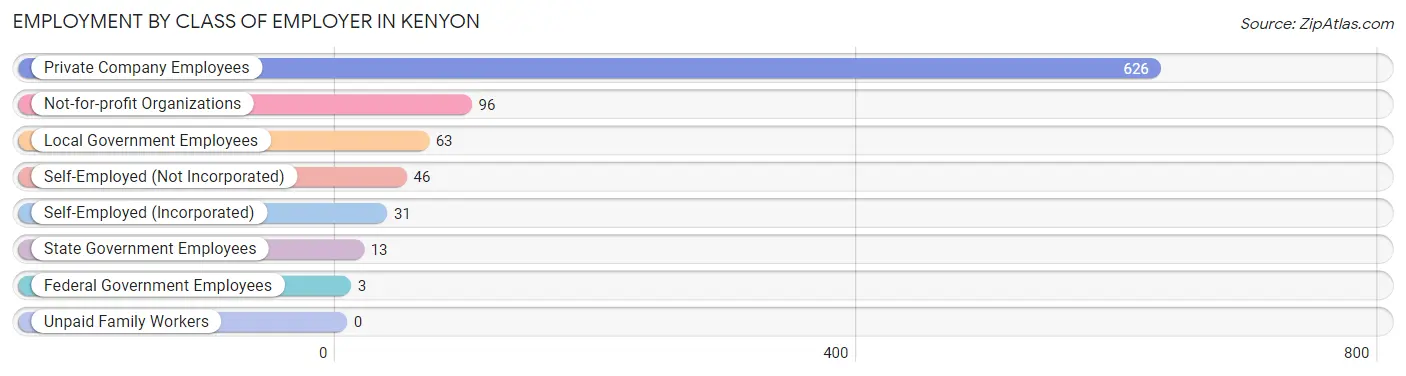
| Employer Class | # Employees | % Employees |
| Private Company Employees | 626 | 71.3% |
| Self-Employed (Incorporated) | 31 | 3.5% |
| Self-Employed (Not Incorporated) | 46 | 5.2% |
| Not-for-profit Organizations | 96 | 10.9% |
| Local Government Employees | 63 | 7.2% |
| State Government Employees | 13 | 1.5% |
| Federal Government Employees | 3 | 0.3% |
| Unpaid Family Workers | 0 | 0.0% |
| Total | 878 | 100.0% |
Employment Status by Age in Kenyon
According to the labor force statistics for Kenyon, out of the total population over 16 years of age (1,448), 62.6% or 906 individuals are in the labor force, with 2.5% or 23 of them unemployed. The age group with the highest labor force participation rate is 25 to 29 years, with 97.9% or 139 individuals in the labor force. Within the labor force, the 30 to 34 years age range has the highest percentage of unemployed individuals, with 7.8% or 9 of them being unemployed.
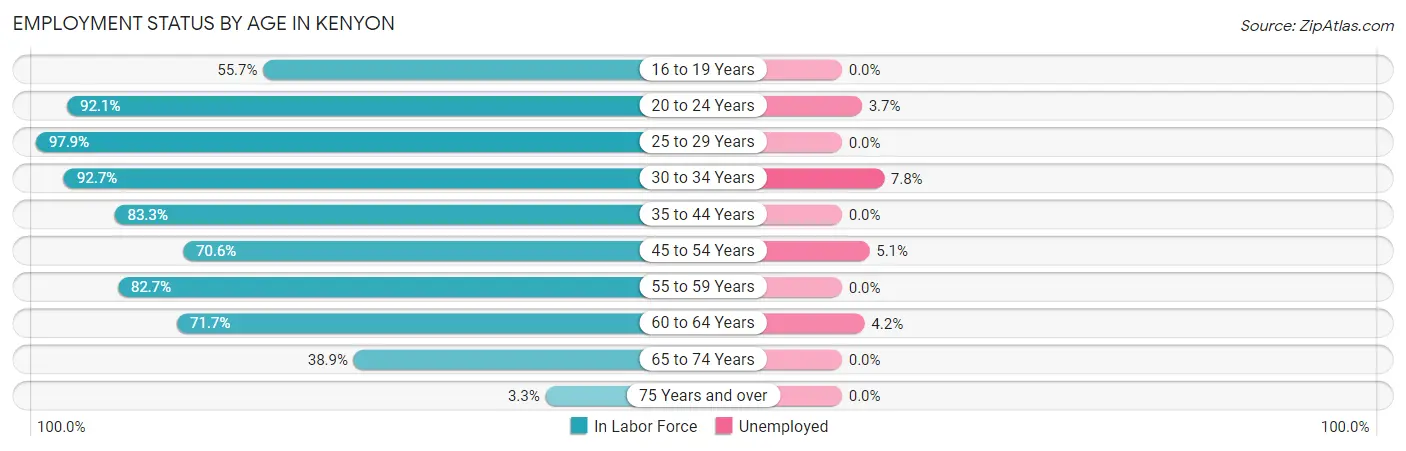
| Age Bracket | In Labor Force | Unemployed |
| 16 to 19 Years | 39 (55.7%) | 0 (0.0%) |
| 20 to 24 Years | 82 (92.1%) | 3 (3.7%) |
| 25 to 29 Years | 139 (97.9%) | 0 (0.0%) |
| 30 to 34 Years | 115 (92.7%) | 9 (7.8%) |
| 35 to 44 Years | 135 (83.3%) | 0 (0.0%) |
| 45 to 54 Years | 156 (70.6%) | 8 (5.1%) |
| 55 to 59 Years | 86 (82.7%) | 0 (0.0%) |
| 60 to 64 Years | 71 (71.7%) | 3 (4.2%) |
| 65 to 74 Years | 75 (38.9%) | 0 (0.0%) |
| 75 Years and over | 8 (3.3%) | 0 (0.0%) |
| Total | 906 (62.6%) | 23 (2.5%) |
Employment Status by Educational Attainment in Kenyon
According to labor force statistics for Kenyon, 82.4% of individuals (702) out of the total population between 25 and 64 years of age (852) are in the labor force, with 2.8% or 20 of them being unemployed. The group with the highest labor force participation rate are those with the educational attainment of bachelor's degree or higher, with 97.0% or 96 individuals in the labor force. Within the labor force, individuals with less than high school education have the highest percentage of unemployment, with 7.0% or 3 of them being unemployed.
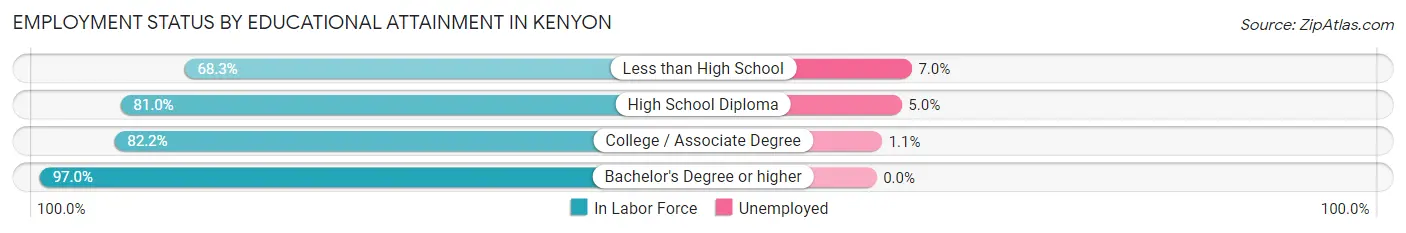
| Educational Attainment | In Labor Force | Unemployed |
| Less than High School | 43 (68.3%) | 4 (7.0%) |
| High School Diploma | 281 (81.0%) | 17 (5.0%) |
| College / Associate Degree | 282 (82.2%) | 4 (1.1%) |
| Bachelor's Degree or higher | 96 (97.0%) | 0 (0.0%) |
| Total | 702 (82.4%) | 24 (2.8%) |
Employment Occupations by Sex in Kenyon
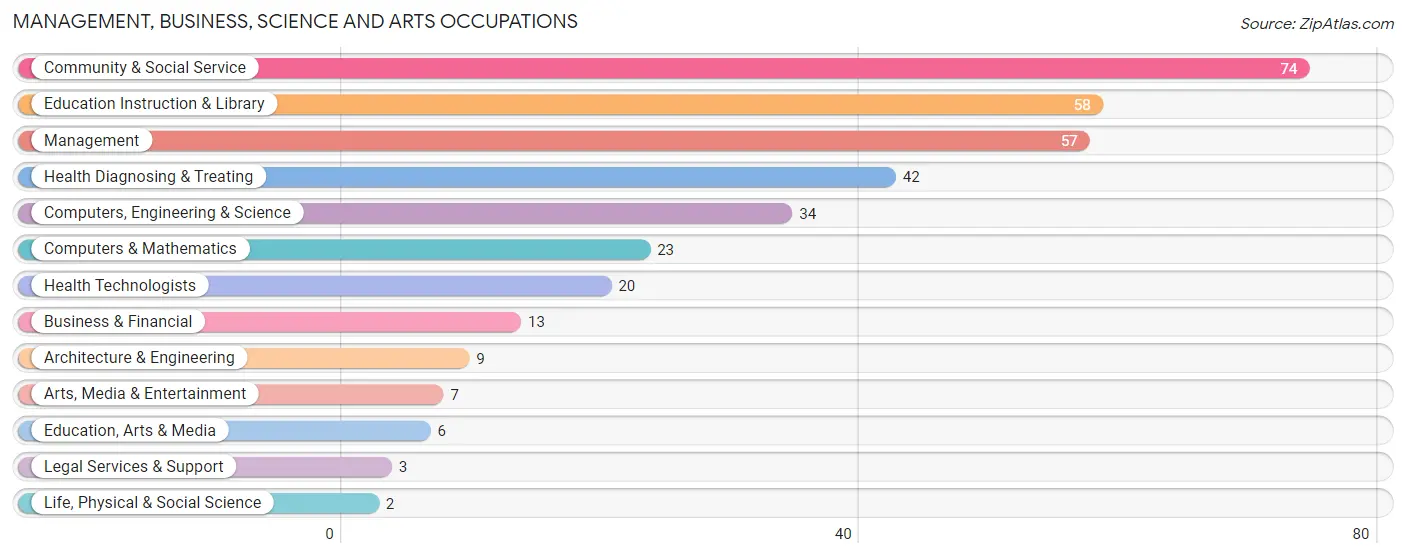
Management, Business, Science and Arts Occupations
The most common Management, Business, Science and Arts occupations in Kenyon are Community & Social Service (74 | 8.4%), Education Instruction & Library (58 | 6.6%), Management (57 | 6.5%), Health Diagnosing & Treating (42 | 4.8%), and Computers, Engineering & Science (34 | 3.8%).
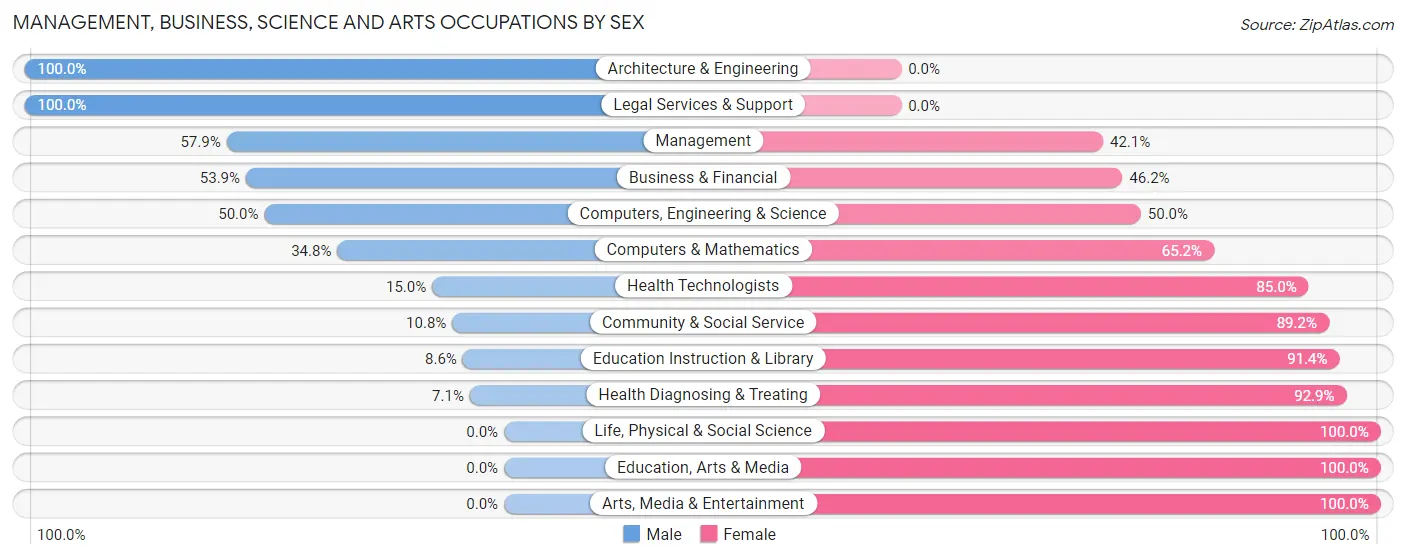
Management, Business, Science and Arts Occupations by Sex
Within the Management, Business, Science and Arts occupations in Kenyon, the most male-oriented occupations are Architecture & Engineering (100.0%), Legal Services & Support (100.0%), and Management (57.9%), while the most female-oriented occupations are Life, Physical & Social Science (100.0%), Education, Arts & Media (100.0%), and Arts, Media & Entertainment (100.0%).
| Occupation | Male | Female |
| Management | 33 (57.9%) | 24 (42.1%) |
| Business & Financial | 7 (53.8%) | 6 (46.2%) |
| Computers, Engineering & Science | 17 (50.0%) | 17 (50.0%) |
| Computers & Mathematics | 8 (34.8%) | 15 (65.2%) |
| Architecture & Engineering | 9 (100.0%) | 0 (0.0%) |
| Life, Physical & Social Science | 0 (0.0%) | 2 (100.0%) |
| Community & Social Service | 8 (10.8%) | 66 (89.2%) |
| Education, Arts & Media | 0 (0.0%) | 6 (100.0%) |
| Legal Services & Support | 3 (100.0%) | 0 (0.0%) |
| Education Instruction & Library | 5 (8.6%) | 53 (91.4%) |
| Arts, Media & Entertainment | 0 (0.0%) | 7 (100.0%) |
| Health Diagnosing & Treating | 3 (7.1%) | 39 (92.9%) |
| Health Technologists | 3 (15.0%) | 17 (85.0%) |
| Total (Category) | 68 (30.9%) | 152 (69.1%) |
| Total (Overall) | 439 (49.7%) | 444 (50.3%) |
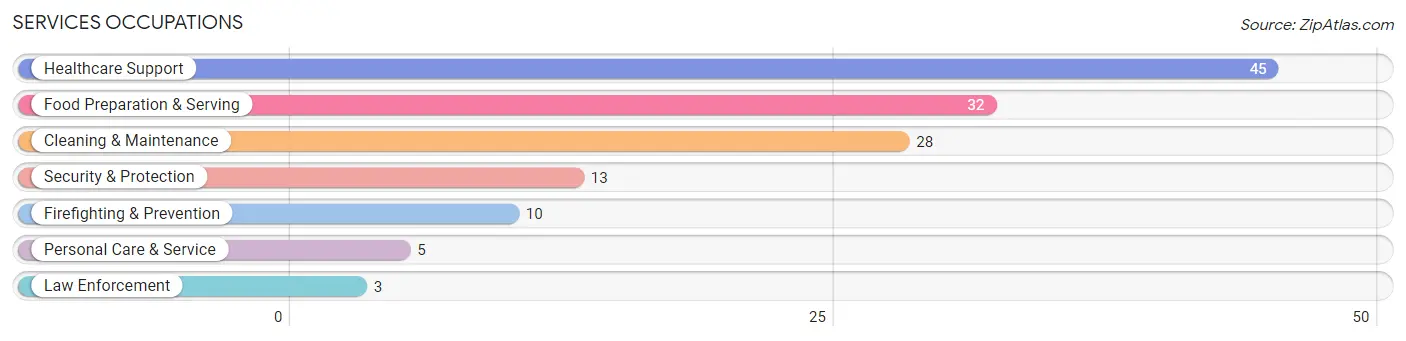
Services Occupations
The most common Services occupations in Kenyon are Healthcare Support (45 | 5.1%), Food Preparation & Serving (32 | 3.6%), Cleaning & Maintenance (28 | 3.2%), Security & Protection (13 | 1.5%), and Firefighting & Prevention (10 | 1.1%).
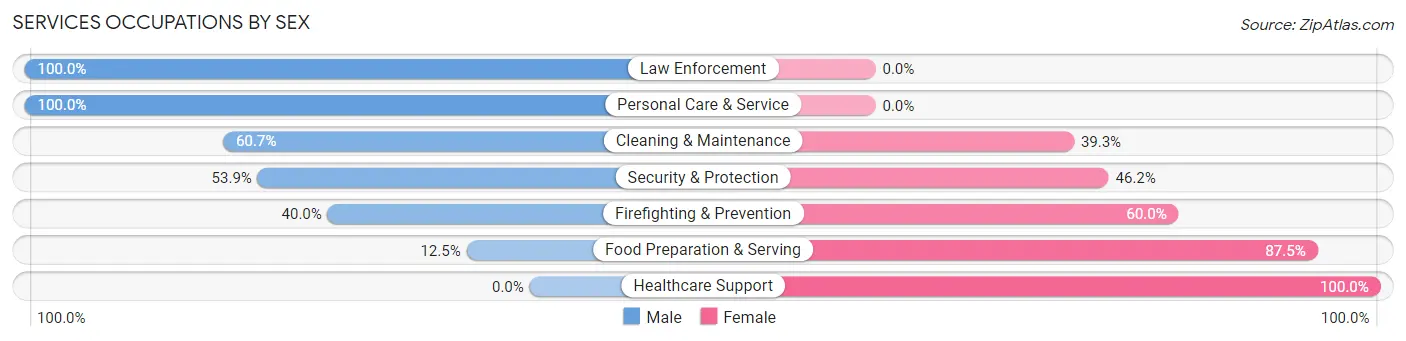
Services Occupations by Sex
Within the Services occupations in Kenyon, the most male-oriented occupations are Law Enforcement (100.0%), Personal Care & Service (100.0%), and Cleaning & Maintenance (60.7%), while the most female-oriented occupations are Healthcare Support (100.0%), Food Preparation & Serving (87.5%), and Firefighting & Prevention (60.0%).
| Occupation | Male | Female |
| Healthcare Support | 0 (0.0%) | 45 (100.0%) |
| Security & Protection | 7 (53.8%) | 6 (46.2%) |
| Firefighting & Prevention | 4 (40.0%) | 6 (60.0%) |
| Law Enforcement | 3 (100.0%) | 0 (0.0%) |
| Food Preparation & Serving | 4 (12.5%) | 28 (87.5%) |
| Cleaning & Maintenance | 17 (60.7%) | 11 (39.3%) |
| Personal Care & Service | 5 (100.0%) | 0 (0.0%) |
| Total (Category) | 33 (26.8%) | 90 (73.2%) |
| Total (Overall) | 439 (49.7%) | 444 (50.3%) |
Sales and Office Occupations
The most common Sales and Office occupations in Kenyon are Office & Administration (84 | 9.5%), and Sales & Related (70 | 7.9%).
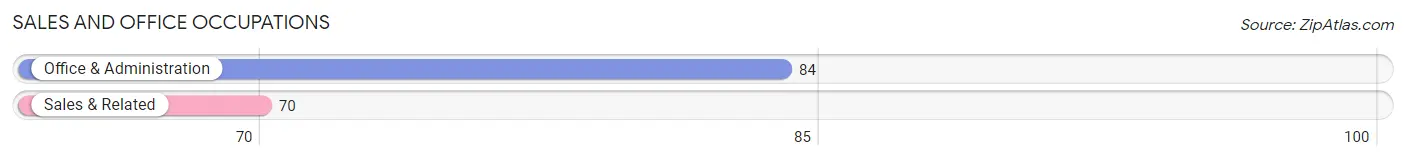
Sales and Office Occupations by Sex
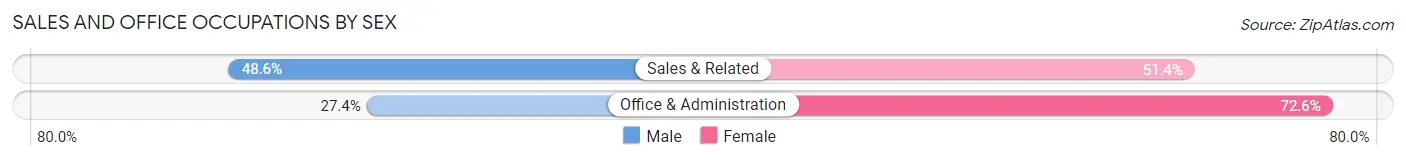
| Occupation | Male | Female |
| Sales & Related | 34 (48.6%) | 36 (51.4%) |
| Office & Administration | 23 (27.4%) | 61 (72.6%) |
| Total (Category) | 57 (37.0%) | 97 (63.0%) |
| Total (Overall) | 439 (49.7%) | 444 (50.3%) |
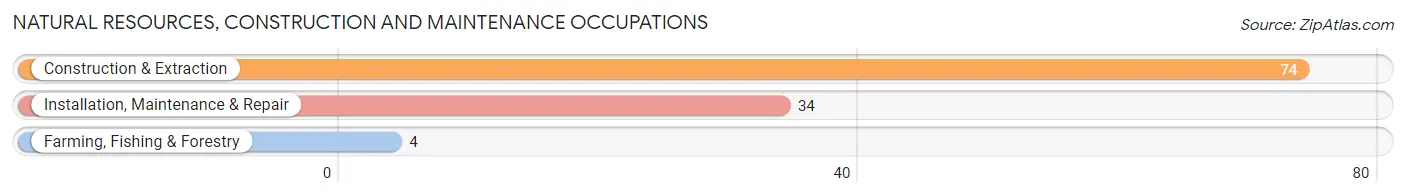
Natural Resources, Construction and Maintenance Occupations
The most common Natural Resources, Construction and Maintenance occupations in Kenyon are Construction & Extraction (74 | 8.4%), Installation, Maintenance & Repair (34 | 3.8%), and Farming, Fishing & Forestry (4 | 0.4%).
Natural Resources, Construction and Maintenance Occupations by Sex
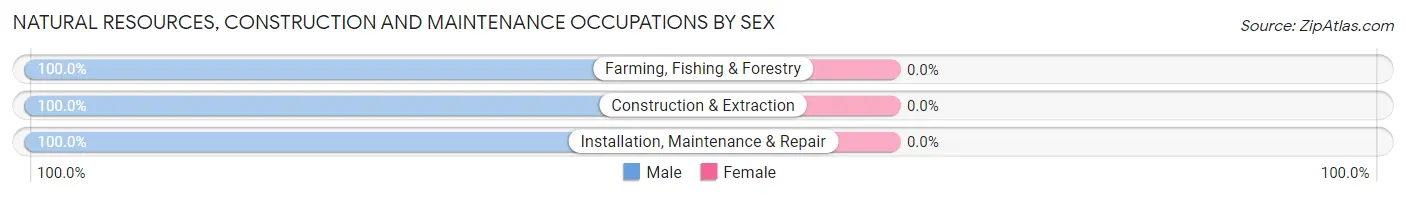
| Occupation | Male | Female |
| Farming, Fishing & Forestry | 4 (100.0%) | 0 (0.0%) |
| Construction & Extraction | 74 (100.0%) | 0 (0.0%) |
| Installation, Maintenance & Repair | 34 (100.0%) | 0 (0.0%) |
| Total (Category) | 112 (100.0%) | 0 (0.0%) |
| Total (Overall) | 439 (49.7%) | 444 (50.3%) |
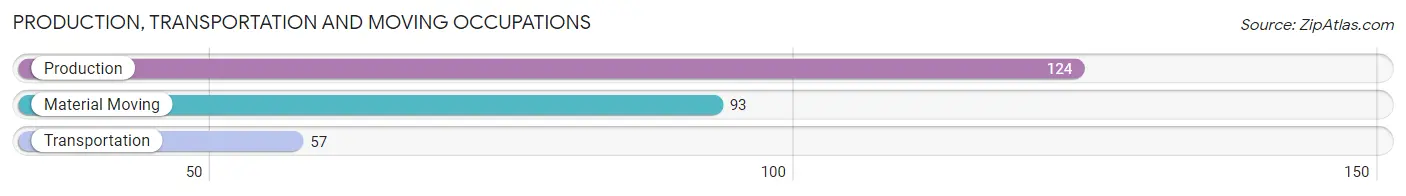
Production, Transportation and Moving Occupations
The most common Production, Transportation and Moving occupations in Kenyon are Production (124 | 14.0%), Material Moving (93 | 10.5%), and Transportation (57 | 6.5%).
Production, Transportation and Moving Occupations by Sex
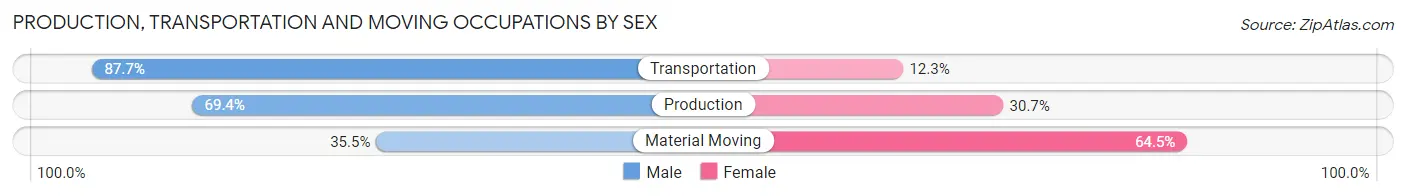
| Occupation | Male | Female |
| Production | 86 (69.4%) | 38 (30.6%) |
| Transportation | 50 (87.7%) | 7 (12.3%) |
| Material Moving | 33 (35.5%) | 60 (64.5%) |
| Total (Category) | 169 (61.7%) | 105 (38.3%) |
| Total (Overall) | 439 (49.7%) | 444 (50.3%) |
Employment Industries by Sex in Kenyon
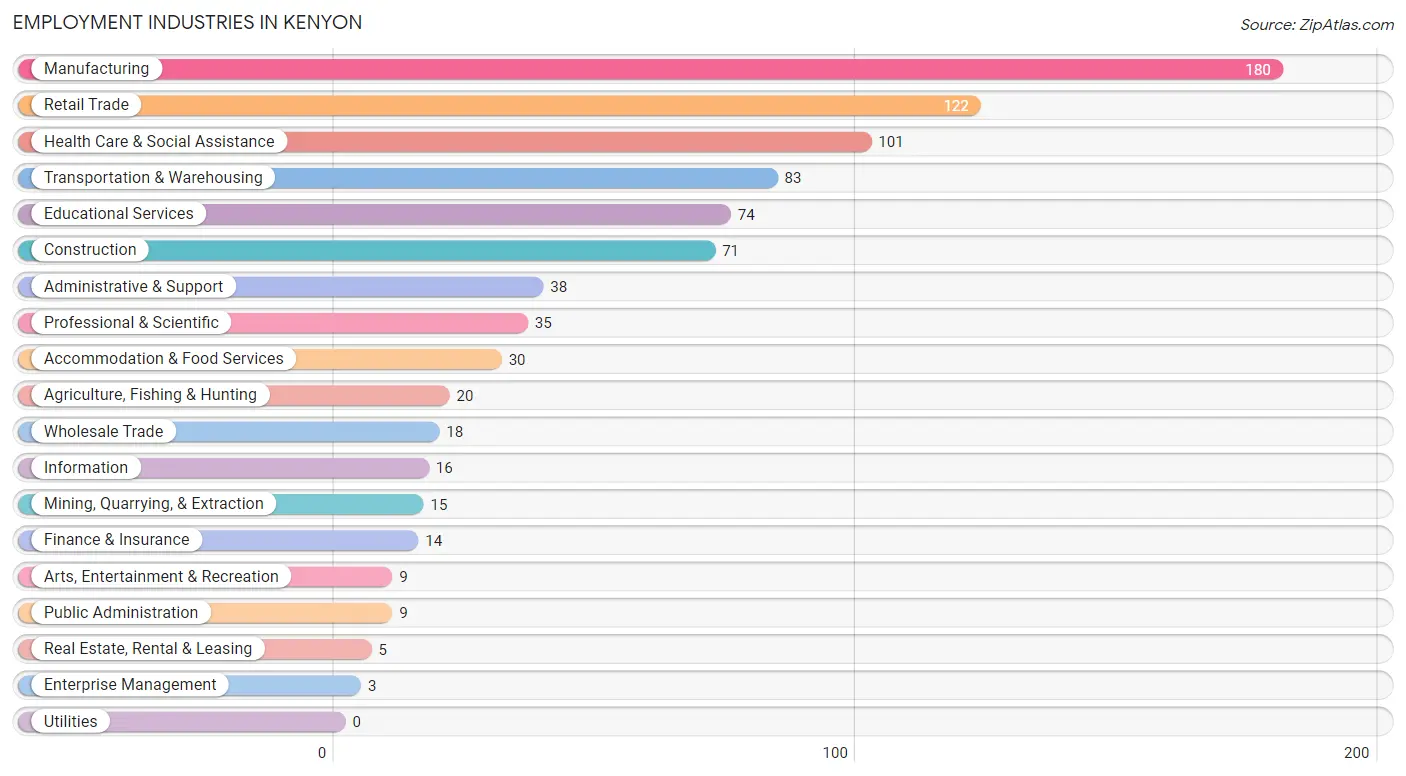
Employment Industries in Kenyon
The major employment industries in Kenyon include Manufacturing (180 | 20.4%), Retail Trade (122 | 13.8%), Health Care & Social Assistance (101 | 11.4%), Transportation & Warehousing (83 | 9.4%), and Educational Services (74 | 8.4%).
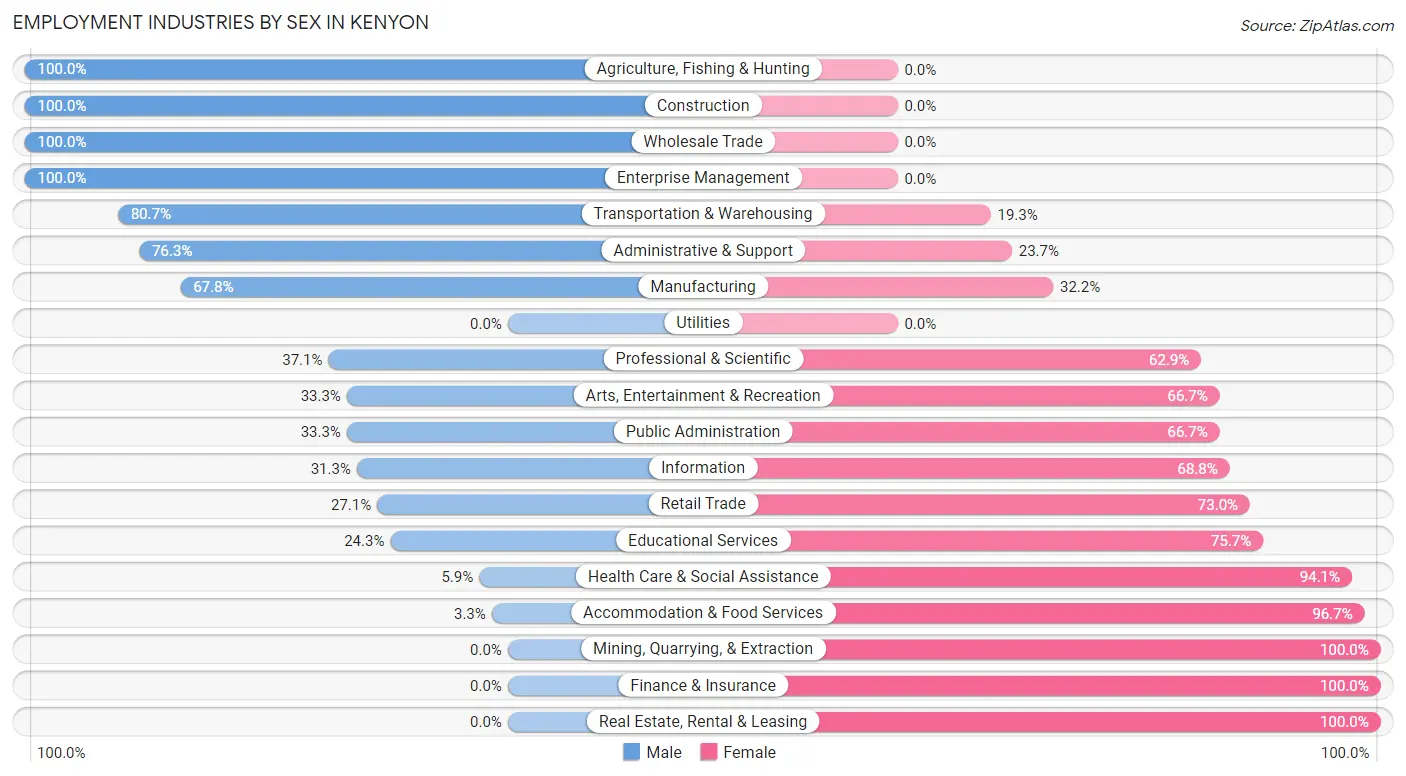
Employment Industries by Sex in Kenyon
The Kenyon industries that see more men than women are Agriculture, Fishing & Hunting (100.0%), Construction (100.0%), and Wholesale Trade (100.0%), whereas the industries that tend to have a higher number of women are Mining, Quarrying, & Extraction (100.0%), Finance & Insurance (100.0%), and Real Estate, Rental & Leasing (100.0%).
| Industry | Male | Female |
| Agriculture, Fishing & Hunting | 20 (100.0%) | 0 (0.0%) |
| Mining, Quarrying, & Extraction | 0 (0.0%) | 15 (100.0%) |
| Construction | 71 (100.0%) | 0 (0.0%) |
| Manufacturing | 122 (67.8%) | 58 (32.2%) |
| Wholesale Trade | 18 (100.0%) | 0 (0.0%) |
| Retail Trade | 33 (27.1%) | 89 (73.0%) |
| Transportation & Warehousing | 67 (80.7%) | 16 (19.3%) |
| Utilities | 0 (0.0%) | 0 (0.0%) |
| Information | 5 (31.2%) | 11 (68.8%) |
| Finance & Insurance | 0 (0.0%) | 14 (100.0%) |
| Real Estate, Rental & Leasing | 0 (0.0%) | 5 (100.0%) |
| Professional & Scientific | 13 (37.1%) | 22 (62.9%) |
| Enterprise Management | 3 (100.0%) | 0 (0.0%) |
| Administrative & Support | 29 (76.3%) | 9 (23.7%) |
| Educational Services | 18 (24.3%) | 56 (75.7%) |
| Health Care & Social Assistance | 6 (5.9%) | 95 (94.1%) |
| Arts, Entertainment & Recreation | 3 (33.3%) | 6 (66.7%) |
| Accommodation & Food Services | 1 (3.3%) | 29 (96.7%) |
| Public Administration | 3 (33.3%) | 6 (66.7%) |
| Total | 439 (49.7%) | 444 (50.3%) |
Education in Kenyon
School Enrollment in Kenyon
The most common levels of schooling among the 358 students in Kenyon are middle school (122 | 34.1%), elementary school (101 | 28.2%), and high school (71 | 19.8%).
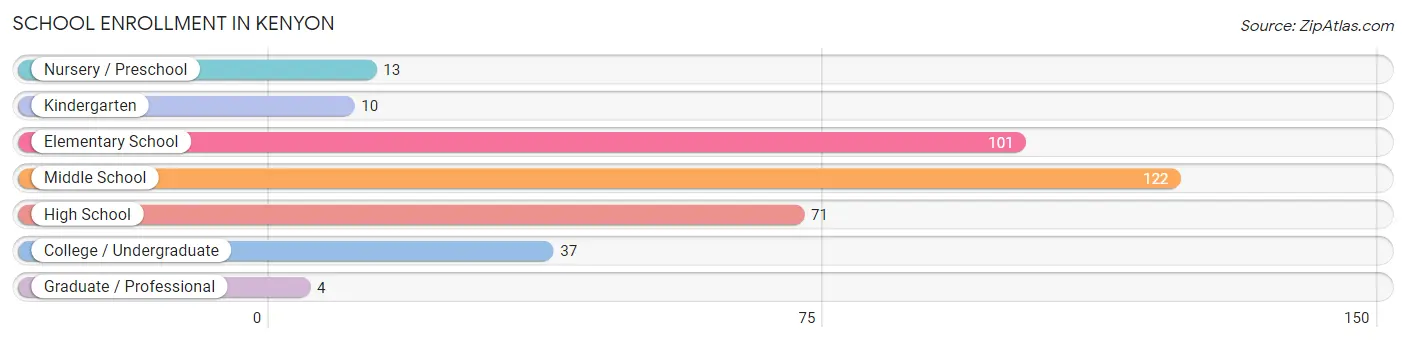
| School Level | # Students | % Students |
| Nursery / Preschool | 13 | 3.6% |
| Kindergarten | 10 | 2.8% |
| Elementary School | 101 | 28.2% |
| Middle School | 122 | 34.1% |
| High School | 71 | 19.8% |
| College / Undergraduate | 37 | 10.3% |
| Graduate / Professional | 4 | 1.1% |
| Total | 358 | 100.0% |
School Enrollment by Age by Funding Source in Kenyon
Out of a total of 358 students who are enrolled in schools in Kenyon, 28 (7.8%) attend a private institution, while the remaining 330 (92.2%) are enrolled in public schools. The age group of 25 to 34 year olds has the highest likelihood of being enrolled in private schools, with 7 (53.8% in the age bracket) enrolled. Conversely, the age group of 10 to 14 year olds has the lowest likelihood of being enrolled in a private school, with 131 (100.0% in the age bracket) attending a public institution.
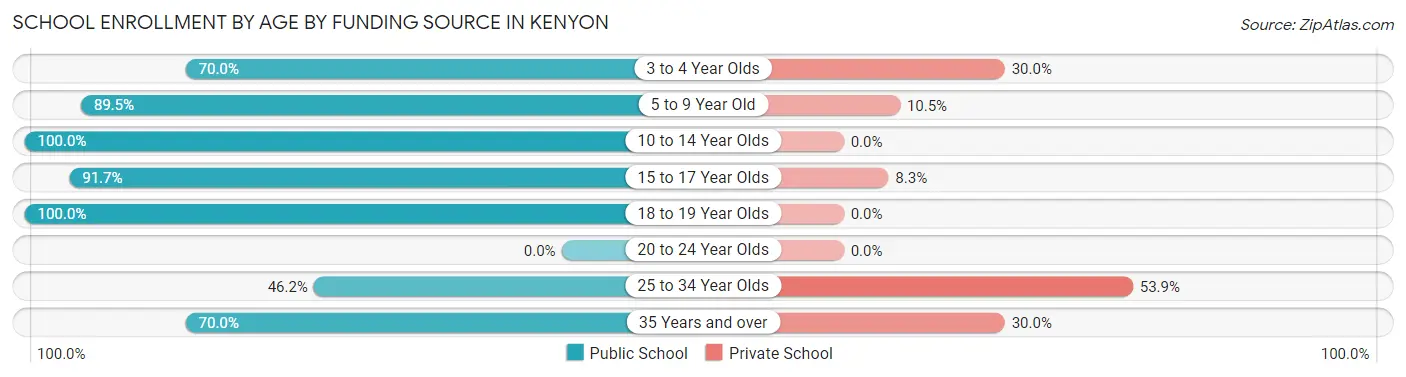
| Age Bracket | Public School | Private School |
| 3 to 4 Year Olds | 7 (70.0%) | 3 (30.0%) |
| 5 to 9 Year Old | 94 (89.5%) | 11 (10.5%) |
| 10 to 14 Year Olds | 131 (100.0%) | 0 (0.0%) |
| 15 to 17 Year Olds | 44 (91.7%) | 4 (8.3%) |
| 18 to 19 Year Olds | 41 (100.0%) | 0 (0.0%) |
| 20 to 24 Year Olds | 0 (0.0%) | 0 (0.0%) |
| 25 to 34 Year Olds | 6 (46.2%) | 7 (53.8%) |
| 35 Years and over | 7 (70.0%) | 3 (30.0%) |
| Total | 330 (92.2%) | 28 (7.8%) |
Educational Attainment by Field of Study in Kenyon
Business (63 | 31.0%), education (62 | 30.5%), arts & humanities (15 | 7.4%), science & technology (12 | 5.9%), and social sciences (10 | 4.9%) are the most common fields of study among 203 individuals in Kenyon who have obtained a bachelor's degree or higher.
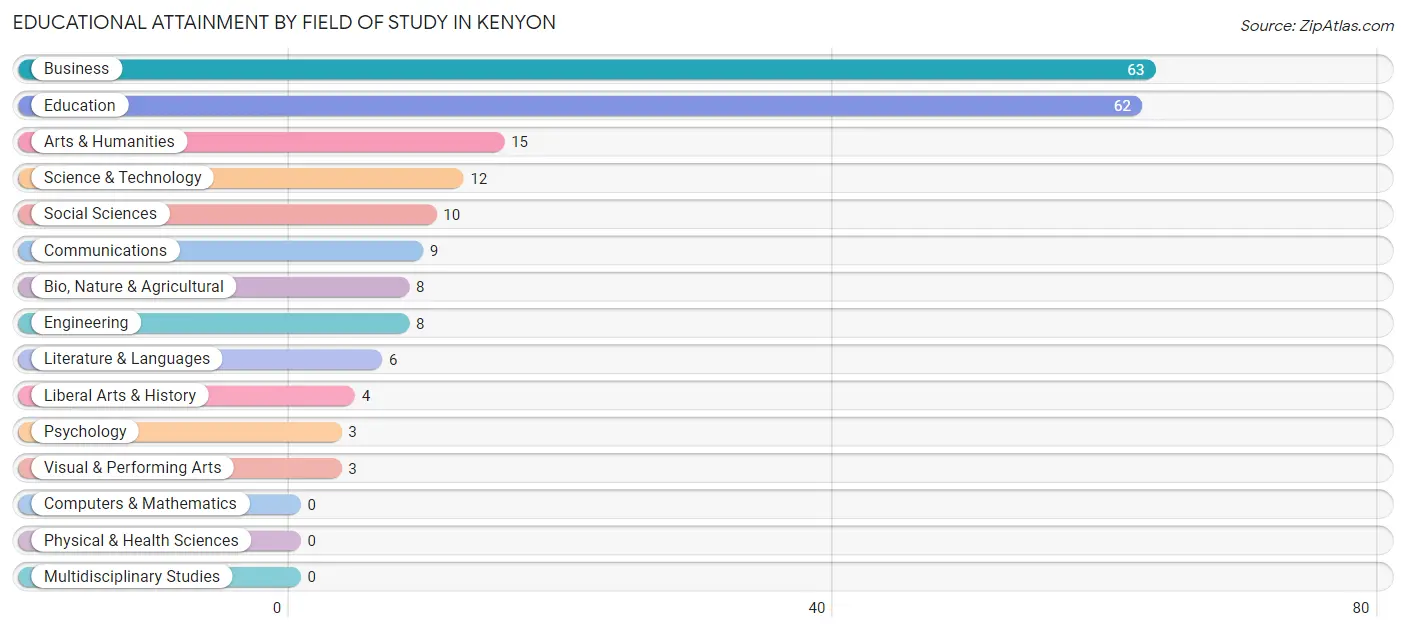
| Field of Study | # Graduates | % Graduates |
| Computers & Mathematics | 0 | 0.0% |
| Bio, Nature & Agricultural | 8 | 3.9% |
| Physical & Health Sciences | 0 | 0.0% |
| Psychology | 3 | 1.5% |
| Social Sciences | 10 | 4.9% |
| Engineering | 8 | 3.9% |
| Multidisciplinary Studies | 0 | 0.0% |
| Science & Technology | 12 | 5.9% |
| Business | 63 | 31.0% |
| Education | 62 | 30.5% |
| Literature & Languages | 6 | 3.0% |
| Liberal Arts & History | 4 | 2.0% |
| Visual & Performing Arts | 3 | 1.5% |
| Communications | 9 | 4.4% |
| Arts & Humanities | 15 | 7.4% |
| Total | 203 | 100.0% |
Transportation & Commute in Kenyon
Vehicle Availability by Sex in Kenyon
The most prevalent vehicle ownership categories in Kenyon are males with 2 vehicles (193, accounting for 44.6%) and females with 2 vehicles (185, making up 43.7%).
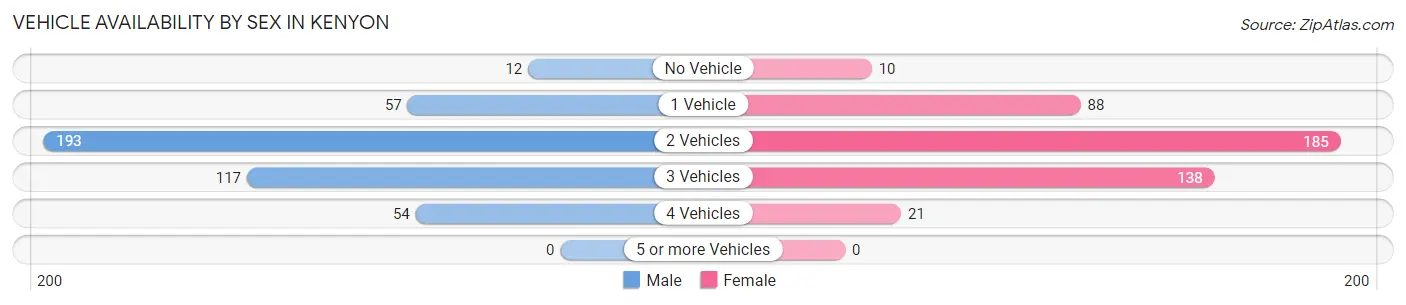
| Vehicles Available | Male | Female |
| No Vehicle | 12 (2.8%) | 10 (2.3%) |
| 1 Vehicle | 57 (13.2%) | 88 (19.9%) |
| 2 Vehicles | 193 (44.6%) | 185 (41.9%) |
| 3 Vehicles | 117 (27.0%) | 138 (31.2%) |
| 4 Vehicles | 54 (12.5%) | 21 (4.8%) |
| 5 or more Vehicles | 0 (0.0%) | 0 (0.0%) |
| Total | 433 (100.0%) | 442 (100.0%) |
Commute Time in Kenyon
The most frequently occuring commute durations in Kenyon are 30 to 34 minutes (110 commuters, 13.1%), less than 5 minutes (90 commuters, 10.7%), and 35 to 39 minutes (88 commuters, 10.5%).
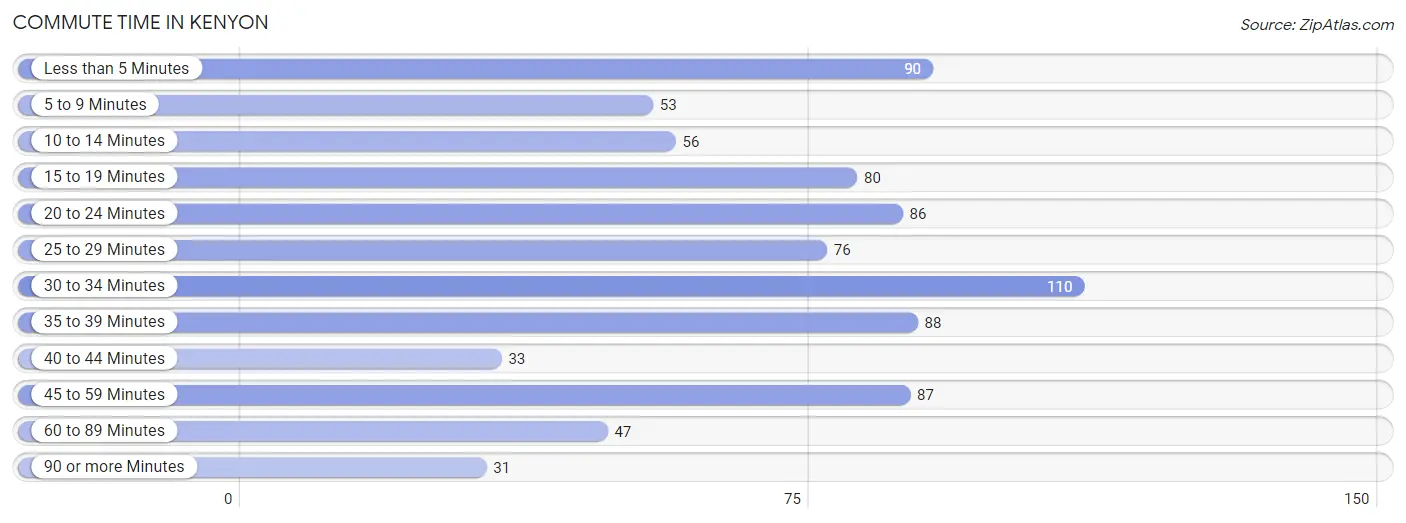
| Commute Time | # Commuters | % Commuters |
| Less than 5 Minutes | 90 | 10.7% |
| 5 to 9 Minutes | 53 | 6.3% |
| 10 to 14 Minutes | 56 | 6.7% |
| 15 to 19 Minutes | 80 | 9.6% |
| 20 to 24 Minutes | 86 | 10.3% |
| 25 to 29 Minutes | 76 | 9.1% |
| 30 to 34 Minutes | 110 | 13.1% |
| 35 to 39 Minutes | 88 | 10.5% |
| 40 to 44 Minutes | 33 | 3.9% |
| 45 to 59 Minutes | 87 | 10.4% |
| 60 to 89 Minutes | 47 | 5.6% |
| 90 or more Minutes | 31 | 3.7% |
Commute Time by Sex in Kenyon
The most common commute times in Kenyon are less than 5 minutes (60 commuters, 14.3%) for males and 35 to 39 minutes (80 commuters, 19.1%) for females.
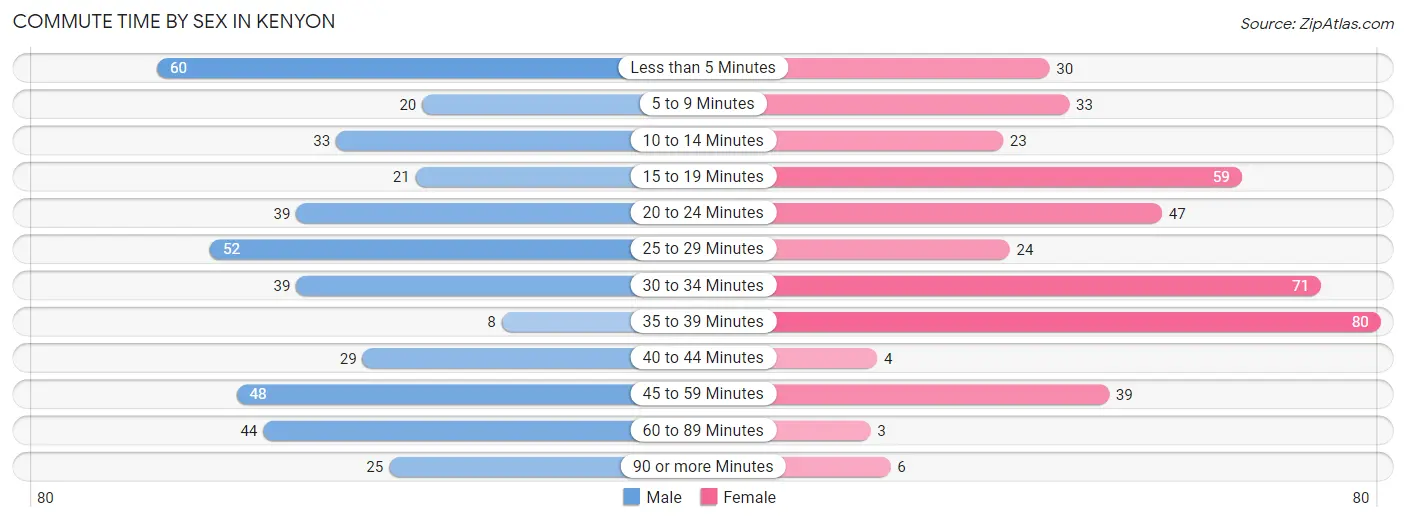
| Commute Time | Male | Female |
| Less than 5 Minutes | 60 (14.3%) | 30 (7.2%) |
| 5 to 9 Minutes | 20 (4.8%) | 33 (7.9%) |
| 10 to 14 Minutes | 33 (7.9%) | 23 (5.5%) |
| 15 to 19 Minutes | 21 (5.0%) | 59 (14.1%) |
| 20 to 24 Minutes | 39 (9.3%) | 47 (11.2%) |
| 25 to 29 Minutes | 52 (12.4%) | 24 (5.7%) |
| 30 to 34 Minutes | 39 (9.3%) | 71 (17.0%) |
| 35 to 39 Minutes | 8 (1.9%) | 80 (19.1%) |
| 40 to 44 Minutes | 29 (6.9%) | 4 (0.9%) |
| 45 to 59 Minutes | 48 (11.5%) | 39 (9.3%) |
| 60 to 89 Minutes | 44 (10.5%) | 3 (0.7%) |
| 90 or more Minutes | 25 (6.0%) | 6 (1.4%) |
Time of Departure to Work by Sex in Kenyon
The most frequent times of departure to work in Kenyon are 12:00 AM to 4:59 AM (124, 29.7%) for males and 7:00 AM to 7:29 AM (80, 19.1%) for females.
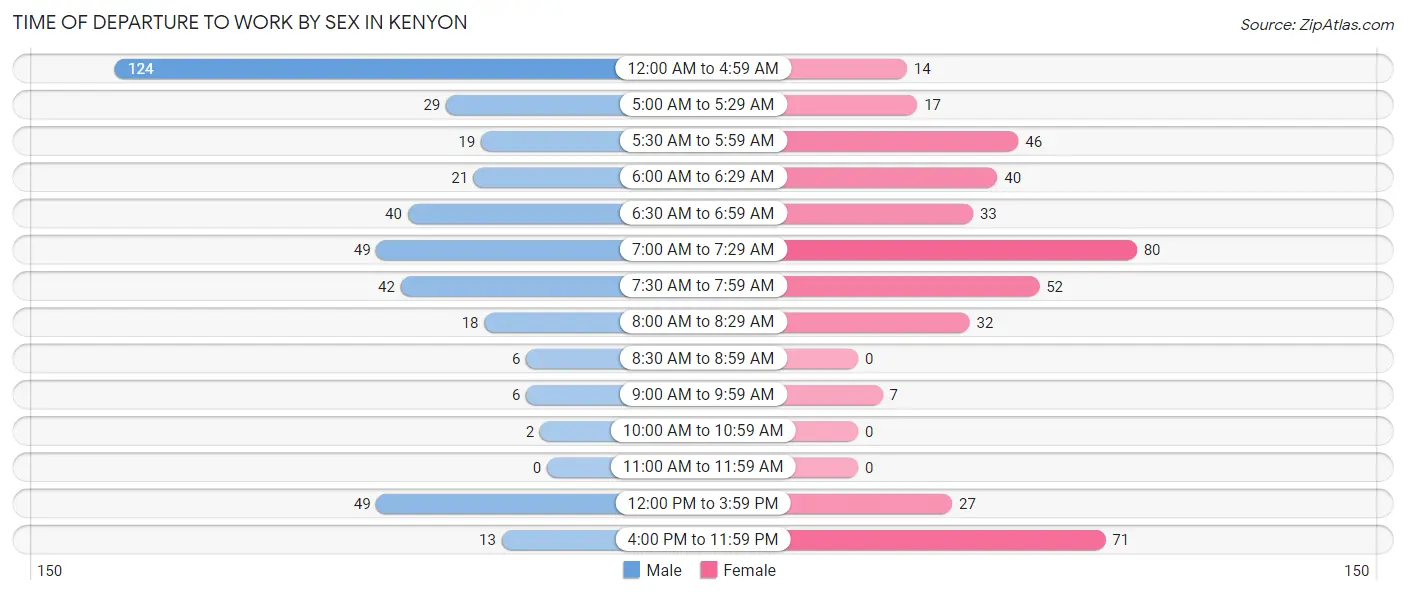
| Time of Departure | Male | Female |
| 12:00 AM to 4:59 AM | 124 (29.7%) | 14 (3.3%) |
| 5:00 AM to 5:29 AM | 29 (6.9%) | 17 (4.1%) |
| 5:30 AM to 5:59 AM | 19 (4.5%) | 46 (11.0%) |
| 6:00 AM to 6:29 AM | 21 (5.0%) | 40 (9.6%) |
| 6:30 AM to 6:59 AM | 40 (9.6%) | 33 (7.9%) |
| 7:00 AM to 7:29 AM | 49 (11.7%) | 80 (19.1%) |
| 7:30 AM to 7:59 AM | 42 (10.1%) | 52 (12.4%) |
| 8:00 AM to 8:29 AM | 18 (4.3%) | 32 (7.6%) |
| 8:30 AM to 8:59 AM | 6 (1.4%) | 0 (0.0%) |
| 9:00 AM to 9:59 AM | 6 (1.4%) | 7 (1.7%) |
| 10:00 AM to 10:59 AM | 2 (0.5%) | 0 (0.0%) |
| 11:00 AM to 11:59 AM | 0 (0.0%) | 0 (0.0%) |
| 12:00 PM to 3:59 PM | 49 (11.7%) | 27 (6.4%) |
| 4:00 PM to 11:59 PM | 13 (3.1%) | 71 (17.0%) |
| Total | 418 (100.0%) | 419 (100.0%) |
Housing Occupancy in Kenyon
Occupancy by Ownership in Kenyon
Of the total 745 dwellings in Kenyon, owner-occupied units account for 603 (80.9%), while renter-occupied units make up 142 (19.1%).
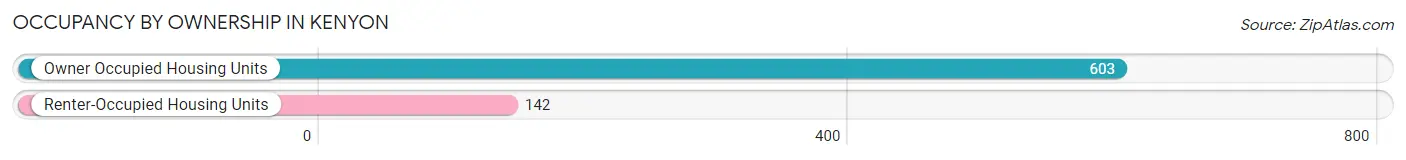
| Occupancy | # Housing Units | % Housing Units |
| Owner Occupied Housing Units | 603 | 80.9% |
| Renter-Occupied Housing Units | 142 | 19.1% |
| Total Occupied Housing Units | 745 | 100.0% |
Occupancy by Household Size in Kenyon
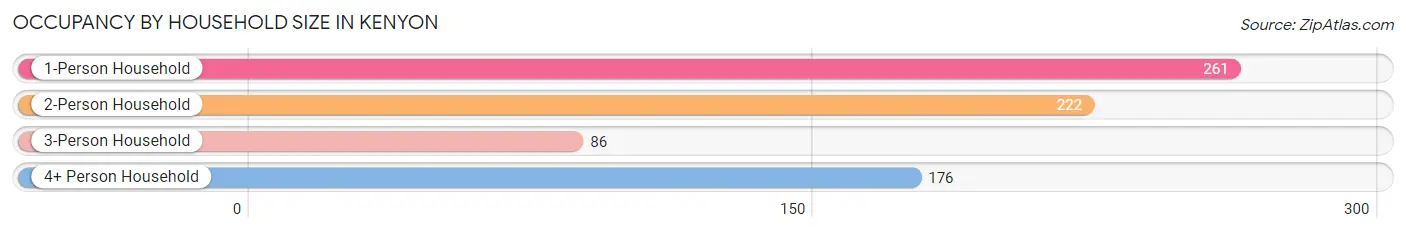
| Household Size | # Housing Units | % Housing Units |
| 1-Person Household | 261 | 35.0% |
| 2-Person Household | 222 | 29.8% |
| 3-Person Household | 86 | 11.5% |
| 4+ Person Household | 176 | 23.6% |
| Total Housing Units | 745 | 100.0% |
Occupancy by Ownership by Household Size in Kenyon
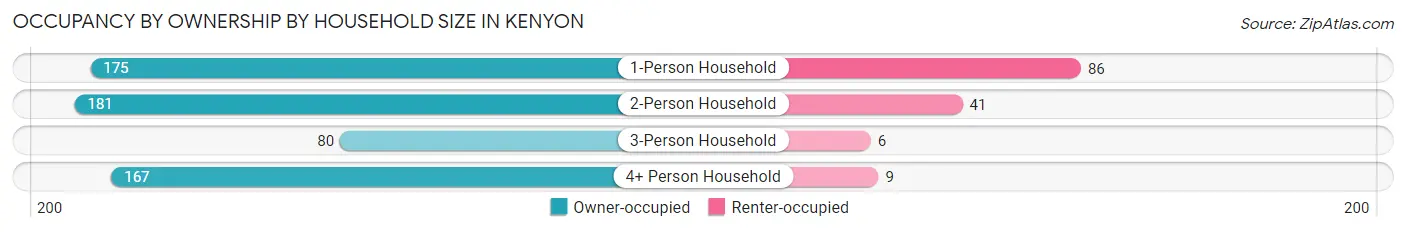
| Household Size | Owner-occupied | Renter-occupied |
| 1-Person Household | 175 (67.0%) | 86 (33.0%) |
| 2-Person Household | 181 (81.5%) | 41 (18.5%) |
| 3-Person Household | 80 (93.0%) | 6 (7.0%) |
| 4+ Person Household | 167 (94.9%) | 9 (5.1%) |
| Total Housing Units | 603 (80.9%) | 142 (19.1%) |
Occupancy by Educational Attainment in Kenyon
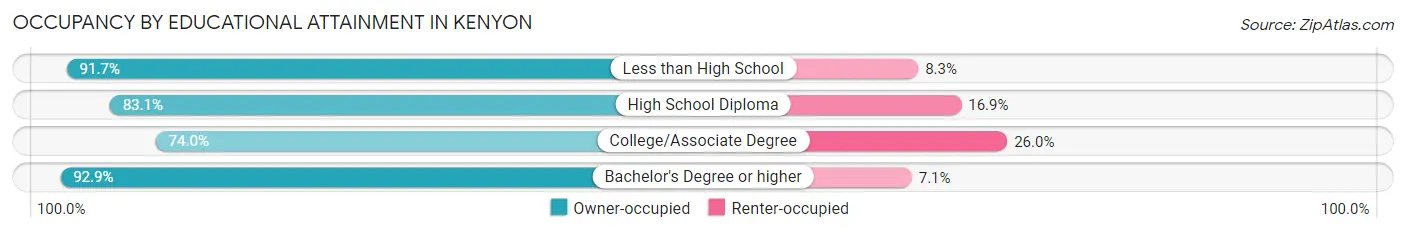
| Household Size | Owner-occupied | Renter-occupied |
| Less than High School | 33 (91.7%) | 3 (8.3%) |
| High School Diploma | 266 (83.1%) | 54 (16.9%) |
| College/Associate Degree | 225 (74.0%) | 79 (26.0%) |
| Bachelor's Degree or higher | 79 (92.9%) | 6 (7.1%) |
Occupancy by Age of Householder in Kenyon
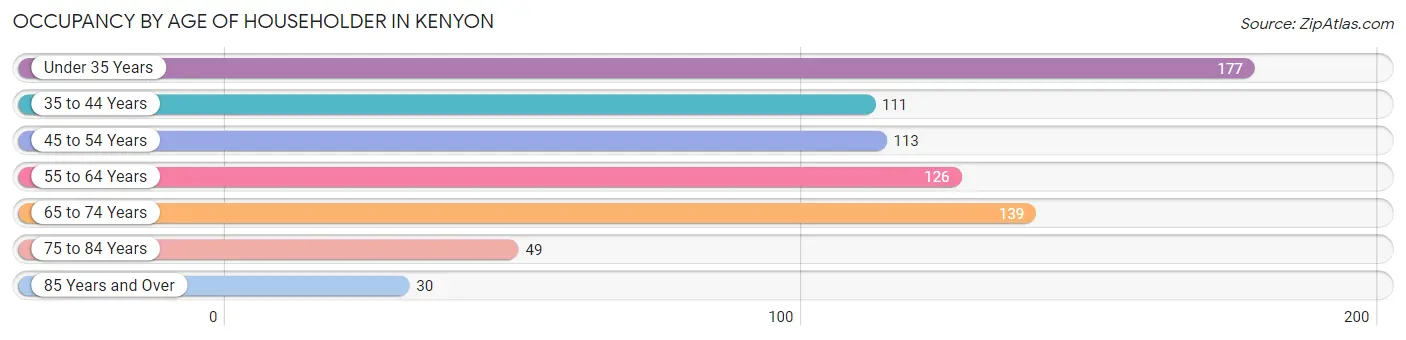
| Age Bracket | # Households | % Households |
| Under 35 Years | 177 | 23.8% |
| 35 to 44 Years | 111 | 14.9% |
| 45 to 54 Years | 113 | 15.2% |
| 55 to 64 Years | 126 | 16.9% |
| 65 to 74 Years | 139 | 18.7% |
| 75 to 84 Years | 49 | 6.6% |
| 85 Years and Over | 30 | 4.0% |
| Total | 745 | 100.0% |
Housing Finances in Kenyon
Median Income by Occupancy in Kenyon
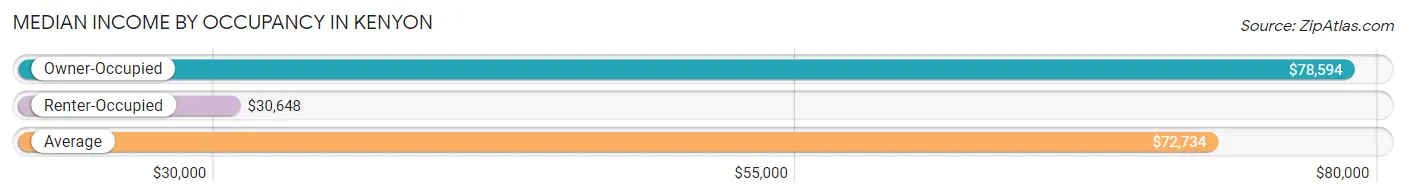
| Occupancy Type | # Households | Median Income |
| Owner-Occupied | 603 (80.9%) | $78,594 |
| Renter-Occupied | 142 (19.1%) | $30,648 |
| Average | 745 (100.0%) | $72,734 |
Occupancy by Householder Income Bracket in Kenyon
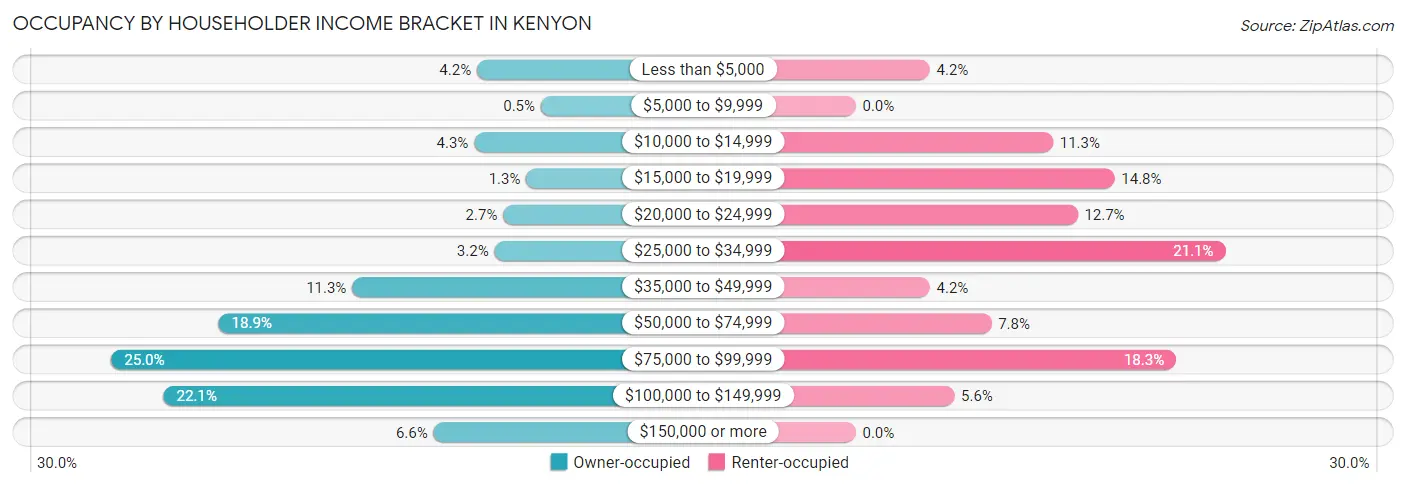
| Income Bracket | Owner-occupied | Renter-occupied |
| Less than $5,000 | 25 (4.2%) | 6 (4.2%) |
| $5,000 to $9,999 | 3 (0.5%) | 0 (0.0%) |
| $10,000 to $14,999 | 26 (4.3%) | 16 (11.3%) |
| $15,000 to $19,999 | 8 (1.3%) | 21 (14.8%) |
| $20,000 to $24,999 | 16 (2.6%) | 18 (12.7%) |
| $25,000 to $34,999 | 19 (3.2%) | 30 (21.1%) |
| $35,000 to $49,999 | 68 (11.3%) | 6 (4.2%) |
| $50,000 to $74,999 | 114 (18.9%) | 11 (7.7%) |
| $75,000 to $99,999 | 151 (25.0%) | 26 (18.3%) |
| $100,000 to $149,999 | 133 (22.1%) | 8 (5.6%) |
| $150,000 or more | 40 (6.6%) | 0 (0.0%) |
| Total | 603 (100.0%) | 142 (100.0%) |
Monthly Housing Cost Tiers in Kenyon
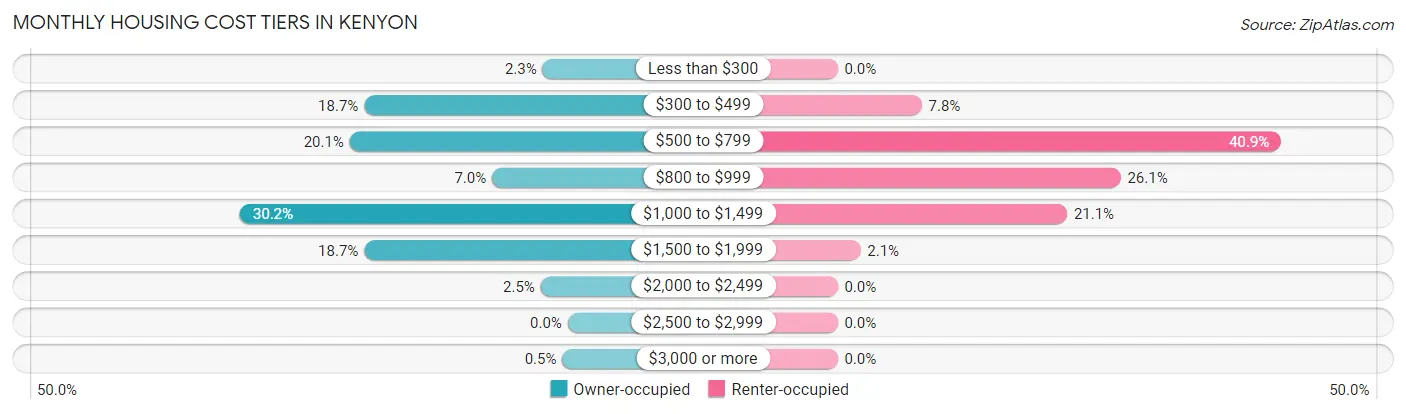
| Monthly Cost | Owner-occupied | Renter-occupied |
| Less than $300 | 14 (2.3%) | 0 (0.0%) |
| $300 to $499 | 113 (18.7%) | 11 (7.7%) |
| $500 to $799 | 121 (20.1%) | 58 (40.8%) |
| $800 to $999 | 42 (7.0%) | 37 (26.1%) |
| $1,000 to $1,499 | 182 (30.2%) | 30 (21.1%) |
| $1,500 to $1,999 | 113 (18.7%) | 3 (2.1%) |
| $2,000 to $2,499 | 15 (2.5%) | 0 (0.0%) |
| $2,500 to $2,999 | 0 (0.0%) | 0 (0.0%) |
| $3,000 or more | 3 (0.5%) | 0 (0.0%) |
| Total | 603 (100.0%) | 142 (100.0%) |
Physical Housing Characteristics in Kenyon
Housing Structures in Kenyon
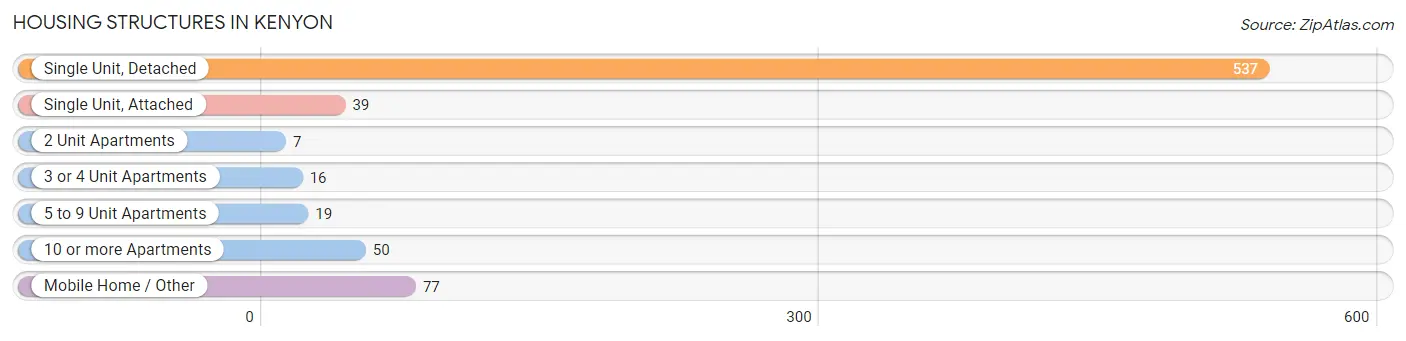
| Structure Type | # Housing Units | % Housing Units |
| Single Unit, Detached | 537 | 72.1% |
| Single Unit, Attached | 39 | 5.2% |
| 2 Unit Apartments | 7 | 0.9% |
| 3 or 4 Unit Apartments | 16 | 2.1% |
| 5 to 9 Unit Apartments | 19 | 2.5% |
| 10 or more Apartments | 50 | 6.7% |
| Mobile Home / Other | 77 | 10.3% |
| Total | 745 | 100.0% |
Housing Structures by Occupancy in Kenyon
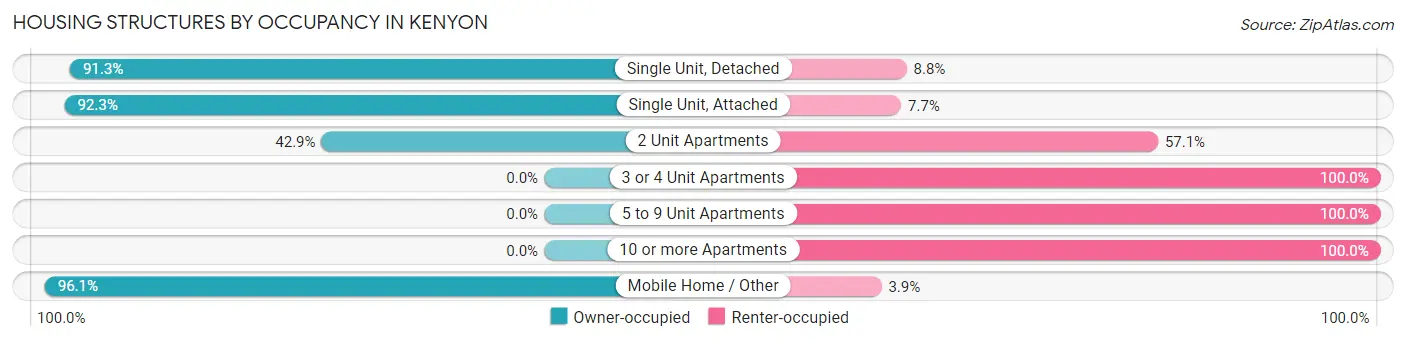
| Structure Type | Owner-occupied | Renter-occupied |
| Single Unit, Detached | 490 (91.2%) | 47 (8.7%) |
| Single Unit, Attached | 36 (92.3%) | 3 (7.7%) |
| 2 Unit Apartments | 3 (42.9%) | 4 (57.1%) |
| 3 or 4 Unit Apartments | 0 (0.0%) | 16 (100.0%) |
| 5 to 9 Unit Apartments | 0 (0.0%) | 19 (100.0%) |
| 10 or more Apartments | 0 (0.0%) | 50 (100.0%) |
| Mobile Home / Other | 74 (96.1%) | 3 (3.9%) |
| Total | 603 (80.9%) | 142 (19.1%) |
Housing Structures by Number of Rooms in Kenyon
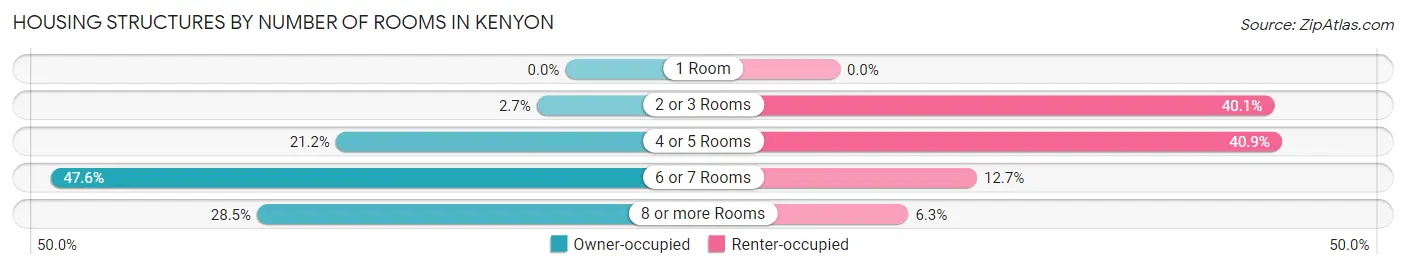
| Number of Rooms | Owner-occupied | Renter-occupied |
| 1 Room | 0 (0.0%) | 0 (0.0%) |
| 2 or 3 Rooms | 16 (2.6%) | 57 (40.1%) |
| 4 or 5 Rooms | 128 (21.2%) | 58 (40.8%) |
| 6 or 7 Rooms | 287 (47.6%) | 18 (12.7%) |
| 8 or more Rooms | 172 (28.5%) | 9 (6.3%) |
| Total | 603 (100.0%) | 142 (100.0%) |
Housing Structure by Heating Type in Kenyon
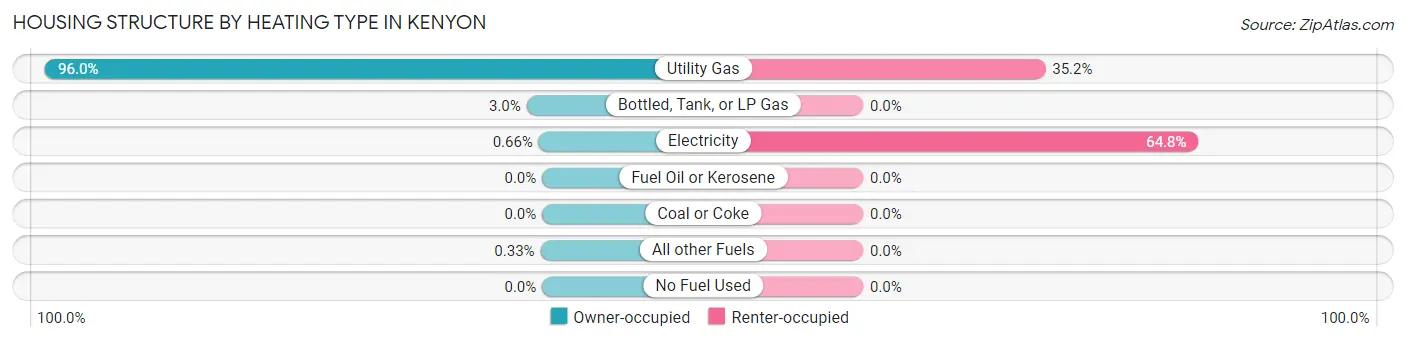
| Heating Type | Owner-occupied | Renter-occupied |
| Utility Gas | 579 (96.0%) | 50 (35.2%) |
| Bottled, Tank, or LP Gas | 18 (3.0%) | 0 (0.0%) |
| Electricity | 4 (0.7%) | 92 (64.8%) |
| Fuel Oil or Kerosene | 0 (0.0%) | 0 (0.0%) |
| Coal or Coke | 0 (0.0%) | 0 (0.0%) |
| All other Fuels | 2 (0.3%) | 0 (0.0%) |
| No Fuel Used | 0 (0.0%) | 0 (0.0%) |
| Total | 603 (100.0%) | 142 (100.0%) |
Household Vehicle Usage in Kenyon
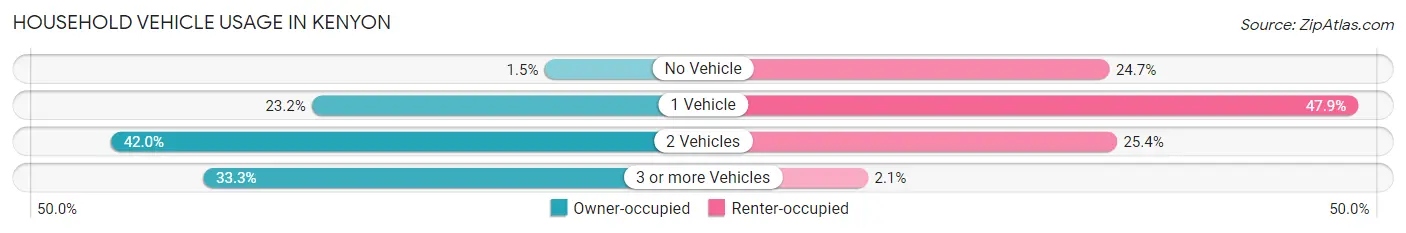
| Vehicles per Household | Owner-occupied | Renter-occupied |
| No Vehicle | 9 (1.5%) | 35 (24.6%) |
| 1 Vehicle | 140 (23.2%) | 68 (47.9%) |
| 2 Vehicles | 253 (42.0%) | 36 (25.4%) |
| 3 or more Vehicles | 201 (33.3%) | 3 (2.1%) |
| Total | 603 (100.0%) | 142 (100.0%) |
Real Estate & Mortgages in Kenyon
Real Estate and Mortgage Overview in Kenyon
| Characteristic | Without Mortgage | With Mortgage |
| Housing Units | 222 | 381 |
| Median Property Value | $110,000 | $175,200 |
| Median Household Income | $80,750 | $32 |
| Monthly Housing Costs | $485 | $3 |
| Real Estate Taxes | $1,596 | $15 |
Property Value by Mortgage Status in Kenyon
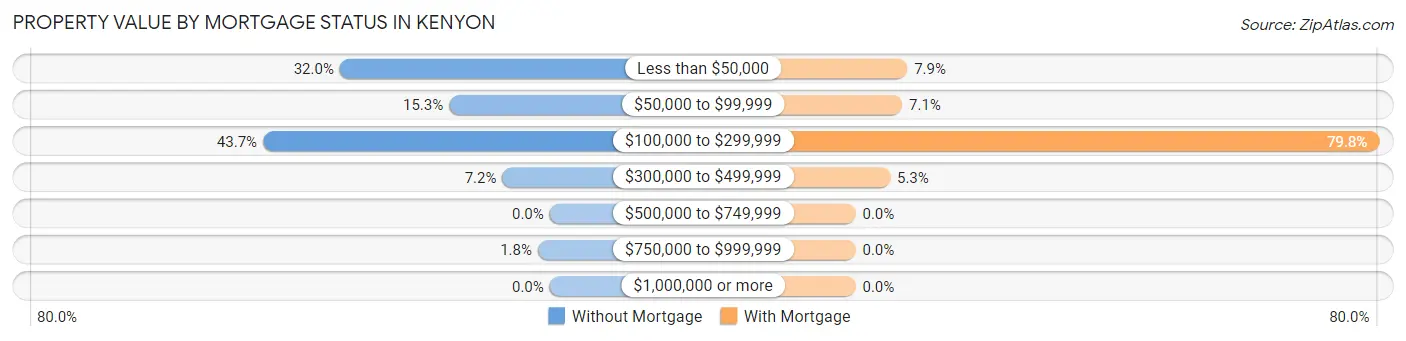
| Property Value | Without Mortgage | With Mortgage |
| Less than $50,000 | 71 (32.0%) | 30 (7.9%) |
| $50,000 to $99,999 | 34 (15.3%) | 27 (7.1%) |
| $100,000 to $299,999 | 97 (43.7%) | 304 (79.8%) |
| $300,000 to $499,999 | 16 (7.2%) | 20 (5.2%) |
| $500,000 to $749,999 | 0 (0.0%) | 0 (0.0%) |
| $750,000 to $999,999 | 4 (1.8%) | 0 (0.0%) |
| $1,000,000 or more | 0 (0.0%) | 0 (0.0%) |
| Total | 222 (100.0%) | 381 (100.0%) |
Household Income by Mortgage Status in Kenyon
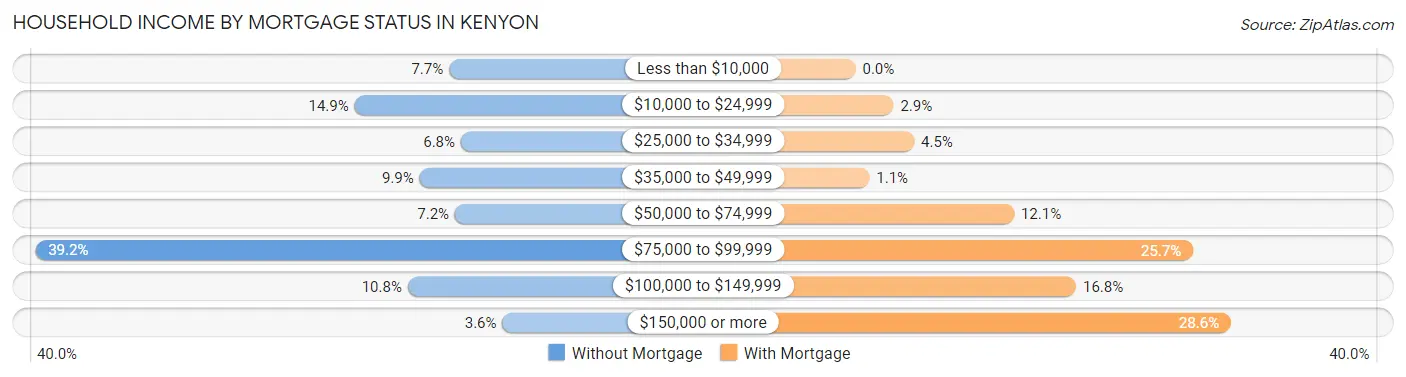
| Household Income | Without Mortgage | With Mortgage |
| Less than $10,000 | 17 (7.7%) | 0 (0.0%) |
| $10,000 to $24,999 | 33 (14.9%) | 11 (2.9%) |
| $25,000 to $34,999 | 15 (6.8%) | 17 (4.5%) |
| $35,000 to $49,999 | 22 (9.9%) | 4 (1.1%) |
| $50,000 to $74,999 | 16 (7.2%) | 46 (12.1%) |
| $75,000 to $99,999 | 87 (39.2%) | 98 (25.7%) |
| $100,000 to $149,999 | 24 (10.8%) | 64 (16.8%) |
| $150,000 or more | 8 (3.6%) | 109 (28.6%) |
| Total | 222 (100.0%) | 381 (100.0%) |
Property Value to Household Income Ratio in Kenyon
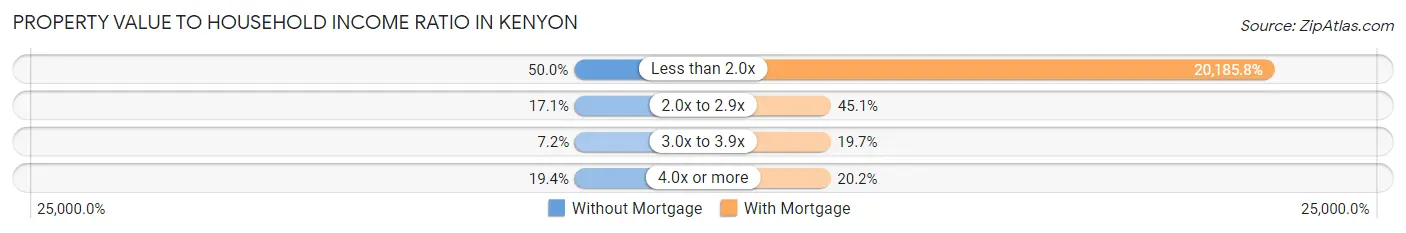
| Value-to-Income Ratio | Without Mortgage | With Mortgage |
| Less than 2.0x | 111 (50.0%) | 76,908 (20,185.8%) |
| 2.0x to 2.9x | 38 (17.1%) | 172 (45.1%) |
| 3.0x to 3.9x | 16 (7.2%) | 75 (19.7%) |
| 4.0x or more | 43 (19.4%) | 77 (20.2%) |
| Total | 222 (100.0%) | 381 (100.0%) |
Real Estate Taxes by Mortgage Status in Kenyon
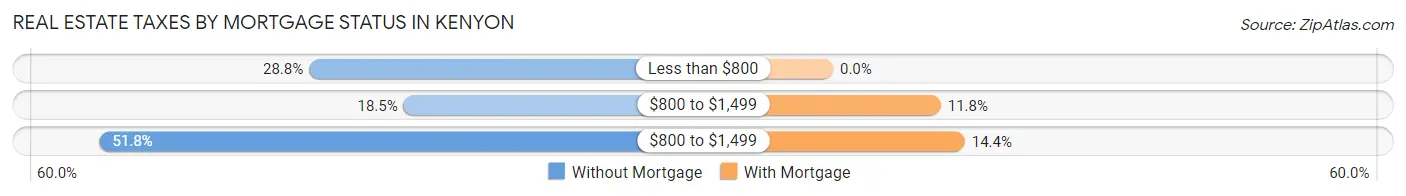
| Property Taxes | Without Mortgage | With Mortgage |
| Less than $800 | 64 (28.8%) | 0 (0.0%) |
| $800 to $1,499 | 41 (18.5%) | 45 (11.8%) |
| $800 to $1,499 | 115 (51.8%) | 55 (14.4%) |
| Total | 222 (100.0%) | 381 (100.0%) |
Health & Disability in Kenyon
Health Insurance Coverage by Age in Kenyon
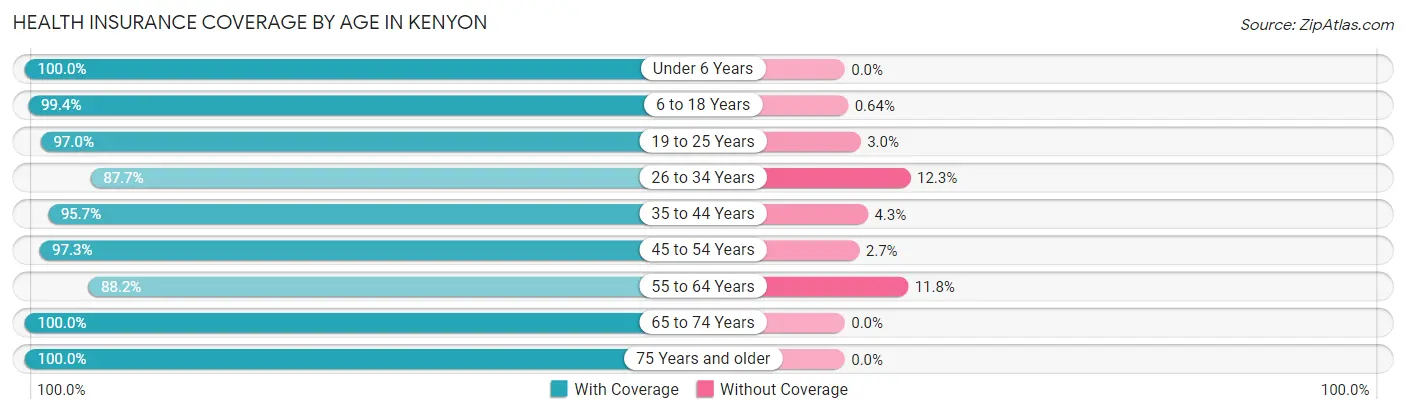
| Age Bracket | With Coverage | Without Coverage |
| Under 6 Years | 124 (100.0%) | 0 (0.0%) |
| 6 to 18 Years | 309 (99.4%) | 2 (0.6%) |
| 19 to 25 Years | 98 (97.0%) | 3 (3.0%) |
| 26 to 34 Years | 229 (87.7%) | 32 (12.3%) |
| 35 to 44 Years | 155 (95.7%) | 7 (4.3%) |
| 45 to 54 Years | 215 (97.3%) | 6 (2.7%) |
| 55 to 64 Years | 179 (88.2%) | 24 (11.8%) |
| 65 to 74 Years | 190 (100.0%) | 0 (0.0%) |
| 75 Years and older | 151 (100.0%) | 0 (0.0%) |
| Total | 1,650 (95.7%) | 74 (4.3%) |
Health Insurance Coverage by Citizenship Status in Kenyon
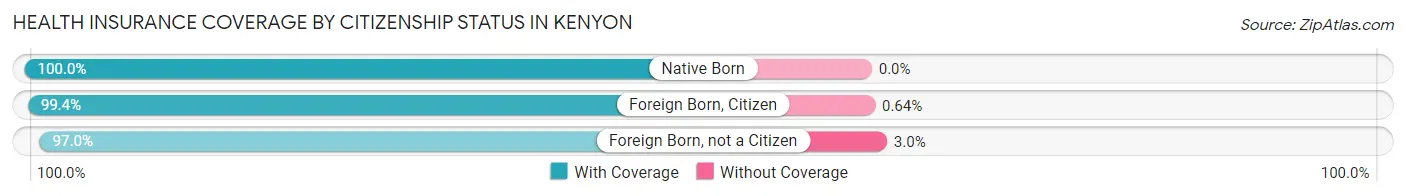
| Citizenship Status | With Coverage | Without Coverage |
| Native Born | 124 (100.0%) | 0 (0.0%) |
| Foreign Born, Citizen | 309 (99.4%) | 2 (0.6%) |
| Foreign Born, not a Citizen | 98 (97.0%) | 3 (3.0%) |
Health Insurance Coverage by Household Income in Kenyon
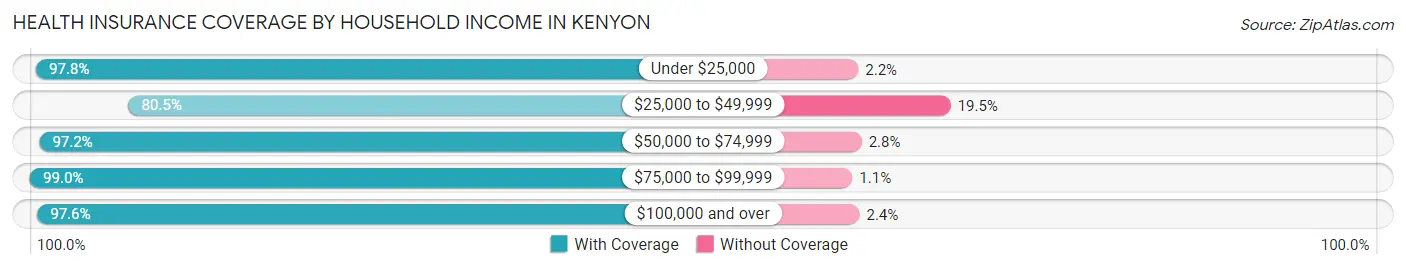
| Household Income | With Coverage | Without Coverage |
| Under $25,000 | 181 (97.8%) | 4 (2.2%) |
| $25,000 to $49,999 | 182 (80.5%) | 44 (19.5%) |
| $50,000 to $74,999 | 279 (97.2%) | 8 (2.8%) |
| $75,000 to $99,999 | 473 (99.0%) | 5 (1.1%) |
| $100,000 and over | 530 (97.6%) | 13 (2.4%) |
Public vs Private Health Insurance Coverage by Age in Kenyon
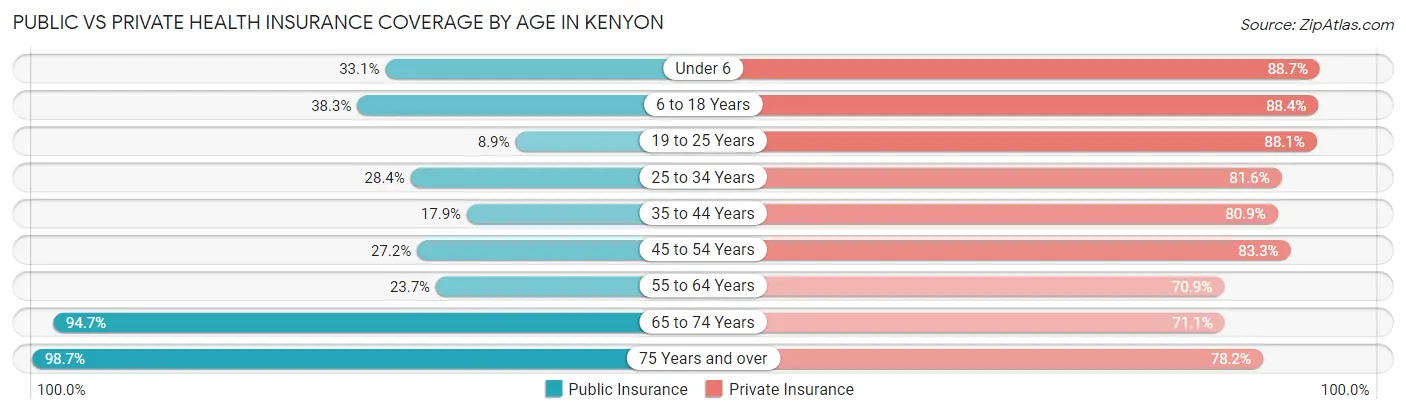
| Age Bracket | Public Insurance | Private Insurance |
| Under 6 | 41 (33.1%) | 110 (88.7%) |
| 6 to 18 Years | 119 (38.3%) | 275 (88.4%) |
| 19 to 25 Years | 9 (8.9%) | 89 (88.1%) |
| 25 to 34 Years | 74 (28.3%) | 213 (81.6%) |
| 35 to 44 Years | 29 (17.9%) | 131 (80.9%) |
| 45 to 54 Years | 60 (27.2%) | 184 (83.3%) |
| 55 to 64 Years | 48 (23.6%) | 144 (70.9%) |
| 65 to 74 Years | 180 (94.7%) | 135 (71.1%) |
| 75 Years and over | 149 (98.7%) | 118 (78.1%) |
| Total | 709 (41.1%) | 1,399 (81.1%) |
Disability Status by Sex by Age in Kenyon
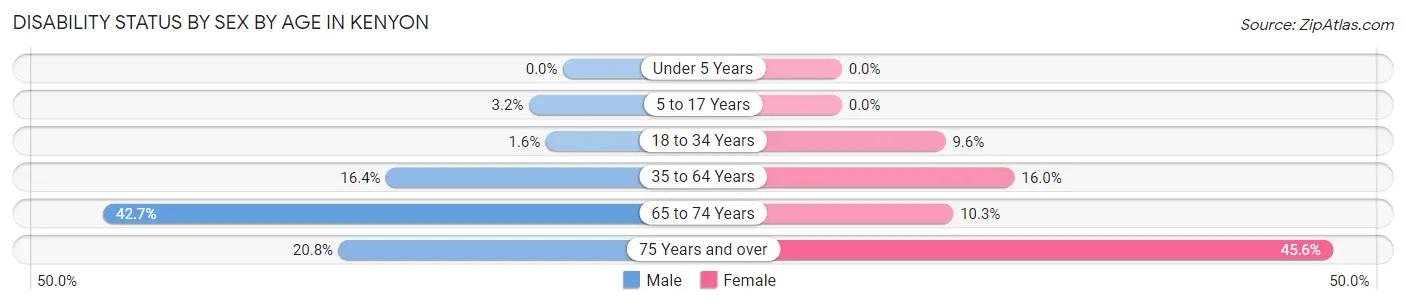
| Age Bracket | Male | Female |
| Under 5 Years | 0 (0.0%) | 0 (0.0%) |
| 5 to 17 Years | 6 (3.2%) | 0 (0.0%) |
| 18 to 34 Years | 3 (1.6%) | 20 (9.6%) |
| 35 to 64 Years | 44 (16.4%) | 51 (16.0%) |
| 65 to 74 Years | 44 (42.7%) | 9 (10.3%) |
| 75 Years and over | 15 (20.8%) | 36 (45.6%) |
Disability Class by Sex by Age in Kenyon
Disability Class: Hearing Difficulty
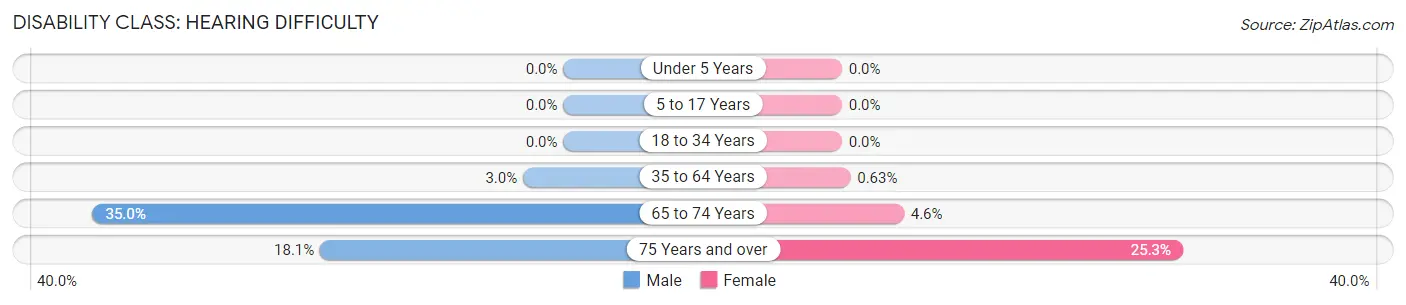
| Age Bracket | Male | Female |
| Under 5 Years | 0 (0.0%) | 0 (0.0%) |
| 5 to 17 Years | 0 (0.0%) | 0 (0.0%) |
| 18 to 34 Years | 0 (0.0%) | 0 (0.0%) |
| 35 to 64 Years | 8 (3.0%) | 2 (0.6%) |
| 65 to 74 Years | 36 (34.9%) | 4 (4.6%) |
| 75 Years and over | 13 (18.1%) | 20 (25.3%) |
Disability Class: Vision Difficulty
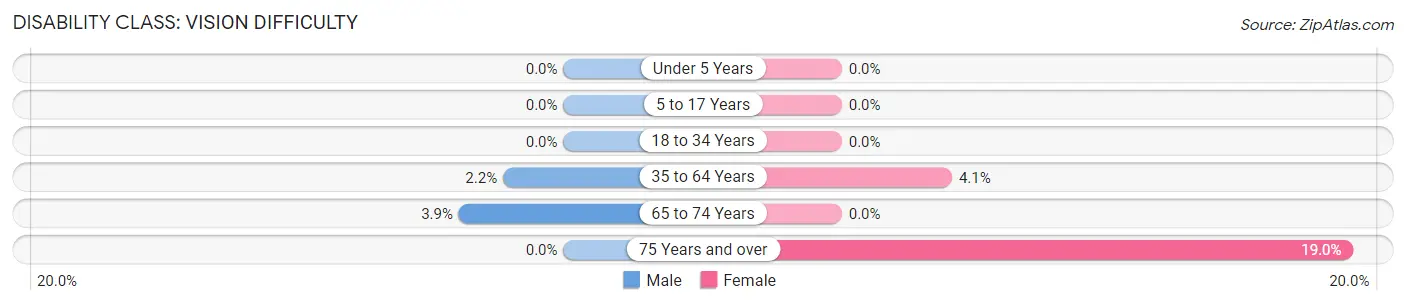
| Age Bracket | Male | Female |
| Under 5 Years | 0 (0.0%) | 0 (0.0%) |
| 5 to 17 Years | 0 (0.0%) | 0 (0.0%) |
| 18 to 34 Years | 0 (0.0%) | 0 (0.0%) |
| 35 to 64 Years | 6 (2.2%) | 13 (4.1%) |
| 65 to 74 Years | 4 (3.9%) | 0 (0.0%) |
| 75 Years and over | 0 (0.0%) | 15 (19.0%) |
Disability Class: Cognitive Difficulty
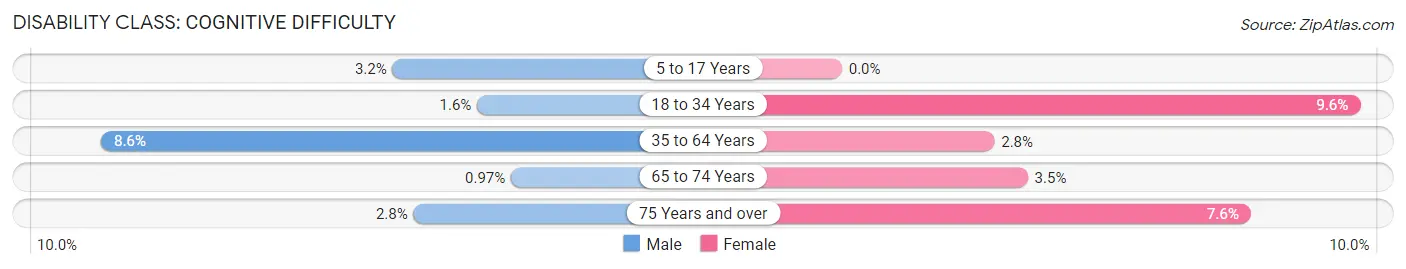
| Age Bracket | Male | Female |
| 5 to 17 Years | 6 (3.2%) | 0 (0.0%) |
| 18 to 34 Years | 3 (1.6%) | 20 (9.6%) |
| 35 to 64 Years | 23 (8.6%) | 9 (2.8%) |
| 65 to 74 Years | 1 (1.0%) | 3 (3.5%) |
| 75 Years and over | 2 (2.8%) | 6 (7.6%) |
Disability Class: Ambulatory Difficulty
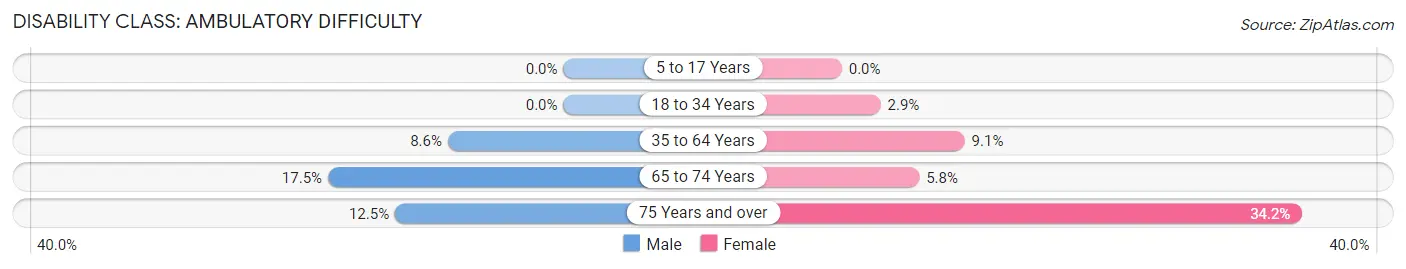
| Age Bracket | Male | Female |
| 5 to 17 Years | 0 (0.0%) | 0 (0.0%) |
| 18 to 34 Years | 0 (0.0%) | 6 (2.9%) |
| 35 to 64 Years | 23 (8.6%) | 29 (9.1%) |
| 65 to 74 Years | 18 (17.5%) | 5 (5.8%) |
| 75 Years and over | 9 (12.5%) | 27 (34.2%) |
Disability Class: Self-Care Difficulty
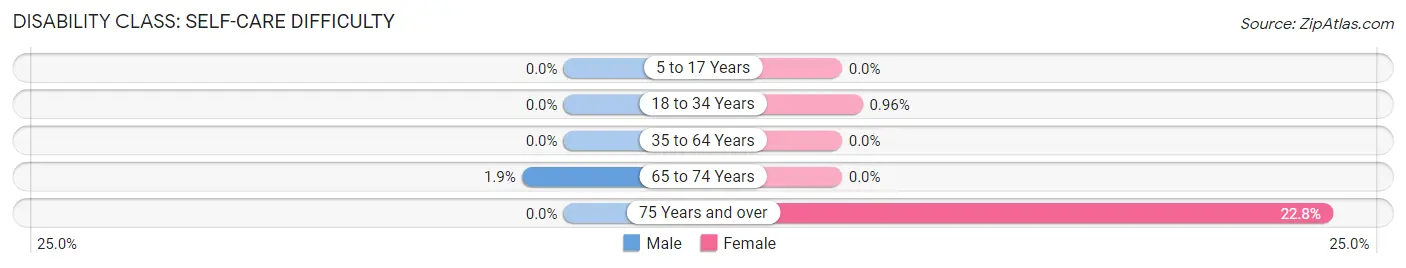
| Age Bracket | Male | Female |
| 5 to 17 Years | 0 (0.0%) | 0 (0.0%) |
| 18 to 34 Years | 0 (0.0%) | 2 (1.0%) |
| 35 to 64 Years | 0 (0.0%) | 0 (0.0%) |
| 65 to 74 Years | 2 (1.9%) | 0 (0.0%) |
| 75 Years and over | 0 (0.0%) | 18 (22.8%) |
Technology Access in Kenyon
Computing Device Access in Kenyon
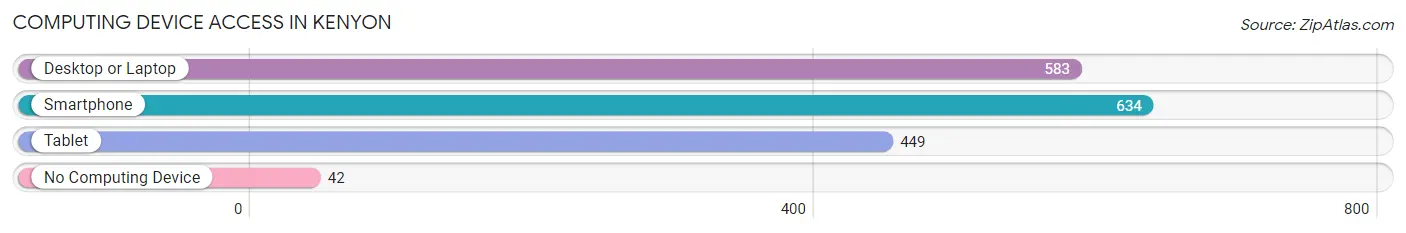
| Device Type | # Households | % Households |
| Desktop or Laptop | 583 | 78.3% |
| Smartphone | 634 | 85.1% |
| Tablet | 449 | 60.3% |
| No Computing Device | 42 | 5.6% |
| Total | 745 | 100.0% |
Internet Access in Kenyon
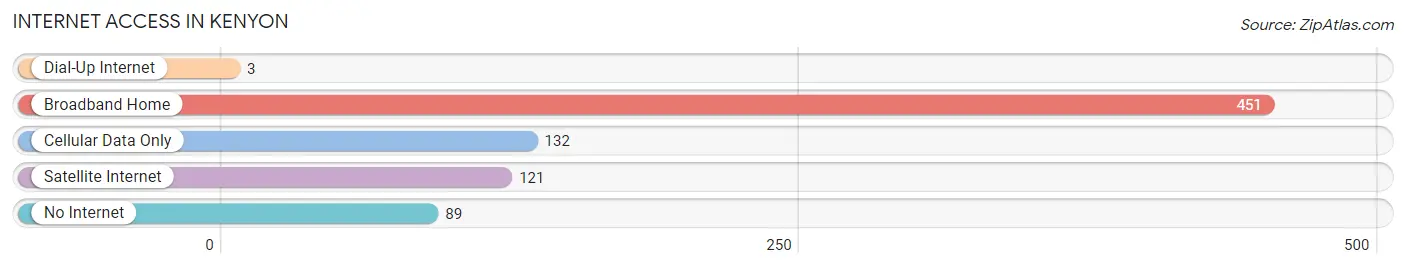
| Internet Type | # Households | % Households |
| Dial-Up Internet | 3 | 0.4% |
| Broadband Home | 451 | 60.5% |
| Cellular Data Only | 132 | 17.7% |
| Satellite Internet | 121 | 16.2% |
| No Internet | 89 | 11.9% |
| Total | 745 | 100.0% |
Kenyon Summary
Kenyon, Minnesota is a small city located in Goodhue County, in the southeastern part of the state. It is situated on the banks of the Cannon River, and is part of the Twin Cities metropolitan area. The city has a population of approximately 2,500 people, and is known for its small-town charm and friendly atmosphere.
History
Kenyon was founded in 1856 by a group of settlers from New England. The town was named after a local Native American chief, Chief Kenyon. The settlers were attracted to the area due to its fertile soil and abundant natural resources. The town quickly grew, and by the late 1800s, it had become a thriving agricultural community.
In the early 1900s, Kenyon began to diversify its economy. The town became a center for manufacturing, with several factories producing furniture, clothing, and other goods. The town also became a popular tourist destination, with many visitors coming to enjoy the area’s natural beauty.
Geography
Kenyon is located in southeastern Minnesota, in Goodhue County. The city is situated on the banks of the Cannon River, and is part of the Twin Cities metropolitan area. The city is surrounded by rolling hills and farmland, and is located approximately 40 miles south of Minneapolis.
The climate in Kenyon is typical of the Midwest, with hot summers and cold winters. The average temperature in the summer is around 75 degrees Fahrenheit, and the average temperature in the winter is around 20 degrees Fahrenheit.
Economy
Kenyon’s economy is largely based on agriculture and manufacturing. The town is home to several large farms, which produce a variety of crops, including corn, soybeans, and wheat. The town is also home to several factories, which produce furniture, clothing, and other goods.
The town is also home to several small businesses, including restaurants, shops, and other services. The town is also home to several tourist attractions, including the Kenyon Historical Society Museum and the Kenyon Country Club.
Demographics
As of the 2010 census, Kenyon had a population of 2,500 people. The racial makeup of the town was 97.2% White, 0.8% African American, 0.4% Native American, 0.4% Asian, and 0.2% from other races. The median household income was $50,000, and the median age was 40.
Kenyon is a small, close-knit community, and is known for its friendly atmosphere. The town is home to several churches, and is a popular destination for tourists and outdoor enthusiasts. The town is also home to several parks and recreational areas, including the Kenyon Country Club and the Kenyon Historical Society Museum.
Common Questions
What is Per Capita Income in Kenyon?
Per Capita income in Kenyon is $30,841.
What is the Median Family Income in Kenyon?
Median Family Income in Kenyon is $80,268.
What is the Median Household income in Kenyon?
Median Household Income in Kenyon is $72,734.
What is Income or Wage Gap in Kenyon?
Income or Wage Gap in Kenyon is 39.6%.
Women in Kenyon earn 60.4 cents for every dollar earned by a man.
What is Inequality or Gini Index in Kenyon?
Inequality or Gini Index in Kenyon is 0.34.
What is the Total Population of Kenyon?
Total Population of Kenyon is 1,820.
What is the Total Male Population of Kenyon?
Total Male Population of Kenyon is 877.
What is the Total Female Population of Kenyon?
Total Female Population of Kenyon is 943.
What is the Ratio of Males per 100 Females in Kenyon?
There are 93.00 Males per 100 Females in Kenyon.
What is the Ratio of Females per 100 Males in Kenyon?
There are 107.53 Females per 100 Males in Kenyon.
What is the Median Population Age in Kenyon?
Median Population Age in Kenyon is 41.1 Years.
What is the Average Family Size in Kenyon
Average Family Size in Kenyon is 3.0 People.
What is the Average Household Size in Kenyon
Average Household Size in Kenyon is 2.3 People.
How Large is the Labor Force in Kenyon?
There are 906 People in the Labor Forcein in Kenyon.
What is the Percentage of People in the Labor Force in Kenyon?
62.6% of People are in the Labor Force in Kenyon.
What is the Unemployment Rate in Kenyon?
Unemployment Rate in Kenyon is 2.5%.