Kensington, MN Map & Demographics
Kensington Map
Kensington Overview
$30,120
PER CAPITA INCOME
$58,125
AVG FAMILY INCOME
$45,000
AVG HOUSEHOLD INCOME
48.7%
WAGE / INCOME GAP [ % ]
51.3¢/ $1
WAGE / INCOME GAP [ $ ]
0.37
INEQUALITY / GINI INDEX
226
TOTAL POPULATION
112
MALE POPULATION
114
FEMALE POPULATION
98.25
MALES / 100 FEMALES
101.79
FEMALES / 100 MALES
46.7
MEDIAN AGE
2.5
AVG FAMILY SIZE
2.0
AVG HOUSEHOLD SIZE
123
LABOR FORCE [ PEOPLE ]
64.7%
PERCENT IN LABOR FORCE
5.7%
UNEMPLOYMENT RATE
Kensington Zip Codes
Kensington Area Codes
Income in Kensington
Income Overview in Kensington
Per Capita Income in Kensington is $30,120, while median incomes of families and households are $58,125 and $45,000 respectively.
| Characteristic | Number | Measure |
| Per Capita Income | 226 | $30,120 |
| Median Family Income | 65 | $58,125 |
| Mean Family Income | 65 | $74,649 |
| Median Household Income | 114 | $45,000 |
| Mean Household Income | 114 | $58,739 |
| Income Deficit | 65 | $0 |
| Wage / Income Gap (%) | 226 | 48.68% |
| Wage / Income Gap ($) | 226 | 51.32¢ per $1 |
| Gini / Inequality Index | 226 | 0.37 |
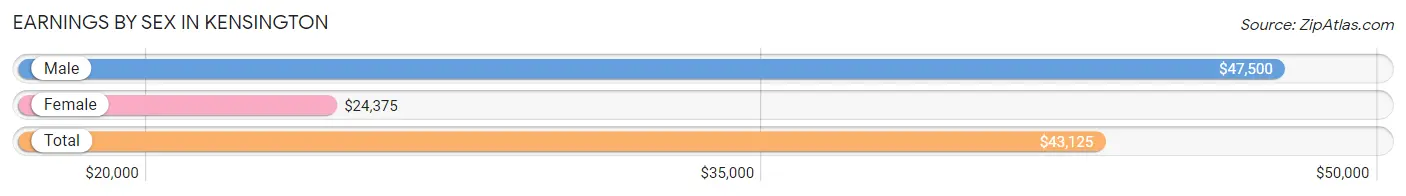
Earnings by Sex in Kensington
Average Earnings in Kensington are $43,125, $47,500 for men and $24,375 for women, a difference of 48.7%.
| Sex | Number | Average Earnings |
| Male | 66 (52.0%) | $47,500 |
| Female | 61 (48.0%) | $24,375 |
| Total | 127 (100.0%) | $43,125 |
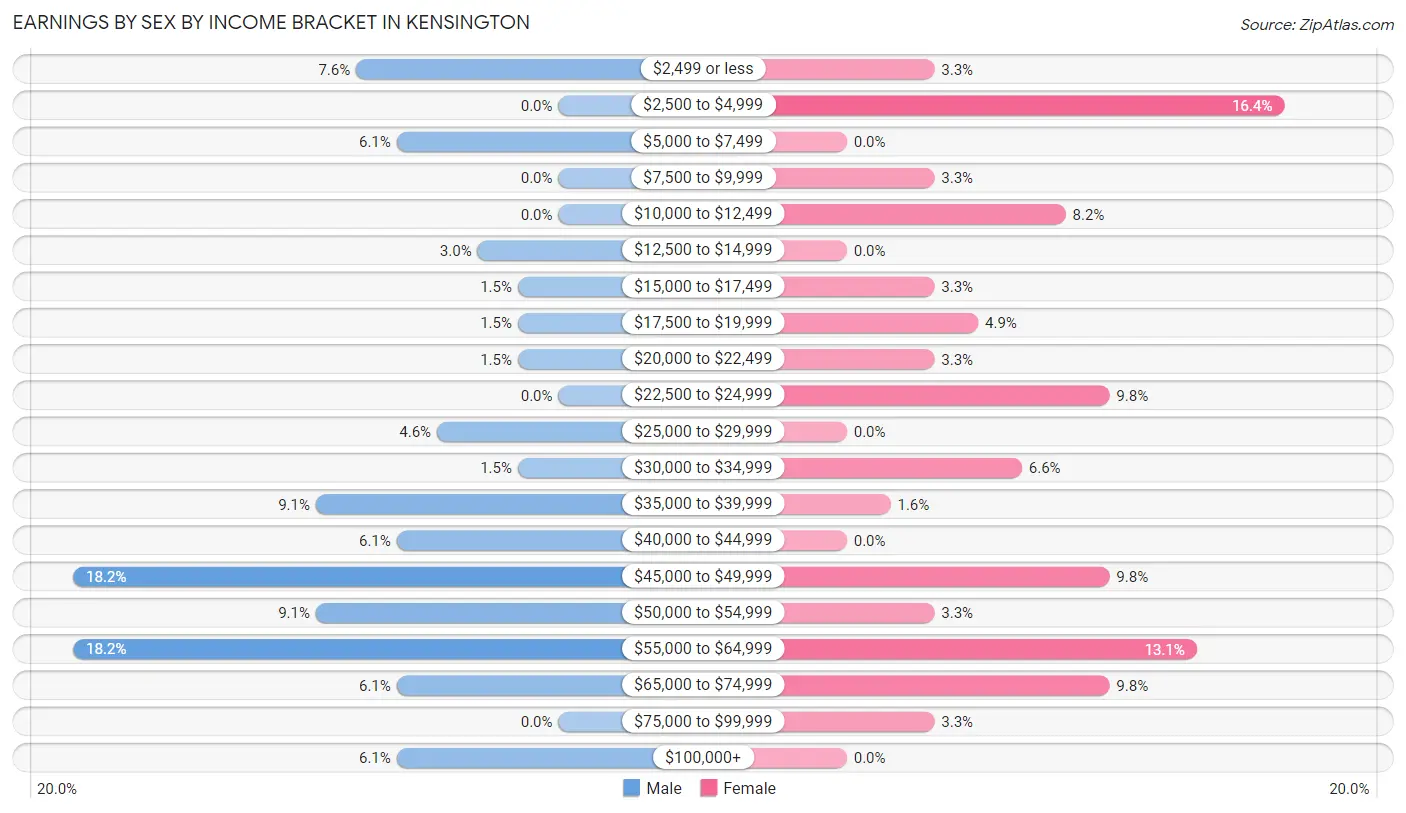
Earnings by Sex by Income Bracket in Kensington
The most common earnings brackets in Kensington are $45,000 to $49,999 for men (12 | 18.2%) and $2,500 to $4,999 for women (10 | 16.4%).
| Income | Male | Female |
| $2,499 or less | 5 (7.6%) | 2 (3.3%) |
| $2,500 to $4,999 | 0 (0.0%) | 10 (16.4%) |
| $5,000 to $7,499 | 4 (6.1%) | 0 (0.0%) |
| $7,500 to $9,999 | 0 (0.0%) | 2 (3.3%) |
| $10,000 to $12,499 | 0 (0.0%) | 5 (8.2%) |
| $12,500 to $14,999 | 2 (3.0%) | 0 (0.0%) |
| $15,000 to $17,499 | 1 (1.5%) | 2 (3.3%) |
| $17,500 to $19,999 | 1 (1.5%) | 3 (4.9%) |
| $20,000 to $22,499 | 1 (1.5%) | 2 (3.3%) |
| $22,500 to $24,999 | 0 (0.0%) | 6 (9.8%) |
| $25,000 to $29,999 | 3 (4.5%) | 0 (0.0%) |
| $30,000 to $34,999 | 1 (1.5%) | 4 (6.6%) |
| $35,000 to $39,999 | 6 (9.1%) | 1 (1.6%) |
| $40,000 to $44,999 | 4 (6.1%) | 0 (0.0%) |
| $45,000 to $49,999 | 12 (18.2%) | 6 (9.8%) |
| $50,000 to $54,999 | 6 (9.1%) | 2 (3.3%) |
| $55,000 to $64,999 | 12 (18.2%) | 8 (13.1%) |
| $65,000 to $74,999 | 4 (6.1%) | 6 (9.8%) |
| $75,000 to $99,999 | 0 (0.0%) | 2 (3.3%) |
| $100,000+ | 4 (6.1%) | 0 (0.0%) |
| Total | 66 (100.0%) | 61 (100.0%) |
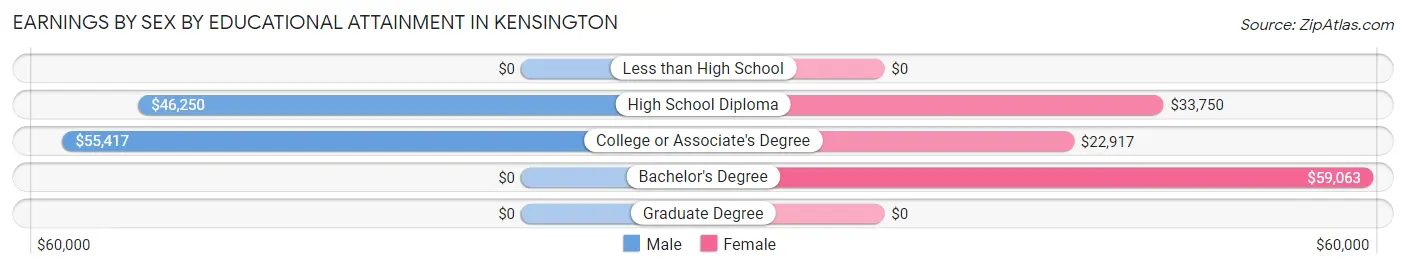
Earnings by Sex by Educational Attainment in Kensington
Average earnings in Kensington are $46,250 for men and $32,500 for women, a difference of 29.7%. Men with an educational attainment of college or associate's degree enjoy the highest average annual earnings of $55,417, while those with high school diploma education earn the least with $46,250. Women with an educational attainment of bachelor's degree earn the most with the average annual earnings of $59,063, while those with college or associate's degree education have the smallest earnings of $22,917.
| Educational Attainment | Male Income | Female Income |
| Less than High School | - | - |
| High School Diploma | $46,250 | $33,750 |
| College or Associate's Degree | $55,417 | $22,917 |
| Bachelor's Degree | - | - |
| Graduate Degree | - | - |
| Total | $46,250 | $32,500 |
Family Income in Kensington
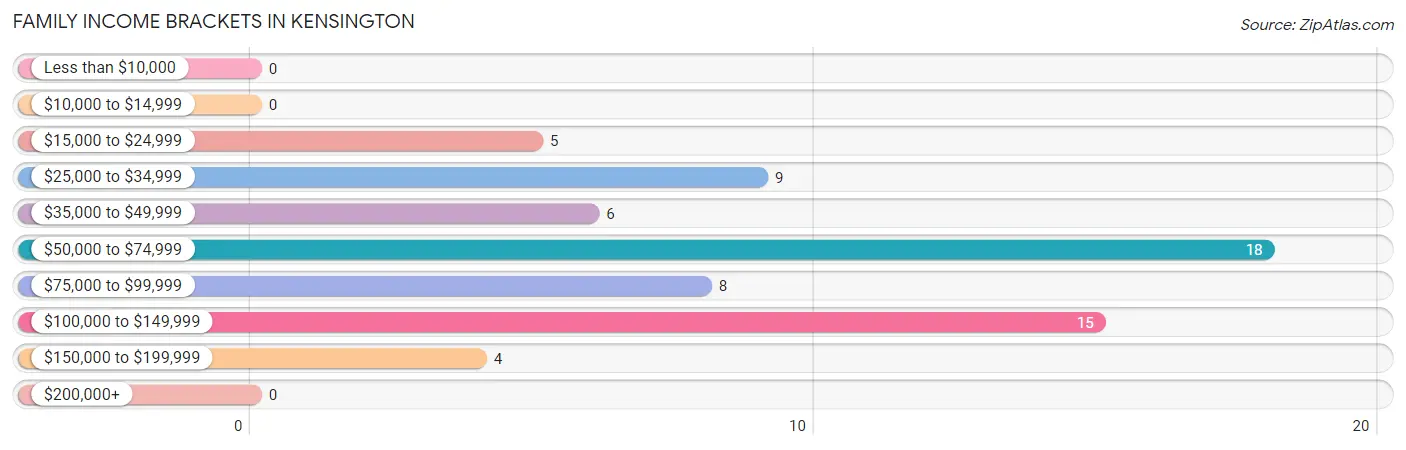
Family Income Brackets in Kensington
According to the Kensington family income data, there are 18 families falling into the $50,000 to $74,999 income range, which is the most common income bracket and makes up 27.7% of all families.
| Income Bracket | # Families | % Families |
| Less than $10,000 | 0 | 0.0% |
| $10,000 to $14,999 | 0 | 0.0% |
| $15,000 to $24,999 | 5 | 7.7% |
| $25,000 to $34,999 | 9 | 13.8% |
| $35,000 to $49,999 | 6 | 9.2% |
| $50,000 to $74,999 | 18 | 27.7% |
| $75,000 to $99,999 | 8 | 12.3% |
| $100,000 to $149,999 | 15 | 23.1% |
| $150,000 to $199,999 | 4 | 6.2% |
| $200,000+ | 0 | 0.0% |
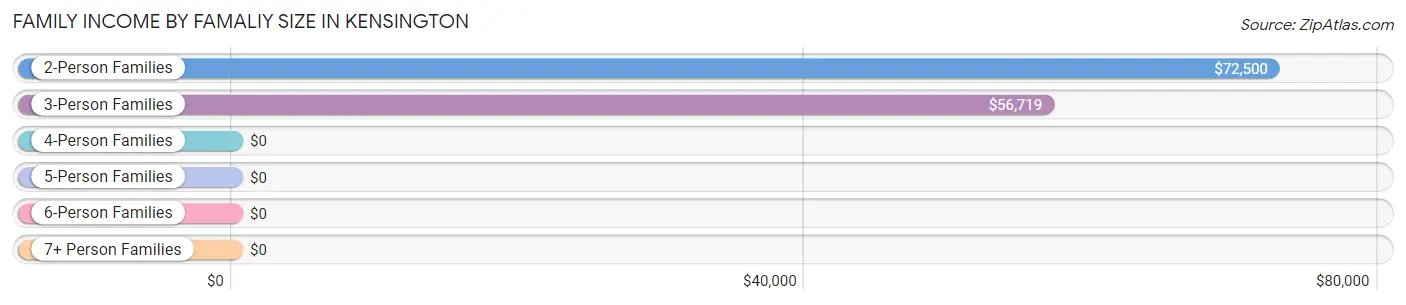
Family Income by Famaliy Size in Kensington
2-person families (40 | 61.5%) account for the highest median family income in Kensington with $72,500 per family, while 2-person families (40 | 61.5%) have the highest median income of $36,250 per family member.
| Income Bracket | # Families | Median Income |
| 2-Person Families | 40 (61.5%) | $72,500 |
| 3-Person Families | 15 (23.1%) | $56,719 |
| 4-Person Families | 9 (13.9%) | $0 |
| 5-Person Families | 1 (1.5%) | $0 |
| 6-Person Families | 0 (0.0%) | $0 |
| 7+ Person Families | 0 (0.0%) | $0 |
| Total | 65 (100.0%) | $58,125 |
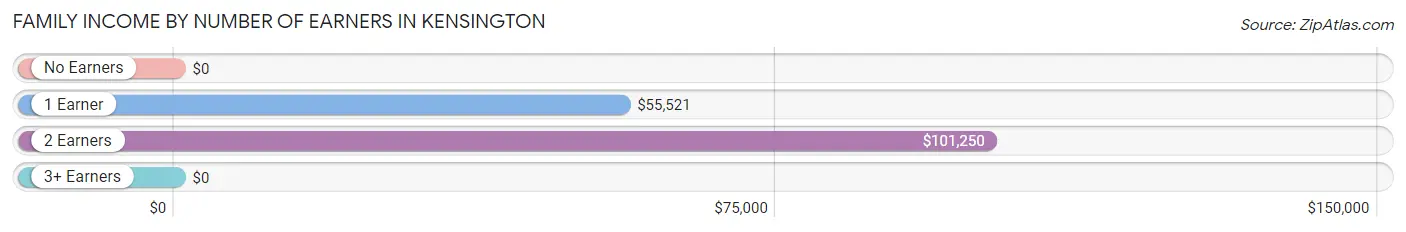
Family Income by Number of Earners in Kensington
| Number of Earners | # Families | Median Income |
| No Earners | 6 (9.2%) | $0 |
| 1 Earner | 27 (41.5%) | $55,521 |
| 2 Earners | 30 (46.2%) | $101,250 |
| 3+ Earners | 2 (3.1%) | $0 |
| Total | 65 (100.0%) | $58,125 |
Household Income in Kensington
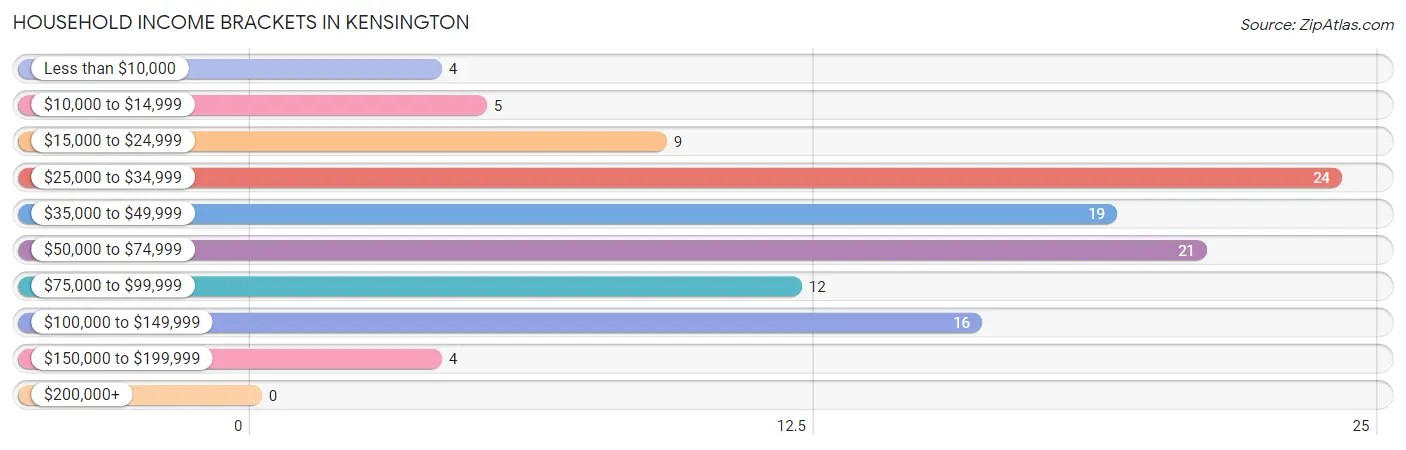
Household Income Brackets in Kensington
With 24 households falling in the category, the $25,000 to $34,999 income range is the most frequent in Kensington, accounting for 21.0% of all households.
| Income Bracket | # Households | % Households |
| Less than $10,000 | 4 | 3.5% |
| $10,000 to $14,999 | 5 | 4.4% |
| $15,000 to $24,999 | 9 | 7.9% |
| $25,000 to $34,999 | 24 | 21.1% |
| $35,000 to $49,999 | 19 | 16.7% |
| $50,000 to $74,999 | 21 | 18.4% |
| $75,000 to $99,999 | 12 | 10.5% |
| $100,000 to $149,999 | 16 | 14.0% |
| $150,000 to $199,999 | 4 | 3.5% |
| $200,000+ | 0 | 0.0% |
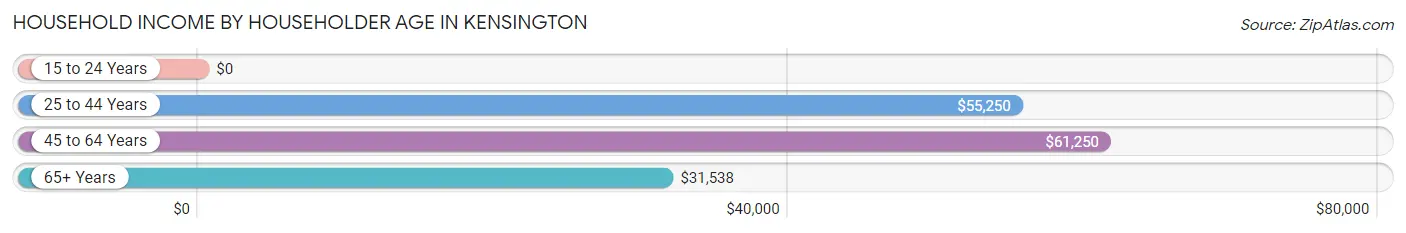
Household Income by Householder Age in Kensington
The median household income in Kensington is $45,000, with the highest median household income of $61,250 found in the 45 to 64 years age bracket for the primary householder. A total of 42 households (36.8%) fall into this category. Meanwhile, the 15 to 24 years age bracket for the primary householder has the lowest median household income of $0, with 7 households (6.1%) in this group.
| Income Bracket | # Households | Median Income |
| 15 to 24 Years | 7 (6.1%) | $0 |
| 25 to 44 Years | 29 (25.4%) | $55,250 |
| 45 to 64 Years | 42 (36.8%) | $61,250 |
| 65+ Years | 36 (31.6%) | $31,538 |
| Total | 114 (100.0%) | $45,000 |
Poverty in Kensington
Income Below Poverty by Sex and Age in Kensington
With 8.0% poverty level for males and 16.7% for females among the residents of Kensington, 65 to 74 year old males and 18 to 24 year old females are the most vulnerable to poverty, with 2 males (25.0%) and 7 females (77.8%) in their respective age groups living below the poverty level.
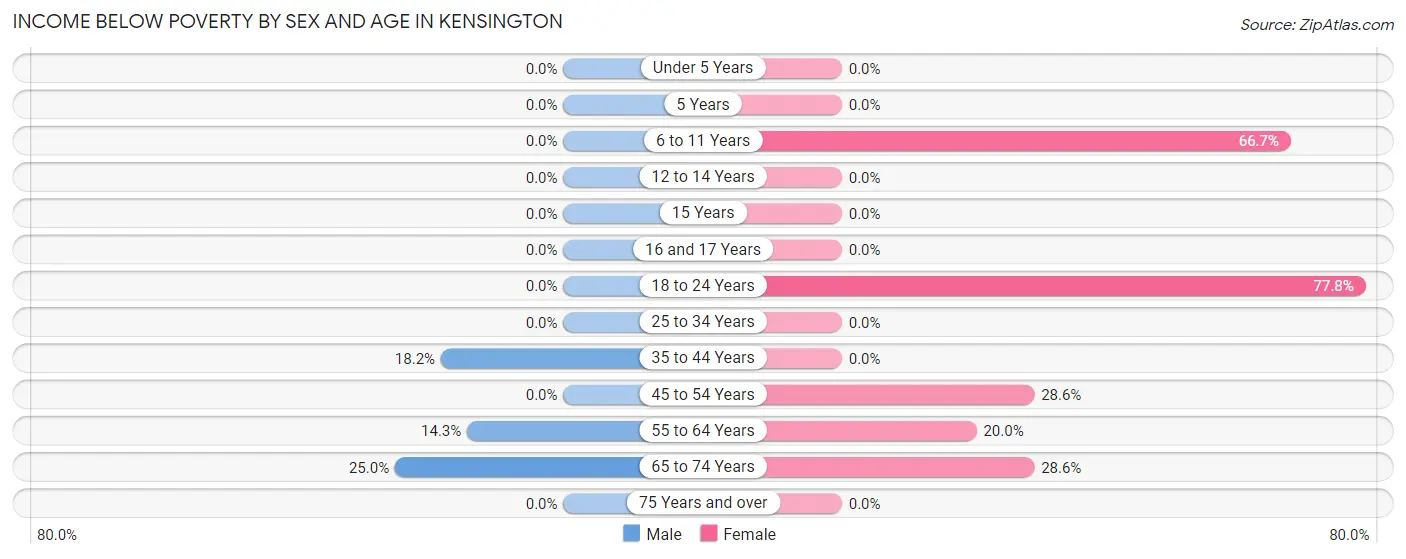
| Age Bracket | Male | Female |
| Under 5 Years | 0 (0.0%) | 0 (0.0%) |
| 5 Years | 0 (0.0%) | 0 (0.0%) |
| 6 to 11 Years | 0 (0.0%) | 2 (66.7%) |
| 12 to 14 Years | 0 (0.0%) | 0 (0.0%) |
| 15 Years | 0 (0.0%) | 0 (0.0%) |
| 16 and 17 Years | 0 (0.0%) | 0 (0.0%) |
| 18 to 24 Years | 0 (0.0%) | 7 (77.8%) |
| 25 to 34 Years | 0 (0.0%) | 0 (0.0%) |
| 35 to 44 Years | 2 (18.2%) | 0 (0.0%) |
| 45 to 54 Years | 0 (0.0%) | 2 (28.6%) |
| 55 to 64 Years | 5 (14.3%) | 4 (20.0%) |
| 65 to 74 Years | 2 (25.0%) | 4 (28.6%) |
| 75 Years and over | 0 (0.0%) | 0 (0.0%) |
| Total | 9 (8.0%) | 19 (16.7%) |
Income Above Poverty by Sex and Age in Kensington
According to the poverty statistics in Kensington, males aged under 5 years and females aged 5 years are the age groups that are most secure financially, with 100.0% of males and 100.0% of females in these age groups living above the poverty line.
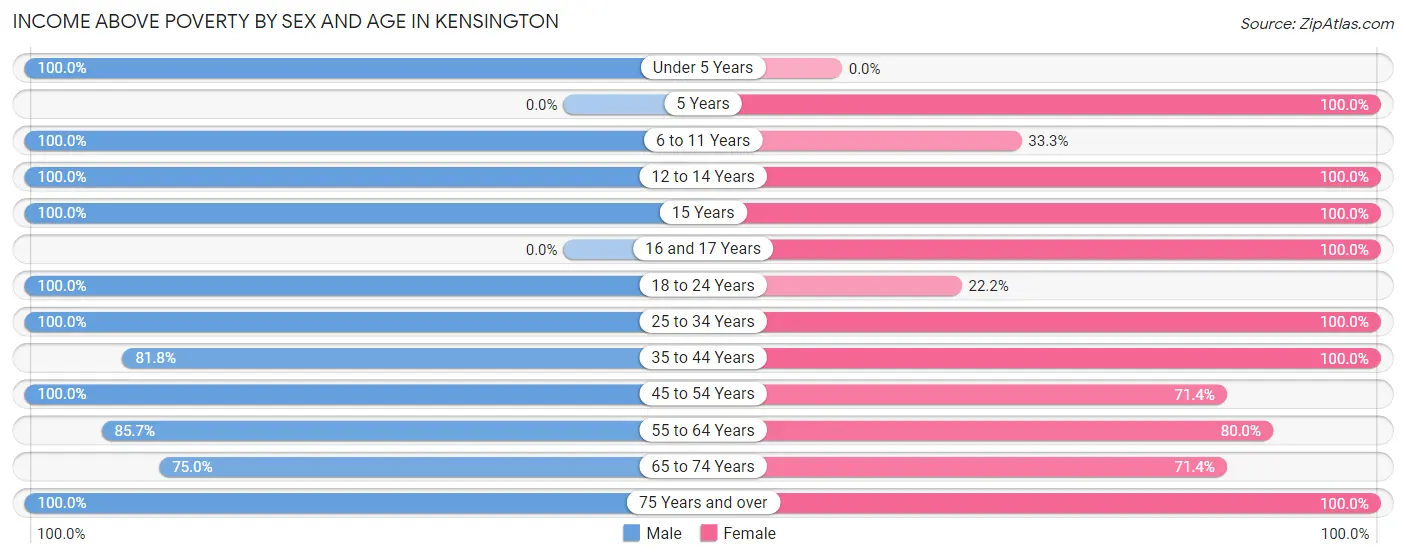
| Age Bracket | Male | Female |
| Under 5 Years | 6 (100.0%) | 0 (0.0%) |
| 5 Years | 0 (0.0%) | 5 (100.0%) |
| 6 to 11 Years | 3 (100.0%) | 1 (33.3%) |
| 12 to 14 Years | 2 (100.0%) | 10 (100.0%) |
| 15 Years | 5 (100.0%) | 2 (100.0%) |
| 16 and 17 Years | 0 (0.0%) | 2 (100.0%) |
| 18 to 24 Years | 9 (100.0%) | 2 (22.2%) |
| 25 to 34 Years | 17 (100.0%) | 13 (100.0%) |
| 35 to 44 Years | 9 (81.8%) | 10 (100.0%) |
| 45 to 54 Years | 10 (100.0%) | 5 (71.4%) |
| 55 to 64 Years | 30 (85.7%) | 16 (80.0%) |
| 65 to 74 Years | 6 (75.0%) | 10 (71.4%) |
| 75 Years and over | 6 (100.0%) | 19 (100.0%) |
| Total | 103 (92.0%) | 95 (83.3%) |
Income Below Poverty Among Married-Couple Families in Kensington
The poverty statistics for married-couple families in Kensington show that 6.8% or 3 of the total 44 families live below the poverty line. Families with no children have the highest poverty rate of 8.8%, comprising of 3 families. On the other hand, families with 1 or 2 children have the lowest poverty rate of 0.0%, which includes 0 families.
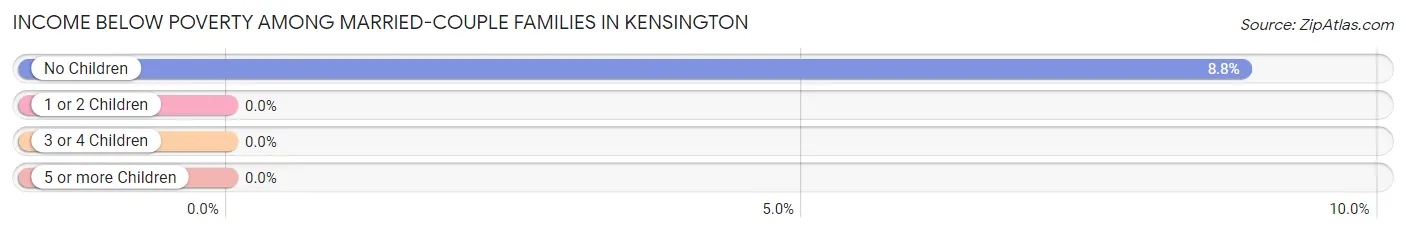
| Children | Above Poverty | Below Poverty |
| No Children | 31 (91.2%) | 3 (8.8%) |
| 1 or 2 Children | 9 (100.0%) | 0 (0.0%) |
| 3 or 4 Children | 1 (100.0%) | 0 (0.0%) |
| 5 or more Children | 0 (0.0%) | 0 (0.0%) |
| Total | 41 (93.2%) | 3 (6.8%) |
Income Below Poverty Among Single-Parent Households in Kensington
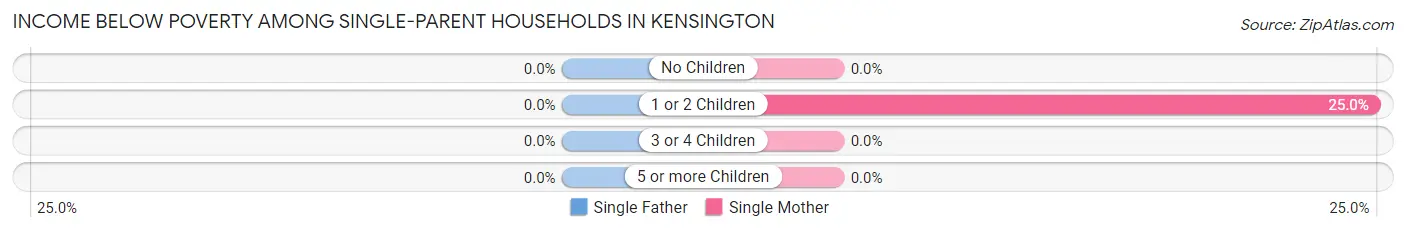
| Children | Single Father | Single Mother |
| No Children | 0 (0.0%) | 0 (0.0%) |
| 1 or 2 Children | 0 (0.0%) | 2 (25.0%) |
| 3 or 4 Children | 0 (0.0%) | 0 (0.0%) |
| 5 or more Children | 0 (0.0%) | 0 (0.0%) |
| Total | 0 (0.0%) | 2 (16.7%) |
Income Below Poverty Among Married-Couple vs Single-Parent Households in Kensington
The poverty data for Kensington shows that 3 of the married-couple family households (6.8%) and 2 of the single-parent households (9.5%) are living below the poverty level. Within the married-couple family households, those with no children have the highest poverty rate, with 3 households (8.8%) falling below the poverty line. Among the single-parent households, those with 1 or 2 children have the highest poverty rate, with 2 household (13.3%) living below poverty.
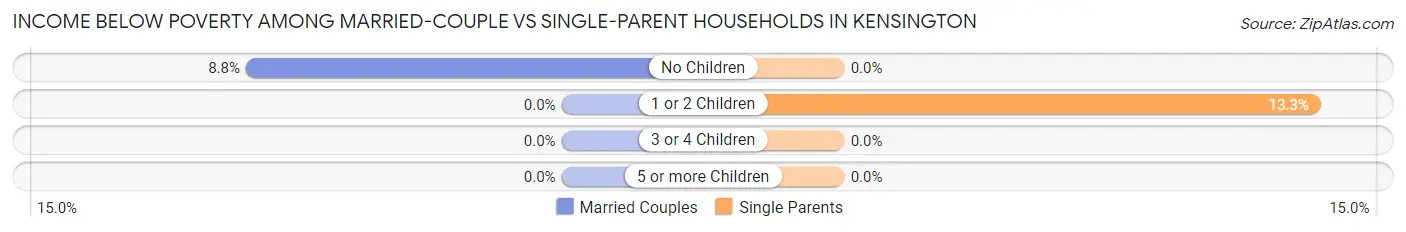
| Children | Married-Couple Families | Single-Parent Households |
| No Children | 3 (8.8%) | 0 (0.0%) |
| 1 or 2 Children | 0 (0.0%) | 2 (13.3%) |
| 3 or 4 Children | 0 (0.0%) | 0 (0.0%) |
| 5 or more Children | 0 (0.0%) | 0 (0.0%) |
| Total | 3 (6.8%) | 2 (9.5%) |
Race in Kensington
The most populous races in Kensington are White / Caucasian (218 | 96.5%), Two or more Races (8 | 3.5%), and Hispanic or Latino (4 | 1.8%).
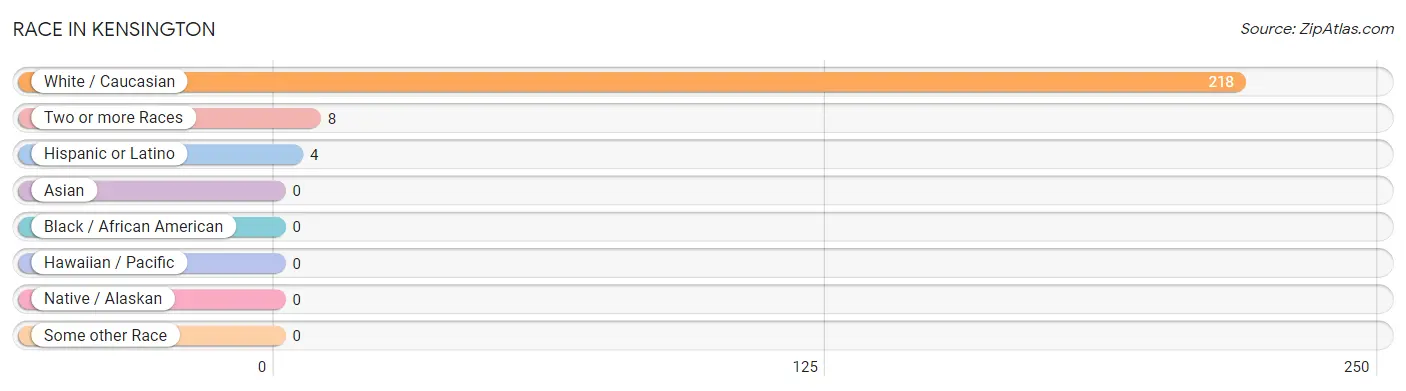
| Race | # Population | % Population |
| Asian | 0 | 0.0% |
| Black / African American | 0 | 0.0% |
| Hawaiian / Pacific | 0 | 0.0% |
| Hispanic or Latino | 4 | 1.8% |
| Native / Alaskan | 0 | 0.0% |
| White / Caucasian | 218 | 96.5% |
| Two or more Races | 8 | 3.5% |
| Some other Race | 0 | 0.0% |
| Total | 226 | 100.0% |
Ancestry in Kensington
The most populous ancestries reported in Kensington are German (103 | 45.6%), Norwegian (89 | 39.4%), Swedish (28 | 12.4%), Polish (22 | 9.7%), and Finnish (17 | 7.5%), together accounting for 114.6% of all Kensington residents.
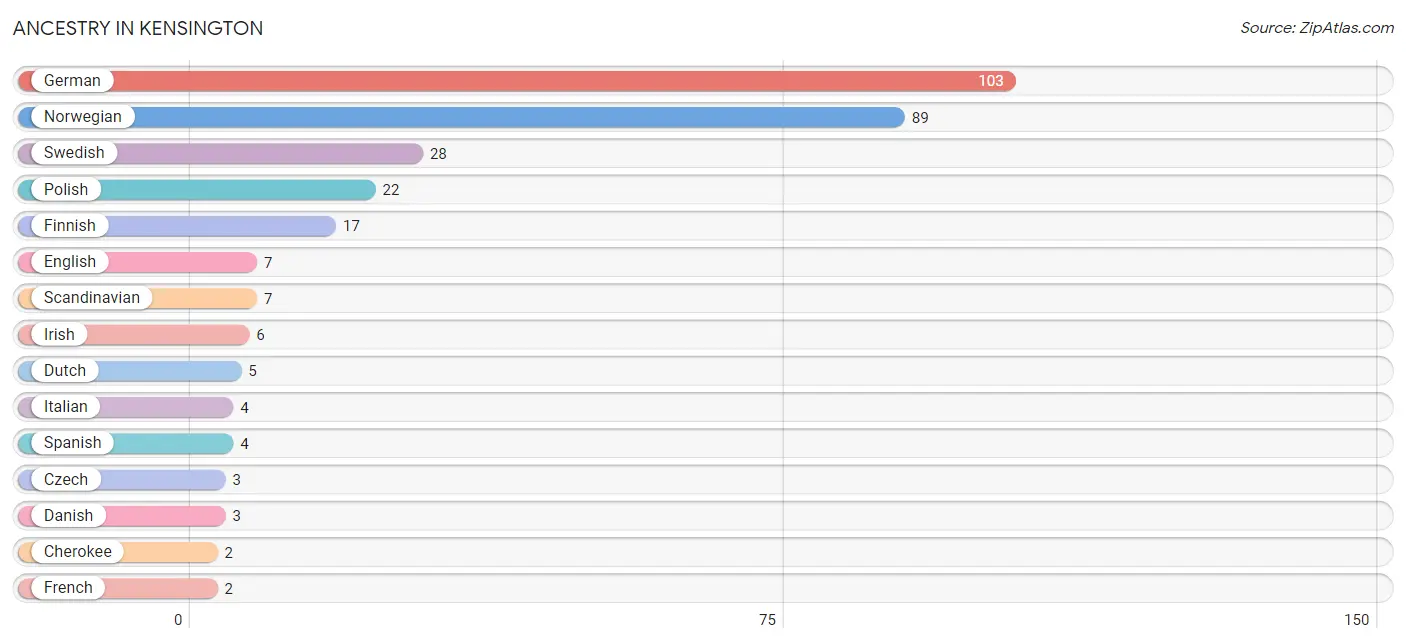
| Ancestry | # Population | % Population |
| Cherokee | 2 | 0.9% |
| Czech | 3 | 1.3% |
| Danish | 3 | 1.3% |
| Dutch | 5 | 2.2% |
| English | 7 | 3.1% |
| Finnish | 17 | 7.5% |
| French | 2 | 0.9% |
| German | 103 | 45.6% |
| Irish | 6 | 2.6% |
| Italian | 4 | 1.8% |
| Northern European | 2 | 0.9% |
| Norwegian | 89 | 39.4% |
| Polish | 22 | 9.7% |
| Scandinavian | 7 | 3.1% |
| Slovak | 2 | 0.9% |
| Spanish | 4 | 1.8% |
| Swedish | 28 | 12.4% | View All 17 Rows |
Immigrants in Kensington

| Immigration Origin | # Population | % Population | View All 0 Rows |
Sex and Age in Kensington
Sex and Age in Kensington
The most populous age groups in Kensington are 60 to 64 Years (19 | 17.0%) for men and 55 to 59 Years (15 | 13.2%) for women.
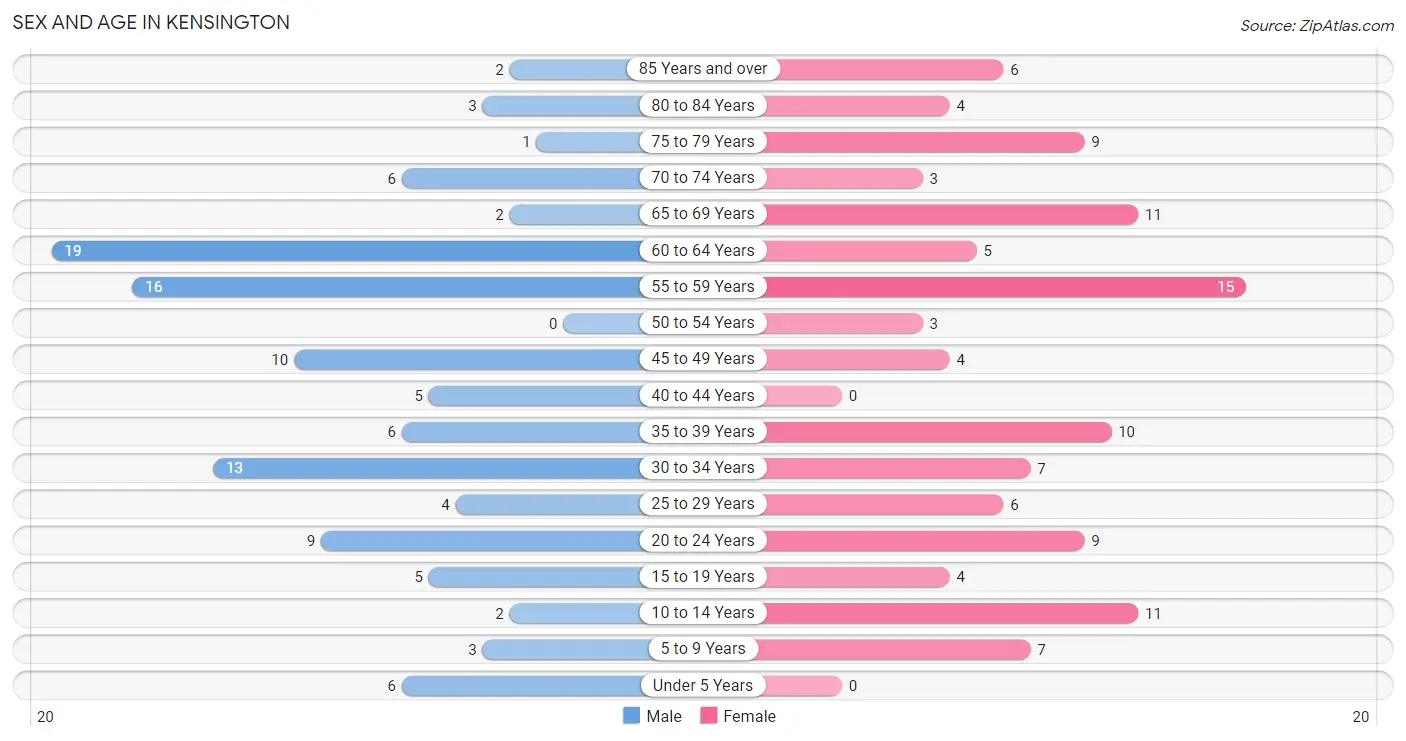
| Age Bracket | Male | Female |
| Under 5 Years | 6 (5.4%) | 0 (0.0%) |
| 5 to 9 Years | 3 (2.7%) | 7 (6.1%) |
| 10 to 14 Years | 2 (1.8%) | 11 (9.7%) |
| 15 to 19 Years | 5 (4.5%) | 4 (3.5%) |
| 20 to 24 Years | 9 (8.0%) | 9 (7.9%) |
| 25 to 29 Years | 4 (3.6%) | 6 (5.3%) |
| 30 to 34 Years | 13 (11.6%) | 7 (6.1%) |
| 35 to 39 Years | 6 (5.4%) | 10 (8.8%) |
| 40 to 44 Years | 5 (4.5%) | 0 (0.0%) |
| 45 to 49 Years | 10 (8.9%) | 4 (3.5%) |
| 50 to 54 Years | 0 (0.0%) | 3 (2.6%) |
| 55 to 59 Years | 16 (14.3%) | 15 (13.2%) |
| 60 to 64 Years | 19 (17.0%) | 5 (4.4%) |
| 65 to 69 Years | 2 (1.8%) | 11 (9.7%) |
| 70 to 74 Years | 6 (5.4%) | 3 (2.6%) |
| 75 to 79 Years | 1 (0.9%) | 9 (7.9%) |
| 80 to 84 Years | 3 (2.7%) | 4 (3.5%) |
| 85 Years and over | 2 (1.8%) | 6 (5.3%) |
| Total | 112 (100.0%) | 114 (100.0%) |
Families and Households in Kensington
Median Family Size in Kensington
The median family size in Kensington is 2.46 persons per family, with married-couple families (44 | 67.7%) accounting for the largest median family size of 2.59 persons per family. On the other hand, single female/mother families (12 | 18.5%) represent the smallest median family size with 2.17 persons per family.
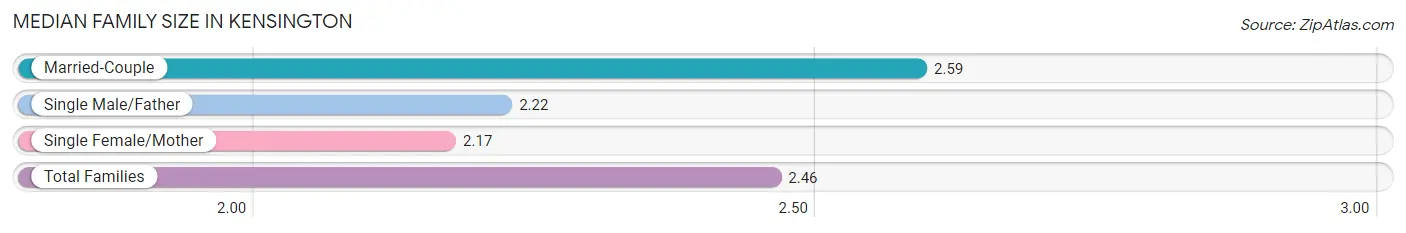
| Family Type | # Families | Family Size |
| Married-Couple | 44 (67.7%) | 2.59 |
| Single Male/Father | 9 (13.9%) | 2.22 |
| Single Female/Mother | 12 (18.5%) | 2.17 |
| Total Families | 65 (100.0%) | 2.46 |
Median Household Size in Kensington
The median household size in Kensington is 1.98 persons per household, with single male/father households (9 | 7.9%) accounting for the largest median household size of 3 persons per household. non-family households (49 | 43.0%) represent the smallest median household size with 1.16 persons per household.
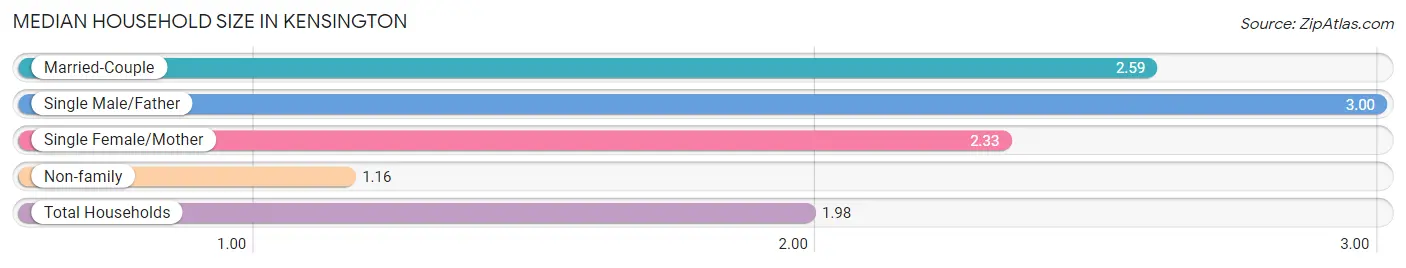
| Household Type | # Households | Household Size |
| Married-Couple | 44 (38.6%) | 2.59 |
| Single Male/Father | 9 (7.9%) | 3.00 |
| Single Female/Mother | 12 (10.5%) | 2.33 |
| Non-family | 49 (43.0%) | 1.16 |
| Total Households | 114 (100.0%) | 1.98 |
Household Size by Marriage Status in Kensington
Out of a total of 114 households in Kensington, 65 (57.0%) are family households, while 49 (43.0%) are nonfamily households. The most numerous type of family households are 2-person households, comprising 38, and the most common type of nonfamily households are 1-person households, comprising 43.
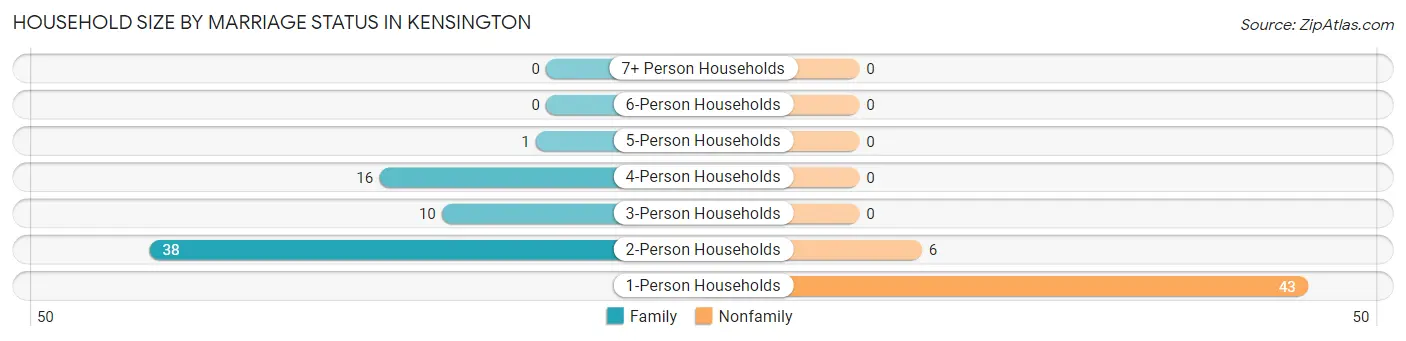
| Household Size | Family Households | Nonfamily Households |
| 1-Person Households | - | 43 (37.7%) |
| 2-Person Households | 38 (33.3%) | 6 (5.3%) |
| 3-Person Households | 10 (8.8%) | 0 (0.0%) |
| 4-Person Households | 16 (14.0%) | 0 (0.0%) |
| 5-Person Households | 1 (0.9%) | 0 (0.0%) |
| 6-Person Households | 0 (0.0%) | 0 (0.0%) |
| 7+ Person Households | 0 (0.0%) | 0 (0.0%) |
| Total | 65 (57.0%) | 49 (43.0%) |
Female Fertility in Kensington
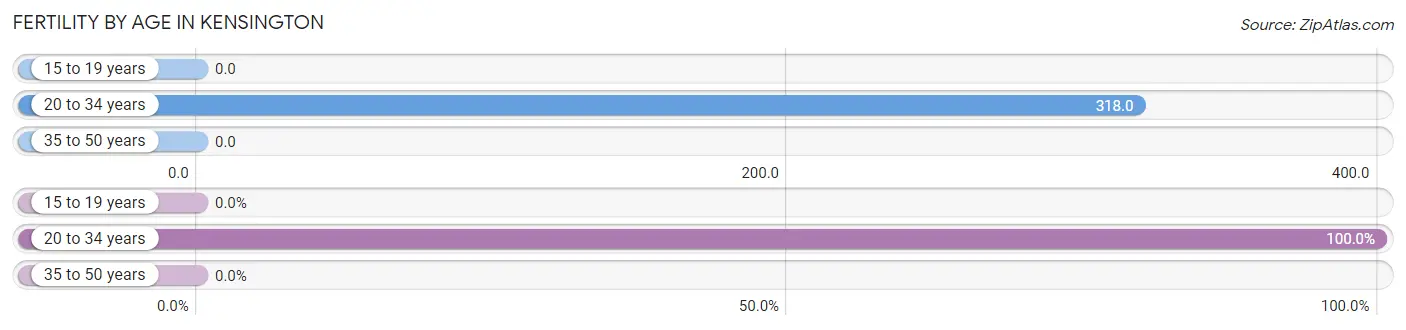
Fertility by Age in Kensington
Average fertility rate in Kensington is 175.0 births per 1,000 women. Women in the age bracket of 20 to 34 years have the highest fertility rate with 318.0 births per 1,000 women. Women in the age bracket of 20 to 34 years acount for 100.0% of all women with births.
| Age Bracket | Women with Births | Births / 1,000 Women |
| 15 to 19 years | 0 (0.0%) | 0.0 |
| 20 to 34 years | 7 (100.0%) | 318.0 |
| 35 to 50 years | 0 (0.0%) | 0.0 |
| Total | 7 (100.0%) | 175.0 |
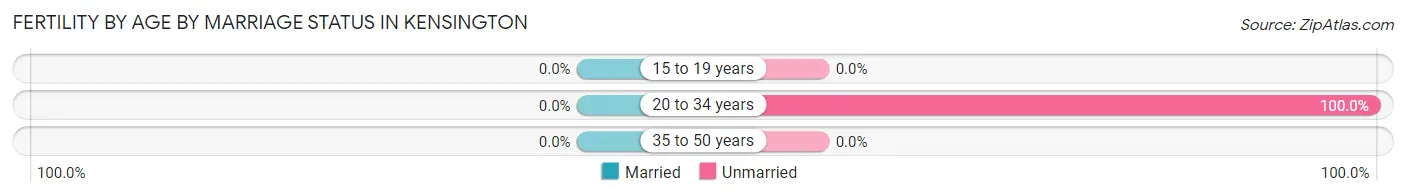
Fertility by Age by Marriage Status in Kensington
| Age Bracket | Married | Unmarried |
| 15 to 19 years | 0 (0.0%) | 0 (0.0%) |
| 20 to 34 years | 0 (0.0%) | 7 (100.0%) |
| 35 to 50 years | 0 (0.0%) | 0 (0.0%) |
| Total | 0 (0.0%) | 7 (100.0%) |
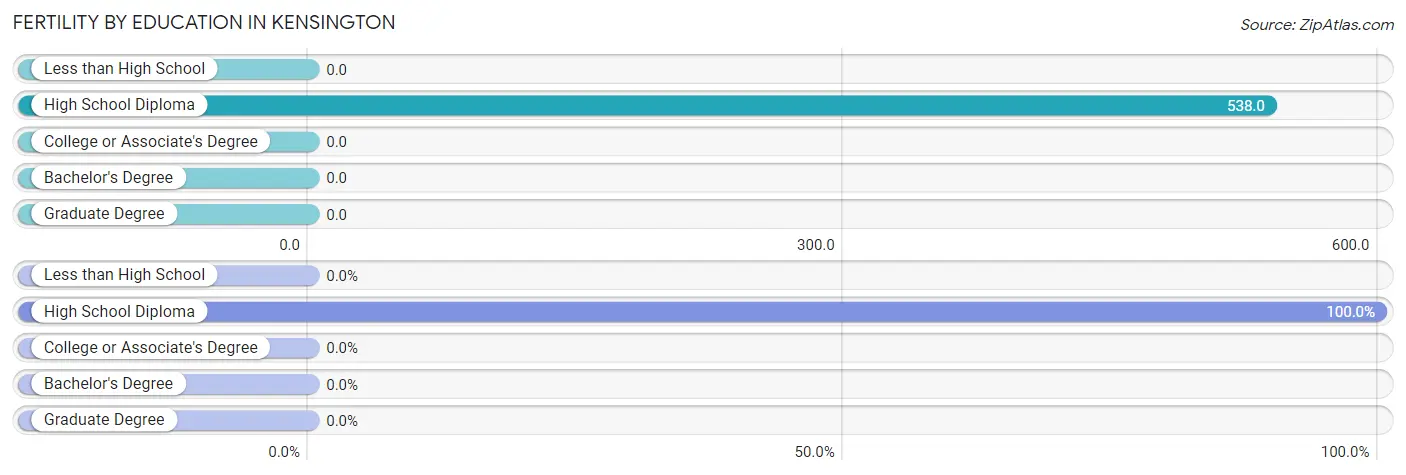
Fertility by Education in Kensington
| Educational Attainment | Women with Births | Births / 1,000 Women |
| Less than High School | 0 (0.0%) | 0.0 |
| High School Diploma | 7 (100.0%) | 538.0 |
| College or Associate's Degree | 0 (0.0%) | 0.0 |
| Bachelor's Degree | 0 (0.0%) | 0.0 |
| Graduate Degree | 0 (0.0%) | 0.0 |
| Total | 7 (100.0%) | 175.0 |
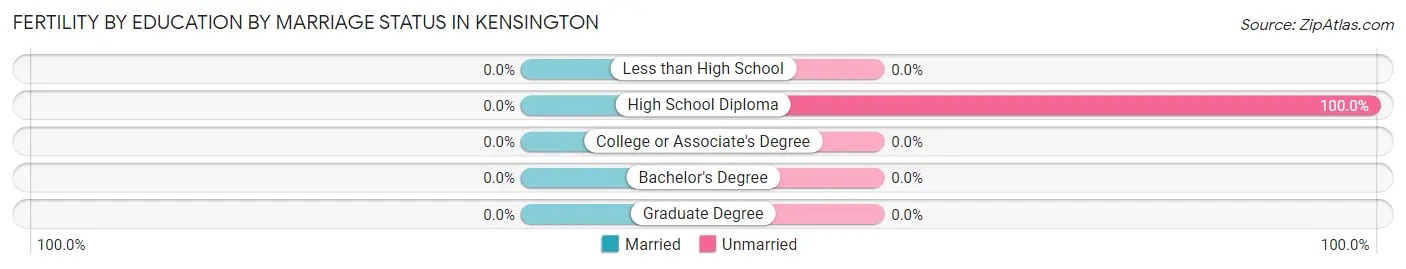
Fertility by Education by Marriage Status in Kensington
| Educational Attainment | Married | Unmarried |
| Less than High School | 0 (0.0%) | 0 (0.0%) |
| High School Diploma | 0 (0.0%) | 7 (100.0%) |
| College or Associate's Degree | 0 (0.0%) | 0 (0.0%) |
| Bachelor's Degree | 0 (0.0%) | 0 (0.0%) |
| Graduate Degree | 0 (0.0%) | 0 (0.0%) |
| Total | 0 (0.0%) | 7 (100.0%) |
Employment Characteristics in Kensington
Employment by Class of Employer in Kensington
Among the 115 employed individuals in Kensington, private company employees (85 | 73.9%), self-employed (not incorporated) (12 | 10.4%), and not-for-profit organizations (7 | 6.1%) make up the most common classes of employment.
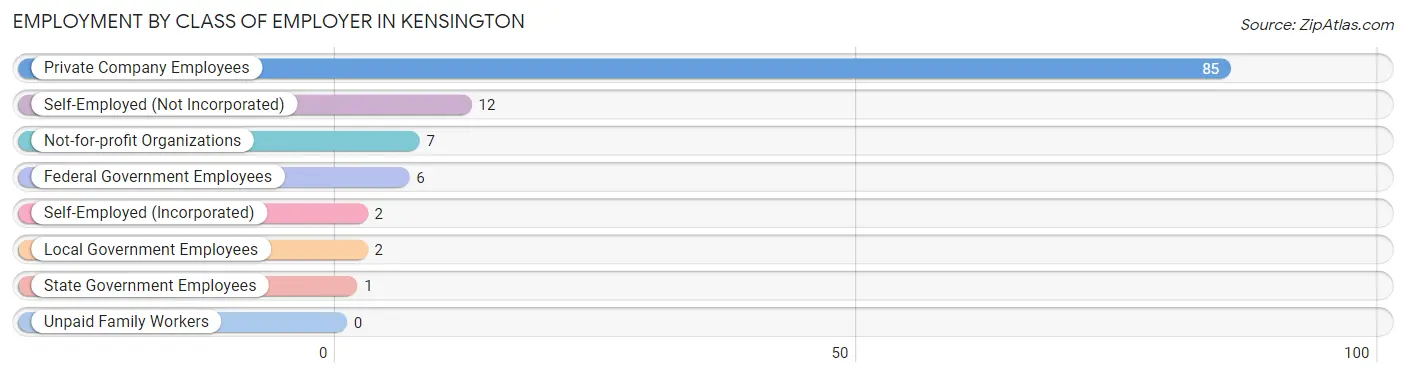
| Employer Class | # Employees | % Employees |
| Private Company Employees | 85 | 73.9% |
| Self-Employed (Incorporated) | 2 | 1.7% |
| Self-Employed (Not Incorporated) | 12 | 10.4% |
| Not-for-profit Organizations | 7 | 6.1% |
| Local Government Employees | 2 | 1.7% |
| State Government Employees | 1 | 0.9% |
| Federal Government Employees | 6 | 5.2% |
| Unpaid Family Workers | 0 | 0.0% |
| Total | 115 | 100.0% |
Employment Status by Age in Kensington
According to the labor force statistics for Kensington, out of the total population over 16 years of age (190), 64.7% or 123 individuals are in the labor force, with 5.7% or 7 of them unemployed. The age group with the highest labor force participation rate is 20 to 24 years, with 100.0% or 18 individuals in the labor force. Within the labor force, the 20 to 24 years age range has the highest percentage of unemployed individuals, with 38.9% or 7 of them being unemployed.
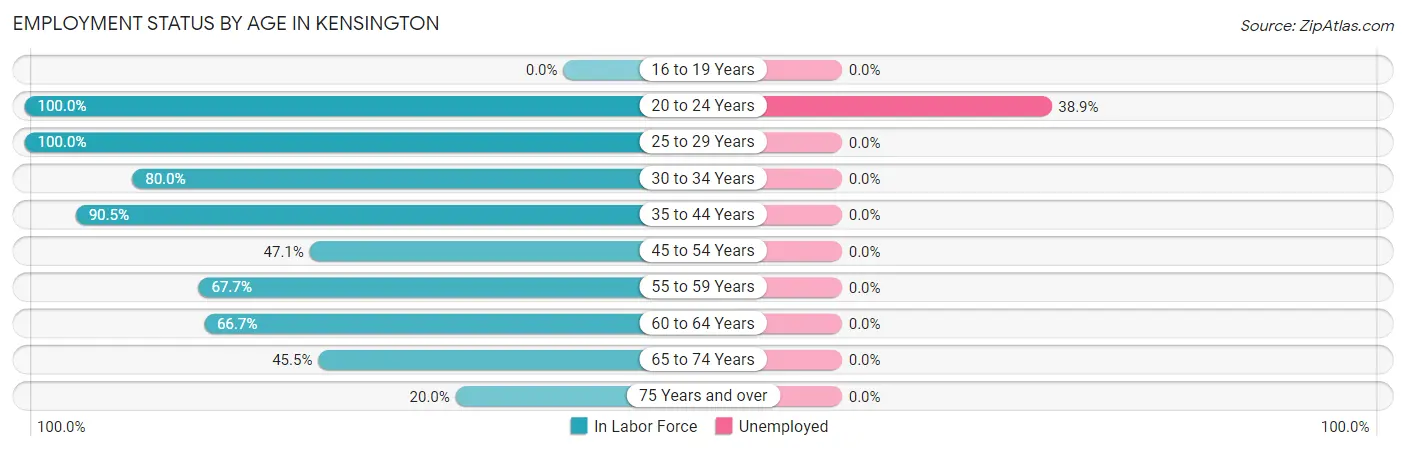
| Age Bracket | In Labor Force | Unemployed |
| 16 to 19 Years | 0 (0.0%) | 0 (0.0%) |
| 20 to 24 Years | 18 (100.0%) | 7 (38.9%) |
| 25 to 29 Years | 10 (100.0%) | 0 (0.0%) |
| 30 to 34 Years | 16 (80.0%) | 0 (0.0%) |
| 35 to 44 Years | 19 (90.5%) | 0 (0.0%) |
| 45 to 54 Years | 8 (47.1%) | 0 (0.0%) |
| 55 to 59 Years | 21 (67.7%) | 0 (0.0%) |
| 60 to 64 Years | 16 (66.7%) | 0 (0.0%) |
| 65 to 74 Years | 10 (45.5%) | 0 (0.0%) |
| 75 Years and over | 5 (20.0%) | 0 (0.0%) |
| Total | 123 (64.7%) | 7 (5.7%) |
Employment Status by Educational Attainment in Kensington
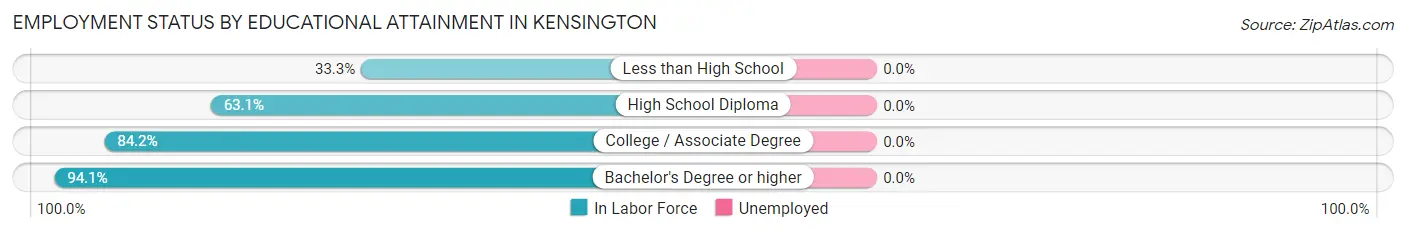
| Educational Attainment | In Labor Force | Unemployed |
| Less than High School | 1 (33.3%) | 0 (0.0%) |
| High School Diploma | 41 (63.1%) | 0 (0.0%) |
| College / Associate Degree | 32 (84.2%) | 0 (0.0%) |
| Bachelor's Degree or higher | 16 (94.1%) | 0 (0.0%) |
| Total | 90 (73.2%) | 0 (0.0%) |
Employment Occupations by Sex in Kensington
Management, Business, Science and Arts Occupations
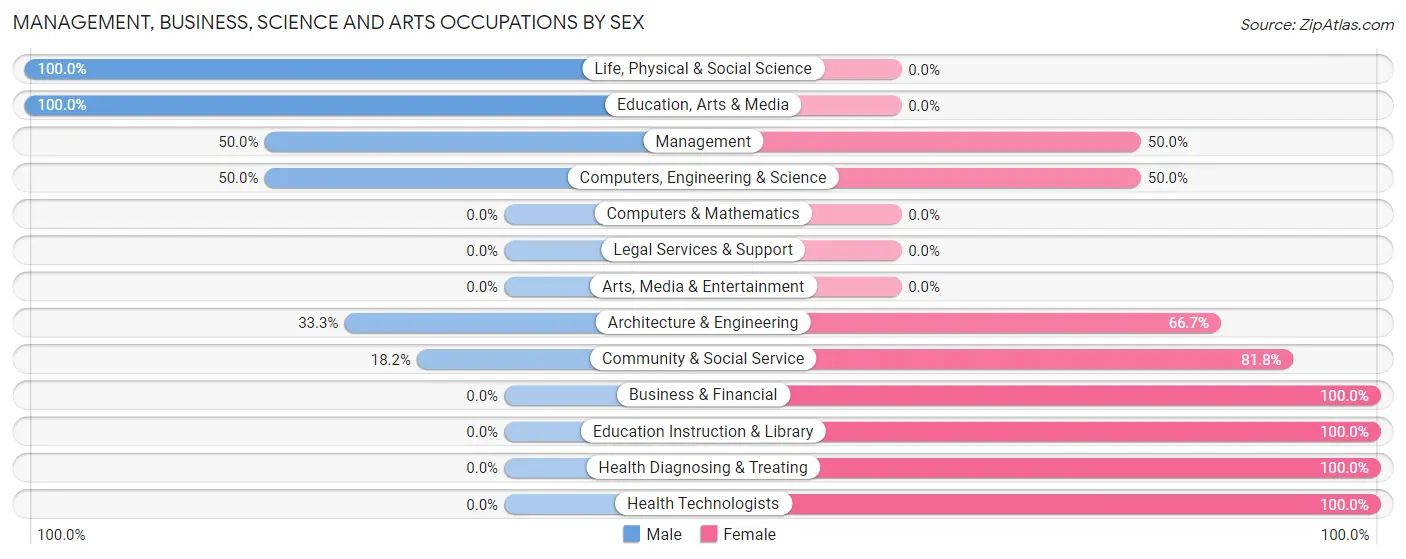
The most common Management, Business, Science and Arts occupations in Kensington are Community & Social Service (11 | 9.5%), Health Diagnosing & Treating (11 | 9.5%), Health Technologists (11 | 9.5%), Education Instruction & Library (9 | 7.8%), and Management (4 | 3.5%).
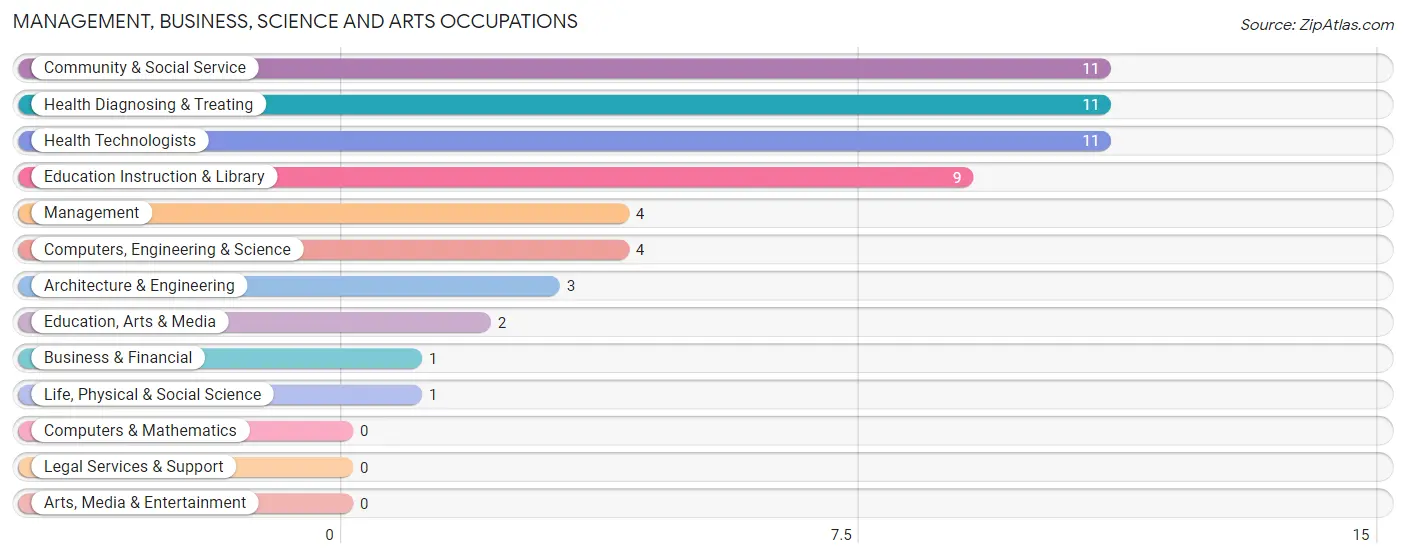
Management, Business, Science and Arts Occupations by Sex
Within the Management, Business, Science and Arts occupations in Kensington, the most male-oriented occupations are Life, Physical & Social Science (100.0%), Education, Arts & Media (100.0%), and Management (50.0%), while the most female-oriented occupations are Business & Financial (100.0%), Education Instruction & Library (100.0%), and Health Diagnosing & Treating (100.0%).
| Occupation | Male | Female |
| Management | 2 (50.0%) | 2 (50.0%) |
| Business & Financial | 0 (0.0%) | 1 (100.0%) |
| Computers, Engineering & Science | 2 (50.0%) | 2 (50.0%) |
| Computers & Mathematics | 0 (0.0%) | 0 (0.0%) |
| Architecture & Engineering | 1 (33.3%) | 2 (66.7%) |
| Life, Physical & Social Science | 1 (100.0%) | 0 (0.0%) |
| Community & Social Service | 2 (18.2%) | 9 (81.8%) |
| Education, Arts & Media | 2 (100.0%) | 0 (0.0%) |
| Legal Services & Support | 0 (0.0%) | 0 (0.0%) |
| Education Instruction & Library | 0 (0.0%) | 9 (100.0%) |
| Arts, Media & Entertainment | 0 (0.0%) | 0 (0.0%) |
| Health Diagnosing & Treating | 0 (0.0%) | 11 (100.0%) |
| Health Technologists | 0 (0.0%) | 11 (100.0%) |
| Total (Category) | 6 (19.4%) | 25 (80.6%) |
| Total (Overall) | 58 (50.0%) | 58 (50.0%) |
Services Occupations
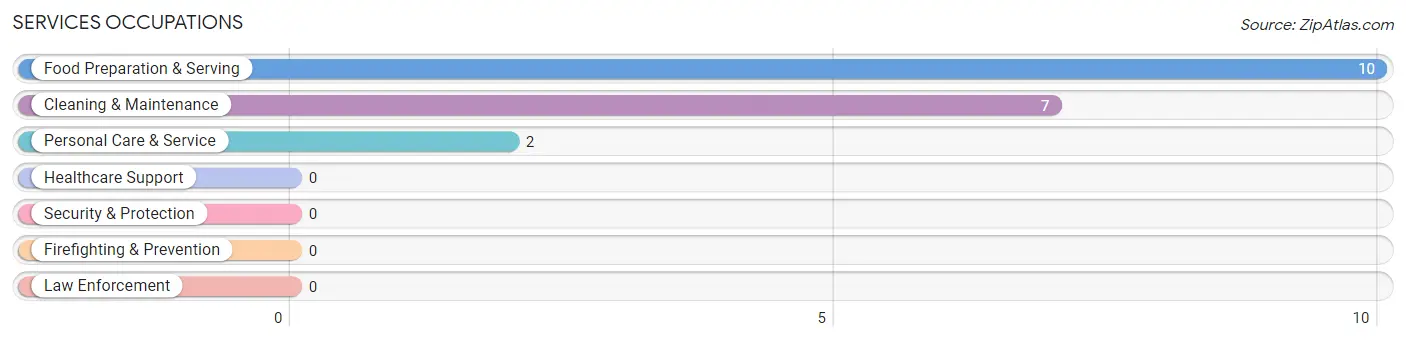
The most common Services occupations in Kensington are Food Preparation & Serving (10 | 8.6%), Cleaning & Maintenance (7 | 6.0%), and Personal Care & Service (2 | 1.7%).
Services Occupations by Sex
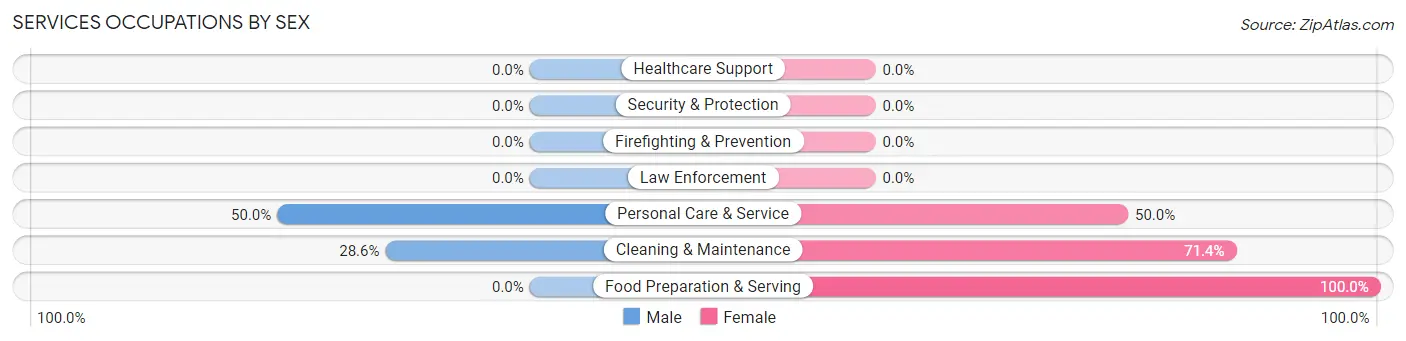
Within the Services occupations in Kensington, the most male-oriented occupations are Personal Care & Service (50.0%), and Cleaning & Maintenance (28.6%), while the most female-oriented occupations are Food Preparation & Serving (100.0%), Cleaning & Maintenance (71.4%), and Personal Care & Service (50.0%).
| Occupation | Male | Female |
| Healthcare Support | 0 (0.0%) | 0 (0.0%) |
| Security & Protection | 0 (0.0%) | 0 (0.0%) |
| Firefighting & Prevention | 0 (0.0%) | 0 (0.0%) |
| Law Enforcement | 0 (0.0%) | 0 (0.0%) |
| Food Preparation & Serving | 0 (0.0%) | 10 (100.0%) |
| Cleaning & Maintenance | 2 (28.6%) | 5 (71.4%) |
| Personal Care & Service | 1 (50.0%) | 1 (50.0%) |
| Total (Category) | 3 (15.8%) | 16 (84.2%) |
| Total (Overall) | 58 (50.0%) | 58 (50.0%) |
Sales and Office Occupations
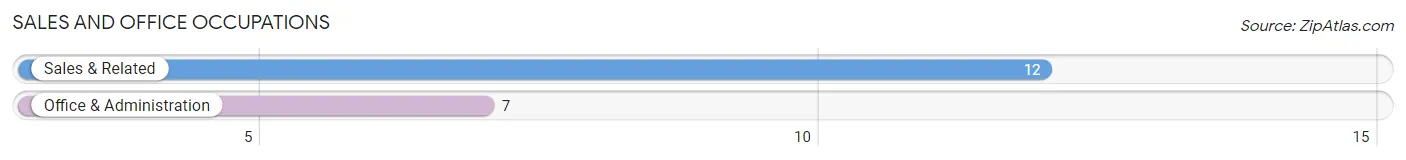
The most common Sales and Office occupations in Kensington are Sales & Related (12 | 10.3%), and Office & Administration (7 | 6.0%).
Sales and Office Occupations by Sex
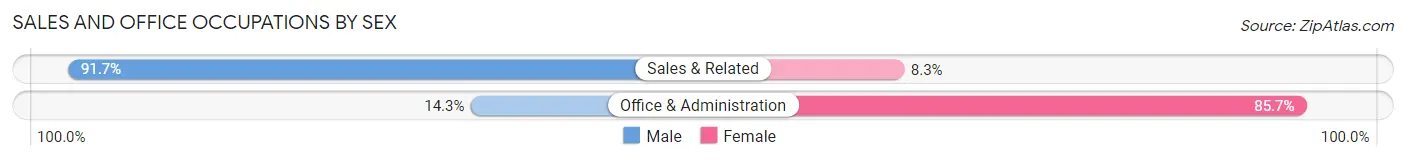
| Occupation | Male | Female |
| Sales & Related | 11 (91.7%) | 1 (8.3%) |
| Office & Administration | 1 (14.3%) | 6 (85.7%) |
| Total (Category) | 12 (63.2%) | 7 (36.8%) |
| Total (Overall) | 58 (50.0%) | 58 (50.0%) |
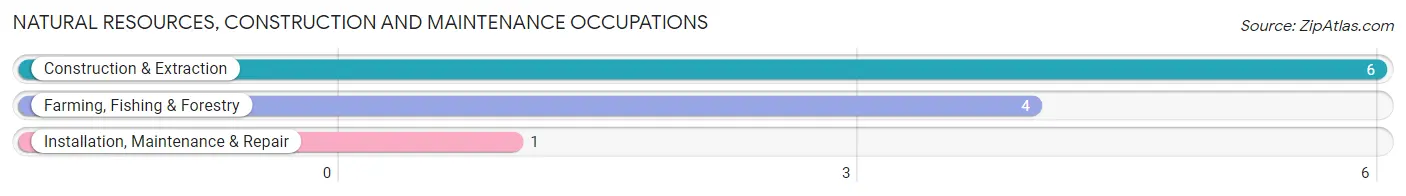
Natural Resources, Construction and Maintenance Occupations
The most common Natural Resources, Construction and Maintenance occupations in Kensington are Construction & Extraction (6 | 5.2%), Farming, Fishing & Forestry (4 | 3.5%), and Installation, Maintenance & Repair (1 | 0.9%).
Natural Resources, Construction and Maintenance Occupations by Sex
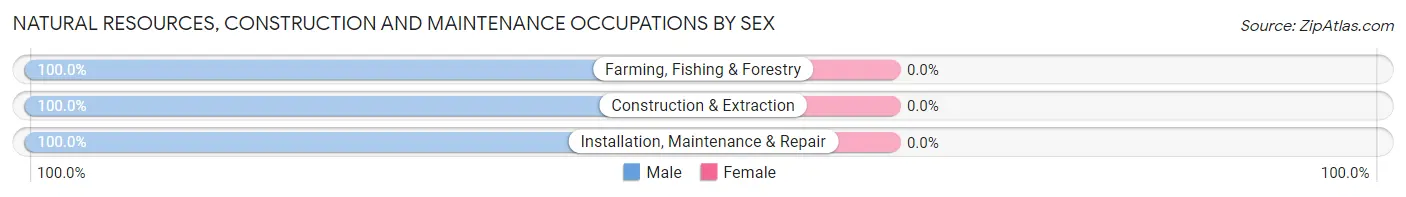
| Occupation | Male | Female |
| Farming, Fishing & Forestry | 4 (100.0%) | 0 (0.0%) |
| Construction & Extraction | 6 (100.0%) | 0 (0.0%) |
| Installation, Maintenance & Repair | 1 (100.0%) | 0 (0.0%) |
| Total (Category) | 11 (100.0%) | 0 (0.0%) |
| Total (Overall) | 58 (50.0%) | 58 (50.0%) |
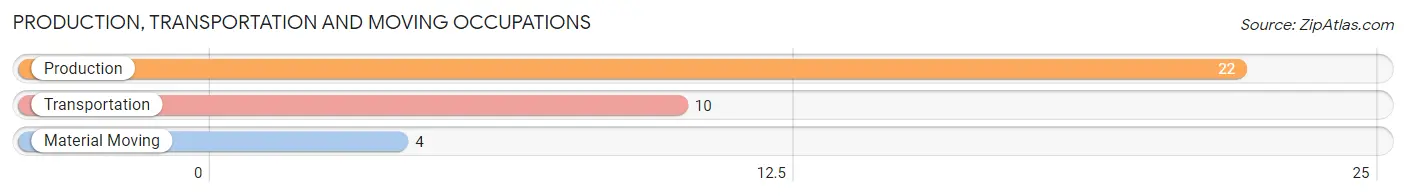
Production, Transportation and Moving Occupations
The most common Production, Transportation and Moving occupations in Kensington are Production (22 | 19.0%), Transportation (10 | 8.6%), and Material Moving (4 | 3.5%).
Production, Transportation and Moving Occupations by Sex
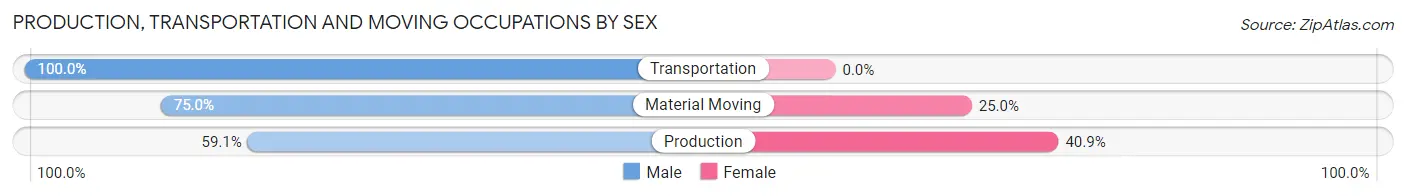
| Occupation | Male | Female |
| Production | 13 (59.1%) | 9 (40.9%) |
| Transportation | 10 (100.0%) | 0 (0.0%) |
| Material Moving | 3 (75.0%) | 1 (25.0%) |
| Total (Category) | 26 (72.2%) | 10 (27.8%) |
| Total (Overall) | 58 (50.0%) | 58 (50.0%) |
Employment Industries by Sex in Kensington
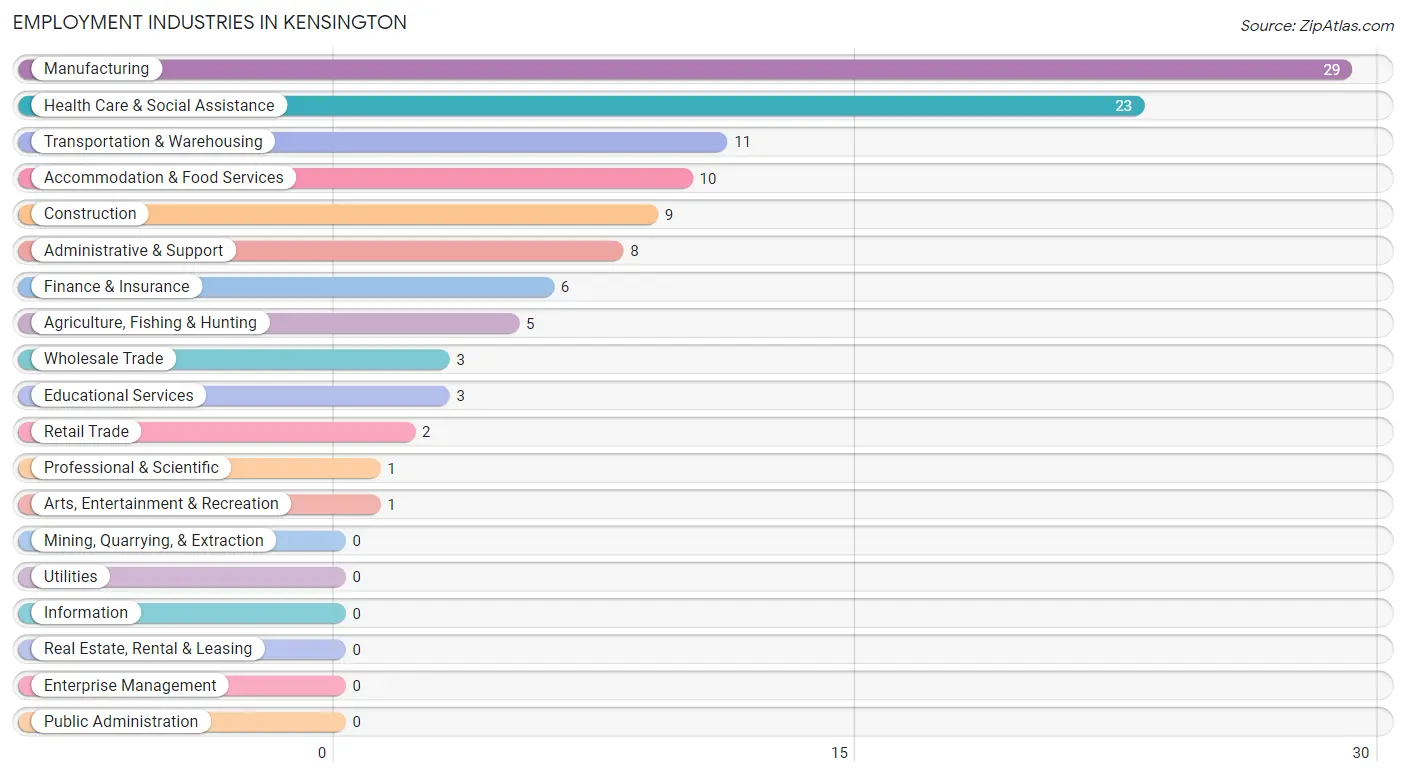
Employment Industries in Kensington
The major employment industries in Kensington include Manufacturing (29 | 25.0%), Health Care & Social Assistance (23 | 19.8%), Transportation & Warehousing (11 | 9.5%), Accommodation & Food Services (10 | 8.6%), and Construction (9 | 7.8%).
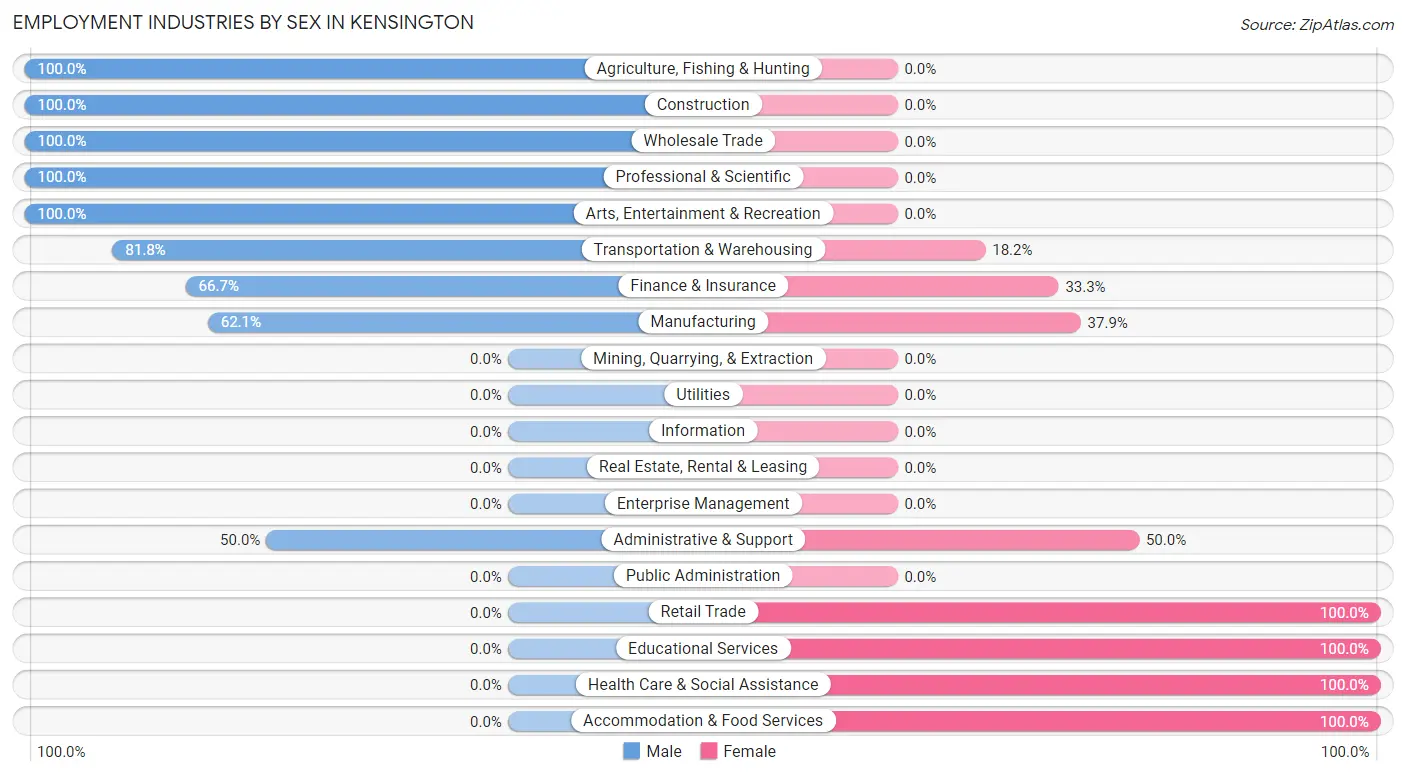
Employment Industries by Sex in Kensington
The Kensington industries that see more men than women are Agriculture, Fishing & Hunting (100.0%), Construction (100.0%), and Wholesale Trade (100.0%), whereas the industries that tend to have a higher number of women are Retail Trade (100.0%), Educational Services (100.0%), and Health Care & Social Assistance (100.0%).
| Industry | Male | Female |
| Agriculture, Fishing & Hunting | 5 (100.0%) | 0 (0.0%) |
| Mining, Quarrying, & Extraction | 0 (0.0%) | 0 (0.0%) |
| Construction | 9 (100.0%) | 0 (0.0%) |
| Manufacturing | 18 (62.1%) | 11 (37.9%) |
| Wholesale Trade | 3 (100.0%) | 0 (0.0%) |
| Retail Trade | 0 (0.0%) | 2 (100.0%) |
| Transportation & Warehousing | 9 (81.8%) | 2 (18.2%) |
| Utilities | 0 (0.0%) | 0 (0.0%) |
| Information | 0 (0.0%) | 0 (0.0%) |
| Finance & Insurance | 4 (66.7%) | 2 (33.3%) |
| Real Estate, Rental & Leasing | 0 (0.0%) | 0 (0.0%) |
| Professional & Scientific | 1 (100.0%) | 0 (0.0%) |
| Enterprise Management | 0 (0.0%) | 0 (0.0%) |
| Administrative & Support | 4 (50.0%) | 4 (50.0%) |
| Educational Services | 0 (0.0%) | 3 (100.0%) |
| Health Care & Social Assistance | 0 (0.0%) | 23 (100.0%) |
| Arts, Entertainment & Recreation | 1 (100.0%) | 0 (0.0%) |
| Accommodation & Food Services | 0 (0.0%) | 10 (100.0%) |
| Public Administration | 0 (0.0%) | 0 (0.0%) |
| Total | 58 (50.0%) | 58 (50.0%) |
Education in Kensington
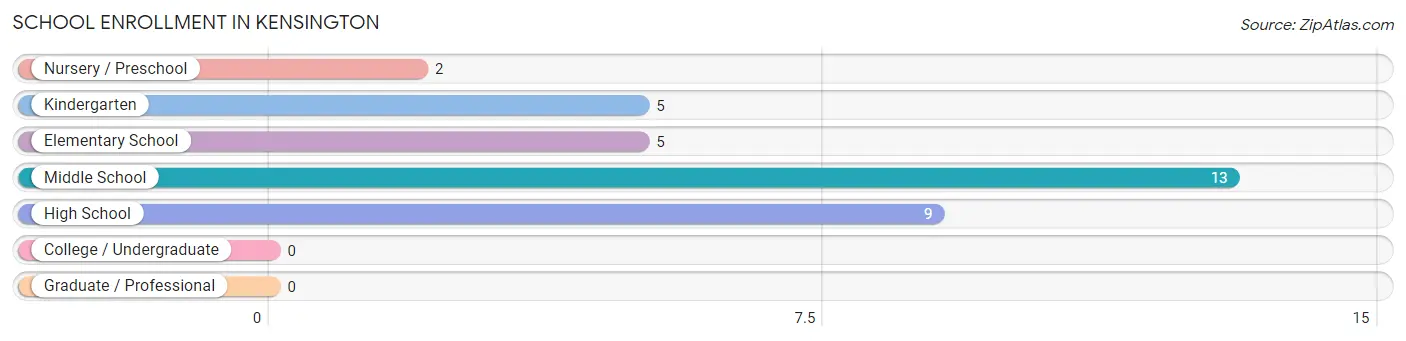
School Enrollment in Kensington
The most common levels of schooling among the 34 students in Kensington are middle school (13 | 38.2%), high school (9 | 26.5%), and kindergarten (5 | 14.7%).
| School Level | # Students | % Students |
| Nursery / Preschool | 2 | 5.9% |
| Kindergarten | 5 | 14.7% |
| Elementary School | 5 | 14.7% |
| Middle School | 13 | 38.2% |
| High School | 9 | 26.5% |
| College / Undergraduate | 0 | 0.0% |
| Graduate / Professional | 0 | 0.0% |
| Total | 34 | 100.0% |
School Enrollment by Age by Funding Source in Kensington
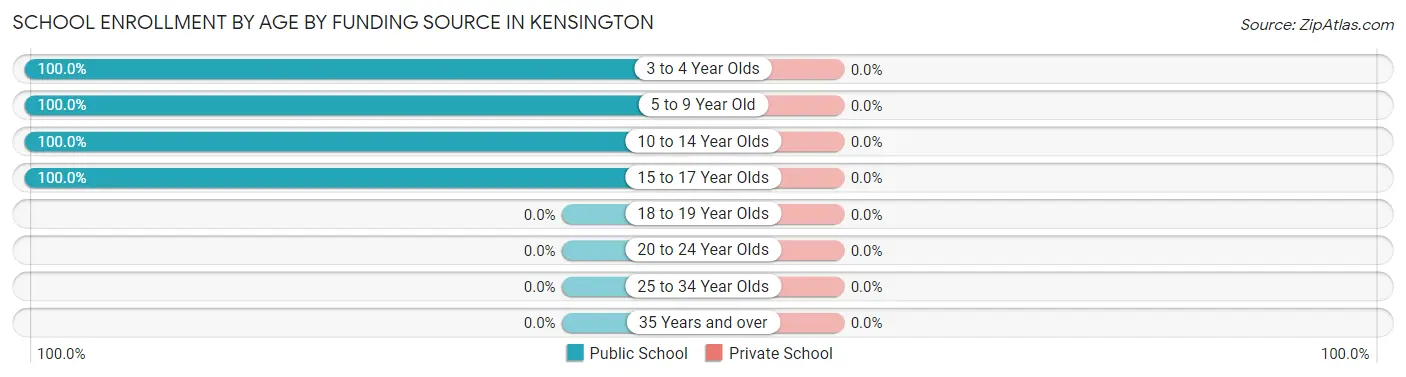
| Age Bracket | Public School | Private School |
| 3 to 4 Year Olds | 2 (100.0%) | 0 (0.0%) |
| 5 to 9 Year Old | 10 (100.0%) | 0 (0.0%) |
| 10 to 14 Year Olds | 13 (100.0%) | 0 (0.0%) |
| 15 to 17 Year Olds | 9 (100.0%) | 0 (0.0%) |
| 18 to 19 Year Olds | 0 (0.0%) | 0 (0.0%) |
| 20 to 24 Year Olds | 0 (0.0%) | 0 (0.0%) |
| 25 to 34 Year Olds | 0 (0.0%) | 0 (0.0%) |
| 35 Years and over | 0 (0.0%) | 0 (0.0%) |
| Total | 34 (100.0%) | 0 (0.0%) |
Educational Attainment by Field of Study in Kensington
Business (6 | 28.6%), science & technology (4 | 19.1%), education (4 | 19.1%), liberal arts & history (4 | 19.1%), and arts & humanities (2 | 9.5%) are the most common fields of study among 21 individuals in Kensington who have obtained a bachelor's degree or higher.
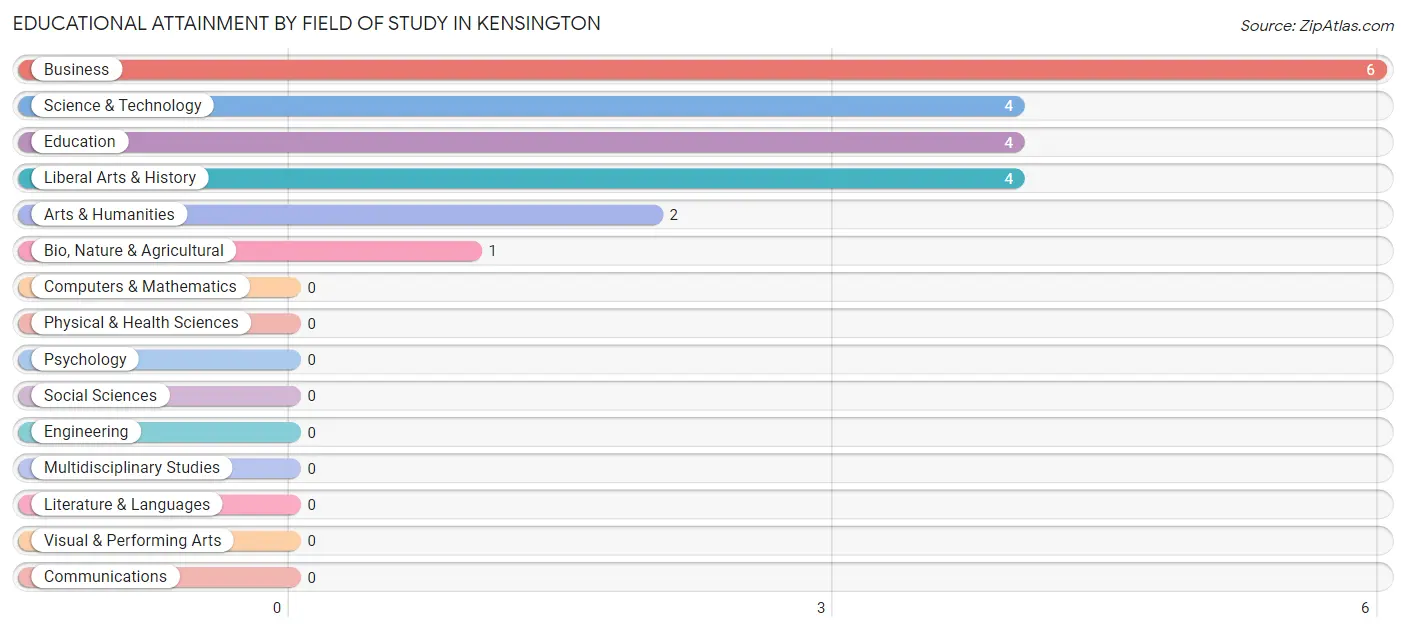
| Field of Study | # Graduates | % Graduates |
| Computers & Mathematics | 0 | 0.0% |
| Bio, Nature & Agricultural | 1 | 4.8% |
| Physical & Health Sciences | 0 | 0.0% |
| Psychology | 0 | 0.0% |
| Social Sciences | 0 | 0.0% |
| Engineering | 0 | 0.0% |
| Multidisciplinary Studies | 0 | 0.0% |
| Science & Technology | 4 | 19.1% |
| Business | 6 | 28.6% |
| Education | 4 | 19.1% |
| Literature & Languages | 0 | 0.0% |
| Liberal Arts & History | 4 | 19.1% |
| Visual & Performing Arts | 0 | 0.0% |
| Communications | 0 | 0.0% |
| Arts & Humanities | 2 | 9.5% |
| Total | 21 | 100.0% |
Transportation & Commute in Kensington
Vehicle Availability by Sex in Kensington
The most prevalent vehicle ownership categories in Kensington are males with 2 vehicles (24, accounting for 41.4%) and females with 2 vehicles (16, making up 42.1%).
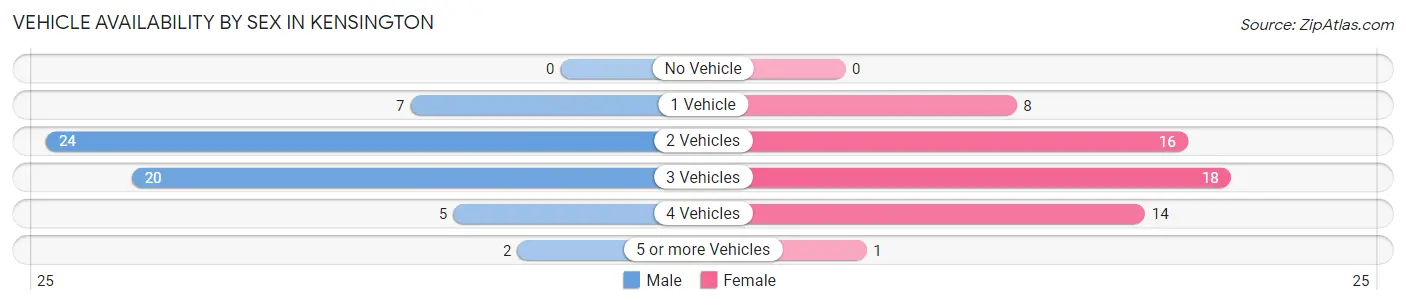
| Vehicles Available | Male | Female |
| No Vehicle | 0 (0.0%) | 0 (0.0%) |
| 1 Vehicle | 7 (12.1%) | 8 (14.0%) |
| 2 Vehicles | 24 (41.4%) | 16 (28.1%) |
| 3 Vehicles | 20 (34.5%) | 18 (31.6%) |
| 4 Vehicles | 5 (8.6%) | 14 (24.6%) |
| 5 or more Vehicles | 2 (3.5%) | 1 (1.8%) |
| Total | 58 (100.0%) | 57 (100.0%) |
Commute Time in Kensington
The most frequently occuring commute durations in Kensington are 25 to 29 minutes (23 commuters, 21.9%), 30 to 34 minutes (21 commuters, 20.0%), and 20 to 24 minutes (20 commuters, 19.1%).
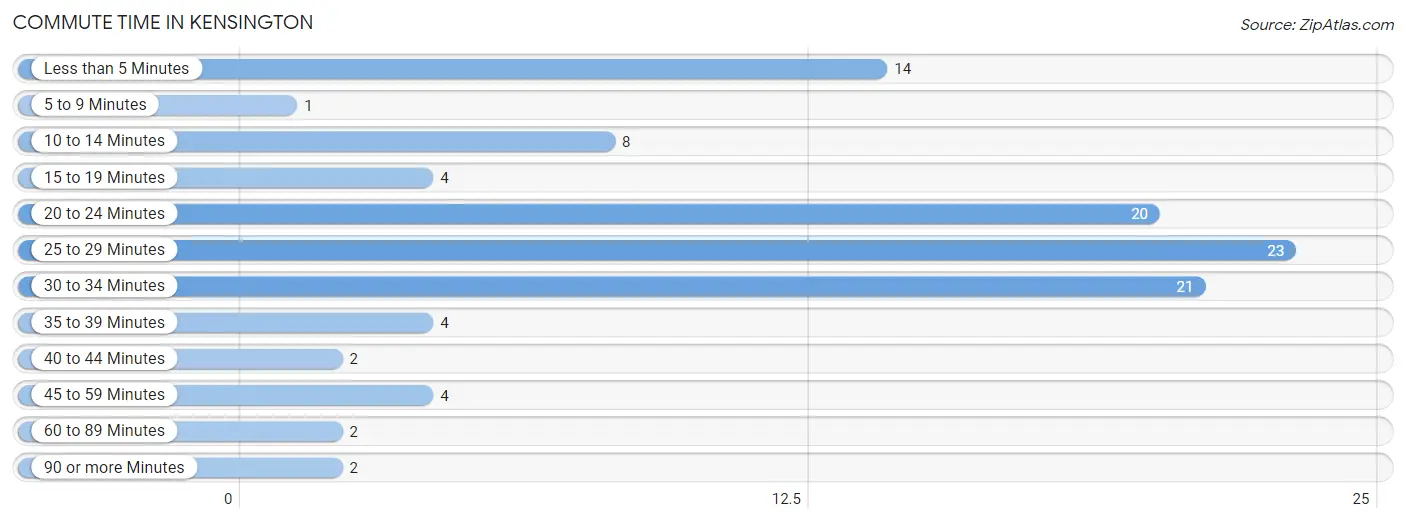
| Commute Time | # Commuters | % Commuters |
| Less than 5 Minutes | 14 | 13.3% |
| 5 to 9 Minutes | 1 | 0.9% |
| 10 to 14 Minutes | 8 | 7.6% |
| 15 to 19 Minutes | 4 | 3.8% |
| 20 to 24 Minutes | 20 | 19.1% |
| 25 to 29 Minutes | 23 | 21.9% |
| 30 to 34 Minutes | 21 | 20.0% |
| 35 to 39 Minutes | 4 | 3.8% |
| 40 to 44 Minutes | 2 | 1.9% |
| 45 to 59 Minutes | 4 | 3.8% |
| 60 to 89 Minutes | 2 | 1.9% |
| 90 or more Minutes | 2 | 1.9% |
Commute Time by Sex in Kensington
The most common commute times in Kensington are 25 to 29 minutes (11 commuters, 20.4%) for males and 20 to 24 minutes (14 commuters, 27.5%) for females.
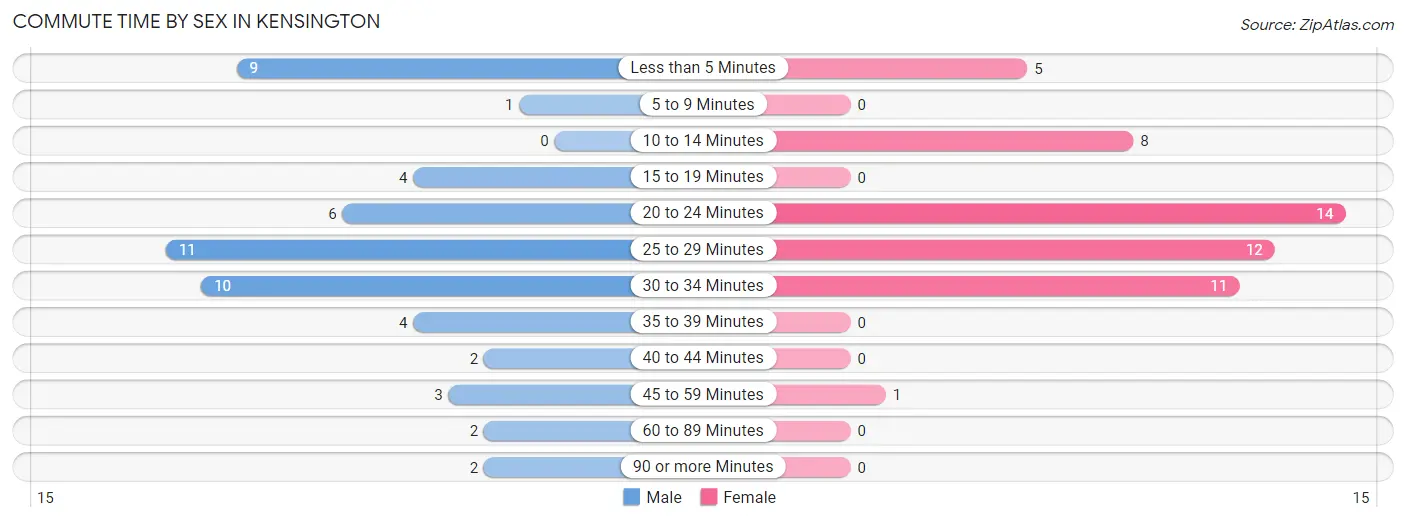
| Commute Time | Male | Female |
| Less than 5 Minutes | 9 (16.7%) | 5 (9.8%) |
| 5 to 9 Minutes | 1 (1.8%) | 0 (0.0%) |
| 10 to 14 Minutes | 0 (0.0%) | 8 (15.7%) |
| 15 to 19 Minutes | 4 (7.4%) | 0 (0.0%) |
| 20 to 24 Minutes | 6 (11.1%) | 14 (27.5%) |
| 25 to 29 Minutes | 11 (20.4%) | 12 (23.5%) |
| 30 to 34 Minutes | 10 (18.5%) | 11 (21.6%) |
| 35 to 39 Minutes | 4 (7.4%) | 0 (0.0%) |
| 40 to 44 Minutes | 2 (3.7%) | 0 (0.0%) |
| 45 to 59 Minutes | 3 (5.6%) | 1 (2.0%) |
| 60 to 89 Minutes | 2 (3.7%) | 0 (0.0%) |
| 90 or more Minutes | 2 (3.7%) | 0 (0.0%) |
Time of Departure to Work by Sex in Kensington
The most frequent times of departure to work in Kensington are 12:00 AM to 4:59 AM (13, 24.1%) for males and 8:00 AM to 8:29 AM (12, 23.5%) for females.
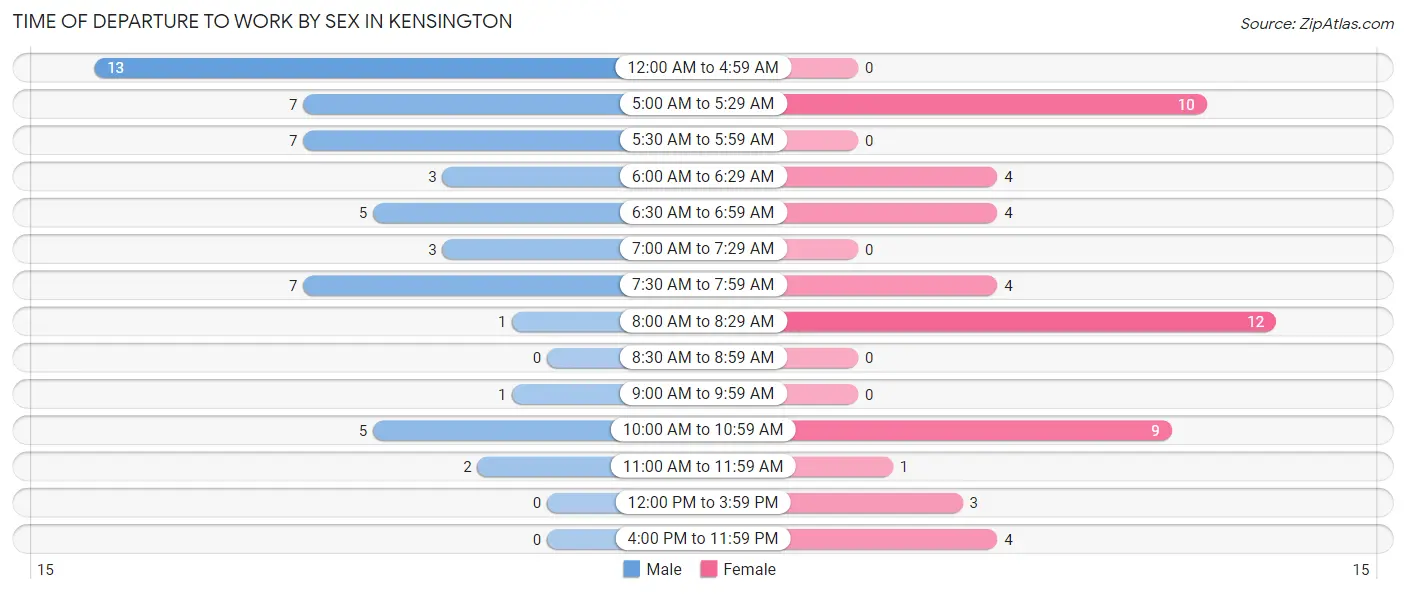
| Time of Departure | Male | Female |
| 12:00 AM to 4:59 AM | 13 (24.1%) | 0 (0.0%) |
| 5:00 AM to 5:29 AM | 7 (13.0%) | 10 (19.6%) |
| 5:30 AM to 5:59 AM | 7 (13.0%) | 0 (0.0%) |
| 6:00 AM to 6:29 AM | 3 (5.6%) | 4 (7.8%) |
| 6:30 AM to 6:59 AM | 5 (9.3%) | 4 (7.8%) |
| 7:00 AM to 7:29 AM | 3 (5.6%) | 0 (0.0%) |
| 7:30 AM to 7:59 AM | 7 (13.0%) | 4 (7.8%) |
| 8:00 AM to 8:29 AM | 1 (1.8%) | 12 (23.5%) |
| 8:30 AM to 8:59 AM | 0 (0.0%) | 0 (0.0%) |
| 9:00 AM to 9:59 AM | 1 (1.8%) | 0 (0.0%) |
| 10:00 AM to 10:59 AM | 5 (9.3%) | 9 (17.6%) |
| 11:00 AM to 11:59 AM | 2 (3.7%) | 1 (2.0%) |
| 12:00 PM to 3:59 PM | 0 (0.0%) | 3 (5.9%) |
| 4:00 PM to 11:59 PM | 0 (0.0%) | 4 (7.8%) |
| Total | 54 (100.0%) | 51 (100.0%) |
Housing Occupancy in Kensington
Occupancy by Ownership in Kensington
Of the total 114 dwellings in Kensington, owner-occupied units account for 97 (85.1%), while renter-occupied units make up 17 (14.9%).
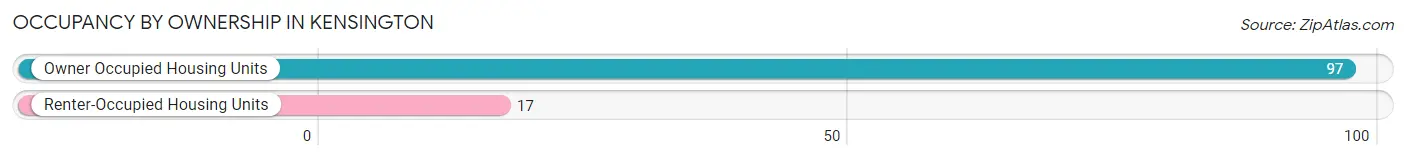
| Occupancy | # Housing Units | % Housing Units |
| Owner Occupied Housing Units | 97 | 85.1% |
| Renter-Occupied Housing Units | 17 | 14.9% |
| Total Occupied Housing Units | 114 | 100.0% |
Occupancy by Household Size in Kensington
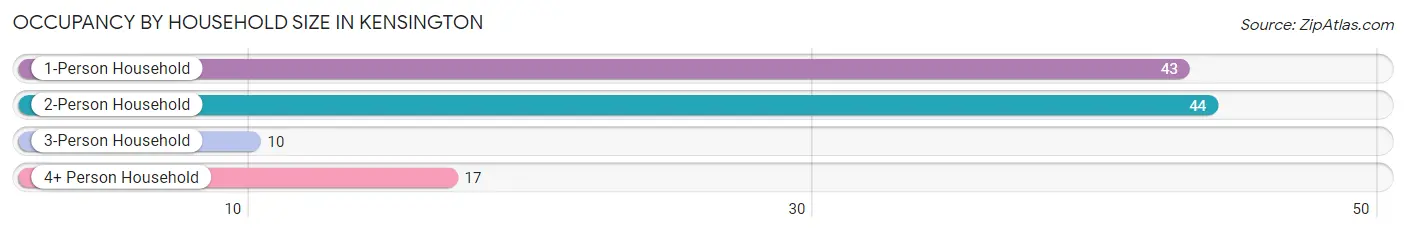
| Household Size | # Housing Units | % Housing Units |
| 1-Person Household | 43 | 37.7% |
| 2-Person Household | 44 | 38.6% |
| 3-Person Household | 10 | 8.8% |
| 4+ Person Household | 17 | 14.9% |
| Total Housing Units | 114 | 100.0% |
Occupancy by Ownership by Household Size in Kensington
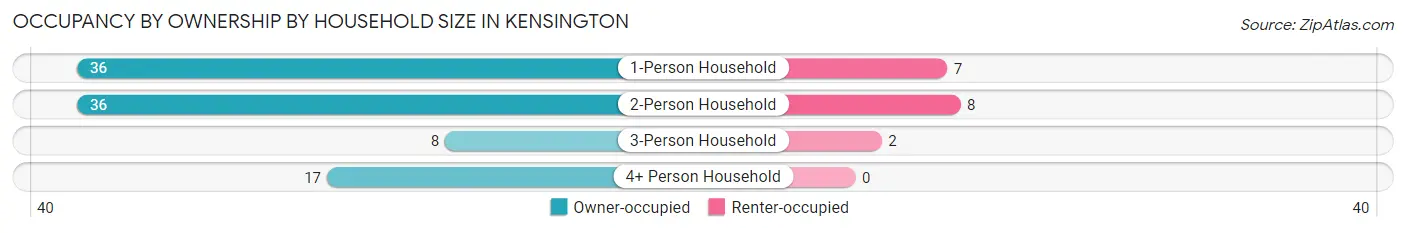
| Household Size | Owner-occupied | Renter-occupied |
| 1-Person Household | 36 (83.7%) | 7 (16.3%) |
| 2-Person Household | 36 (81.8%) | 8 (18.2%) |
| 3-Person Household | 8 (80.0%) | 2 (20.0%) |
| 4+ Person Household | 17 (100.0%) | 0 (0.0%) |
| Total Housing Units | 97 (85.1%) | 17 (14.9%) |
Occupancy by Educational Attainment in Kensington
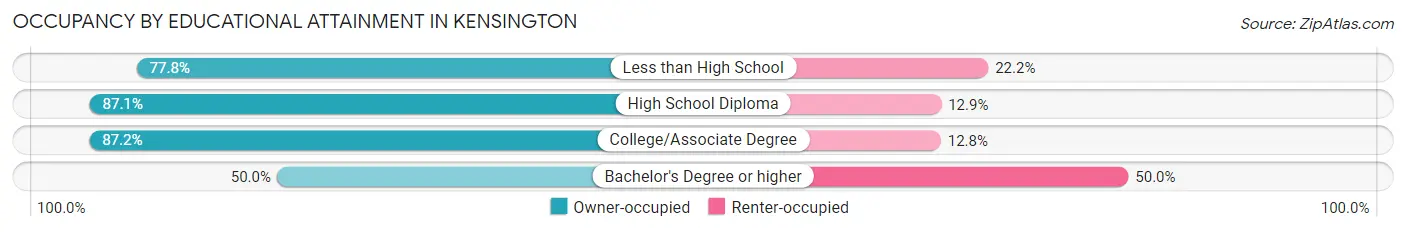
| Household Size | Owner-occupied | Renter-occupied |
| Less than High School | 7 (77.8%) | 2 (22.2%) |
| High School Diploma | 54 (87.1%) | 8 (12.9%) |
| College/Associate Degree | 34 (87.2%) | 5 (12.8%) |
| Bachelor's Degree or higher | 2 (50.0%) | 2 (50.0%) |
Occupancy by Age of Householder in Kensington
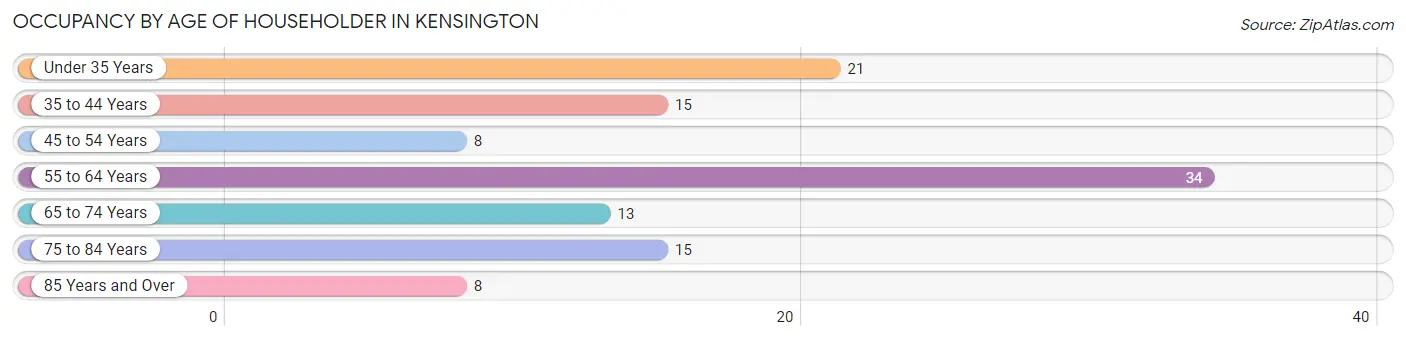
| Age Bracket | # Households | % Households |
| Under 35 Years | 21 | 18.4% |
| 35 to 44 Years | 15 | 13.2% |
| 45 to 54 Years | 8 | 7.0% |
| 55 to 64 Years | 34 | 29.8% |
| 65 to 74 Years | 13 | 11.4% |
| 75 to 84 Years | 15 | 13.2% |
| 85 Years and Over | 8 | 7.0% |
| Total | 114 | 100.0% |
Housing Finances in Kensington
Median Income by Occupancy in Kensington
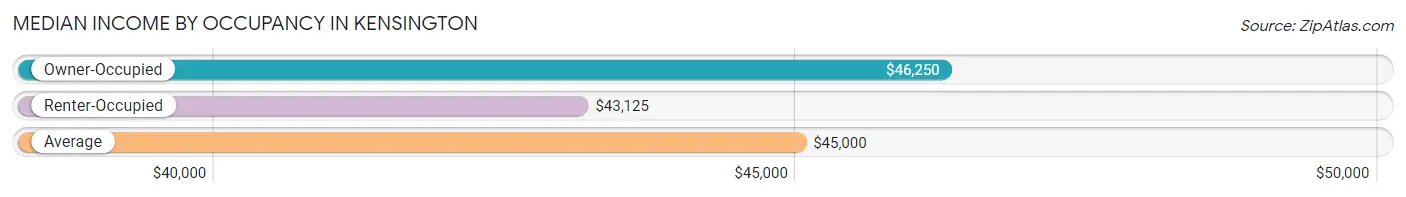
| Occupancy Type | # Households | Median Income |
| Owner-Occupied | 97 (85.1%) | $46,250 |
| Renter-Occupied | 17 (14.9%) | $43,125 |
| Average | 114 (100.0%) | $45,000 |
Occupancy by Householder Income Bracket in Kensington
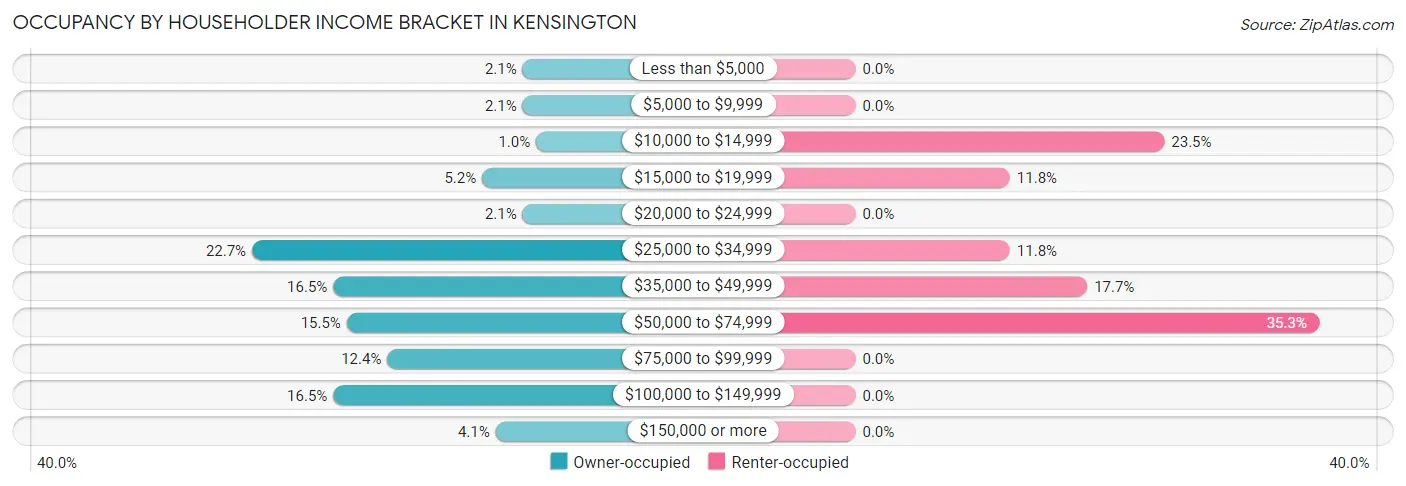
| Income Bracket | Owner-occupied | Renter-occupied |
| Less than $5,000 | 2 (2.1%) | 0 (0.0%) |
| $5,000 to $9,999 | 2 (2.1%) | 0 (0.0%) |
| $10,000 to $14,999 | 1 (1.0%) | 4 (23.5%) |
| $15,000 to $19,999 | 5 (5.1%) | 2 (11.8%) |
| $20,000 to $24,999 | 2 (2.1%) | 0 (0.0%) |
| $25,000 to $34,999 | 22 (22.7%) | 2 (11.8%) |
| $35,000 to $49,999 | 16 (16.5%) | 3 (17.6%) |
| $50,000 to $74,999 | 15 (15.5%) | 6 (35.3%) |
| $75,000 to $99,999 | 12 (12.4%) | 0 (0.0%) |
| $100,000 to $149,999 | 16 (16.5%) | 0 (0.0%) |
| $150,000 or more | 4 (4.1%) | 0 (0.0%) |
| Total | 97 (100.0%) | 17 (100.0%) |
Monthly Housing Cost Tiers in Kensington
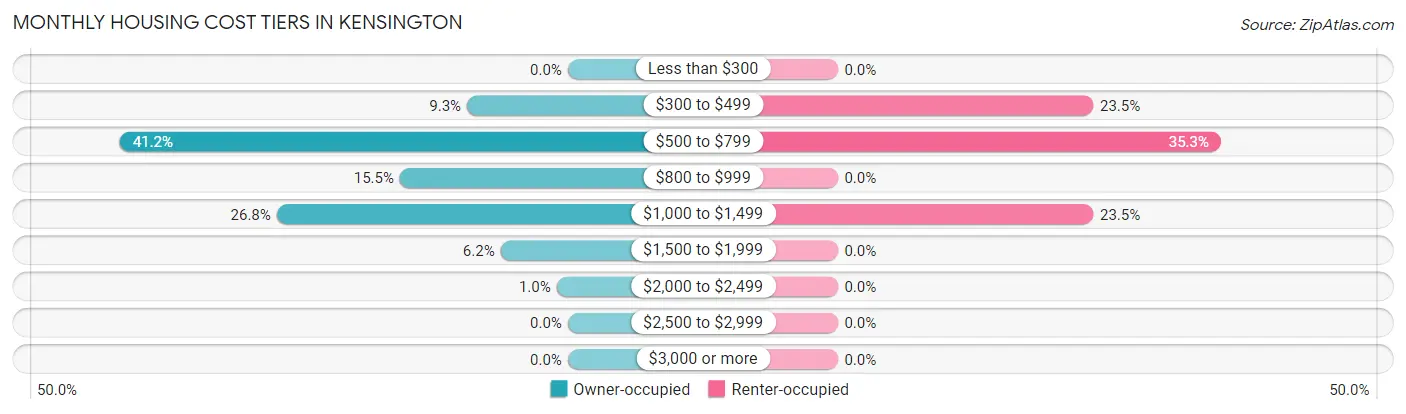
| Monthly Cost | Owner-occupied | Renter-occupied |
| Less than $300 | 0 (0.0%) | 0 (0.0%) |
| $300 to $499 | 9 (9.3%) | 4 (23.5%) |
| $500 to $799 | 40 (41.2%) | 6 (35.3%) |
| $800 to $999 | 15 (15.5%) | 0 (0.0%) |
| $1,000 to $1,499 | 26 (26.8%) | 4 (23.5%) |
| $1,500 to $1,999 | 6 (6.2%) | 0 (0.0%) |
| $2,000 to $2,499 | 1 (1.0%) | 0 (0.0%) |
| $2,500 to $2,999 | 0 (0.0%) | 0 (0.0%) |
| $3,000 or more | 0 (0.0%) | 0 (0.0%) |
| Total | 97 (100.0%) | 17 (100.0%) |
Physical Housing Characteristics in Kensington
Housing Structures in Kensington
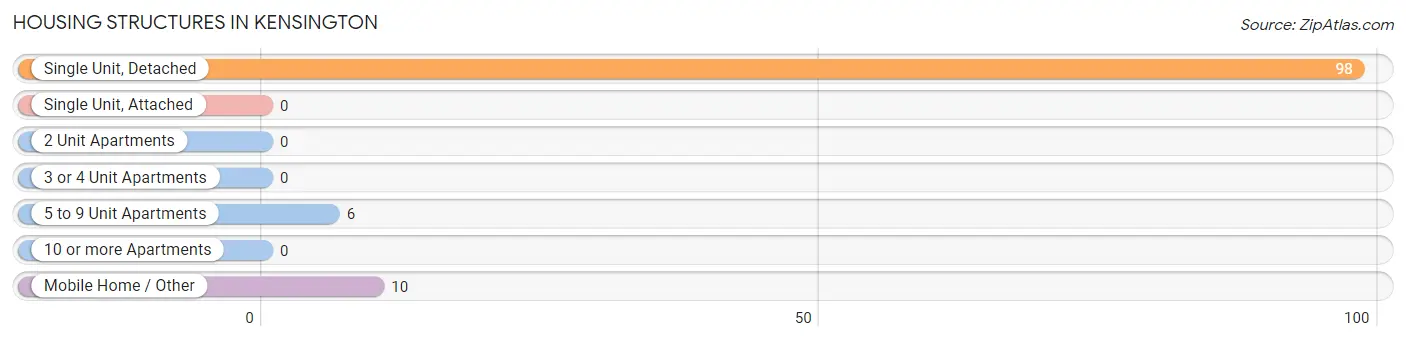
| Structure Type | # Housing Units | % Housing Units |
| Single Unit, Detached | 98 | 86.0% |
| Single Unit, Attached | 0 | 0.0% |
| 2 Unit Apartments | 0 | 0.0% |
| 3 or 4 Unit Apartments | 0 | 0.0% |
| 5 to 9 Unit Apartments | 6 | 5.3% |
| 10 or more Apartments | 0 | 0.0% |
| Mobile Home / Other | 10 | 8.8% |
| Total | 114 | 100.0% |
Housing Structures by Occupancy in Kensington
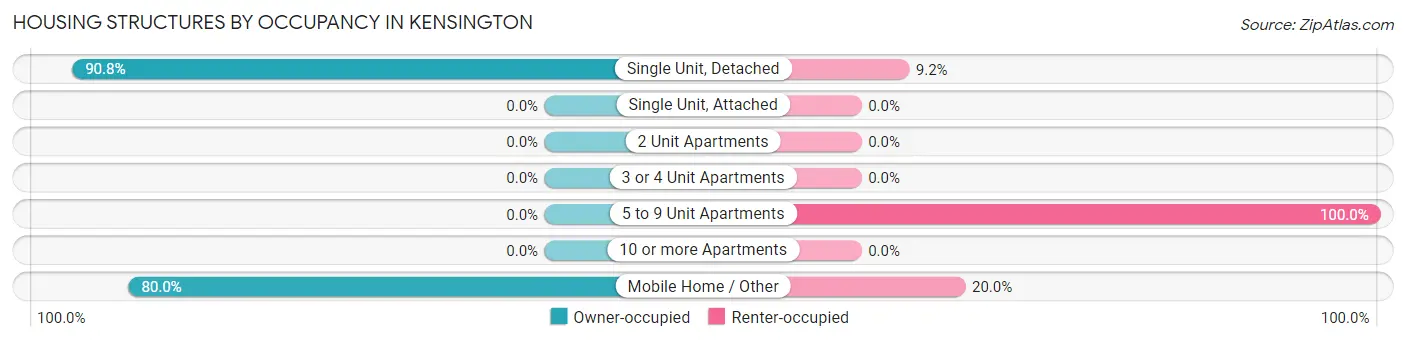
| Structure Type | Owner-occupied | Renter-occupied |
| Single Unit, Detached | 89 (90.8%) | 9 (9.2%) |
| Single Unit, Attached | 0 (0.0%) | 0 (0.0%) |
| 2 Unit Apartments | 0 (0.0%) | 0 (0.0%) |
| 3 or 4 Unit Apartments | 0 (0.0%) | 0 (0.0%) |
| 5 to 9 Unit Apartments | 0 (0.0%) | 6 (100.0%) |
| 10 or more Apartments | 0 (0.0%) | 0 (0.0%) |
| Mobile Home / Other | 8 (80.0%) | 2 (20.0%) |
| Total | 97 (85.1%) | 17 (14.9%) |
Housing Structures by Number of Rooms in Kensington
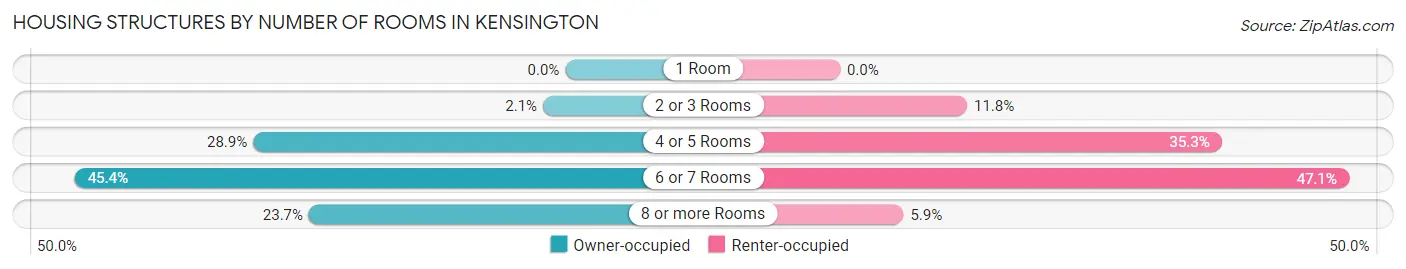
| Number of Rooms | Owner-occupied | Renter-occupied |
| 1 Room | 0 (0.0%) | 0 (0.0%) |
| 2 or 3 Rooms | 2 (2.1%) | 2 (11.8%) |
| 4 or 5 Rooms | 28 (28.9%) | 6 (35.3%) |
| 6 or 7 Rooms | 44 (45.4%) | 8 (47.1%) |
| 8 or more Rooms | 23 (23.7%) | 1 (5.9%) |
| Total | 97 (100.0%) | 17 (100.0%) |
Housing Structure by Heating Type in Kensington
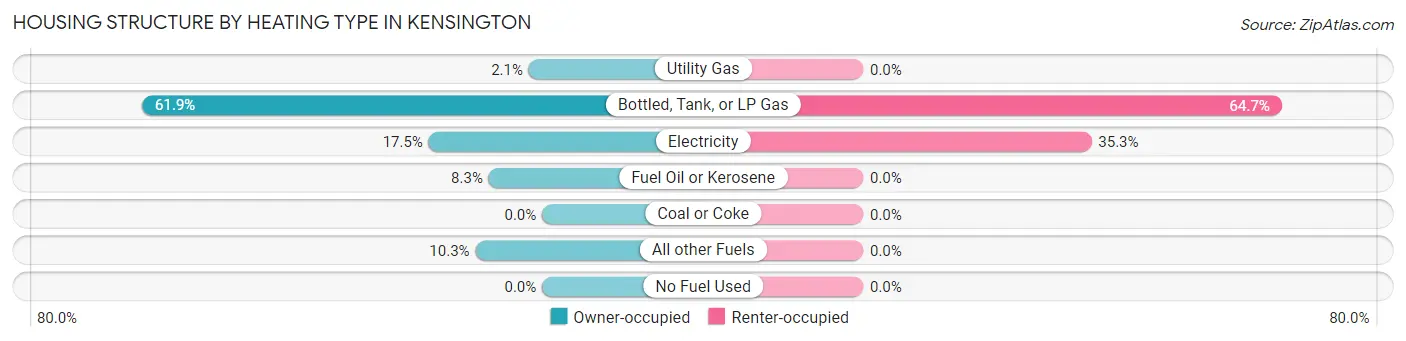
| Heating Type | Owner-occupied | Renter-occupied |
| Utility Gas | 2 (2.1%) | 0 (0.0%) |
| Bottled, Tank, or LP Gas | 60 (61.9%) | 11 (64.7%) |
| Electricity | 17 (17.5%) | 6 (35.3%) |
| Fuel Oil or Kerosene | 8 (8.3%) | 0 (0.0%) |
| Coal or Coke | 0 (0.0%) | 0 (0.0%) |
| All other Fuels | 10 (10.3%) | 0 (0.0%) |
| No Fuel Used | 0 (0.0%) | 0 (0.0%) |
| Total | 97 (100.0%) | 17 (100.0%) |
Household Vehicle Usage in Kensington
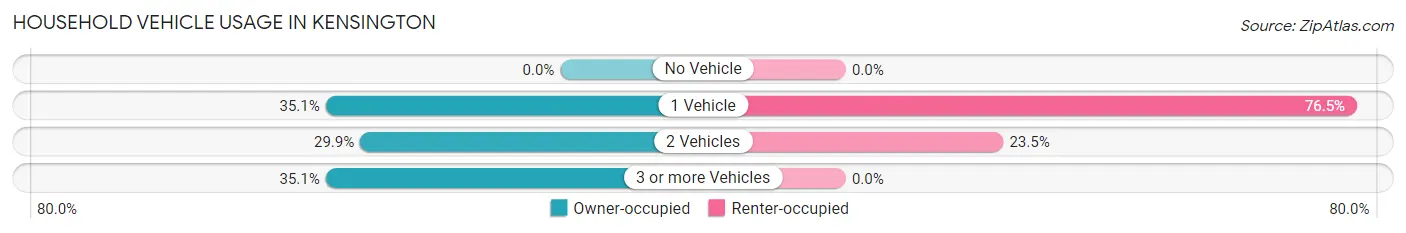
| Vehicles per Household | Owner-occupied | Renter-occupied |
| No Vehicle | 0 (0.0%) | 0 (0.0%) |
| 1 Vehicle | 34 (35.0%) | 13 (76.5%) |
| 2 Vehicles | 29 (29.9%) | 4 (23.5%) |
| 3 or more Vehicles | 34 (35.0%) | 0 (0.0%) |
| Total | 97 (100.0%) | 17 (100.0%) |
Real Estate & Mortgages in Kensington
Real Estate and Mortgage Overview in Kensington
| Characteristic | Without Mortgage | With Mortgage |
| Housing Units | 42 | 55 |
| Median Property Value | $72,500 | $86,500 |
| Median Household Income | $31,154 | $2 |
| Monthly Housing Costs | $557 | $0 |
| Real Estate Taxes | $1,176 | $0 |
Property Value by Mortgage Status in Kensington
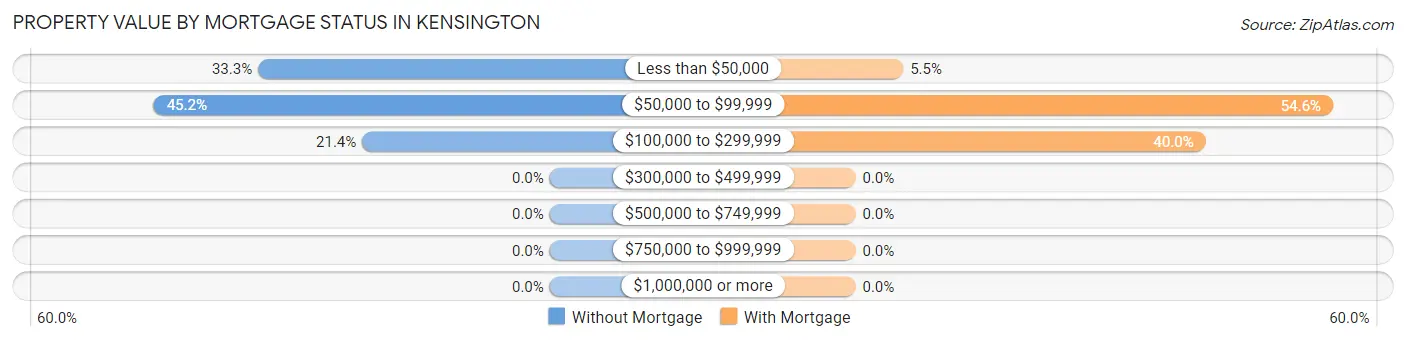
| Property Value | Without Mortgage | With Mortgage |
| Less than $50,000 | 14 (33.3%) | 3 (5.4%) |
| $50,000 to $99,999 | 19 (45.2%) | 30 (54.5%) |
| $100,000 to $299,999 | 9 (21.4%) | 22 (40.0%) |
| $300,000 to $499,999 | 0 (0.0%) | 0 (0.0%) |
| $500,000 to $749,999 | 0 (0.0%) | 0 (0.0%) |
| $750,000 to $999,999 | 0 (0.0%) | 0 (0.0%) |
| $1,000,000 or more | 0 (0.0%) | 0 (0.0%) |
| Total | 42 (100.0%) | 55 (100.0%) |
Household Income by Mortgage Status in Kensington
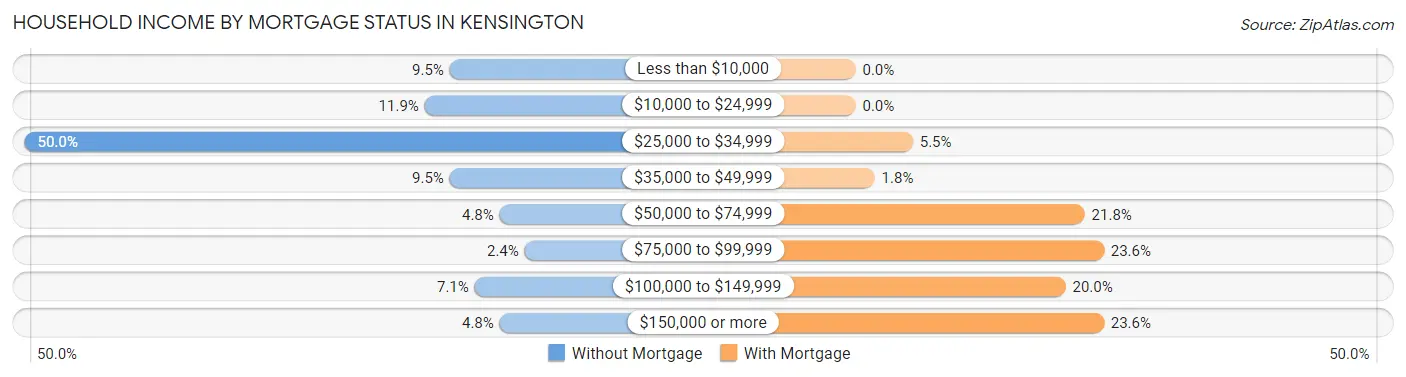
| Household Income | Without Mortgage | With Mortgage |
| Less than $10,000 | 4 (9.5%) | 0 (0.0%) |
| $10,000 to $24,999 | 5 (11.9%) | 0 (0.0%) |
| $25,000 to $34,999 | 21 (50.0%) | 3 (5.4%) |
| $35,000 to $49,999 | 4 (9.5%) | 1 (1.8%) |
| $50,000 to $74,999 | 2 (4.8%) | 12 (21.8%) |
| $75,000 to $99,999 | 1 (2.4%) | 13 (23.6%) |
| $100,000 to $149,999 | 3 (7.1%) | 11 (20.0%) |
| $150,000 or more | 2 (4.8%) | 13 (23.6%) |
| Total | 42 (100.0%) | 55 (100.0%) |
Property Value to Household Income Ratio in Kensington
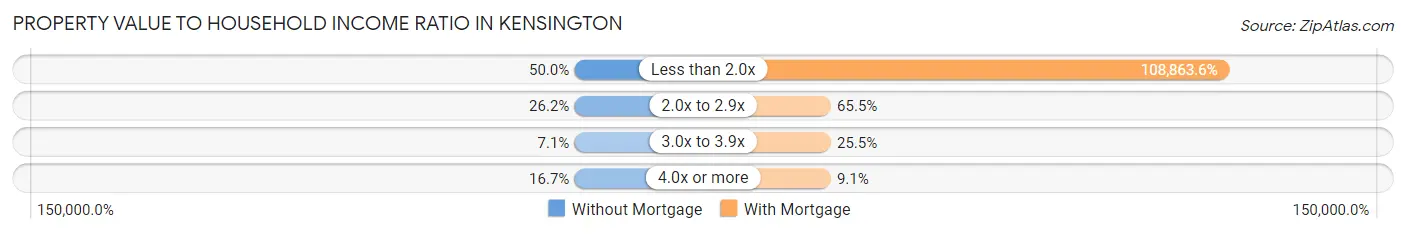
| Value-to-Income Ratio | Without Mortgage | With Mortgage |
| Less than 2.0x | 21 (50.0%) | 59,875 (108,863.6%) |
| 2.0x to 2.9x | 11 (26.2%) | 36 (65.4%) |
| 3.0x to 3.9x | 3 (7.1%) | 14 (25.5%) |
| 4.0x or more | 7 (16.7%) | 5 (9.1%) |
| Total | 42 (100.0%) | 55 (100.0%) |
Real Estate Taxes by Mortgage Status in Kensington
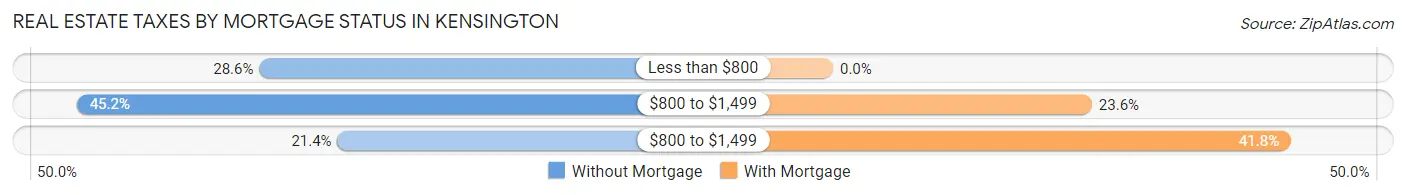
| Property Taxes | Without Mortgage | With Mortgage |
| Less than $800 | 12 (28.6%) | 0 (0.0%) |
| $800 to $1,499 | 19 (45.2%) | 13 (23.6%) |
| $800 to $1,499 | 9 (21.4%) | 23 (41.8%) |
| Total | 42 (100.0%) | 55 (100.0%) |
Health & Disability in Kensington
Health Insurance Coverage by Age in Kensington
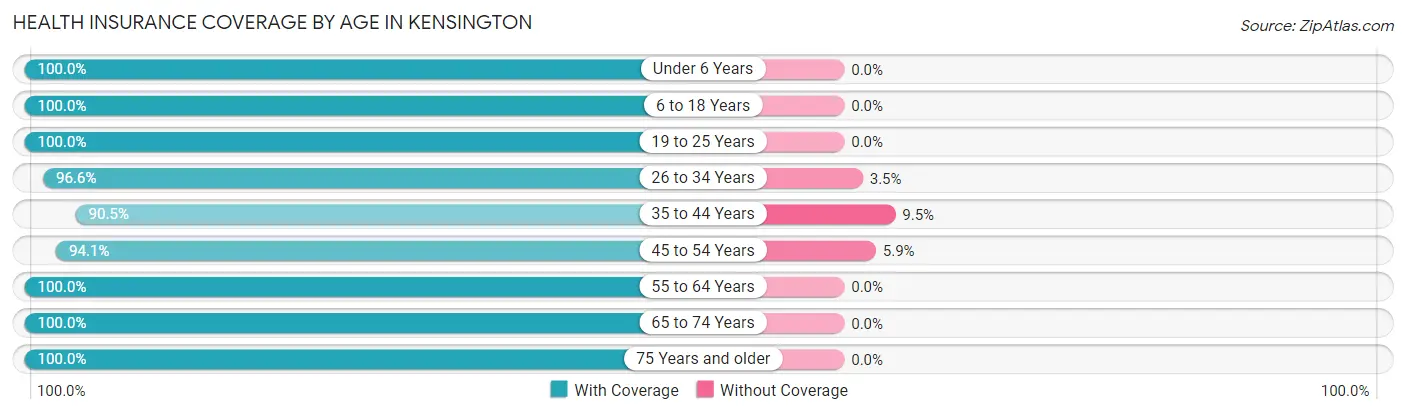
| Age Bracket | With Coverage | Without Coverage |
| Under 6 Years | 11 (100.0%) | 0 (0.0%) |
| 6 to 18 Years | 27 (100.0%) | 0 (0.0%) |
| 19 to 25 Years | 19 (100.0%) | 0 (0.0%) |
| 26 to 34 Years | 28 (96.6%) | 1 (3.5%) |
| 35 to 44 Years | 19 (90.5%) | 2 (9.5%) |
| 45 to 54 Years | 16 (94.1%) | 1 (5.9%) |
| 55 to 64 Years | 55 (100.0%) | 0 (0.0%) |
| 65 to 74 Years | 22 (100.0%) | 0 (0.0%) |
| 75 Years and older | 25 (100.0%) | 0 (0.0%) |
| Total | 222 (98.2%) | 4 (1.8%) |
Health Insurance Coverage by Citizenship Status in Kensington
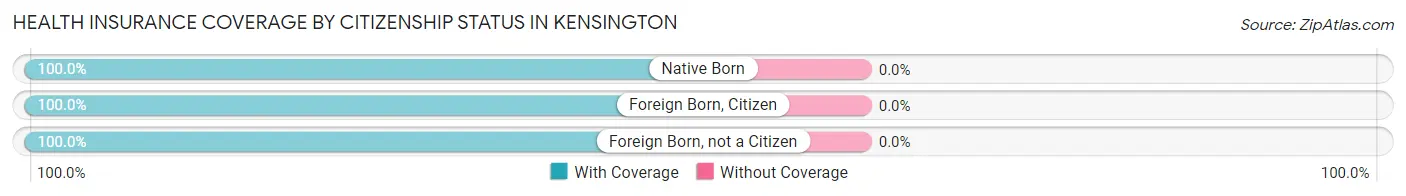
| Citizenship Status | With Coverage | Without Coverage |
| Native Born | 11 (100.0%) | 0 (0.0%) |
| Foreign Born, Citizen | 27 (100.0%) | 0 (0.0%) |
| Foreign Born, not a Citizen | 19 (100.0%) | 0 (0.0%) |
Health Insurance Coverage by Household Income in Kensington
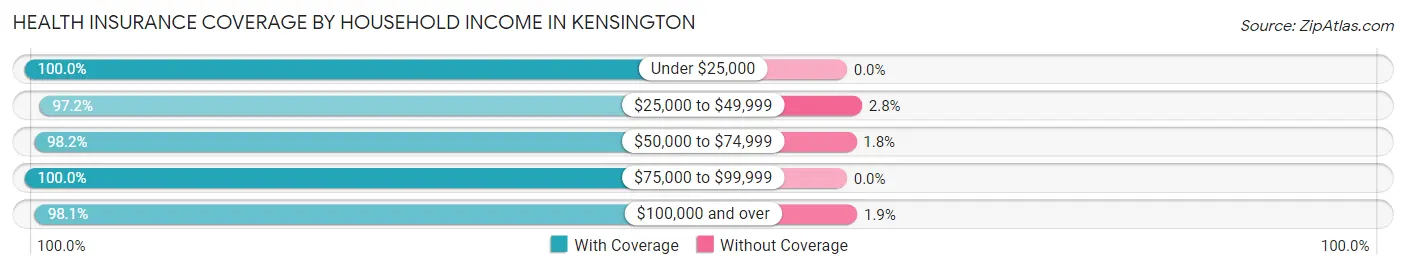
| Household Income | With Coverage | Without Coverage |
| Under $25,000 | 24 (100.0%) | 0 (0.0%) |
| $25,000 to $49,999 | 69 (97.2%) | 2 (2.8%) |
| $50,000 to $74,999 | 55 (98.2%) | 1 (1.8%) |
| $75,000 to $99,999 | 23 (100.0%) | 0 (0.0%) |
| $100,000 and over | 51 (98.1%) | 1 (1.9%) |
Public vs Private Health Insurance Coverage by Age in Kensington
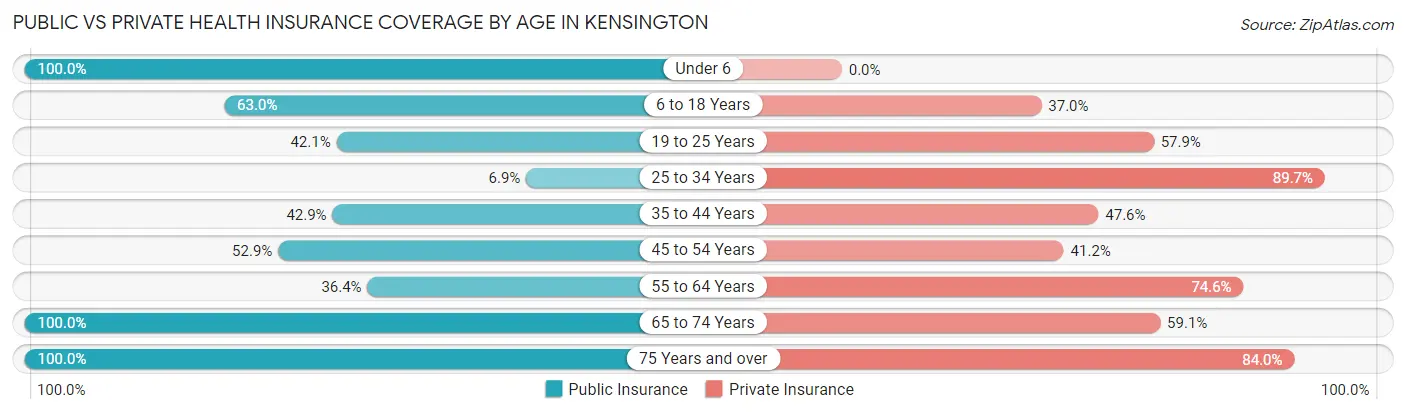
| Age Bracket | Public Insurance | Private Insurance |
| Under 6 | 11 (100.0%) | 0 (0.0%) |
| 6 to 18 Years | 17 (63.0%) | 10 (37.0%) |
| 19 to 25 Years | 8 (42.1%) | 11 (57.9%) |
| 25 to 34 Years | 2 (6.9%) | 26 (89.7%) |
| 35 to 44 Years | 9 (42.9%) | 10 (47.6%) |
| 45 to 54 Years | 9 (52.9%) | 7 (41.2%) |
| 55 to 64 Years | 20 (36.4%) | 41 (74.6%) |
| 65 to 74 Years | 22 (100.0%) | 13 (59.1%) |
| 75 Years and over | 25 (100.0%) | 21 (84.0%) |
| Total | 123 (54.4%) | 139 (61.5%) |
Disability Status by Sex by Age in Kensington
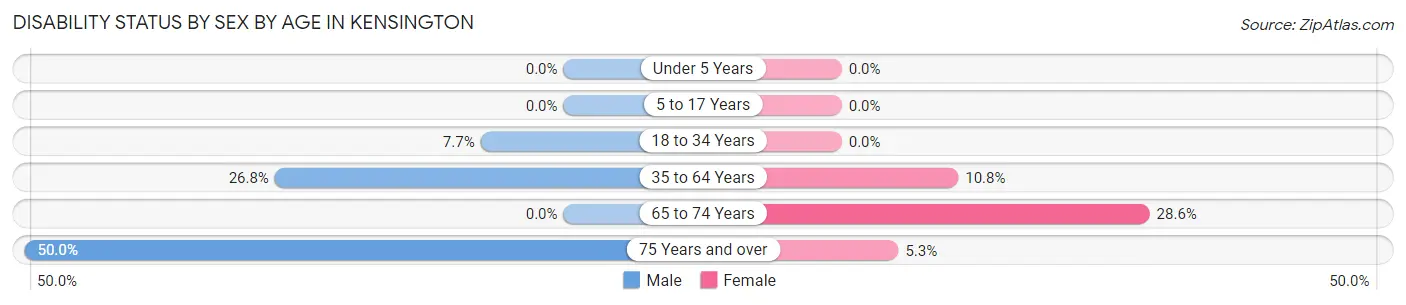
| Age Bracket | Male | Female |
| Under 5 Years | 0 (0.0%) | 0 (0.0%) |
| 5 to 17 Years | 0 (0.0%) | 0 (0.0%) |
| 18 to 34 Years | 2 (7.7%) | 0 (0.0%) |
| 35 to 64 Years | 15 (26.8%) | 4 (10.8%) |
| 65 to 74 Years | 0 (0.0%) | 4 (28.6%) |
| 75 Years and over | 3 (50.0%) | 1 (5.3%) |
Disability Class by Sex by Age in Kensington
Disability Class: Hearing Difficulty
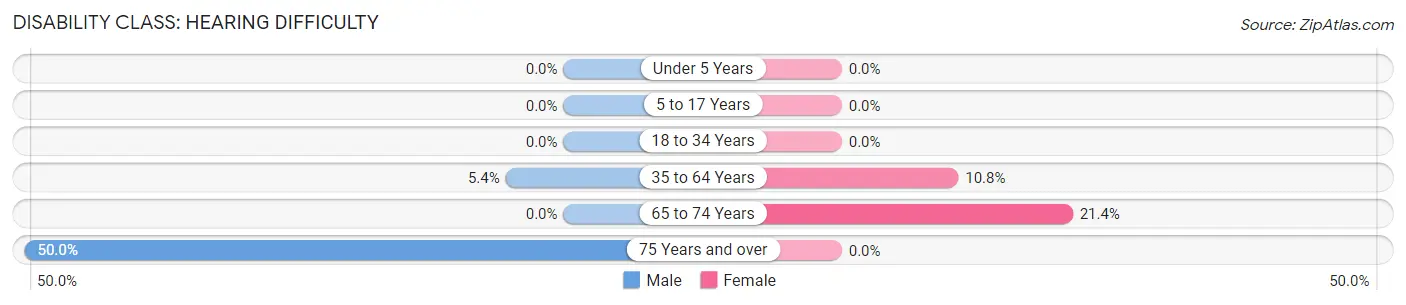
| Age Bracket | Male | Female |
| Under 5 Years | 0 (0.0%) | 0 (0.0%) |
| 5 to 17 Years | 0 (0.0%) | 0 (0.0%) |
| 18 to 34 Years | 0 (0.0%) | 0 (0.0%) |
| 35 to 64 Years | 3 (5.4%) | 4 (10.8%) |
| 65 to 74 Years | 0 (0.0%) | 3 (21.4%) |
| 75 Years and over | 3 (50.0%) | 0 (0.0%) |
Disability Class: Vision Difficulty
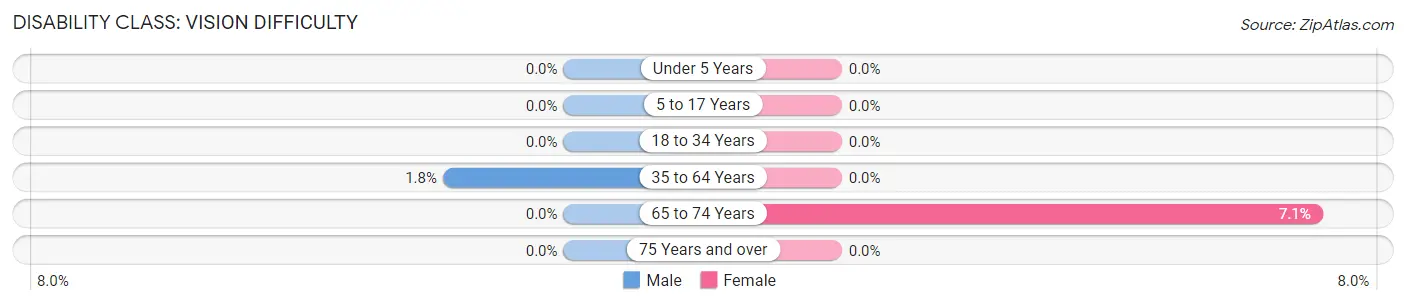
| Age Bracket | Male | Female |
| Under 5 Years | 0 (0.0%) | 0 (0.0%) |
| 5 to 17 Years | 0 (0.0%) | 0 (0.0%) |
| 18 to 34 Years | 0 (0.0%) | 0 (0.0%) |
| 35 to 64 Years | 1 (1.8%) | 0 (0.0%) |
| 65 to 74 Years | 0 (0.0%) | 1 (7.1%) |
| 75 Years and over | 0 (0.0%) | 0 (0.0%) |
Disability Class: Cognitive Difficulty
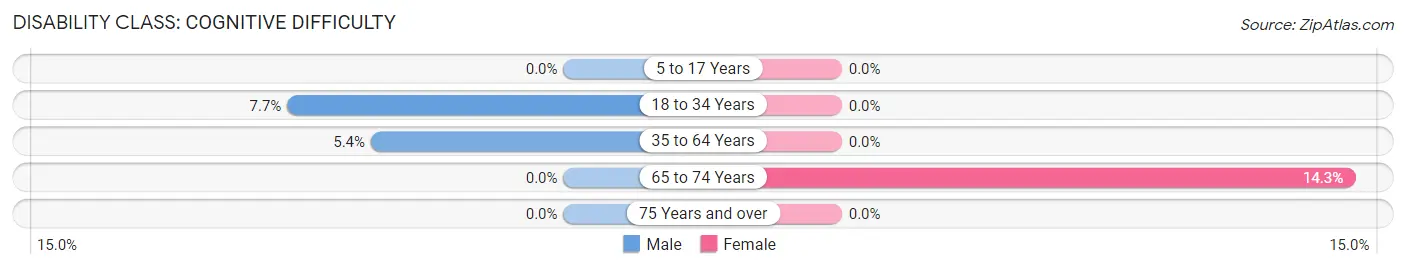
| Age Bracket | Male | Female |
| 5 to 17 Years | 0 (0.0%) | 0 (0.0%) |
| 18 to 34 Years | 2 (7.7%) | 0 (0.0%) |
| 35 to 64 Years | 3 (5.4%) | 0 (0.0%) |
| 65 to 74 Years | 0 (0.0%) | 2 (14.3%) |
| 75 Years and over | 0 (0.0%) | 0 (0.0%) |
Disability Class: Ambulatory Difficulty
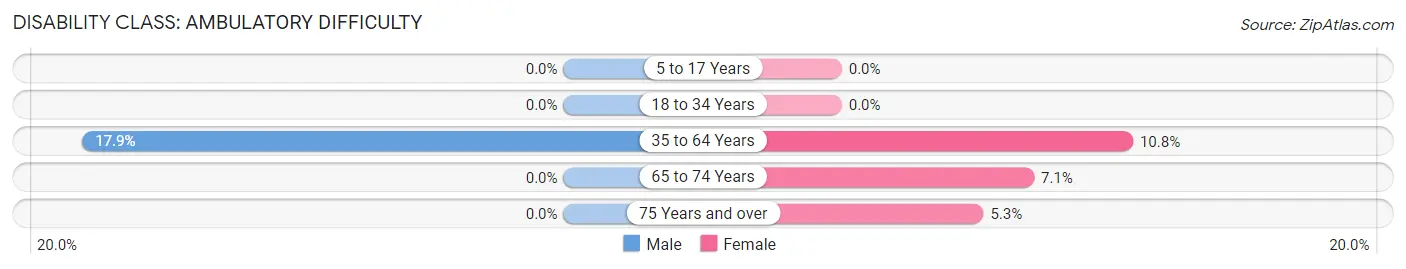
| Age Bracket | Male | Female |
| 5 to 17 Years | 0 (0.0%) | 0 (0.0%) |
| 18 to 34 Years | 0 (0.0%) | 0 (0.0%) |
| 35 to 64 Years | 10 (17.9%) | 4 (10.8%) |
| 65 to 74 Years | 0 (0.0%) | 1 (7.1%) |
| 75 Years and over | 0 (0.0%) | 1 (5.3%) |
Disability Class: Self-Care Difficulty
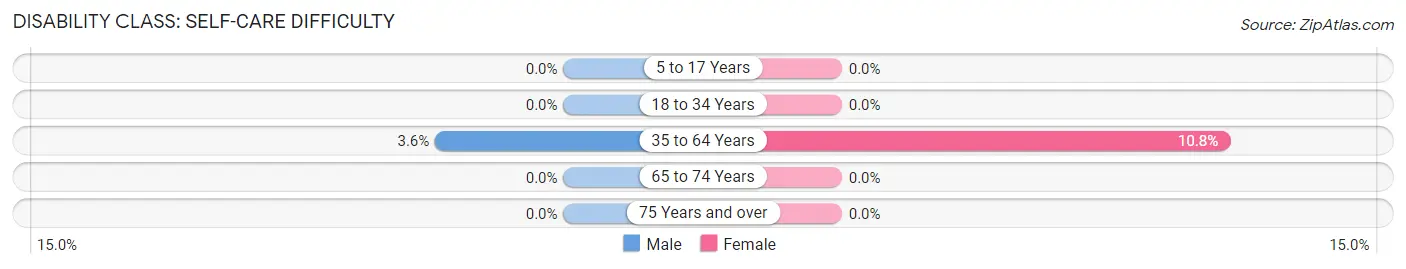
| Age Bracket | Male | Female |
| 5 to 17 Years | 0 (0.0%) | 0 (0.0%) |
| 18 to 34 Years | 0 (0.0%) | 0 (0.0%) |
| 35 to 64 Years | 2 (3.6%) | 4 (10.8%) |
| 65 to 74 Years | 0 (0.0%) | 0 (0.0%) |
| 75 Years and over | 0 (0.0%) | 0 (0.0%) |
Technology Access in Kensington
Computing Device Access in Kensington
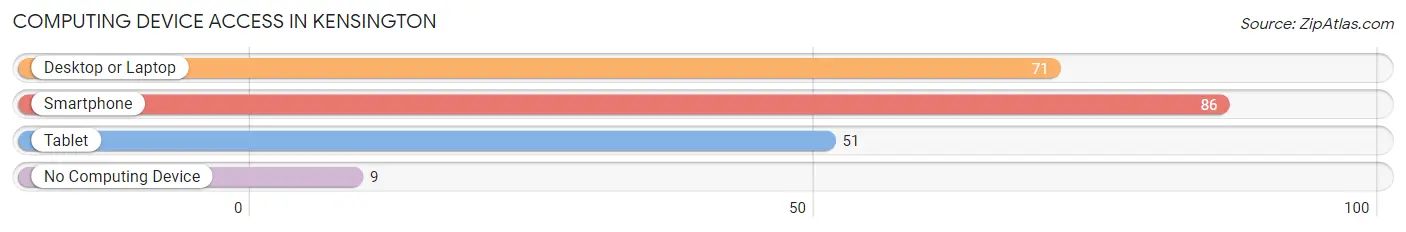
| Device Type | # Households | % Households |
| Desktop or Laptop | 71 | 62.3% |
| Smartphone | 86 | 75.4% |
| Tablet | 51 | 44.7% |
| No Computing Device | 9 | 7.9% |
| Total | 114 | 100.0% |
Internet Access in Kensington
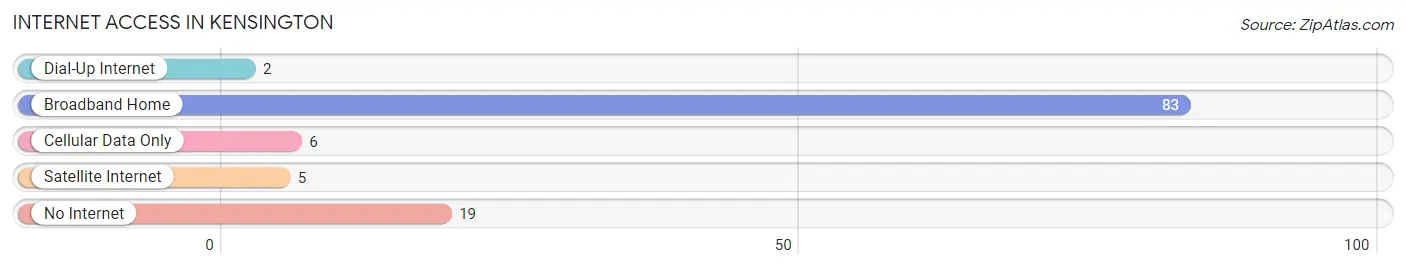
| Internet Type | # Households | % Households |
| Dial-Up Internet | 2 | 1.8% |
| Broadband Home | 83 | 72.8% |
| Cellular Data Only | 6 | 5.3% |
| Satellite Internet | 5 | 4.4% |
| No Internet | 19 | 16.7% |
| Total | 114 | 100.0% |
Kensington Summary
Kensington, Minnesota is a small town located in Douglas County, in the west-central part of the state. It is situated on the banks of the Pomme de Terre River, about 25 miles northwest of Alexandria. The town was founded in 1881 and was named after the English city of Kensington. As of the 2010 census, the population of Kensington was 545.
Geography
Kensington is located at the intersection of Minnesota State Highways 27 and 29. It is situated on the banks of the Pomme de Terre River, about 25 miles northwest of Alexandria. The town is surrounded by rolling hills and farmland, and is located in the Central Lakes region of Minnesota. The climate is humid continental, with cold winters and warm summers.
Economy
Kensington’s economy is largely based on agriculture and tourism. The town is home to several small businesses, including a grocery store, a hardware store, a restaurant, and a gas station. The town also has a small industrial park, which houses a few small manufacturing companies.
The town is also home to a number of recreational activities, including fishing, hunting, camping, and boating. The nearby Pomme de Terre State Park offers a variety of outdoor activities, including hiking, biking, and swimming.
Demographics
As of the 2010 census, the population of Kensington was 545. The racial makeup of the town was 97.3% White, 0.2% African American, 0.2% Native American, 0.2% Asian, 0.2% from other races, and 1.9% from two or more races. Hispanic or Latino of any race were 0.7% of the population.
The median income for a household in Kensington was $41,250, and the median income for a family was $45,000. The per capita income for the town was $19,845. About 8.2% of families and 10.2% of the population were below the poverty line, including 11.3% of those under age 18 and 8.3% of those age 65 or over.
History
Kensington was founded in 1881 by a group of settlers from England. The town was named after the English city of Kensington. The town was originally a farming community, and the main crops were wheat, oats, and barley.
In the early 1900s, the town began to grow and prosper. The railroad arrived in Kensington in 1906, and the town became a shipping center for the surrounding area. The town also became a popular tourist destination, and several hotels and resorts were built in the area.
In the 1950s, the town began to decline as the railroad industry declined. The town’s population decreased, and many of the businesses closed. In the late 1970s, the town began to experience a resurgence, and the population began to increase. Today, Kensington is a small but vibrant community, with a strong sense of community and pride.
Common Questions
What is Per Capita Income in Kensington?
Per Capita income in Kensington is $30,120.
What is the Median Family Income in Kensington?
Median Family Income in Kensington is $58,125.
What is the Median Household income in Kensington?
Median Household Income in Kensington is $45,000.
What is Income or Wage Gap in Kensington?
Income or Wage Gap in Kensington is 48.7%.
Women in Kensington earn 51.3 cents for every dollar earned by a man.
What is Inequality or Gini Index in Kensington?
Inequality or Gini Index in Kensington is 0.37.
What is the Total Population of Kensington?
Total Population of Kensington is 226.
What is the Total Male Population of Kensington?
Total Male Population of Kensington is 112.
What is the Total Female Population of Kensington?
Total Female Population of Kensington is 114.
What is the Ratio of Males per 100 Females in Kensington?
There are 98.25 Males per 100 Females in Kensington.
What is the Ratio of Females per 100 Males in Kensington?
There are 101.79 Females per 100 Males in Kensington.
What is the Median Population Age in Kensington?
Median Population Age in Kensington is 46.7 Years.
What is the Average Family Size in Kensington
Average Family Size in Kensington is 2.5 People.
What is the Average Household Size in Kensington
Average Household Size in Kensington is 2.0 People.
How Large is the Labor Force in Kensington?
There are 123 People in the Labor Forcein in Kensington.
What is the Percentage of People in the Labor Force in Kensington?
64.7% of People are in the Labor Force in Kensington.
What is the Unemployment Rate in Kensington?
Unemployment Rate in Kensington is 5.7%.