Hinckley, MN Map & Demographics
Hinckley Map
Hinckley Overview
$22,078
PER CAPITA INCOME
$50,972
AVG FAMILY INCOME
$40,909
AVG HOUSEHOLD INCOME
31.3%
WAGE / INCOME GAP [ % ]
68.7¢/ $1
WAGE / INCOME GAP [ $ ]
0.38
INEQUALITY / GINI INDEX
1,564
TOTAL POPULATION
779
MALE POPULATION
785
FEMALE POPULATION
99.24
MALES / 100 FEMALES
100.77
FEMALES / 100 MALES
42.7
MEDIAN AGE
3.1
AVG FAMILY SIZE
2.4
AVG HOUSEHOLD SIZE
736
LABOR FORCE [ PEOPLE ]
58.7%
PERCENT IN LABOR FORCE
9.5%
UNEMPLOYMENT RATE
Hinckley Zip Codes
Hinckley Area Codes
Income in Hinckley
Income Overview in Hinckley
Per Capita Income in Hinckley is $22,078, while median incomes of families and households are $50,972 and $40,909 respectively.
| Characteristic | Number | Measure |
| Per Capita Income | 1,564 | $22,078 |
| Median Family Income | 361 | $50,972 |
| Mean Family Income | 361 | $57,891 |
| Median Household Income | 640 | $40,909 |
| Mean Household Income | 640 | $51,718 |
| Income Deficit | 361 | $0 |
| Wage / Income Gap (%) | 1,564 | 31.34% |
| Wage / Income Gap ($) | 1,564 | 68.66¢ per $1 |
| Gini / Inequality Index | 1,564 | 0.38 |
Earnings by Sex in Hinckley
Average Earnings in Hinckley are $28,944, $35,536 for men and $24,398 for women, a difference of 31.3%.
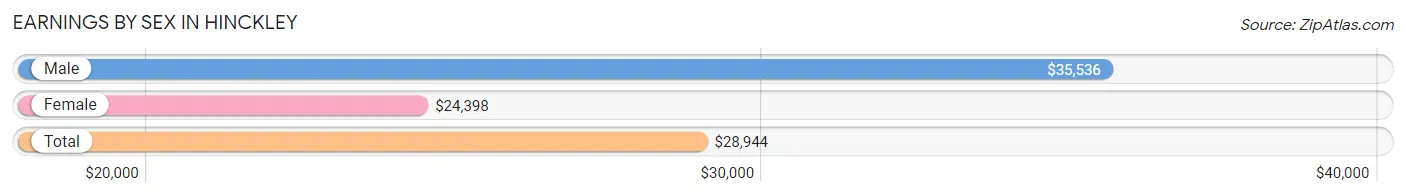
| Sex | Number | Average Earnings |
| Male | 351 (46.3%) | $35,536 |
| Female | 407 (53.7%) | $24,398 |
| Total | 758 (100.0%) | $28,944 |
Earnings by Sex by Income Bracket in Hinckley
The most common earnings brackets in Hinckley are $65,000 to $74,999 for men (43 | 12.2%) and $2,499 or less for women (49 | 12.0%).
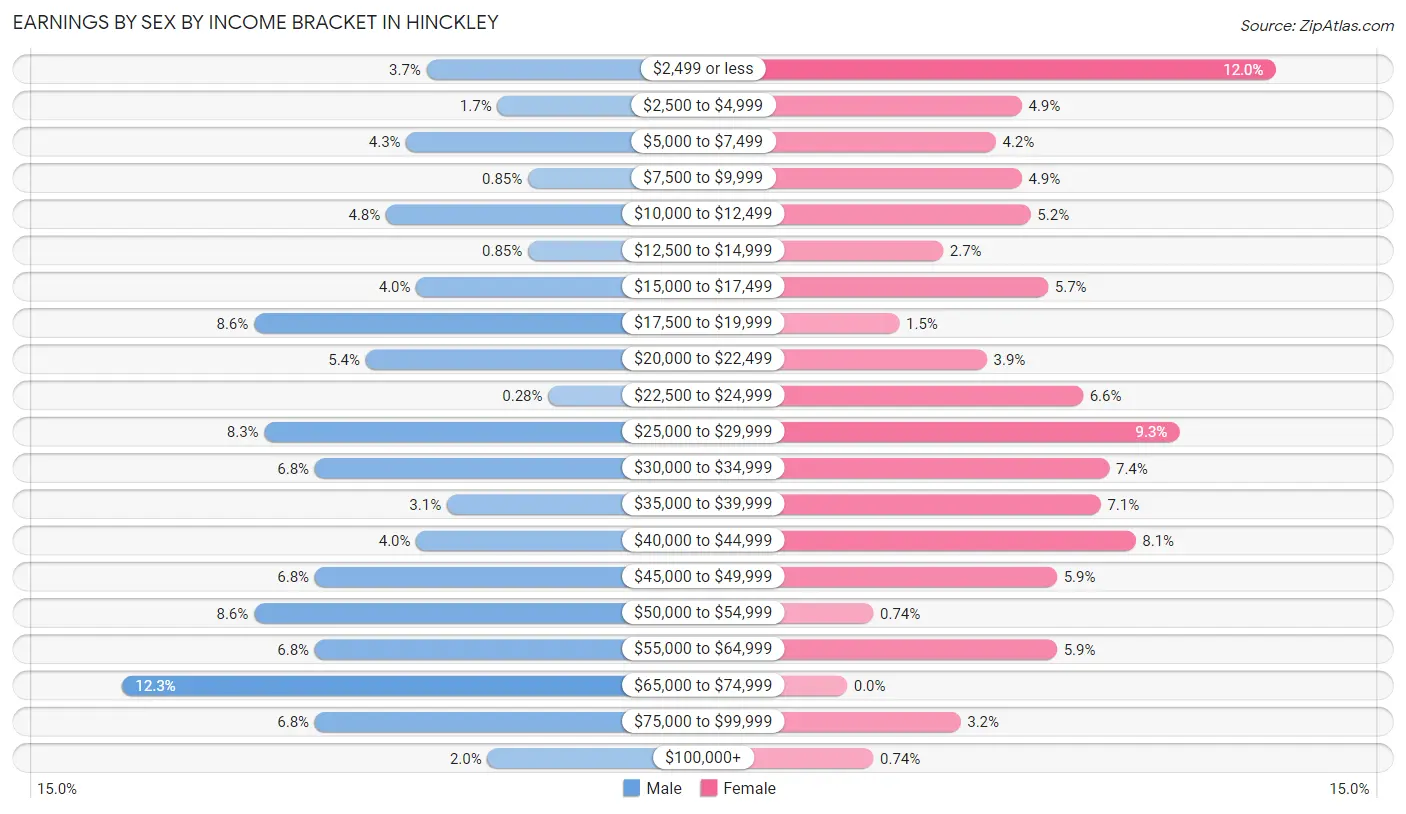
| Income | Male | Female |
| $2,499 or less | 13 (3.7%) | 49 (12.0%) |
| $2,500 to $4,999 | 6 (1.7%) | 20 (4.9%) |
| $5,000 to $7,499 | 15 (4.3%) | 17 (4.2%) |
| $7,500 to $9,999 | 3 (0.9%) | 20 (4.9%) |
| $10,000 to $12,499 | 17 (4.8%) | 21 (5.2%) |
| $12,500 to $14,999 | 3 (0.9%) | 11 (2.7%) |
| $15,000 to $17,499 | 14 (4.0%) | 23 (5.7%) |
| $17,500 to $19,999 | 30 (8.6%) | 6 (1.5%) |
| $20,000 to $22,499 | 19 (5.4%) | 16 (3.9%) |
| $22,500 to $24,999 | 1 (0.3%) | 27 (6.6%) |
| $25,000 to $29,999 | 29 (8.3%) | 38 (9.3%) |
| $30,000 to $34,999 | 24 (6.8%) | 30 (7.4%) |
| $35,000 to $39,999 | 11 (3.1%) | 29 (7.1%) |
| $40,000 to $44,999 | 14 (4.0%) | 33 (8.1%) |
| $45,000 to $49,999 | 24 (6.8%) | 24 (5.9%) |
| $50,000 to $54,999 | 30 (8.6%) | 3 (0.7%) |
| $55,000 to $64,999 | 24 (6.8%) | 24 (5.9%) |
| $65,000 to $74,999 | 43 (12.2%) | 0 (0.0%) |
| $75,000 to $99,999 | 24 (6.8%) | 13 (3.2%) |
| $100,000+ | 7 (2.0%) | 3 (0.7%) |
| Total | 351 (100.0%) | 407 (100.0%) |
Earnings by Sex by Educational Attainment in Hinckley
Average earnings in Hinckley are $41,339 for men and $27,596 for women, a difference of 33.2%. Men with an educational attainment of college or associate's degree enjoy the highest average annual earnings of $58,438, while those with high school diploma education earn the least with $28,977. Women with an educational attainment of less than high school earn the most with the average annual earnings of $29,375, while those with high school diploma education have the smallest earnings of $22,266.
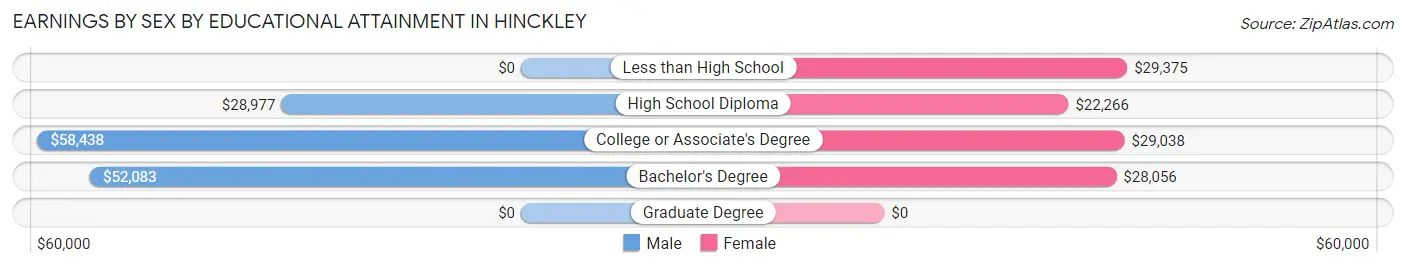
| Educational Attainment | Male Income | Female Income |
| Less than High School | - | - |
| High School Diploma | $28,977 | $22,266 |
| College or Associate's Degree | $58,438 | $29,038 |
| Bachelor's Degree | $52,083 | $28,056 |
| Graduate Degree | - | - |
| Total | $41,339 | $27,596 |
Family Income in Hinckley
Family Income Brackets in Hinckley
According to the Hinckley family income data, there are 90 families falling into the $35,000 to $49,999 income range, which is the most common income bracket and makes up 24.9% of all families.
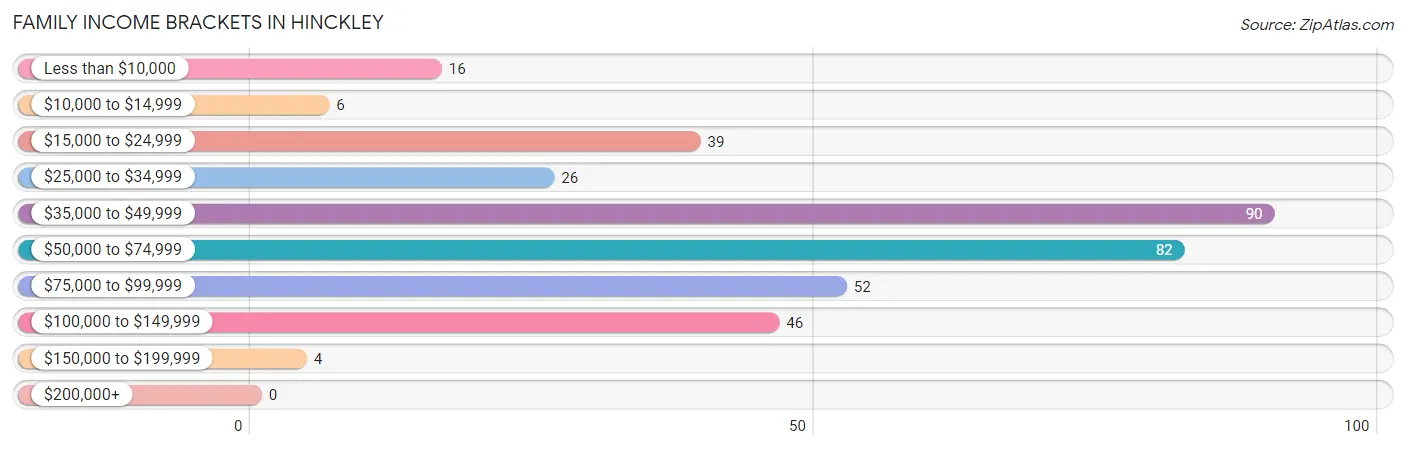
| Income Bracket | # Families | % Families |
| Less than $10,000 | 16 | 4.4% |
| $10,000 to $14,999 | 6 | 1.7% |
| $15,000 to $24,999 | 39 | 10.8% |
| $25,000 to $34,999 | 26 | 7.2% |
| $35,000 to $49,999 | 90 | 24.9% |
| $50,000 to $74,999 | 82 | 22.7% |
| $75,000 to $99,999 | 52 | 14.4% |
| $100,000 to $149,999 | 46 | 12.7% |
| $150,000 to $199,999 | 4 | 1.1% |
| $200,000+ | 0 | 0.0% |
Family Income by Famaliy Size in Hinckley
4-person families (34 | 9.4%) account for the highest median family income in Hinckley with $120,500 per family, while 4-person families (34 | 9.4%) have the highest median income of $30,125 per family member.
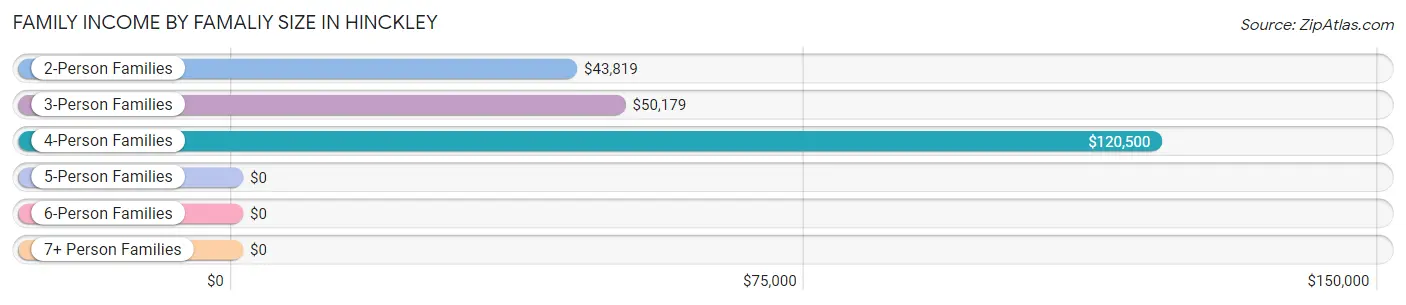
| Income Bracket | # Families | Median Income |
| 2-Person Families | 237 (65.6%) | $43,819 |
| 3-Person Families | 59 (16.3%) | $50,179 |
| 4-Person Families | 34 (9.4%) | $120,500 |
| 5-Person Families | 3 (0.8%) | $0 |
| 6-Person Families | 8 (2.2%) | $0 |
| 7+ Person Families | 20 (5.5%) | $0 |
| Total | 361 (100.0%) | $50,972 |
Family Income by Number of Earners in Hinckley
The median family income in Hinckley is $50,972, with families comprising 3+ earners (23) having the highest median family income of $121,750, while families with no earners (94) have the lowest median family income of $35,833, accounting for 6.4% and 26.0% of families, respectively.
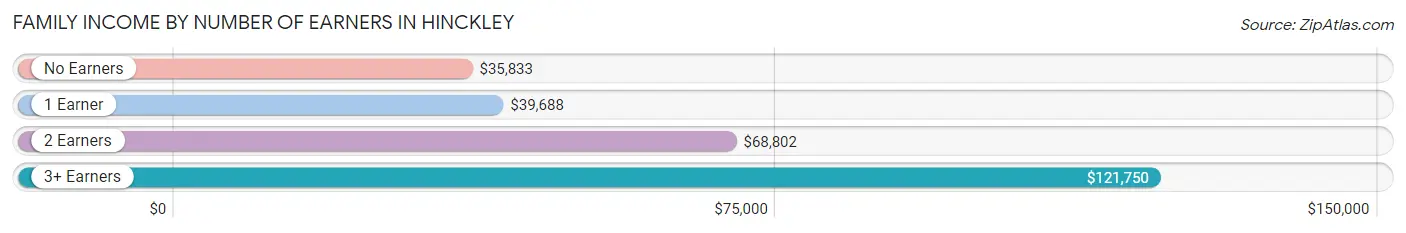
| Number of Earners | # Families | Median Income |
| No Earners | 94 (26.0%) | $35,833 |
| 1 Earner | 95 (26.3%) | $39,688 |
| 2 Earners | 149 (41.3%) | $68,802 |
| 3+ Earners | 23 (6.4%) | $121,750 |
| Total | 361 (100.0%) | $50,972 |
Household Income in Hinckley
Household Income Brackets in Hinckley
With 138 households falling in the category, the $50,000 to $74,999 income range is the most frequent in Hinckley, accounting for 21.6% of all households. In contrast, only 3 households (0.5%) fall into the $200,000+ income bracket, making it the least populous group.
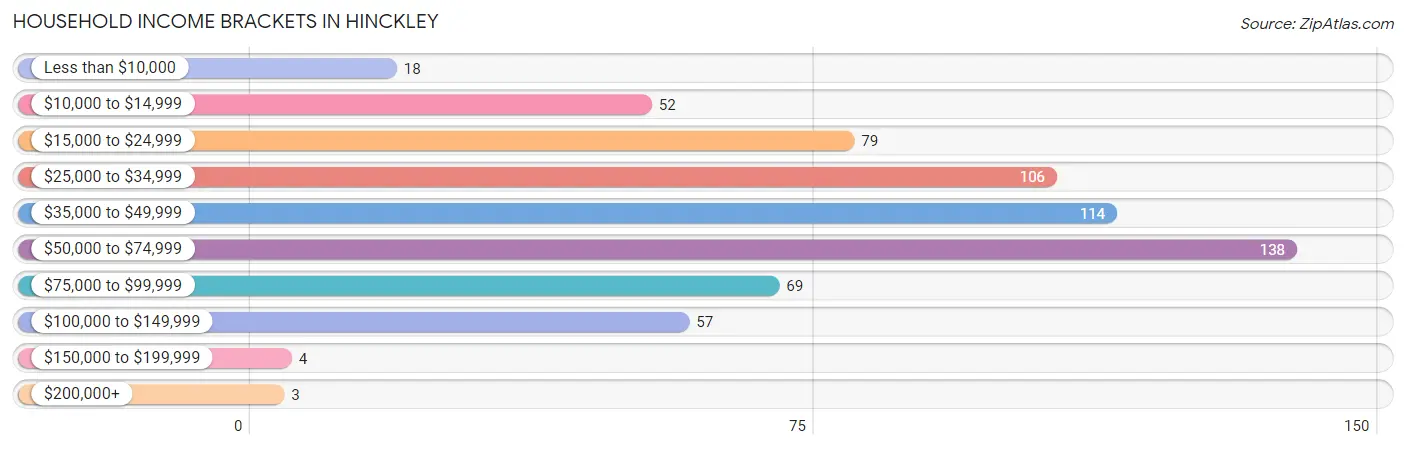
| Income Bracket | # Households | % Households |
| Less than $10,000 | 18 | 2.8% |
| $10,000 to $14,999 | 52 | 8.1% |
| $15,000 to $24,999 | 79 | 12.3% |
| $25,000 to $34,999 | 106 | 16.6% |
| $35,000 to $49,999 | 114 | 17.8% |
| $50,000 to $74,999 | 138 | 21.6% |
| $75,000 to $99,999 | 69 | 10.8% |
| $100,000 to $149,999 | 57 | 8.9% |
| $150,000 to $199,999 | 4 | 0.6% |
| $200,000+ | 3 | 0.5% |
Household Income by Householder Age in Hinckley
The median household income in Hinckley is $40,909, with the highest median household income of $68,478 found in the 25 to 44 years age bracket for the primary householder. A total of 154 households (24.1%) fall into this category. Meanwhile, the 15 to 24 years age bracket for the primary householder has the lowest median household income of $0, with 5 households (0.8%) in this group.
| Income Bracket | # Households | Median Income |
| 15 to 24 Years | 5 (0.8%) | $0 |
| 25 to 44 Years | 154 (24.1%) | $68,478 |
| 45 to 64 Years | 231 (36.1%) | $41,375 |
| 65+ Years | 250 (39.1%) | $35,102 |
| Total | 640 (100.0%) | $40,909 |
Poverty in Hinckley
Income Below Poverty by Sex and Age in Hinckley
With 26.5% poverty level for males and 15.4% for females among the residents of Hinckley, 5 year old males and 35 to 44 year old females are the most vulnerable to poverty, with 36 males (100.0%) and 31 females (50.8%) in their respective age groups living below the poverty level.
| Age Bracket | Male | Female |
| Under 5 Years | 8 (19.5%) | 3 (5.7%) |
| 5 Years | 36 (100.0%) | 0 (0.0%) |
| 6 to 11 Years | 3 (14.3%) | 16 (41.0%) |
| 12 to 14 Years | 0 (0.0%) | 6 (15.8%) |
| 15 Years | 0 (0.0%) | 0 (0.0%) |
| 16 and 17 Years | 8 (25.0%) | 4 (12.9%) |
| 18 to 24 Years | 38 (66.7%) | 14 (34.2%) |
| 25 to 34 Years | 16 (16.7%) | 13 (16.7%) |
| 35 to 44 Years | 29 (24.0%) | 31 (50.8%) |
| 45 to 54 Years | 10 (14.9%) | 4 (3.5%) |
| 55 to 64 Years | 22 (28.6%) | 19 (14.8%) |
| 65 to 74 Years | 32 (34.8%) | 5 (8.1%) |
| 75 Years and over | 3 (3.0%) | 4 (4.8%) |
| Total | 205 (26.5%) | 119 (15.4%) |
Income Above Poverty by Sex and Age in Hinckley
According to the poverty statistics in Hinckley, males aged 12 to 14 years and females aged 5 years are the age groups that are most secure financially, with 100.0% of males and 100.0% of females in these age groups living above the poverty line.
| Age Bracket | Male | Female |
| Under 5 Years | 33 (80.5%) | 50 (94.3%) |
| 5 Years | 0 (0.0%) | 3 (100.0%) |
| 6 to 11 Years | 18 (85.7%) | 23 (59.0%) |
| 12 to 14 Years | 21 (100.0%) | 32 (84.2%) |
| 15 Years | 12 (100.0%) | 37 (100.0%) |
| 16 and 17 Years | 24 (75.0%) | 27 (87.1%) |
| 18 to 24 Years | 19 (33.3%) | 27 (65.8%) |
| 25 to 34 Years | 80 (83.3%) | 65 (83.3%) |
| 35 to 44 Years | 92 (76.0%) | 30 (49.2%) |
| 45 to 54 Years | 57 (85.1%) | 112 (96.6%) |
| 55 to 64 Years | 55 (71.4%) | 109 (85.2%) |
| 65 to 74 Years | 60 (65.2%) | 57 (91.9%) |
| 75 Years and over | 98 (97.0%) | 80 (95.2%) |
| Total | 569 (73.5%) | 652 (84.6%) |
Income Below Poverty Among Married-Couple Families in Hinckley
The poverty statistics for married-couple families in Hinckley show that 2.9% or 7 of the total 238 families live below the poverty line. Families with 1 or 2 children have the highest poverty rate of 6.6%, comprising of 4 families. On the other hand, families with 3 or 4 children have the lowest poverty rate of 0.0%, which includes 0 families.
| Children | Above Poverty | Below Poverty |
| No Children | 151 (98.1%) | 3 (1.9%) |
| 1 or 2 Children | 57 (93.4%) | 4 (6.6%) |
| 3 or 4 Children | 7 (100.0%) | 0 (0.0%) |
| 5 or more Children | 16 (100.0%) | 0 (0.0%) |
| Total | 231 (97.1%) | 7 (2.9%) |
Income Below Poverty Among Single-Parent Households in Hinckley
According to the poverty data in Hinckley, 33.3% or 11 single-father households and 37.8% or 34 single-mother households are living below the poverty line. Among single-father households, those with no children have the highest poverty rate, with 11 households (64.7%) experiencing poverty. Likewise, among single-mother households, those with 1 or 2 children have the highest poverty rate, with 23 households (69.7%) falling below the poverty line.
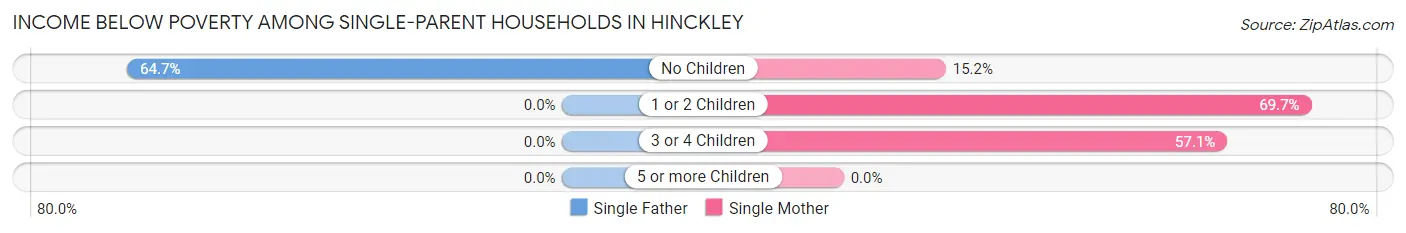
| Children | Single Father | Single Mother |
| No Children | 11 (64.7%) | 7 (15.2%) |
| 1 or 2 Children | 0 (0.0%) | 23 (69.7%) |
| 3 or 4 Children | 0 (0.0%) | 4 (57.1%) |
| 5 or more Children | 0 (0.0%) | 0 (0.0%) |
| Total | 11 (33.3%) | 34 (37.8%) |
Income Below Poverty Among Married-Couple vs Single-Parent Households in Hinckley
The poverty data for Hinckley shows that 7 of the married-couple family households (2.9%) and 45 of the single-parent households (36.6%) are living below the poverty level. Within the married-couple family households, those with 1 or 2 children have the highest poverty rate, with 4 households (6.6%) falling below the poverty line. Among the single-parent households, those with 1 or 2 children have the highest poverty rate, with 23 household (51.1%) living below poverty.
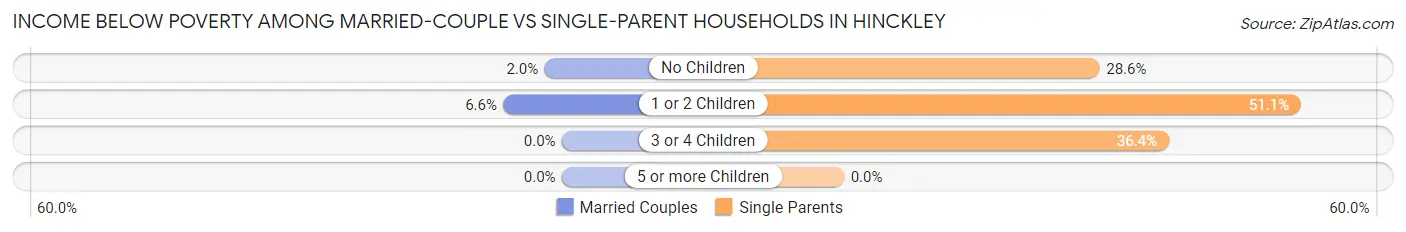
| Children | Married-Couple Families | Single-Parent Households |
| No Children | 3 (1.9%) | 18 (28.6%) |
| 1 or 2 Children | 4 (6.6%) | 23 (51.1%) |
| 3 or 4 Children | 0 (0.0%) | 4 (36.4%) |
| 5 or more Children | 0 (0.0%) | 0 (0.0%) |
| Total | 7 (2.9%) | 45 (36.6%) |
Race in Hinckley
The most populous races in Hinckley are White / Caucasian (1,228 | 78.5%), Two or more Races (168 | 10.7%), and Native / Alaskan (139 | 8.9%).
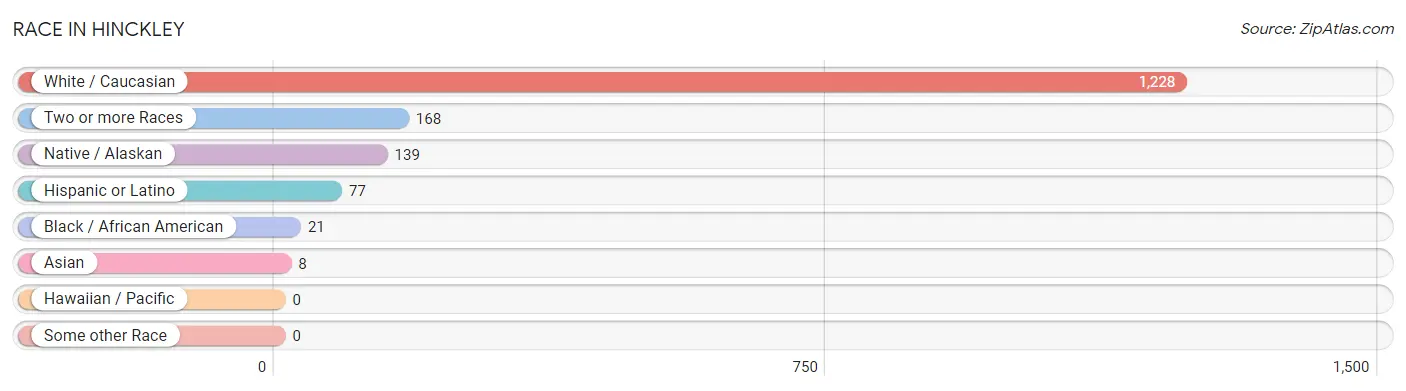
| Race | # Population | % Population |
| Asian | 8 | 0.5% |
| Black / African American | 21 | 1.3% |
| Hawaiian / Pacific | 0 | 0.0% |
| Hispanic or Latino | 77 | 4.9% |
| Native / Alaskan | 139 | 8.9% |
| White / Caucasian | 1,228 | 78.5% |
| Two or more Races | 168 | 10.7% |
| Some other Race | 0 | 0.0% |
| Total | 1,564 | 100.0% |
Ancestry in Hinckley
The most populous ancestries reported in Hinckley are German (448 | 28.6%), Swedish (187 | 12.0%), Chippewa (169 | 10.8%), Irish (115 | 7.3%), and American (90 | 5.8%), together accounting for 64.5% of all Hinckley residents.
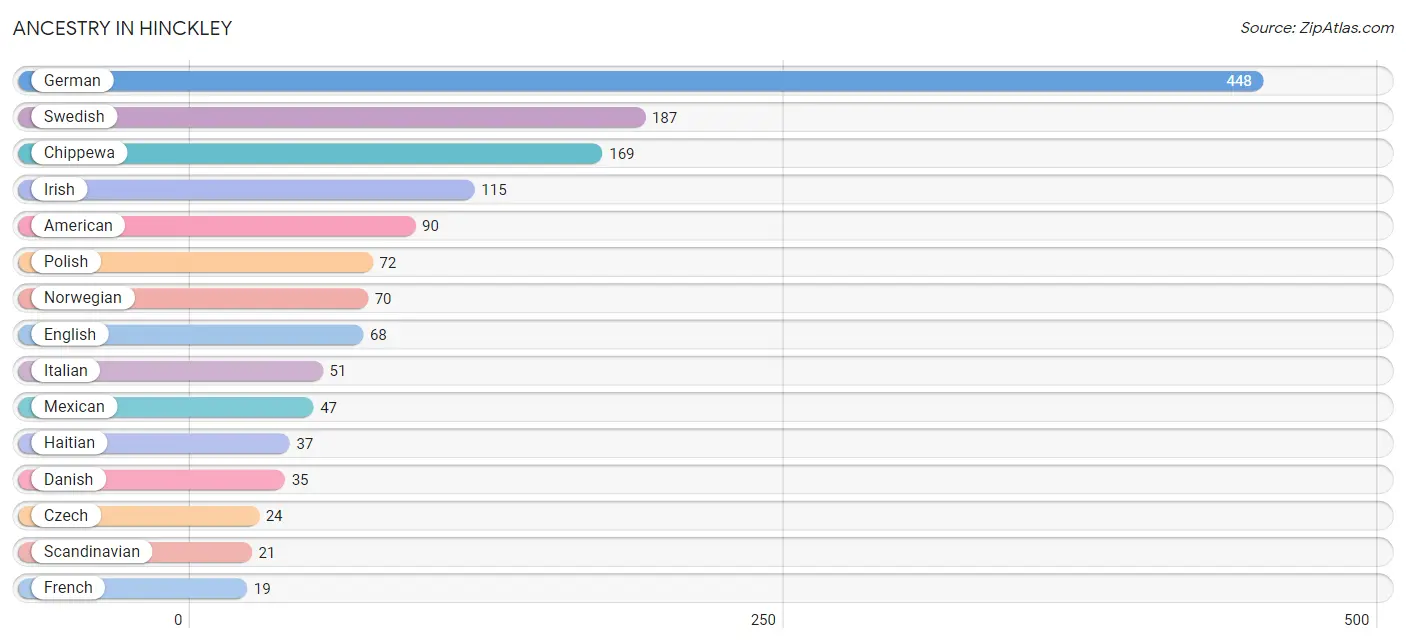
| Ancestry | # Population | % Population |
| African | 4 | 0.3% |
| American | 90 | 5.8% |
| Austrian | 5 | 0.3% |
| Central American | 9 | 0.6% |
| Cherokee | 8 | 0.5% |
| Chippewa | 169 | 10.8% |
| Czech | 24 | 1.5% |
| Danish | 35 | 2.2% |
| Dominican | 9 | 0.6% |
| Dutch | 4 | 0.3% |
| English | 68 | 4.3% |
| Finnish | 18 | 1.1% |
| French | 19 | 1.2% |
| French Canadian | 19 | 1.2% |
| German | 448 | 28.6% |
| Haitian | 37 | 2.4% |
| Indian (Asian) | 9 | 0.6% |
| Irish | 115 | 7.3% |
| Italian | 51 | 3.3% |
| Korean | 8 | 0.5% |
| Lithuanian | 10 | 0.6% |
| Mexican | 47 | 3.0% |
| Norwegian | 70 | 4.5% |
| Pakistani | 1 | 0.1% |
| Panamanian | 9 | 0.6% |
| Polish | 72 | 4.6% |
| Puerto Rican | 4 | 0.3% |
| Scandinavian | 21 | 1.3% |
| Scottish | 3 | 0.2% |
| Sioux | 14 | 0.9% |
| Slavic | 7 | 0.4% |
| Subsaharan African | 4 | 0.3% |
| Swedish | 187 | 12.0% | View All 33 Rows |
Immigrants in Hinckley
The most numerous immigrant groups reported in Hinckley came from Asia (8 | 0.5%), Philippines (8 | 0.5%), South Eastern Asia (8 | 0.5%), Africa (4 | 0.3%), and Eastern Africa (4 | 0.3%), together accounting for 2.0% of all Hinckley residents.
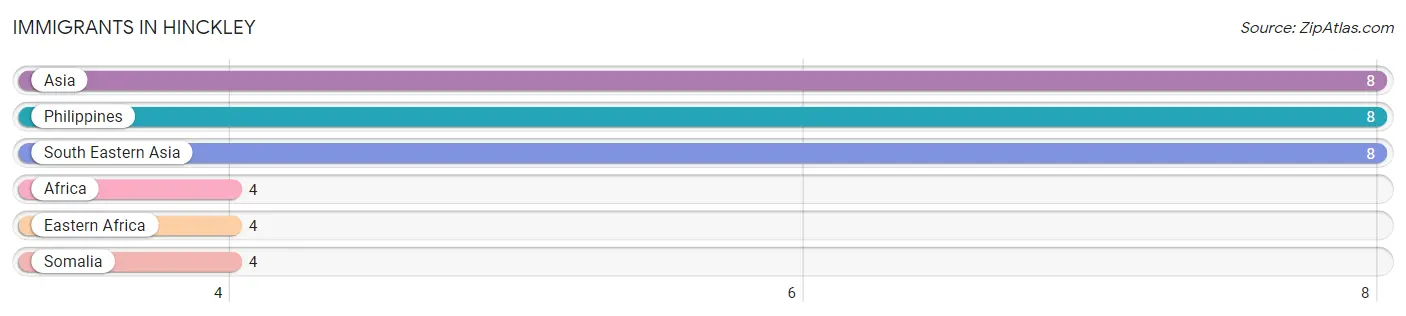
| Immigration Origin | # Population | % Population |
| Africa | 4 | 0.3% |
| Asia | 8 | 0.5% |
| Eastern Africa | 4 | 0.3% |
| Philippines | 8 | 0.5% |
| Somalia | 4 | 0.3% |
| South Eastern Asia | 8 | 0.5% | View All 6 Rows |
Sex and Age in Hinckley
Sex and Age in Hinckley
The most populous age groups in Hinckley are 40 to 44 Years (73 | 9.4%) for men and 50 to 54 Years (86 | 11.0%) for women.
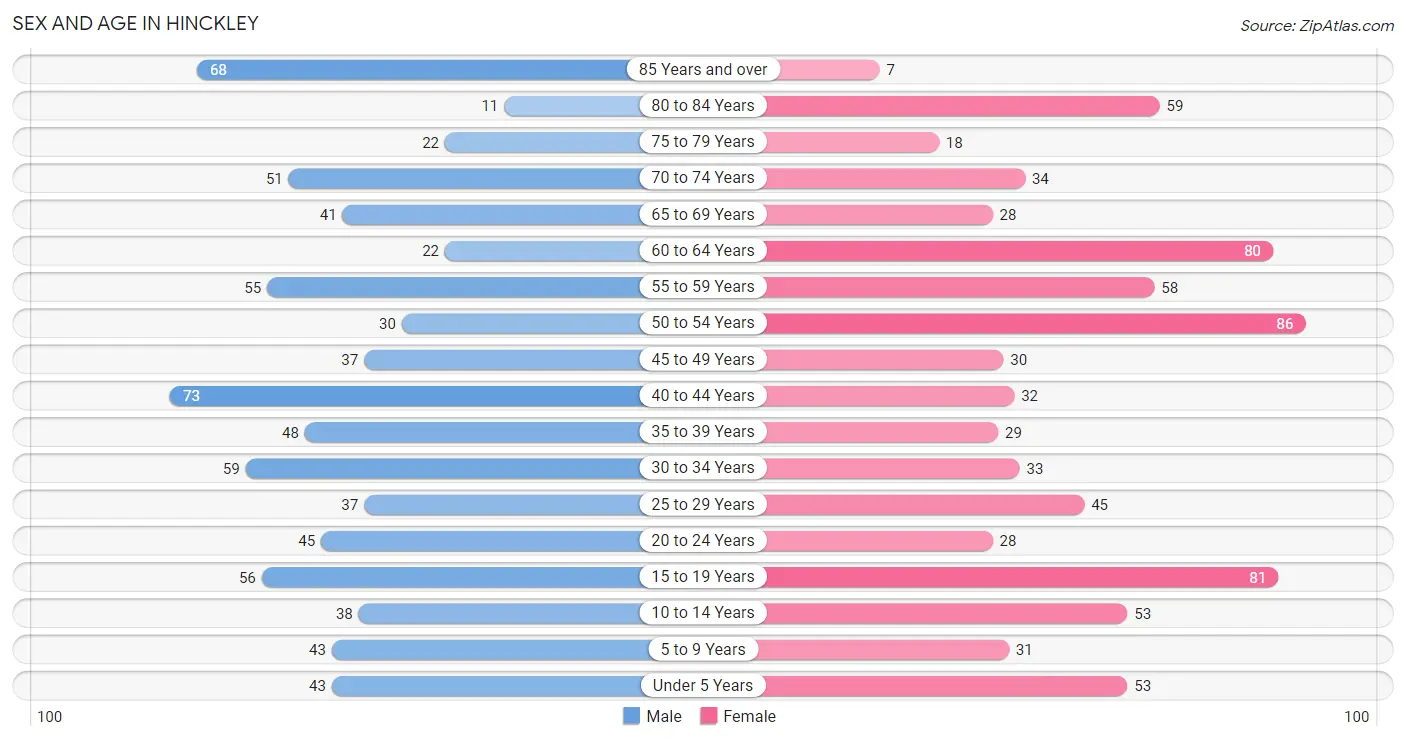
| Age Bracket | Male | Female |
| Under 5 Years | 43 (5.5%) | 53 (6.8%) |
| 5 to 9 Years | 43 (5.5%) | 31 (4.0%) |
| 10 to 14 Years | 38 (4.9%) | 53 (6.8%) |
| 15 to 19 Years | 56 (7.2%) | 81 (10.3%) |
| 20 to 24 Years | 45 (5.8%) | 28 (3.6%) |
| 25 to 29 Years | 37 (4.8%) | 45 (5.7%) |
| 30 to 34 Years | 59 (7.6%) | 33 (4.2%) |
| 35 to 39 Years | 48 (6.2%) | 29 (3.7%) |
| 40 to 44 Years | 73 (9.4%) | 32 (4.1%) |
| 45 to 49 Years | 37 (4.8%) | 30 (3.8%) |
| 50 to 54 Years | 30 (3.8%) | 86 (11.0%) |
| 55 to 59 Years | 55 (7.1%) | 58 (7.4%) |
| 60 to 64 Years | 22 (2.8%) | 80 (10.2%) |
| 65 to 69 Years | 41 (5.3%) | 28 (3.6%) |
| 70 to 74 Years | 51 (6.6%) | 34 (4.3%) |
| 75 to 79 Years | 22 (2.8%) | 18 (2.3%) |
| 80 to 84 Years | 11 (1.4%) | 59 (7.5%) |
| 85 Years and over | 68 (8.7%) | 7 (0.9%) |
| Total | 779 (100.0%) | 785 (100.0%) |
Families and Households in Hinckley
Median Family Size in Hinckley
The median family size in Hinckley is 3.09 persons per family, with single female/mother families (90 | 24.9%) accounting for the largest median family size of 3.53 persons per family. On the other hand, single male/father families (33 | 9.1%) represent the smallest median family size with 2.91 persons per family.
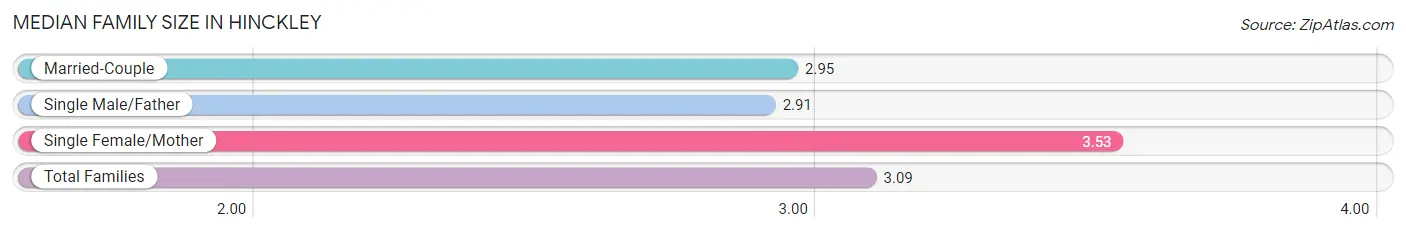
| Family Type | # Families | Family Size |
| Married-Couple | 238 (65.9%) | 2.95 |
| Single Male/Father | 33 (9.1%) | 2.91 |
| Single Female/Mother | 90 (24.9%) | 3.53 |
| Total Families | 361 (100.0%) | 3.09 |
Median Household Size in Hinckley
The median household size in Hinckley is 2.42 persons per household, with single female/mother households (90 | 14.1%) accounting for the largest median household size of 4.13 persons per household. non-family households (279 | 43.6%) represent the smallest median household size with 1.28 persons per household.
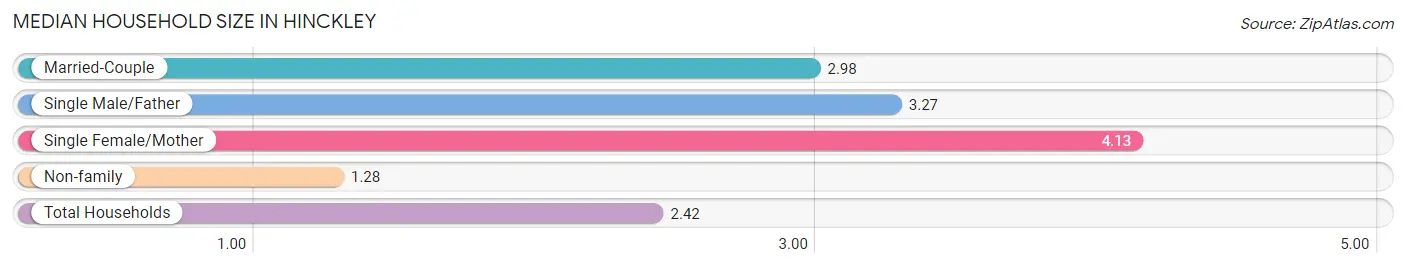
| Household Type | # Households | Household Size |
| Married-Couple | 238 (37.2%) | 2.98 |
| Single Male/Father | 33 (5.2%) | 3.27 |
| Single Female/Mother | 90 (14.1%) | 4.13 |
| Non-family | 279 (43.6%) | 1.28 |
| Total Households | 640 (100.0%) | 2.42 |
Household Size by Marriage Status in Hinckley
Out of a total of 640 households in Hinckley, 361 (56.4%) are family households, while 279 (43.6%) are nonfamily households. The most numerous type of family households are 2-person households, comprising 210, and the most common type of nonfamily households are 1-person households, comprising 227.
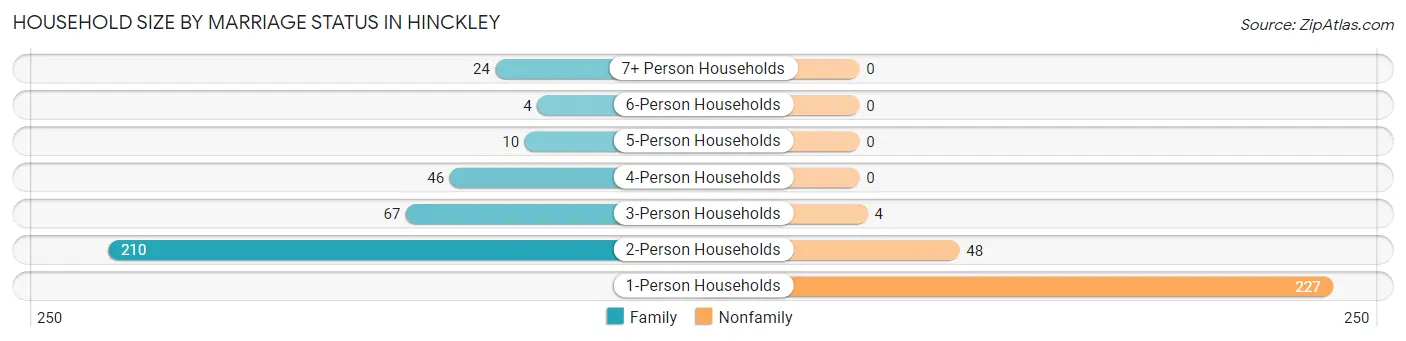
| Household Size | Family Households | Nonfamily Households |
| 1-Person Households | - | 227 (35.5%) |
| 2-Person Households | 210 (32.8%) | 48 (7.5%) |
| 3-Person Households | 67 (10.5%) | 4 (0.6%) |
| 4-Person Households | 46 (7.2%) | 0 (0.0%) |
| 5-Person Households | 10 (1.6%) | 0 (0.0%) |
| 6-Person Households | 4 (0.6%) | 0 (0.0%) |
| 7+ Person Households | 24 (3.7%) | 0 (0.0%) |
| Total | 361 (56.4%) | 279 (43.6%) |
Female Fertility in Hinckley
Fertility by Age in Hinckley
| Age Bracket | Women with Births | Births / 1,000 Women |
| 15 to 19 years | 0 (0.0%) | 0.0 |
| 20 to 34 years | 0 (0.0%) | 0.0 |
| 35 to 50 years | 0 (0.0%) | 0.0 |
| Total | 0 (0.0%) | 0.0 |
Fertility by Age by Marriage Status in Hinckley
| Age Bracket | Married | Unmarried |
| 15 to 19 years | 0 (0.0%) | 0 (0.0%) |
| 20 to 34 years | 0 (0.0%) | 0 (0.0%) |
| 35 to 50 years | 0 (0.0%) | 0 (0.0%) |
| Total | 0 (0.0%) | 0 (0.0%) |
Fertility by Education in Hinckley
| Educational Attainment | Women with Births | Births / 1,000 Women |
| Less than High School | 0 (0.0%) | 0.0 |
| High School Diploma | 0 (0.0%) | 0.0 |
| College or Associate's Degree | 0 (0.0%) | 0.0 |
| Bachelor's Degree | 0 (0.0%) | 0.0 |
| Graduate Degree | 0 (0.0%) | 0.0 |
| Total | 0 (0.0%) | 0.0 |
Fertility by Education by Marriage Status in Hinckley
| Educational Attainment | Married | Unmarried |
| Less than High School | 0 (0.0%) | 0 (0.0%) |
| High School Diploma | 0 (0.0%) | 0 (0.0%) |
| College or Associate's Degree | 0 (0.0%) | 0 (0.0%) |
| Bachelor's Degree | 0 (0.0%) | 0 (0.0%) |
| Graduate Degree | 0 (0.0%) | 0 (0.0%) |
| Total | 0 (0.0%) | 0 (0.0%) |
Employment Characteristics in Hinckley
Employment by Class of Employer in Hinckley
Among the 663 employed individuals in Hinckley, private company employees (429 | 64.7%), federal government employees (58 | 8.7%), and not-for-profit organizations (51 | 7.7%) make up the most common classes of employment.
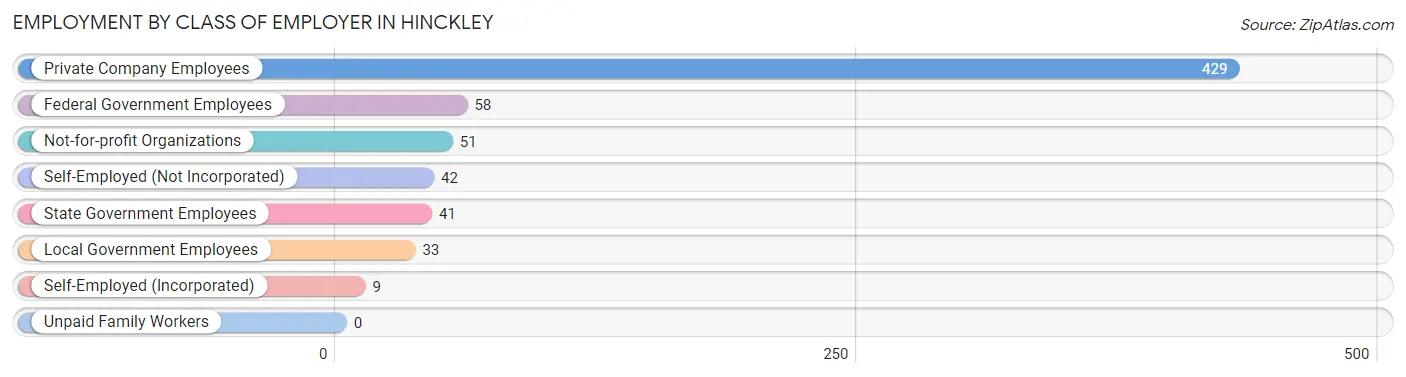
| Employer Class | # Employees | % Employees |
| Private Company Employees | 429 | 64.7% |
| Self-Employed (Incorporated) | 9 | 1.4% |
| Self-Employed (Not Incorporated) | 42 | 6.3% |
| Not-for-profit Organizations | 51 | 7.7% |
| Local Government Employees | 33 | 5.0% |
| State Government Employees | 41 | 6.2% |
| Federal Government Employees | 58 | 8.7% |
| Unpaid Family Workers | 0 | 0.0% |
| Total | 663 | 100.0% |
Employment Status by Age in Hinckley
According to the labor force statistics for Hinckley, out of the total population over 16 years of age (1,254), 58.7% or 736 individuals are in the labor force, with 9.5% or 70 of them unemployed. The age group with the highest labor force participation rate is 30 to 34 years, with 100.0% or 92 individuals in the labor force. Within the labor force, the 20 to 24 years age range has the highest percentage of unemployed individuals, with 33.3% or 19 of them being unemployed.
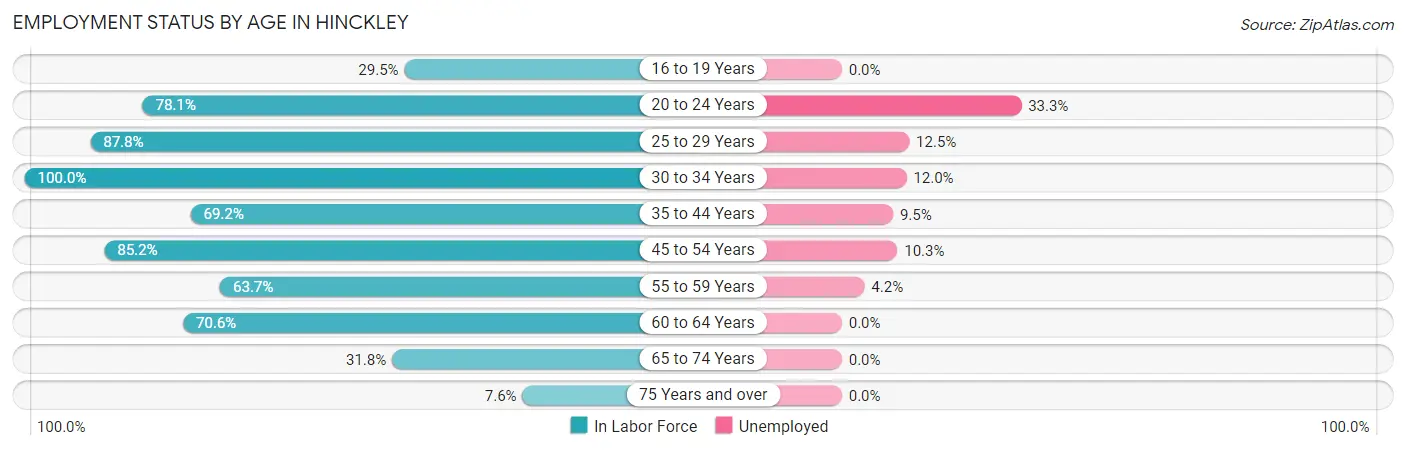
| Age Bracket | In Labor Force | Unemployed |
| 16 to 19 Years | 26 (29.5%) | 0 (0.0%) |
| 20 to 24 Years | 57 (78.1%) | 19 (33.3%) |
| 25 to 29 Years | 72 (87.8%) | 9 (12.5%) |
| 30 to 34 Years | 92 (100.0%) | 11 (12.0%) |
| 35 to 44 Years | 126 (69.2%) | 12 (9.5%) |
| 45 to 54 Years | 156 (85.2%) | 16 (10.3%) |
| 55 to 59 Years | 72 (63.7%) | 3 (4.2%) |
| 60 to 64 Years | 72 (70.6%) | 0 (0.0%) |
| 65 to 74 Years | 49 (31.8%) | 0 (0.0%) |
| 75 Years and over | 14 (7.6%) | 0 (0.0%) |
| Total | 736 (58.7%) | 70 (9.5%) |
Employment Status by Educational Attainment in Hinckley
According to labor force statistics for Hinckley, 78.2% of individuals (590) out of the total population between 25 and 64 years of age (754) are in the labor force, with 8.6% or 51 of them being unemployed. The group with the highest labor force participation rate are those with the educational attainment of bachelor's degree or higher, with 95.4% or 62 individuals in the labor force. Within the labor force, individuals with less than high school education have the highest percentage of unemployment, with 26.1% or 6 of them being unemployed.
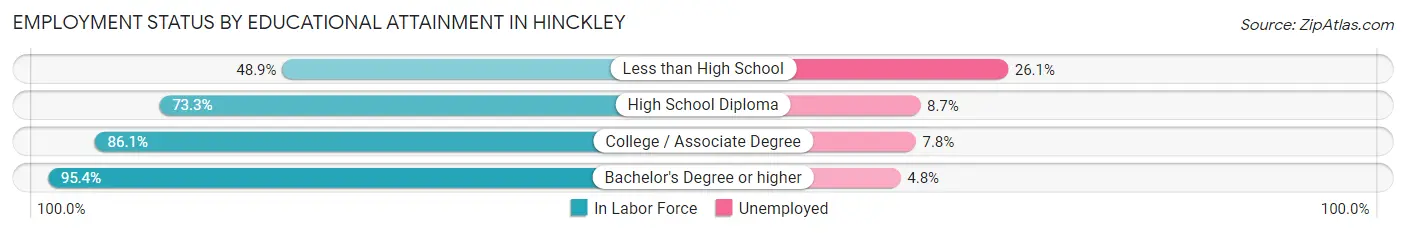
| Educational Attainment | In Labor Force | Unemployed |
| Less than High School | 23 (48.9%) | 12 (26.1%) |
| High School Diploma | 275 (73.3%) | 33 (8.7%) |
| College / Associate Degree | 230 (86.1%) | 21 (7.8%) |
| Bachelor's Degree or higher | 62 (95.4%) | 3 (4.8%) |
| Total | 590 (78.2%) | 65 (8.6%) |
Employment Occupations by Sex in Hinckley
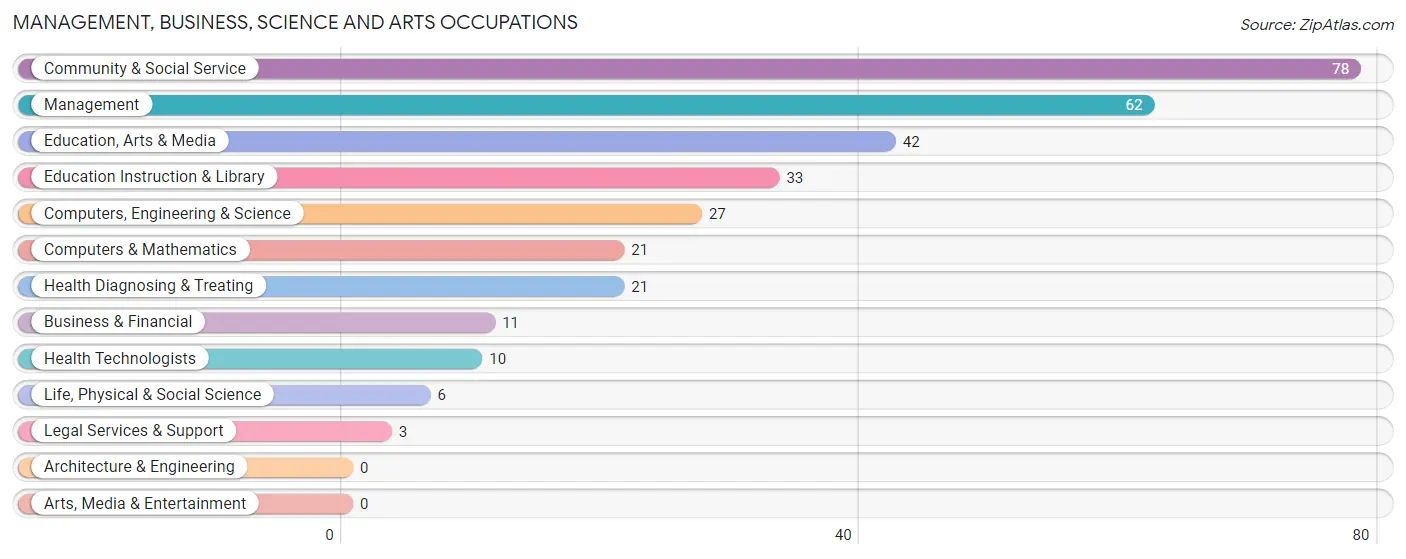
Management, Business, Science and Arts Occupations
The most common Management, Business, Science and Arts occupations in Hinckley are Community & Social Service (78 | 11.7%), Management (62 | 9.3%), Education, Arts & Media (42 | 6.3%), Education Instruction & Library (33 | 5.0%), and Computers, Engineering & Science (27 | 4.1%).
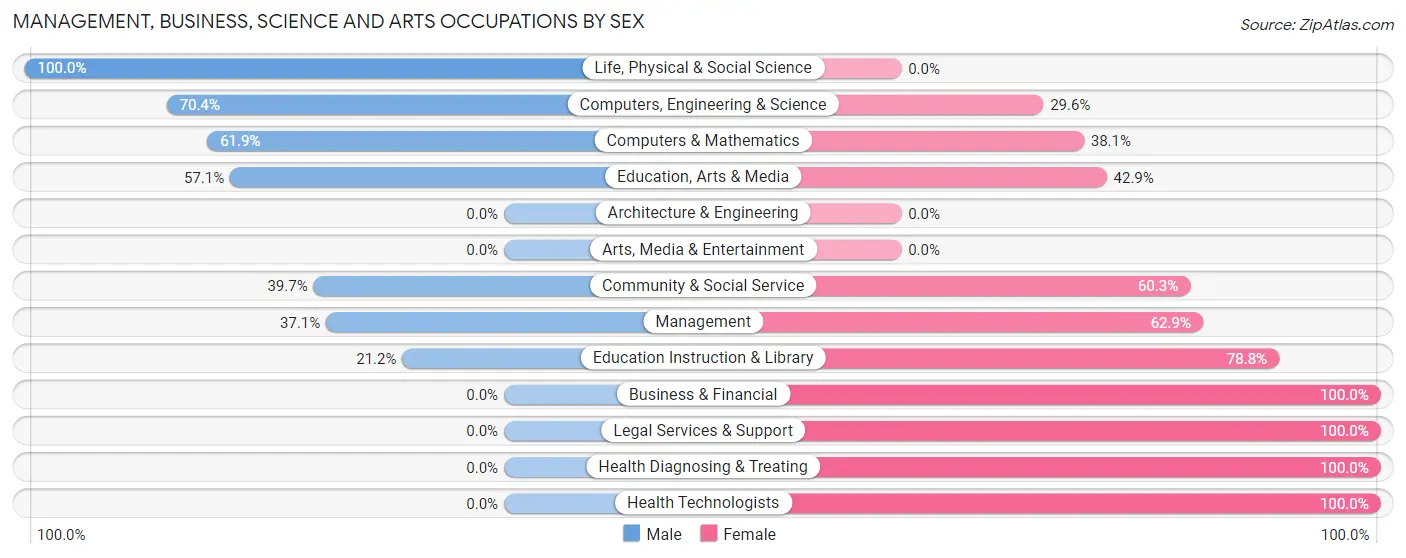
Management, Business, Science and Arts Occupations by Sex
Within the Management, Business, Science and Arts occupations in Hinckley, the most male-oriented occupations are Life, Physical & Social Science (100.0%), Computers, Engineering & Science (70.4%), and Computers & Mathematics (61.9%), while the most female-oriented occupations are Business & Financial (100.0%), Legal Services & Support (100.0%), and Health Diagnosing & Treating (100.0%).
| Occupation | Male | Female |
| Management | 23 (37.1%) | 39 (62.9%) |
| Business & Financial | 0 (0.0%) | 11 (100.0%) |
| Computers, Engineering & Science | 19 (70.4%) | 8 (29.6%) |
| Computers & Mathematics | 13 (61.9%) | 8 (38.1%) |
| Architecture & Engineering | 0 (0.0%) | 0 (0.0%) |
| Life, Physical & Social Science | 6 (100.0%) | 0 (0.0%) |
| Community & Social Service | 31 (39.7%) | 47 (60.3%) |
| Education, Arts & Media | 24 (57.1%) | 18 (42.9%) |
| Legal Services & Support | 0 (0.0%) | 3 (100.0%) |
| Education Instruction & Library | 7 (21.2%) | 26 (78.8%) |
| Arts, Media & Entertainment | 0 (0.0%) | 0 (0.0%) |
| Health Diagnosing & Treating | 0 (0.0%) | 21 (100.0%) |
| Health Technologists | 0 (0.0%) | 10 (100.0%) |
| Total (Category) | 73 (36.7%) | 126 (63.3%) |
| Total (Overall) | 289 (43.4%) | 377 (56.6%) |
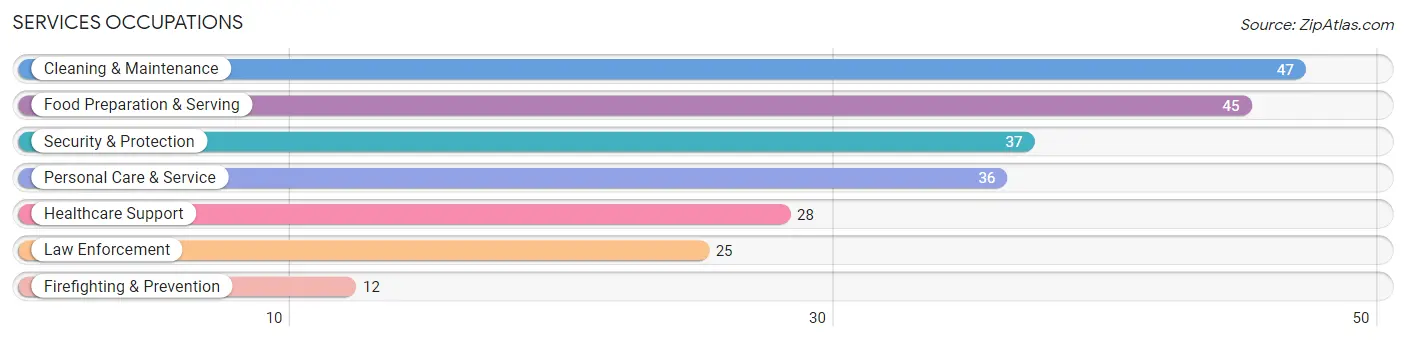
Services Occupations
The most common Services occupations in Hinckley are Cleaning & Maintenance (47 | 7.1%), Food Preparation & Serving (45 | 6.8%), Security & Protection (37 | 5.6%), Personal Care & Service (36 | 5.4%), and Healthcare Support (28 | 4.2%).
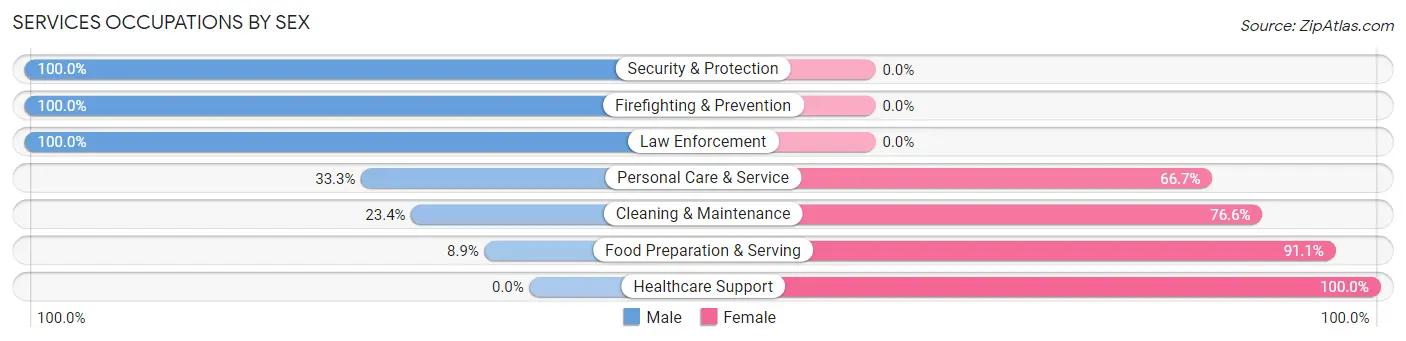
Services Occupations by Sex
Within the Services occupations in Hinckley, the most male-oriented occupations are Security & Protection (100.0%), Firefighting & Prevention (100.0%), and Law Enforcement (100.0%), while the most female-oriented occupations are Healthcare Support (100.0%), Food Preparation & Serving (91.1%), and Cleaning & Maintenance (76.6%).
| Occupation | Male | Female |
| Healthcare Support | 0 (0.0%) | 28 (100.0%) |
| Security & Protection | 37 (100.0%) | 0 (0.0%) |
| Firefighting & Prevention | 12 (100.0%) | 0 (0.0%) |
| Law Enforcement | 25 (100.0%) | 0 (0.0%) |
| Food Preparation & Serving | 4 (8.9%) | 41 (91.1%) |
| Cleaning & Maintenance | 11 (23.4%) | 36 (76.6%) |
| Personal Care & Service | 12 (33.3%) | 24 (66.7%) |
| Total (Category) | 64 (33.2%) | 129 (66.8%) |
| Total (Overall) | 289 (43.4%) | 377 (56.6%) |
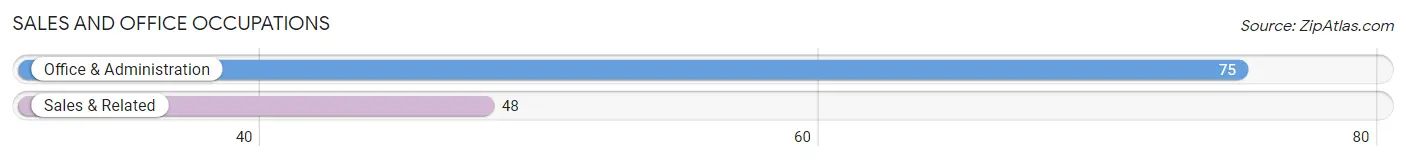
Sales and Office Occupations
The most common Sales and Office occupations in Hinckley are Office & Administration (75 | 11.3%), and Sales & Related (48 | 7.2%).
Sales and Office Occupations by Sex
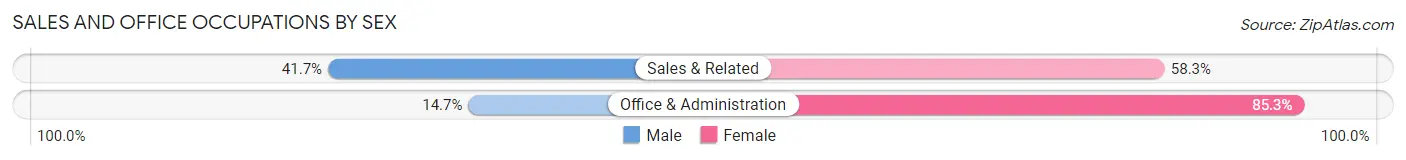
| Occupation | Male | Female |
| Sales & Related | 20 (41.7%) | 28 (58.3%) |
| Office & Administration | 11 (14.7%) | 64 (85.3%) |
| Total (Category) | 31 (25.2%) | 92 (74.8%) |
| Total (Overall) | 289 (43.4%) | 377 (56.6%) |
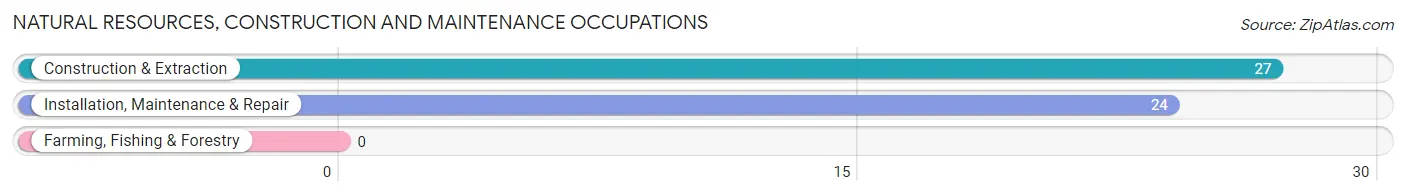
Natural Resources, Construction and Maintenance Occupations
The most common Natural Resources, Construction and Maintenance occupations in Hinckley are Construction & Extraction (27 | 4.1%), and Installation, Maintenance & Repair (24 | 3.6%).
Natural Resources, Construction and Maintenance Occupations by Sex
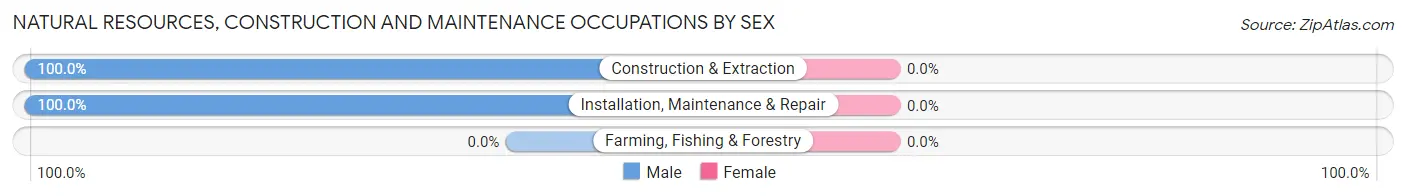
| Occupation | Male | Female |
| Farming, Fishing & Forestry | 0 (0.0%) | 0 (0.0%) |
| Construction & Extraction | 27 (100.0%) | 0 (0.0%) |
| Installation, Maintenance & Repair | 24 (100.0%) | 0 (0.0%) |
| Total (Category) | 51 (100.0%) | 0 (0.0%) |
| Total (Overall) | 289 (43.4%) | 377 (56.6%) |
Production, Transportation and Moving Occupations
The most common Production, Transportation and Moving occupations in Hinckley are Transportation (36 | 5.4%), Production (35 | 5.3%), and Material Moving (29 | 4.3%).
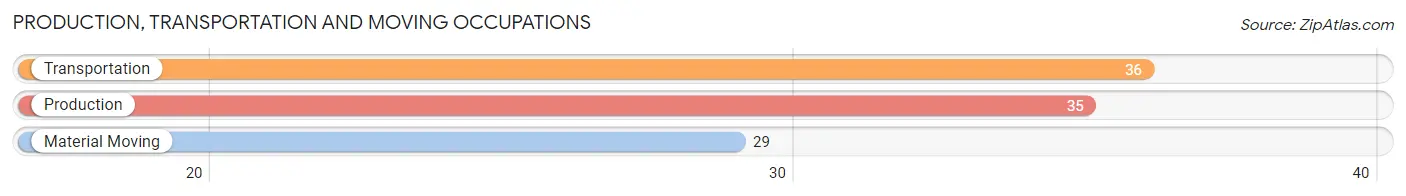
Production, Transportation and Moving Occupations by Sex
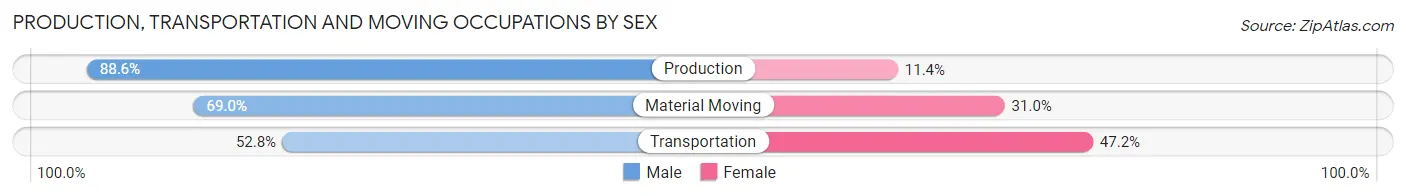
| Occupation | Male | Female |
| Production | 31 (88.6%) | 4 (11.4%) |
| Transportation | 19 (52.8%) | 17 (47.2%) |
| Material Moving | 20 (69.0%) | 9 (31.0%) |
| Total (Category) | 70 (70.0%) | 30 (30.0%) |
| Total (Overall) | 289 (43.4%) | 377 (56.6%) |
Employment Industries by Sex in Hinckley
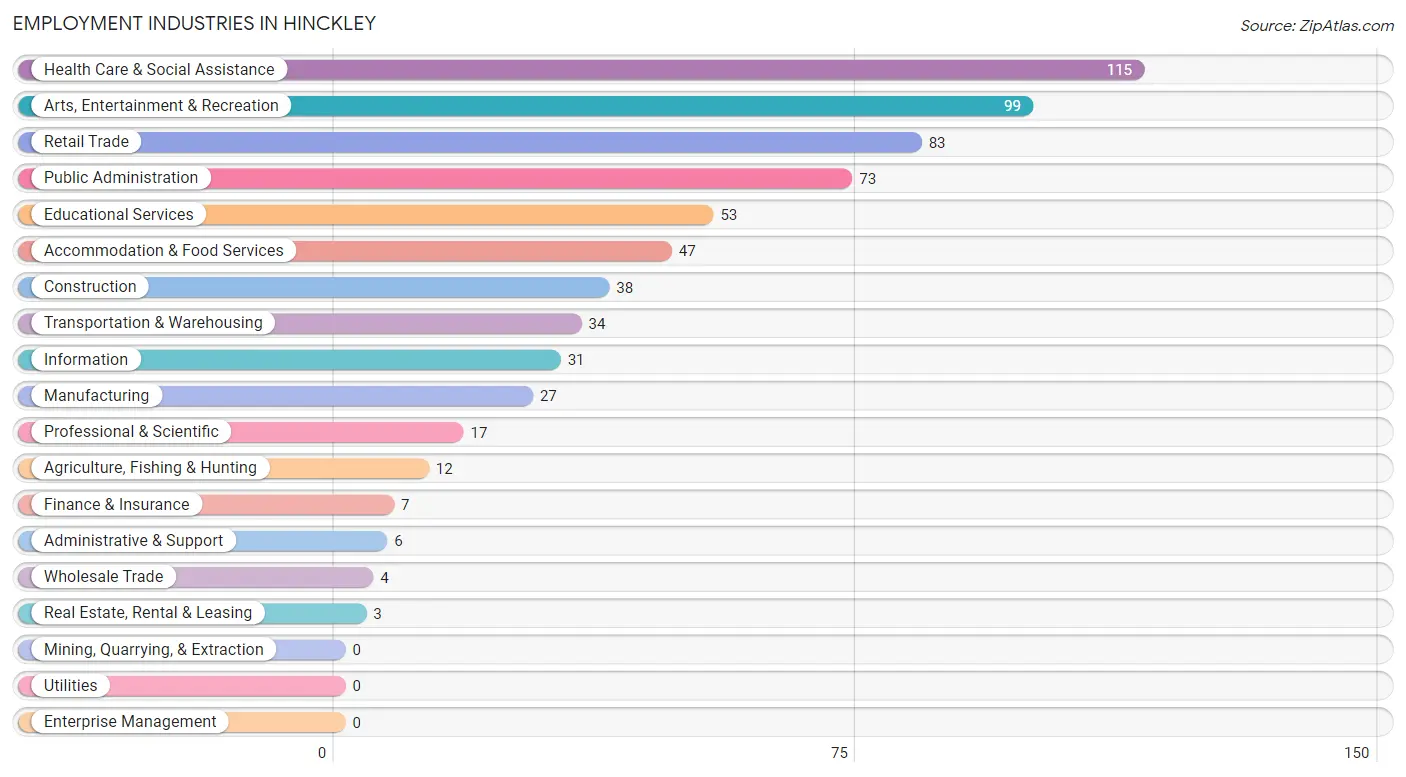
Employment Industries in Hinckley
The major employment industries in Hinckley include Health Care & Social Assistance (115 | 17.3%), Arts, Entertainment & Recreation (99 | 14.9%), Retail Trade (83 | 12.5%), Public Administration (73 | 11.0%), and Educational Services (53 | 8.0%).
Employment Industries by Sex in Hinckley
The Hinckley industries that see more men than women are Agriculture, Fishing & Hunting (100.0%), Construction (100.0%), and Manufacturing (100.0%), whereas the industries that tend to have a higher number of women are Wholesale Trade (100.0%), Real Estate, Rental & Leasing (100.0%), and Health Care & Social Assistance (93.9%).
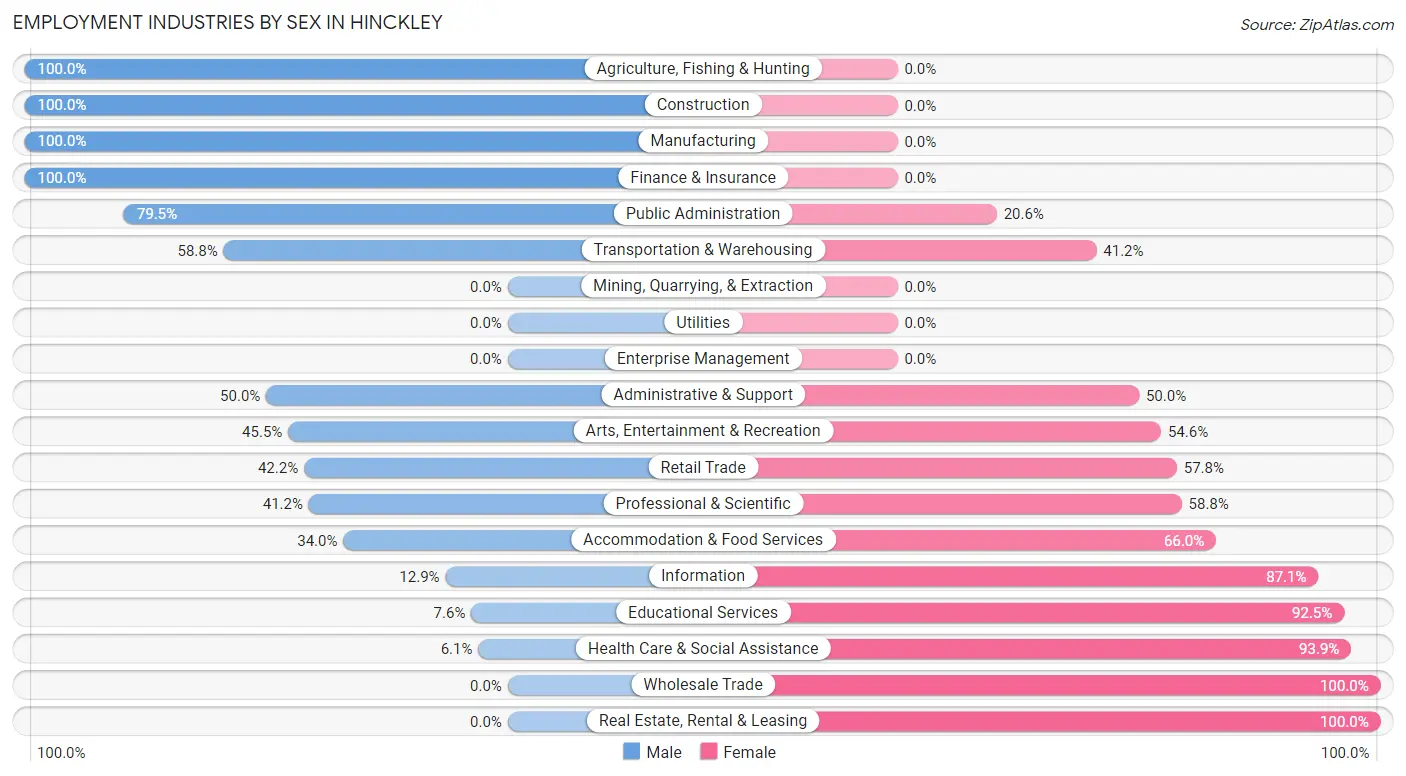
| Industry | Male | Female |
| Agriculture, Fishing & Hunting | 12 (100.0%) | 0 (0.0%) |
| Mining, Quarrying, & Extraction | 0 (0.0%) | 0 (0.0%) |
| Construction | 38 (100.0%) | 0 (0.0%) |
| Manufacturing | 27 (100.0%) | 0 (0.0%) |
| Wholesale Trade | 0 (0.0%) | 4 (100.0%) |
| Retail Trade | 35 (42.2%) | 48 (57.8%) |
| Transportation & Warehousing | 20 (58.8%) | 14 (41.2%) |
| Utilities | 0 (0.0%) | 0 (0.0%) |
| Information | 4 (12.9%) | 27 (87.1%) |
| Finance & Insurance | 7 (100.0%) | 0 (0.0%) |
| Real Estate, Rental & Leasing | 0 (0.0%) | 3 (100.0%) |
| Professional & Scientific | 7 (41.2%) | 10 (58.8%) |
| Enterprise Management | 0 (0.0%) | 0 (0.0%) |
| Administrative & Support | 3 (50.0%) | 3 (50.0%) |
| Educational Services | 4 (7.5%) | 49 (92.4%) |
| Health Care & Social Assistance | 7 (6.1%) | 108 (93.9%) |
| Arts, Entertainment & Recreation | 45 (45.5%) | 54 (54.5%) |
| Accommodation & Food Services | 16 (34.0%) | 31 (66.0%) |
| Public Administration | 58 (79.4%) | 15 (20.5%) |
| Total | 289 (43.4%) | 377 (56.6%) |
Education in Hinckley
School Enrollment in Hinckley
The most common levels of schooling among the 324 students in Hinckley are high school (119 | 36.7%), middle school (83 | 25.6%), and elementary school (42 | 13.0%).
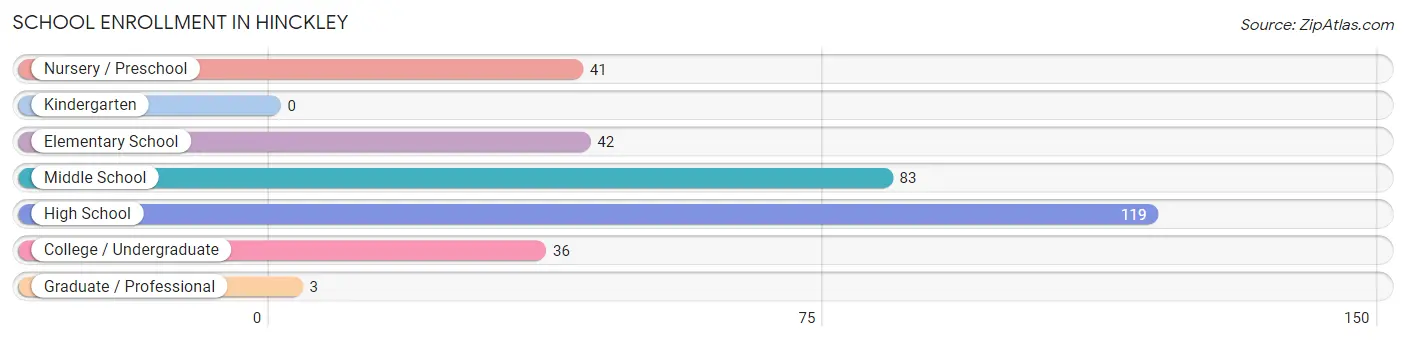
| School Level | # Students | % Students |
| Nursery / Preschool | 41 | 12.7% |
| Kindergarten | 0 | 0.0% |
| Elementary School | 42 | 13.0% |
| Middle School | 83 | 25.6% |
| High School | 119 | 36.7% |
| College / Undergraduate | 36 | 11.1% |
| Graduate / Professional | 3 | 0.9% |
| Total | 324 | 100.0% |
School Enrollment by Age by Funding Source in Hinckley
Out of a total of 324 students who are enrolled in schools in Hinckley, 14 (4.3%) attend a private institution, while the remaining 310 (95.7%) are enrolled in public schools. The age group of 35 years and over has the highest likelihood of being enrolled in private schools, with 3 (33.3% in the age bracket) enrolled. Conversely, the age group of 3 to 4 year olds has the lowest likelihood of being enrolled in a private school, with 5 (100.0% in the age bracket) attending a public institution.
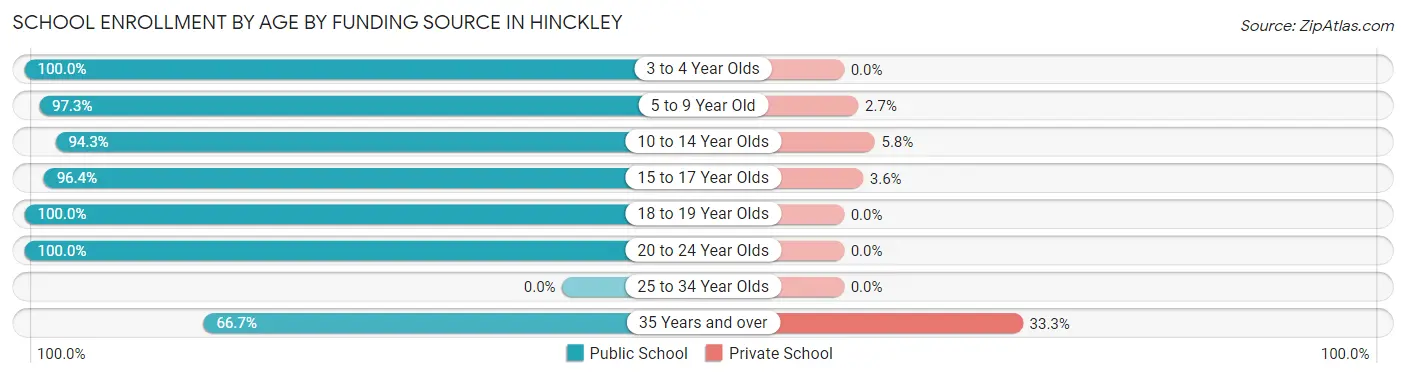
| Age Bracket | Public School | Private School |
| 3 to 4 Year Olds | 5 (100.0%) | 0 (0.0%) |
| 5 to 9 Year Old | 72 (97.3%) | 2 (2.7%) |
| 10 to 14 Year Olds | 82 (94.3%) | 5 (5.8%) |
| 15 to 17 Year Olds | 108 (96.4%) | 4 (3.6%) |
| 18 to 19 Year Olds | 18 (100.0%) | 0 (0.0%) |
| 20 to 24 Year Olds | 19 (100.0%) | 0 (0.0%) |
| 25 to 34 Year Olds | 0 (0.0%) | 0 (0.0%) |
| 35 Years and over | 6 (66.7%) | 3 (33.3%) |
| Total | 310 (95.7%) | 14 (4.3%) |
Educational Attainment by Field of Study in Hinckley
Business (25 | 25.8%), education (25 | 25.8%), science & technology (17 | 17.5%), arts & humanities (13 | 13.4%), and social sciences (6 | 6.2%) are the most common fields of study among 97 individuals in Hinckley who have obtained a bachelor's degree or higher.
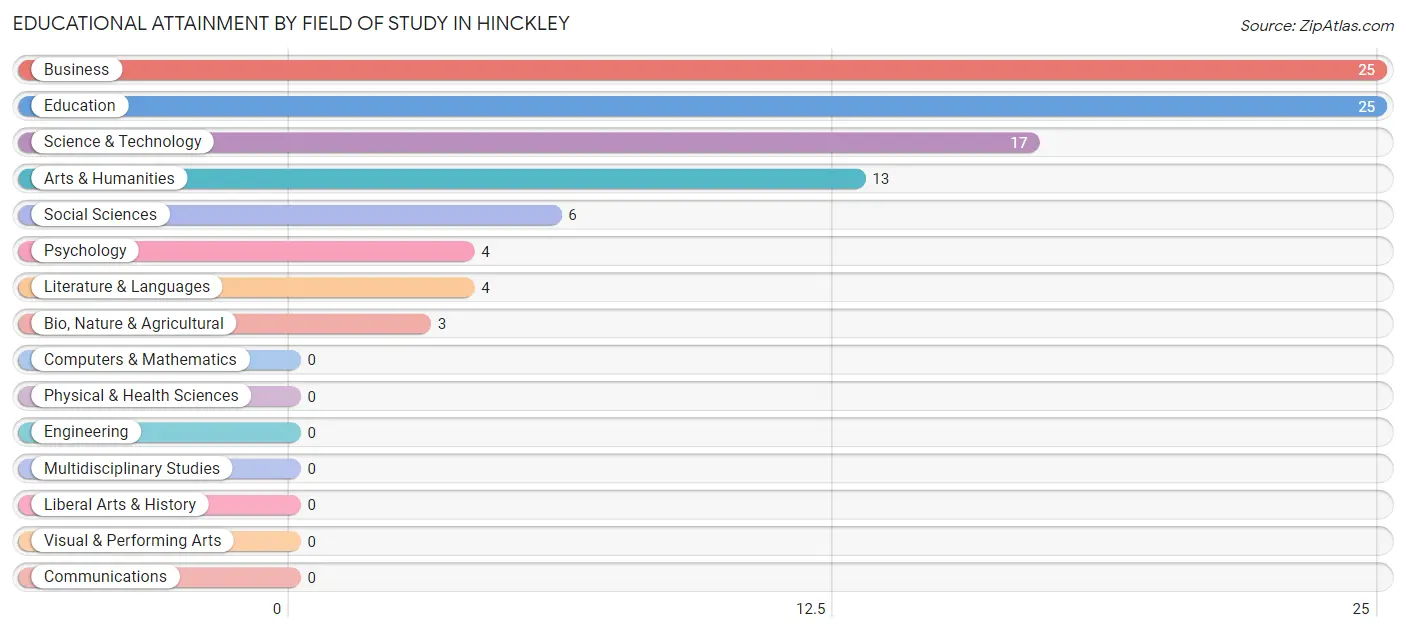
| Field of Study | # Graduates | % Graduates |
| Computers & Mathematics | 0 | 0.0% |
| Bio, Nature & Agricultural | 3 | 3.1% |
| Physical & Health Sciences | 0 | 0.0% |
| Psychology | 4 | 4.1% |
| Social Sciences | 6 | 6.2% |
| Engineering | 0 | 0.0% |
| Multidisciplinary Studies | 0 | 0.0% |
| Science & Technology | 17 | 17.5% |
| Business | 25 | 25.8% |
| Education | 25 | 25.8% |
| Literature & Languages | 4 | 4.1% |
| Liberal Arts & History | 0 | 0.0% |
| Visual & Performing Arts | 0 | 0.0% |
| Communications | 0 | 0.0% |
| Arts & Humanities | 13 | 13.4% |
| Total | 97 | 100.0% |
Transportation & Commute in Hinckley
Vehicle Availability by Sex in Hinckley
The most prevalent vehicle ownership categories in Hinckley are males with 2 vehicles (108, accounting for 37.6%) and females with 2 vehicles (105, making up 28.9%).
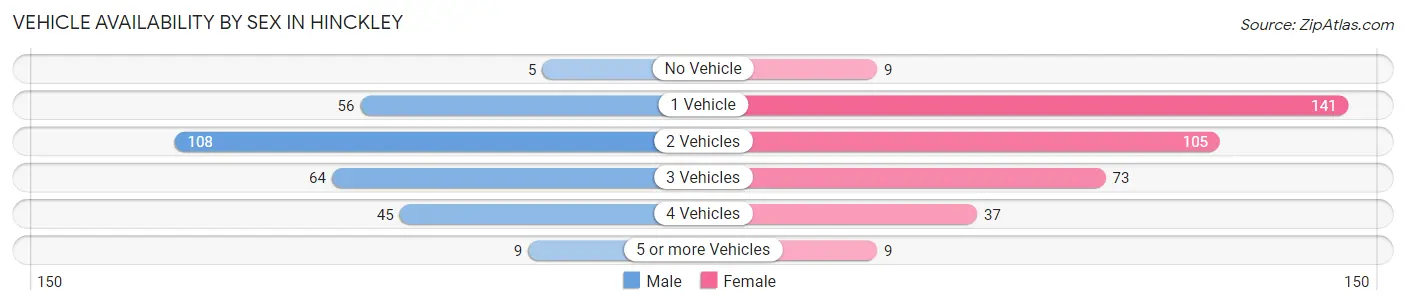
| Vehicles Available | Male | Female |
| No Vehicle | 5 (1.7%) | 9 (2.4%) |
| 1 Vehicle | 56 (19.5%) | 141 (37.7%) |
| 2 Vehicles | 108 (37.6%) | 105 (28.1%) |
| 3 Vehicles | 64 (22.3%) | 73 (19.5%) |
| 4 Vehicles | 45 (15.7%) | 37 (9.9%) |
| 5 or more Vehicles | 9 (3.1%) | 9 (2.4%) |
| Total | 287 (100.0%) | 374 (100.0%) |
Commute Time in Hinckley
The most frequently occuring commute durations in Hinckley are 5 to 9 minutes (156 commuters, 25.9%), 10 to 14 minutes (96 commuters, 15.9%), and 15 to 19 minutes (83 commuters, 13.8%).
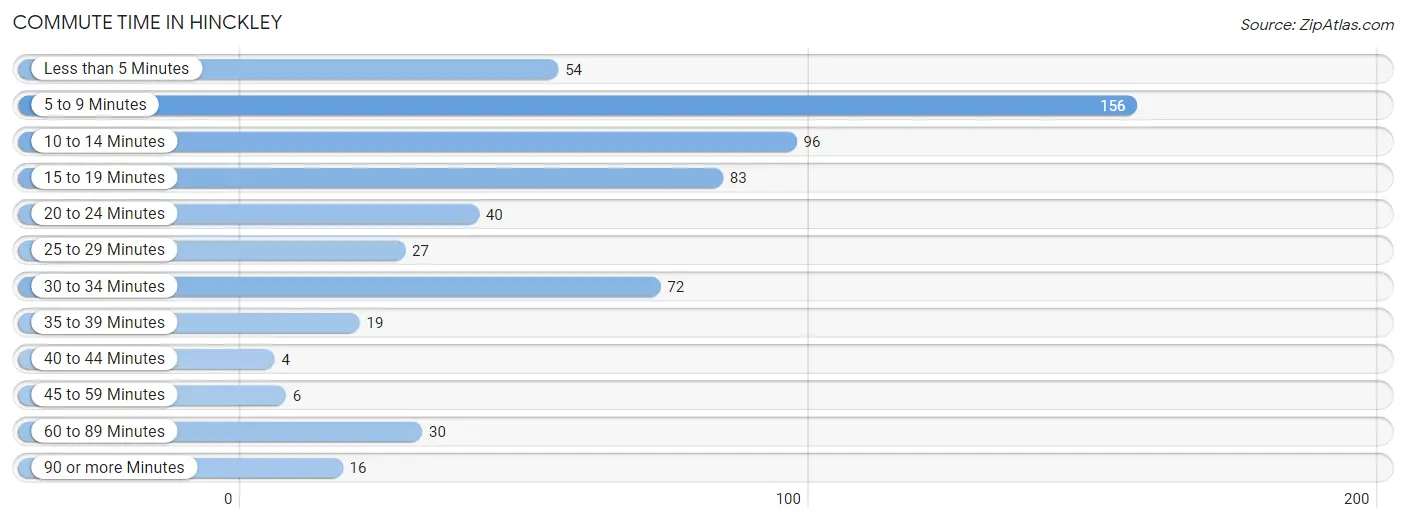
| Commute Time | # Commuters | % Commuters |
| Less than 5 Minutes | 54 | 9.0% |
| 5 to 9 Minutes | 156 | 25.9% |
| 10 to 14 Minutes | 96 | 15.9% |
| 15 to 19 Minutes | 83 | 13.8% |
| 20 to 24 Minutes | 40 | 6.6% |
| 25 to 29 Minutes | 27 | 4.5% |
| 30 to 34 Minutes | 72 | 11.9% |
| 35 to 39 Minutes | 19 | 3.2% |
| 40 to 44 Minutes | 4 | 0.7% |
| 45 to 59 Minutes | 6 | 1.0% |
| 60 to 89 Minutes | 30 | 5.0% |
| 90 or more Minutes | 16 | 2.6% |
Commute Time by Sex in Hinckley
The most common commute times in Hinckley are 5 to 9 minutes (55 commuters, 20.2%) for males and 5 to 9 minutes (101 commuters, 30.6%) for females.
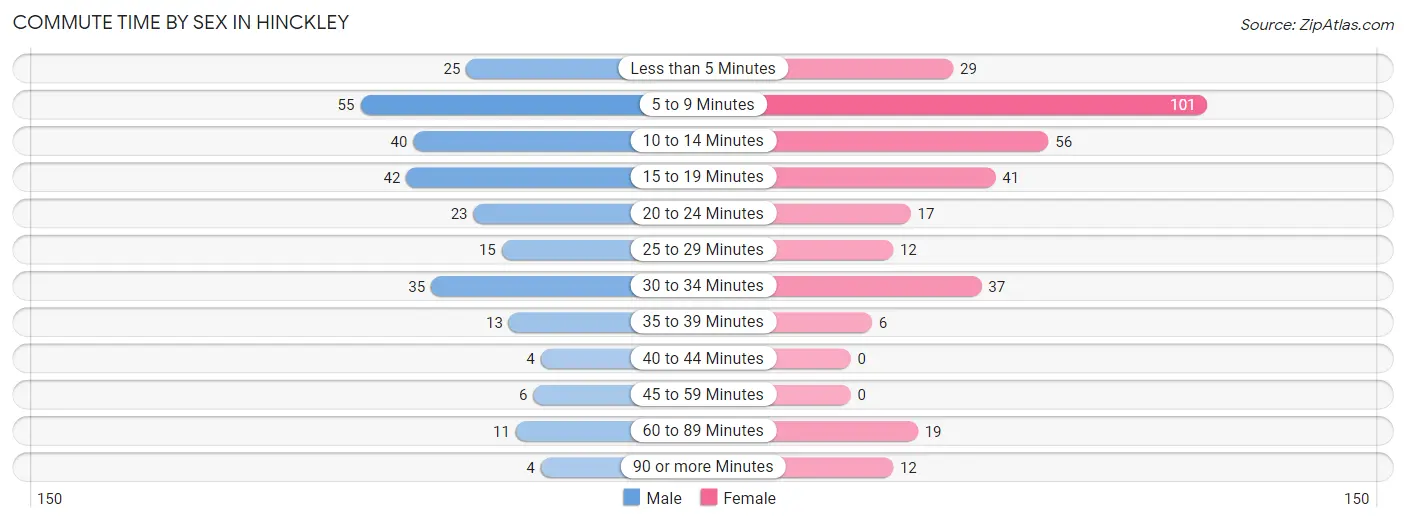
| Commute Time | Male | Female |
| Less than 5 Minutes | 25 (9.2%) | 29 (8.8%) |
| 5 to 9 Minutes | 55 (20.2%) | 101 (30.6%) |
| 10 to 14 Minutes | 40 (14.6%) | 56 (17.0%) |
| 15 to 19 Minutes | 42 (15.4%) | 41 (12.4%) |
| 20 to 24 Minutes | 23 (8.4%) | 17 (5.1%) |
| 25 to 29 Minutes | 15 (5.5%) | 12 (3.6%) |
| 30 to 34 Minutes | 35 (12.8%) | 37 (11.2%) |
| 35 to 39 Minutes | 13 (4.8%) | 6 (1.8%) |
| 40 to 44 Minutes | 4 (1.5%) | 0 (0.0%) |
| 45 to 59 Minutes | 6 (2.2%) | 0 (0.0%) |
| 60 to 89 Minutes | 11 (4.0%) | 19 (5.8%) |
| 90 or more Minutes | 4 (1.5%) | 12 (3.6%) |
Time of Departure to Work by Sex in Hinckley
The most frequent times of departure to work in Hinckley are 7:00 AM to 7:29 AM (73, 26.7%) for males and 7:00 AM to 7:29 AM (118, 35.8%) for females.
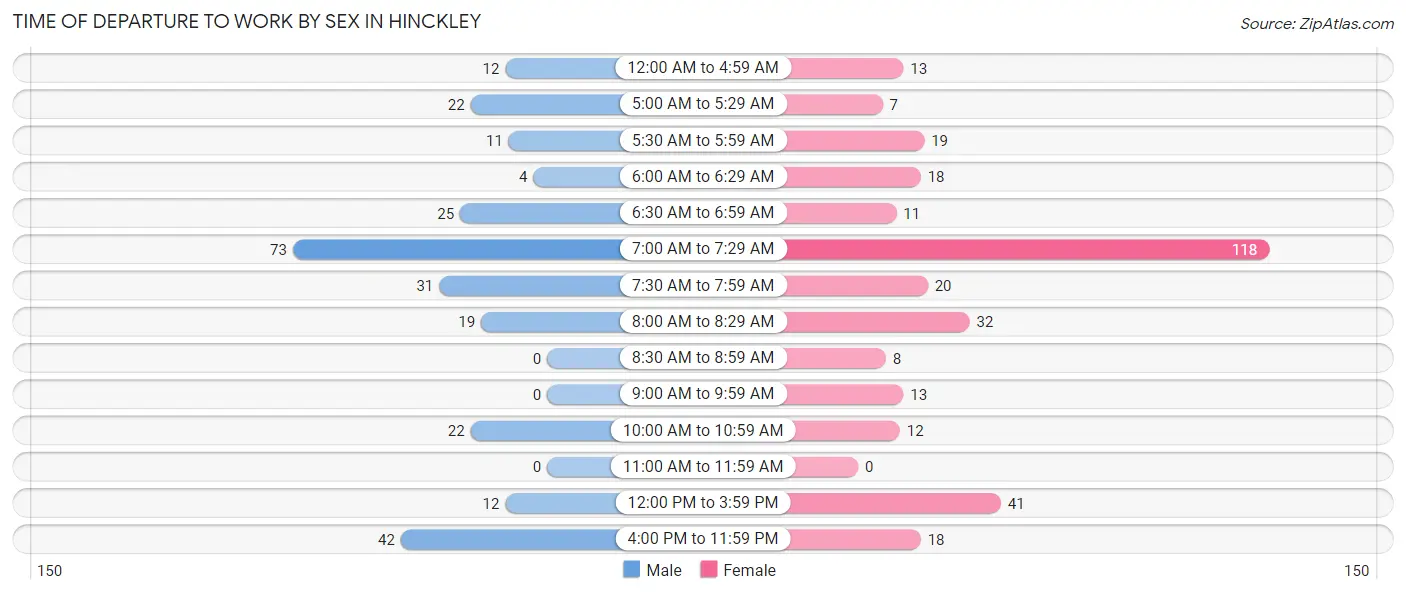
| Time of Departure | Male | Female |
| 12:00 AM to 4:59 AM | 12 (4.4%) | 13 (3.9%) |
| 5:00 AM to 5:29 AM | 22 (8.1%) | 7 (2.1%) |
| 5:30 AM to 5:59 AM | 11 (4.0%) | 19 (5.8%) |
| 6:00 AM to 6:29 AM | 4 (1.5%) | 18 (5.4%) |
| 6:30 AM to 6:59 AM | 25 (9.2%) | 11 (3.3%) |
| 7:00 AM to 7:29 AM | 73 (26.7%) | 118 (35.8%) |
| 7:30 AM to 7:59 AM | 31 (11.4%) | 20 (6.1%) |
| 8:00 AM to 8:29 AM | 19 (7.0%) | 32 (9.7%) |
| 8:30 AM to 8:59 AM | 0 (0.0%) | 8 (2.4%) |
| 9:00 AM to 9:59 AM | 0 (0.0%) | 13 (3.9%) |
| 10:00 AM to 10:59 AM | 22 (8.1%) | 12 (3.6%) |
| 11:00 AM to 11:59 AM | 0 (0.0%) | 0 (0.0%) |
| 12:00 PM to 3:59 PM | 12 (4.4%) | 41 (12.4%) |
| 4:00 PM to 11:59 PM | 42 (15.4%) | 18 (5.4%) |
| Total | 273 (100.0%) | 330 (100.0%) |
Housing Occupancy in Hinckley
Occupancy by Ownership in Hinckley
Of the total 640 dwellings in Hinckley, owner-occupied units account for 365 (57.0%), while renter-occupied units make up 275 (43.0%).
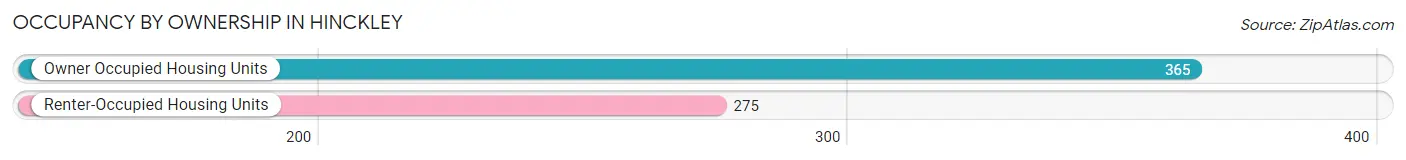
| Occupancy | # Housing Units | % Housing Units |
| Owner Occupied Housing Units | 365 | 57.0% |
| Renter-Occupied Housing Units | 275 | 43.0% |
| Total Occupied Housing Units | 640 | 100.0% |
Occupancy by Household Size in Hinckley
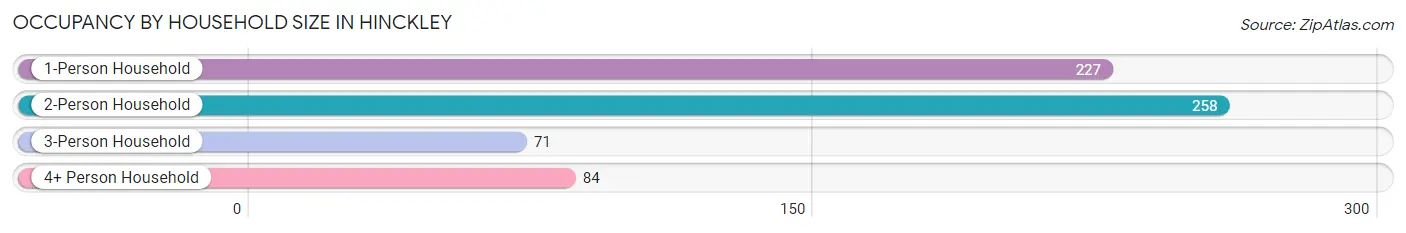
| Household Size | # Housing Units | % Housing Units |
| 1-Person Household | 227 | 35.5% |
| 2-Person Household | 258 | 40.3% |
| 3-Person Household | 71 | 11.1% |
| 4+ Person Household | 84 | 13.1% |
| Total Housing Units | 640 | 100.0% |
Occupancy by Ownership by Household Size in Hinckley
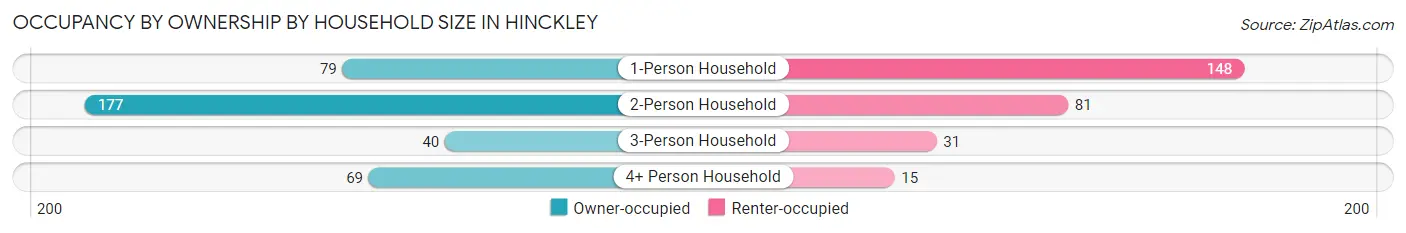
| Household Size | Owner-occupied | Renter-occupied |
| 1-Person Household | 79 (34.8%) | 148 (65.2%) |
| 2-Person Household | 177 (68.6%) | 81 (31.4%) |
| 3-Person Household | 40 (56.3%) | 31 (43.7%) |
| 4+ Person Household | 69 (82.1%) | 15 (17.9%) |
| Total Housing Units | 365 (57.0%) | 275 (43.0%) |
Occupancy by Educational Attainment in Hinckley
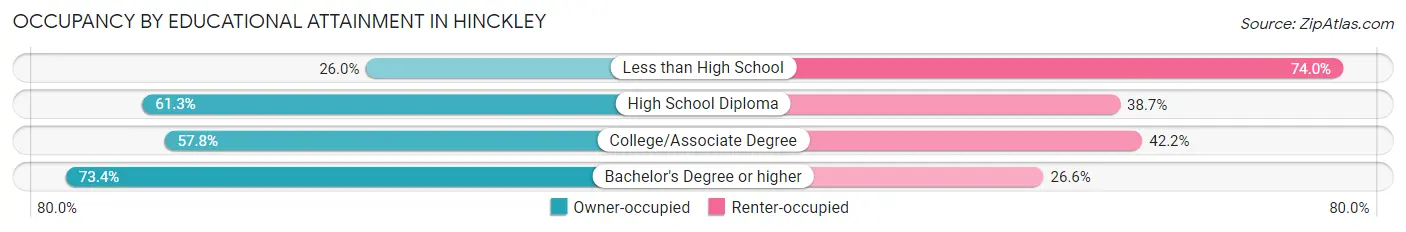
| Household Size | Owner-occupied | Renter-occupied |
| Less than High School | 20 (26.0%) | 57 (74.0%) |
| High School Diploma | 168 (61.3%) | 106 (38.7%) |
| College/Associate Degree | 130 (57.8%) | 95 (42.2%) |
| Bachelor's Degree or higher | 47 (73.4%) | 17 (26.6%) |
Occupancy by Age of Householder in Hinckley
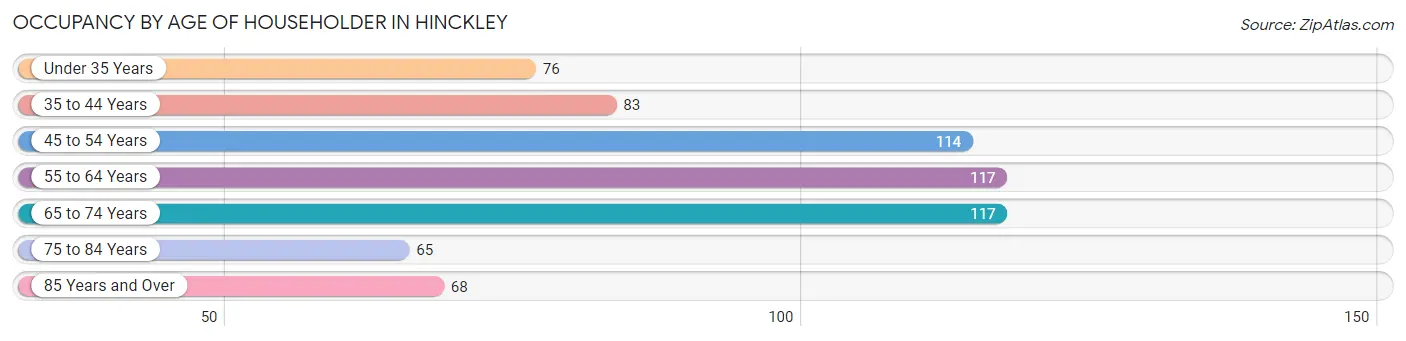
| Age Bracket | # Households | % Households |
| Under 35 Years | 76 | 11.9% |
| 35 to 44 Years | 83 | 13.0% |
| 45 to 54 Years | 114 | 17.8% |
| 55 to 64 Years | 117 | 18.3% |
| 65 to 74 Years | 117 | 18.3% |
| 75 to 84 Years | 65 | 10.2% |
| 85 Years and Over | 68 | 10.6% |
| Total | 640 | 100.0% |
Housing Finances in Hinckley
Median Income by Occupancy in Hinckley
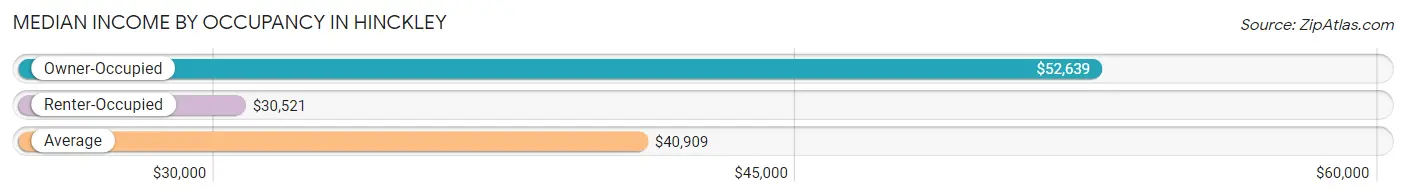
| Occupancy Type | # Households | Median Income |
| Owner-Occupied | 365 (57.0%) | $52,639 |
| Renter-Occupied | 275 (43.0%) | $30,521 |
| Average | 640 (100.0%) | $40,909 |
Occupancy by Householder Income Bracket in Hinckley
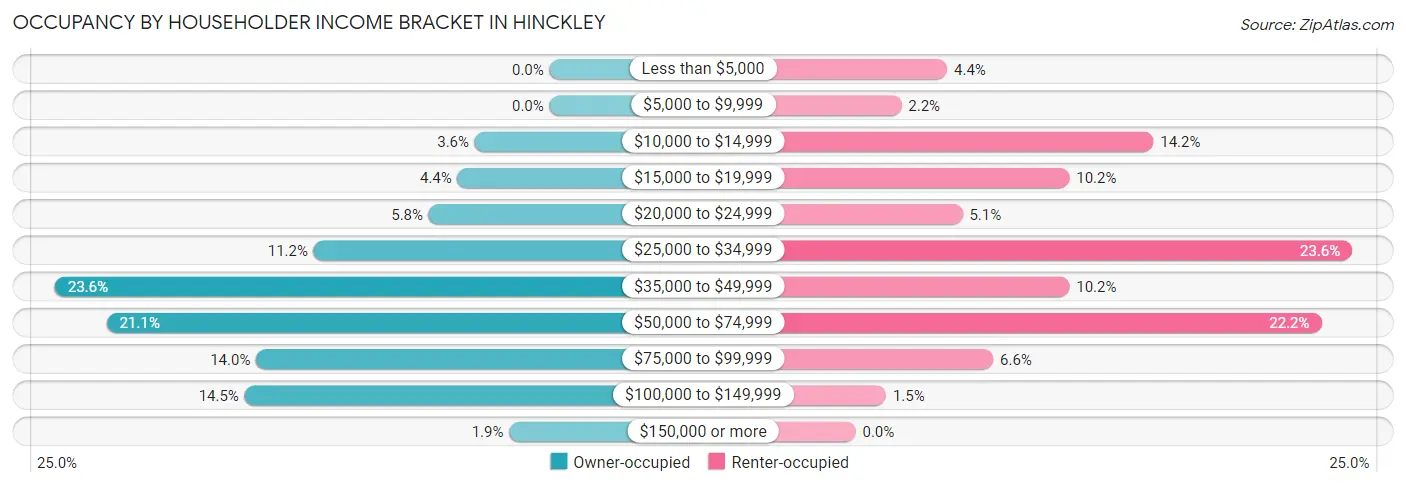
| Income Bracket | Owner-occupied | Renter-occupied |
| Less than $5,000 | 0 (0.0%) | 12 (4.4%) |
| $5,000 to $9,999 | 0 (0.0%) | 6 (2.2%) |
| $10,000 to $14,999 | 13 (3.6%) | 39 (14.2%) |
| $15,000 to $19,999 | 16 (4.4%) | 28 (10.2%) |
| $20,000 to $24,999 | 21 (5.8%) | 14 (5.1%) |
| $25,000 to $34,999 | 41 (11.2%) | 65 (23.6%) |
| $35,000 to $49,999 | 86 (23.6%) | 28 (10.2%) |
| $50,000 to $74,999 | 77 (21.1%) | 61 (22.2%) |
| $75,000 to $99,999 | 51 (14.0%) | 18 (6.6%) |
| $100,000 to $149,999 | 53 (14.5%) | 4 (1.5%) |
| $150,000 or more | 7 (1.9%) | 0 (0.0%) |
| Total | 365 (100.0%) | 275 (100.0%) |
Monthly Housing Cost Tiers in Hinckley
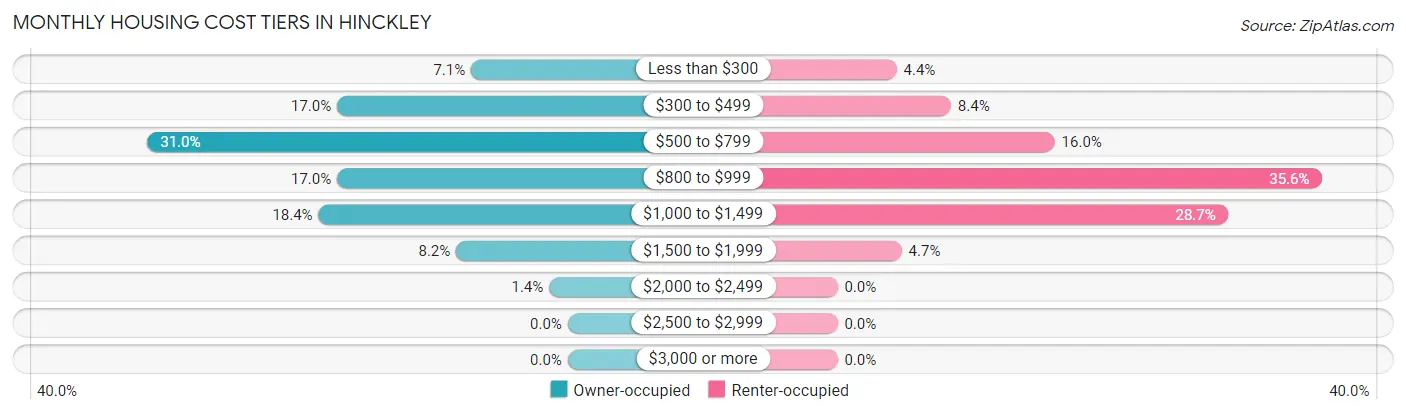
| Monthly Cost | Owner-occupied | Renter-occupied |
| Less than $300 | 26 (7.1%) | 12 (4.4%) |
| $300 to $499 | 62 (17.0%) | 23 (8.4%) |
| $500 to $799 | 113 (31.0%) | 44 (16.0%) |
| $800 to $999 | 62 (17.0%) | 98 (35.6%) |
| $1,000 to $1,499 | 67 (18.4%) | 79 (28.7%) |
| $1,500 to $1,999 | 30 (8.2%) | 13 (4.7%) |
| $2,000 to $2,499 | 5 (1.4%) | 0 (0.0%) |
| $2,500 to $2,999 | 0 (0.0%) | 0 (0.0%) |
| $3,000 or more | 0 (0.0%) | 0 (0.0%) |
| Total | 365 (100.0%) | 275 (100.0%) |
Physical Housing Characteristics in Hinckley
Housing Structures in Hinckley
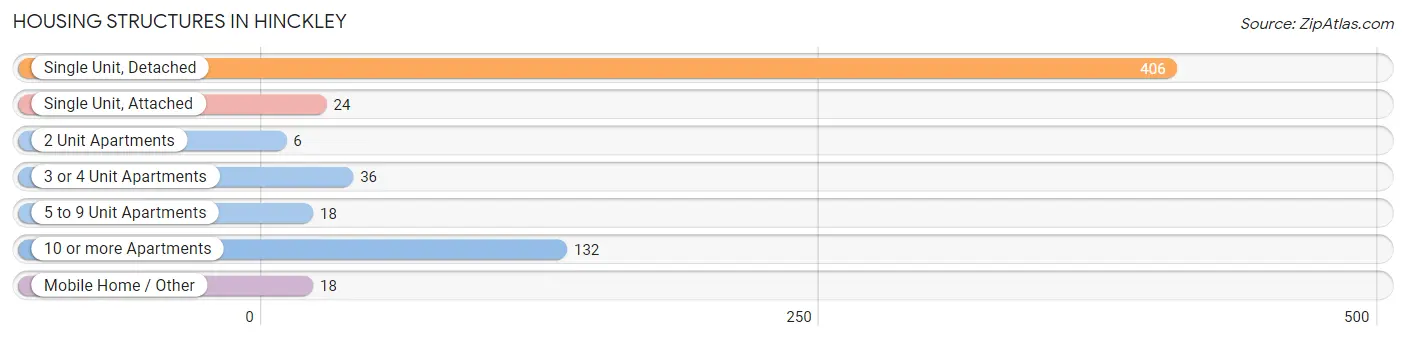
| Structure Type | # Housing Units | % Housing Units |
| Single Unit, Detached | 406 | 63.4% |
| Single Unit, Attached | 24 | 3.7% |
| 2 Unit Apartments | 6 | 0.9% |
| 3 or 4 Unit Apartments | 36 | 5.6% |
| 5 to 9 Unit Apartments | 18 | 2.8% |
| 10 or more Apartments | 132 | 20.6% |
| Mobile Home / Other | 18 | 2.8% |
| Total | 640 | 100.0% |
Housing Structures by Occupancy in Hinckley
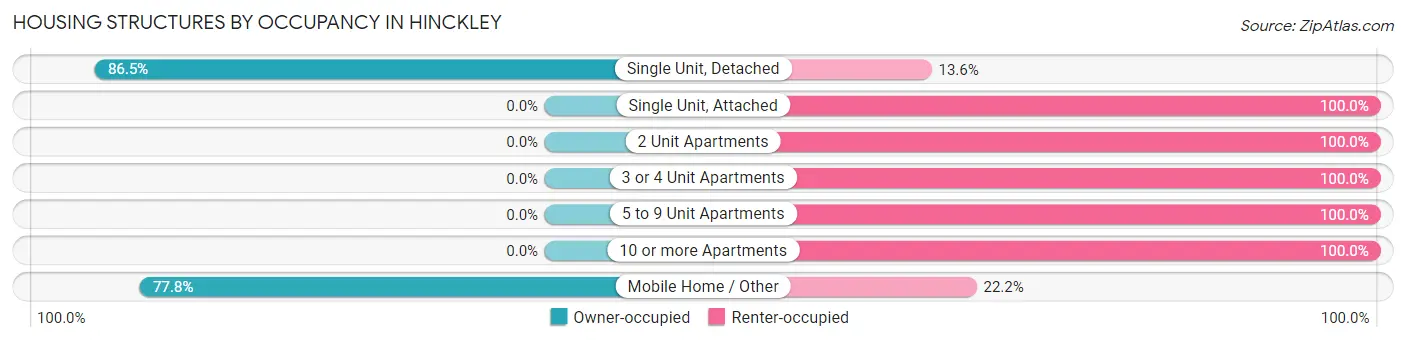
| Structure Type | Owner-occupied | Renter-occupied |
| Single Unit, Detached | 351 (86.5%) | 55 (13.6%) |
| Single Unit, Attached | 0 (0.0%) | 24 (100.0%) |
| 2 Unit Apartments | 0 (0.0%) | 6 (100.0%) |
| 3 or 4 Unit Apartments | 0 (0.0%) | 36 (100.0%) |
| 5 to 9 Unit Apartments | 0 (0.0%) | 18 (100.0%) |
| 10 or more Apartments | 0 (0.0%) | 132 (100.0%) |
| Mobile Home / Other | 14 (77.8%) | 4 (22.2%) |
| Total | 365 (57.0%) | 275 (43.0%) |
Housing Structures by Number of Rooms in Hinckley
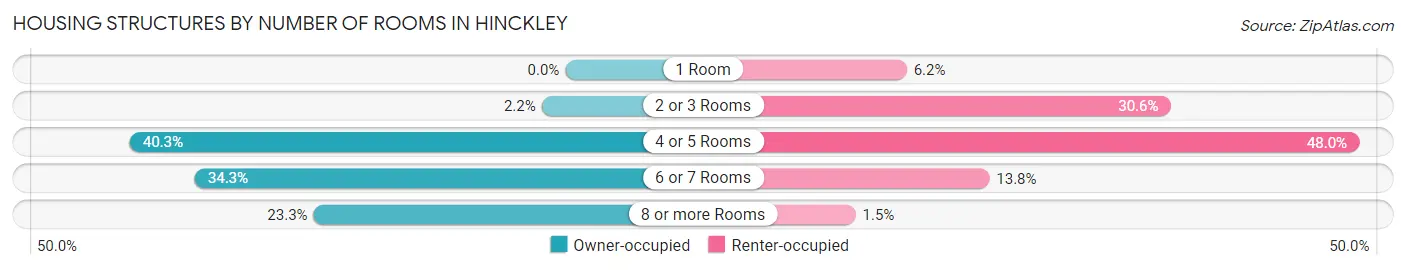
| Number of Rooms | Owner-occupied | Renter-occupied |
| 1 Room | 0 (0.0%) | 17 (6.2%) |
| 2 or 3 Rooms | 8 (2.2%) | 84 (30.5%) |
| 4 or 5 Rooms | 147 (40.3%) | 132 (48.0%) |
| 6 or 7 Rooms | 125 (34.3%) | 38 (13.8%) |
| 8 or more Rooms | 85 (23.3%) | 4 (1.5%) |
| Total | 365 (100.0%) | 275 (100.0%) |
Housing Structure by Heating Type in Hinckley
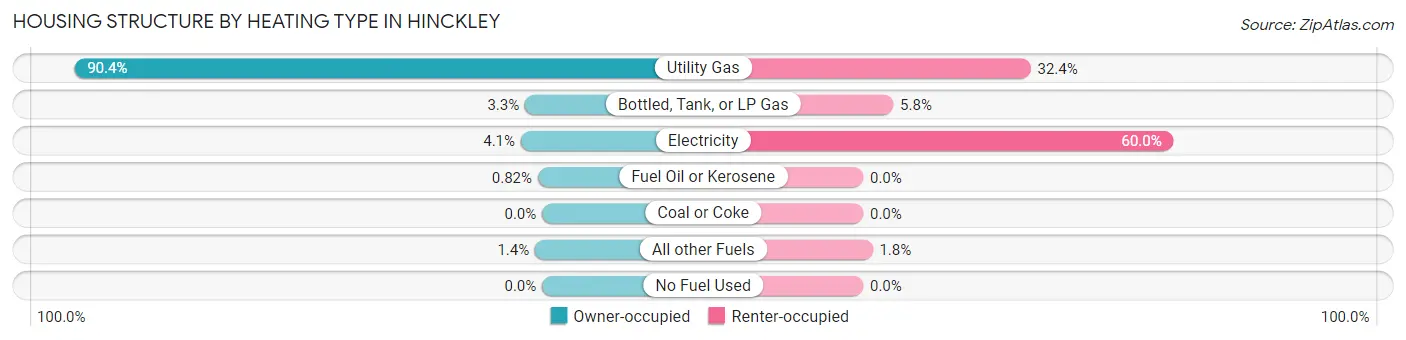
| Heating Type | Owner-occupied | Renter-occupied |
| Utility Gas | 330 (90.4%) | 89 (32.4%) |
| Bottled, Tank, or LP Gas | 12 (3.3%) | 16 (5.8%) |
| Electricity | 15 (4.1%) | 165 (60.0%) |
| Fuel Oil or Kerosene | 3 (0.8%) | 0 (0.0%) |
| Coal or Coke | 0 (0.0%) | 0 (0.0%) |
| All other Fuels | 5 (1.4%) | 5 (1.8%) |
| No Fuel Used | 0 (0.0%) | 0 (0.0%) |
| Total | 365 (100.0%) | 275 (100.0%) |
Household Vehicle Usage in Hinckley
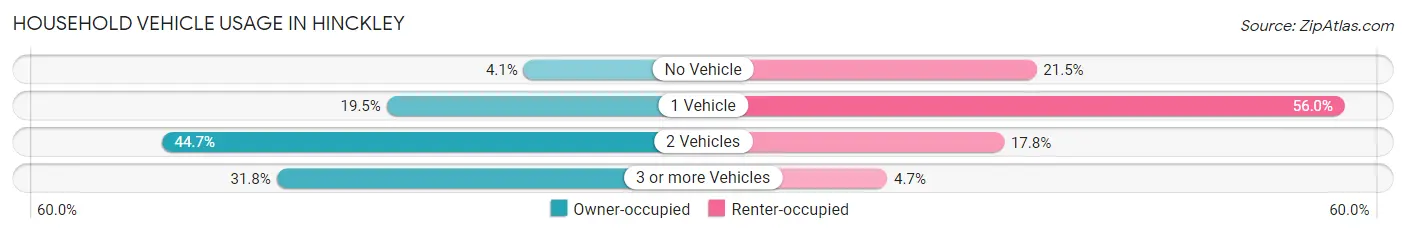
| Vehicles per Household | Owner-occupied | Renter-occupied |
| No Vehicle | 15 (4.1%) | 59 (21.4%) |
| 1 Vehicle | 71 (19.5%) | 154 (56.0%) |
| 2 Vehicles | 163 (44.7%) | 49 (17.8%) |
| 3 or more Vehicles | 116 (31.8%) | 13 (4.7%) |
| Total | 365 (100.0%) | 275 (100.0%) |
Real Estate & Mortgages in Hinckley
Real Estate and Mortgage Overview in Hinckley
| Characteristic | Without Mortgage | With Mortgage |
| Housing Units | 161 | 204 |
| Median Property Value | $168,500 | $154,400 |
| Median Household Income | $36,083 | $7 |
| Monthly Housing Costs | $467 | $0 |
| Real Estate Taxes | $1,700 | $3 |
Property Value by Mortgage Status in Hinckley
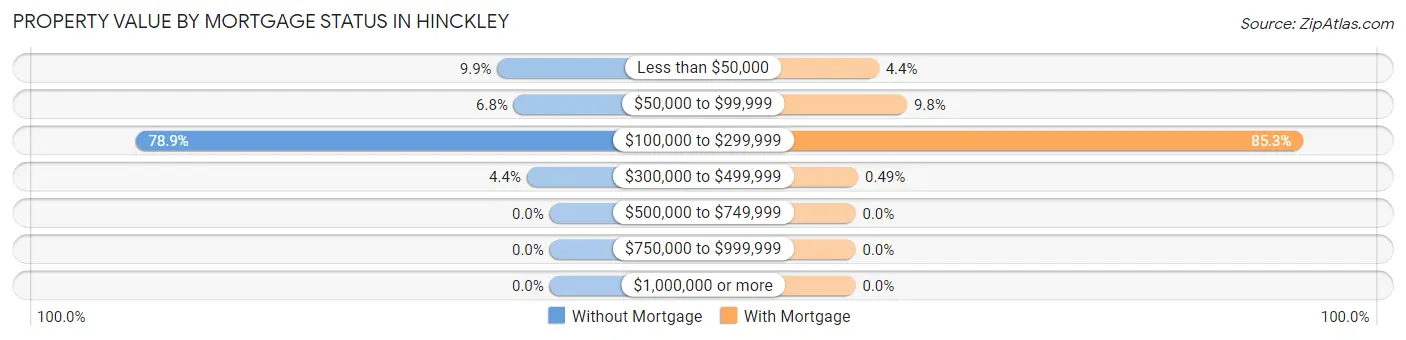
| Property Value | Without Mortgage | With Mortgage |
| Less than $50,000 | 16 (9.9%) | 9 (4.4%) |
| $50,000 to $99,999 | 11 (6.8%) | 20 (9.8%) |
| $100,000 to $299,999 | 127 (78.9%) | 174 (85.3%) |
| $300,000 to $499,999 | 7 (4.3%) | 1 (0.5%) |
| $500,000 to $749,999 | 0 (0.0%) | 0 (0.0%) |
| $750,000 to $999,999 | 0 (0.0%) | 0 (0.0%) |
| $1,000,000 or more | 0 (0.0%) | 0 (0.0%) |
| Total | 161 (100.0%) | 204 (100.0%) |
Household Income by Mortgage Status in Hinckley
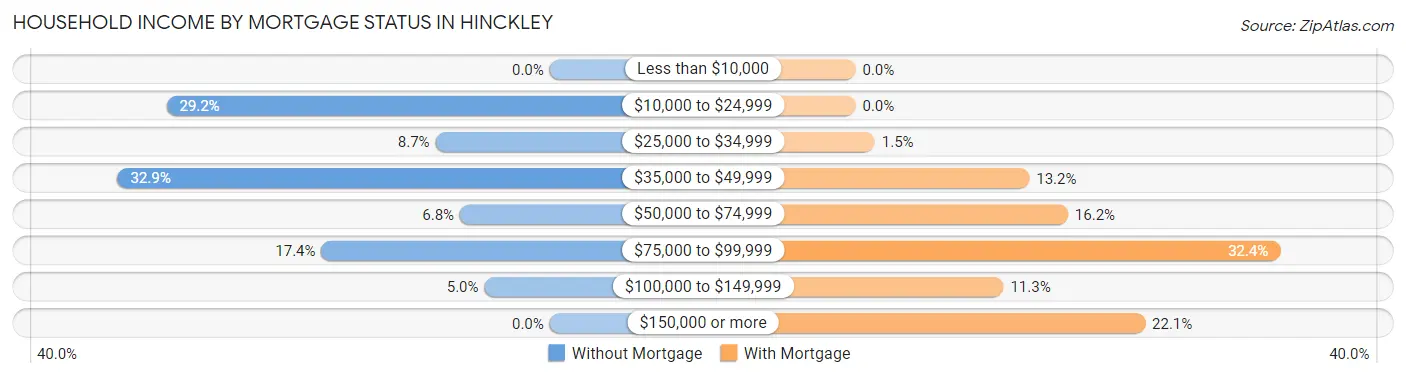
| Household Income | Without Mortgage | With Mortgage |
| Less than $10,000 | 0 (0.0%) | 0 (0.0%) |
| $10,000 to $24,999 | 47 (29.2%) | 0 (0.0%) |
| $25,000 to $34,999 | 14 (8.7%) | 3 (1.5%) |
| $35,000 to $49,999 | 53 (32.9%) | 27 (13.2%) |
| $50,000 to $74,999 | 11 (6.8%) | 33 (16.2%) |
| $75,000 to $99,999 | 28 (17.4%) | 66 (32.4%) |
| $100,000 to $149,999 | 8 (5.0%) | 23 (11.3%) |
| $150,000 or more | 0 (0.0%) | 45 (22.1%) |
| Total | 161 (100.0%) | 204 (100.0%) |
Property Value to Household Income Ratio in Hinckley
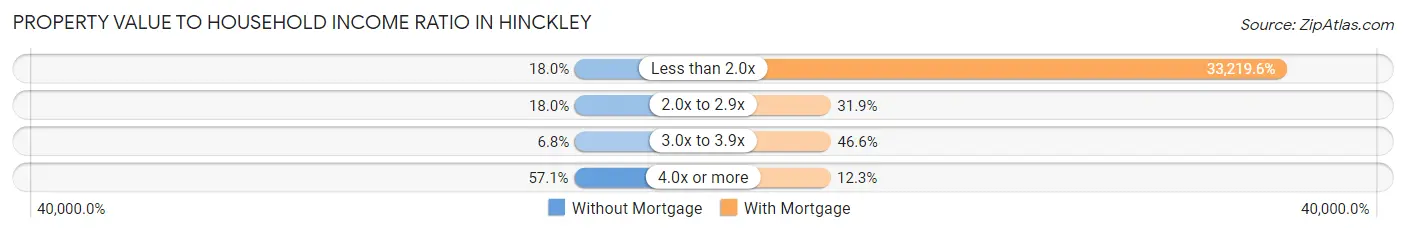
| Value-to-Income Ratio | Without Mortgage | With Mortgage |
| Less than 2.0x | 29 (18.0%) | 67,768 (33,219.6%) |
| 2.0x to 2.9x | 29 (18.0%) | 65 (31.9%) |
| 3.0x to 3.9x | 11 (6.8%) | 95 (46.6%) |
| 4.0x or more | 92 (57.1%) | 25 (12.2%) |
| Total | 161 (100.0%) | 204 (100.0%) |
Real Estate Taxes by Mortgage Status in Hinckley
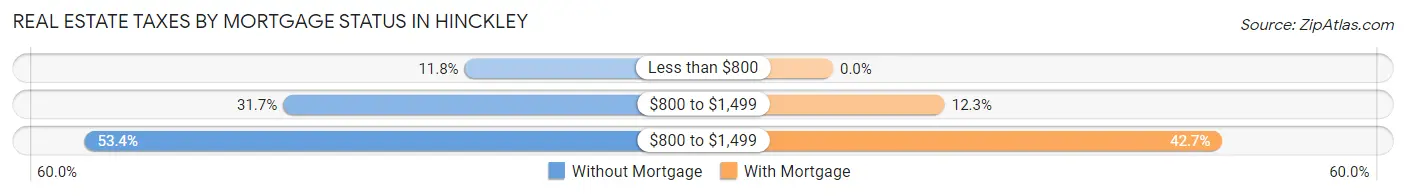
| Property Taxes | Without Mortgage | With Mortgage |
| Less than $800 | 19 (11.8%) | 0 (0.0%) |
| $800 to $1,499 | 51 (31.7%) | 25 (12.2%) |
| $800 to $1,499 | 86 (53.4%) | 87 (42.6%) |
| Total | 161 (100.0%) | 204 (100.0%) |
Health & Disability in Hinckley
Health Insurance Coverage by Age in Hinckley
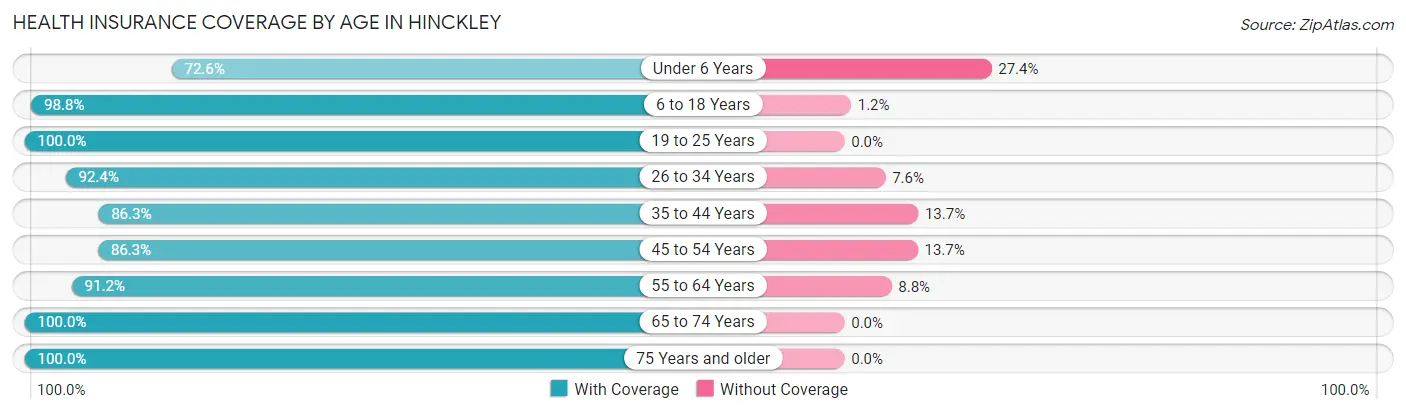
| Age Bracket | With Coverage | Without Coverage |
| Under 6 Years | 98 (72.6%) | 37 (27.4%) |
| 6 to 18 Years | 244 (98.8%) | 3 (1.2%) |
| 19 to 25 Years | 132 (100.0%) | 0 (0.0%) |
| 26 to 34 Years | 121 (92.4%) | 10 (7.6%) |
| 35 to 44 Years | 157 (86.3%) | 25 (13.7%) |
| 45 to 54 Years | 158 (86.3%) | 25 (13.7%) |
| 55 to 64 Years | 187 (91.2%) | 18 (8.8%) |
| 65 to 74 Years | 154 (100.0%) | 0 (0.0%) |
| 75 Years and older | 185 (100.0%) | 0 (0.0%) |
| Total | 1,436 (92.4%) | 118 (7.6%) |
Health Insurance Coverage by Citizenship Status in Hinckley
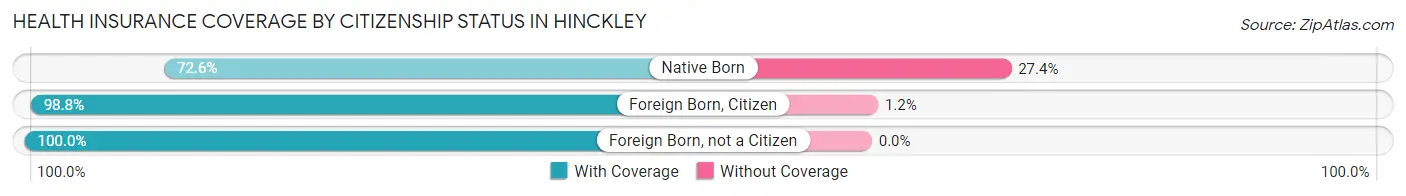
| Citizenship Status | With Coverage | Without Coverage |
| Native Born | 98 (72.6%) | 37 (27.4%) |
| Foreign Born, Citizen | 244 (98.8%) | 3 (1.2%) |
| Foreign Born, not a Citizen | 132 (100.0%) | 0 (0.0%) |
Health Insurance Coverage by Household Income in Hinckley
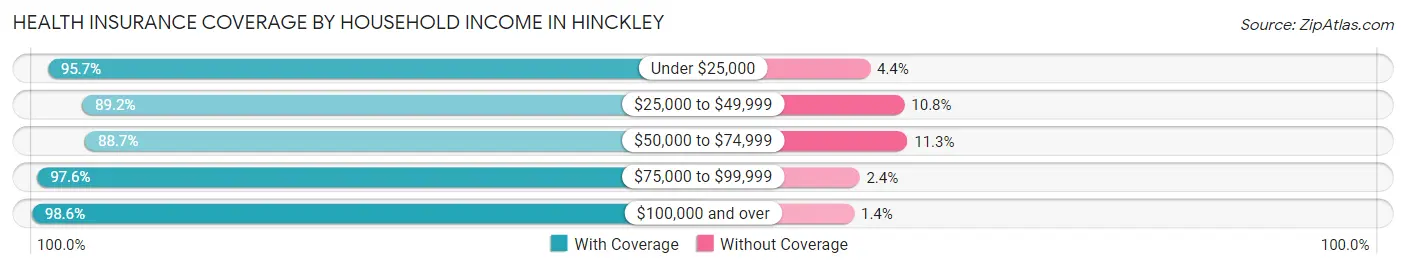
| Household Income | With Coverage | Without Coverage |
| Under $25,000 | 242 (95.7%) | 11 (4.3%) |
| $25,000 to $49,999 | 405 (89.2%) | 49 (10.8%) |
| $50,000 to $74,999 | 399 (88.7%) | 51 (11.3%) |
| $75,000 to $99,999 | 165 (97.6%) | 4 (2.4%) |
| $100,000 and over | 217 (98.6%) | 3 (1.4%) |
Public vs Private Health Insurance Coverage by Age in Hinckley
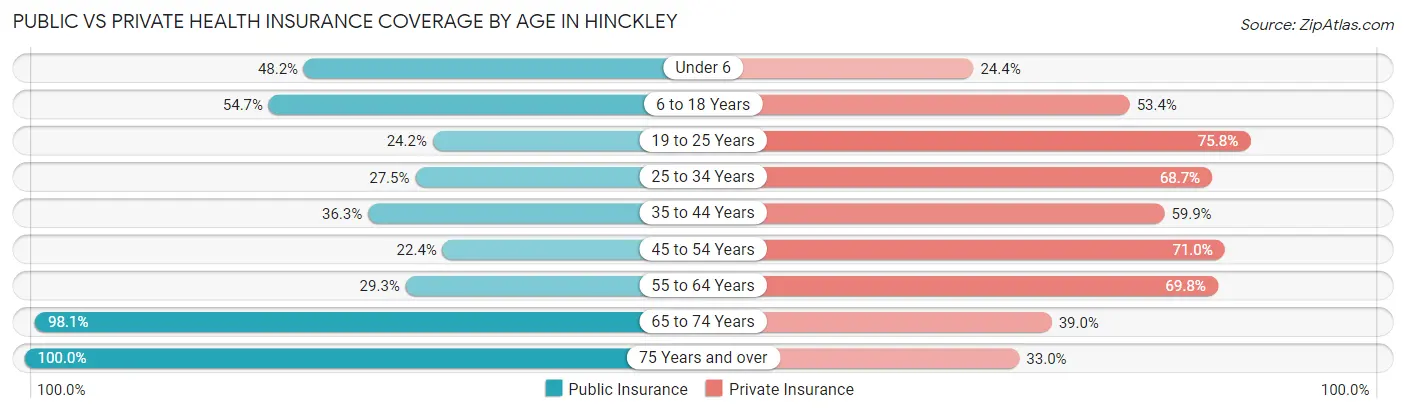
| Age Bracket | Public Insurance | Private Insurance |
| Under 6 | 65 (48.1%) | 33 (24.4%) |
| 6 to 18 Years | 135 (54.7%) | 132 (53.4%) |
| 19 to 25 Years | 32 (24.2%) | 100 (75.8%) |
| 25 to 34 Years | 36 (27.5%) | 90 (68.7%) |
| 35 to 44 Years | 66 (36.3%) | 109 (59.9%) |
| 45 to 54 Years | 41 (22.4%) | 130 (71.0%) |
| 55 to 64 Years | 60 (29.3%) | 143 (69.8%) |
| 65 to 74 Years | 151 (98.1%) | 60 (39.0%) |
| 75 Years and over | 185 (100.0%) | 61 (33.0%) |
| Total | 771 (49.6%) | 858 (55.2%) |
Disability Status by Sex by Age in Hinckley
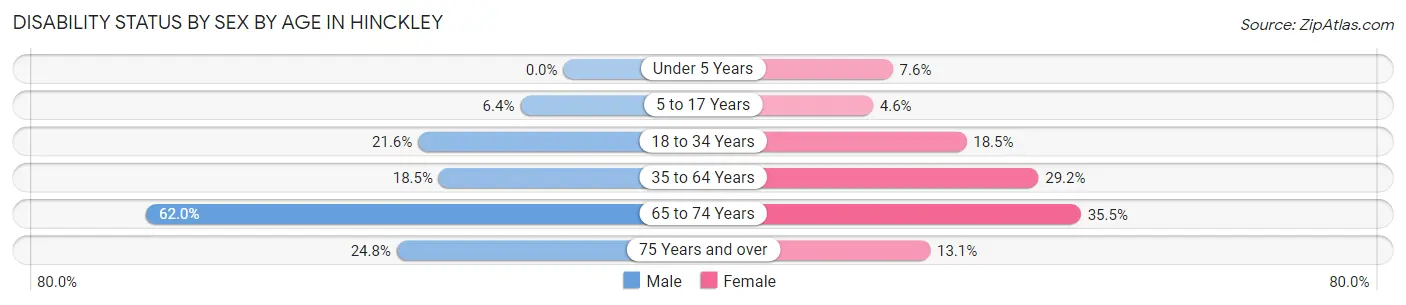
| Age Bracket | Male | Female |
| Under 5 Years | 0 (0.0%) | 4 (7.5%) |
| 5 to 17 Years | 8 (6.4%) | 7 (4.6%) |
| 18 to 34 Years | 33 (21.6%) | 22 (18.5%) |
| 35 to 64 Years | 49 (18.5%) | 89 (29.2%) |
| 65 to 74 Years | 57 (62.0%) | 22 (35.5%) |
| 75 Years and over | 25 (24.7%) | 11 (13.1%) |
Disability Class by Sex by Age in Hinckley
Disability Class: Hearing Difficulty
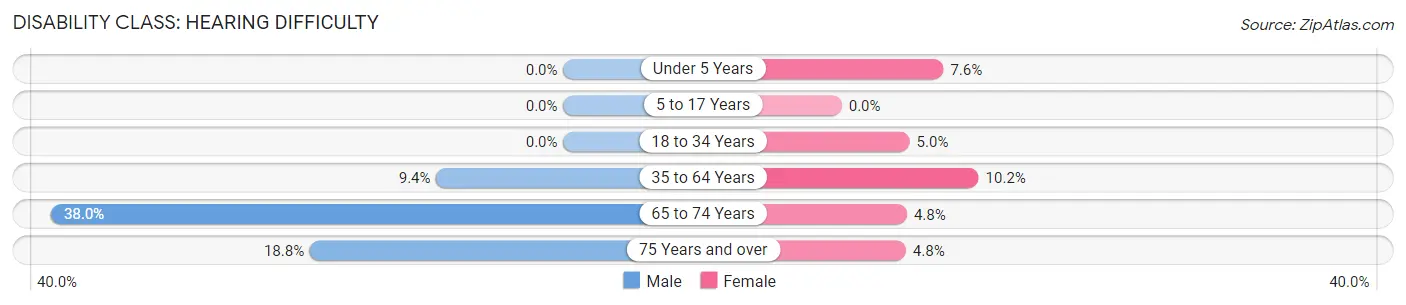
| Age Bracket | Male | Female |
| Under 5 Years | 0 (0.0%) | 4 (7.5%) |
| 5 to 17 Years | 0 (0.0%) | 0 (0.0%) |
| 18 to 34 Years | 0 (0.0%) | 6 (5.0%) |
| 35 to 64 Years | 25 (9.4%) | 31 (10.2%) |
| 65 to 74 Years | 35 (38.0%) | 3 (4.8%) |
| 75 Years and over | 19 (18.8%) | 4 (4.8%) |
Disability Class: Vision Difficulty
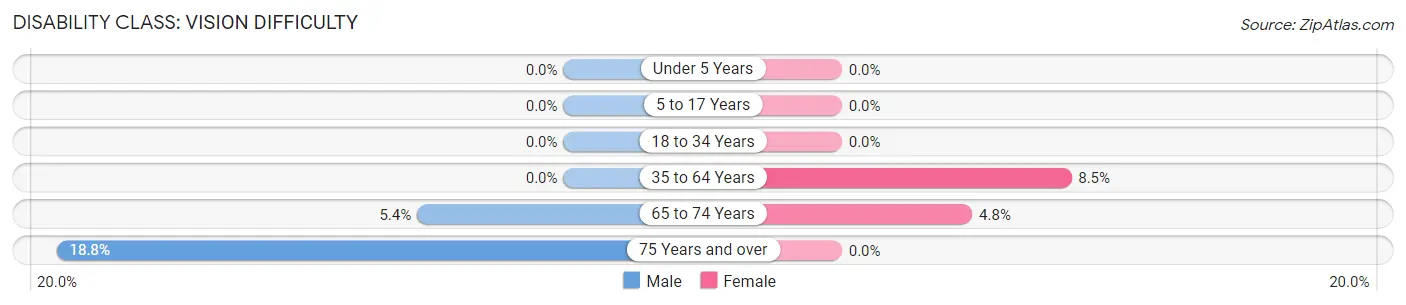
| Age Bracket | Male | Female |
| Under 5 Years | 0 (0.0%) | 0 (0.0%) |
| 5 to 17 Years | 0 (0.0%) | 0 (0.0%) |
| 18 to 34 Years | 0 (0.0%) | 0 (0.0%) |
| 35 to 64 Years | 0 (0.0%) | 26 (8.5%) |
| 65 to 74 Years | 5 (5.4%) | 3 (4.8%) |
| 75 Years and over | 19 (18.8%) | 0 (0.0%) |
Disability Class: Cognitive Difficulty
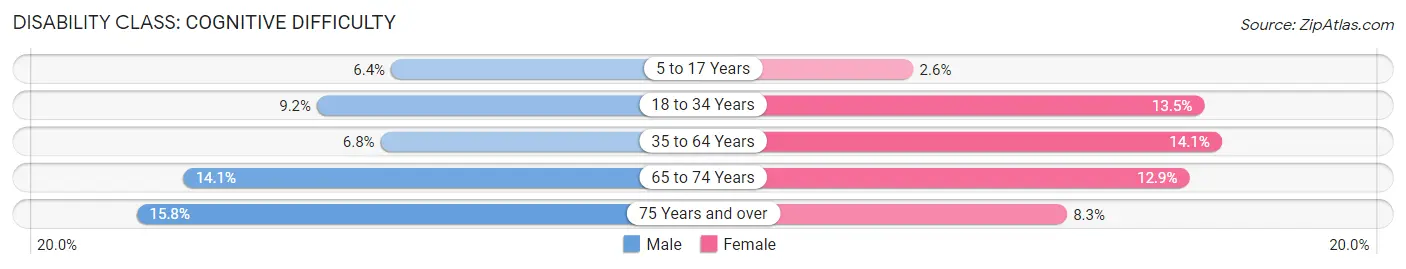
| Age Bracket | Male | Female |
| 5 to 17 Years | 8 (6.4%) | 4 (2.6%) |
| 18 to 34 Years | 14 (9.1%) | 16 (13.5%) |
| 35 to 64 Years | 18 (6.8%) | 43 (14.1%) |
| 65 to 74 Years | 13 (14.1%) | 8 (12.9%) |
| 75 Years and over | 16 (15.8%) | 7 (8.3%) |
Disability Class: Ambulatory Difficulty
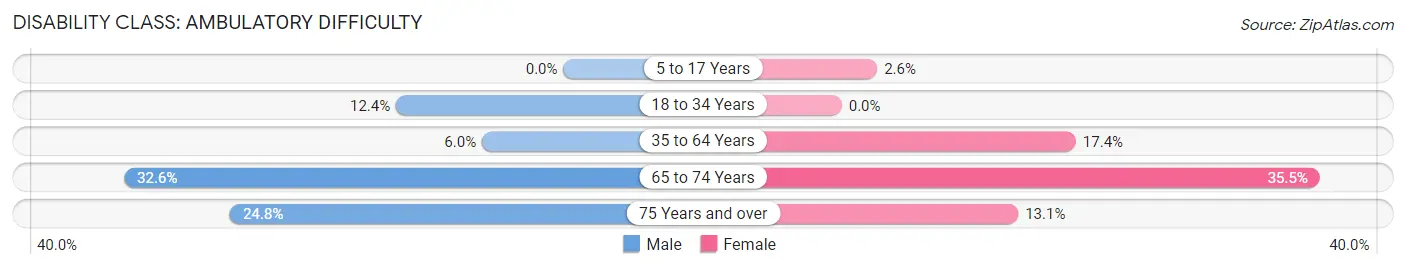
| Age Bracket | Male | Female |
| 5 to 17 Years | 0 (0.0%) | 4 (2.6%) |
| 18 to 34 Years | 19 (12.4%) | 0 (0.0%) |
| 35 to 64 Years | 16 (6.0%) | 53 (17.4%) |
| 65 to 74 Years | 30 (32.6%) | 22 (35.5%) |
| 75 Years and over | 25 (24.7%) | 11 (13.1%) |
Disability Class: Self-Care Difficulty
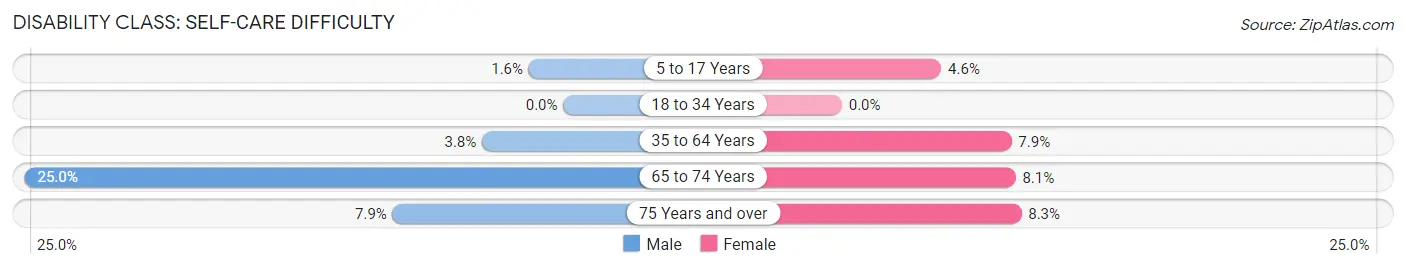
| Age Bracket | Male | Female |
| 5 to 17 Years | 2 (1.6%) | 7 (4.6%) |
| 18 to 34 Years | 0 (0.0%) | 0 (0.0%) |
| 35 to 64 Years | 10 (3.8%) | 24 (7.9%) |
| 65 to 74 Years | 23 (25.0%) | 5 (8.1%) |
| 75 Years and over | 8 (7.9%) | 7 (8.3%) |
Technology Access in Hinckley
Computing Device Access in Hinckley
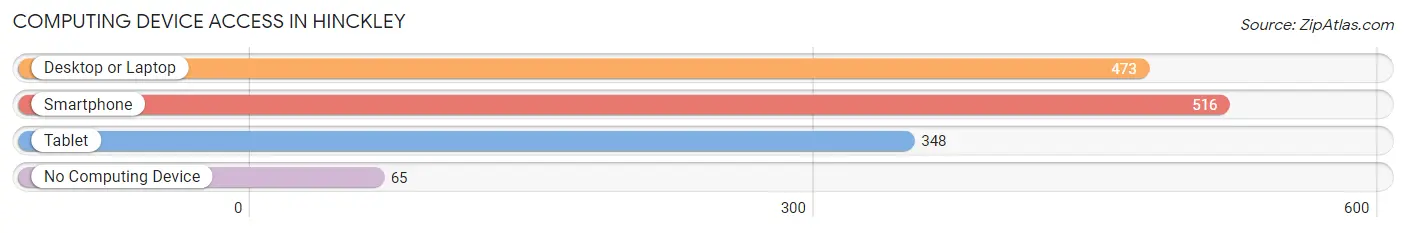
| Device Type | # Households | % Households |
| Desktop or Laptop | 473 | 73.9% |
| Smartphone | 516 | 80.6% |
| Tablet | 348 | 54.4% |
| No Computing Device | 65 | 10.2% |
| Total | 640 | 100.0% |
Internet Access in Hinckley
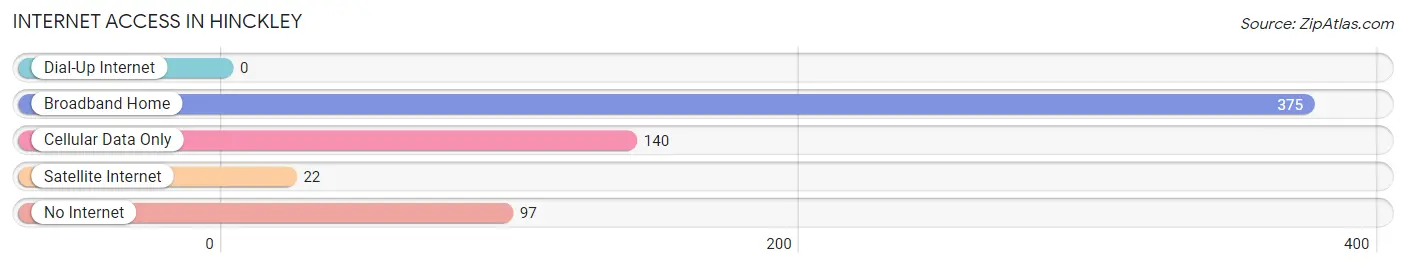
| Internet Type | # Households | % Households |
| Dial-Up Internet | 0 | 0.0% |
| Broadband Home | 375 | 58.6% |
| Cellular Data Only | 140 | 21.9% |
| Satellite Internet | 22 | 3.4% |
| No Internet | 97 | 15.2% |
| Total | 640 | 100.0% |
Hinckley Summary
Hinckley, Minnesota is a small city located in Pine County, Minnesota, United States. It is situated on the banks of the Kettle River, approximately 50 miles north of the Twin Cities. The city has a population of 2,717 as of the 2010 census.
History
Hinckley was founded in 1894 by the Hinckley Land and Lumber Company. The company was founded by William Hinckley, who had previously worked in the lumber industry in Wisconsin. The company was responsible for the development of the city, and the construction of the Great Northern Railway line that ran through the city. The city was incorporated in 1895, and the first mayor was William Hinckley.
The city was initially a logging and lumber town, and the Hinckley Land and Lumber Company was the largest employer in the area. The company was responsible for the construction of the Great Northern Railway line, which ran through the city and connected it to the Twin Cities. The railway line was a major factor in the growth of the city, as it allowed for the transportation of lumber and other goods to and from the city.
The city was also home to a number of other industries, including a flour mill, a brickyard, and a sawmill. The city was also home to a number of hotels, restaurants, and other businesses.
Geography
Hinckley is located in Pine County, Minnesota, United States. It is situated on the banks of the Kettle River, approximately 50 miles north of the Twin Cities. The city has a total area of 2.2 square miles, all of which is land.
The city is located in a heavily forested area, and is surrounded by a number of lakes, including Sand Lake, Mud Lake, and Rice Lake. The city is also located near the St. Croix National Scenic Riverway, which is a federally protected riverway.
Economy
Hinckley has a diverse economy, with a number of industries providing employment opportunities for the city's residents. The largest employer in the city is the Hinckley Land and Lumber Company, which is still in operation today. The company is responsible for the production of lumber and other wood products.
The city is also home to a number of other industries, including a flour mill, a brickyard, and a sawmill. The city is also home to a number of hotels, restaurants, and other businesses.
Demographics
As of the 2010 census, the city had a population of 2,717. The racial makeup of the city was 94.3% White, 0.7% African American, 0.3% Native American, 0.2% Asian, 0.1% Pacific Islander, 2.3% from other races, and 2.2% from two or more races. Hispanic or Latino of any race were 4.2% of the population.
The median income for a household in the city was $37,917, and the median income for a family was $45,938. The per capita income for the city was $18,945. About 11.2% of families and 14.2% of the population were below the poverty line, including 19.2% of those under age 18 and 8.2% of those age 65 or over.
Common Questions
What is Per Capita Income in Hinckley?
Per Capita income in Hinckley is $22,078.
What is the Median Family Income in Hinckley?
Median Family Income in Hinckley is $50,972.
What is the Median Household income in Hinckley?
Median Household Income in Hinckley is $40,909.
What is Income or Wage Gap in Hinckley?
Income or Wage Gap in Hinckley is 31.3%.
Women in Hinckley earn 68.7 cents for every dollar earned by a man.
What is Inequality or Gini Index in Hinckley?
Inequality or Gini Index in Hinckley is 0.38.
What is the Total Population of Hinckley?
Total Population of Hinckley is 1,564.
What is the Total Male Population of Hinckley?
Total Male Population of Hinckley is 779.
What is the Total Female Population of Hinckley?
Total Female Population of Hinckley is 785.
What is the Ratio of Males per 100 Females in Hinckley?
There are 99.24 Males per 100 Females in Hinckley.
What is the Ratio of Females per 100 Males in Hinckley?
There are 100.77 Females per 100 Males in Hinckley.
What is the Median Population Age in Hinckley?
Median Population Age in Hinckley is 42.7 Years.
What is the Average Family Size in Hinckley
Average Family Size in Hinckley is 3.1 People.
What is the Average Household Size in Hinckley
Average Household Size in Hinckley is 2.4 People.
How Large is the Labor Force in Hinckley?
There are 736 People in the Labor Forcein in Hinckley.
What is the Percentage of People in the Labor Force in Hinckley?
58.7% of People are in the Labor Force in Hinckley.
What is the Unemployment Rate in Hinckley?
Unemployment Rate in Hinckley is 9.5%.