Heron Lake, MN Map & Demographics
Heron Lake Map
Heron Lake Overview
$35,113
PER CAPITA INCOME
$81,522
AVG FAMILY INCOME
$65,750
AVG HOUSEHOLD INCOME
48.0%
WAGE / INCOME GAP [ % ]
52.0¢/ $1
WAGE / INCOME GAP [ $ ]
0.37
INEQUALITY / GINI INDEX
600
TOTAL POPULATION
300
MALE POPULATION
300
FEMALE POPULATION
100.00
MALES / 100 FEMALES
100.00
FEMALES / 100 MALES
43.3
MEDIAN AGE
2.9
AVG FAMILY SIZE
2.2
AVG HOUSEHOLD SIZE
356
LABOR FORCE [ PEOPLE ]
70.8%
PERCENT IN LABOR FORCE
Heron Lake Zip Codes
Heron Lake Area Codes
Income in Heron Lake
Income Overview in Heron Lake
Per Capita Income in Heron Lake is $35,113, while median incomes of families and households are $81,522 and $65,750 respectively.
| Characteristic | Number | Measure |
| Per Capita Income | 600 | $35,113 |
| Median Family Income | 158 | $81,522 |
| Mean Family Income | 158 | $93,766 |
| Median Household Income | 268 | $65,750 |
| Mean Household Income | 268 | $74,684 |
| Income Deficit | 158 | $0 |
| Wage / Income Gap (%) | 600 | 47.95% |
| Wage / Income Gap ($) | 600 | 52.05¢ per $1 |
| Gini / Inequality Index | 600 | 0.37 |
Earnings by Sex in Heron Lake
Average Earnings in Heron Lake are $32,361, $47,679 for men and $24,816 for women, a difference of 47.9%.
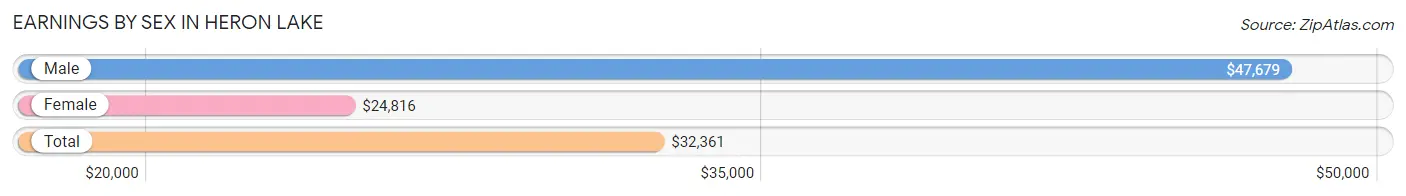
| Sex | Number | Average Earnings |
| Male | 198 (51.7%) | $47,679 |
| Female | 185 (48.3%) | $24,816 |
| Total | 383 (100.0%) | $32,361 |
Earnings by Sex by Income Bracket in Heron Lake
The most common earnings brackets in Heron Lake are $55,000 to $64,999 for men (35 | 17.7%) and $22,500 to $24,999 for women (34 | 18.4%).
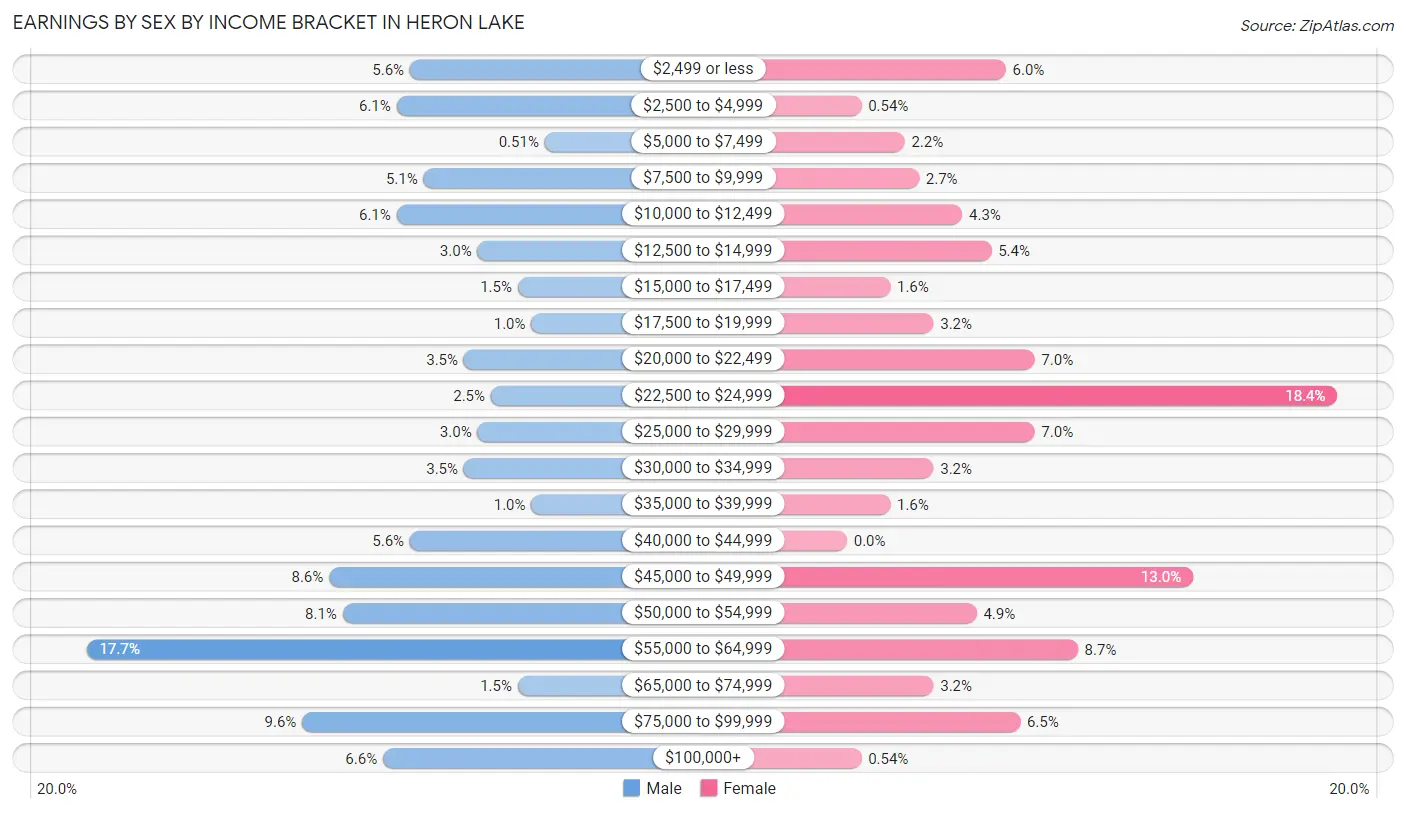
| Income | Male | Female |
| $2,499 or less | 11 (5.6%) | 11 (5.9%) |
| $2,500 to $4,999 | 12 (6.1%) | 1 (0.5%) |
| $5,000 to $7,499 | 1 (0.5%) | 4 (2.2%) |
| $7,500 to $9,999 | 10 (5.1%) | 5 (2.7%) |
| $10,000 to $12,499 | 12 (6.1%) | 8 (4.3%) |
| $12,500 to $14,999 | 6 (3.0%) | 10 (5.4%) |
| $15,000 to $17,499 | 3 (1.5%) | 3 (1.6%) |
| $17,500 to $19,999 | 2 (1.0%) | 6 (3.2%) |
| $20,000 to $22,499 | 7 (3.5%) | 13 (7.0%) |
| $22,500 to $24,999 | 5 (2.5%) | 34 (18.4%) |
| $25,000 to $29,999 | 6 (3.0%) | 13 (7.0%) |
| $30,000 to $34,999 | 7 (3.5%) | 6 (3.2%) |
| $35,000 to $39,999 | 2 (1.0%) | 3 (1.6%) |
| $40,000 to $44,999 | 11 (5.6%) | 0 (0.0%) |
| $45,000 to $49,999 | 17 (8.6%) | 24 (13.0%) |
| $50,000 to $54,999 | 16 (8.1%) | 9 (4.9%) |
| $55,000 to $64,999 | 35 (17.7%) | 16 (8.6%) |
| $65,000 to $74,999 | 3 (1.5%) | 6 (3.2%) |
| $75,000 to $99,999 | 19 (9.6%) | 12 (6.5%) |
| $100,000+ | 13 (6.6%) | 1 (0.5%) |
| Total | 198 (100.0%) | 185 (100.0%) |
Earnings by Sex by Educational Attainment in Heron Lake
Average earnings in Heron Lake are $50,250 for men and $28,636 for women, a difference of 43.0%. Men with an educational attainment of bachelor's degree enjoy the highest average annual earnings of $85,313, while those with high school diploma education earn the least with $32,500. Women with an educational attainment of graduate degree earn the most with the average annual earnings of $54,167, while those with high school diploma education have the smallest earnings of $23,664.
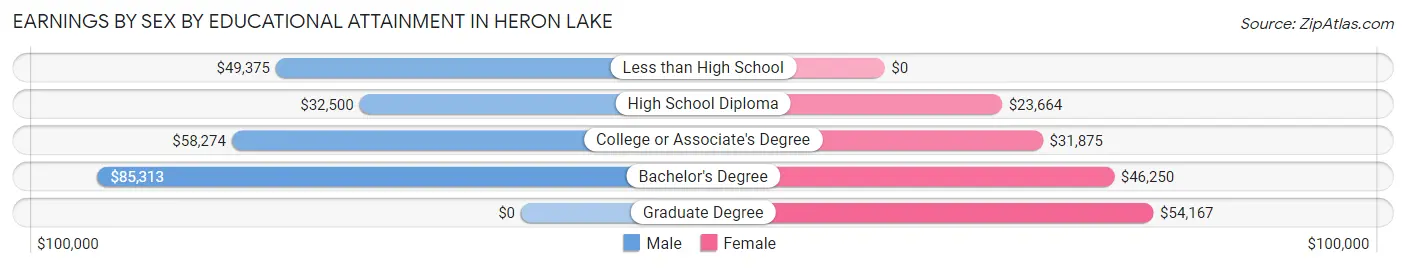
| Educational Attainment | Male Income | Female Income |
| Less than High School | $49,375 | $0 |
| High School Diploma | $32,500 | $23,664 |
| College or Associate's Degree | $58,274 | $31,875 |
| Bachelor's Degree | $85,313 | $46,250 |
| Graduate Degree | - | - |
| Total | $50,250 | $28,636 |
Family Income in Heron Lake
Family Income Brackets in Heron Lake
According to the Heron Lake family income data, there are 46 families falling into the $75,000 to $99,999 income range, which is the most common income bracket and makes up 29.1% of all families.
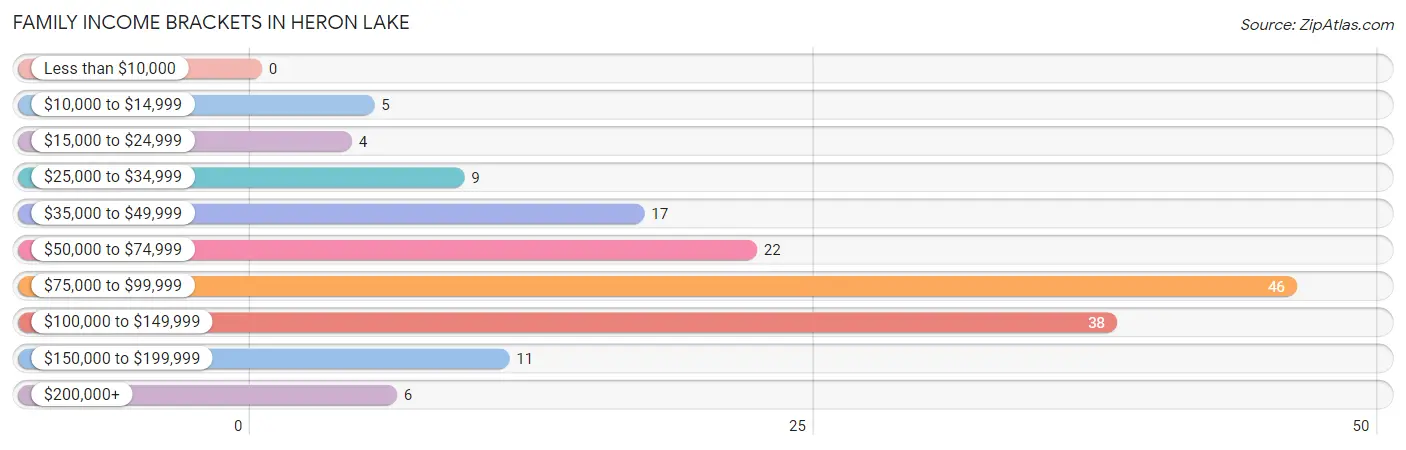
| Income Bracket | # Families | % Families |
| Less than $10,000 | 0 | 0.0% |
| $10,000 to $14,999 | 5 | 3.2% |
| $15,000 to $24,999 | 4 | 2.5% |
| $25,000 to $34,999 | 9 | 5.7% |
| $35,000 to $49,999 | 17 | 10.8% |
| $50,000 to $74,999 | 22 | 13.9% |
| $75,000 to $99,999 | 46 | 29.1% |
| $100,000 to $149,999 | 38 | 24.1% |
| $150,000 to $199,999 | 11 | 7.0% |
| $200,000+ | 6 | 3.8% |
Family Income by Famaliy Size in Heron Lake
5-person families (9 | 5.7%) account for the highest median family income in Heron Lake with $123,250 per family, while 2-person families (91 | 57.6%) have the highest median income of $40,136 per family member.
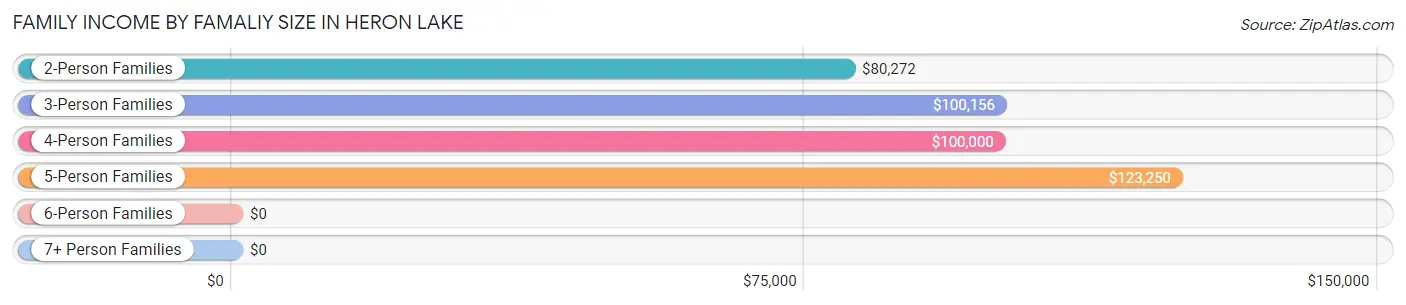
| Income Bracket | # Families | Median Income |
| 2-Person Families | 91 (57.6%) | $80,272 |
| 3-Person Families | 33 (20.9%) | $100,156 |
| 4-Person Families | 14 (8.9%) | $100,000 |
| 5-Person Families | 9 (5.7%) | $123,250 |
| 6-Person Families | 11 (7.0%) | $0 |
| 7+ Person Families | 0 (0.0%) | $0 |
| Total | 158 (100.0%) | $81,522 |
Family Income by Number of Earners in Heron Lake
The median family income in Heron Lake is $81,522, with families comprising 3+ earners (26) having the highest median family income of $151,250, while families with no earners (21) have the lowest median family income of $48,875, accounting for 16.5% and 13.3% of families, respectively.
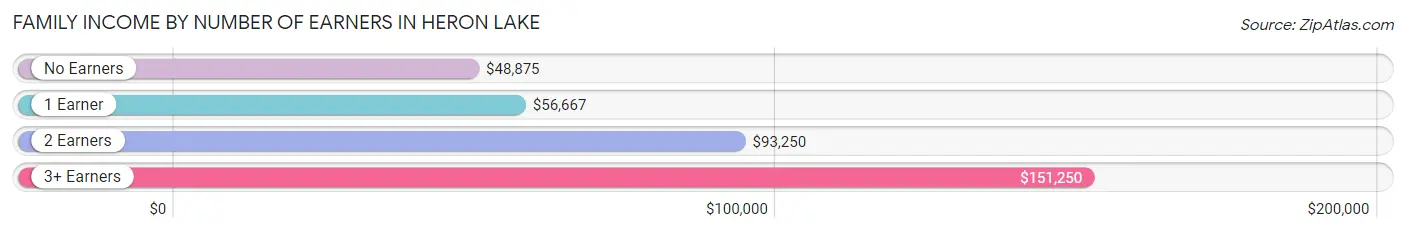
| Number of Earners | # Families | Median Income |
| No Earners | 21 (13.3%) | $48,875 |
| 1 Earner | 30 (19.0%) | $56,667 |
| 2 Earners | 81 (51.3%) | $93,250 |
| 3+ Earners | 26 (16.5%) | $151,250 |
| Total | 158 (100.0%) | $81,522 |
Household Income in Heron Lake
Household Income Brackets in Heron Lake
With 56 households falling in the category, the $75,000 to $99,999 income range is the most frequent in Heron Lake, accounting for 20.9% of all households. In contrast, only 4 households (1.5%) fall into the less than $10,000 income bracket, making it the least populous group.
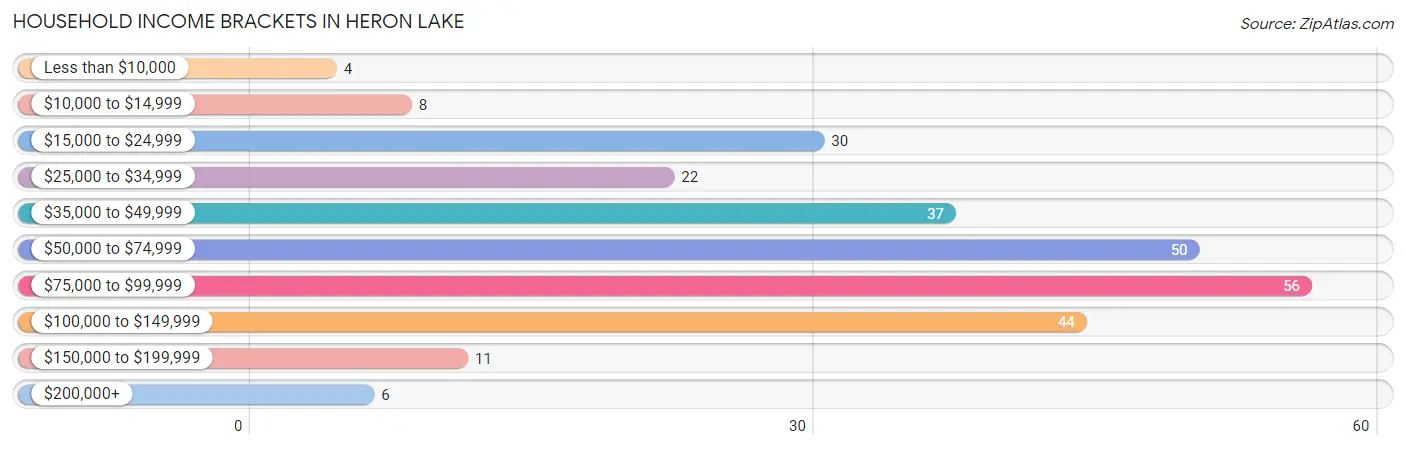
| Income Bracket | # Households | % Households |
| Less than $10,000 | 4 | 1.5% |
| $10,000 to $14,999 | 8 | 3.0% |
| $15,000 to $24,999 | 30 | 11.2% |
| $25,000 to $34,999 | 22 | 8.2% |
| $35,000 to $49,999 | 37 | 13.8% |
| $50,000 to $74,999 | 50 | 18.7% |
| $75,000 to $99,999 | 56 | 20.9% |
| $100,000 to $149,999 | 44 | 16.4% |
| $150,000 to $199,999 | 11 | 4.1% |
| $200,000+ | 6 | 2.2% |
Household Income by Householder Age in Heron Lake
The median household income in Heron Lake is $65,750, with the highest median household income of $81,902 found in the 45 to 64 years age bracket for the primary householder. A total of 85 households (31.7%) fall into this category. Meanwhile, the 15 to 24 years age bracket for the primary householder has the lowest median household income of $0, with 2 households (0.7%) in this group.
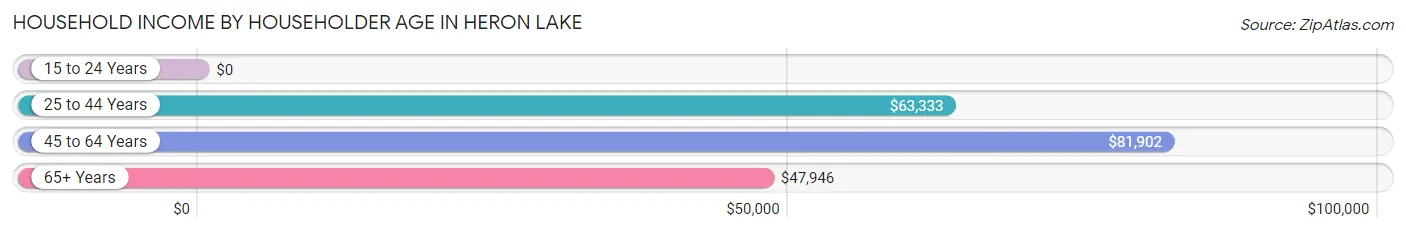
| Income Bracket | # Households | Median Income |
| 15 to 24 Years | 2 (0.7%) | $0 |
| 25 to 44 Years | 82 (30.6%) | $63,333 |
| 45 to 64 Years | 85 (31.7%) | $81,902 |
| 65+ Years | 99 (36.9%) | $47,946 |
| Total | 268 (100.0%) | $65,750 |
Poverty in Heron Lake
Income Below Poverty by Sex and Age in Heron Lake
With 8.4% poverty level for males and 7.9% for females among the residents of Heron Lake, 5 year old males and 15 year old females are the most vulnerable to poverty, with 4 males (100.0%) and 1 females (100.0%) in their respective age groups living below the poverty level.
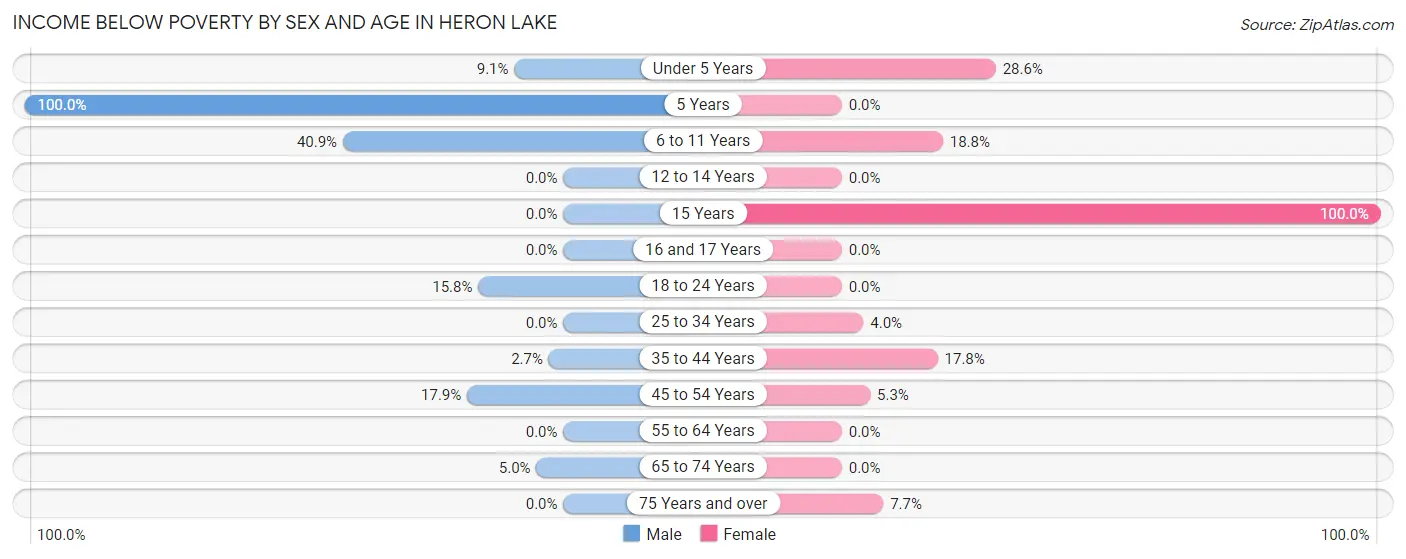
| Age Bracket | Male | Female |
| Under 5 Years | 1 (9.1%) | 2 (28.6%) |
| 5 Years | 4 (100.0%) | 0 (0.0%) |
| 6 to 11 Years | 9 (40.9%) | 6 (18.8%) |
| 12 to 14 Years | 0 (0.0%) | 0 (0.0%) |
| 15 Years | 0 (0.0%) | 1 (100.0%) |
| 16 and 17 Years | 0 (0.0%) | 0 (0.0%) |
| 18 to 24 Years | 3 (15.8%) | 0 (0.0%) |
| 25 to 34 Years | 0 (0.0%) | 2 (4.0%) |
| 35 to 44 Years | 1 (2.7%) | 8 (17.8%) |
| 45 to 54 Years | 5 (17.9%) | 1 (5.3%) |
| 55 to 64 Years | 0 (0.0%) | 0 (0.0%) |
| 65 to 74 Years | 2 (5.0%) | 0 (0.0%) |
| 75 Years and over | 0 (0.0%) | 3 (7.7%) |
| Total | 25 (8.4%) | 23 (7.9%) |
Income Above Poverty by Sex and Age in Heron Lake
According to the poverty statistics in Heron Lake, males aged 12 to 14 years and females aged 12 to 14 years are the age groups that are most secure financially, with 100.0% of males and 100.0% of females in these age groups living above the poverty line.
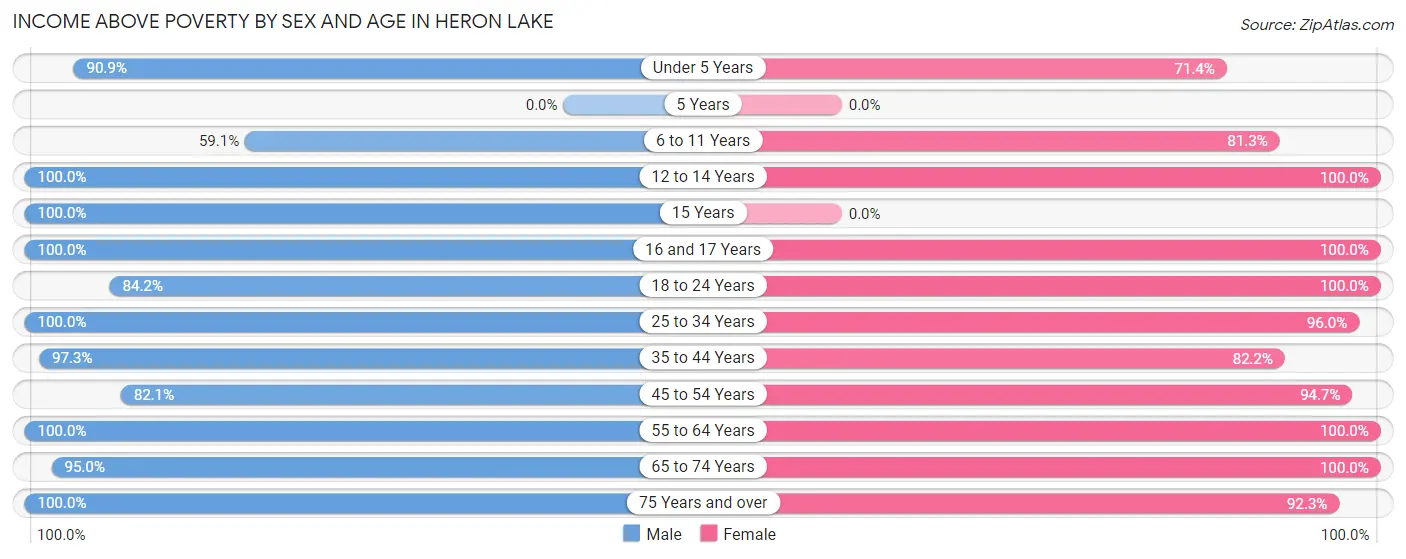
| Age Bracket | Male | Female |
| Under 5 Years | 10 (90.9%) | 5 (71.4%) |
| 5 Years | 0 (0.0%) | 0 (0.0%) |
| 6 to 11 Years | 13 (59.1%) | 26 (81.2%) |
| 12 to 14 Years | 4 (100.0%) | 13 (100.0%) |
| 15 Years | 1 (100.0%) | 0 (0.0%) |
| 16 and 17 Years | 13 (100.0%) | 2 (100.0%) |
| 18 to 24 Years | 16 (84.2%) | 17 (100.0%) |
| 25 to 34 Years | 26 (100.0%) | 48 (96.0%) |
| 35 to 44 Years | 36 (97.3%) | 37 (82.2%) |
| 45 to 54 Years | 23 (82.1%) | 18 (94.7%) |
| 55 to 64 Years | 55 (100.0%) | 34 (100.0%) |
| 65 to 74 Years | 38 (95.0%) | 31 (100.0%) |
| 75 Years and over | 38 (100.0%) | 36 (92.3%) |
| Total | 273 (91.6%) | 267 (92.1%) |
Income Below Poverty Among Married-Couple Families in Heron Lake
The poverty statistics for married-couple families in Heron Lake show that 0.9% or 1 of the total 109 families live below the poverty line. Families with 1 or 2 children have the highest poverty rate of 3.2%, comprising of 1 families. On the other hand, families with no children have the lowest poverty rate of 0.0%, which includes 0 families.
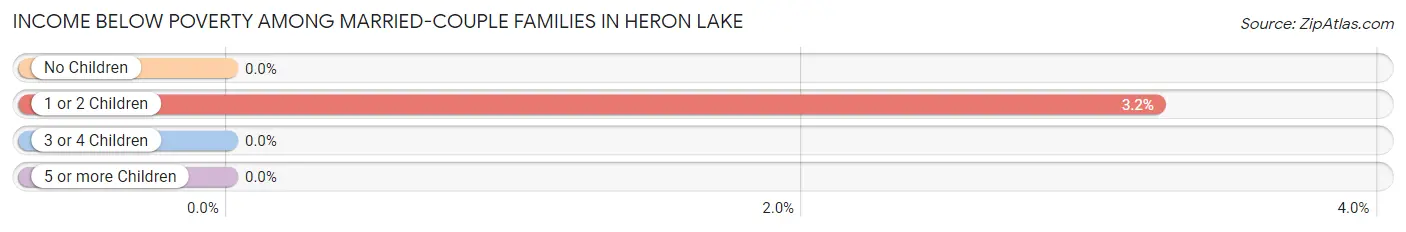
| Children | Above Poverty | Below Poverty |
| No Children | 67 (100.0%) | 0 (0.0%) |
| 1 or 2 Children | 30 (96.8%) | 1 (3.2%) |
| 3 or 4 Children | 11 (100.0%) | 0 (0.0%) |
| 5 or more Children | 0 (0.0%) | 0 (0.0%) |
| Total | 108 (99.1%) | 1 (0.9%) |
Income Below Poverty Among Single-Parent Households in Heron Lake
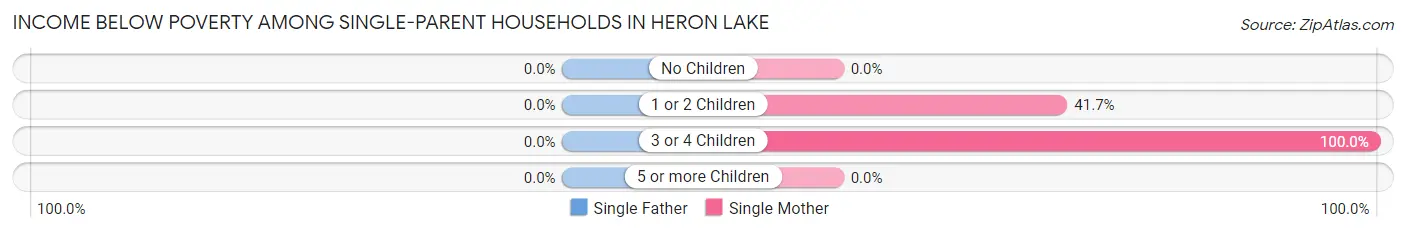
| Children | Single Father | Single Mother |
| No Children | 0 (0.0%) | 0 (0.0%) |
| 1 or 2 Children | 0 (0.0%) | 5 (41.7%) |
| 3 or 4 Children | 0 (0.0%) | 3 (100.0%) |
| 5 or more Children | 0 (0.0%) | 0 (0.0%) |
| Total | 0 (0.0%) | 8 (42.1%) |
Income Below Poverty Among Married-Couple vs Single-Parent Households in Heron Lake
The poverty data for Heron Lake shows that 1 of the married-couple family households (0.9%) and 8 of the single-parent households (16.3%) are living below the poverty level. Within the married-couple family households, those with 1 or 2 children have the highest poverty rate, with 1 households (3.2%) falling below the poverty line. Among the single-parent households, those with 3 or 4 children have the highest poverty rate, with 3 household (100.0%) living below poverty.
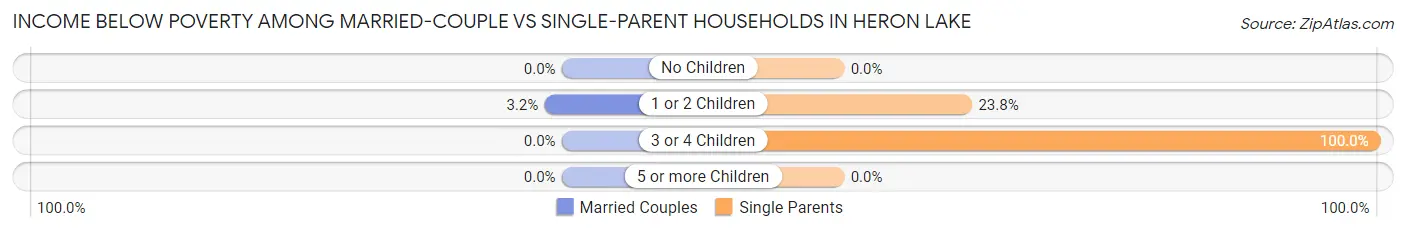
| Children | Married-Couple Families | Single-Parent Households |
| No Children | 0 (0.0%) | 0 (0.0%) |
| 1 or 2 Children | 1 (3.2%) | 5 (23.8%) |
| 3 or 4 Children | 0 (0.0%) | 3 (100.0%) |
| 5 or more Children | 0 (0.0%) | 0 (0.0%) |
| Total | 1 (0.9%) | 8 (16.3%) |
Race in Heron Lake
The most populous races in Heron Lake are White / Caucasian (513 | 85.5%), Hispanic or Latino (63 | 10.5%), and Two or more Races (46 | 7.7%).
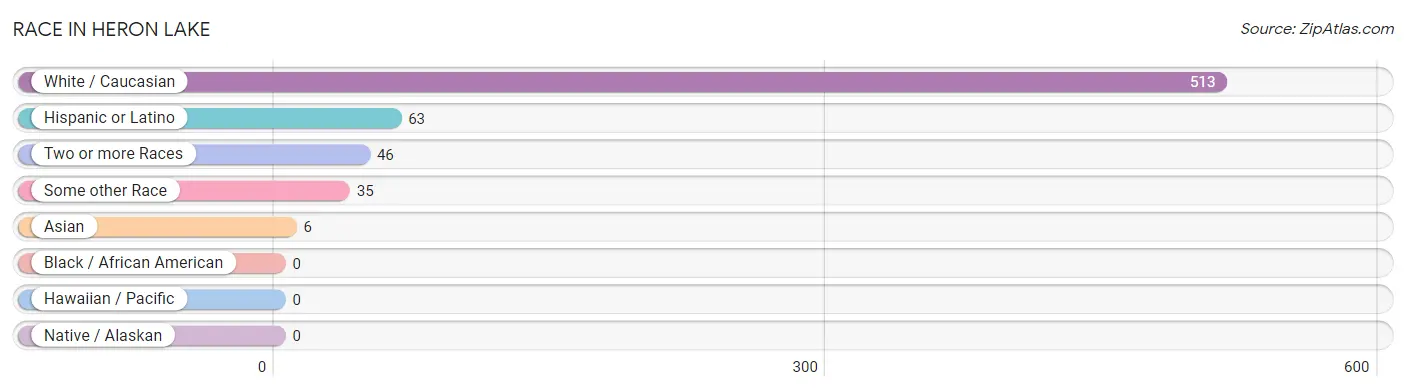
| Race | # Population | % Population |
| Asian | 6 | 1.0% |
| Black / African American | 0 | 0.0% |
| Hawaiian / Pacific | 0 | 0.0% |
| Hispanic or Latino | 63 | 10.5% |
| Native / Alaskan | 0 | 0.0% |
| White / Caucasian | 513 | 85.5% |
| Two or more Races | 46 | 7.7% |
| Some other Race | 35 | 5.8% |
| Total | 600 | 100.0% |
Ancestry in Heron Lake
The most populous ancestries reported in Heron Lake are German (284 | 47.3%), Irish (78 | 13.0%), Norwegian (60 | 10.0%), Mexican (57 | 9.5%), and Danish (48 | 8.0%), together accounting for 87.8% of all Heron Lake residents.
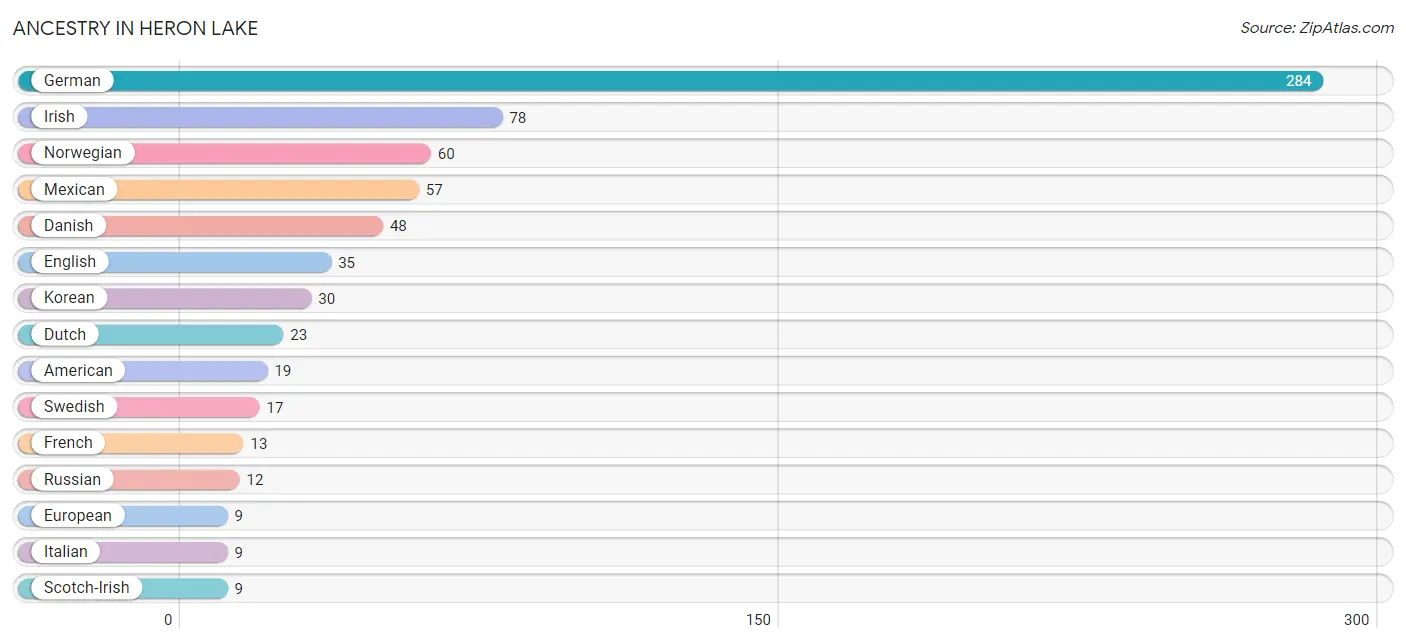
| Ancestry | # Population | % Population |
| American | 19 | 3.2% |
| Austrian | 6 | 1.0% |
| Central American | 3 | 0.5% |
| Cheyenne | 2 | 0.3% |
| Danish | 48 | 8.0% |
| Dutch | 23 | 3.8% |
| English | 35 | 5.8% |
| European | 9 | 1.5% |
| French | 13 | 2.2% |
| German | 284 | 47.3% |
| Guatemalan | 3 | 0.5% |
| Irish | 78 | 13.0% |
| Italian | 9 | 1.5% |
| Korean | 30 | 5.0% |
| Luxembourger | 4 | 0.7% |
| Mexican | 57 | 9.5% |
| Norwegian | 60 | 10.0% |
| Pakistani | 4 | 0.7% |
| Russian | 12 | 2.0% |
| Scotch-Irish | 9 | 1.5% |
| Scottish | 8 | 1.3% |
| Sioux | 2 | 0.3% |
| Swedish | 17 | 2.8% |
| Ukrainian | 5 | 0.8% |
| Welsh | 1 | 0.2% |
| Yugoslavian | 1 | 0.2% | View All 26 Rows |
Immigrants in Heron Lake
The most numerous immigrant groups reported in Heron Lake came from Eastern Europe (2 | 0.3%), Europe (2 | 0.3%), Ukraine (2 | 0.3%), Central America (1 | 0.2%), and Latin America (1 | 0.2%), together accounting for 1.3% of all Heron Lake residents.
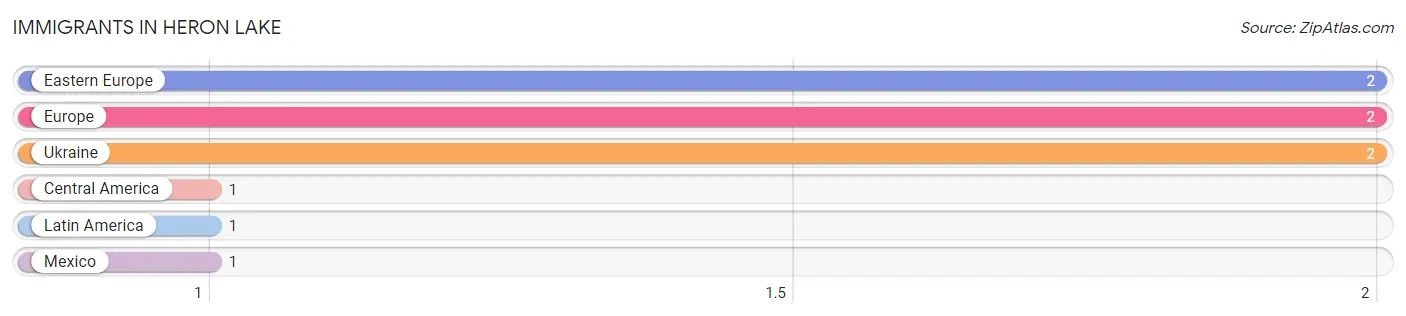
| Immigration Origin | # Population | % Population |
| Central America | 1 | 0.2% |
| Eastern Europe | 2 | 0.3% |
| Europe | 2 | 0.3% |
| Latin America | 1 | 0.2% |
| Mexico | 1 | 0.2% |
| Ukraine | 2 | 0.3% | View All 6 Rows |
Sex and Age in Heron Lake
Sex and Age in Heron Lake
The most populous age groups in Heron Lake are 55 to 59 Years (37 | 12.3%) for men and 25 to 29 Years (36 | 12.0%) for women.
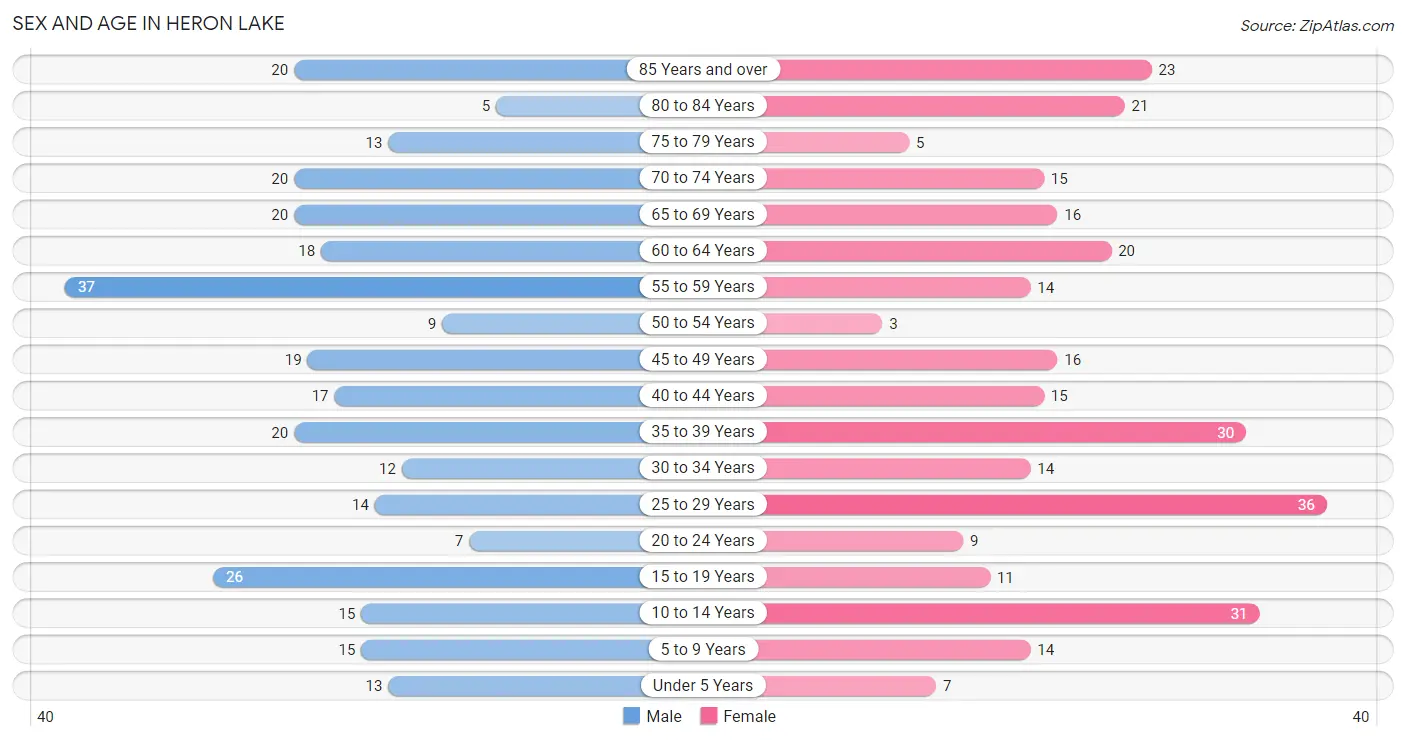
| Age Bracket | Male | Female |
| Under 5 Years | 13 (4.3%) | 7 (2.3%) |
| 5 to 9 Years | 15 (5.0%) | 14 (4.7%) |
| 10 to 14 Years | 15 (5.0%) | 31 (10.3%) |
| 15 to 19 Years | 26 (8.7%) | 11 (3.7%) |
| 20 to 24 Years | 7 (2.3%) | 9 (3.0%) |
| 25 to 29 Years | 14 (4.7%) | 36 (12.0%) |
| 30 to 34 Years | 12 (4.0%) | 14 (4.7%) |
| 35 to 39 Years | 20 (6.7%) | 30 (10.0%) |
| 40 to 44 Years | 17 (5.7%) | 15 (5.0%) |
| 45 to 49 Years | 19 (6.3%) | 16 (5.3%) |
| 50 to 54 Years | 9 (3.0%) | 3 (1.0%) |
| 55 to 59 Years | 37 (12.3%) | 14 (4.7%) |
| 60 to 64 Years | 18 (6.0%) | 20 (6.7%) |
| 65 to 69 Years | 20 (6.7%) | 16 (5.3%) |
| 70 to 74 Years | 20 (6.7%) | 15 (5.0%) |
| 75 to 79 Years | 13 (4.3%) | 5 (1.7%) |
| 80 to 84 Years | 5 (1.7%) | 21 (7.0%) |
| 85 Years and over | 20 (6.7%) | 23 (7.7%) |
| Total | 300 (100.0%) | 300 (100.0%) |
Families and Households in Heron Lake
Median Family Size in Heron Lake
The median family size in Heron Lake is 2.92 persons per family, with single female/mother families (19 | 12.0%) accounting for the largest median family size of 3.32 persons per family. On the other hand, single male/father families (30 | 19.0%) represent the smallest median family size with 2.20 persons per family.
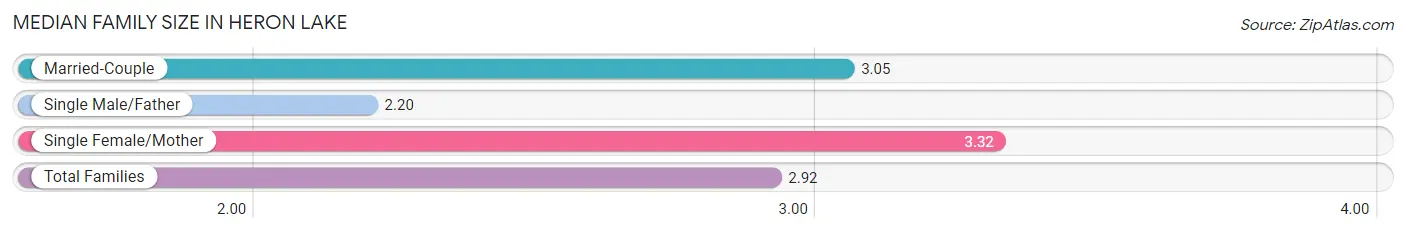
| Family Type | # Families | Family Size |
| Married-Couple | 109 (69.0%) | 3.05 |
| Single Male/Father | 30 (19.0%) | 2.20 |
| Single Female/Mother | 19 (12.0%) | 3.32 |
| Total Families | 158 (100.0%) | 2.92 |
Median Household Size in Heron Lake
The median household size in Heron Lake is 2.20 persons per household, with single female/mother households (19 | 7.1%) accounting for the largest median household size of 3.79 persons per household. non-family households (110 | 41.0%) represent the smallest median household size with 1.06 persons per household.
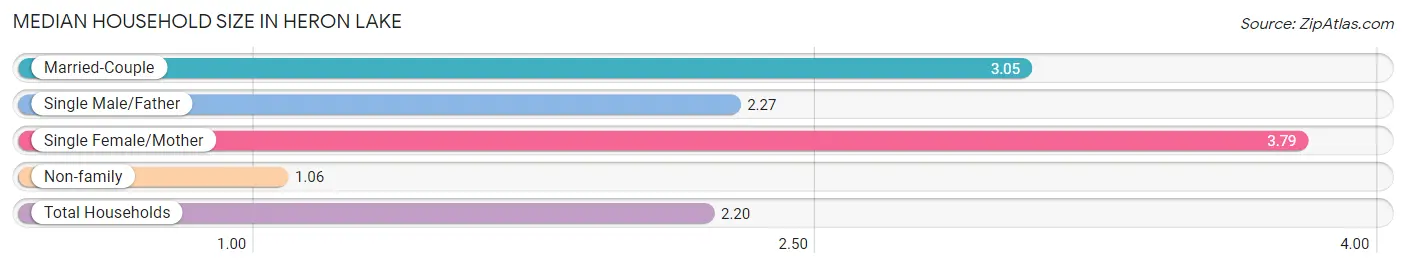
| Household Type | # Households | Household Size |
| Married-Couple | 109 (40.7%) | 3.05 |
| Single Male/Father | 30 (11.2%) | 2.27 |
| Single Female/Mother | 19 (7.1%) | 3.79 |
| Non-family | 110 (41.0%) | 1.06 |
| Total Households | 268 (100.0%) | 2.20 |
Household Size by Marriage Status in Heron Lake
Out of a total of 268 households in Heron Lake, 158 (59.0%) are family households, while 110 (41.0%) are nonfamily households. The most numerous type of family households are 2-person households, comprising 86, and the most common type of nonfamily households are 1-person households, comprising 103.
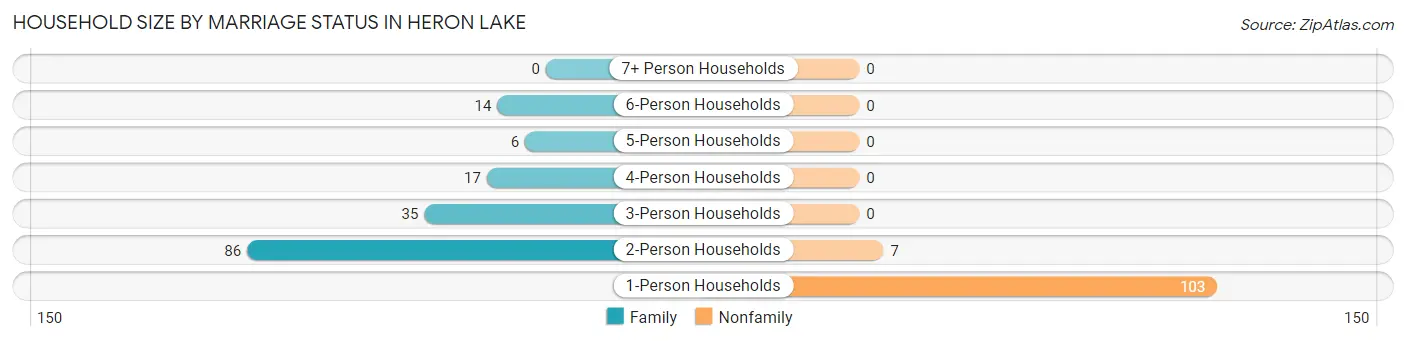
| Household Size | Family Households | Nonfamily Households |
| 1-Person Households | - | 103 (38.4%) |
| 2-Person Households | 86 (32.1%) | 7 (2.6%) |
| 3-Person Households | 35 (13.1%) | 0 (0.0%) |
| 4-Person Households | 17 (6.3%) | 0 (0.0%) |
| 5-Person Households | 6 (2.2%) | 0 (0.0%) |
| 6-Person Households | 14 (5.2%) | 0 (0.0%) |
| 7+ Person Households | 0 (0.0%) | 0 (0.0%) |
| Total | 158 (59.0%) | 110 (41.0%) |
Female Fertility in Heron Lake
Fertility by Age in Heron Lake
Average fertility rate in Heron Lake is 8.0 births per 1,000 women. Women in the age bracket of 35 to 50 years have the highest fertility rate with 16.0 births per 1,000 women. Women in the age bracket of 35 to 50 years acount for 100.0% of all women with births.
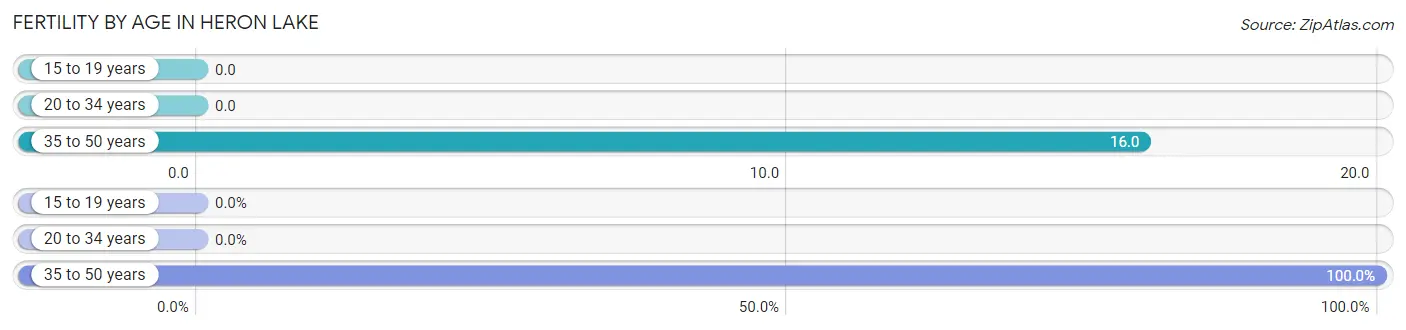
| Age Bracket | Women with Births | Births / 1,000 Women |
| 15 to 19 years | 0 (0.0%) | 0.0 |
| 20 to 34 years | 0 (0.0%) | 0.0 |
| 35 to 50 years | 1 (100.0%) | 16.0 |
| Total | 1 (100.0%) | 8.0 |
Fertility by Age by Marriage Status in Heron Lake
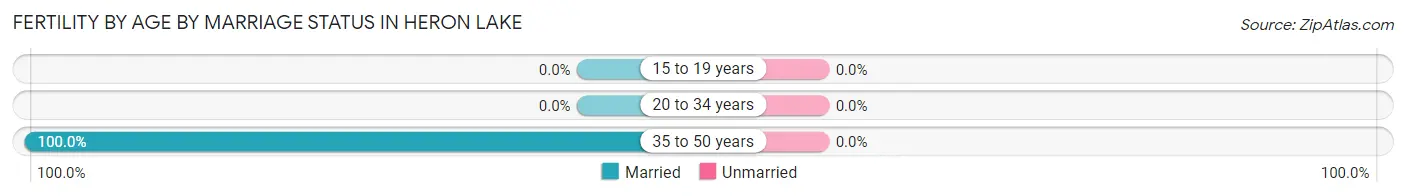
| Age Bracket | Married | Unmarried |
| 15 to 19 years | 0 (0.0%) | 0 (0.0%) |
| 20 to 34 years | 0 (0.0%) | 0 (0.0%) |
| 35 to 50 years | 1 (100.0%) | 0 (0.0%) |
| Total | 1 (100.0%) | 0 (0.0%) |
Fertility by Education in Heron Lake
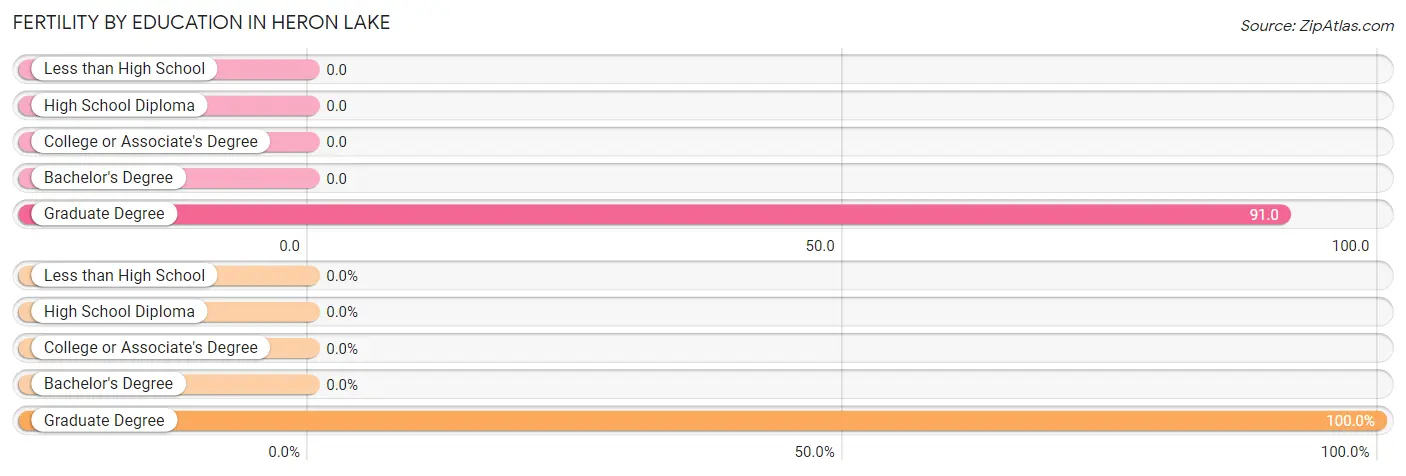
| Educational Attainment | Women with Births | Births / 1,000 Women |
| Less than High School | 0 (0.0%) | 0.0 |
| High School Diploma | 0 (0.0%) | 0.0 |
| College or Associate's Degree | 0 (0.0%) | 0.0 |
| Bachelor's Degree | 0 (0.0%) | 0.0 |
| Graduate Degree | 1 (100.0%) | 91.0 |
| Total | 1 (100.0%) | 8.0 |
Fertility by Education by Marriage Status in Heron Lake
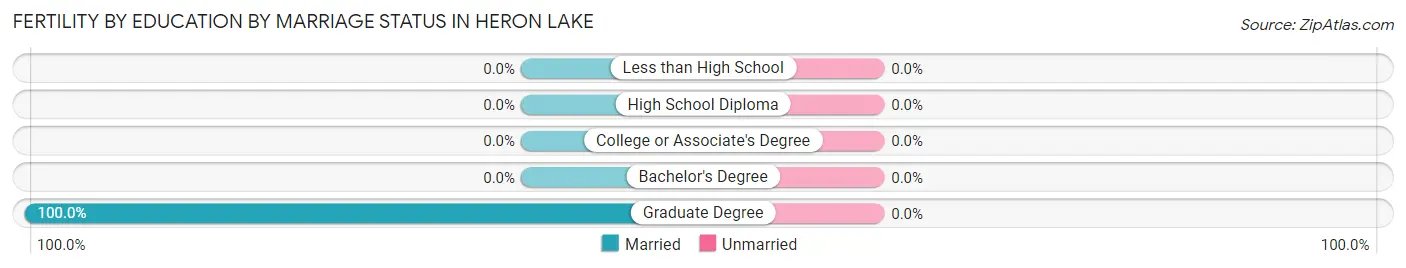
| Educational Attainment | Married | Unmarried |
| Less than High School | 0 (0.0%) | 0 (0.0%) |
| High School Diploma | 0 (0.0%) | 0 (0.0%) |
| College or Associate's Degree | 0 (0.0%) | 0 (0.0%) |
| Bachelor's Degree | 0 (0.0%) | 0 (0.0%) |
| Graduate Degree | 1 (100.0%) | 0 (0.0%) |
| Total | 1 (100.0%) | 0 (0.0%) |
Employment Characteristics in Heron Lake
Employment by Class of Employer in Heron Lake
Among the 352 employed individuals in Heron Lake, private company employees (248 | 70.5%), self-employed (not incorporated) (35 | 9.9%), and not-for-profit organizations (34 | 9.7%) make up the most common classes of employment.
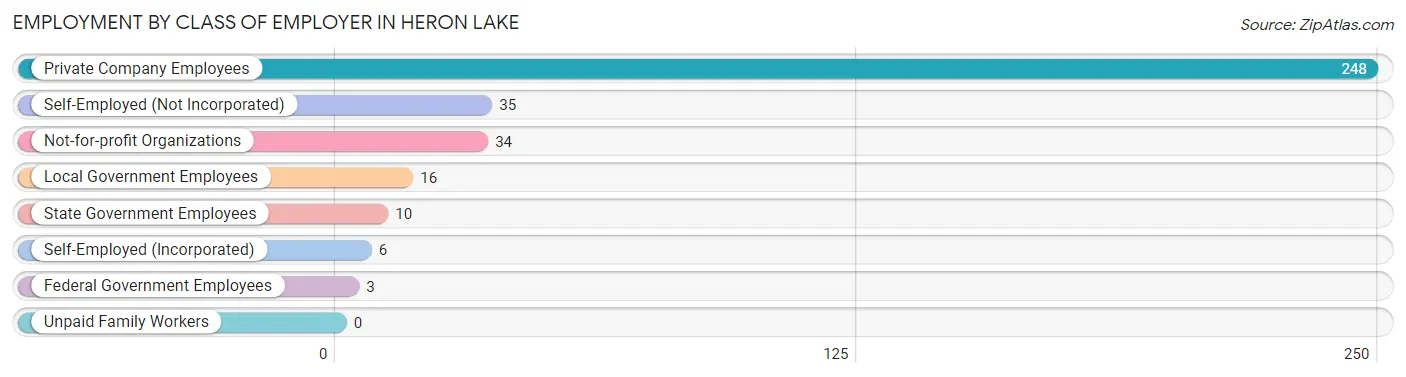
| Employer Class | # Employees | % Employees |
| Private Company Employees | 248 | 70.5% |
| Self-Employed (Incorporated) | 6 | 1.7% |
| Self-Employed (Not Incorporated) | 35 | 9.9% |
| Not-for-profit Organizations | 34 | 9.7% |
| Local Government Employees | 16 | 4.5% |
| State Government Employees | 10 | 2.8% |
| Federal Government Employees | 3 | 0.9% |
| Unpaid Family Workers | 0 | 0.0% |
| Total | 352 | 100.0% |
Employment Status by Age in Heron Lake
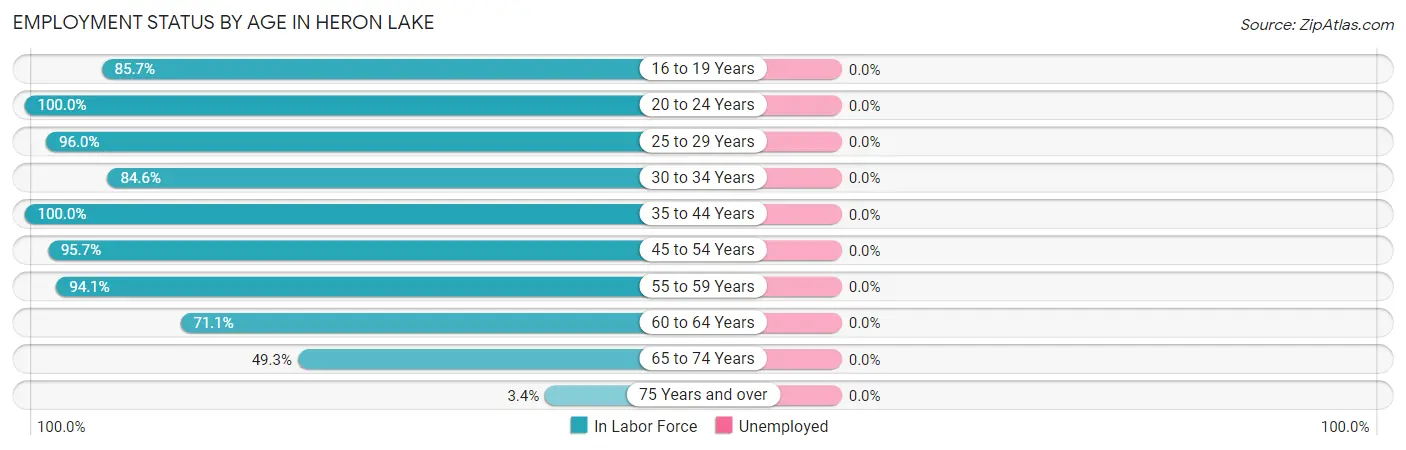
| Age Bracket | In Labor Force | Unemployed |
| 16 to 19 Years | 30 (85.7%) | 0 (0.0%) |
| 20 to 24 Years | 16 (100.0%) | 0 (0.0%) |
| 25 to 29 Years | 48 (96.0%) | 0 (0.0%) |
| 30 to 34 Years | 22 (84.6%) | 0 (0.0%) |
| 35 to 44 Years | 82 (100.0%) | 0 (0.0%) |
| 45 to 54 Years | 45 (95.7%) | 0 (0.0%) |
| 55 to 59 Years | 48 (94.1%) | 0 (0.0%) |
| 60 to 64 Years | 27 (71.1%) | 0 (0.0%) |
| 65 to 74 Years | 35 (49.3%) | 0 (0.0%) |
| 75 Years and over | 3 (3.4%) | 0 (0.0%) |
| Total | 356 (70.8%) | 0 (0.0%) |
Employment Status by Educational Attainment in Heron Lake
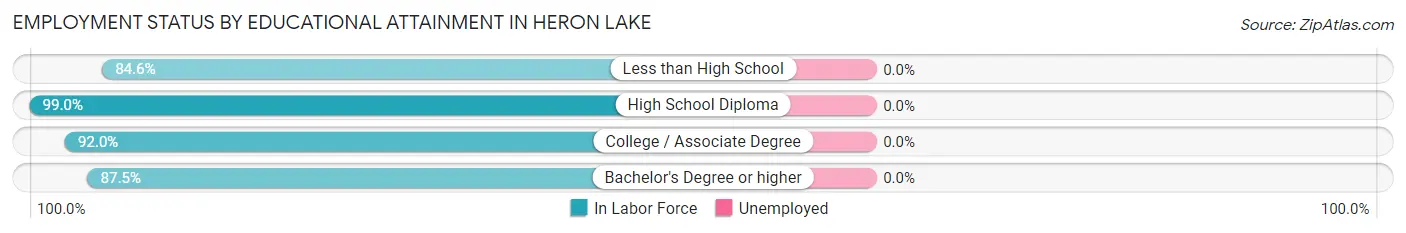
| Educational Attainment | In Labor Force | Unemployed |
| Less than High School | 22 (84.6%) | 0 (0.0%) |
| High School Diploma | 95 (99.0%) | 0 (0.0%) |
| College / Associate Degree | 92 (92.0%) | 0 (0.0%) |
| Bachelor's Degree or higher | 63 (87.5%) | 0 (0.0%) |
| Total | 272 (92.5%) | 0 (0.0%) |
Employment Occupations by Sex in Heron Lake
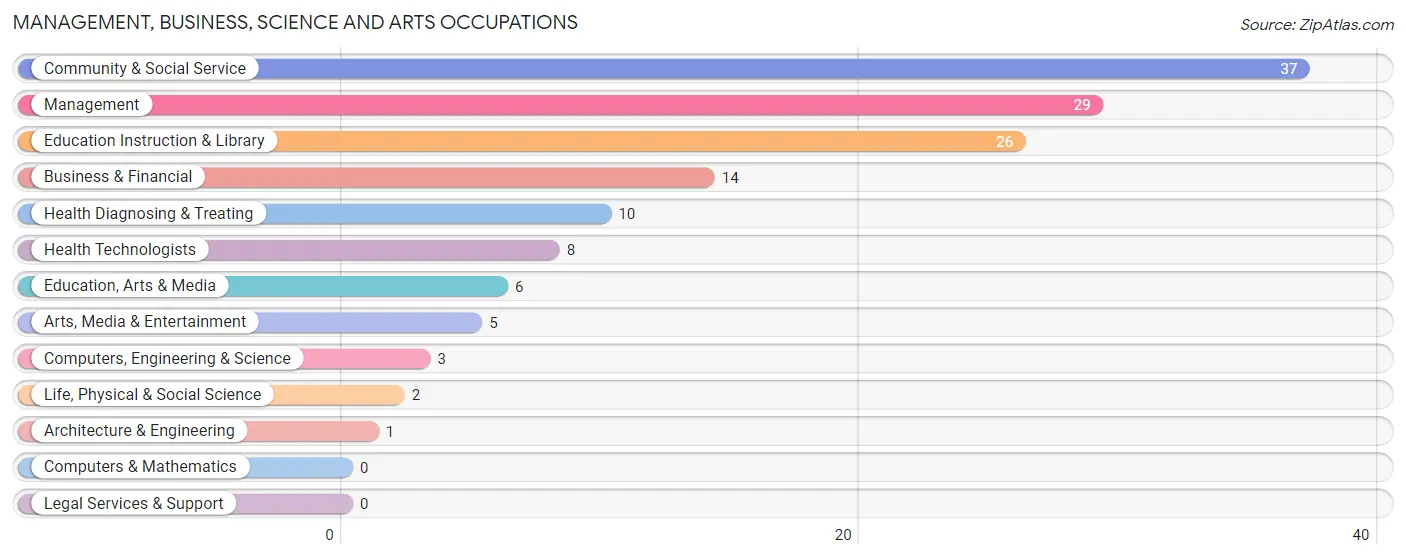
Management, Business, Science and Arts Occupations
The most common Management, Business, Science and Arts occupations in Heron Lake are Community & Social Service (37 | 10.4%), Management (29 | 8.2%), Education Instruction & Library (26 | 7.3%), Business & Financial (14 | 3.9%), and Health Diagnosing & Treating (10 | 2.8%).
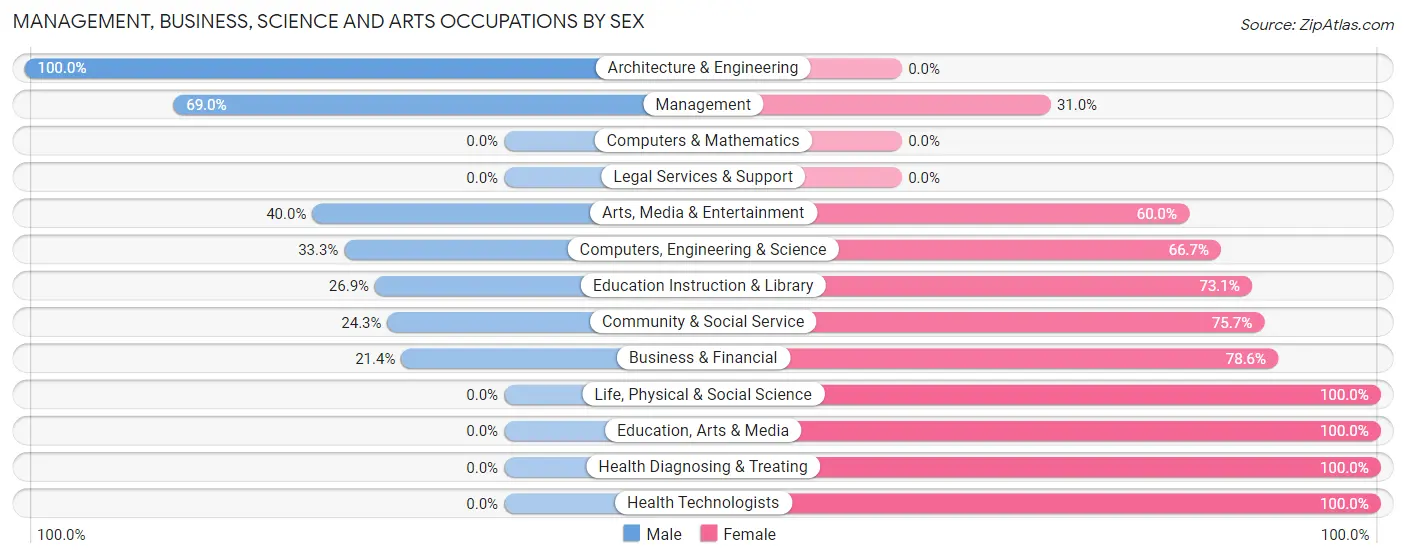
Management, Business, Science and Arts Occupations by Sex
Within the Management, Business, Science and Arts occupations in Heron Lake, the most male-oriented occupations are Architecture & Engineering (100.0%), Management (69.0%), and Arts, Media & Entertainment (40.0%), while the most female-oriented occupations are Life, Physical & Social Science (100.0%), Education, Arts & Media (100.0%), and Health Diagnosing & Treating (100.0%).
| Occupation | Male | Female |
| Management | 20 (69.0%) | 9 (31.0%) |
| Business & Financial | 3 (21.4%) | 11 (78.6%) |
| Computers, Engineering & Science | 1 (33.3%) | 2 (66.7%) |
| Computers & Mathematics | 0 (0.0%) | 0 (0.0%) |
| Architecture & Engineering | 1 (100.0%) | 0 (0.0%) |
| Life, Physical & Social Science | 0 (0.0%) | 2 (100.0%) |
| Community & Social Service | 9 (24.3%) | 28 (75.7%) |
| Education, Arts & Media | 0 (0.0%) | 6 (100.0%) |
| Legal Services & Support | 0 (0.0%) | 0 (0.0%) |
| Education Instruction & Library | 7 (26.9%) | 19 (73.1%) |
| Arts, Media & Entertainment | 2 (40.0%) | 3 (60.0%) |
| Health Diagnosing & Treating | 0 (0.0%) | 10 (100.0%) |
| Health Technologists | 0 (0.0%) | 8 (100.0%) |
| Total (Category) | 33 (35.5%) | 60 (64.5%) |
| Total (Overall) | 185 (52.0%) | 171 (48.0%) |
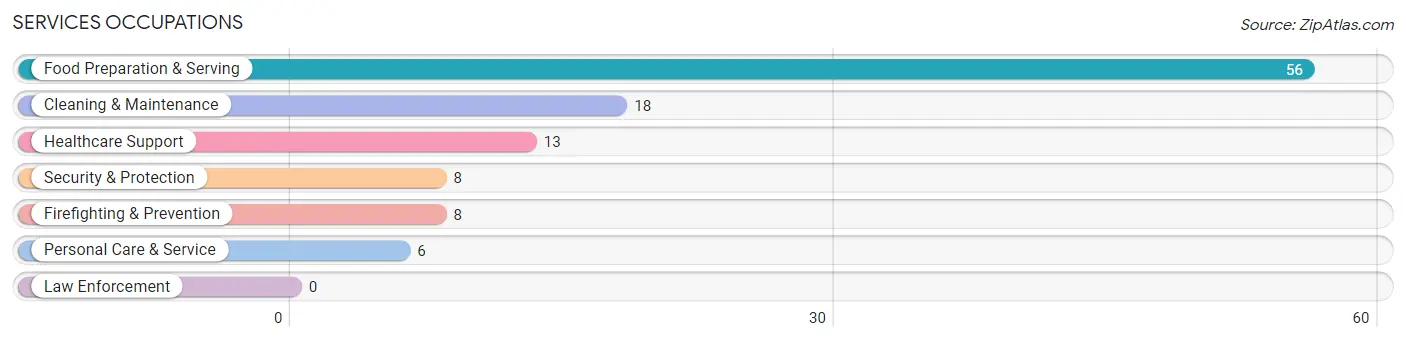
Services Occupations
The most common Services occupations in Heron Lake are Food Preparation & Serving (56 | 15.7%), Cleaning & Maintenance (18 | 5.1%), Healthcare Support (13 | 3.6%), Security & Protection (8 | 2.2%), and Firefighting & Prevention (8 | 2.2%).
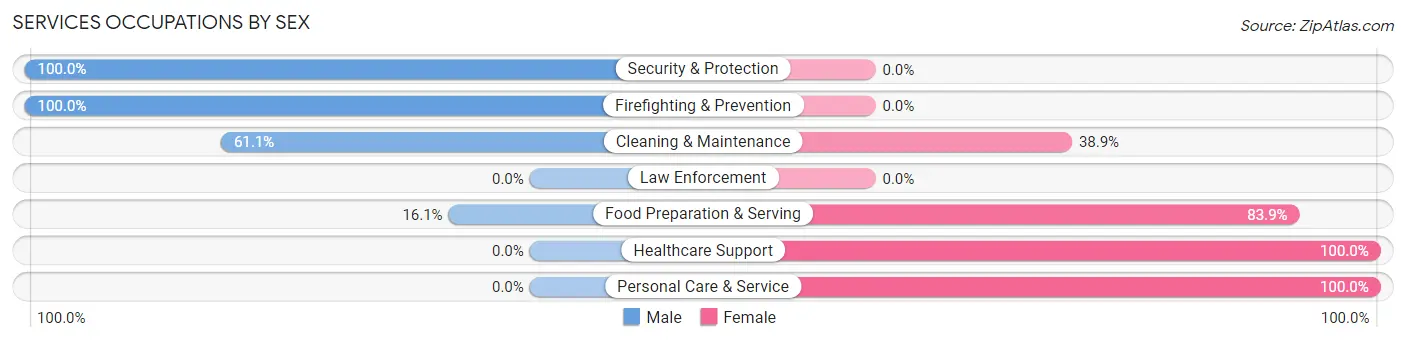
Services Occupations by Sex
Within the Services occupations in Heron Lake, the most male-oriented occupations are Security & Protection (100.0%), Firefighting & Prevention (100.0%), and Cleaning & Maintenance (61.1%), while the most female-oriented occupations are Healthcare Support (100.0%), Personal Care & Service (100.0%), and Food Preparation & Serving (83.9%).
| Occupation | Male | Female |
| Healthcare Support | 0 (0.0%) | 13 (100.0%) |
| Security & Protection | 8 (100.0%) | 0 (0.0%) |
| Firefighting & Prevention | 8 (100.0%) | 0 (0.0%) |
| Law Enforcement | 0 (0.0%) | 0 (0.0%) |
| Food Preparation & Serving | 9 (16.1%) | 47 (83.9%) |
| Cleaning & Maintenance | 11 (61.1%) | 7 (38.9%) |
| Personal Care & Service | 0 (0.0%) | 6 (100.0%) |
| Total (Category) | 28 (27.7%) | 73 (72.3%) |
| Total (Overall) | 185 (52.0%) | 171 (48.0%) |
Sales and Office Occupations
The most common Sales and Office occupations in Heron Lake are Office & Administration (23 | 6.5%), and Sales & Related (8 | 2.2%).
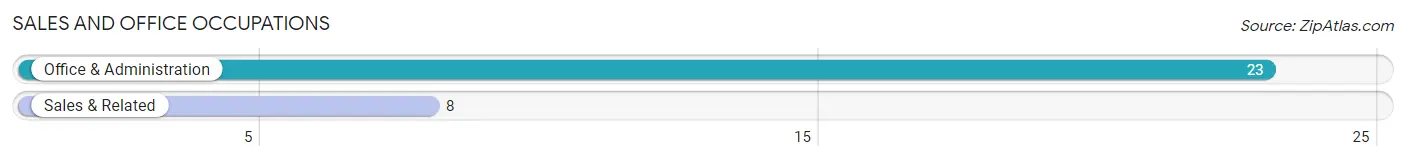
Sales and Office Occupations by Sex

| Occupation | Male | Female |
| Sales & Related | 8 (100.0%) | 0 (0.0%) |
| Office & Administration | 5 (21.7%) | 18 (78.3%) |
| Total (Category) | 13 (41.9%) | 18 (58.1%) |
| Total (Overall) | 185 (52.0%) | 171 (48.0%) |
Natural Resources, Construction and Maintenance Occupations
The most common Natural Resources, Construction and Maintenance occupations in Heron Lake are Construction & Extraction (13 | 3.6%), Farming, Fishing & Forestry (5 | 1.4%), and Installation, Maintenance & Repair (4 | 1.1%).
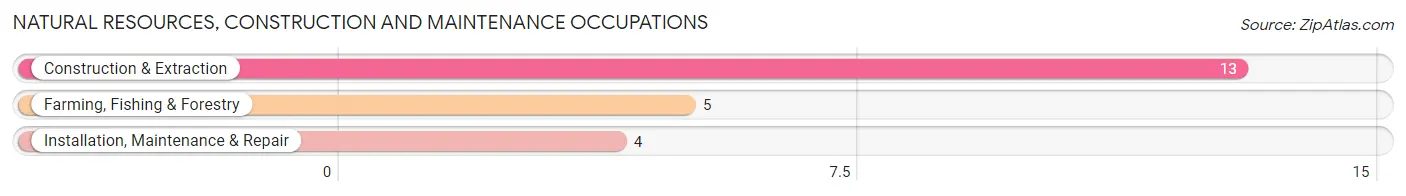
Natural Resources, Construction and Maintenance Occupations by Sex
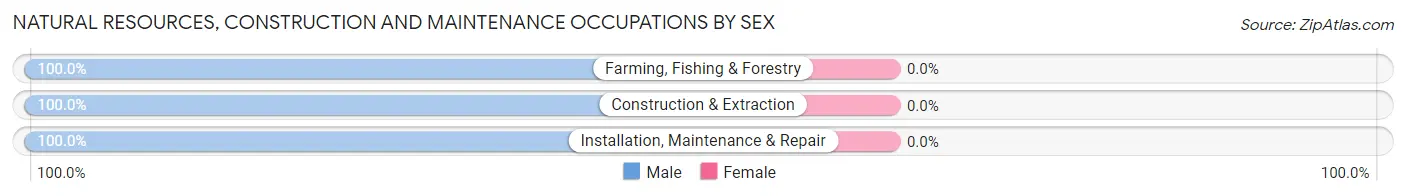
| Occupation | Male | Female |
| Farming, Fishing & Forestry | 5 (100.0%) | 0 (0.0%) |
| Construction & Extraction | 13 (100.0%) | 0 (0.0%) |
| Installation, Maintenance & Repair | 4 (100.0%) | 0 (0.0%) |
| Total (Category) | 22 (100.0%) | 0 (0.0%) |
| Total (Overall) | 185 (52.0%) | 171 (48.0%) |
Production, Transportation and Moving Occupations
The most common Production, Transportation and Moving occupations in Heron Lake are Production (44 | 12.4%), Material Moving (42 | 11.8%), and Transportation (23 | 6.5%).
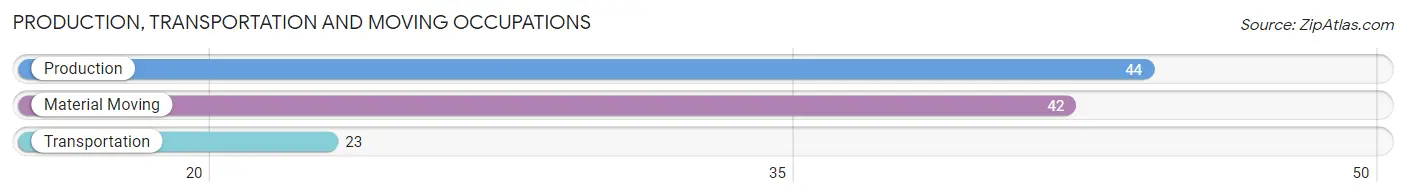
Production, Transportation and Moving Occupations by Sex
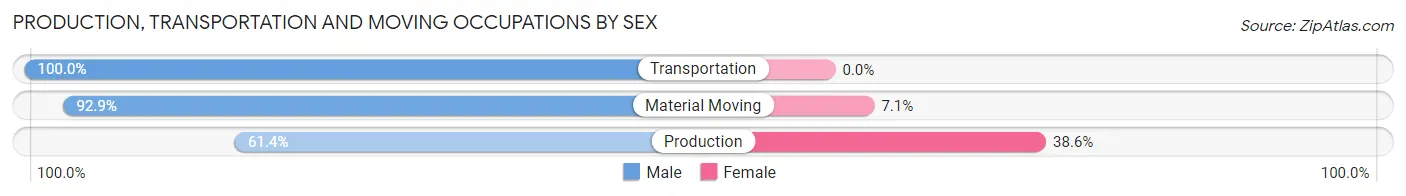
| Occupation | Male | Female |
| Production | 27 (61.4%) | 17 (38.6%) |
| Transportation | 23 (100.0%) | 0 (0.0%) |
| Material Moving | 39 (92.9%) | 3 (7.1%) |
| Total (Category) | 89 (81.7%) | 20 (18.3%) |
| Total (Overall) | 185 (52.0%) | 171 (48.0%) |
Employment Industries by Sex in Heron Lake
Employment Industries in Heron Lake
The major employment industries in Heron Lake include Manufacturing (105 | 29.5%), Retail Trade (55 | 15.4%), Health Care & Social Assistance (41 | 11.5%), Educational Services (30 | 8.4%), and Accommodation & Food Services (27 | 7.6%).

Employment Industries by Sex in Heron Lake
The Heron Lake industries that see more men than women are Construction (100.0%), Wholesale Trade (100.0%), and Finance & Insurance (100.0%), whereas the industries that tend to have a higher number of women are Information (100.0%), Professional & Scientific (100.0%), and Health Care & Social Assistance (90.2%).
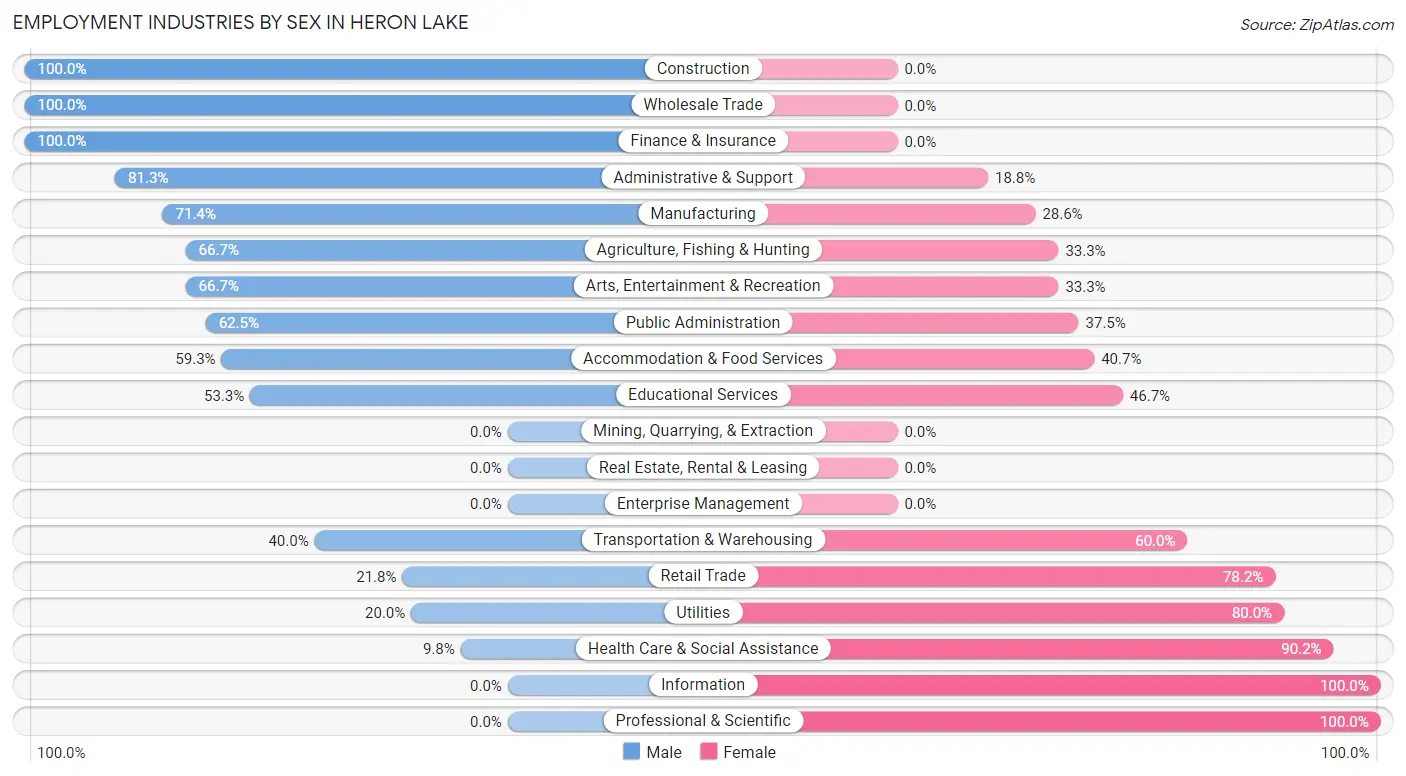
| Industry | Male | Female |
| Agriculture, Fishing & Hunting | 12 (66.7%) | 6 (33.3%) |
| Mining, Quarrying, & Extraction | 0 (0.0%) | 0 (0.0%) |
| Construction | 13 (100.0%) | 0 (0.0%) |
| Manufacturing | 75 (71.4%) | 30 (28.6%) |
| Wholesale Trade | 7 (100.0%) | 0 (0.0%) |
| Retail Trade | 12 (21.8%) | 43 (78.2%) |
| Transportation & Warehousing | 2 (40.0%) | 3 (60.0%) |
| Utilities | 1 (20.0%) | 4 (80.0%) |
| Information | 0 (0.0%) | 7 (100.0%) |
| Finance & Insurance | 5 (100.0%) | 0 (0.0%) |
| Real Estate, Rental & Leasing | 0 (0.0%) | 0 (0.0%) |
| Professional & Scientific | 0 (0.0%) | 5 (100.0%) |
| Enterprise Management | 0 (0.0%) | 0 (0.0%) |
| Administrative & Support | 13 (81.2%) | 3 (18.8%) |
| Educational Services | 16 (53.3%) | 14 (46.7%) |
| Health Care & Social Assistance | 4 (9.8%) | 37 (90.2%) |
| Arts, Entertainment & Recreation | 4 (66.7%) | 2 (33.3%) |
| Accommodation & Food Services | 16 (59.3%) | 11 (40.7%) |
| Public Administration | 5 (62.5%) | 3 (37.5%) |
| Total | 185 (52.0%) | 171 (48.0%) |
Education in Heron Lake
School Enrollment in Heron Lake
The most common levels of schooling among the 116 students in Heron Lake are elementary school (37 | 31.9%), high school (31 | 26.7%), and middle school (27 | 23.3%).
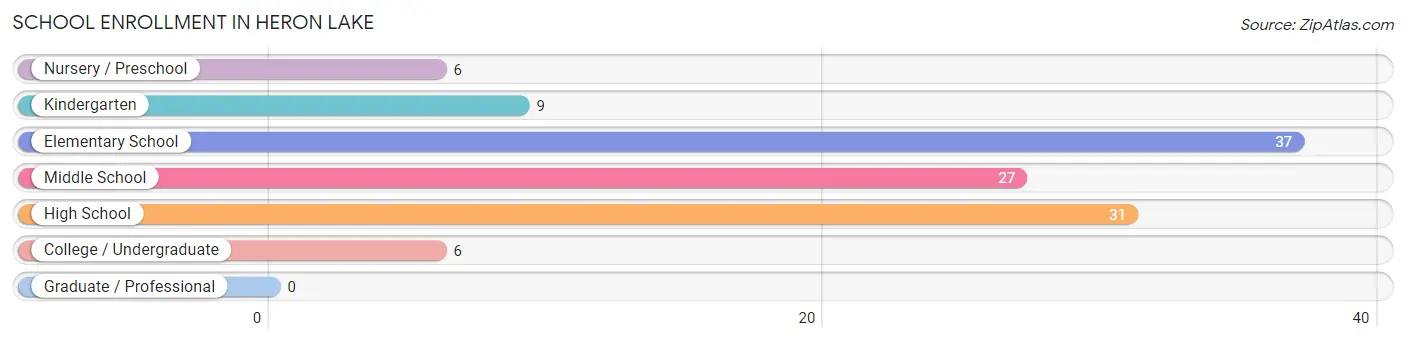
| School Level | # Students | % Students |
| Nursery / Preschool | 6 | 5.2% |
| Kindergarten | 9 | 7.8% |
| Elementary School | 37 | 31.9% |
| Middle School | 27 | 23.3% |
| High School | 31 | 26.7% |
| College / Undergraduate | 6 | 5.2% |
| Graduate / Professional | 0 | 0.0% |
| Total | 116 | 100.0% |
School Enrollment by Age by Funding Source in Heron Lake
Out of a total of 116 students who are enrolled in schools in Heron Lake, 11 (9.5%) attend a private institution, while the remaining 105 (90.5%) are enrolled in public schools. The age group of 18 to 19 year olds has the highest likelihood of being enrolled in private schools, with 7 (43.8% in the age bracket) enrolled. Conversely, the age group of 3 to 4 year olds has the lowest likelihood of being enrolled in a private school, with 6 (100.0% in the age bracket) attending a public institution.
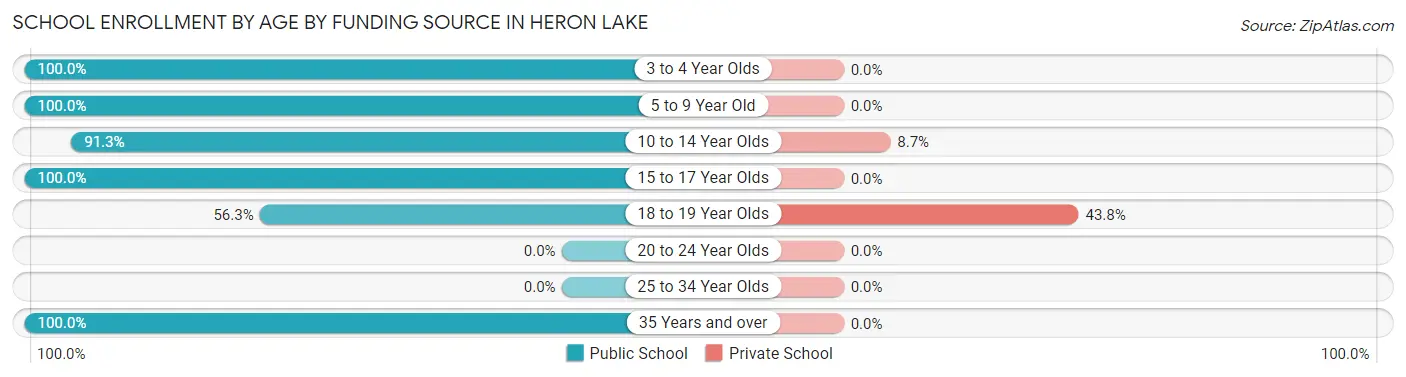
| Age Bracket | Public School | Private School |
| 3 to 4 Year Olds | 6 (100.0%) | 0 (0.0%) |
| 5 to 9 Year Old | 29 (100.0%) | 0 (0.0%) |
| 10 to 14 Year Olds | 42 (91.3%) | 4 (8.7%) |
| 15 to 17 Year Olds | 17 (100.0%) | 0 (0.0%) |
| 18 to 19 Year Olds | 9 (56.2%) | 7 (43.8%) |
| 20 to 24 Year Olds | 0 (0.0%) | 0 (0.0%) |
| 25 to 34 Year Olds | 0 (0.0%) | 0 (0.0%) |
| 35 Years and over | 2 (100.0%) | 0 (0.0%) |
| Total | 105 (90.5%) | 11 (9.5%) |
Educational Attainment by Field of Study in Heron Lake
Education (36 | 31.3%), science & technology (17 | 14.8%), business (17 | 14.8%), bio, nature & agricultural (8 | 7.0%), and social sciences (7 | 6.1%) are the most common fields of study among 115 individuals in Heron Lake who have obtained a bachelor's degree or higher.
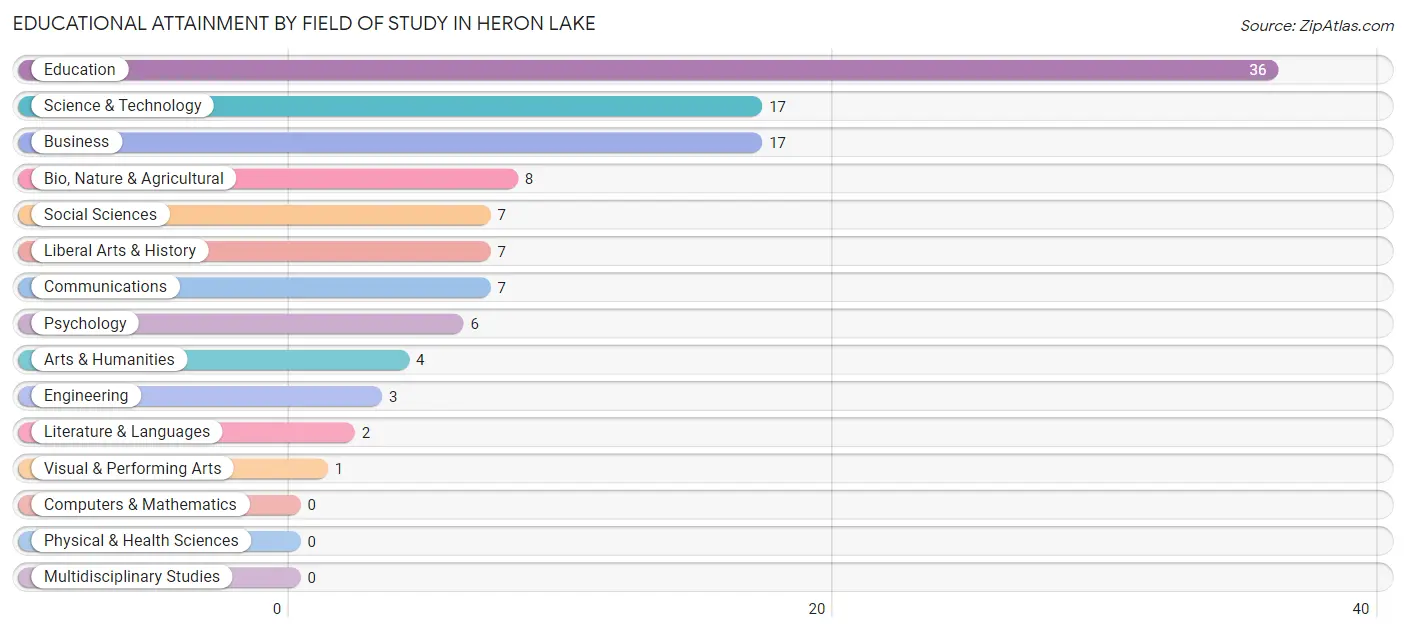
| Field of Study | # Graduates | % Graduates |
| Computers & Mathematics | 0 | 0.0% |
| Bio, Nature & Agricultural | 8 | 7.0% |
| Physical & Health Sciences | 0 | 0.0% |
| Psychology | 6 | 5.2% |
| Social Sciences | 7 | 6.1% |
| Engineering | 3 | 2.6% |
| Multidisciplinary Studies | 0 | 0.0% |
| Science & Technology | 17 | 14.8% |
| Business | 17 | 14.8% |
| Education | 36 | 31.3% |
| Literature & Languages | 2 | 1.7% |
| Liberal Arts & History | 7 | 6.1% |
| Visual & Performing Arts | 1 | 0.9% |
| Communications | 7 | 6.1% |
| Arts & Humanities | 4 | 3.5% |
| Total | 115 | 100.0% |
Transportation & Commute in Heron Lake
Vehicle Availability by Sex in Heron Lake
The most prevalent vehicle ownership categories in Heron Lake are males with 3 vehicles (75, accounting for 40.8%) and females with 3 vehicles (39, making up 44.9%).
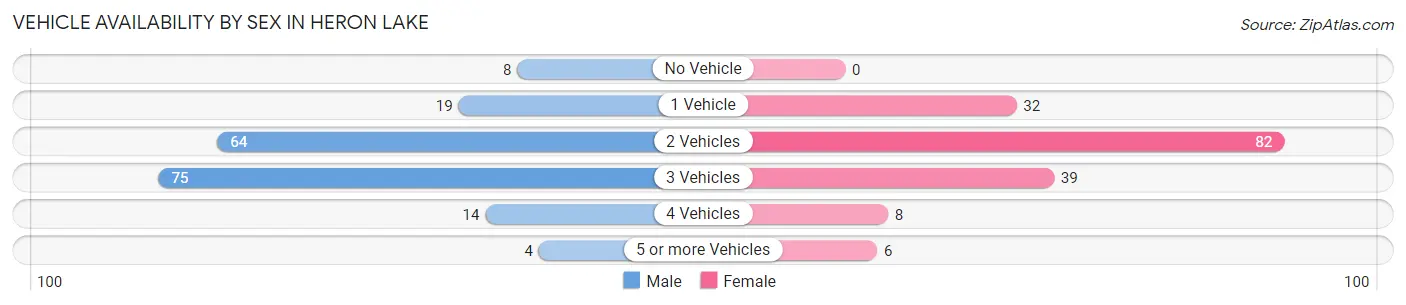
| Vehicles Available | Male | Female |
| No Vehicle | 8 (4.3%) | 0 (0.0%) |
| 1 Vehicle | 19 (10.3%) | 32 (19.2%) |
| 2 Vehicles | 64 (34.8%) | 82 (49.1%) |
| 3 Vehicles | 75 (40.8%) | 39 (23.4%) |
| 4 Vehicles | 14 (7.6%) | 8 (4.8%) |
| 5 or more Vehicles | 4 (2.2%) | 6 (3.6%) |
| Total | 184 (100.0%) | 167 (100.0%) |
Commute Time in Heron Lake
The most frequently occuring commute durations in Heron Lake are 20 to 24 minutes (81 commuters, 23.5%), 5 to 9 minutes (66 commuters, 19.2%), and 10 to 14 minutes (55 commuters, 16.0%).
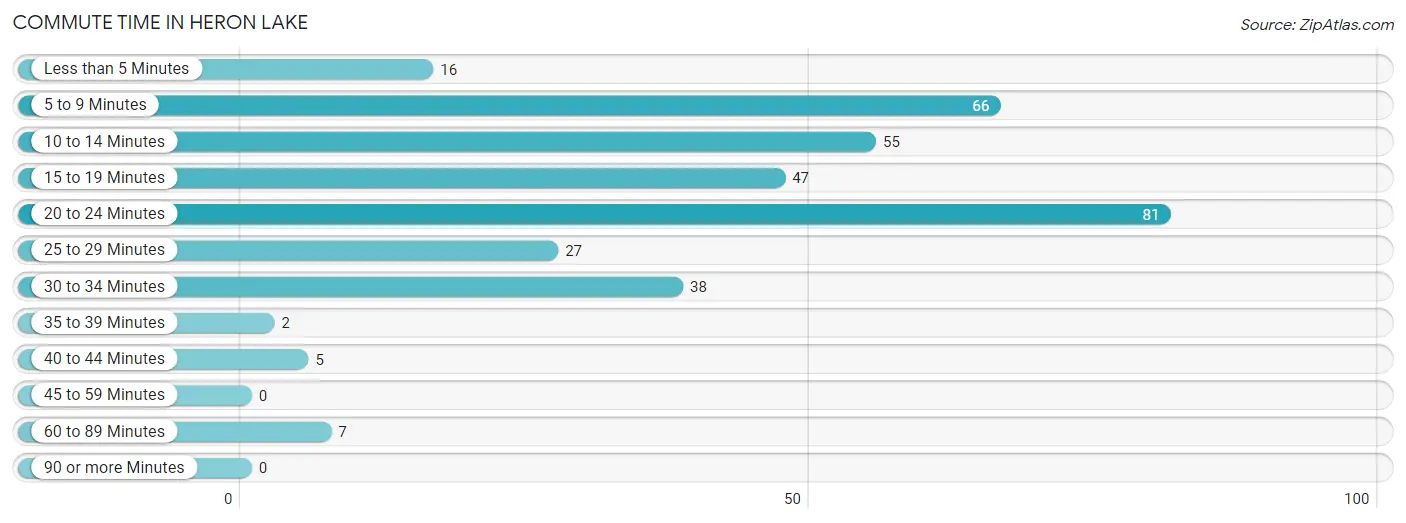
| Commute Time | # Commuters | % Commuters |
| Less than 5 Minutes | 16 | 4.6% |
| 5 to 9 Minutes | 66 | 19.2% |
| 10 to 14 Minutes | 55 | 16.0% |
| 15 to 19 Minutes | 47 | 13.7% |
| 20 to 24 Minutes | 81 | 23.5% |
| 25 to 29 Minutes | 27 | 7.9% |
| 30 to 34 Minutes | 38 | 11.1% |
| 35 to 39 Minutes | 2 | 0.6% |
| 40 to 44 Minutes | 5 | 1.5% |
| 45 to 59 Minutes | 0 | 0.0% |
| 60 to 89 Minutes | 7 | 2.0% |
| 90 or more Minutes | 0 | 0.0% |
Commute Time by Sex in Heron Lake
The most common commute times in Heron Lake are 5 to 9 minutes (43 commuters, 23.5%) for males and 20 to 24 minutes (39 commuters, 24.2%) for females.
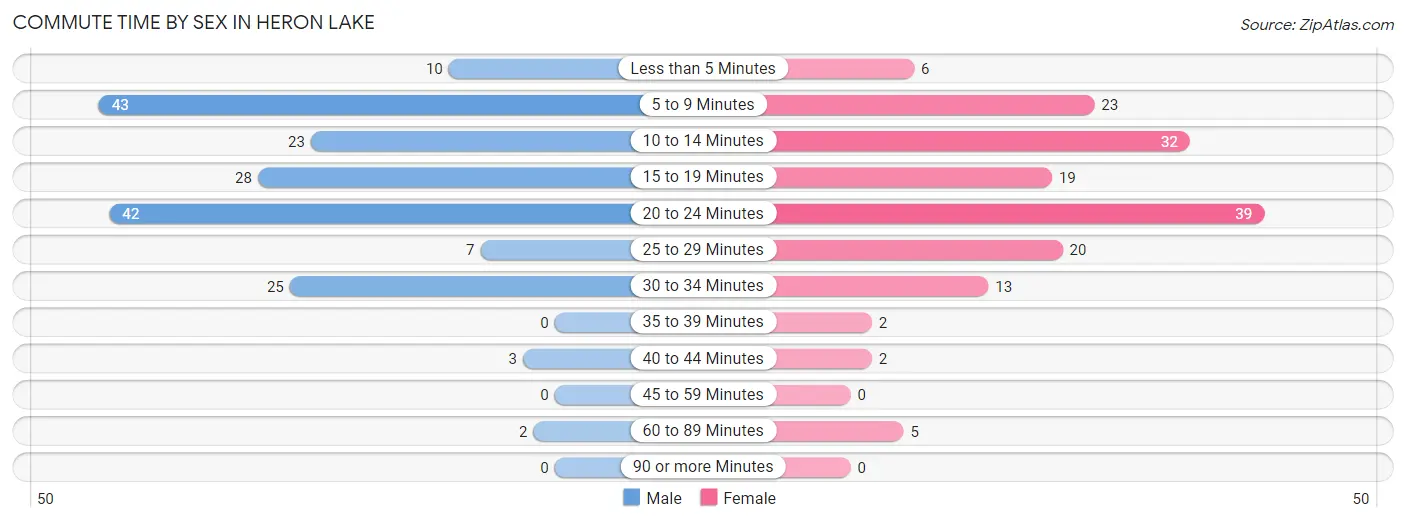
| Commute Time | Male | Female |
| Less than 5 Minutes | 10 (5.5%) | 6 (3.7%) |
| 5 to 9 Minutes | 43 (23.5%) | 23 (14.3%) |
| 10 to 14 Minutes | 23 (12.6%) | 32 (19.9%) |
| 15 to 19 Minutes | 28 (15.3%) | 19 (11.8%) |
| 20 to 24 Minutes | 42 (23.0%) | 39 (24.2%) |
| 25 to 29 Minutes | 7 (3.8%) | 20 (12.4%) |
| 30 to 34 Minutes | 25 (13.7%) | 13 (8.1%) |
| 35 to 39 Minutes | 0 (0.0%) | 2 (1.2%) |
| 40 to 44 Minutes | 3 (1.6%) | 2 (1.2%) |
| 45 to 59 Minutes | 0 (0.0%) | 0 (0.0%) |
| 60 to 89 Minutes | 2 (1.1%) | 5 (3.1%) |
| 90 or more Minutes | 0 (0.0%) | 0 (0.0%) |
Time of Departure to Work by Sex in Heron Lake
The most frequent times of departure to work in Heron Lake are 7:00 AM to 7:29 AM (41, 22.4%) for males and 12:00 PM to 3:59 PM (34, 21.1%) for females.
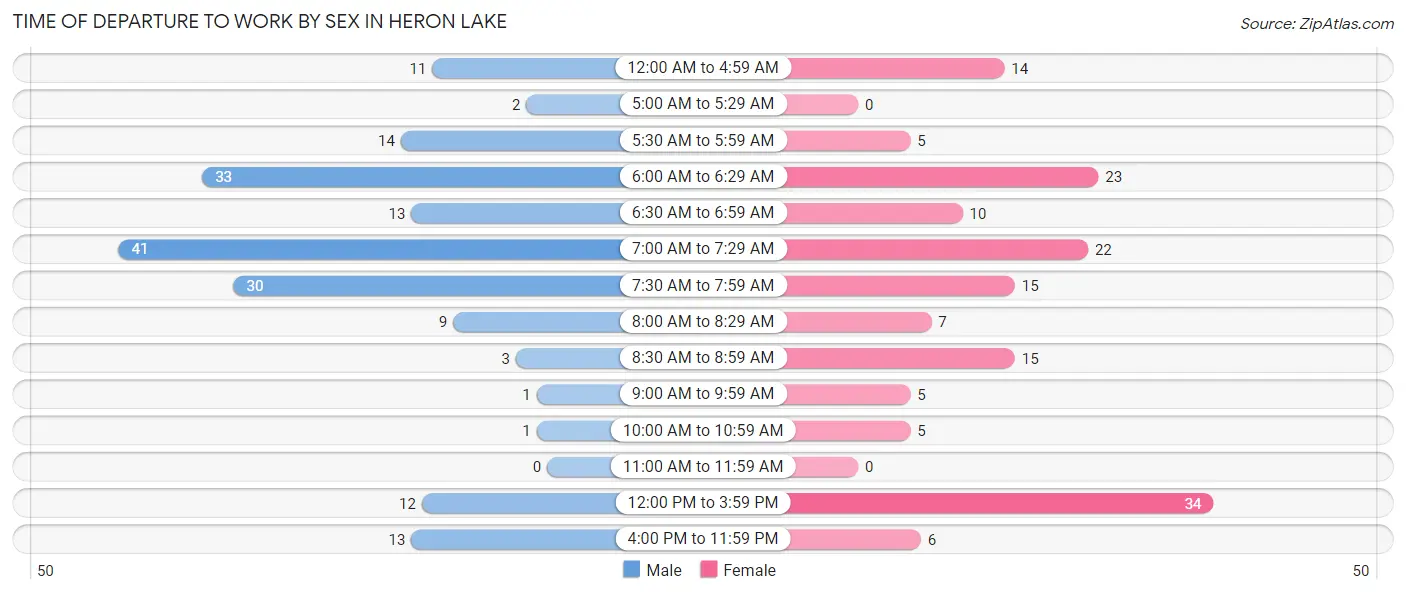
| Time of Departure | Male | Female |
| 12:00 AM to 4:59 AM | 11 (6.0%) | 14 (8.7%) |
| 5:00 AM to 5:29 AM | 2 (1.1%) | 0 (0.0%) |
| 5:30 AM to 5:59 AM | 14 (7.6%) | 5 (3.1%) |
| 6:00 AM to 6:29 AM | 33 (18.0%) | 23 (14.3%) |
| 6:30 AM to 6:59 AM | 13 (7.1%) | 10 (6.2%) |
| 7:00 AM to 7:29 AM | 41 (22.4%) | 22 (13.7%) |
| 7:30 AM to 7:59 AM | 30 (16.4%) | 15 (9.3%) |
| 8:00 AM to 8:29 AM | 9 (4.9%) | 7 (4.3%) |
| 8:30 AM to 8:59 AM | 3 (1.6%) | 15 (9.3%) |
| 9:00 AM to 9:59 AM | 1 (0.5%) | 5 (3.1%) |
| 10:00 AM to 10:59 AM | 1 (0.5%) | 5 (3.1%) |
| 11:00 AM to 11:59 AM | 0 (0.0%) | 0 (0.0%) |
| 12:00 PM to 3:59 PM | 12 (6.6%) | 34 (21.1%) |
| 4:00 PM to 11:59 PM | 13 (7.1%) | 6 (3.7%) |
| Total | 183 (100.0%) | 161 (100.0%) |
Housing Occupancy in Heron Lake
Occupancy by Ownership in Heron Lake
Of the total 268 dwellings in Heron Lake, owner-occupied units account for 230 (85.8%), while renter-occupied units make up 38 (14.2%).
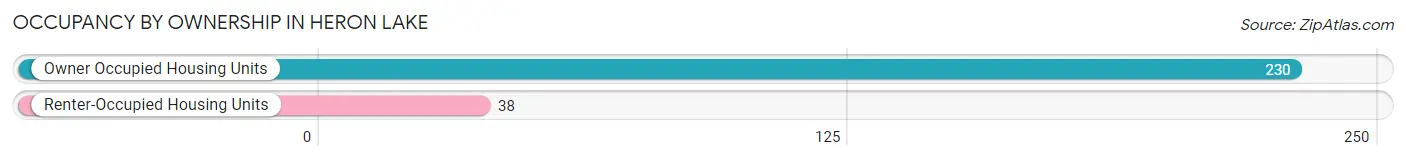
| Occupancy | # Housing Units | % Housing Units |
| Owner Occupied Housing Units | 230 | 85.8% |
| Renter-Occupied Housing Units | 38 | 14.2% |
| Total Occupied Housing Units | 268 | 100.0% |
Occupancy by Household Size in Heron Lake
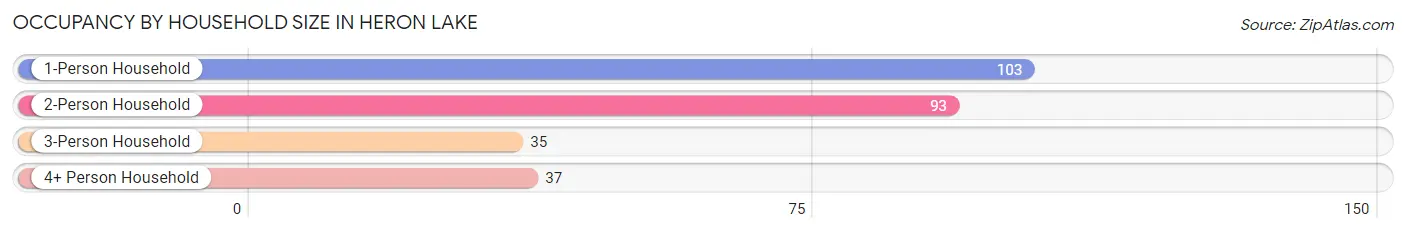
| Household Size | # Housing Units | % Housing Units |
| 1-Person Household | 103 | 38.4% |
| 2-Person Household | 93 | 34.7% |
| 3-Person Household | 35 | 13.1% |
| 4+ Person Household | 37 | 13.8% |
| Total Housing Units | 268 | 100.0% |
Occupancy by Ownership by Household Size in Heron Lake
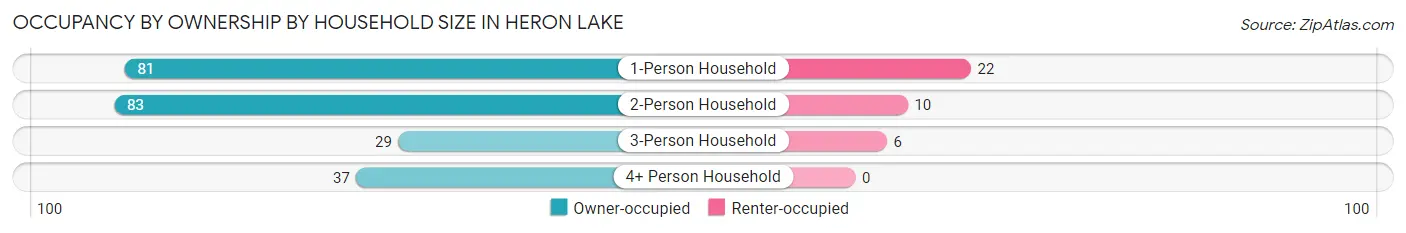
| Household Size | Owner-occupied | Renter-occupied |
| 1-Person Household | 81 (78.6%) | 22 (21.4%) |
| 2-Person Household | 83 (89.2%) | 10 (10.7%) |
| 3-Person Household | 29 (82.9%) | 6 (17.1%) |
| 4+ Person Household | 37 (100.0%) | 0 (0.0%) |
| Total Housing Units | 230 (85.8%) | 38 (14.2%) |
Occupancy by Educational Attainment in Heron Lake
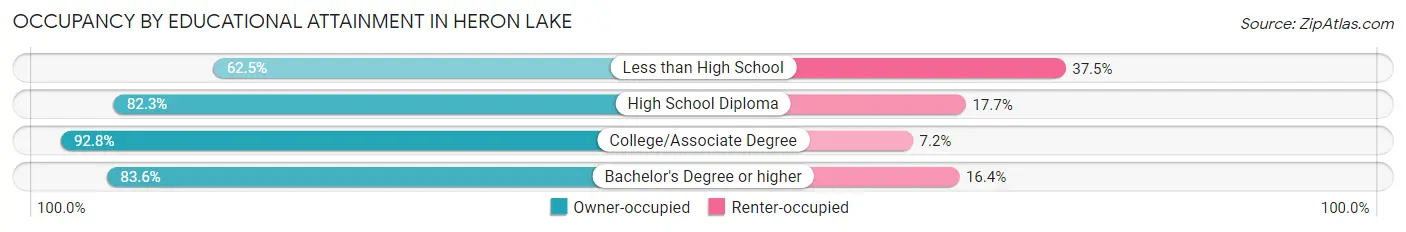
| Household Size | Owner-occupied | Renter-occupied |
| Less than High School | 5 (62.5%) | 3 (37.5%) |
| High School Diploma | 79 (82.3%) | 17 (17.7%) |
| College/Associate Degree | 90 (92.8%) | 7 (7.2%) |
| Bachelor's Degree or higher | 56 (83.6%) | 11 (16.4%) |
Occupancy by Age of Householder in Heron Lake
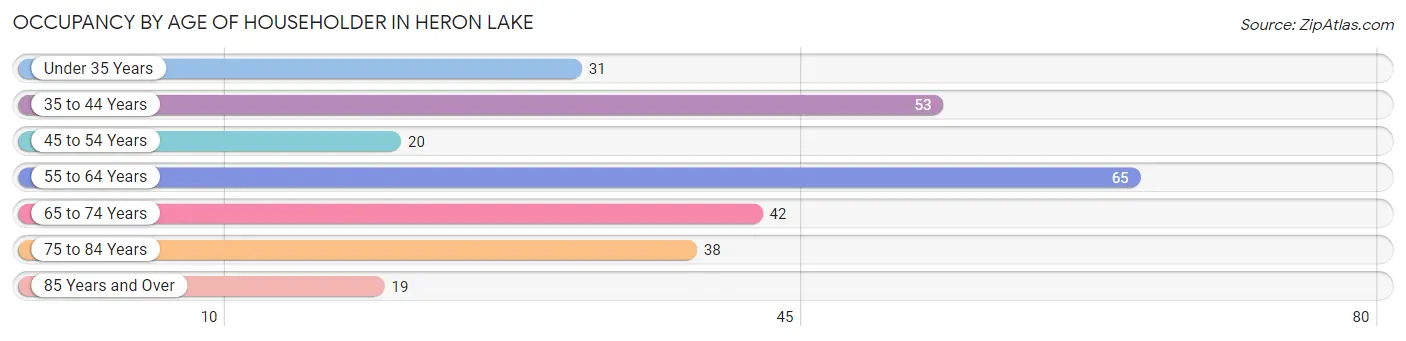
| Age Bracket | # Households | % Households |
| Under 35 Years | 31 | 11.6% |
| 35 to 44 Years | 53 | 19.8% |
| 45 to 54 Years | 20 | 7.5% |
| 55 to 64 Years | 65 | 24.2% |
| 65 to 74 Years | 42 | 15.7% |
| 75 to 84 Years | 38 | 14.2% |
| 85 Years and Over | 19 | 7.1% |
| Total | 268 | 100.0% |
Housing Finances in Heron Lake
Median Income by Occupancy in Heron Lake
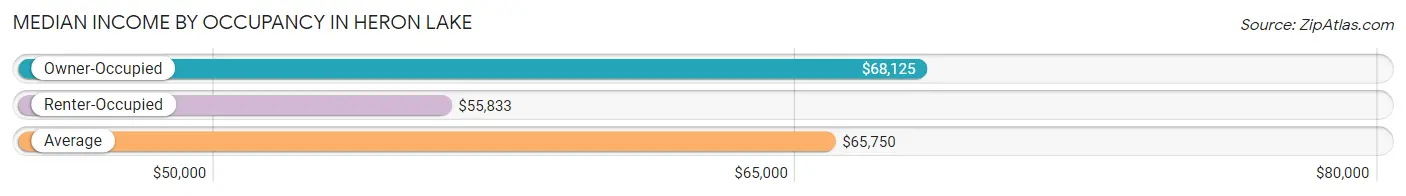
| Occupancy Type | # Households | Median Income |
| Owner-Occupied | 230 (85.8%) | $68,125 |
| Renter-Occupied | 38 (14.2%) | $55,833 |
| Average | 268 (100.0%) | $65,750 |
Occupancy by Householder Income Bracket in Heron Lake
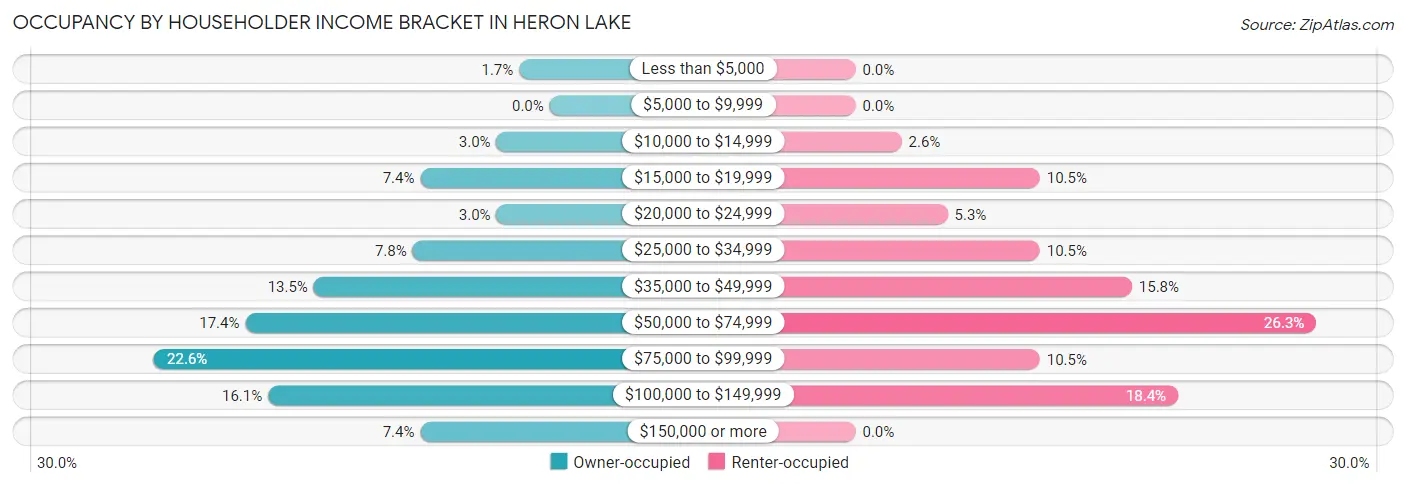
| Income Bracket | Owner-occupied | Renter-occupied |
| Less than $5,000 | 4 (1.7%) | 0 (0.0%) |
| $5,000 to $9,999 | 0 (0.0%) | 0 (0.0%) |
| $10,000 to $14,999 | 7 (3.0%) | 1 (2.6%) |
| $15,000 to $19,999 | 17 (7.4%) | 4 (10.5%) |
| $20,000 to $24,999 | 7 (3.0%) | 2 (5.3%) |
| $25,000 to $34,999 | 18 (7.8%) | 4 (10.5%) |
| $35,000 to $49,999 | 31 (13.5%) | 6 (15.8%) |
| $50,000 to $74,999 | 40 (17.4%) | 10 (26.3%) |
| $75,000 to $99,999 | 52 (22.6%) | 4 (10.5%) |
| $100,000 to $149,999 | 37 (16.1%) | 7 (18.4%) |
| $150,000 or more | 17 (7.4%) | 0 (0.0%) |
| Total | 230 (100.0%) | 38 (100.0%) |
Monthly Housing Cost Tiers in Heron Lake
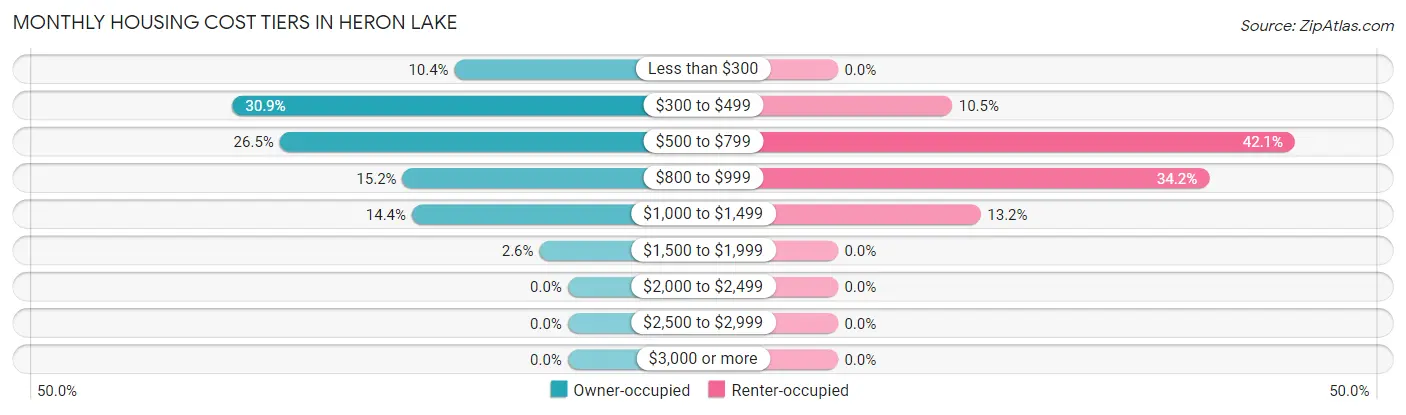
| Monthly Cost | Owner-occupied | Renter-occupied |
| Less than $300 | 24 (10.4%) | 0 (0.0%) |
| $300 to $499 | 71 (30.9%) | 4 (10.5%) |
| $500 to $799 | 61 (26.5%) | 16 (42.1%) |
| $800 to $999 | 35 (15.2%) | 13 (34.2%) |
| $1,000 to $1,499 | 33 (14.3%) | 5 (13.2%) |
| $1,500 to $1,999 | 6 (2.6%) | 0 (0.0%) |
| $2,000 to $2,499 | 0 (0.0%) | 0 (0.0%) |
| $2,500 to $2,999 | 0 (0.0%) | 0 (0.0%) |
| $3,000 or more | 0 (0.0%) | 0 (0.0%) |
| Total | 230 (100.0%) | 38 (100.0%) |
Physical Housing Characteristics in Heron Lake
Housing Structures in Heron Lake
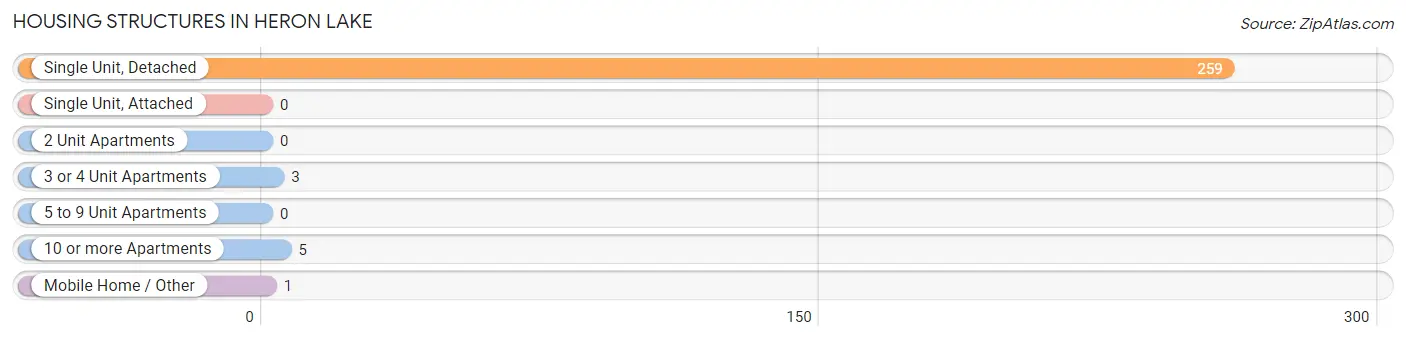
| Structure Type | # Housing Units | % Housing Units |
| Single Unit, Detached | 259 | 96.6% |
| Single Unit, Attached | 0 | 0.0% |
| 2 Unit Apartments | 0 | 0.0% |
| 3 or 4 Unit Apartments | 3 | 1.1% |
| 5 to 9 Unit Apartments | 0 | 0.0% |
| 10 or more Apartments | 5 | 1.9% |
| Mobile Home / Other | 1 | 0.4% |
| Total | 268 | 100.0% |
Housing Structures by Occupancy in Heron Lake
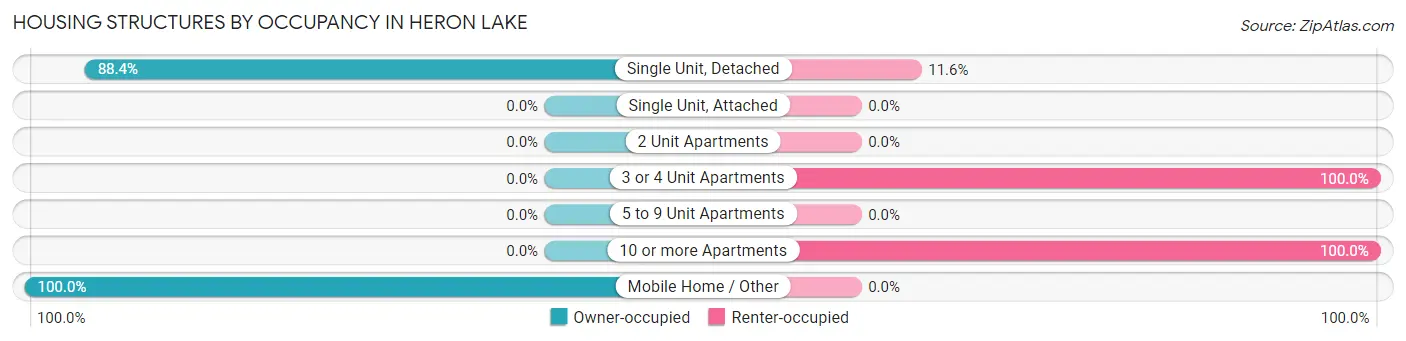
| Structure Type | Owner-occupied | Renter-occupied |
| Single Unit, Detached | 229 (88.4%) | 30 (11.6%) |
| Single Unit, Attached | 0 (0.0%) | 0 (0.0%) |
| 2 Unit Apartments | 0 (0.0%) | 0 (0.0%) |
| 3 or 4 Unit Apartments | 0 (0.0%) | 3 (100.0%) |
| 5 to 9 Unit Apartments | 0 (0.0%) | 0 (0.0%) |
| 10 or more Apartments | 0 (0.0%) | 5 (100.0%) |
| Mobile Home / Other | 1 (100.0%) | 0 (0.0%) |
| Total | 230 (85.8%) | 38 (14.2%) |
Housing Structures by Number of Rooms in Heron Lake
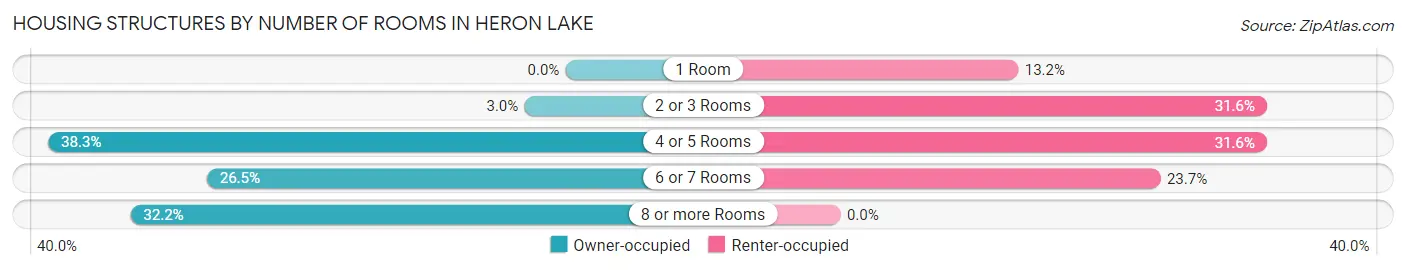
| Number of Rooms | Owner-occupied | Renter-occupied |
| 1 Room | 0 (0.0%) | 5 (13.2%) |
| 2 or 3 Rooms | 7 (3.0%) | 12 (31.6%) |
| 4 or 5 Rooms | 88 (38.3%) | 12 (31.6%) |
| 6 or 7 Rooms | 61 (26.5%) | 9 (23.7%) |
| 8 or more Rooms | 74 (32.2%) | 0 (0.0%) |
| Total | 230 (100.0%) | 38 (100.0%) |
Housing Structure by Heating Type in Heron Lake
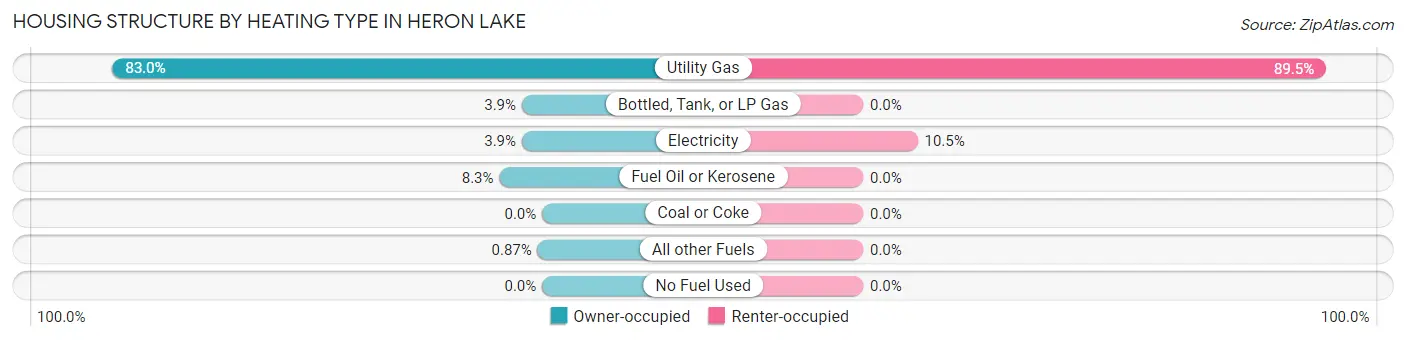
| Heating Type | Owner-occupied | Renter-occupied |
| Utility Gas | 191 (83.0%) | 34 (89.5%) |
| Bottled, Tank, or LP Gas | 9 (3.9%) | 0 (0.0%) |
| Electricity | 9 (3.9%) | 4 (10.5%) |
| Fuel Oil or Kerosene | 19 (8.3%) | 0 (0.0%) |
| Coal or Coke | 0 (0.0%) | 0 (0.0%) |
| All other Fuels | 2 (0.9%) | 0 (0.0%) |
| No Fuel Used | 0 (0.0%) | 0 (0.0%) |
| Total | 230 (100.0%) | 38 (100.0%) |
Household Vehicle Usage in Heron Lake
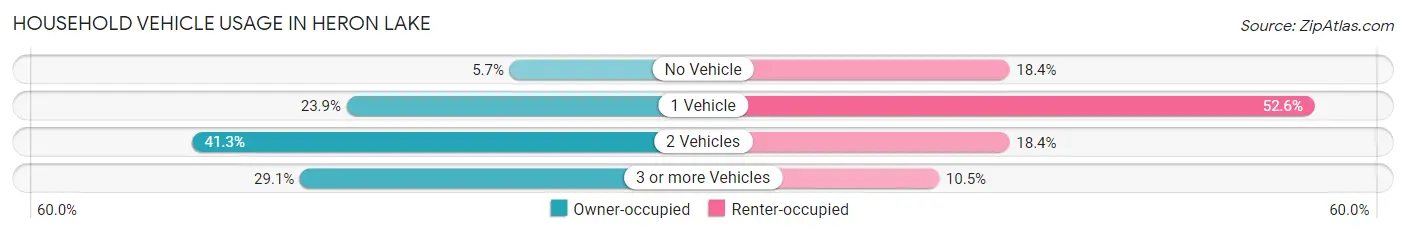
| Vehicles per Household | Owner-occupied | Renter-occupied |
| No Vehicle | 13 (5.7%) | 7 (18.4%) |
| 1 Vehicle | 55 (23.9%) | 20 (52.6%) |
| 2 Vehicles | 95 (41.3%) | 7 (18.4%) |
| 3 or more Vehicles | 67 (29.1%) | 4 (10.5%) |
| Total | 230 (100.0%) | 38 (100.0%) |
Real Estate & Mortgages in Heron Lake
Real Estate and Mortgage Overview in Heron Lake
| Characteristic | Without Mortgage | With Mortgage |
| Housing Units | 114 | 116 |
| Median Property Value | $85,600 | $82,600 |
| Median Household Income | $47,833 | $16 |
| Monthly Housing Costs | $424 | $0 |
| Real Estate Taxes | $927 | $4 |
Property Value by Mortgage Status in Heron Lake
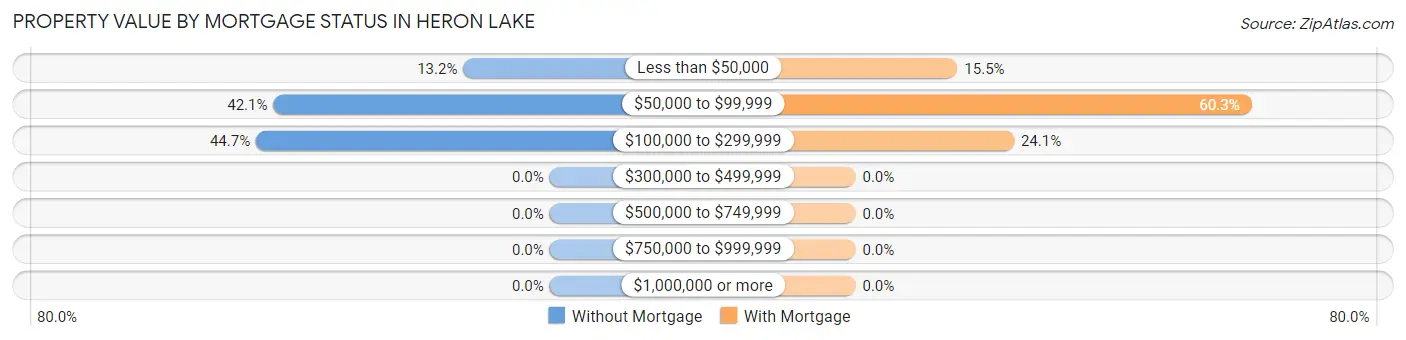
| Property Value | Without Mortgage | With Mortgage |
| Less than $50,000 | 15 (13.2%) | 18 (15.5%) |
| $50,000 to $99,999 | 48 (42.1%) | 70 (60.3%) |
| $100,000 to $299,999 | 51 (44.7%) | 28 (24.1%) |
| $300,000 to $499,999 | 0 (0.0%) | 0 (0.0%) |
| $500,000 to $749,999 | 0 (0.0%) | 0 (0.0%) |
| $750,000 to $999,999 | 0 (0.0%) | 0 (0.0%) |
| $1,000,000 or more | 0 (0.0%) | 0 (0.0%) |
| Total | 114 (100.0%) | 116 (100.0%) |
Household Income by Mortgage Status in Heron Lake
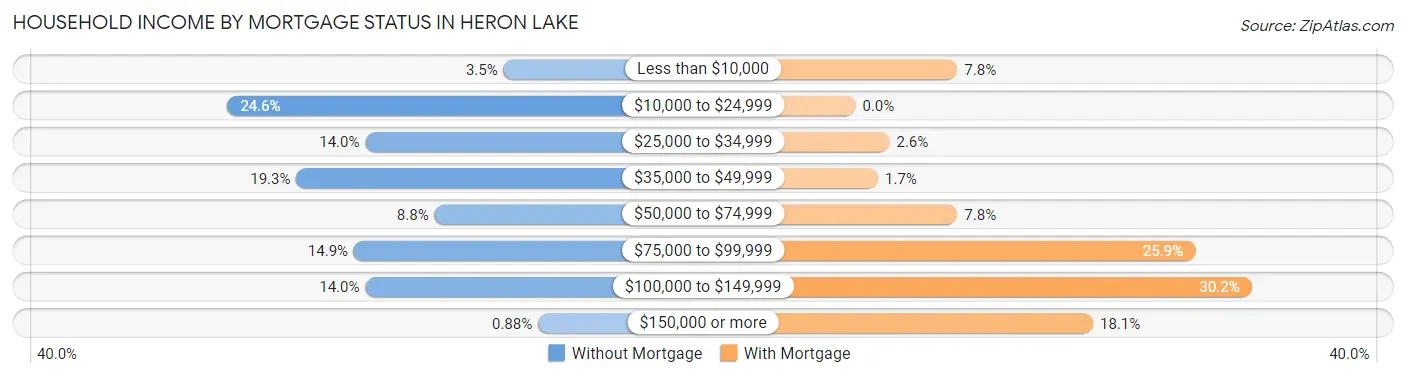
| Household Income | Without Mortgage | With Mortgage |
| Less than $10,000 | 4 (3.5%) | 9 (7.8%) |
| $10,000 to $24,999 | 28 (24.6%) | 0 (0.0%) |
| $25,000 to $34,999 | 16 (14.0%) | 3 (2.6%) |
| $35,000 to $49,999 | 22 (19.3%) | 2 (1.7%) |
| $50,000 to $74,999 | 10 (8.8%) | 9 (7.8%) |
| $75,000 to $99,999 | 17 (14.9%) | 30 (25.9%) |
| $100,000 to $149,999 | 16 (14.0%) | 35 (30.2%) |
| $150,000 or more | 1 (0.9%) | 21 (18.1%) |
| Total | 114 (100.0%) | 116 (100.0%) |
Property Value to Household Income Ratio in Heron Lake
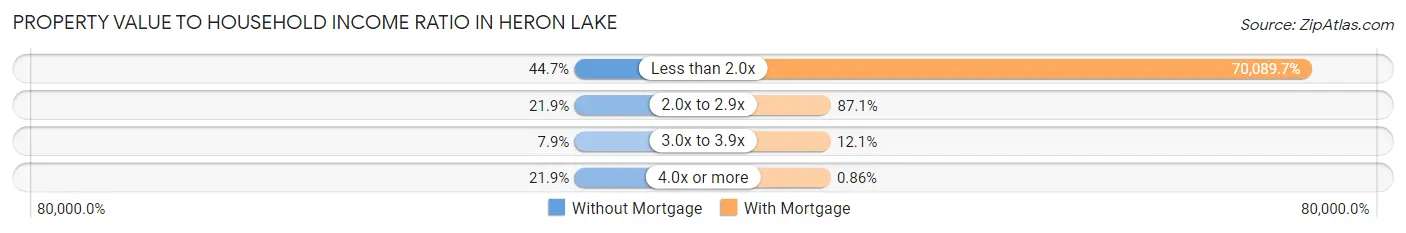
| Value-to-Income Ratio | Without Mortgage | With Mortgage |
| Less than 2.0x | 51 (44.7%) | 81,304 (70,089.7%) |
| 2.0x to 2.9x | 25 (21.9%) | 101 (87.1%) |
| 3.0x to 3.9x | 9 (7.9%) | 14 (12.1%) |
| 4.0x or more | 25 (21.9%) | 1 (0.9%) |
| Total | 114 (100.0%) | 116 (100.0%) |
Real Estate Taxes by Mortgage Status in Heron Lake
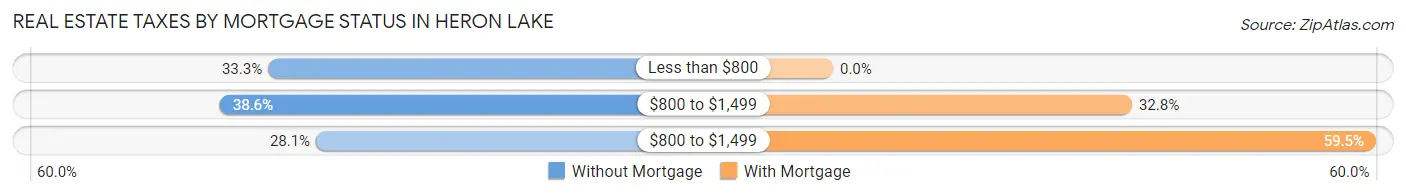
| Property Taxes | Without Mortgage | With Mortgage |
| Less than $800 | 38 (33.3%) | 0 (0.0%) |
| $800 to $1,499 | 44 (38.6%) | 38 (32.8%) |
| $800 to $1,499 | 32 (28.1%) | 69 (59.5%) |
| Total | 114 (100.0%) | 116 (100.0%) |
Health & Disability in Heron Lake
Health Insurance Coverage by Age in Heron Lake
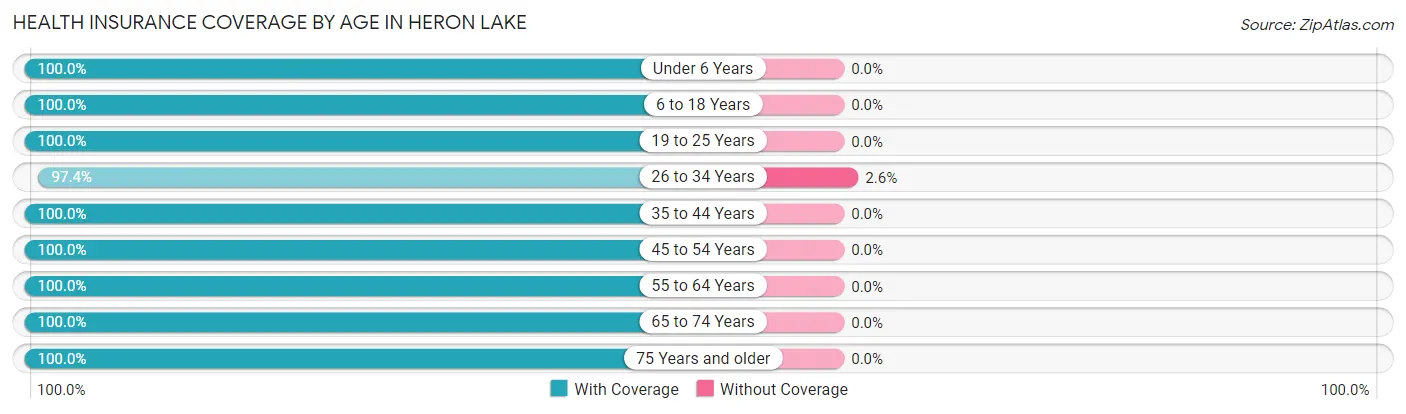
| Age Bracket | With Coverage | Without Coverage |
| Under 6 Years | 24 (100.0%) | 0 (0.0%) |
| 6 to 18 Years | 107 (100.0%) | 0 (0.0%) |
| 19 to 25 Years | 17 (100.0%) | 0 (0.0%) |
| 26 to 34 Years | 74 (97.4%) | 2 (2.6%) |
| 35 to 44 Years | 82 (100.0%) | 0 (0.0%) |
| 45 to 54 Years | 47 (100.0%) | 0 (0.0%) |
| 55 to 64 Years | 89 (100.0%) | 0 (0.0%) |
| 65 to 74 Years | 71 (100.0%) | 0 (0.0%) |
| 75 Years and older | 77 (100.0%) | 0 (0.0%) |
| Total | 588 (99.7%) | 2 (0.3%) |
Health Insurance Coverage by Citizenship Status in Heron Lake
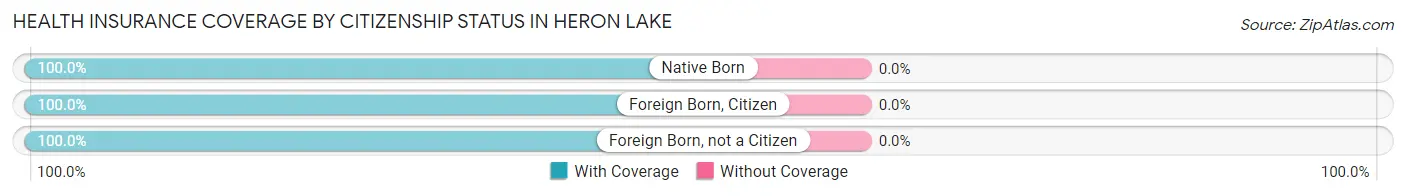
| Citizenship Status | With Coverage | Without Coverage |
| Native Born | 24 (100.0%) | 0 (0.0%) |
| Foreign Born, Citizen | 107 (100.0%) | 0 (0.0%) |
| Foreign Born, not a Citizen | 17 (100.0%) | 0 (0.0%) |
Health Insurance Coverage by Household Income in Heron Lake
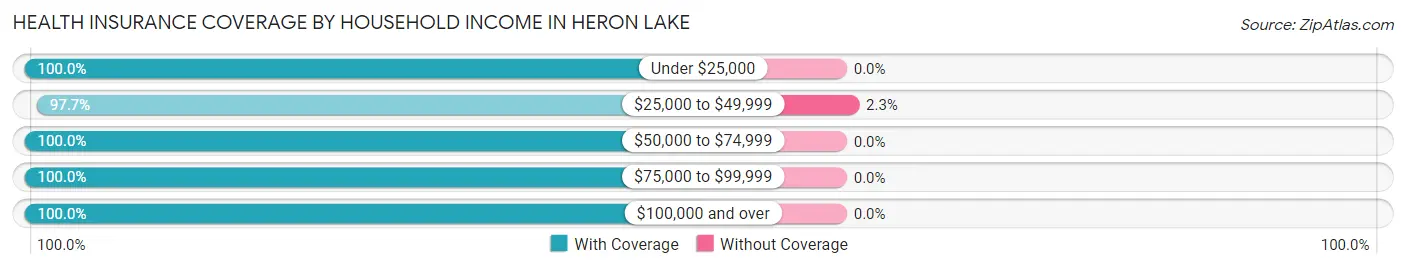
| Household Income | With Coverage | Without Coverage |
| Under $25,000 | 52 (100.0%) | 0 (0.0%) |
| $25,000 to $49,999 | 85 (97.7%) | 2 (2.3%) |
| $50,000 to $74,999 | 102 (100.0%) | 0 (0.0%) |
| $75,000 to $99,999 | 125 (100.0%) | 0 (0.0%) |
| $100,000 and over | 223 (100.0%) | 0 (0.0%) |
Public vs Private Health Insurance Coverage by Age in Heron Lake
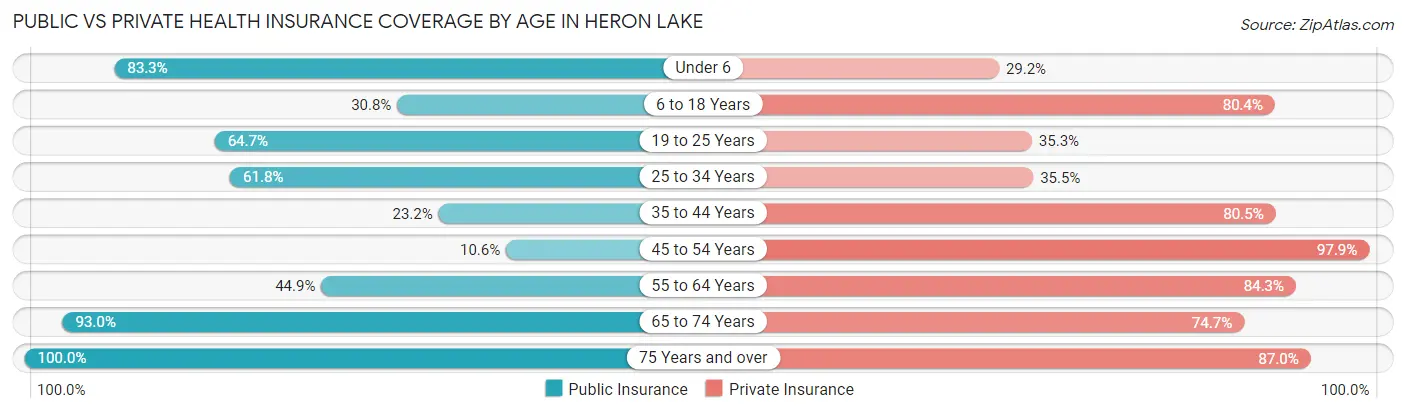
| Age Bracket | Public Insurance | Private Insurance |
| Under 6 | 20 (83.3%) | 7 (29.2%) |
| 6 to 18 Years | 33 (30.8%) | 86 (80.4%) |
| 19 to 25 Years | 11 (64.7%) | 6 (35.3%) |
| 25 to 34 Years | 47 (61.8%) | 27 (35.5%) |
| 35 to 44 Years | 19 (23.2%) | 66 (80.5%) |
| 45 to 54 Years | 5 (10.6%) | 46 (97.9%) |
| 55 to 64 Years | 40 (44.9%) | 75 (84.3%) |
| 65 to 74 Years | 66 (93.0%) | 53 (74.7%) |
| 75 Years and over | 77 (100.0%) | 67 (87.0%) |
| Total | 318 (53.9%) | 433 (73.4%) |
Disability Status by Sex by Age in Heron Lake
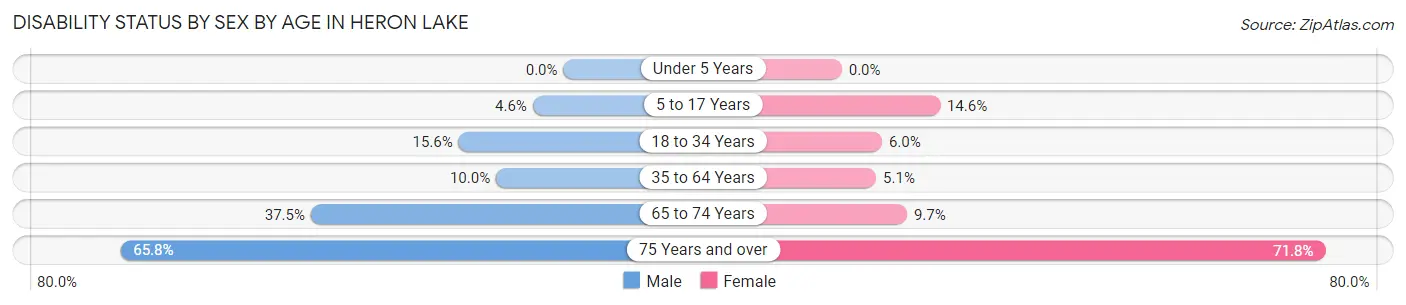
| Age Bracket | Male | Female |
| Under 5 Years | 0 (0.0%) | 0 (0.0%) |
| 5 to 17 Years | 2 (4.5%) | 7 (14.6%) |
| 18 to 34 Years | 7 (15.6%) | 4 (6.0%) |
| 35 to 64 Years | 12 (10.0%) | 5 (5.1%) |
| 65 to 74 Years | 15 (37.5%) | 3 (9.7%) |
| 75 Years and over | 25 (65.8%) | 28 (71.8%) |
Disability Class by Sex by Age in Heron Lake
Disability Class: Hearing Difficulty
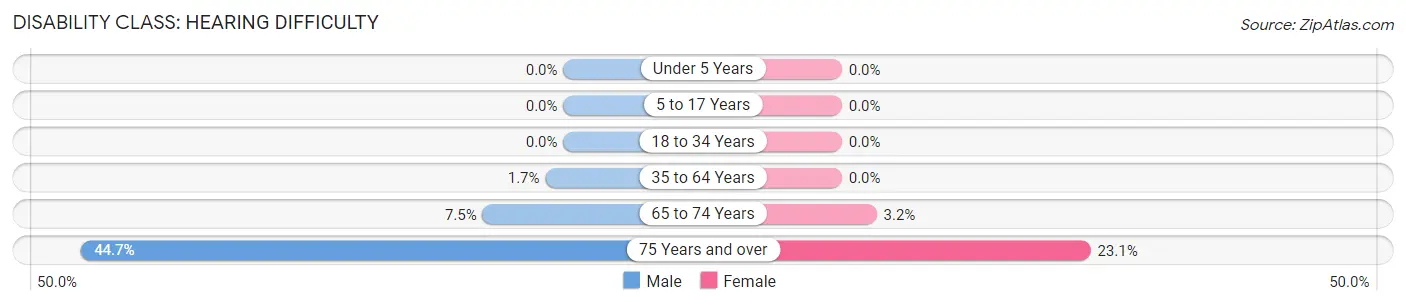
| Age Bracket | Male | Female |
| Under 5 Years | 0 (0.0%) | 0 (0.0%) |
| 5 to 17 Years | 0 (0.0%) | 0 (0.0%) |
| 18 to 34 Years | 0 (0.0%) | 0 (0.0%) |
| 35 to 64 Years | 2 (1.7%) | 0 (0.0%) |
| 65 to 74 Years | 3 (7.5%) | 1 (3.2%) |
| 75 Years and over | 17 (44.7%) | 9 (23.1%) |
Disability Class: Vision Difficulty
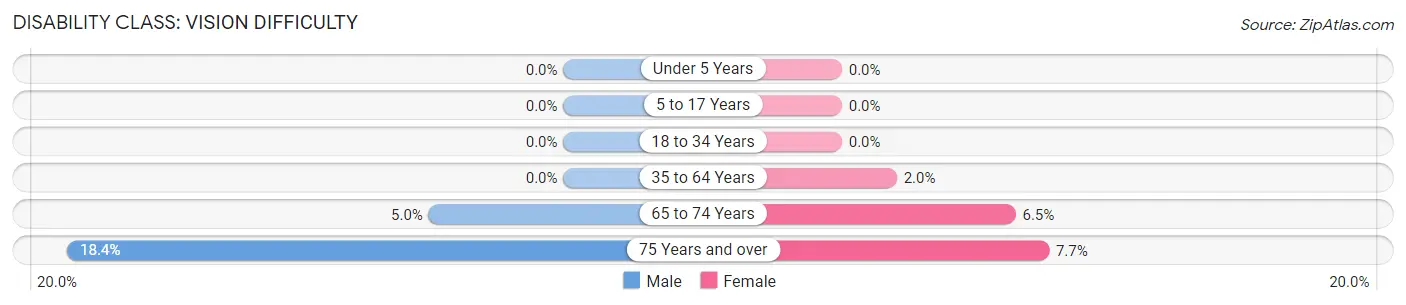
| Age Bracket | Male | Female |
| Under 5 Years | 0 (0.0%) | 0 (0.0%) |
| 5 to 17 Years | 0 (0.0%) | 0 (0.0%) |
| 18 to 34 Years | 0 (0.0%) | 0 (0.0%) |
| 35 to 64 Years | 0 (0.0%) | 2 (2.0%) |
| 65 to 74 Years | 2 (5.0%) | 2 (6.5%) |
| 75 Years and over | 7 (18.4%) | 3 (7.7%) |
Disability Class: Cognitive Difficulty
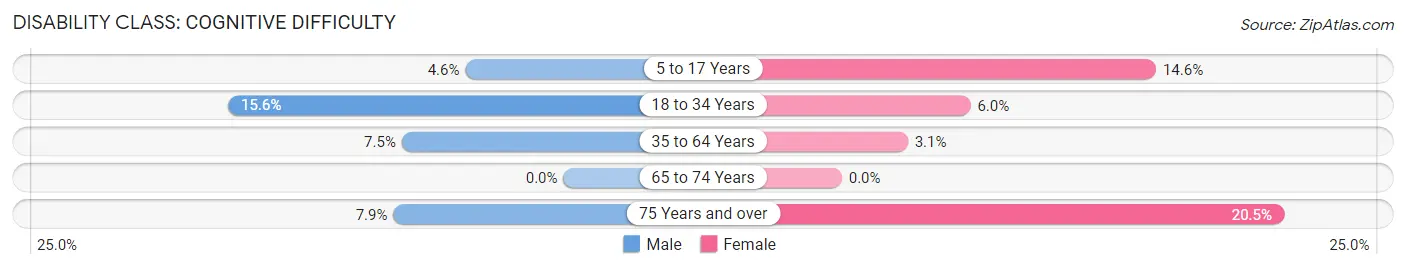
| Age Bracket | Male | Female |
| 5 to 17 Years | 2 (4.5%) | 7 (14.6%) |
| 18 to 34 Years | 7 (15.6%) | 4 (6.0%) |
| 35 to 64 Years | 9 (7.5%) | 3 (3.1%) |
| 65 to 74 Years | 0 (0.0%) | 0 (0.0%) |
| 75 Years and over | 3 (7.9%) | 8 (20.5%) |
Disability Class: Ambulatory Difficulty
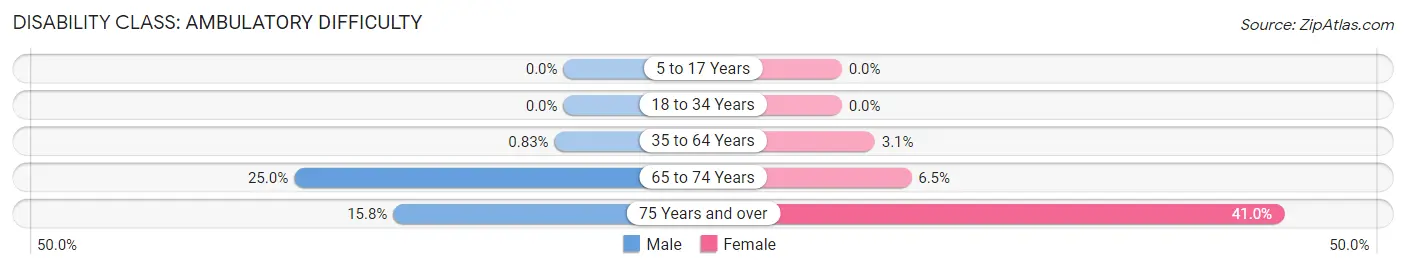
| Age Bracket | Male | Female |
| 5 to 17 Years | 0 (0.0%) | 0 (0.0%) |
| 18 to 34 Years | 0 (0.0%) | 0 (0.0%) |
| 35 to 64 Years | 1 (0.8%) | 3 (3.1%) |
| 65 to 74 Years | 10 (25.0%) | 2 (6.5%) |
| 75 Years and over | 6 (15.8%) | 16 (41.0%) |
Disability Class: Self-Care Difficulty
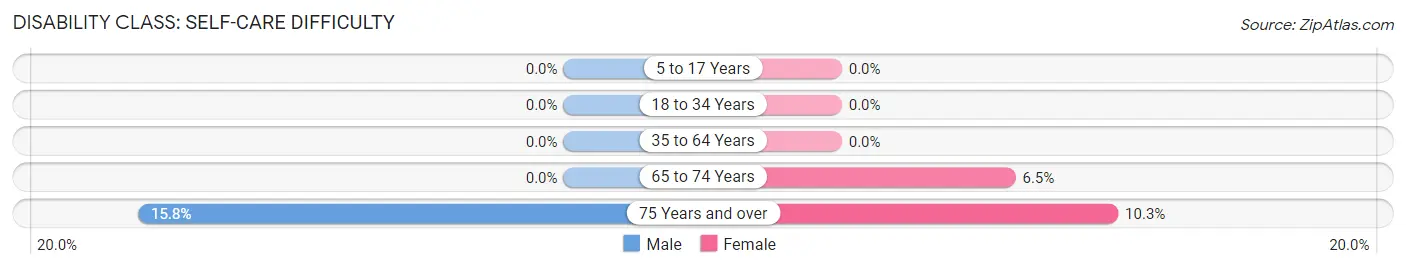
| Age Bracket | Male | Female |
| 5 to 17 Years | 0 (0.0%) | 0 (0.0%) |
| 18 to 34 Years | 0 (0.0%) | 0 (0.0%) |
| 35 to 64 Years | 0 (0.0%) | 0 (0.0%) |
| 65 to 74 Years | 0 (0.0%) | 2 (6.5%) |
| 75 Years and over | 6 (15.8%) | 4 (10.3%) |
Technology Access in Heron Lake
Computing Device Access in Heron Lake
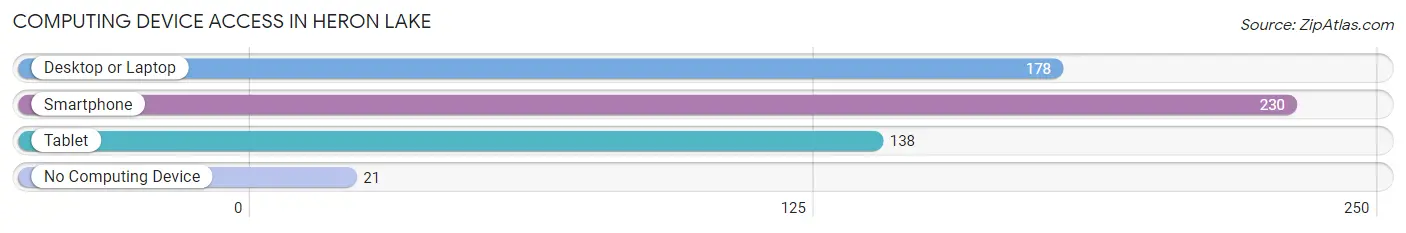
| Device Type | # Households | % Households |
| Desktop or Laptop | 178 | 66.4% |
| Smartphone | 230 | 85.8% |
| Tablet | 138 | 51.5% |
| No Computing Device | 21 | 7.8% |
| Total | 268 | 100.0% |
Internet Access in Heron Lake
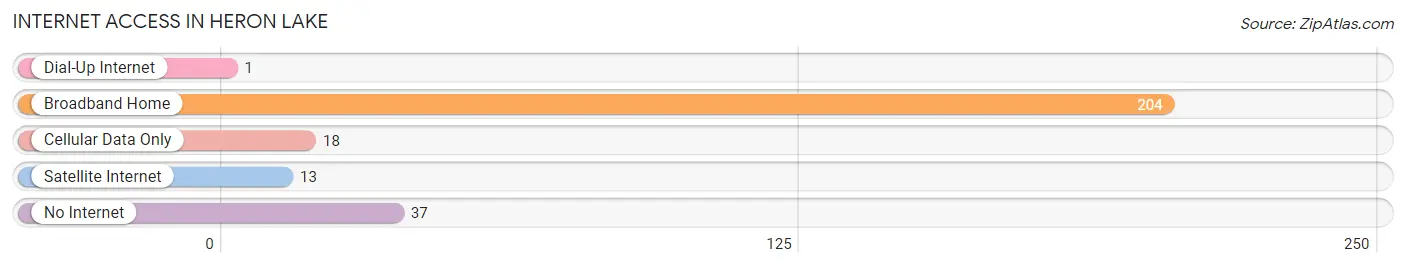
| Internet Type | # Households | % Households |
| Dial-Up Internet | 1 | 0.4% |
| Broadband Home | 204 | 76.1% |
| Cellular Data Only | 18 | 6.7% |
| Satellite Internet | 13 | 4.9% |
| No Internet | 37 | 13.8% |
| Total | 268 | 100.0% |
Heron Lake Summary
Heron Lake is a small city located in Jackson County, Minnesota, United States. The city is situated on the shores of Heron Lake, a natural lake that is part of the Des Moines River watershed. The city was founded in 1881 and has a population of approximately 1,000 people.
History
Heron Lake was founded in 1881 by a group of settlers from Wisconsin. The settlers were attracted to the area by the abundance of fish and game in the lake and the surrounding area. The first settlers built a sawmill and a grist mill, which provided the foundation for the city's economy. The city was incorporated in 1883 and the first mayor was elected in 1884.
The city grew slowly but steadily over the years, and by the early 1900s, it had become a popular tourist destination. The city was known for its beautiful lake and its abundance of wildlife. The city was also home to a number of businesses, including a hotel, a general store, a blacksmith shop, and a livery stable.
In the 1920s, the city began to experience a decline in population as people moved away to larger cities. However, the city was able to remain afloat due to its strong agricultural base. The city was also home to a number of small businesses, including a creamery, a feed mill, and a lumberyard.
Geography
Heron Lake is located in Jackson County, Minnesota, United States. The city is situated on the shores of Heron Lake, a natural lake that is part of the Des Moines River watershed. The lake is approximately 1,000 acres in size and is surrounded by a variety of wildlife, including deer, beavers, and muskrats. The city is located approximately 25 miles south of the city of Jackson and is approximately 50 miles north of the city of Sioux Falls, South Dakota.
The city is located in a rural area and is surrounded by rolling hills and farmland. The city is located in a temperate climate, with hot summers and cold winters. The average temperature in the summer is around 75 degrees Fahrenheit, and the average temperature in the winter is around 20 degrees Fahrenheit.
Economy
Heron Lake's economy is largely based on agriculture. The city is home to a number of farms, which produce a variety of crops, including corn, soybeans, and wheat. The city is also home to a number of small businesses, including a feed mill, a lumberyard, and a creamery.
The city is also home to a number of manufacturing businesses, including a furniture factory and a plastics factory. The city is also home to a number of retail businesses, including a grocery store, a hardware store, and a variety of other small businesses.
Demographics
As of the 2010 census, the population of Heron Lake was 1,000 people. The racial makeup of the city was 97.2% White, 0.7% African American, 0.2% Native American, 0.2% Asian, 0.2% from other races, and 1.7% from two or more races. The median household income in the city was $41,250, and the median family income was $50,000.
The city is home to a number of churches, including the United Methodist Church, the Lutheran Church, and the Catholic Church. The city is also home to a number of schools, including a public elementary school, a public middle school, and a public high school.
Conclusion
Heron Lake is a small city located in Jackson County, Minnesota, United States. The city is situated on the shores of Heron Lake, a natural lake that is part of the Des Moines River watershed. The city was founded in 1881 and has a population of approximately 1,000 people. The city's economy is largely based on agriculture, and the city is home to a number of small businesses. The racial makeup of the city is 97.2% White, 0.7% African American, 0.2% Native American, 0.2% Asian, 0.2% from other races, and 1.7% from two or more races. The median household income in the city was $41,250, and the median family income was $50,000. Heron Lake is a small city with a rich history and a bright future.
Common Questions
What is Per Capita Income in Heron Lake?
Per Capita income in Heron Lake is $35,113.
What is the Median Family Income in Heron Lake?
Median Family Income in Heron Lake is $81,522.
What is the Median Household income in Heron Lake?
Median Household Income in Heron Lake is $65,750.
What is Income or Wage Gap in Heron Lake?
Income or Wage Gap in Heron Lake is 48.0%.
Women in Heron Lake earn 52.0 cents for every dollar earned by a man.
What is Inequality or Gini Index in Heron Lake?
Inequality or Gini Index in Heron Lake is 0.37.
What is the Total Population of Heron Lake?
Total Population of Heron Lake is 600.
What is the Total Male Population of Heron Lake?
Total Male Population of Heron Lake is 300.
What is the Total Female Population of Heron Lake?
Total Female Population of Heron Lake is 300.
What is the Ratio of Males per 100 Females in Heron Lake?
There are 100.00 Males per 100 Females in Heron Lake.
What is the Ratio of Females per 100 Males in Heron Lake?
There are 100.00 Females per 100 Males in Heron Lake.
What is the Median Population Age in Heron Lake?
Median Population Age in Heron Lake is 43.3 Years.
What is the Average Family Size in Heron Lake
Average Family Size in Heron Lake is 2.9 People.
What is the Average Household Size in Heron Lake
Average Household Size in Heron Lake is 2.2 People.
How Large is the Labor Force in Heron Lake?
There are 356 People in the Labor Forcein in Heron Lake.
What is the Percentage of People in the Labor Force in Heron Lake?
70.8% of People are in the Labor Force in Heron Lake.