Hendricks, MN Map & Demographics
Hendricks Map
Hendricks Overview
$31,430
PER CAPITA INCOME
$64,375
AVG FAMILY INCOME
$46,875
AVG HOUSEHOLD INCOME
38.6%
WAGE / INCOME GAP [ % ]
61.4¢/ $1
WAGE / INCOME GAP [ $ ]
0.46
INEQUALITY / GINI INDEX
602
TOTAL POPULATION
266
MALE POPULATION
336
FEMALE POPULATION
79.17
MALES / 100 FEMALES
126.32
FEMALES / 100 MALES
53.7
MEDIAN AGE
2.5
AVG FAMILY SIZE
1.8
AVG HOUSEHOLD SIZE
272
LABOR FORCE [ PEOPLE ]
51.1%
PERCENT IN LABOR FORCE
3.7%
UNEMPLOYMENT RATE
Hendricks Zip Codes
Hendricks Area Codes
Income in Hendricks
Income Overview in Hendricks
Per Capita Income in Hendricks is $31,430, while median incomes of families and households are $64,375 and $46,875 respectively.
| Characteristic | Number | Measure |
| Per Capita Income | 602 | $31,430 |
| Median Family Income | 153 | $64,375 |
| Mean Family Income | 153 | $82,586 |
| Median Household Income | 312 | $46,875 |
| Mean Household Income | 312 | $59,655 |
| Income Deficit | 153 | $0 |
| Wage / Income Gap (%) | 602 | 38.61% |
| Wage / Income Gap ($) | 602 | 61.39¢ per $1 |
| Gini / Inequality Index | 602 | 0.46 |
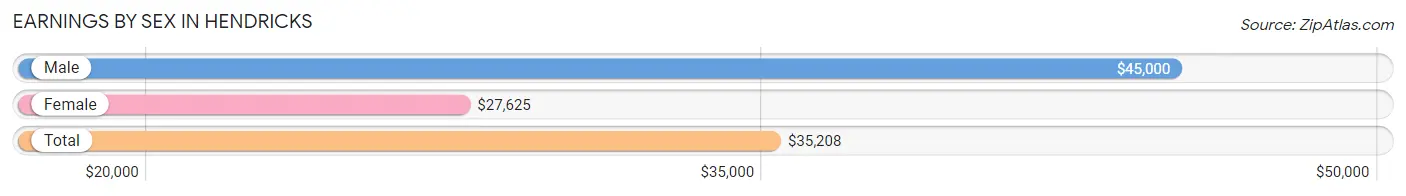
Earnings by Sex in Hendricks
Average Earnings in Hendricks are $35,208, $45,000 for men and $27,625 for women, a difference of 38.6%.
| Sex | Number | Average Earnings |
| Male | 150 (52.6%) | $45,000 |
| Female | 135 (47.4%) | $27,625 |
| Total | 285 (100.0%) | $35,208 |
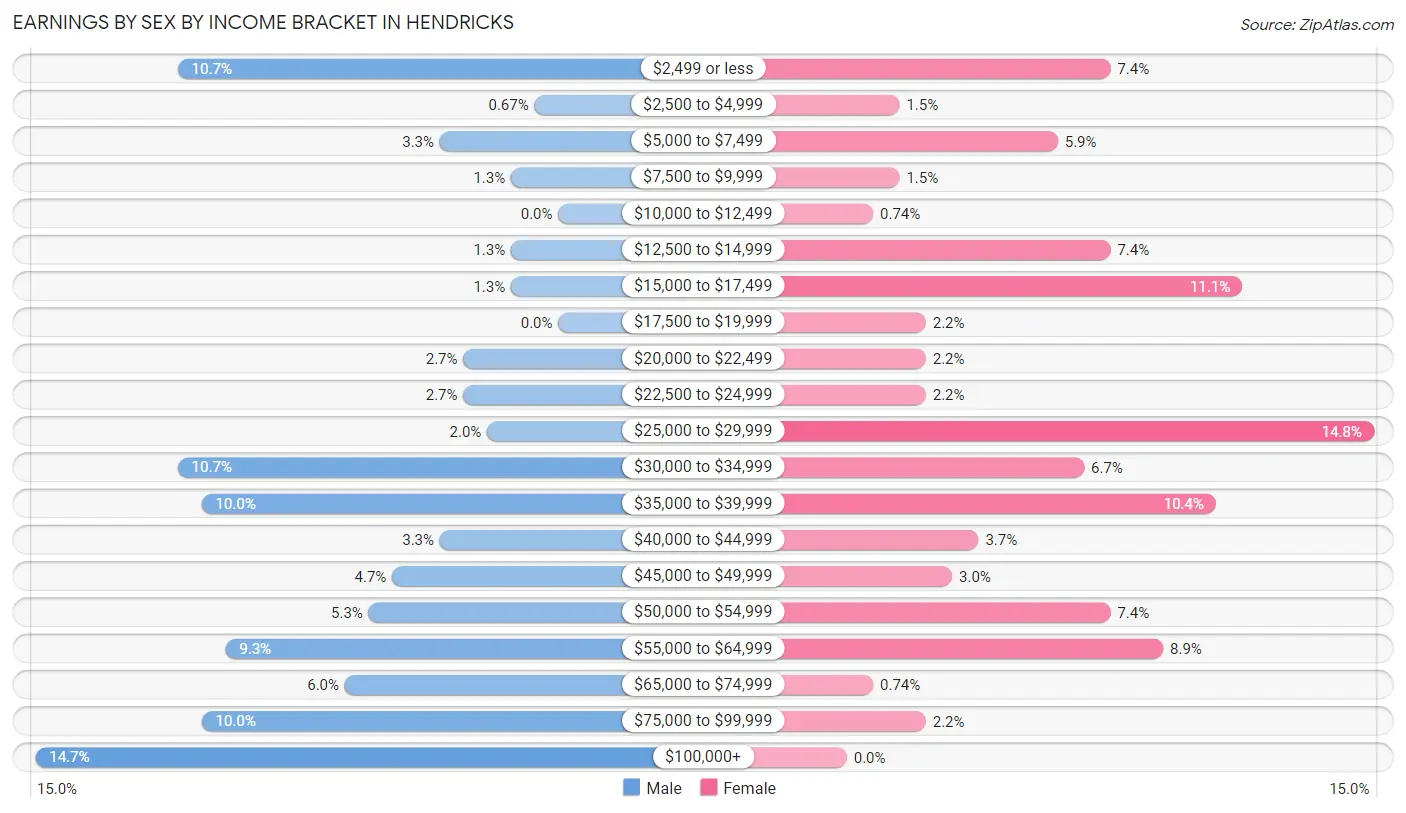
Earnings by Sex by Income Bracket in Hendricks
The most common earnings brackets in Hendricks are $100,000+ for men (22 | 14.7%) and $25,000 to $29,999 for women (20 | 14.8%).
| Income | Male | Female |
| $2,499 or less | 16 (10.7%) | 10 (7.4%) |
| $2,500 to $4,999 | 1 (0.7%) | 2 (1.5%) |
| $5,000 to $7,499 | 5 (3.3%) | 8 (5.9%) |
| $7,500 to $9,999 | 2 (1.3%) | 2 (1.5%) |
| $10,000 to $12,499 | 0 (0.0%) | 1 (0.7%) |
| $12,500 to $14,999 | 2 (1.3%) | 10 (7.4%) |
| $15,000 to $17,499 | 2 (1.3%) | 15 (11.1%) |
| $17,500 to $19,999 | 0 (0.0%) | 3 (2.2%) |
| $20,000 to $22,499 | 4 (2.7%) | 3 (2.2%) |
| $22,500 to $24,999 | 4 (2.7%) | 3 (2.2%) |
| $25,000 to $29,999 | 3 (2.0%) | 20 (14.8%) |
| $30,000 to $34,999 | 16 (10.7%) | 9 (6.7%) |
| $35,000 to $39,999 | 15 (10.0%) | 14 (10.4%) |
| $40,000 to $44,999 | 5 (3.3%) | 5 (3.7%) |
| $45,000 to $49,999 | 7 (4.7%) | 4 (3.0%) |
| $50,000 to $54,999 | 8 (5.3%) | 10 (7.4%) |
| $55,000 to $64,999 | 14 (9.3%) | 12 (8.9%) |
| $65,000 to $74,999 | 9 (6.0%) | 1 (0.7%) |
| $75,000 to $99,999 | 15 (10.0%) | 3 (2.2%) |
| $100,000+ | 22 (14.7%) | 0 (0.0%) |
| Total | 150 (100.0%) | 135 (100.0%) |
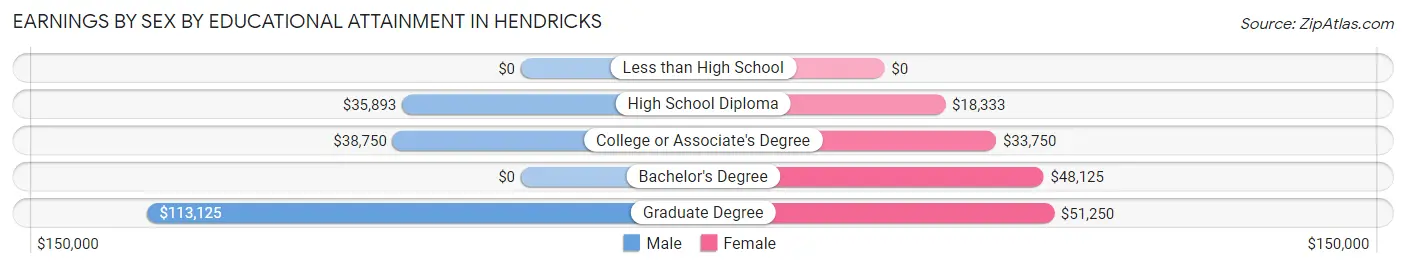
Earnings by Sex by Educational Attainment in Hendricks
Average earnings in Hendricks are $45,938 for men and $29,500 for women, a difference of 35.8%. Men with an educational attainment of graduate degree enjoy the highest average annual earnings of $113,125, while those with high school diploma education earn the least with $35,893. Women with an educational attainment of graduate degree earn the most with the average annual earnings of $51,250, while those with high school diploma education have the smallest earnings of $18,333.
| Educational Attainment | Male Income | Female Income |
| Less than High School | - | - |
| High School Diploma | $35,893 | $18,333 |
| College or Associate's Degree | $38,750 | $33,750 |
| Bachelor's Degree | - | - |
| Graduate Degree | $113,125 | $51,250 |
| Total | $45,938 | $29,500 |
Family Income in Hendricks
Family Income Brackets in Hendricks
According to the Hendricks family income data, there are 30 families falling into the $50,000 to $74,999 income range, which is the most common income bracket and makes up 19.6% of all families. Conversely, the $200,000+ income bracket is the least frequent group with only 5 families (3.3%) belonging to this category.
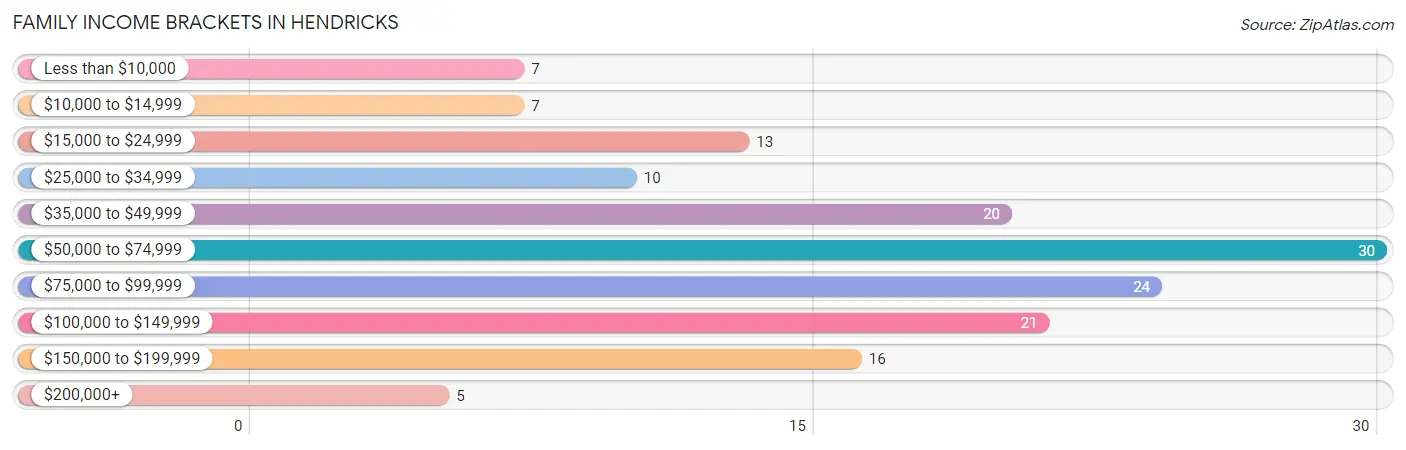
| Income Bracket | # Families | % Families |
| Less than $10,000 | 7 | 4.6% |
| $10,000 to $14,999 | 7 | 4.6% |
| $15,000 to $24,999 | 13 | 8.5% |
| $25,000 to $34,999 | 10 | 6.5% |
| $35,000 to $49,999 | 20 | 13.1% |
| $50,000 to $74,999 | 30 | 19.6% |
| $75,000 to $99,999 | 24 | 15.7% |
| $100,000 to $149,999 | 21 | 13.7% |
| $150,000 to $199,999 | 16 | 10.5% |
| $200,000+ | 5 | 3.3% |
Family Income by Famaliy Size in Hendricks
3-person families (34 | 22.2%) account for the highest median family income in Hendricks with $73,333 per family, while 2-person families (92 | 60.1%) have the highest median income of $27,188 per family member.
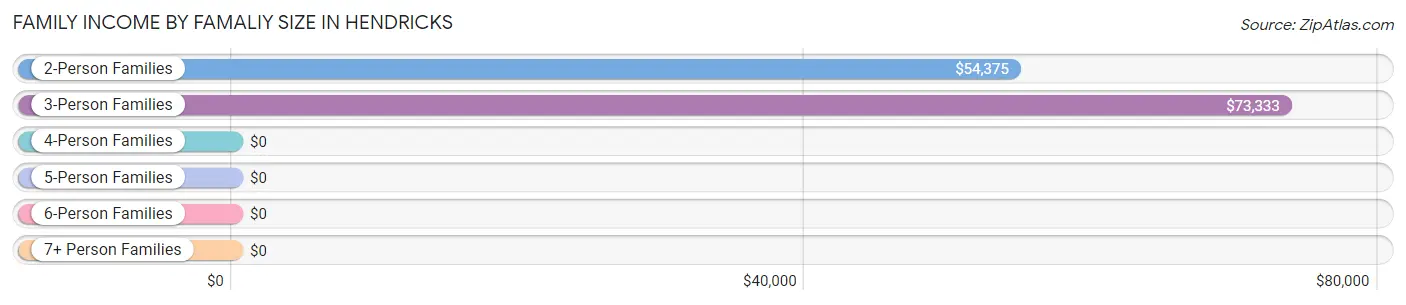
| Income Bracket | # Families | Median Income |
| 2-Person Families | 92 (60.1%) | $54,375 |
| 3-Person Families | 34 (22.2%) | $73,333 |
| 4-Person Families | 19 (12.4%) | $0 |
| 5-Person Families | 5 (3.3%) | $0 |
| 6-Person Families | 3 (2.0%) | $0 |
| 7+ Person Families | 0 (0.0%) | $0 |
| Total | 153 (100.0%) | $64,375 |
Family Income by Number of Earners in Hendricks
The median family income in Hendricks is $64,375, with families comprising 3+ earners (10) having the highest median family income of $143,750, while families with no earners (36) have the lowest median family income of $38,750, accounting for 6.5% and 23.5% of families, respectively.
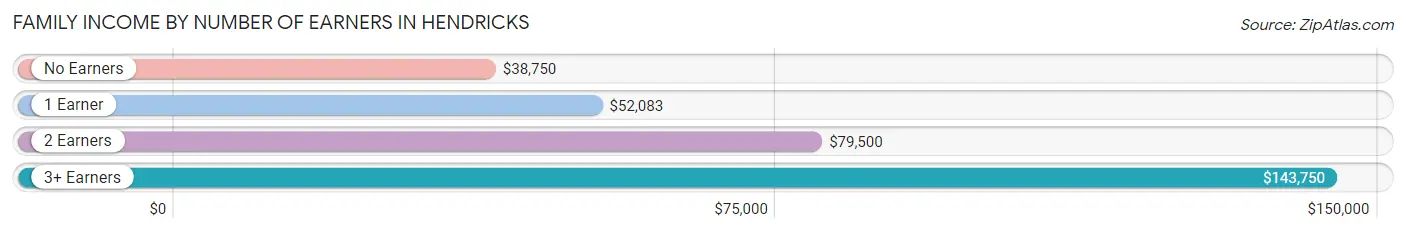
| Number of Earners | # Families | Median Income |
| No Earners | 36 (23.5%) | $38,750 |
| 1 Earner | 45 (29.4%) | $52,083 |
| 2 Earners | 62 (40.5%) | $79,500 |
| 3+ Earners | 10 (6.5%) | $143,750 |
| Total | 153 (100.0%) | $64,375 |
Household Income in Hendricks
Household Income Brackets in Hendricks
With 56 households falling in the category, the $50,000 to $74,999 income range is the most frequent in Hendricks, accounting for 17.9% of all households. In contrast, only 5 households (1.6%) fall into the $200,000+ income bracket, making it the least populous group.
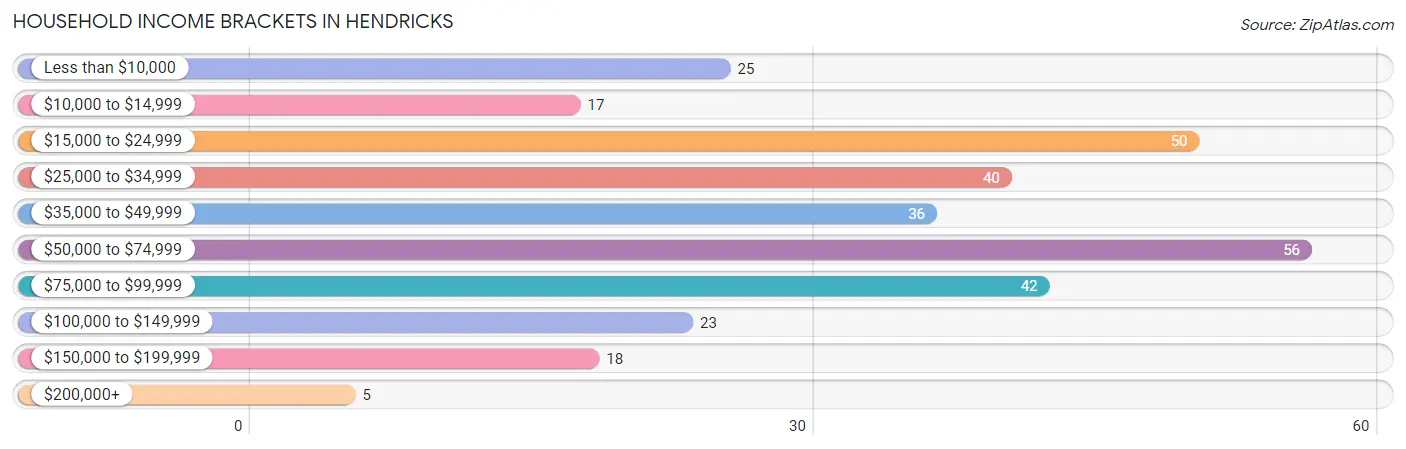
| Income Bracket | # Households | % Households |
| Less than $10,000 | 25 | 8.0% |
| $10,000 to $14,999 | 17 | 5.4% |
| $15,000 to $24,999 | 50 | 16.0% |
| $25,000 to $34,999 | 40 | 12.8% |
| $35,000 to $49,999 | 36 | 11.5% |
| $50,000 to $74,999 | 56 | 17.9% |
| $75,000 to $99,999 | 42 | 13.5% |
| $100,000 to $149,999 | 23 | 7.4% |
| $150,000 to $199,999 | 18 | 5.8% |
| $200,000+ | 5 | 1.6% |
Household Income by Householder Age in Hendricks
The median household income in Hendricks is $46,875, with the highest median household income of $64,000 found in the 45 to 64 years age bracket for the primary householder. A total of 84 households (26.9%) fall into this category. Meanwhile, the 15 to 24 years age bracket for the primary householder has the lowest median household income of $0, with 30 households (9.6%) in this group.
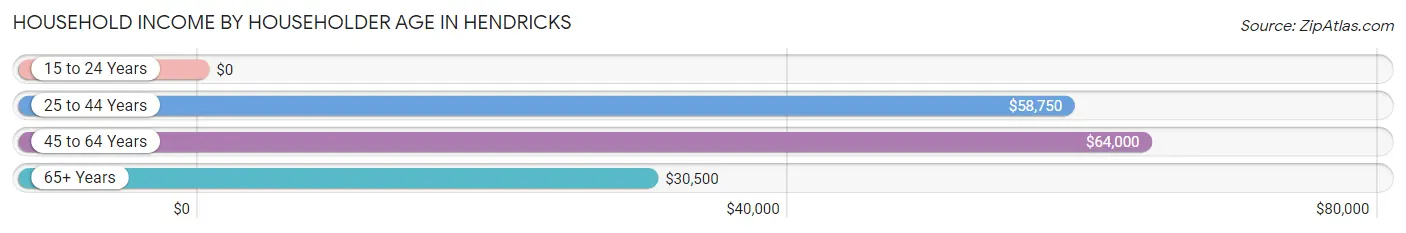
| Income Bracket | # Households | Median Income |
| 15 to 24 Years | 30 (9.6%) | $0 |
| 25 to 44 Years | 72 (23.1%) | $58,750 |
| 45 to 64 Years | 84 (26.9%) | $64,000 |
| 65+ Years | 126 (40.4%) | $30,500 |
| Total | 312 (100.0%) | $46,875 |
Poverty in Hendricks
Income Below Poverty by Sex and Age in Hendricks
With 19.2% poverty level for males and 17.5% for females among the residents of Hendricks, 5 year old males and 16 and 17 year old females are the most vulnerable to poverty, with 6 males (100.0%) and 7 females (77.8%) in their respective age groups living below the poverty level.
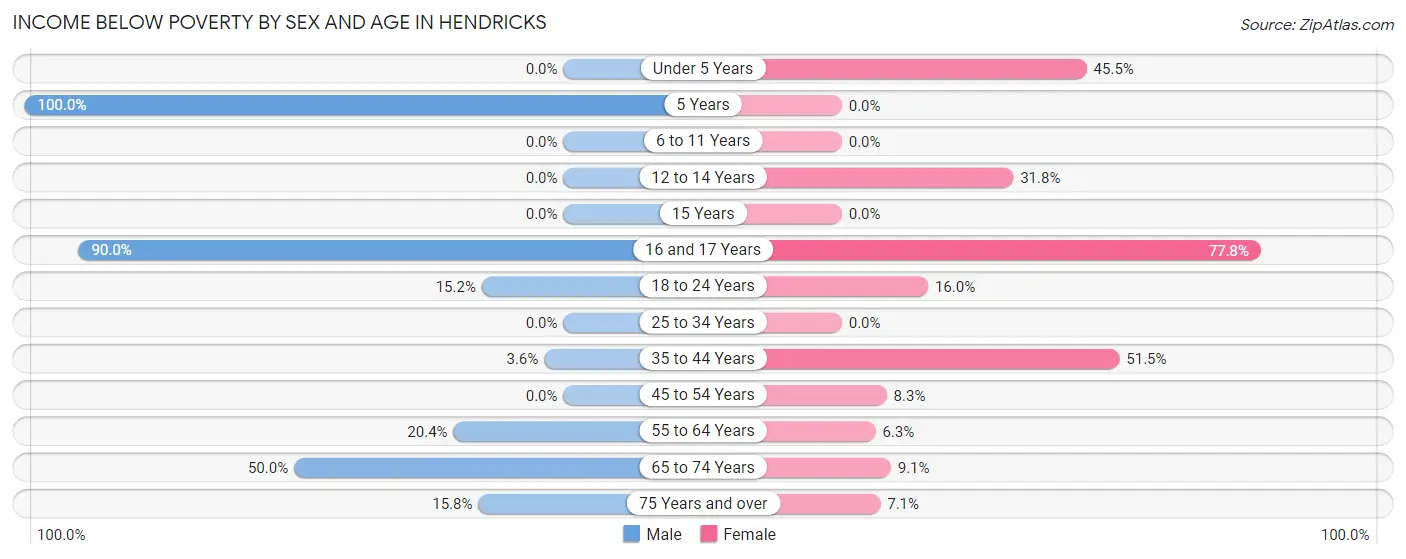
| Age Bracket | Male | Female |
| Under 5 Years | 0 (0.0%) | 5 (45.5%) |
| 5 Years | 6 (100.0%) | 0 (0.0%) |
| 6 to 11 Years | 0 (0.0%) | 0 (0.0%) |
| 12 to 14 Years | 0 (0.0%) | 7 (31.8%) |
| 15 Years | 0 (0.0%) | 0 (0.0%) |
| 16 and 17 Years | 9 (90.0%) | 7 (77.8%) |
| 18 to 24 Years | 5 (15.1%) | 4 (16.0%) |
| 25 to 34 Years | 0 (0.0%) | 0 (0.0%) |
| 35 to 44 Years | 1 (3.6%) | 17 (51.5%) |
| 45 to 54 Years | 0 (0.0%) | 3 (8.3%) |
| 55 to 64 Years | 10 (20.4%) | 2 (6.2%) |
| 65 to 74 Years | 12 (50.0%) | 2 (9.1%) |
| 75 Years and over | 6 (15.8%) | 5 (7.1%) |
| Total | 49 (19.2%) | 52 (17.5%) |
Income Above Poverty by Sex and Age in Hendricks
According to the poverty statistics in Hendricks, males aged under 5 years and females aged 5 years are the age groups that are most secure financially, with 100.0% of males and 100.0% of females in these age groups living above the poverty line.
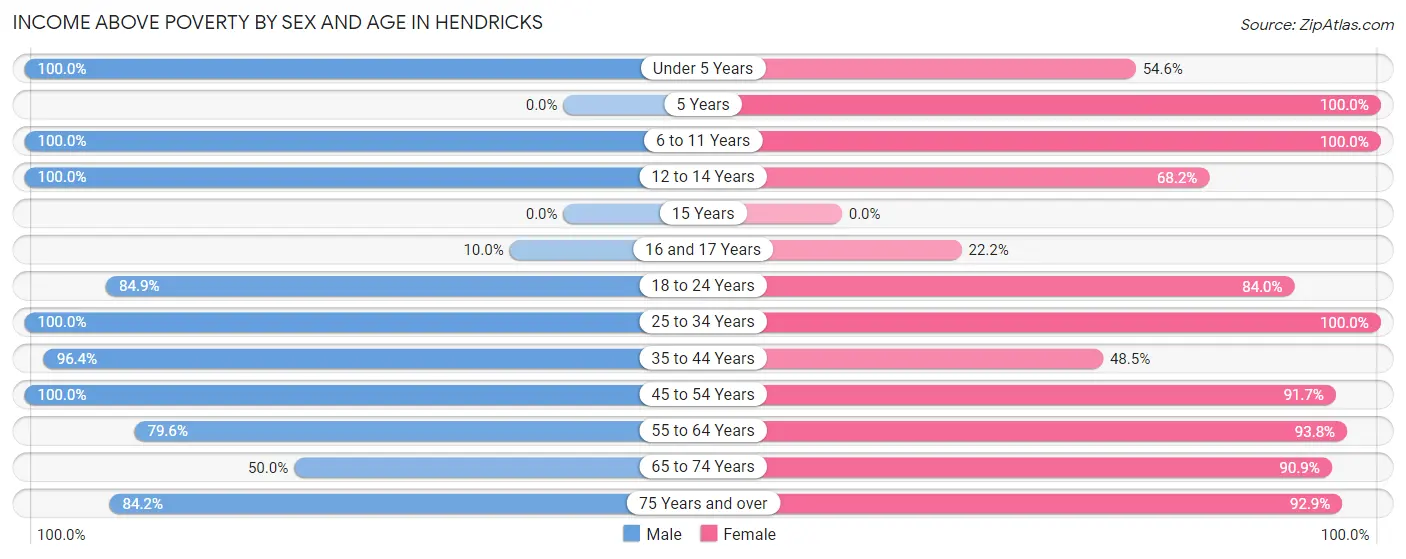
| Age Bracket | Male | Female |
| Under 5 Years | 4 (100.0%) | 6 (54.5%) |
| 5 Years | 0 (0.0%) | 3 (100.0%) |
| 6 to 11 Years | 11 (100.0%) | 12 (100.0%) |
| 12 to 14 Years | 1 (100.0%) | 15 (68.2%) |
| 15 Years | 0 (0.0%) | 0 (0.0%) |
| 16 and 17 Years | 1 (10.0%) | 2 (22.2%) |
| 18 to 24 Years | 28 (84.9%) | 21 (84.0%) |
| 25 to 34 Years | 23 (100.0%) | 22 (100.0%) |
| 35 to 44 Years | 27 (96.4%) | 16 (48.5%) |
| 45 to 54 Years | 28 (100.0%) | 33 (91.7%) |
| 55 to 64 Years | 39 (79.6%) | 30 (93.8%) |
| 65 to 74 Years | 12 (50.0%) | 20 (90.9%) |
| 75 Years and over | 32 (84.2%) | 65 (92.9%) |
| Total | 206 (80.8%) | 245 (82.5%) |
Income Below Poverty Among Married-Couple Families in Hendricks
The poverty statistics for married-couple families in Hendricks show that 1.9% or 2 of the total 106 families live below the poverty line. Families with no children have the highest poverty rate of 2.3%, comprising of 2 families. On the other hand, families with 1 or 2 children have the lowest poverty rate of 0.0%, which includes 0 families.
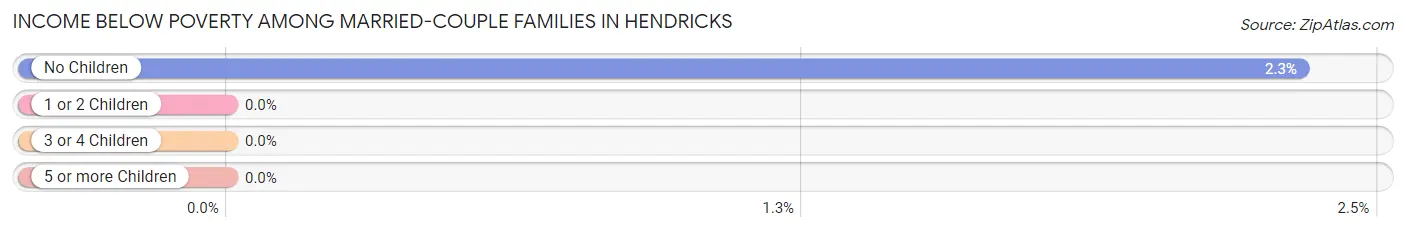
| Children | Above Poverty | Below Poverty |
| No Children | 84 (97.7%) | 2 (2.3%) |
| 1 or 2 Children | 12 (100.0%) | 0 (0.0%) |
| 3 or 4 Children | 8 (100.0%) | 0 (0.0%) |
| 5 or more Children | 0 (0.0%) | 0 (0.0%) |
| Total | 104 (98.1%) | 2 (1.9%) |
Income Below Poverty Among Single-Parent Households in Hendricks
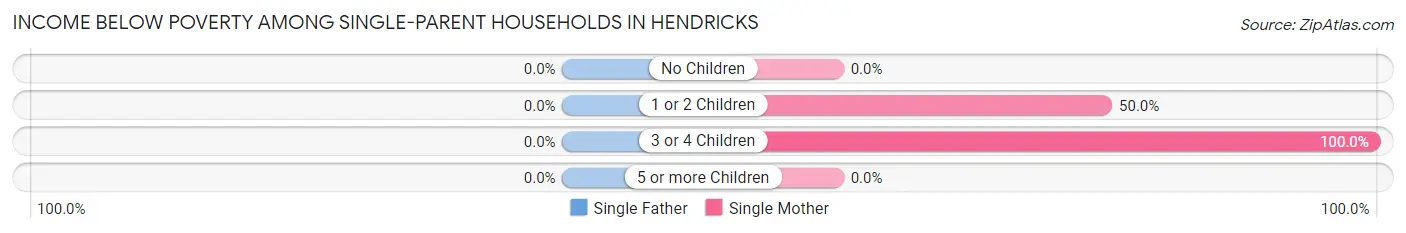
| Children | Single Father | Single Mother |
| No Children | 0 (0.0%) | 0 (0.0%) |
| 1 or 2 Children | 0 (0.0%) | 10 (50.0%) |
| 3 or 4 Children | 0 (0.0%) | 7 (100.0%) |
| 5 or more Children | 0 (0.0%) | 0 (0.0%) |
| Total | 0 (0.0%) | 17 (39.5%) |
Income Below Poverty Among Married-Couple vs Single-Parent Households in Hendricks
The poverty data for Hendricks shows that 2 of the married-couple family households (1.9%) and 17 of the single-parent households (36.2%) are living below the poverty level. Within the married-couple family households, those with no children have the highest poverty rate, with 2 households (2.3%) falling below the poverty line. Among the single-parent households, those with 3 or 4 children have the highest poverty rate, with 7 household (100.0%) living below poverty.
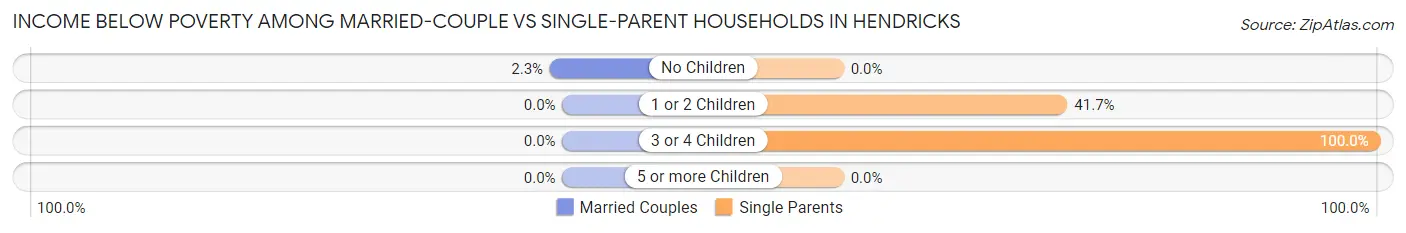
| Children | Married-Couple Families | Single-Parent Households |
| No Children | 2 (2.3%) | 0 (0.0%) |
| 1 or 2 Children | 0 (0.0%) | 10 (41.7%) |
| 3 or 4 Children | 0 (0.0%) | 7 (100.0%) |
| 5 or more Children | 0 (0.0%) | 0 (0.0%) |
| Total | 2 (1.9%) | 17 (36.2%) |
Race in Hendricks
The most populous races in Hendricks are White / Caucasian (556 | 92.4%), Two or more Races (33 | 5.5%), and Hispanic or Latino (11 | 1.8%).
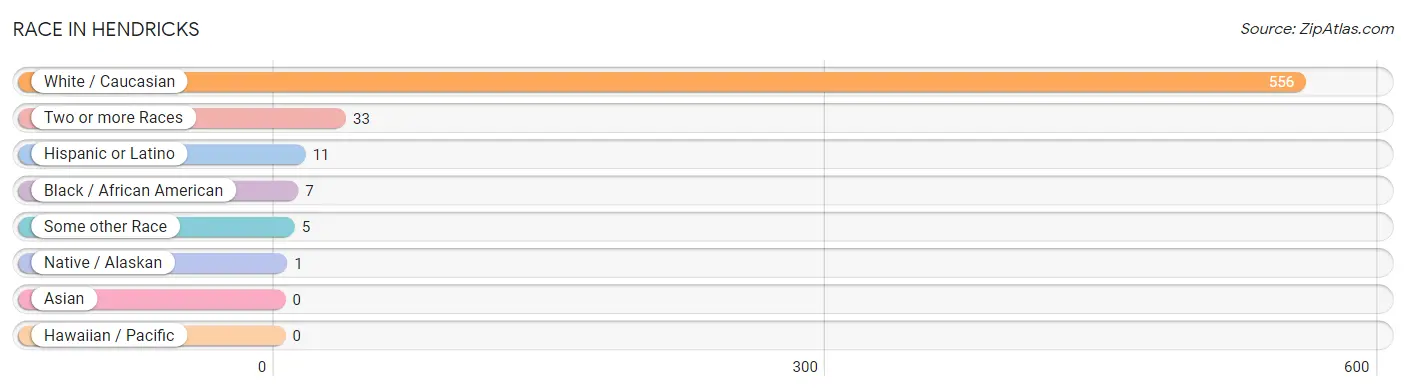
| Race | # Population | % Population |
| Asian | 0 | 0.0% |
| Black / African American | 7 | 1.2% |
| Hawaiian / Pacific | 0 | 0.0% |
| Hispanic or Latino | 11 | 1.8% |
| Native / Alaskan | 1 | 0.2% |
| White / Caucasian | 556 | 92.4% |
| Two or more Races | 33 | 5.5% |
| Some other Race | 5 | 0.8% |
| Total | 602 | 100.0% |
Ancestry in Hendricks
The most populous ancestries reported in Hendricks are German (205 | 34.1%), Norwegian (132 | 21.9%), Irish (79 | 13.1%), Swedish (30 | 5.0%), and Polish (26 | 4.3%), together accounting for 78.4% of all Hendricks residents.
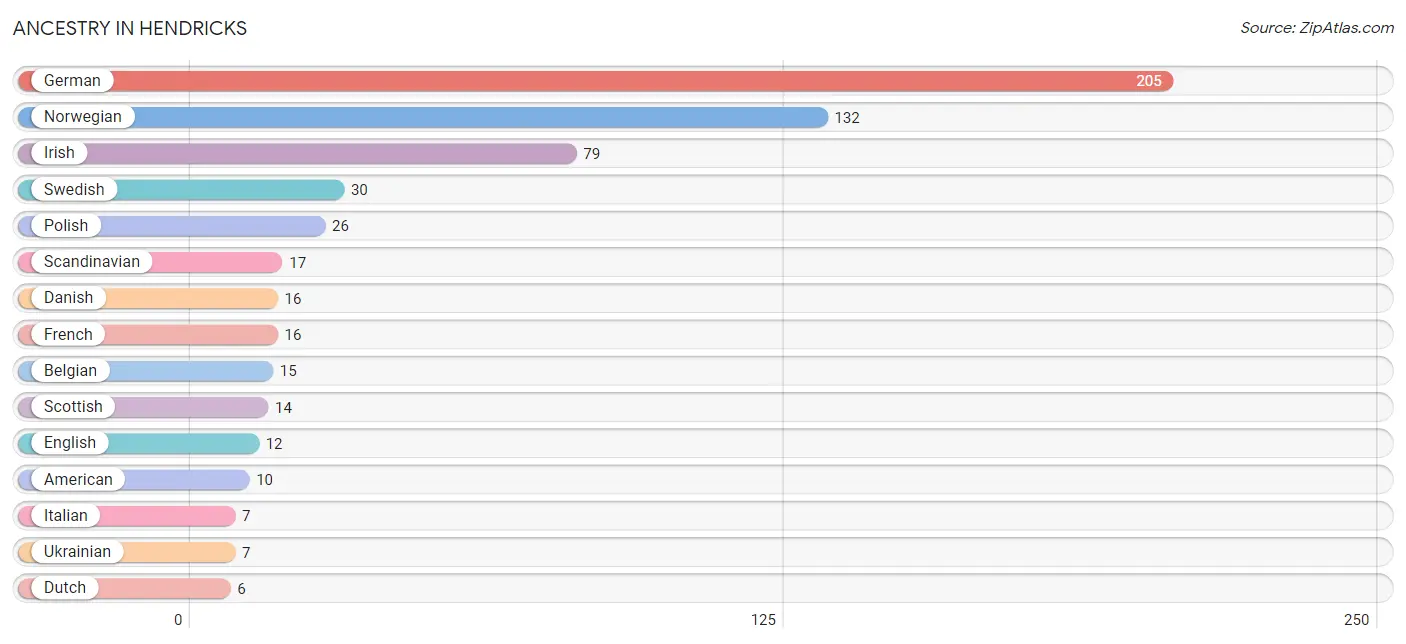
| Ancestry | # Population | % Population |
| American | 10 | 1.7% |
| Belgian | 15 | 2.5% |
| Canadian | 2 | 0.3% |
| Czech | 4 | 0.7% |
| Danish | 16 | 2.7% |
| Dutch | 6 | 1.0% |
| English | 12 | 2.0% |
| Estonian | 2 | 0.3% |
| French | 16 | 2.7% |
| German | 205 | 34.1% |
| Icelander | 2 | 0.3% |
| Irish | 79 | 13.1% |
| Italian | 7 | 1.2% |
| Mexican | 6 | 1.0% |
| Norwegian | 132 | 21.9% |
| Polish | 26 | 4.3% |
| Russian | 3 | 0.5% |
| Scandinavian | 17 | 2.8% |
| Scotch-Irish | 3 | 0.5% |
| Scottish | 14 | 2.3% |
| Sioux | 6 | 1.0% |
| Spanish | 5 | 0.8% |
| Sri Lankan | 6 | 1.0% |
| Subsaharan African | 4 | 0.7% |
| Swedish | 30 | 5.0% |
| Ukrainian | 7 | 1.2% |
| Welsh | 6 | 1.0% | View All 27 Rows |
Immigrants in Hendricks
The most numerous immigrant groups reported in Hendricks came from Central America (6 | 1.0%), Latin America (6 | 1.0%), Mexico (6 | 1.0%), Africa (4 | 0.7%), and Cameroon (4 | 0.7%), together accounting for 4.3% of all Hendricks residents.
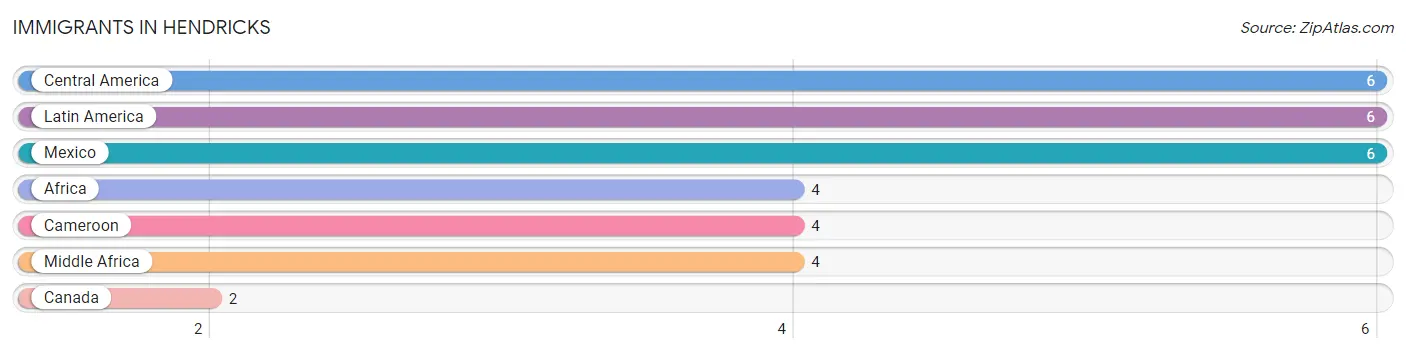
| Immigration Origin | # Population | % Population |
| Africa | 4 | 0.7% |
| Cameroon | 4 | 0.7% |
| Canada | 2 | 0.3% |
| Central America | 6 | 1.0% |
| Latin America | 6 | 1.0% |
| Mexico | 6 | 1.0% |
| Middle Africa | 4 | 0.7% | View All 7 Rows |
Sex and Age in Hendricks
Sex and Age in Hendricks
The most populous age groups in Hendricks are 60 to 64 Years (39 | 14.7%) for men and 85 Years and over (60 | 17.9%) for women.
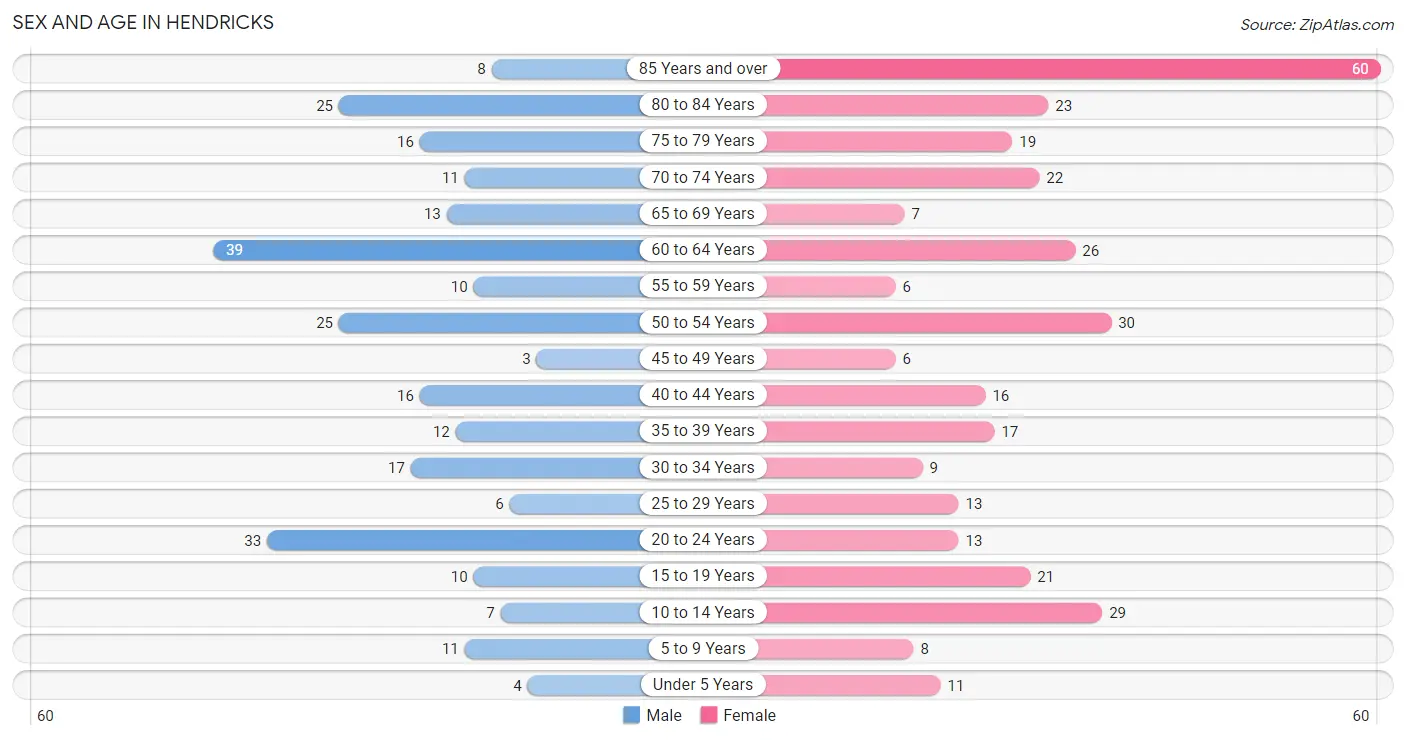
| Age Bracket | Male | Female |
| Under 5 Years | 4 (1.5%) | 11 (3.3%) |
| 5 to 9 Years | 11 (4.1%) | 8 (2.4%) |
| 10 to 14 Years | 7 (2.6%) | 29 (8.6%) |
| 15 to 19 Years | 10 (3.8%) | 21 (6.2%) |
| 20 to 24 Years | 33 (12.4%) | 13 (3.9%) |
| 25 to 29 Years | 6 (2.3%) | 13 (3.9%) |
| 30 to 34 Years | 17 (6.4%) | 9 (2.7%) |
| 35 to 39 Years | 12 (4.5%) | 17 (5.1%) |
| 40 to 44 Years | 16 (6.0%) | 16 (4.8%) |
| 45 to 49 Years | 3 (1.1%) | 6 (1.8%) |
| 50 to 54 Years | 25 (9.4%) | 30 (8.9%) |
| 55 to 59 Years | 10 (3.8%) | 6 (1.8%) |
| 60 to 64 Years | 39 (14.7%) | 26 (7.7%) |
| 65 to 69 Years | 13 (4.9%) | 7 (2.1%) |
| 70 to 74 Years | 11 (4.1%) | 22 (6.6%) |
| 75 to 79 Years | 16 (6.0%) | 19 (5.7%) |
| 80 to 84 Years | 25 (9.4%) | 23 (6.9%) |
| 85 Years and over | 8 (3.0%) | 60 (17.9%) |
| Total | 266 (100.0%) | 336 (100.0%) |
Families and Households in Hendricks
Median Family Size in Hendricks
The median family size in Hendricks is 2.46 persons per family, with single female/mother families (43 | 28.1%) accounting for the largest median family size of 2.65 persons per family. On the other hand, single male/father families (4 | 2.6%) represent the smallest median family size with 2.00 persons per family.
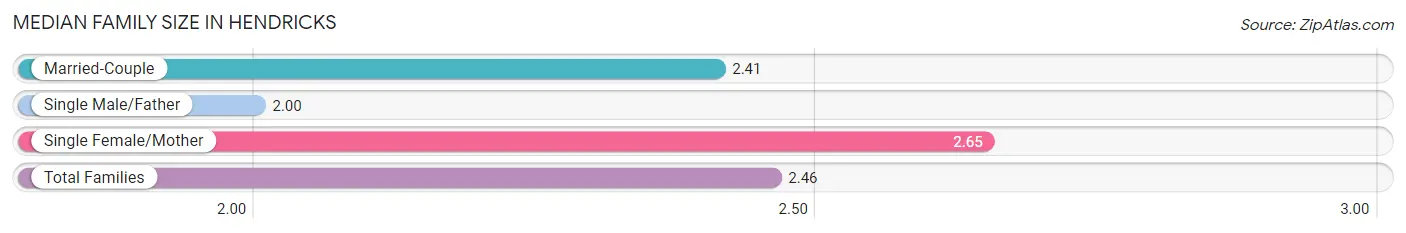
| Family Type | # Families | Family Size |
| Married-Couple | 106 (69.3%) | 2.41 |
| Single Male/Father | 4 (2.6%) | 2.00 |
| Single Female/Mother | 43 (28.1%) | 2.65 |
| Total Families | 153 (100.0%) | 2.46 |
Median Household Size in Hendricks
The median household size in Hendricks is 1.77 persons per household, with single female/mother households (43 | 13.8%) accounting for the largest median household size of 2.79 persons per household. non-family households (159 | 51.0%) represent the smallest median household size with 1.04 persons per household.
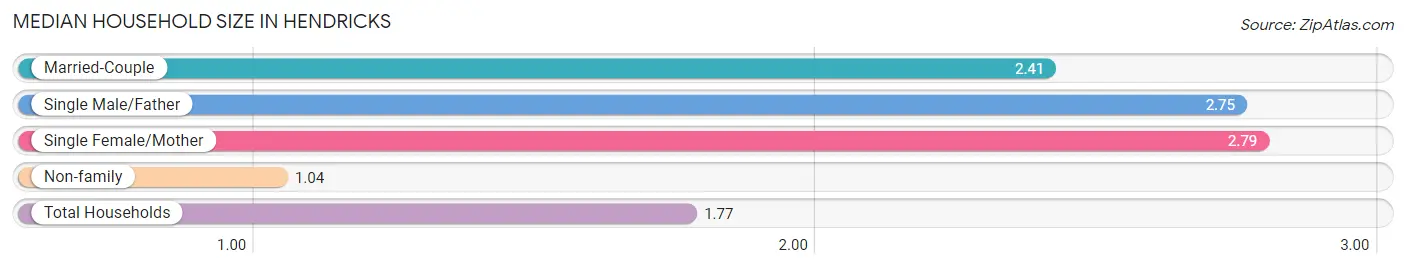
| Household Type | # Households | Household Size |
| Married-Couple | 106 (34.0%) | 2.41 |
| Single Male/Father | 4 (1.3%) | 2.75 |
| Single Female/Mother | 43 (13.8%) | 2.79 |
| Non-family | 159 (51.0%) | 1.04 |
| Total Households | 312 (100.0%) | 1.77 |
Household Size by Marriage Status in Hendricks
Out of a total of 312 households in Hendricks, 153 (49.0%) are family households, while 159 (51.0%) are nonfamily households. The most numerous type of family households are 2-person households, comprising 90, and the most common type of nonfamily households are 1-person households, comprising 150.
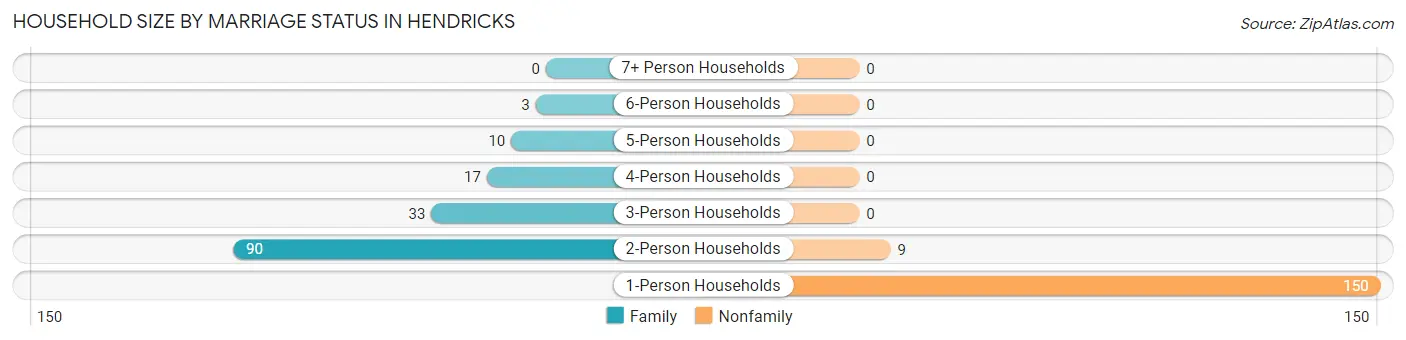
| Household Size | Family Households | Nonfamily Households |
| 1-Person Households | - | 150 (48.1%) |
| 2-Person Households | 90 (28.8%) | 9 (2.9%) |
| 3-Person Households | 33 (10.6%) | 0 (0.0%) |
| 4-Person Households | 17 (5.4%) | 0 (0.0%) |
| 5-Person Households | 10 (3.2%) | 0 (0.0%) |
| 6-Person Households | 3 (1.0%) | 0 (0.0%) |
| 7+ Person Households | 0 (0.0%) | 0 (0.0%) |
| Total | 153 (49.0%) | 159 (51.0%) |
Female Fertility in Hendricks
Fertility by Age in Hendricks
Average fertility rate in Hendricks is 97.0 births per 1,000 women. Women in the age bracket of 20 to 34 years have the highest fertility rate with 314.0 births per 1,000 women. Women in the age bracket of 20 to 34 years acount for 100.0% of all women with births.
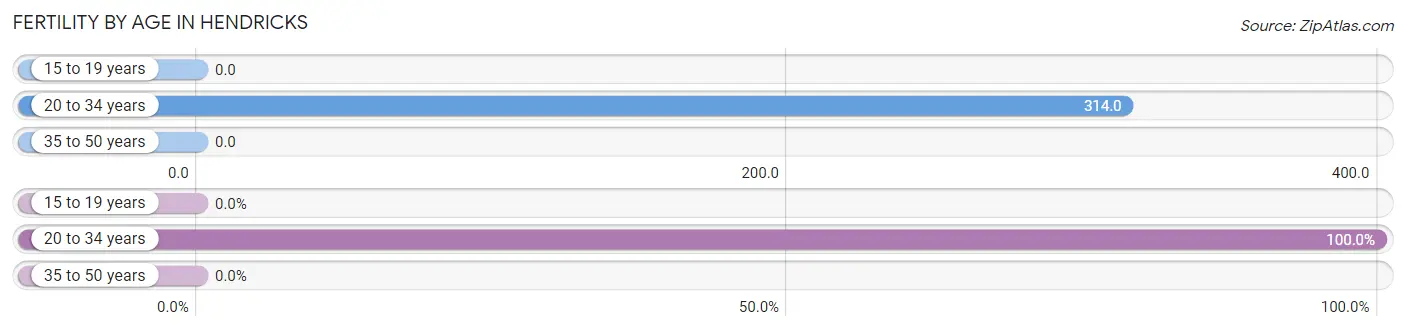
| Age Bracket | Women with Births | Births / 1,000 Women |
| 15 to 19 years | 0 (0.0%) | 0.0 |
| 20 to 34 years | 11 (100.0%) | 314.0 |
| 35 to 50 years | 0 (0.0%) | 0.0 |
| Total | 11 (100.0%) | 97.0 |
Fertility by Age by Marriage Status in Hendricks
63.6% of women with births (11) in Hendricks are married. The highest percentage of unmarried women with births falls into 20 to 34 years age bracket with 36.4% of them unmarried at the time of birth, while the lowest percentage of unmarried women with births belong to 20 to 34 years age bracket with 36.4% of them unmarried.
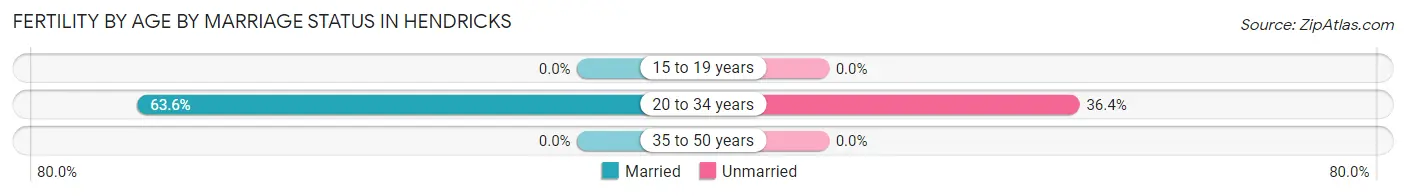
| Age Bracket | Married | Unmarried |
| 15 to 19 years | 0 (0.0%) | 0 (0.0%) |
| 20 to 34 years | 7 (63.6%) | 4 (36.4%) |
| 35 to 50 years | 0 (0.0%) | 0 (0.0%) |
| Total | 7 (63.6%) | 4 (36.4%) |
Fertility by Education in Hendricks
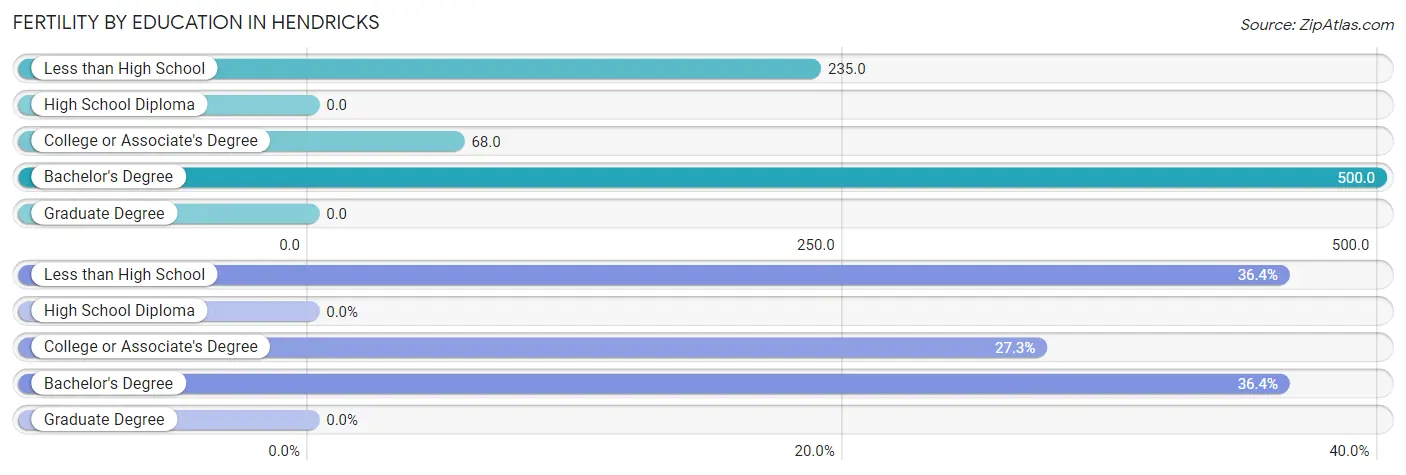
| Educational Attainment | Women with Births | Births / 1,000 Women |
| Less than High School | 4 (36.4%) | 235.0 |
| High School Diploma | 0 (0.0%) | 0.0 |
| College or Associate's Degree | 3 (27.3%) | 68.0 |
| Bachelor's Degree | 4 (36.4%) | 500.0 |
| Graduate Degree | 0 (0.0%) | 0.0 |
| Total | 11 (100.0%) | 97.0 |
Fertility by Education by Marriage Status in Hendricks
36.4% of women with births in Hendricks are unmarried. Women with the educational attainment of college or associate's degree are most likely to be married with 100.0% of them married at childbirth, while women with the educational attainment of less than high school are least likely to be married with 100.0% of them unmarried at childbirth.
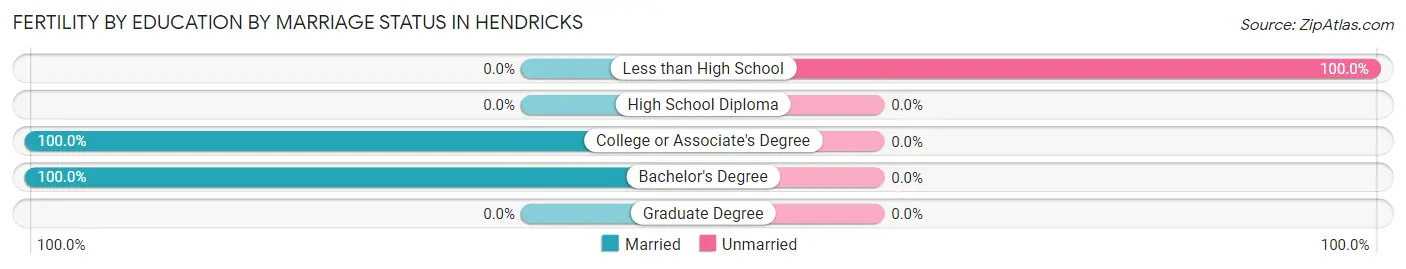
| Educational Attainment | Married | Unmarried |
| Less than High School | 0 (0.0%) | 4 (100.0%) |
| High School Diploma | 0 (0.0%) | 0 (0.0%) |
| College or Associate's Degree | 3 (100.0%) | 0 (0.0%) |
| Bachelor's Degree | 4 (100.0%) | 0 (0.0%) |
| Graduate Degree | 0 (0.0%) | 0 (0.0%) |
| Total | 7 (63.6%) | 4 (36.4%) |
Employment Characteristics in Hendricks
Employment by Class of Employer in Hendricks
Among the 256 employed individuals in Hendricks, private company employees (171 | 66.8%), not-for-profit organizations (23 | 9.0%), and local government employees (22 | 8.6%) make up the most common classes of employment.
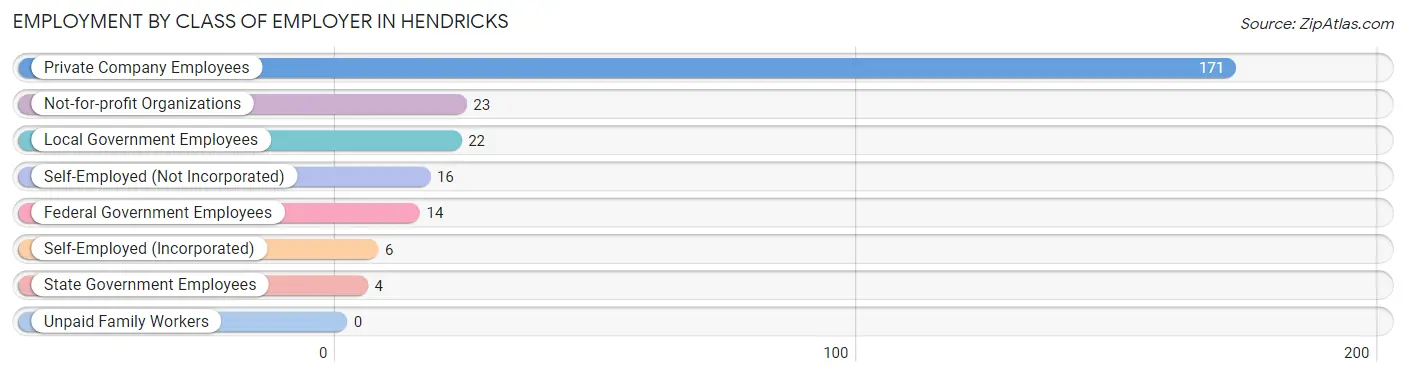
| Employer Class | # Employees | % Employees |
| Private Company Employees | 171 | 66.8% |
| Self-Employed (Incorporated) | 6 | 2.3% |
| Self-Employed (Not Incorporated) | 16 | 6.2% |
| Not-for-profit Organizations | 23 | 9.0% |
| Local Government Employees | 22 | 8.6% |
| State Government Employees | 4 | 1.6% |
| Federal Government Employees | 14 | 5.5% |
| Unpaid Family Workers | 0 | 0.0% |
| Total | 256 | 100.0% |
Employment Status by Age in Hendricks
According to the labor force statistics for Hendricks, out of the total population over 16 years of age (532), 51.1% or 272 individuals are in the labor force, with 3.7% or 10 of them unemployed. The age group with the highest labor force participation rate is 25 to 29 years, with 100.0% or 19 individuals in the labor force. Within the labor force, the 55 to 59 years age range has the highest percentage of unemployed individuals, with 21.4% or 3 of them being unemployed.
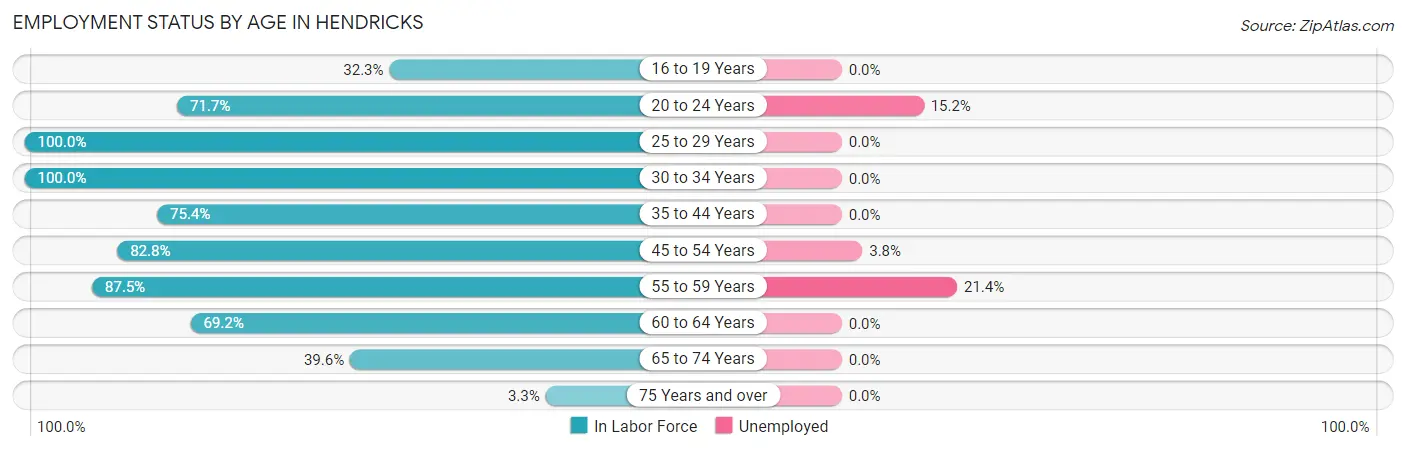
| Age Bracket | In Labor Force | Unemployed |
| 16 to 19 Years | 10 (32.3%) | 0 (0.0%) |
| 20 to 24 Years | 33 (71.7%) | 5 (15.2%) |
| 25 to 29 Years | 19 (100.0%) | 0 (0.0%) |
| 30 to 34 Years | 26 (100.0%) | 0 (0.0%) |
| 35 to 44 Years | 46 (75.4%) | 0 (0.0%) |
| 45 to 54 Years | 53 (82.8%) | 2 (3.8%) |
| 55 to 59 Years | 14 (87.5%) | 3 (21.4%) |
| 60 to 64 Years | 45 (69.2%) | 0 (0.0%) |
| 65 to 74 Years | 21 (39.6%) | 0 (0.0%) |
| 75 Years and over | 5 (3.3%) | 0 (0.0%) |
| Total | 272 (51.1%) | 10 (3.7%) |
Employment Status by Educational Attainment in Hendricks
According to labor force statistics for Hendricks, 80.9% of individuals (203) out of the total population between 25 and 64 years of age (251) are in the labor force, with 2.5% or 5 of them being unemployed. The group with the highest labor force participation rate are those with the educational attainment of college / associate degree, with 86.8% or 79 individuals in the labor force. Within the labor force, individuals with high school diploma education have the highest percentage of unemployment, with 4.8% or 3 of them being unemployed.
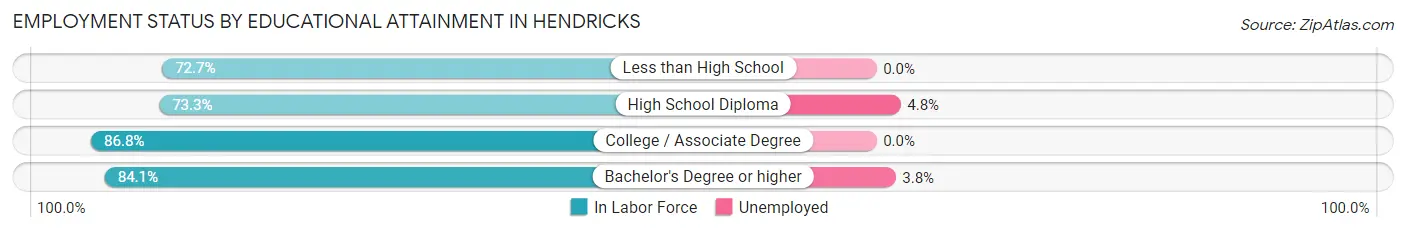
| Educational Attainment | In Labor Force | Unemployed |
| Less than High School | 8 (72.7%) | 0 (0.0%) |
| High School Diploma | 63 (73.3%) | 4 (4.8%) |
| College / Associate Degree | 79 (86.8%) | 0 (0.0%) |
| Bachelor's Degree or higher | 53 (84.1%) | 2 (3.8%) |
| Total | 203 (80.9%) | 6 (2.5%) |
Employment Occupations by Sex in Hendricks
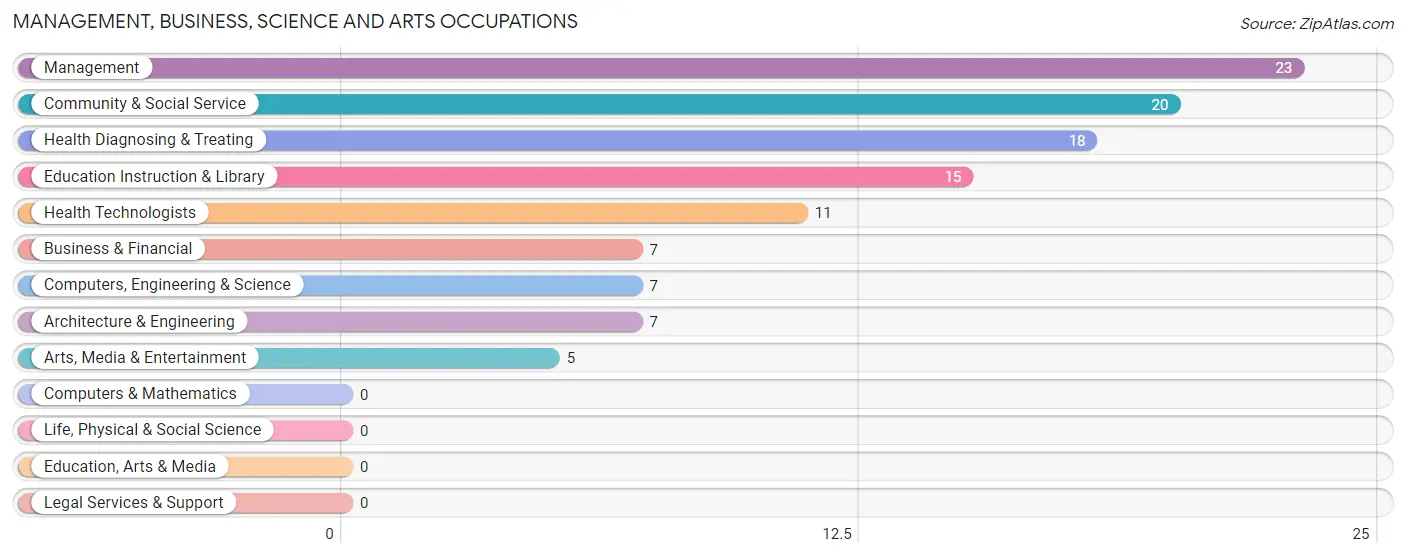
Management, Business, Science and Arts Occupations
The most common Management, Business, Science and Arts occupations in Hendricks are Management (23 | 8.8%), Community & Social Service (20 | 7.6%), Health Diagnosing & Treating (18 | 6.9%), Education Instruction & Library (15 | 5.7%), and Health Technologists (11 | 4.2%).
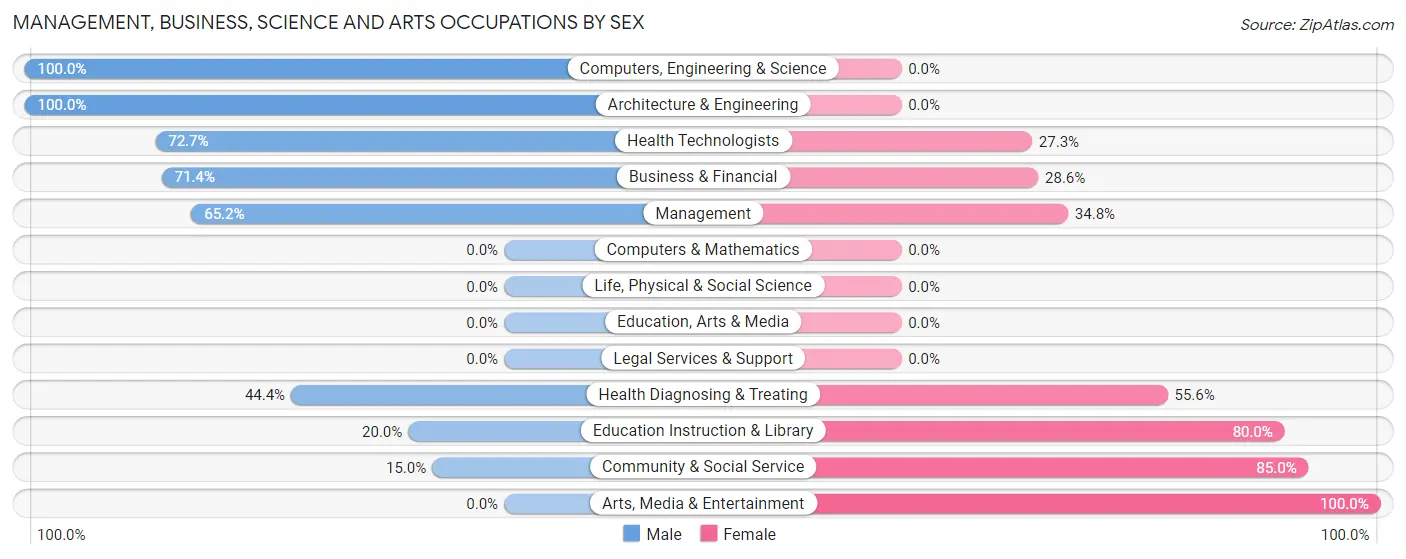
Management, Business, Science and Arts Occupations by Sex
Within the Management, Business, Science and Arts occupations in Hendricks, the most male-oriented occupations are Computers, Engineering & Science (100.0%), Architecture & Engineering (100.0%), and Health Technologists (72.7%), while the most female-oriented occupations are Arts, Media & Entertainment (100.0%), Community & Social Service (85.0%), and Education Instruction & Library (80.0%).
| Occupation | Male | Female |
| Management | 15 (65.2%) | 8 (34.8%) |
| Business & Financial | 5 (71.4%) | 2 (28.6%) |
| Computers, Engineering & Science | 7 (100.0%) | 0 (0.0%) |
| Computers & Mathematics | 0 (0.0%) | 0 (0.0%) |
| Architecture & Engineering | 7 (100.0%) | 0 (0.0%) |
| Life, Physical & Social Science | 0 (0.0%) | 0 (0.0%) |
| Community & Social Service | 3 (15.0%) | 17 (85.0%) |
| Education, Arts & Media | 0 (0.0%) | 0 (0.0%) |
| Legal Services & Support | 0 (0.0%) | 0 (0.0%) |
| Education Instruction & Library | 3 (20.0%) | 12 (80.0%) |
| Arts, Media & Entertainment | 0 (0.0%) | 5 (100.0%) |
| Health Diagnosing & Treating | 8 (44.4%) | 10 (55.6%) |
| Health Technologists | 8 (72.7%) | 3 (27.3%) |
| Total (Category) | 38 (50.7%) | 37 (49.3%) |
| Total (Overall) | 141 (53.8%) | 121 (46.2%) |
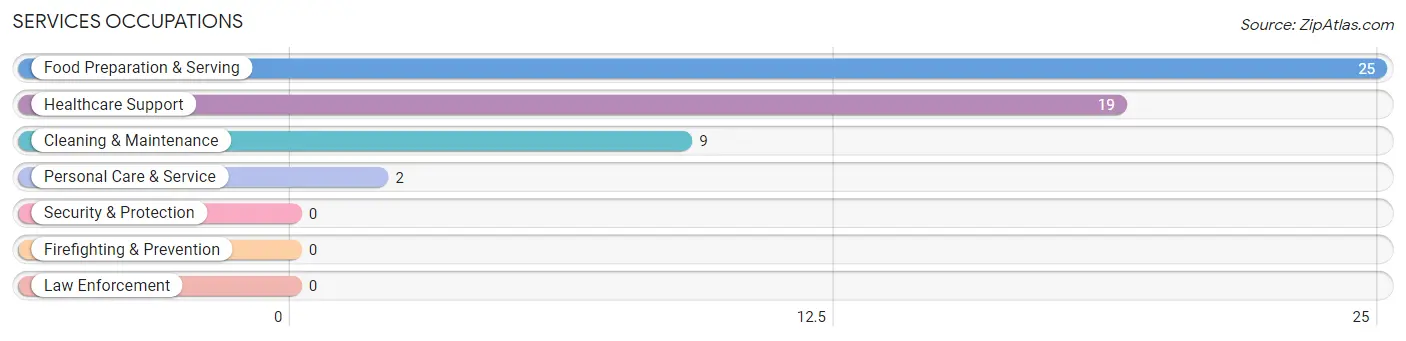
Services Occupations
The most common Services occupations in Hendricks are Food Preparation & Serving (25 | 9.5%), Healthcare Support (19 | 7.2%), Cleaning & Maintenance (9 | 3.4%), and Personal Care & Service (2 | 0.8%).
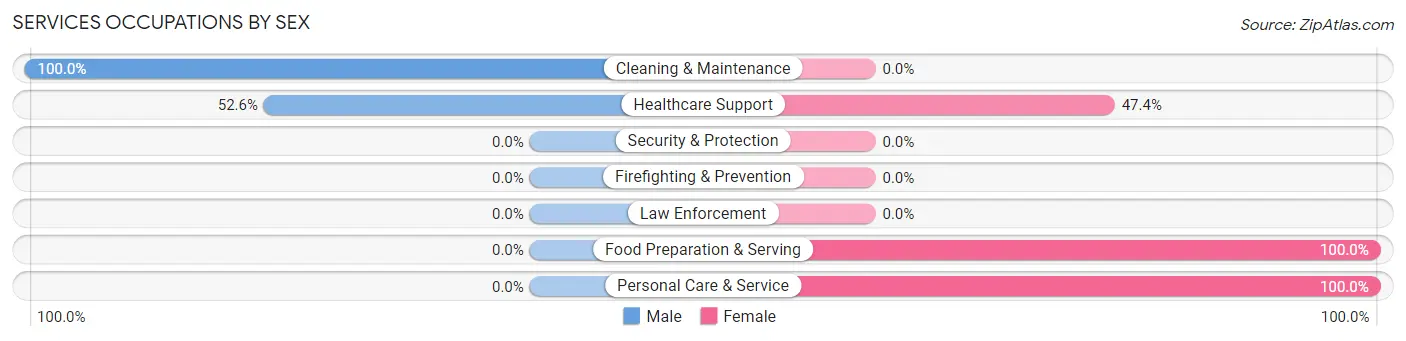
Services Occupations by Sex
Within the Services occupations in Hendricks, the most male-oriented occupations are Cleaning & Maintenance (100.0%), and Healthcare Support (52.6%), while the most female-oriented occupations are Food Preparation & Serving (100.0%), Personal Care & Service (100.0%), and Healthcare Support (47.4%).
| Occupation | Male | Female |
| Healthcare Support | 10 (52.6%) | 9 (47.4%) |
| Security & Protection | 0 (0.0%) | 0 (0.0%) |
| Firefighting & Prevention | 0 (0.0%) | 0 (0.0%) |
| Law Enforcement | 0 (0.0%) | 0 (0.0%) |
| Food Preparation & Serving | 0 (0.0%) | 25 (100.0%) |
| Cleaning & Maintenance | 9 (100.0%) | 0 (0.0%) |
| Personal Care & Service | 0 (0.0%) | 2 (100.0%) |
| Total (Category) | 19 (34.5%) | 36 (65.4%) |
| Total (Overall) | 141 (53.8%) | 121 (46.2%) |
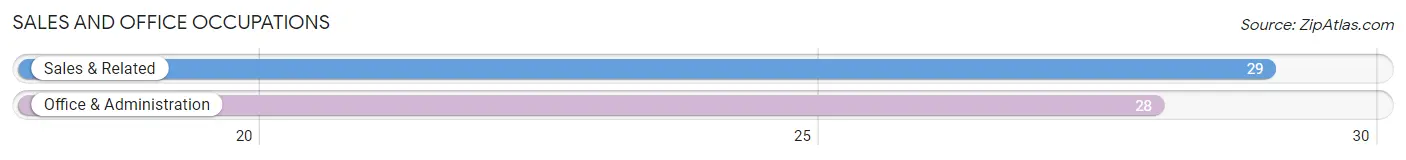
Sales and Office Occupations
The most common Sales and Office occupations in Hendricks are Sales & Related (29 | 11.1%), and Office & Administration (28 | 10.7%).
Sales and Office Occupations by Sex
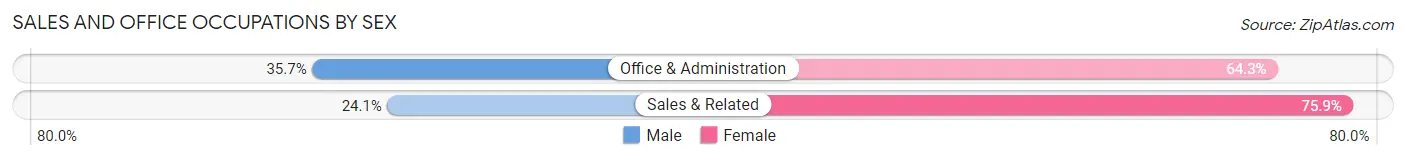
| Occupation | Male | Female |
| Sales & Related | 7 (24.1%) | 22 (75.9%) |
| Office & Administration | 10 (35.7%) | 18 (64.3%) |
| Total (Category) | 17 (29.8%) | 40 (70.2%) |
| Total (Overall) | 141 (53.8%) | 121 (46.2%) |
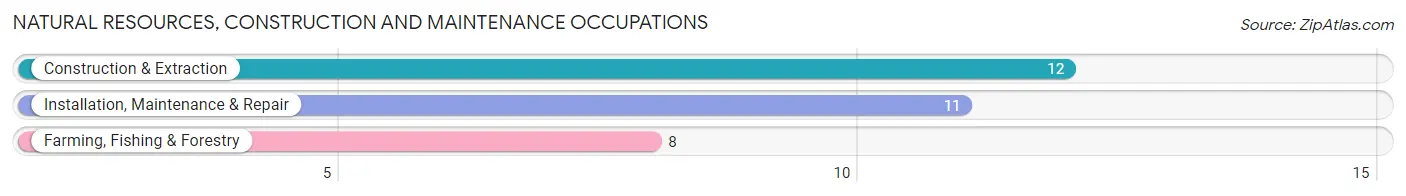
Natural Resources, Construction and Maintenance Occupations
The most common Natural Resources, Construction and Maintenance occupations in Hendricks are Construction & Extraction (12 | 4.6%), Installation, Maintenance & Repair (11 | 4.2%), and Farming, Fishing & Forestry (8 | 3.0%).
Natural Resources, Construction and Maintenance Occupations by Sex
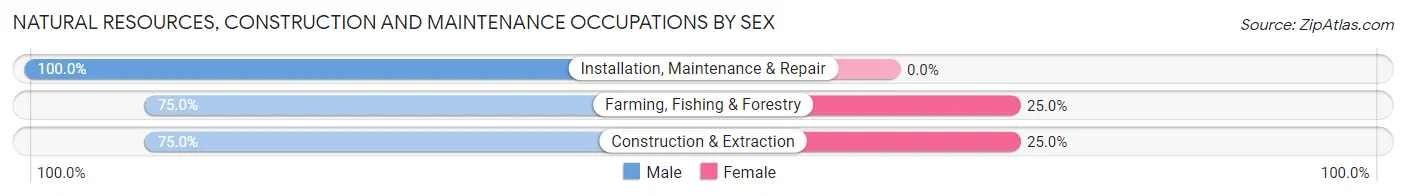
| Occupation | Male | Female |
| Farming, Fishing & Forestry | 6 (75.0%) | 2 (25.0%) |
| Construction & Extraction | 9 (75.0%) | 3 (25.0%) |
| Installation, Maintenance & Repair | 11 (100.0%) | 0 (0.0%) |
| Total (Category) | 26 (83.9%) | 5 (16.1%) |
| Total (Overall) | 141 (53.8%) | 121 (46.2%) |
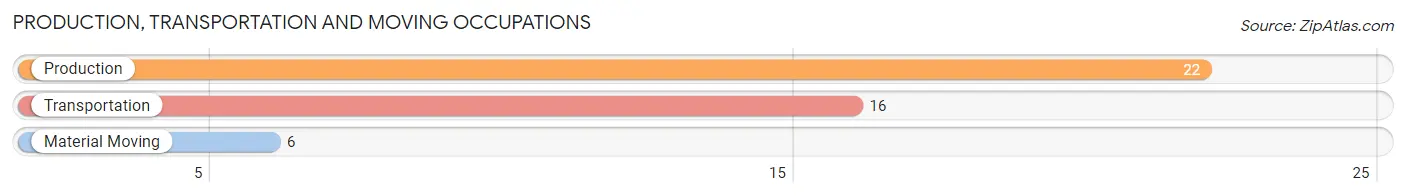
Production, Transportation and Moving Occupations
The most common Production, Transportation and Moving occupations in Hendricks are Production (22 | 8.4%), Transportation (16 | 6.1%), and Material Moving (6 | 2.3%).
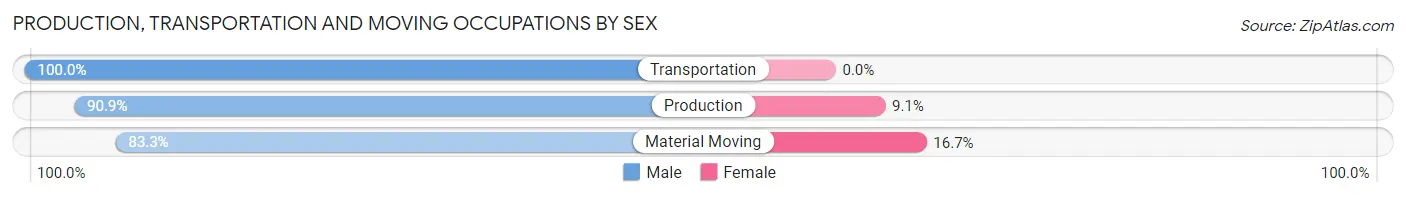
Production, Transportation and Moving Occupations by Sex
| Occupation | Male | Female |
| Production | 20 (90.9%) | 2 (9.1%) |
| Transportation | 16 (100.0%) | 0 (0.0%) |
| Material Moving | 5 (83.3%) | 1 (16.7%) |
| Total (Category) | 41 (93.2%) | 3 (6.8%) |
| Total (Overall) | 141 (53.8%) | 121 (46.2%) |
Employment Industries by Sex in Hendricks
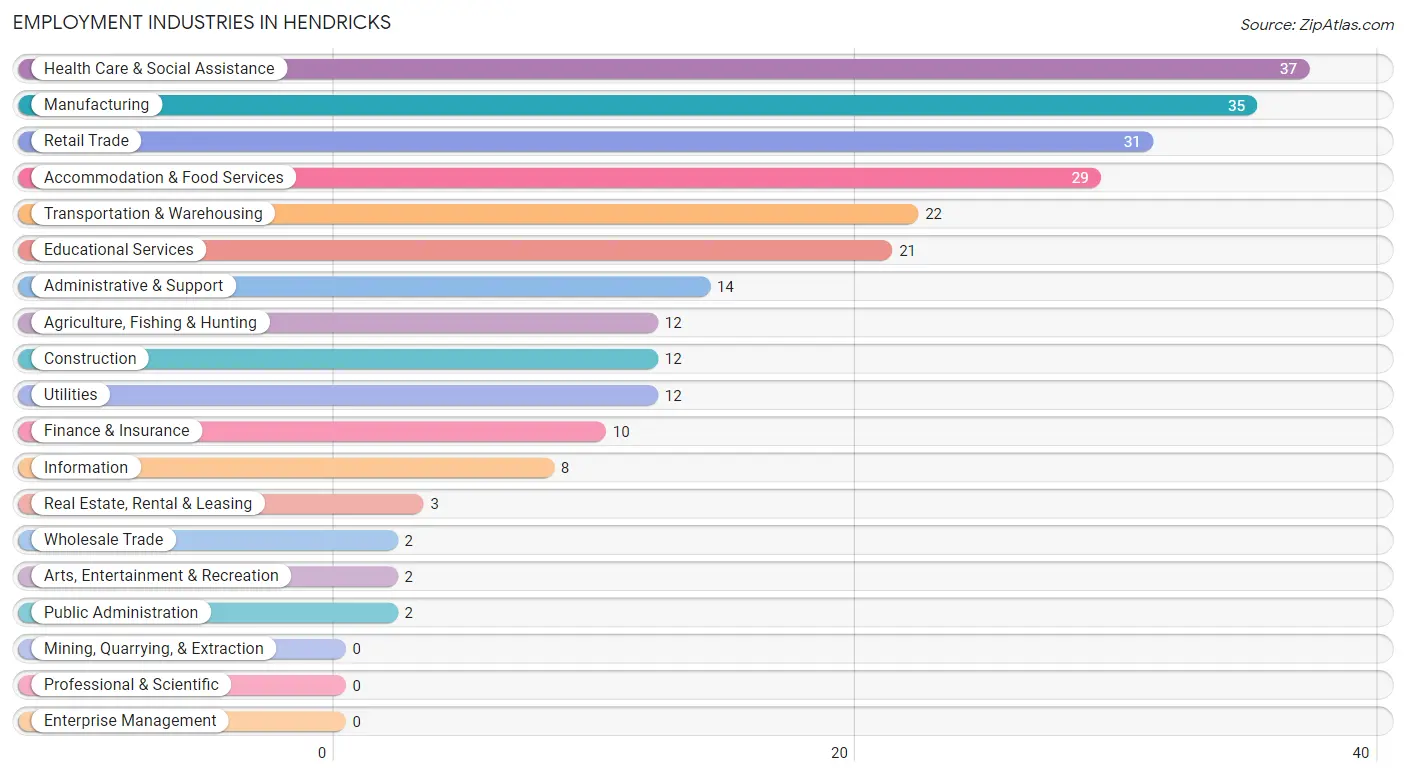
Employment Industries in Hendricks
The major employment industries in Hendricks include Health Care & Social Assistance (37 | 14.1%), Manufacturing (35 | 13.4%), Retail Trade (31 | 11.8%), Accommodation & Food Services (29 | 11.1%), and Transportation & Warehousing (22 | 8.4%).
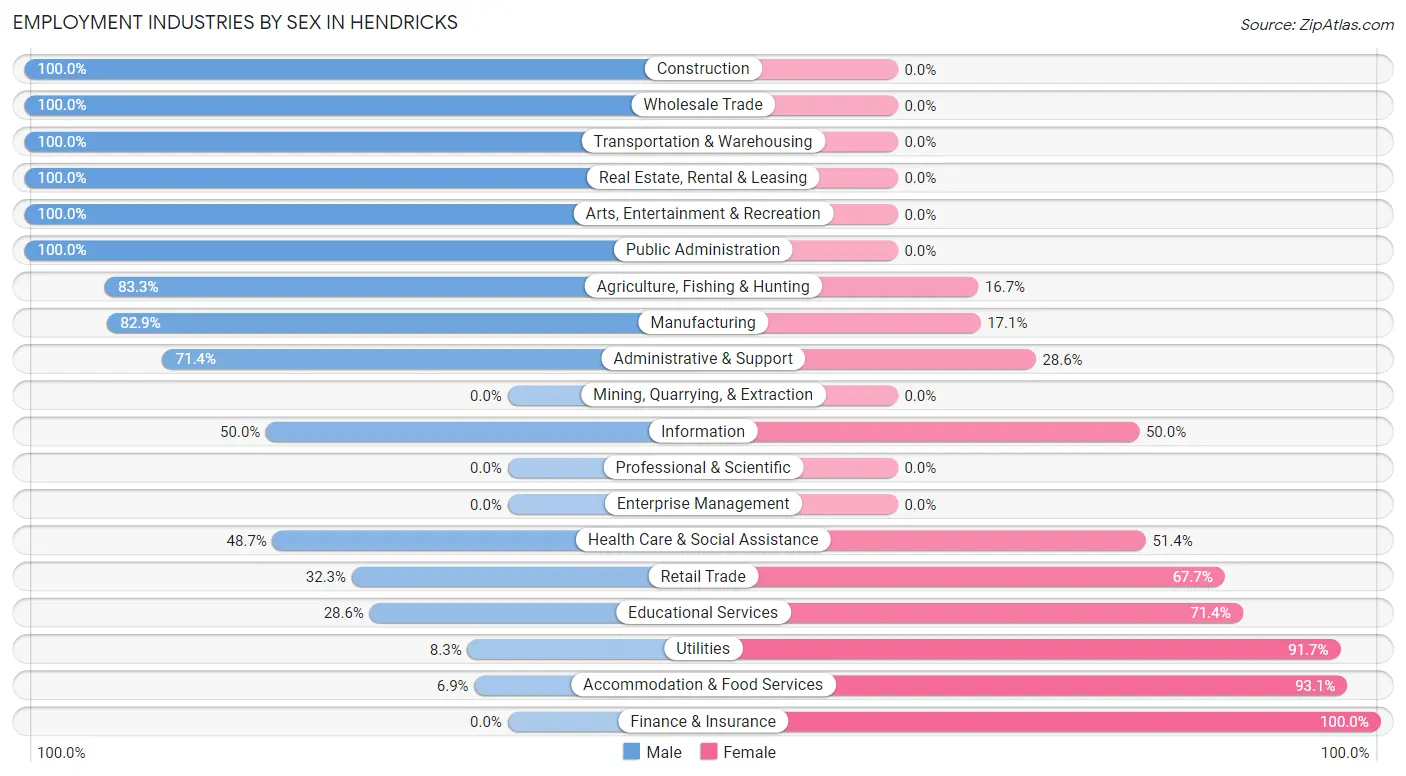
Employment Industries by Sex in Hendricks
The Hendricks industries that see more men than women are Construction (100.0%), Wholesale Trade (100.0%), and Transportation & Warehousing (100.0%), whereas the industries that tend to have a higher number of women are Finance & Insurance (100.0%), Accommodation & Food Services (93.1%), and Utilities (91.7%).
| Industry | Male | Female |
| Agriculture, Fishing & Hunting | 10 (83.3%) | 2 (16.7%) |
| Mining, Quarrying, & Extraction | 0 (0.0%) | 0 (0.0%) |
| Construction | 12 (100.0%) | 0 (0.0%) |
| Manufacturing | 29 (82.9%) | 6 (17.1%) |
| Wholesale Trade | 2 (100.0%) | 0 (0.0%) |
| Retail Trade | 10 (32.3%) | 21 (67.7%) |
| Transportation & Warehousing | 22 (100.0%) | 0 (0.0%) |
| Utilities | 1 (8.3%) | 11 (91.7%) |
| Information | 4 (50.0%) | 4 (50.0%) |
| Finance & Insurance | 0 (0.0%) | 10 (100.0%) |
| Real Estate, Rental & Leasing | 3 (100.0%) | 0 (0.0%) |
| Professional & Scientific | 0 (0.0%) | 0 (0.0%) |
| Enterprise Management | 0 (0.0%) | 0 (0.0%) |
| Administrative & Support | 10 (71.4%) | 4 (28.6%) |
| Educational Services | 6 (28.6%) | 15 (71.4%) |
| Health Care & Social Assistance | 18 (48.6%) | 19 (51.3%) |
| Arts, Entertainment & Recreation | 2 (100.0%) | 0 (0.0%) |
| Accommodation & Food Services | 2 (6.9%) | 27 (93.1%) |
| Public Administration | 2 (100.0%) | 0 (0.0%) |
| Total | 141 (53.8%) | 121 (46.2%) |
Education in Hendricks
School Enrollment in Hendricks
The most common levels of schooling among the 103 students in Hendricks are middle school (36 | 34.9%), high school (21 | 20.4%), and college / undergraduate (17 | 16.5%).
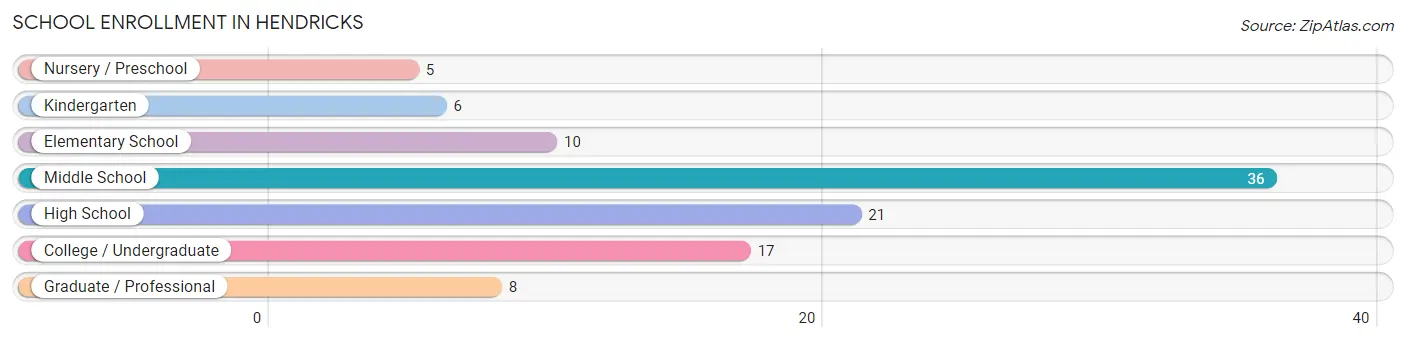
| School Level | # Students | % Students |
| Nursery / Preschool | 5 | 4.9% |
| Kindergarten | 6 | 5.8% |
| Elementary School | 10 | 9.7% |
| Middle School | 36 | 34.9% |
| High School | 21 | 20.4% |
| College / Undergraduate | 17 | 16.5% |
| Graduate / Professional | 8 | 7.8% |
| Total | 103 | 100.0% |
School Enrollment by Age by Funding Source in Hendricks
Out of a total of 103 students who are enrolled in schools in Hendricks, 9 (8.7%) attend a private institution, while the remaining 94 (91.3%) are enrolled in public schools. The age group of 25 to 34 year olds has the highest likelihood of being enrolled in private schools, with 6 (60.0% in the age bracket) enrolled. Conversely, the age group of 3 to 4 year olds has the lowest likelihood of being enrolled in a private school, with 2 (100.0% in the age bracket) attending a public institution.
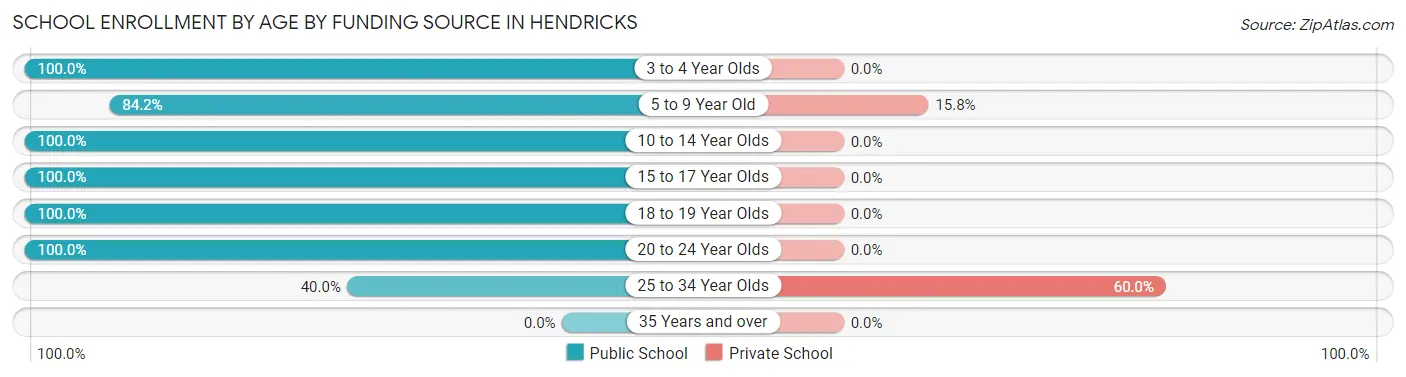
| Age Bracket | Public School | Private School |
| 3 to 4 Year Olds | 2 (100.0%) | 0 (0.0%) |
| 5 to 9 Year Old | 16 (84.2%) | 3 (15.8%) |
| 10 to 14 Year Olds | 36 (100.0%) | 0 (0.0%) |
| 15 to 17 Year Olds | 19 (100.0%) | 0 (0.0%) |
| 18 to 19 Year Olds | 12 (100.0%) | 0 (0.0%) |
| 20 to 24 Year Olds | 5 (100.0%) | 0 (0.0%) |
| 25 to 34 Year Olds | 4 (40.0%) | 6 (60.0%) |
| 35 Years and over | 0 (0.0%) | 0 (0.0%) |
| Total | 94 (91.3%) | 9 (8.7%) |
Educational Attainment by Field of Study in Hendricks
Education (29 | 31.9%), business (15 | 16.5%), science & technology (10 | 11.0%), bio, nature & agricultural (9 | 9.9%), and physical & health sciences (5 | 5.5%) are the most common fields of study among 91 individuals in Hendricks who have obtained a bachelor's degree or higher.
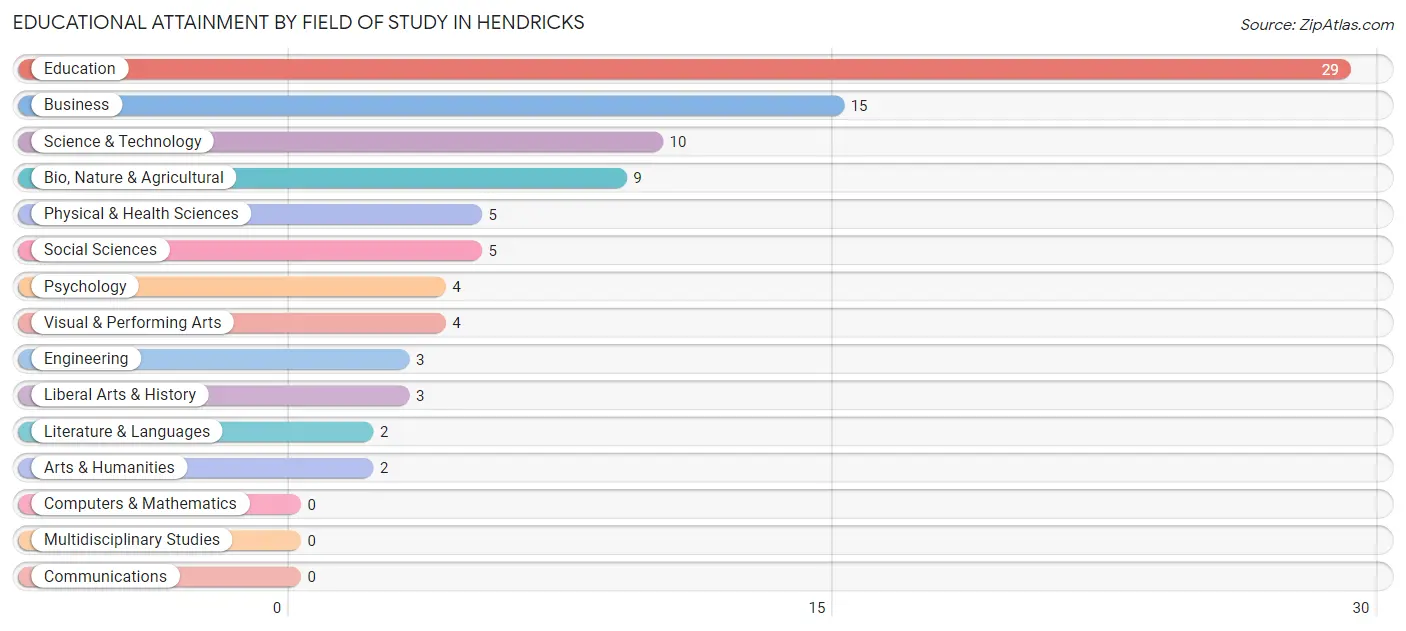
| Field of Study | # Graduates | % Graduates |
| Computers & Mathematics | 0 | 0.0% |
| Bio, Nature & Agricultural | 9 | 9.9% |
| Physical & Health Sciences | 5 | 5.5% |
| Psychology | 4 | 4.4% |
| Social Sciences | 5 | 5.5% |
| Engineering | 3 | 3.3% |
| Multidisciplinary Studies | 0 | 0.0% |
| Science & Technology | 10 | 11.0% |
| Business | 15 | 16.5% |
| Education | 29 | 31.9% |
| Literature & Languages | 2 | 2.2% |
| Liberal Arts & History | 3 | 3.3% |
| Visual & Performing Arts | 4 | 4.4% |
| Communications | 0 | 0.0% |
| Arts & Humanities | 2 | 2.2% |
| Total | 91 | 100.0% |
Transportation & Commute in Hendricks
Vehicle Availability by Sex in Hendricks
The most prevalent vehicle ownership categories in Hendricks are males with 2 vehicles (43, accounting for 30.5%) and females with 2 vehicles (41, making up 37.4%).
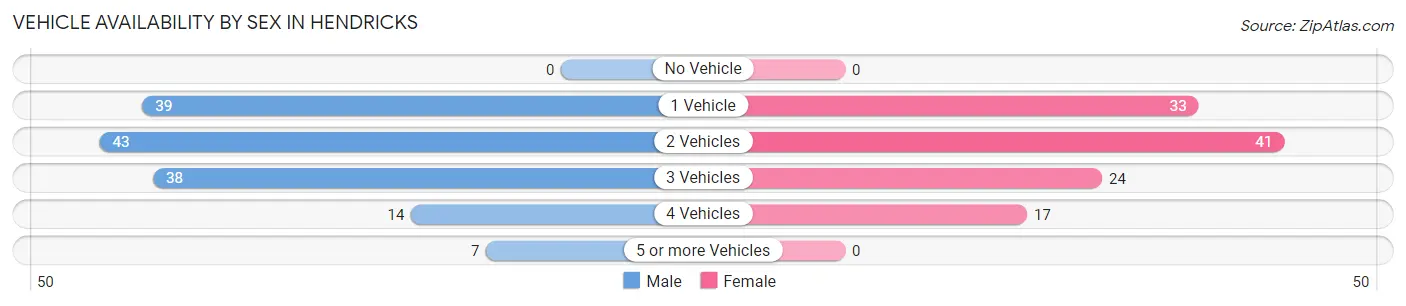
| Vehicles Available | Male | Female |
| No Vehicle | 0 (0.0%) | 0 (0.0%) |
| 1 Vehicle | 39 (27.7%) | 33 (28.7%) |
| 2 Vehicles | 43 (30.5%) | 41 (35.6%) |
| 3 Vehicles | 38 (27.0%) | 24 (20.9%) |
| 4 Vehicles | 14 (9.9%) | 17 (14.8%) |
| 5 or more Vehicles | 7 (5.0%) | 0 (0.0%) |
| Total | 141 (100.0%) | 115 (100.0%) |
Commute Time in Hendricks
The most frequently occuring commute durations in Hendricks are 5 to 9 minutes (79 commuters, 32.2%), less than 5 minutes (53 commuters, 21.6%), and 30 to 34 minutes (33 commuters, 13.5%).
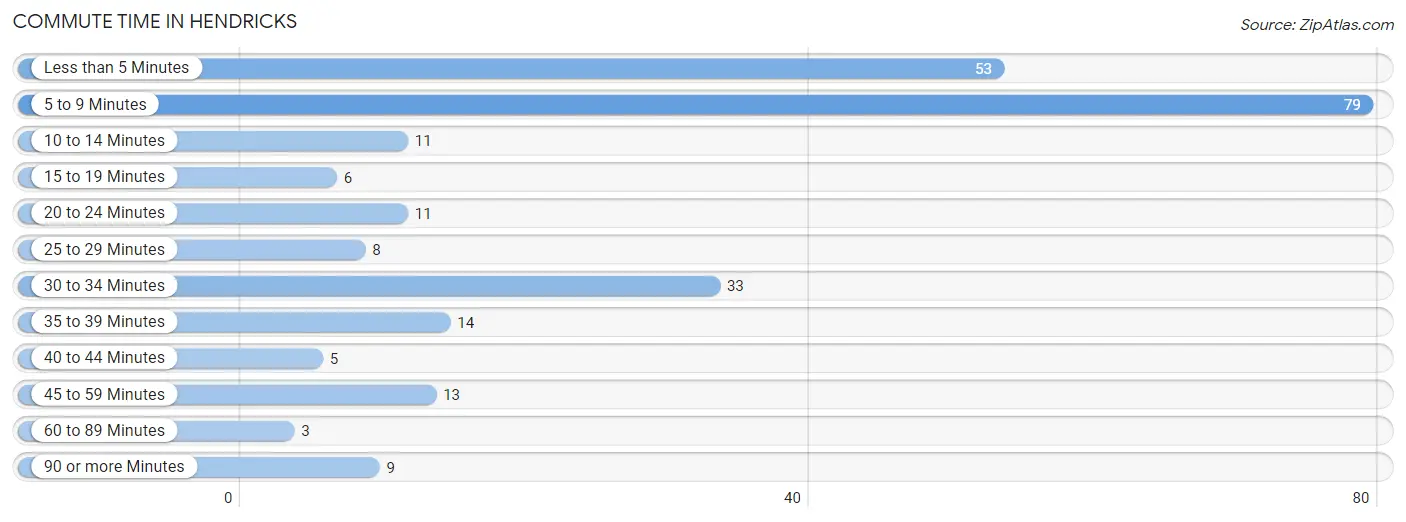
| Commute Time | # Commuters | % Commuters |
| Less than 5 Minutes | 53 | 21.6% |
| 5 to 9 Minutes | 79 | 32.2% |
| 10 to 14 Minutes | 11 | 4.5% |
| 15 to 19 Minutes | 6 | 2.5% |
| 20 to 24 Minutes | 11 | 4.5% |
| 25 to 29 Minutes | 8 | 3.3% |
| 30 to 34 Minutes | 33 | 13.5% |
| 35 to 39 Minutes | 14 | 5.7% |
| 40 to 44 Minutes | 5 | 2.0% |
| 45 to 59 Minutes | 13 | 5.3% |
| 60 to 89 Minutes | 3 | 1.2% |
| 90 or more Minutes | 9 | 3.7% |
Commute Time by Sex in Hendricks
The most common commute times in Hendricks are less than 5 minutes (37 commuters, 27.0%) for males and 5 to 9 minutes (48 commuters, 44.4%) for females.
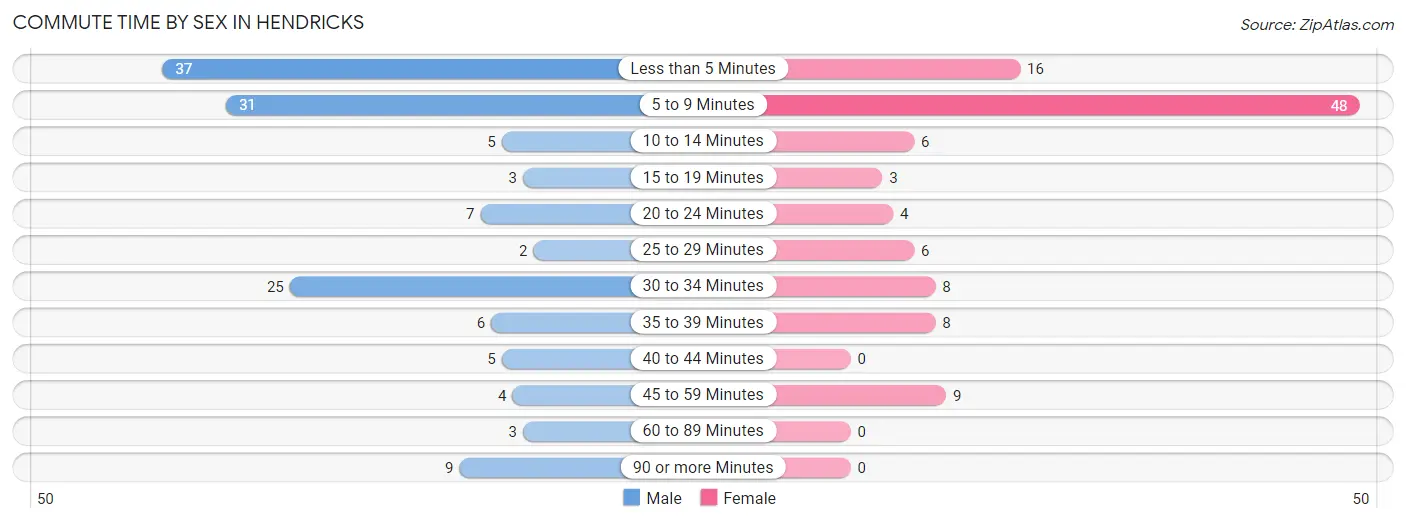
| Commute Time | Male | Female |
| Less than 5 Minutes | 37 (27.0%) | 16 (14.8%) |
| 5 to 9 Minutes | 31 (22.6%) | 48 (44.4%) |
| 10 to 14 Minutes | 5 (3.6%) | 6 (5.6%) |
| 15 to 19 Minutes | 3 (2.2%) | 3 (2.8%) |
| 20 to 24 Minutes | 7 (5.1%) | 4 (3.7%) |
| 25 to 29 Minutes | 2 (1.5%) | 6 (5.6%) |
| 30 to 34 Minutes | 25 (18.2%) | 8 (7.4%) |
| 35 to 39 Minutes | 6 (4.4%) | 8 (7.4%) |
| 40 to 44 Minutes | 5 (3.6%) | 0 (0.0%) |
| 45 to 59 Minutes | 4 (2.9%) | 9 (8.3%) |
| 60 to 89 Minutes | 3 (2.2%) | 0 (0.0%) |
| 90 or more Minutes | 9 (6.6%) | 0 (0.0%) |
Time of Departure to Work by Sex in Hendricks
The most frequent times of departure to work in Hendricks are 6:00 AM to 6:29 AM (28, 20.4%) for males and 4:00 PM to 11:59 PM (23, 21.3%) for females.
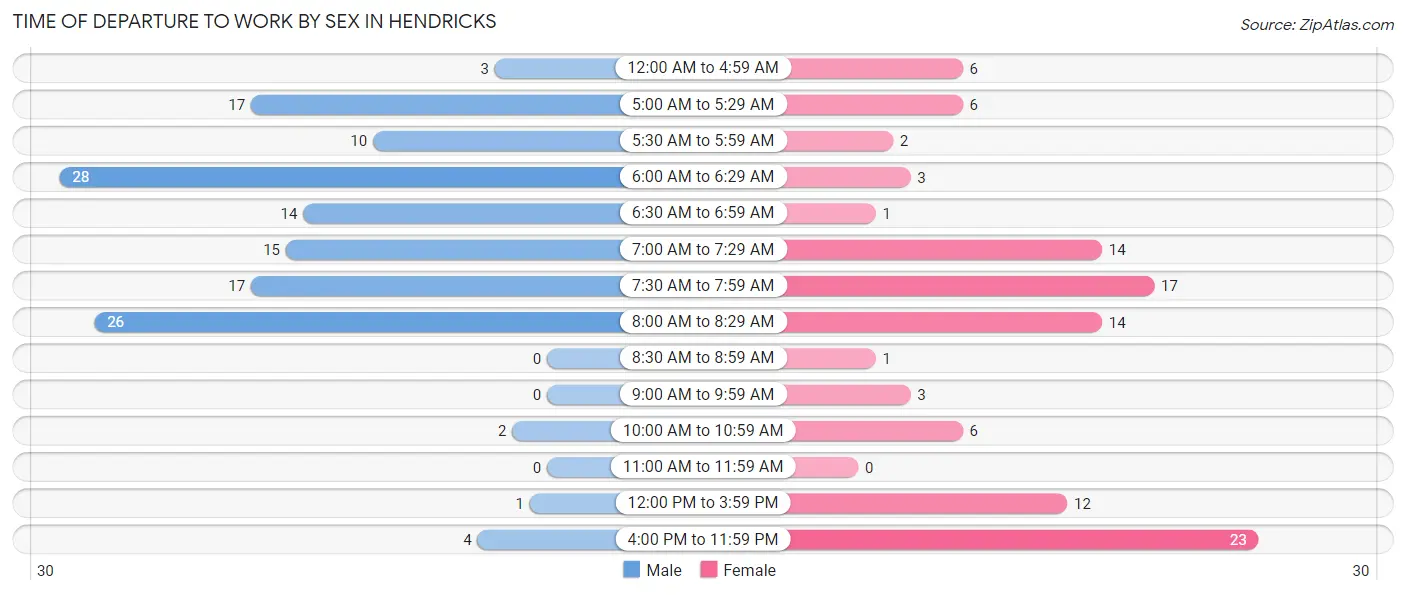
| Time of Departure | Male | Female |
| 12:00 AM to 4:59 AM | 3 (2.2%) | 6 (5.6%) |
| 5:00 AM to 5:29 AM | 17 (12.4%) | 6 (5.6%) |
| 5:30 AM to 5:59 AM | 10 (7.3%) | 2 (1.8%) |
| 6:00 AM to 6:29 AM | 28 (20.4%) | 3 (2.8%) |
| 6:30 AM to 6:59 AM | 14 (10.2%) | 1 (0.9%) |
| 7:00 AM to 7:29 AM | 15 (11.0%) | 14 (13.0%) |
| 7:30 AM to 7:59 AM | 17 (12.4%) | 17 (15.7%) |
| 8:00 AM to 8:29 AM | 26 (19.0%) | 14 (13.0%) |
| 8:30 AM to 8:59 AM | 0 (0.0%) | 1 (0.9%) |
| 9:00 AM to 9:59 AM | 0 (0.0%) | 3 (2.8%) |
| 10:00 AM to 10:59 AM | 2 (1.5%) | 6 (5.6%) |
| 11:00 AM to 11:59 AM | 0 (0.0%) | 0 (0.0%) |
| 12:00 PM to 3:59 PM | 1 (0.7%) | 12 (11.1%) |
| 4:00 PM to 11:59 PM | 4 (2.9%) | 23 (21.3%) |
| Total | 137 (100.0%) | 108 (100.0%) |
Housing Occupancy in Hendricks
Occupancy by Ownership in Hendricks
Of the total 312 dwellings in Hendricks, owner-occupied units account for 214 (68.6%), while renter-occupied units make up 98 (31.4%).
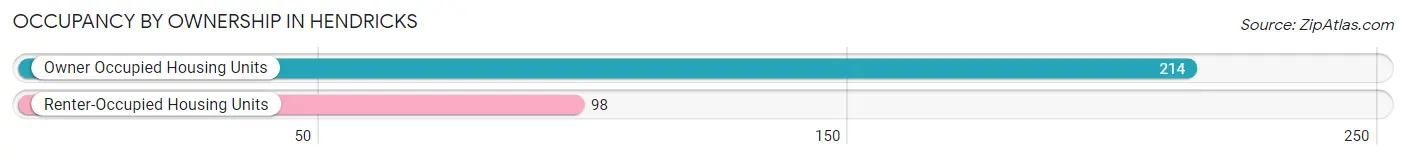
| Occupancy | # Housing Units | % Housing Units |
| Owner Occupied Housing Units | 214 | 68.6% |
| Renter-Occupied Housing Units | 98 | 31.4% |
| Total Occupied Housing Units | 312 | 100.0% |
Occupancy by Household Size in Hendricks
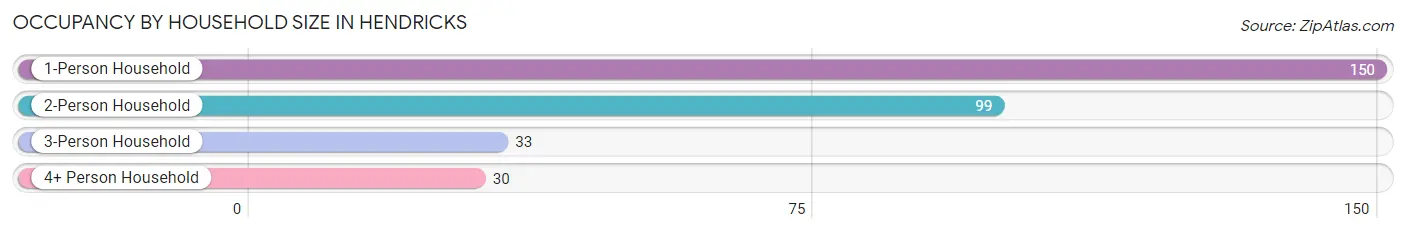
| Household Size | # Housing Units | % Housing Units |
| 1-Person Household | 150 | 48.1% |
| 2-Person Household | 99 | 31.7% |
| 3-Person Household | 33 | 10.6% |
| 4+ Person Household | 30 | 9.6% |
| Total Housing Units | 312 | 100.0% |
Occupancy by Ownership by Household Size in Hendricks
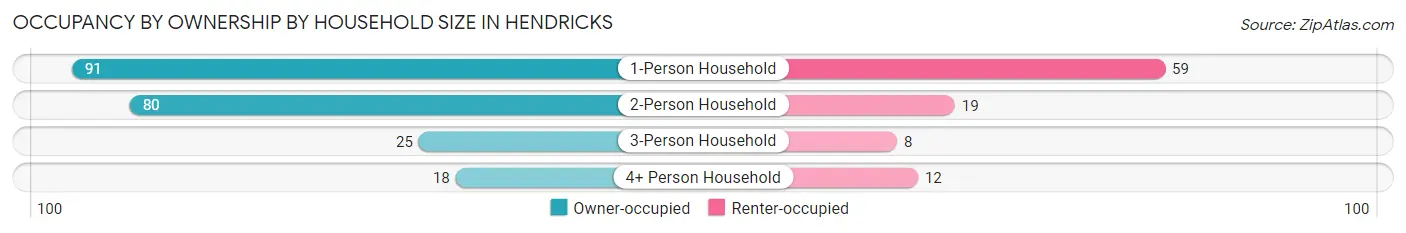
| Household Size | Owner-occupied | Renter-occupied |
| 1-Person Household | 91 (60.7%) | 59 (39.3%) |
| 2-Person Household | 80 (80.8%) | 19 (19.2%) |
| 3-Person Household | 25 (75.8%) | 8 (24.2%) |
| 4+ Person Household | 18 (60.0%) | 12 (40.0%) |
| Total Housing Units | 214 (68.6%) | 98 (31.4%) |
Occupancy by Educational Attainment in Hendricks
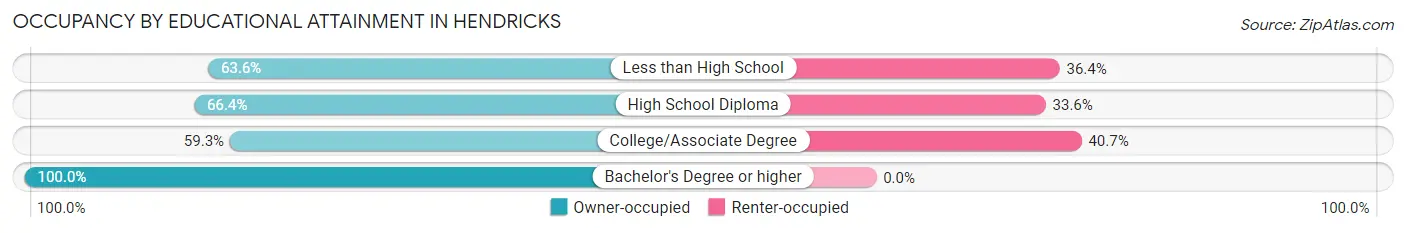
| Household Size | Owner-occupied | Renter-occupied |
| Less than High School | 14 (63.6%) | 8 (36.4%) |
| High School Diploma | 87 (66.4%) | 44 (33.6%) |
| College/Associate Degree | 67 (59.3%) | 46 (40.7%) |
| Bachelor's Degree or higher | 46 (100.0%) | 0 (0.0%) |
Occupancy by Age of Householder in Hendricks
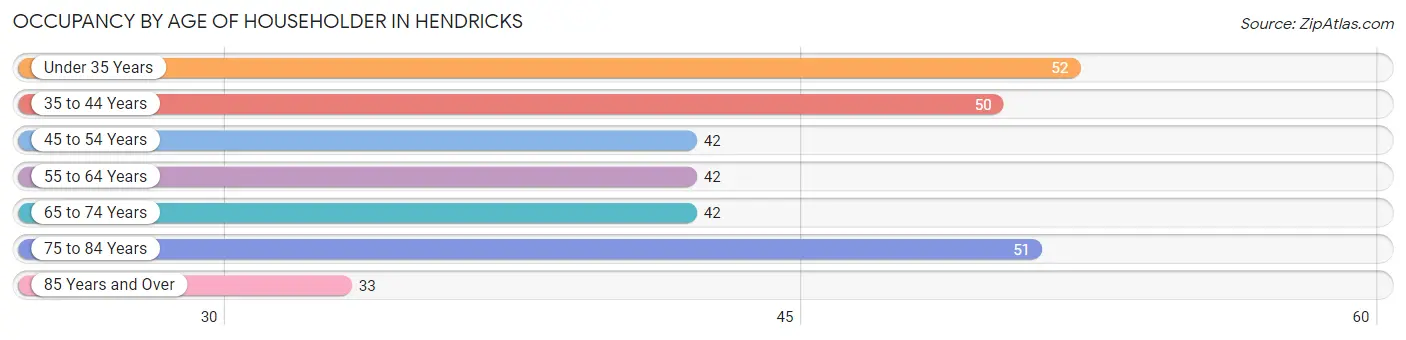
| Age Bracket | # Households | % Households |
| Under 35 Years | 52 | 16.7% |
| 35 to 44 Years | 50 | 16.0% |
| 45 to 54 Years | 42 | 13.5% |
| 55 to 64 Years | 42 | 13.5% |
| 65 to 74 Years | 42 | 13.5% |
| 75 to 84 Years | 51 | 16.4% |
| 85 Years and Over | 33 | 10.6% |
| Total | 312 | 100.0% |
Housing Finances in Hendricks
Median Income by Occupancy in Hendricks
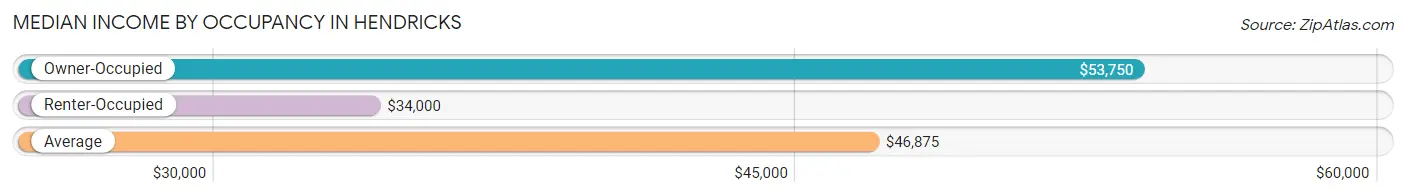
| Occupancy Type | # Households | Median Income |
| Owner-Occupied | 214 (68.6%) | $53,750 |
| Renter-Occupied | 98 (31.4%) | $34,000 |
| Average | 312 (100.0%) | $46,875 |
Occupancy by Householder Income Bracket in Hendricks
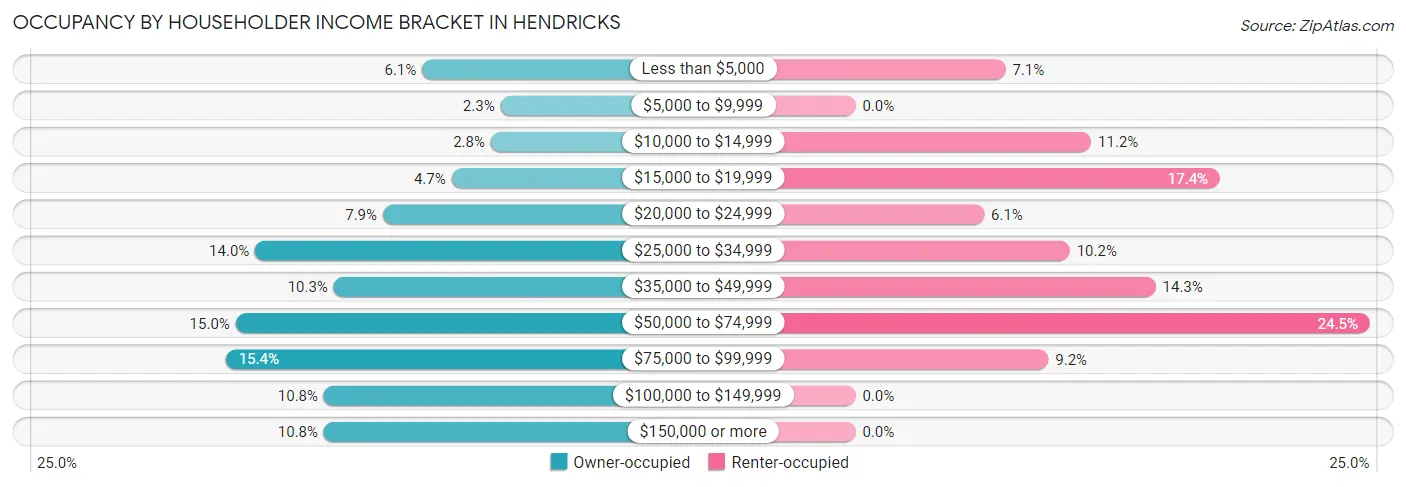
| Income Bracket | Owner-occupied | Renter-occupied |
| Less than $5,000 | 13 (6.1%) | 7 (7.1%) |
| $5,000 to $9,999 | 5 (2.3%) | 0 (0.0%) |
| $10,000 to $14,999 | 6 (2.8%) | 11 (11.2%) |
| $15,000 to $19,999 | 10 (4.7%) | 17 (17.3%) |
| $20,000 to $24,999 | 17 (7.9%) | 6 (6.1%) |
| $25,000 to $34,999 | 30 (14.0%) | 10 (10.2%) |
| $35,000 to $49,999 | 22 (10.3%) | 14 (14.3%) |
| $50,000 to $74,999 | 32 (14.9%) | 24 (24.5%) |
| $75,000 to $99,999 | 33 (15.4%) | 9 (9.2%) |
| $100,000 to $149,999 | 23 (10.7%) | 0 (0.0%) |
| $150,000 or more | 23 (10.7%) | 0 (0.0%) |
| Total | 214 (100.0%) | 98 (100.0%) |
Monthly Housing Cost Tiers in Hendricks
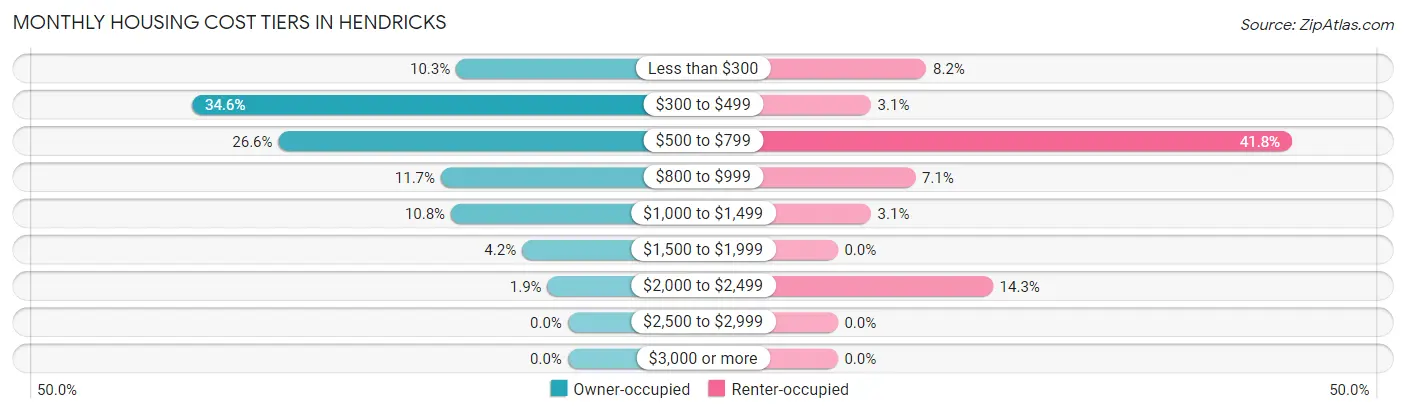
| Monthly Cost | Owner-occupied | Renter-occupied |
| Less than $300 | 22 (10.3%) | 8 (8.2%) |
| $300 to $499 | 74 (34.6%) | 3 (3.1%) |
| $500 to $799 | 57 (26.6%) | 41 (41.8%) |
| $800 to $999 | 25 (11.7%) | 7 (7.1%) |
| $1,000 to $1,499 | 23 (10.7%) | 3 (3.1%) |
| $1,500 to $1,999 | 9 (4.2%) | 0 (0.0%) |
| $2,000 to $2,499 | 4 (1.9%) | 14 (14.3%) |
| $2,500 to $2,999 | 0 (0.0%) | 0 (0.0%) |
| $3,000 or more | 0 (0.0%) | 0 (0.0%) |
| Total | 214 (100.0%) | 98 (100.0%) |
Physical Housing Characteristics in Hendricks
Housing Structures in Hendricks
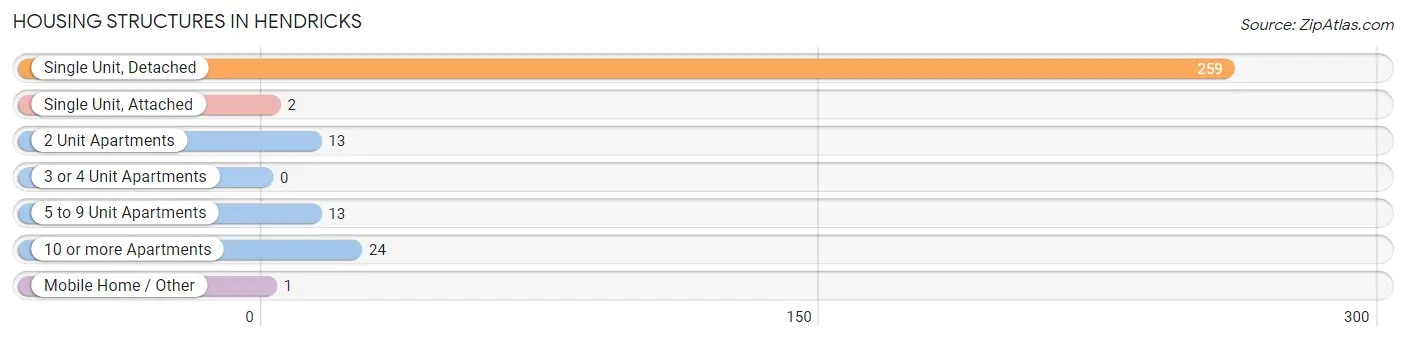
| Structure Type | # Housing Units | % Housing Units |
| Single Unit, Detached | 259 | 83.0% |
| Single Unit, Attached | 2 | 0.6% |
| 2 Unit Apartments | 13 | 4.2% |
| 3 or 4 Unit Apartments | 0 | 0.0% |
| 5 to 9 Unit Apartments | 13 | 4.2% |
| 10 or more Apartments | 24 | 7.7% |
| Mobile Home / Other | 1 | 0.3% |
| Total | 312 | 100.0% |
Housing Structures by Occupancy in Hendricks
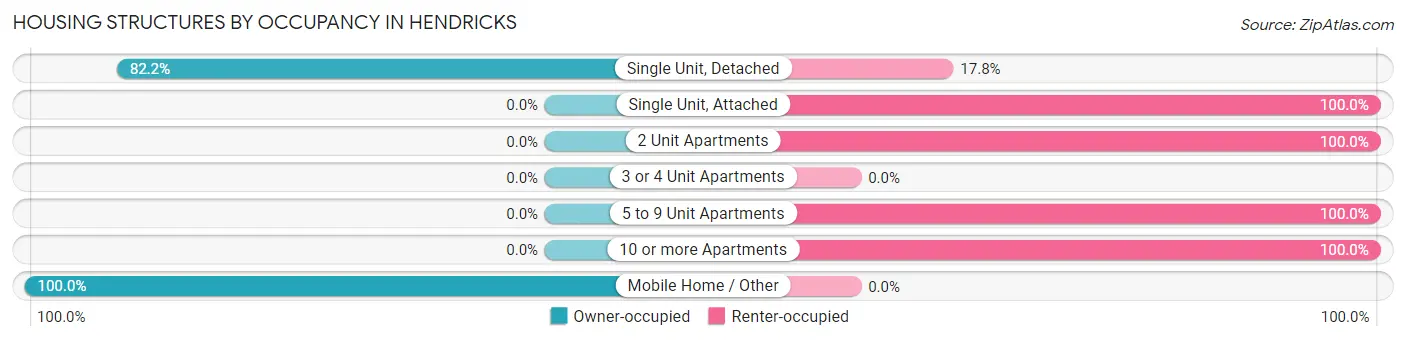
| Structure Type | Owner-occupied | Renter-occupied |
| Single Unit, Detached | 213 (82.2%) | 46 (17.8%) |
| Single Unit, Attached | 0 (0.0%) | 2 (100.0%) |
| 2 Unit Apartments | 0 (0.0%) | 13 (100.0%) |
| 3 or 4 Unit Apartments | 0 (0.0%) | 0 (0.0%) |
| 5 to 9 Unit Apartments | 0 (0.0%) | 13 (100.0%) |
| 10 or more Apartments | 0 (0.0%) | 24 (100.0%) |
| Mobile Home / Other | 1 (100.0%) | 0 (0.0%) |
| Total | 214 (68.6%) | 98 (31.4%) |
Housing Structures by Number of Rooms in Hendricks
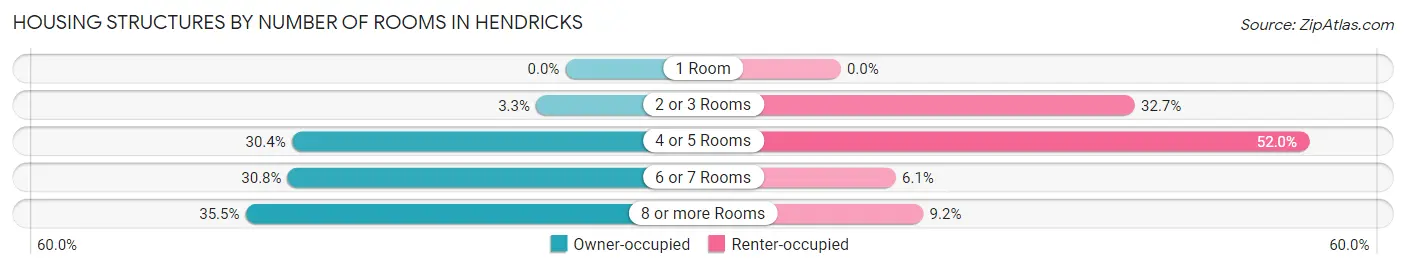
| Number of Rooms | Owner-occupied | Renter-occupied |
| 1 Room | 0 (0.0%) | 0 (0.0%) |
| 2 or 3 Rooms | 7 (3.3%) | 32 (32.7%) |
| 4 or 5 Rooms | 65 (30.4%) | 51 (52.0%) |
| 6 or 7 Rooms | 66 (30.8%) | 6 (6.1%) |
| 8 or more Rooms | 76 (35.5%) | 9 (9.2%) |
| Total | 214 (100.0%) | 98 (100.0%) |
Housing Structure by Heating Type in Hendricks
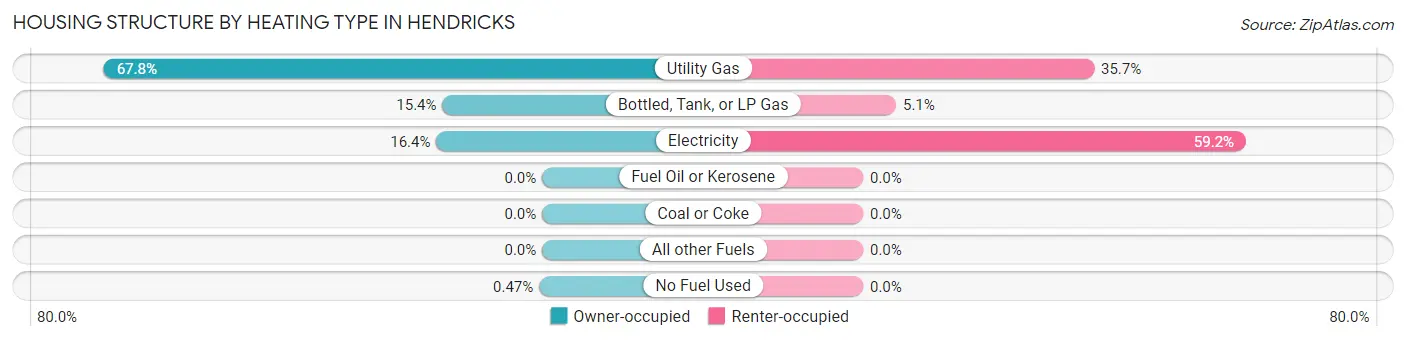
| Heating Type | Owner-occupied | Renter-occupied |
| Utility Gas | 145 (67.8%) | 35 (35.7%) |
| Bottled, Tank, or LP Gas | 33 (15.4%) | 5 (5.1%) |
| Electricity | 35 (16.4%) | 58 (59.2%) |
| Fuel Oil or Kerosene | 0 (0.0%) | 0 (0.0%) |
| Coal or Coke | 0 (0.0%) | 0 (0.0%) |
| All other Fuels | 0 (0.0%) | 0 (0.0%) |
| No Fuel Used | 1 (0.5%) | 0 (0.0%) |
| Total | 214 (100.0%) | 98 (100.0%) |
Household Vehicle Usage in Hendricks
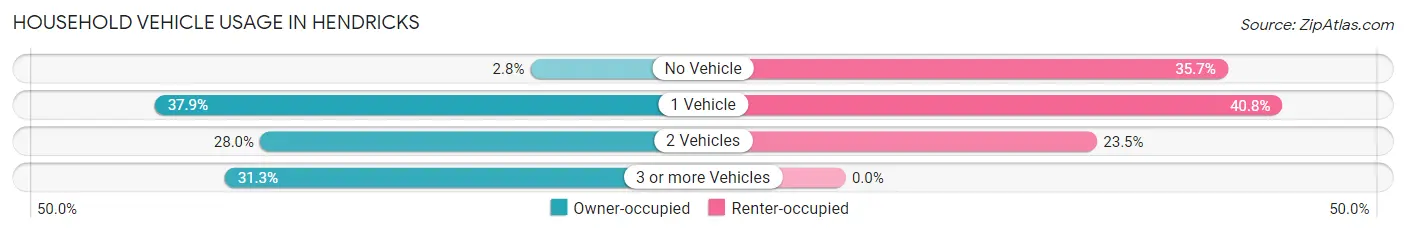
| Vehicles per Household | Owner-occupied | Renter-occupied |
| No Vehicle | 6 (2.8%) | 35 (35.7%) |
| 1 Vehicle | 81 (37.9%) | 40 (40.8%) |
| 2 Vehicles | 60 (28.0%) | 23 (23.5%) |
| 3 or more Vehicles | 67 (31.3%) | 0 (0.0%) |
| Total | 214 (100.0%) | 98 (100.0%) |
Real Estate & Mortgages in Hendricks
Real Estate and Mortgage Overview in Hendricks
| Characteristic | Without Mortgage | With Mortgage |
| Housing Units | 142 | 72 |
| Median Property Value | $60,000 | $93,300 |
| Median Household Income | $47,500 | $9 |
| Monthly Housing Costs | $430 | $0 |
| Real Estate Taxes | $967 | $6 |
Property Value by Mortgage Status in Hendricks
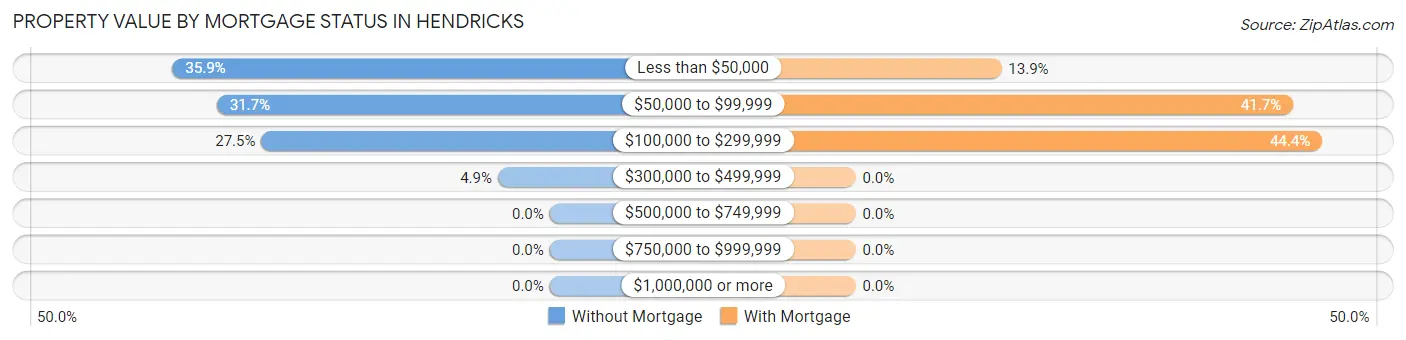
| Property Value | Without Mortgage | With Mortgage |
| Less than $50,000 | 51 (35.9%) | 10 (13.9%) |
| $50,000 to $99,999 | 45 (31.7%) | 30 (41.7%) |
| $100,000 to $299,999 | 39 (27.5%) | 32 (44.4%) |
| $300,000 to $499,999 | 7 (4.9%) | 0 (0.0%) |
| $500,000 to $749,999 | 0 (0.0%) | 0 (0.0%) |
| $750,000 to $999,999 | 0 (0.0%) | 0 (0.0%) |
| $1,000,000 or more | 0 (0.0%) | 0 (0.0%) |
| Total | 142 (100.0%) | 72 (100.0%) |
Household Income by Mortgage Status in Hendricks
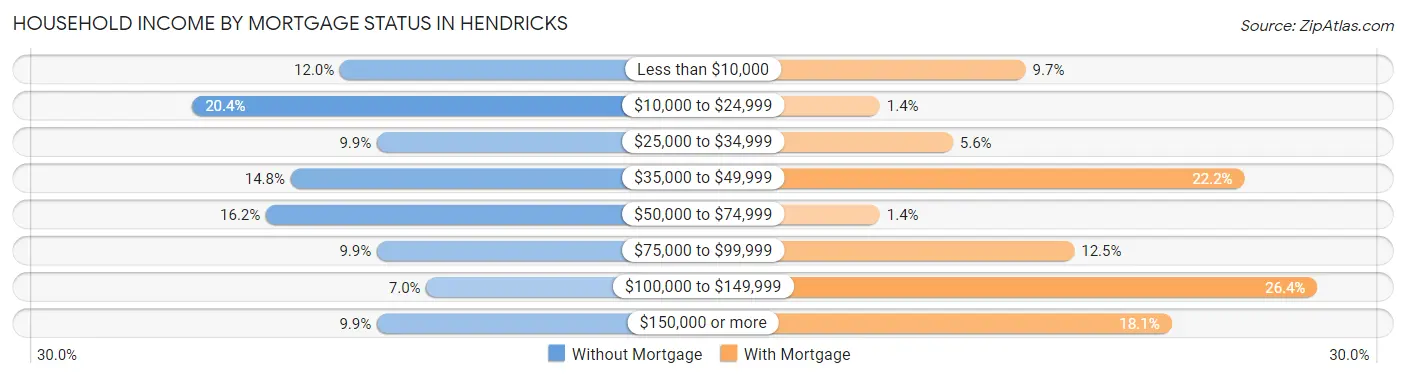
| Household Income | Without Mortgage | With Mortgage |
| Less than $10,000 | 17 (12.0%) | 7 (9.7%) |
| $10,000 to $24,999 | 29 (20.4%) | 1 (1.4%) |
| $25,000 to $34,999 | 14 (9.9%) | 4 (5.6%) |
| $35,000 to $49,999 | 21 (14.8%) | 16 (22.2%) |
| $50,000 to $74,999 | 23 (16.2%) | 1 (1.4%) |
| $75,000 to $99,999 | 14 (9.9%) | 9 (12.5%) |
| $100,000 to $149,999 | 10 (7.0%) | 19 (26.4%) |
| $150,000 or more | 14 (9.9%) | 13 (18.1%) |
| Total | 142 (100.0%) | 72 (100.0%) |
Property Value to Household Income Ratio in Hendricks
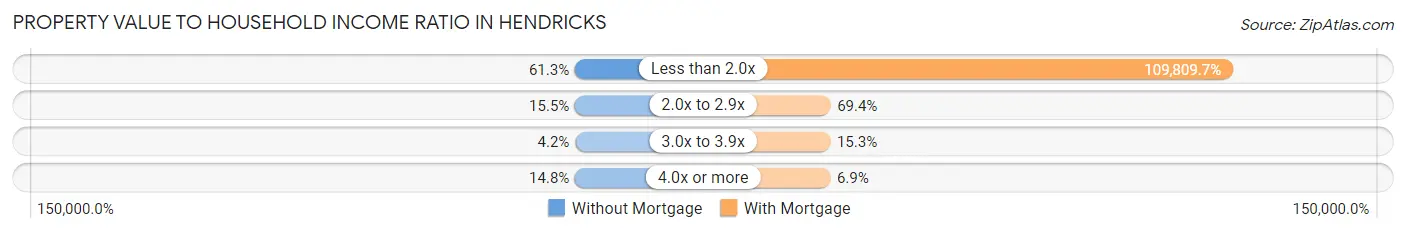
| Value-to-Income Ratio | Without Mortgage | With Mortgage |
| Less than 2.0x | 87 (61.3%) | 79,063 (109,809.7%) |
| 2.0x to 2.9x | 22 (15.5%) | 50 (69.4%) |
| 3.0x to 3.9x | 6 (4.2%) | 11 (15.3%) |
| 4.0x or more | 21 (14.8%) | 5 (6.9%) |
| Total | 142 (100.0%) | 72 (100.0%) |
Real Estate Taxes by Mortgage Status in Hendricks
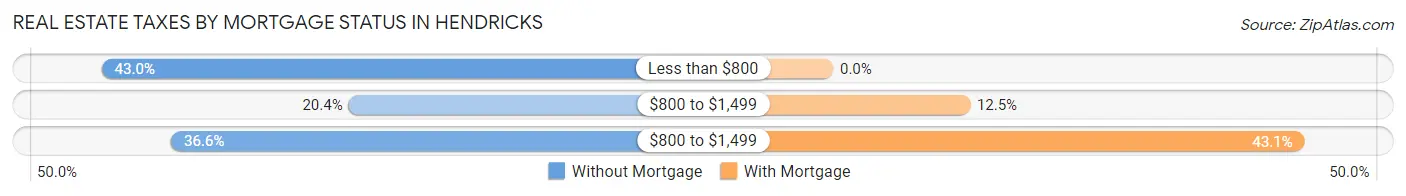
| Property Taxes | Without Mortgage | With Mortgage |
| Less than $800 | 61 (43.0%) | 0 (0.0%) |
| $800 to $1,499 | 29 (20.4%) | 9 (12.5%) |
| $800 to $1,499 | 52 (36.6%) | 31 (43.1%) |
| Total | 142 (100.0%) | 72 (100.0%) |
Health & Disability in Hendricks
Health Insurance Coverage by Age in Hendricks
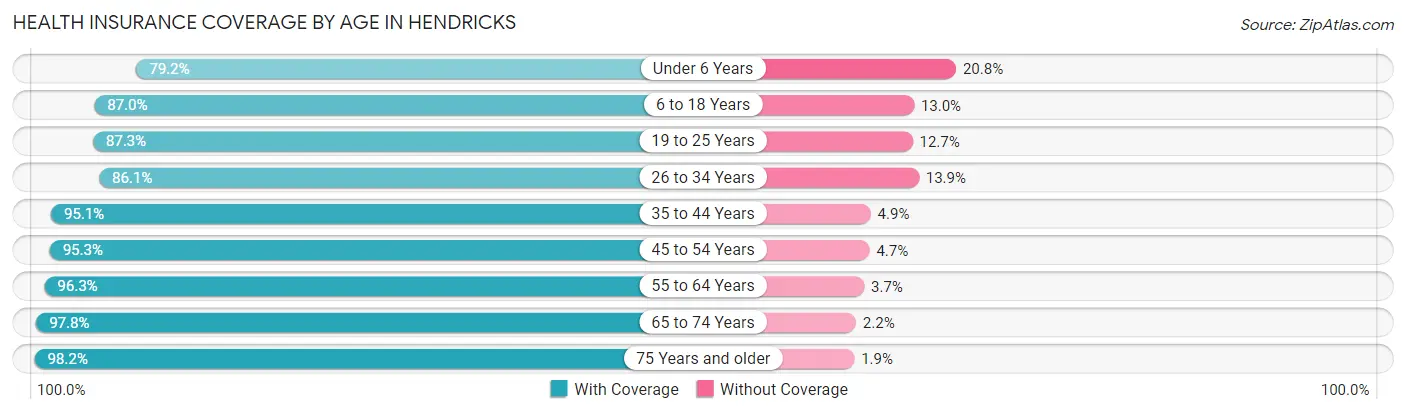
| Age Bracket | With Coverage | Without Coverage |
| Under 6 Years | 19 (79.2%) | 5 (20.8%) |
| 6 to 18 Years | 67 (87.0%) | 10 (13.0%) |
| 19 to 25 Years | 48 (87.3%) | 7 (12.7%) |
| 26 to 34 Years | 31 (86.1%) | 5 (13.9%) |
| 35 to 44 Years | 58 (95.1%) | 3 (4.9%) |
| 45 to 54 Years | 61 (95.3%) | 3 (4.7%) |
| 55 to 64 Years | 78 (96.3%) | 3 (3.7%) |
| 65 to 74 Years | 45 (97.8%) | 1 (2.2%) |
| 75 Years and older | 106 (98.2%) | 2 (1.8%) |
| Total | 513 (92.9%) | 39 (7.1%) |
Health Insurance Coverage by Citizenship Status in Hendricks
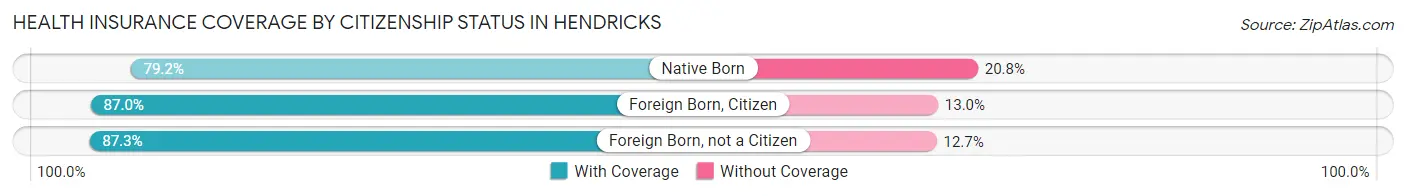
| Citizenship Status | With Coverage | Without Coverage |
| Native Born | 19 (79.2%) | 5 (20.8%) |
| Foreign Born, Citizen | 67 (87.0%) | 10 (13.0%) |
| Foreign Born, not a Citizen | 48 (87.3%) | 7 (12.7%) |
Health Insurance Coverage by Household Income in Hendricks
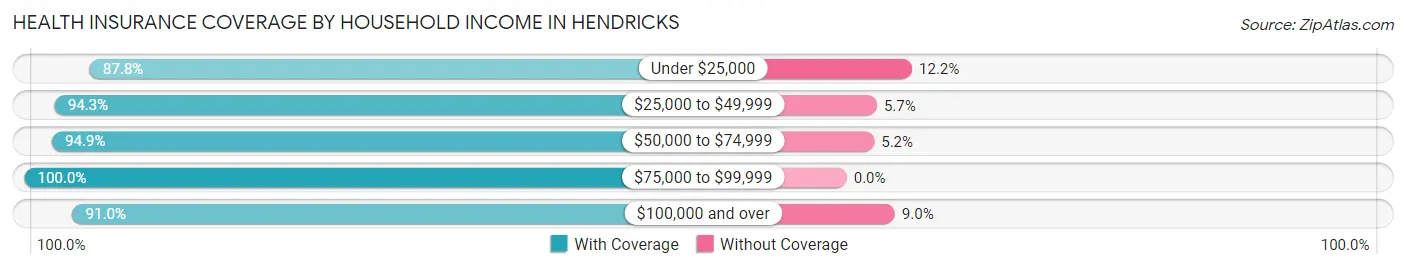
| Household Income | With Coverage | Without Coverage |
| Under $25,000 | 129 (87.8%) | 18 (12.2%) |
| $25,000 to $49,999 | 100 (94.3%) | 6 (5.7%) |
| $50,000 to $74,999 | 92 (94.9%) | 5 (5.1%) |
| $75,000 to $99,999 | 91 (100.0%) | 0 (0.0%) |
| $100,000 and over | 101 (91.0%) | 10 (9.0%) |
Public vs Private Health Insurance Coverage by Age in Hendricks
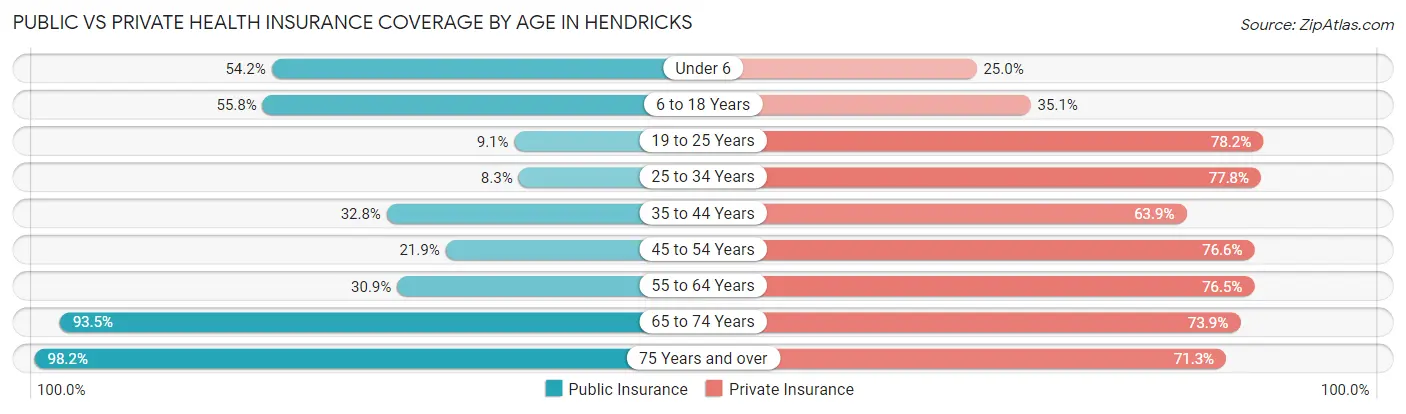
| Age Bracket | Public Insurance | Private Insurance |
| Under 6 | 13 (54.2%) | 6 (25.0%) |
| 6 to 18 Years | 43 (55.8%) | 27 (35.1%) |
| 19 to 25 Years | 5 (9.1%) | 43 (78.2%) |
| 25 to 34 Years | 3 (8.3%) | 28 (77.8%) |
| 35 to 44 Years | 20 (32.8%) | 39 (63.9%) |
| 45 to 54 Years | 14 (21.9%) | 49 (76.6%) |
| 55 to 64 Years | 25 (30.9%) | 62 (76.5%) |
| 65 to 74 Years | 43 (93.5%) | 34 (73.9%) |
| 75 Years and over | 106 (98.2%) | 77 (71.3%) |
| Total | 272 (49.3%) | 365 (66.1%) |
Disability Status by Sex by Age in Hendricks
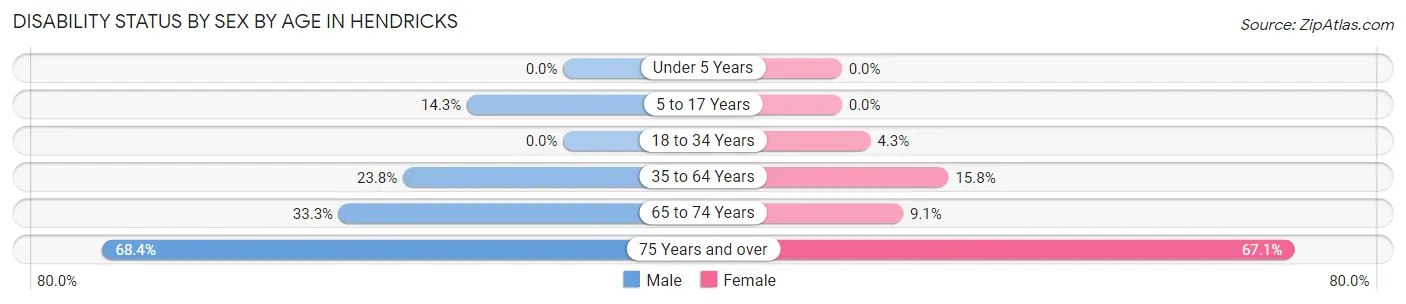
| Age Bracket | Male | Female |
| Under 5 Years | 0 (0.0%) | 0 (0.0%) |
| 5 to 17 Years | 4 (14.3%) | 0 (0.0%) |
| 18 to 34 Years | 0 (0.0%) | 2 (4.3%) |
| 35 to 64 Years | 25 (23.8%) | 16 (15.8%) |
| 65 to 74 Years | 8 (33.3%) | 2 (9.1%) |
| 75 Years and over | 26 (68.4%) | 47 (67.1%) |
Disability Class by Sex by Age in Hendricks
Disability Class: Hearing Difficulty
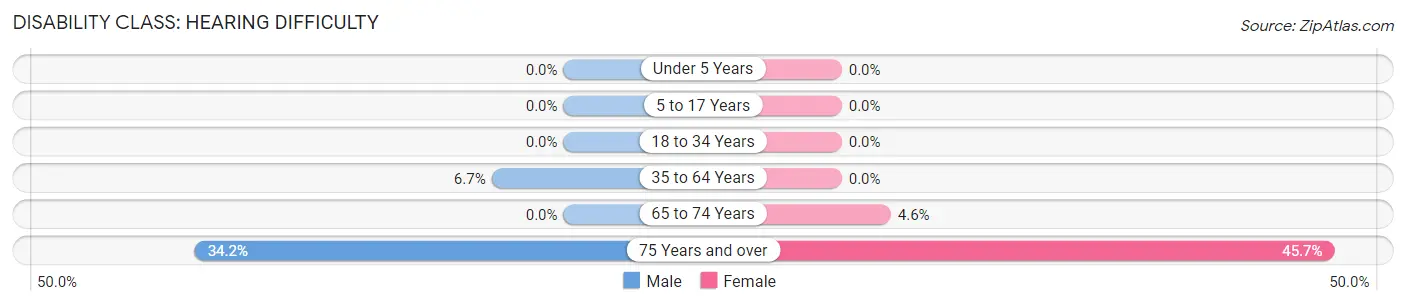
| Age Bracket | Male | Female |
| Under 5 Years | 0 (0.0%) | 0 (0.0%) |
| 5 to 17 Years | 0 (0.0%) | 0 (0.0%) |
| 18 to 34 Years | 0 (0.0%) | 0 (0.0%) |
| 35 to 64 Years | 7 (6.7%) | 0 (0.0%) |
| 65 to 74 Years | 0 (0.0%) | 1 (4.5%) |
| 75 Years and over | 13 (34.2%) | 32 (45.7%) |
Disability Class: Vision Difficulty
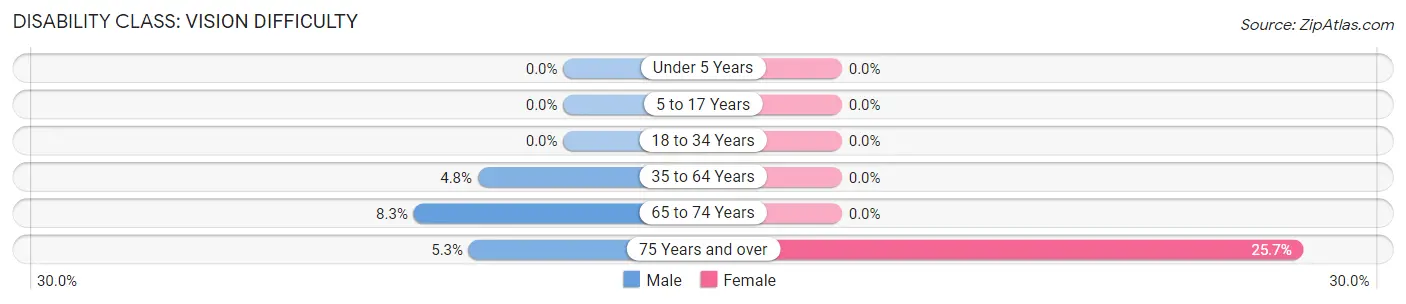
| Age Bracket | Male | Female |
| Under 5 Years | 0 (0.0%) | 0 (0.0%) |
| 5 to 17 Years | 0 (0.0%) | 0 (0.0%) |
| 18 to 34 Years | 0 (0.0%) | 0 (0.0%) |
| 35 to 64 Years | 5 (4.8%) | 0 (0.0%) |
| 65 to 74 Years | 2 (8.3%) | 0 (0.0%) |
| 75 Years and over | 2 (5.3%) | 18 (25.7%) |
Disability Class: Cognitive Difficulty
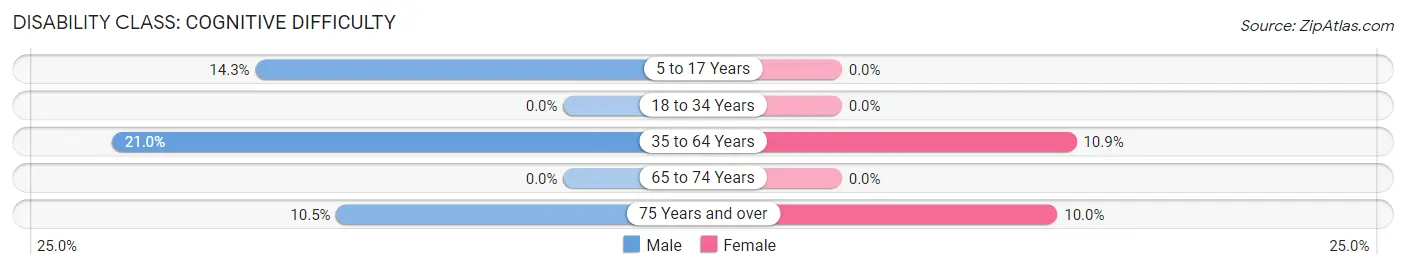
| Age Bracket | Male | Female |
| 5 to 17 Years | 4 (14.3%) | 0 (0.0%) |
| 18 to 34 Years | 0 (0.0%) | 0 (0.0%) |
| 35 to 64 Years | 22 (20.9%) | 11 (10.9%) |
| 65 to 74 Years | 0 (0.0%) | 0 (0.0%) |
| 75 Years and over | 4 (10.5%) | 7 (10.0%) |
Disability Class: Ambulatory Difficulty
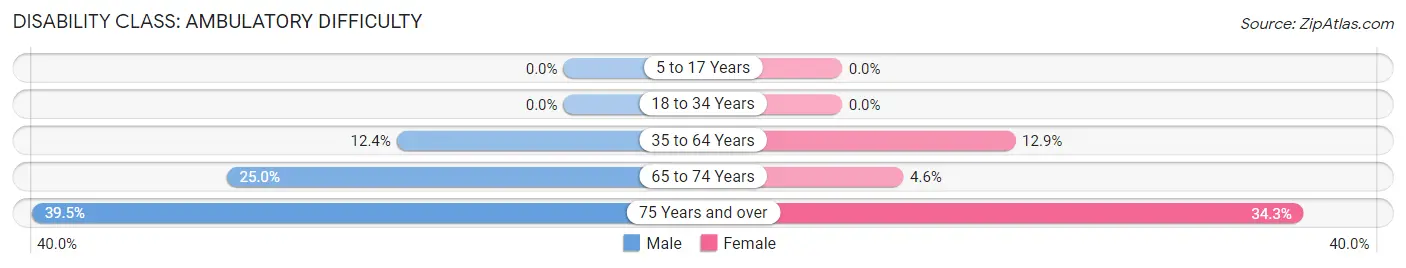
| Age Bracket | Male | Female |
| 5 to 17 Years | 0 (0.0%) | 0 (0.0%) |
| 18 to 34 Years | 0 (0.0%) | 0 (0.0%) |
| 35 to 64 Years | 13 (12.4%) | 13 (12.9%) |
| 65 to 74 Years | 6 (25.0%) | 1 (4.5%) |
| 75 Years and over | 15 (39.5%) | 24 (34.3%) |
Disability Class: Self-Care Difficulty
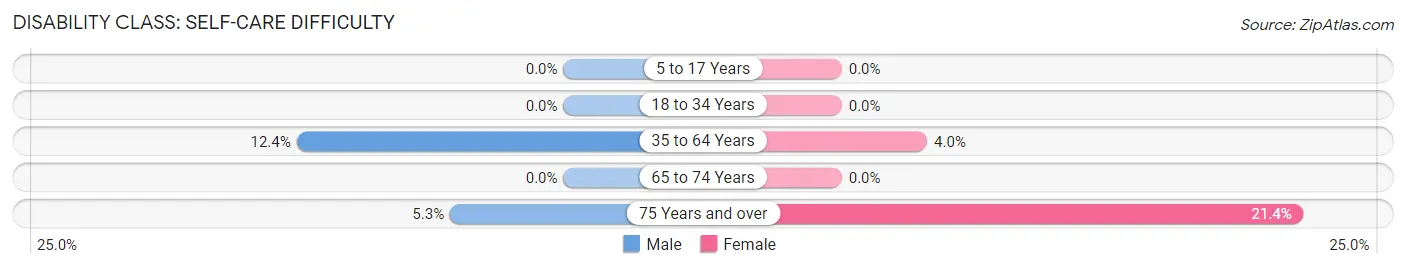
| Age Bracket | Male | Female |
| 5 to 17 Years | 0 (0.0%) | 0 (0.0%) |
| 18 to 34 Years | 0 (0.0%) | 0 (0.0%) |
| 35 to 64 Years | 13 (12.4%) | 4 (4.0%) |
| 65 to 74 Years | 0 (0.0%) | 0 (0.0%) |
| 75 Years and over | 2 (5.3%) | 15 (21.4%) |
Technology Access in Hendricks
Computing Device Access in Hendricks
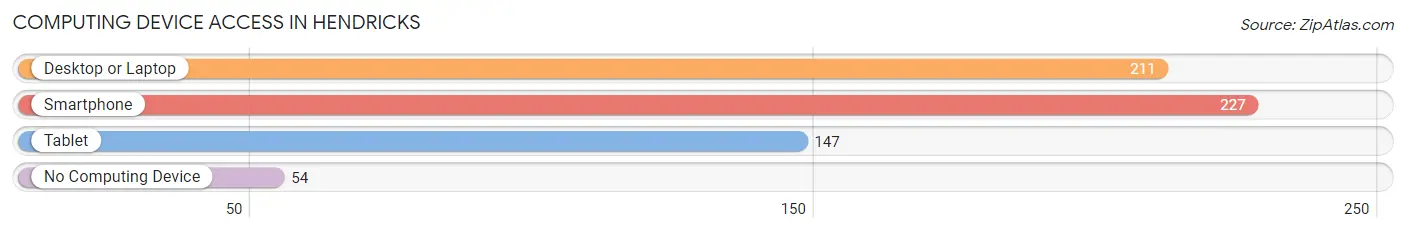
| Device Type | # Households | % Households |
| Desktop or Laptop | 211 | 67.6% |
| Smartphone | 227 | 72.8% |
| Tablet | 147 | 47.1% |
| No Computing Device | 54 | 17.3% |
| Total | 312 | 100.0% |
Internet Access in Hendricks
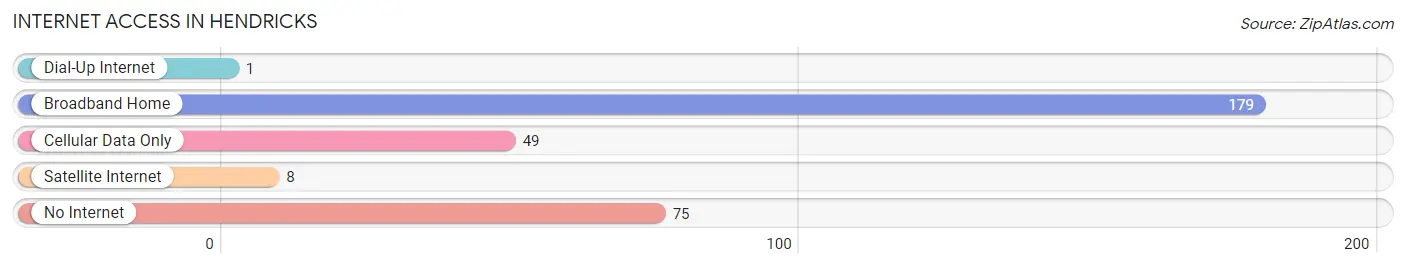
| Internet Type | # Households | % Households |
| Dial-Up Internet | 1 | 0.3% |
| Broadband Home | 179 | 57.4% |
| Cellular Data Only | 49 | 15.7% |
| Satellite Internet | 8 | 2.6% |
| No Internet | 75 | 24.0% |
| Total | 312 | 100.0% |
Hendricks Summary
Hendricks is a small city located in Lincoln County, Minnesota. It is situated on the banks of the Des Moines River, approximately 25 miles east of Sioux Falls, South Dakota. The city has a population of approximately 1,000 people and is the county seat of Lincoln County.
Geography
Hendricks is located in the southwestern corner of Minnesota, near the border with South Dakota. The city is situated on the banks of the Des Moines River, which flows through the city and provides a scenic backdrop. The city is surrounded by rolling hills and farmland, and is located in the heart of the Minnesota River Valley. The city is located at an elevation of 1,072 feet above sea level.
The climate in Hendricks is typical of the Midwest, with hot summers and cold winters. The average temperature in the summer is around 75 degrees Fahrenheit, while the average temperature in the winter is around 20 degrees Fahrenheit. The city receives an average of 28 inches of precipitation per year, with most of it falling in the spring and summer months.
Economy
Hendricks is a small city with a limited economy. The city is home to several small businesses, including a grocery store, a hardware store, and a few restaurants. The city also has a small manufacturing sector, with several companies producing agricultural and industrial equipment. The city is also home to a few small farms, which produce a variety of crops, including corn, soybeans, and wheat.
The city is also home to a few small tourist attractions, including a museum, a golf course, and a few parks. The city is also home to a few small festivals, including the Hendricks County Fair and the Hendricks County Music Festival.
Demographics
As of the 2010 census, the population of Hendricks was 1,000 people. The racial makeup of the city was 97.2% White, 0.7% African American, 0.3% Native American, 0.2% Asian, 0.1% Pacific Islander, and 1.5% from two or more races. The median household income in Hendricks was $41,250, and the median family income was $50,000.
The city is home to a variety of religious denominations, including Lutheran, Catholic, Methodist, and Baptist. The city is also home to a variety of ethnic backgrounds, including German, Irish, Norwegian, and Swedish.
Conclusion
Hendricks is a small city located in Lincoln County, Minnesota. It is situated on the banks of the Des Moines River, approximately 25 miles east of Sioux Falls, South Dakota. The city has a population of approximately 1,000 people and is the county seat of Lincoln County. The city is home to a variety of small businesses, farms, and tourist attractions, and is home to a variety of religious denominations and ethnic backgrounds. The city has a limited economy, but is a pleasant place to live and visit.
Common Questions
What is Per Capita Income in Hendricks?
Per Capita income in Hendricks is $31,430.
What is the Median Family Income in Hendricks?
Median Family Income in Hendricks is $64,375.
What is the Median Household income in Hendricks?
Median Household Income in Hendricks is $46,875.
What is Income or Wage Gap in Hendricks?
Income or Wage Gap in Hendricks is 38.6%.
Women in Hendricks earn 61.4 cents for every dollar earned by a man.
What is Inequality or Gini Index in Hendricks?
Inequality or Gini Index in Hendricks is 0.46.
What is the Total Population of Hendricks?
Total Population of Hendricks is 602.
What is the Total Male Population of Hendricks?
Total Male Population of Hendricks is 266.
What is the Total Female Population of Hendricks?
Total Female Population of Hendricks is 336.
What is the Ratio of Males per 100 Females in Hendricks?
There are 79.17 Males per 100 Females in Hendricks.
What is the Ratio of Females per 100 Males in Hendricks?
There are 126.32 Females per 100 Males in Hendricks.
What is the Median Population Age in Hendricks?
Median Population Age in Hendricks is 53.7 Years.
What is the Average Family Size in Hendricks
Average Family Size in Hendricks is 2.5 People.
What is the Average Household Size in Hendricks
Average Household Size in Hendricks is 1.8 People.
How Large is the Labor Force in Hendricks?
There are 272 People in the Labor Forcein in Hendricks.
What is the Percentage of People in the Labor Force in Hendricks?
51.1% of People are in the Labor Force in Hendricks.
What is the Unemployment Rate in Hendricks?
Unemployment Rate in Hendricks is 3.7%.