Hector, MN Map & Demographics
Hector Map
Hector Overview
$29,783
PER CAPITA INCOME
$70,313
AVG FAMILY INCOME
$57,788
AVG HOUSEHOLD INCOME
10.2%
WAGE / INCOME GAP [ % ]
89.8¢/ $1
WAGE / INCOME GAP [ $ ]
$10,914
FAMILY INCOME DEFICIT
0.38
INEQUALITY / GINI INDEX
1,127
TOTAL POPULATION
562
MALE POPULATION
565
FEMALE POPULATION
99.47
MALES / 100 FEMALES
100.53
FEMALES / 100 MALES
38.3
MEDIAN AGE
3.3
AVG FAMILY SIZE
2.6
AVG HOUSEHOLD SIZE
639
LABOR FORCE [ PEOPLE ]
70.9%
PERCENT IN LABOR FORCE
0.9%
UNEMPLOYMENT RATE
Hector Zip Codes
Hector Area Codes
Income in Hector
Income Overview in Hector
Per Capita Income in Hector is $29,783, while median incomes of families and households are $70,313 and $57,788 respectively.
| Characteristic | Number | Measure |
| Per Capita Income | 1,127 | $29,783 |
| Median Family Income | 251 | $70,313 |
| Mean Family Income | 251 | $86,109 |
| Median Household Income | 424 | $57,788 |
| Mean Household Income | 424 | $70,725 |
| Income Deficit | 251 | $10,914 |
| Wage / Income Gap (%) | 1,127 | 10.16% |
| Wage / Income Gap ($) | 1,127 | 89.84¢ per $1 |
| Gini / Inequality Index | 1,127 | 0.38 |
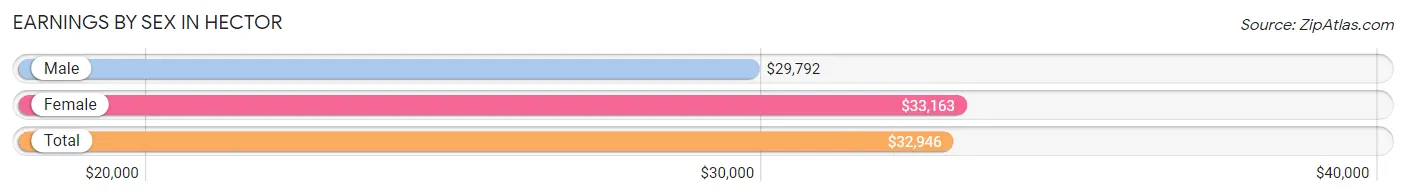
Earnings by Sex in Hector
Average Earnings in Hector are $32,946, $29,792 for men and $33,163 for women, a difference of 10.2%.
| Sex | Number | Average Earnings |
| Male | 344 (51.3%) | $29,792 |
| Female | 326 (48.7%) | $33,163 |
| Total | 670 (100.0%) | $32,946 |
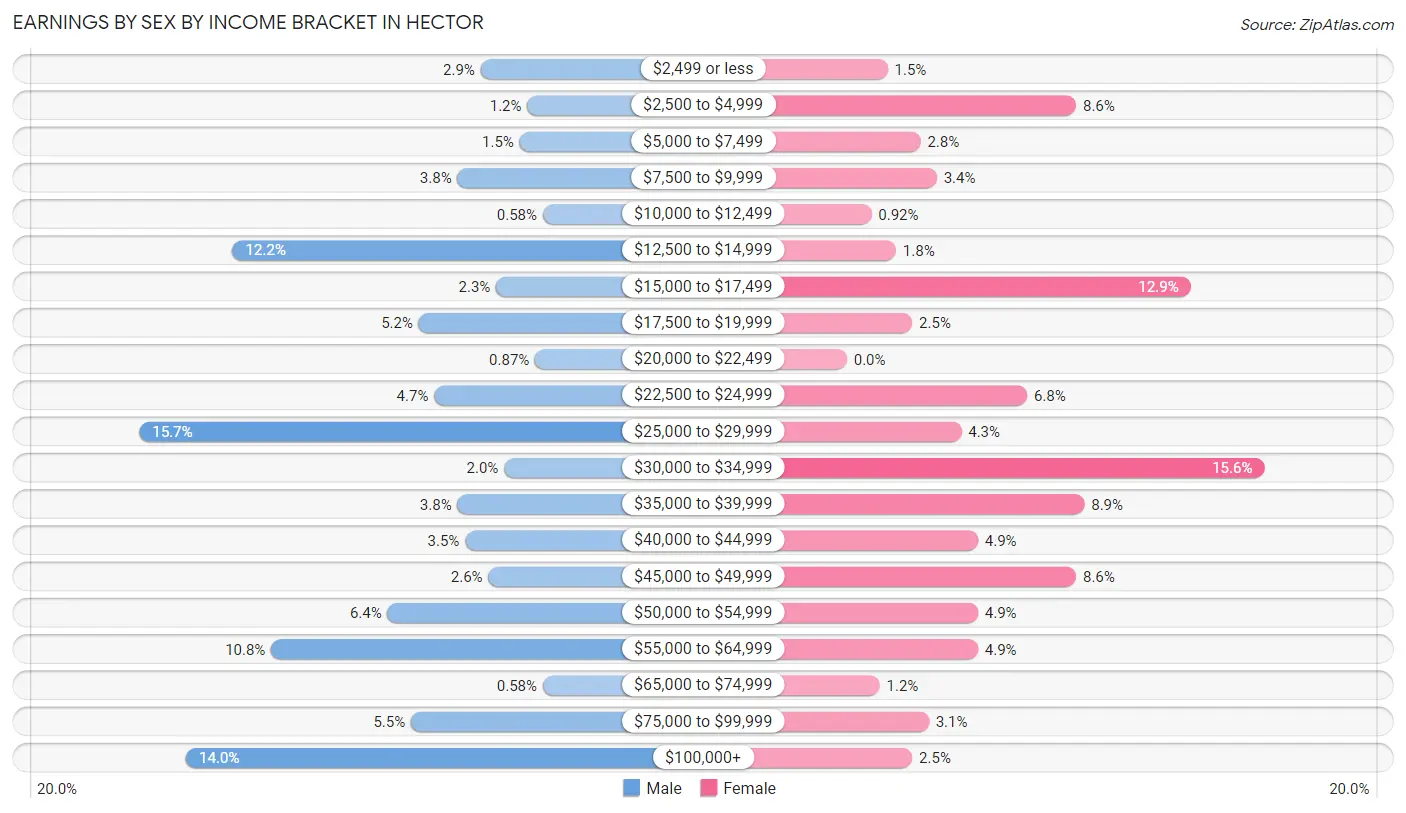
Earnings by Sex by Income Bracket in Hector
The most common earnings brackets in Hector are $25,000 to $29,999 for men (54 | 15.7%) and $30,000 to $34,999 for women (51 | 15.6%).
| Income | Male | Female |
| $2,499 or less | 10 (2.9%) | 5 (1.5%) |
| $2,500 to $4,999 | 4 (1.2%) | 28 (8.6%) |
| $5,000 to $7,499 | 5 (1.5%) | 9 (2.8%) |
| $7,500 to $9,999 | 13 (3.8%) | 11 (3.4%) |
| $10,000 to $12,499 | 2 (0.6%) | 3 (0.9%) |
| $12,500 to $14,999 | 42 (12.2%) | 6 (1.8%) |
| $15,000 to $17,499 | 8 (2.3%) | 42 (12.9%) |
| $17,500 to $19,999 | 18 (5.2%) | 8 (2.5%) |
| $20,000 to $22,499 | 3 (0.9%) | 0 (0.0%) |
| $22,500 to $24,999 | 16 (4.6%) | 22 (6.8%) |
| $25,000 to $29,999 | 54 (15.7%) | 14 (4.3%) |
| $30,000 to $34,999 | 7 (2.0%) | 51 (15.6%) |
| $35,000 to $39,999 | 13 (3.8%) | 29 (8.9%) |
| $40,000 to $44,999 | 12 (3.5%) | 16 (4.9%) |
| $45,000 to $49,999 | 9 (2.6%) | 28 (8.6%) |
| $50,000 to $54,999 | 22 (6.4%) | 16 (4.9%) |
| $55,000 to $64,999 | 37 (10.8%) | 16 (4.9%) |
| $65,000 to $74,999 | 2 (0.6%) | 4 (1.2%) |
| $75,000 to $99,999 | 19 (5.5%) | 10 (3.1%) |
| $100,000+ | 48 (14.0%) | 8 (2.5%) |
| Total | 344 (100.0%) | 326 (100.0%) |
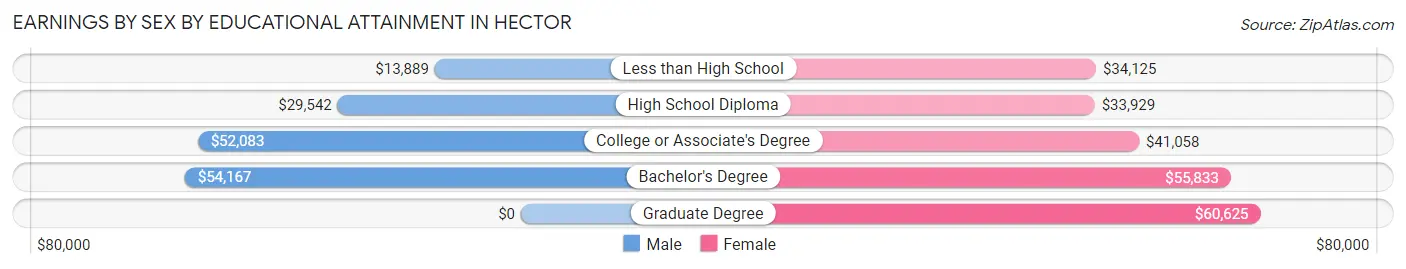
Earnings by Sex by Educational Attainment in Hector
Average earnings in Hector are $35,833 for men and $38,482 for women, a difference of 6.9%. Men with an educational attainment of bachelor's degree enjoy the highest average annual earnings of $54,167, while those with less than high school education earn the least with $13,889. Women with an educational attainment of graduate degree earn the most with the average annual earnings of $60,625, while those with high school diploma education have the smallest earnings of $33,929.
| Educational Attainment | Male Income | Female Income |
| Less than High School | $13,889 | $34,125 |
| High School Diploma | $29,542 | $33,929 |
| College or Associate's Degree | $52,083 | $41,058 |
| Bachelor's Degree | $54,167 | $55,833 |
| Graduate Degree | - | - |
| Total | $35,833 | $38,482 |
Family Income in Hector
Family Income Brackets in Hector
According to the Hector family income data, there are 55 families falling into the $100,000 to $149,999 income range, which is the most common income bracket and makes up 21.9% of all families.
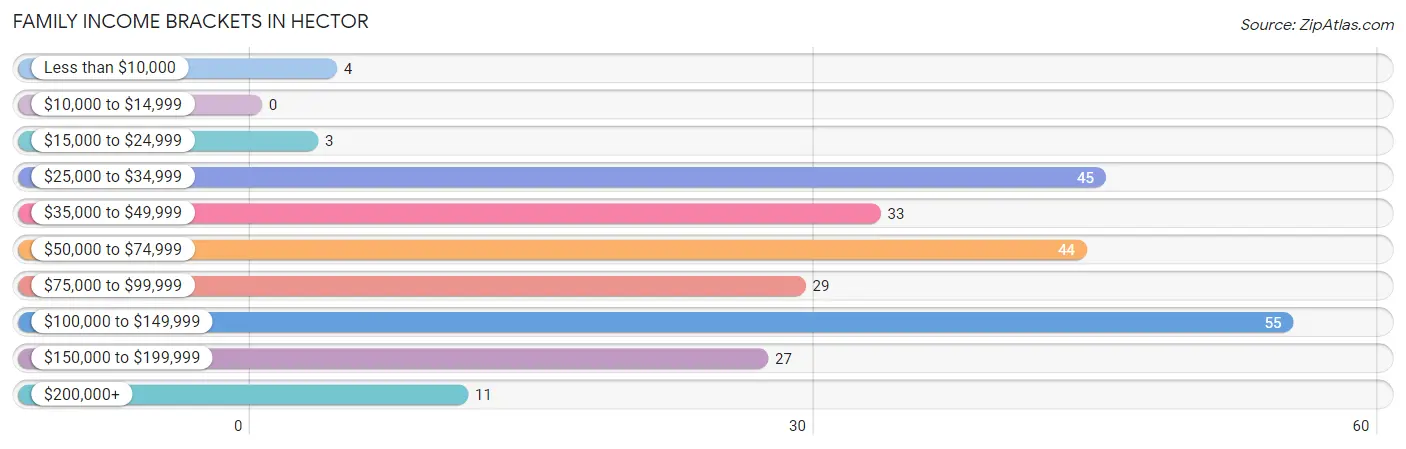
| Income Bracket | # Families | % Families |
| Less than $10,000 | 4 | 1.6% |
| $10,000 to $14,999 | 0 | 0.0% |
| $15,000 to $24,999 | 3 | 1.2% |
| $25,000 to $34,999 | 45 | 17.9% |
| $35,000 to $49,999 | 33 | 13.1% |
| $50,000 to $74,999 | 44 | 17.5% |
| $75,000 to $99,999 | 29 | 11.6% |
| $100,000 to $149,999 | 55 | 21.9% |
| $150,000 to $199,999 | 27 | 10.8% |
| $200,000+ | 11 | 4.4% |
Family Income by Famaliy Size in Hector
4-person families (17 | 6.8%) account for the highest median family income in Hector with $103,125 per family, while 2-person families (138 | 55.0%) have the highest median income of $32,000 per family member.
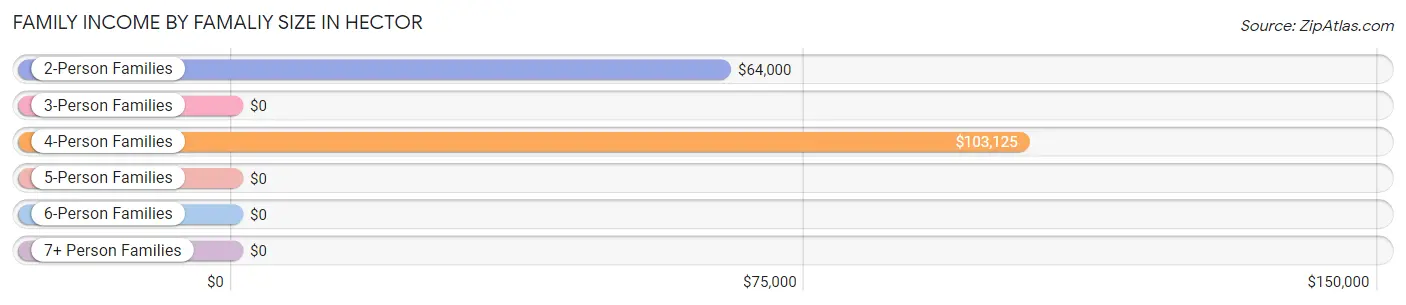
| Income Bracket | # Families | Median Income |
| 2-Person Families | 138 (55.0%) | $64,000 |
| 3-Person Families | 67 (26.7%) | $0 |
| 4-Person Families | 17 (6.8%) | $103,125 |
| 5-Person Families | 17 (6.8%) | $0 |
| 6-Person Families | 7 (2.8%) | $0 |
| 7+ Person Families | 5 (2.0%) | $0 |
| Total | 251 (100.0%) | $70,313 |
Family Income by Number of Earners in Hector
The median family income in Hector is $70,313, with families comprising 3+ earners (28) having the highest median family income of $118,167, while families with 1 earner (80) have the lowest median family income of $45,625, accounting for 11.2% and 31.9% of families, respectively.
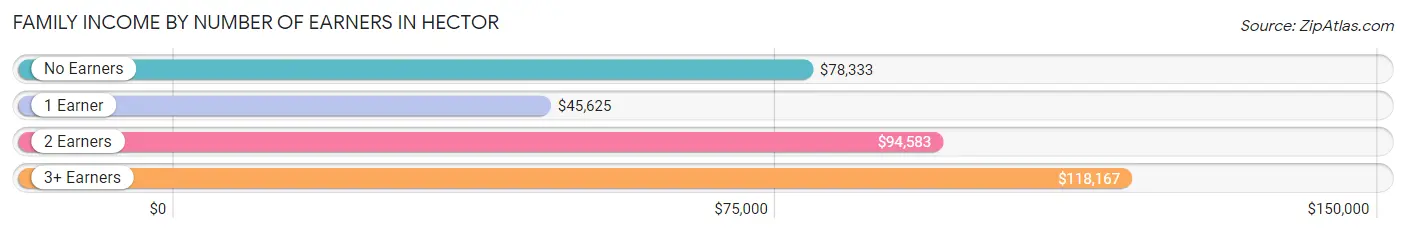
| Number of Earners | # Families | Median Income |
| No Earners | 24 (9.6%) | $78,333 |
| 1 Earner | 80 (31.9%) | $45,625 |
| 2 Earners | 119 (47.4%) | $94,583 |
| 3+ Earners | 28 (11.2%) | $118,167 |
| Total | 251 (100.0%) | $70,313 |
Household Income in Hector
Household Income Brackets in Hector
With 117 households falling in the category, the $50,000 to $74,999 income range is the most frequent in Hector, accounting for 27.6% of all households. In contrast, only 11 households (2.6%) fall into the less than $10,000 income bracket, making it the least populous group.
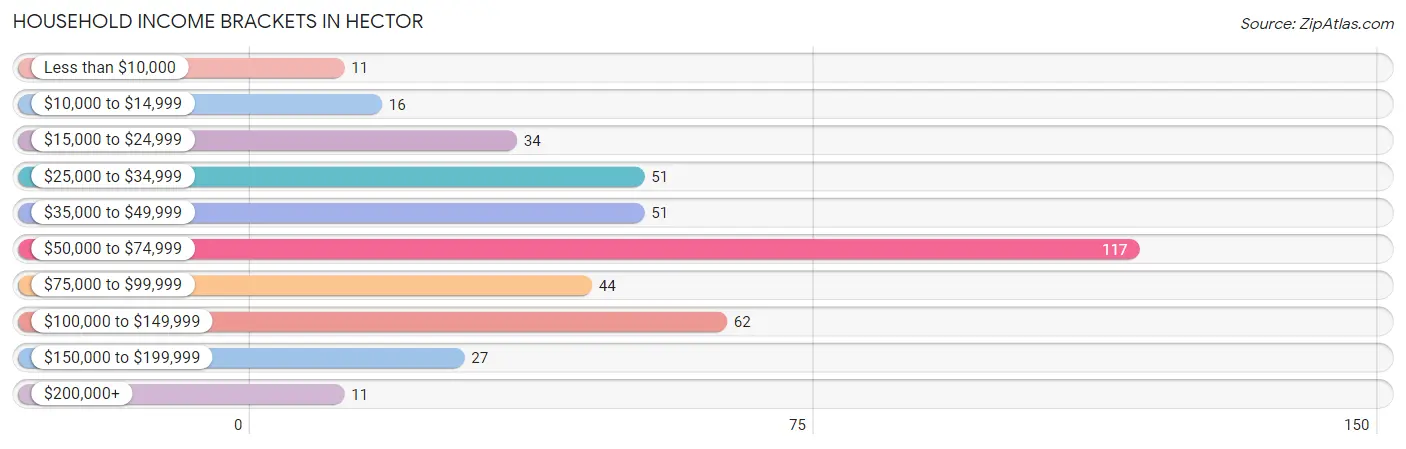
| Income Bracket | # Households | % Households |
| Less than $10,000 | 11 | 2.6% |
| $10,000 to $14,999 | 16 | 3.8% |
| $15,000 to $24,999 | 34 | 8.0% |
| $25,000 to $34,999 | 51 | 12.0% |
| $35,000 to $49,999 | 51 | 12.0% |
| $50,000 to $74,999 | 117 | 27.6% |
| $75,000 to $99,999 | 44 | 10.4% |
| $100,000 to $149,999 | 62 | 14.6% |
| $150,000 to $199,999 | 27 | 6.4% |
| $200,000+ | 11 | 2.6% |
Household Income by Householder Age in Hector
The median household income in Hector is $57,788, with the highest median household income of $71,103 found in the 15 to 24 years age bracket for the primary householder. A total of 25 households (5.9%) fall into this category. Meanwhile, the 45 to 64 years age bracket for the primary householder has the lowest median household income of $0, with 138 households (32.6%) in this group.
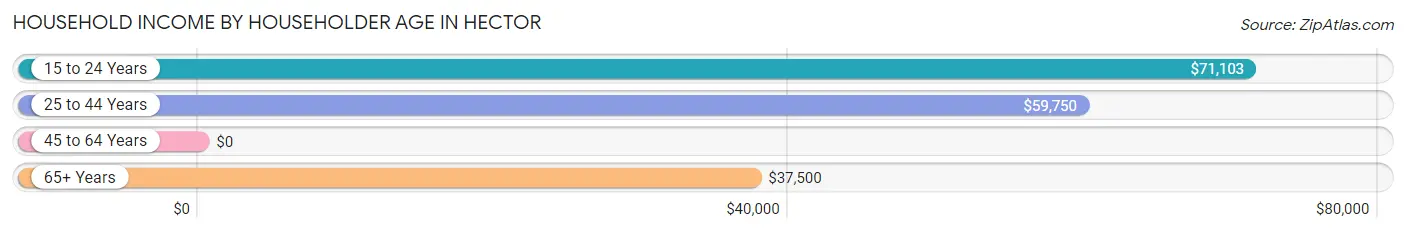
| Income Bracket | # Households | Median Income |
| 15 to 24 Years | 25 (5.9%) | $71,103 |
| 25 to 44 Years | 105 (24.8%) | $59,750 |
| 45 to 64 Years | 138 (32.6%) | $0 |
| 65+ Years | 156 (36.8%) | $37,500 |
| Total | 424 (100.0%) | $57,788 |
Poverty in Hector
Income Below Poverty by Sex and Age in Hector
With 4.8% poverty level for males and 7.3% for females among the residents of Hector, 75 year old and over males and 25 to 34 year old females are the most vulnerable to poverty, with 10 males (27.8%) and 10 females (29.4%) in their respective age groups living below the poverty level.
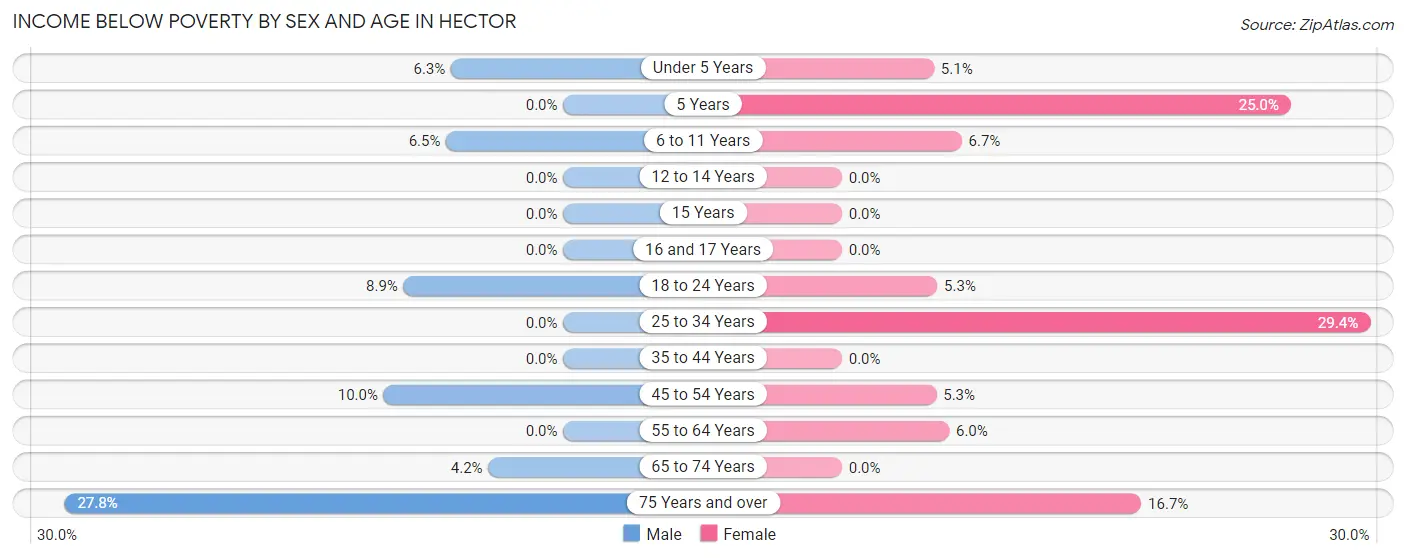
| Age Bracket | Male | Female |
| Under 5 Years | 2 (6.2%) | 2 (5.1%) |
| 5 Years | 0 (0.0%) | 2 (25.0%) |
| 6 to 11 Years | 3 (6.5%) | 2 (6.7%) |
| 12 to 14 Years | 0 (0.0%) | 0 (0.0%) |
| 15 Years | 0 (0.0%) | 0 (0.0%) |
| 16 and 17 Years | 0 (0.0%) | 0 (0.0%) |
| 18 to 24 Years | 4 (8.9%) | 6 (5.3%) |
| 25 to 34 Years | 0 (0.0%) | 10 (29.4%) |
| 35 to 44 Years | 0 (0.0%) | 0 (0.0%) |
| 45 to 54 Years | 6 (10.0%) | 3 (5.3%) |
| 55 to 64 Years | 0 (0.0%) | 4 (6.0%) |
| 65 to 74 Years | 2 (4.2%) | 0 (0.0%) |
| 75 Years and over | 10 (27.8%) | 11 (16.7%) |
| Total | 27 (4.8%) | 40 (7.3%) |
Income Above Poverty by Sex and Age in Hector
According to the poverty statistics in Hector, males aged 5 years and females aged 12 to 14 years are the age groups that are most secure financially, with 100.0% of males and 100.0% of females in these age groups living above the poverty line.
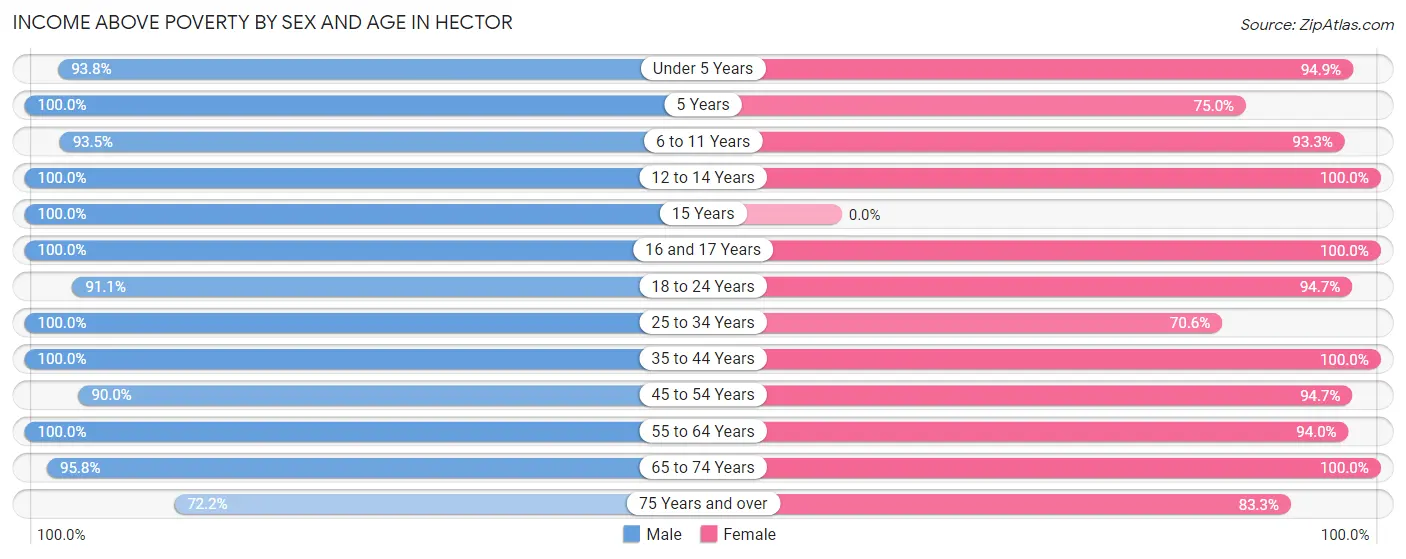
| Age Bracket | Male | Female |
| Under 5 Years | 30 (93.8%) | 37 (94.9%) |
| 5 Years | 13 (100.0%) | 6 (75.0%) |
| 6 to 11 Years | 43 (93.5%) | 28 (93.3%) |
| 12 to 14 Years | 9 (100.0%) | 23 (100.0%) |
| 15 Years | 12 (100.0%) | 0 (0.0%) |
| 16 and 17 Years | 3 (100.0%) | 5 (100.0%) |
| 18 to 24 Years | 41 (91.1%) | 107 (94.7%) |
| 25 to 34 Years | 115 (100.0%) | 24 (70.6%) |
| 35 to 44 Years | 57 (100.0%) | 59 (100.0%) |
| 45 to 54 Years | 54 (90.0%) | 54 (94.7%) |
| 55 to 64 Years | 85 (100.0%) | 63 (94.0%) |
| 65 to 74 Years | 46 (95.8%) | 48 (100.0%) |
| 75 Years and over | 26 (72.2%) | 55 (83.3%) |
| Total | 534 (95.2%) | 509 (92.7%) |
Income Below Poverty Among Married-Couple Families in Hector
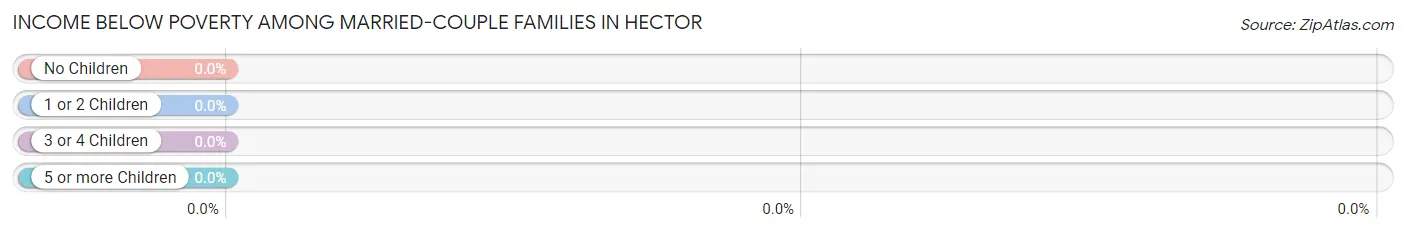
| Children | Above Poverty | Below Poverty |
| No Children | 111 (100.0%) | 0 (0.0%) |
| 1 or 2 Children | 34 (100.0%) | 0 (0.0%) |
| 3 or 4 Children | 18 (100.0%) | 0 (0.0%) |
| 5 or more Children | 5 (100.0%) | 0 (0.0%) |
| Total | 168 (100.0%) | 0 (0.0%) |
Income Below Poverty Among Single-Parent Households in Hector
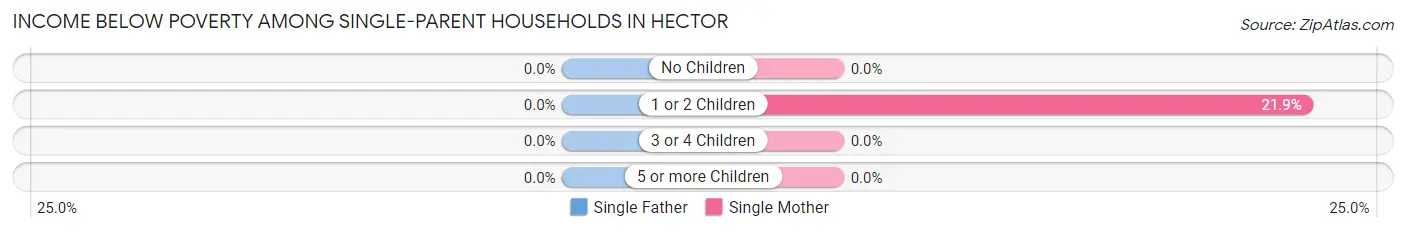
| Children | Single Father | Single Mother |
| No Children | 0 (0.0%) | 0 (0.0%) |
| 1 or 2 Children | 0 (0.0%) | 7 (21.9%) |
| 3 or 4 Children | 0 (0.0%) | 0 (0.0%) |
| 5 or more Children | 0 (0.0%) | 0 (0.0%) |
| Total | 0 (0.0%) | 7 (11.7%) |
Income Below Poverty Among Married-Couple vs Single-Parent Households in Hector
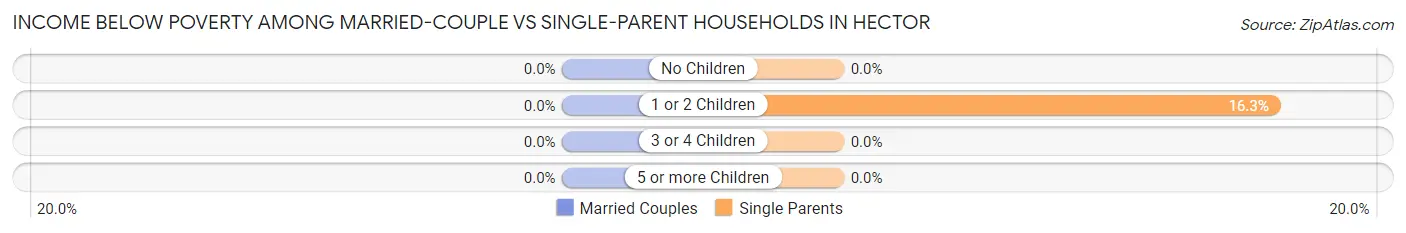
| Children | Married-Couple Families | Single-Parent Households |
| No Children | 0 (0.0%) | 0 (0.0%) |
| 1 or 2 Children | 0 (0.0%) | 7 (16.3%) |
| 3 or 4 Children | 0 (0.0%) | 0 (0.0%) |
| 5 or more Children | 0 (0.0%) | 0 (0.0%) |
| Total | 0 (0.0%) | 7 (8.4%) |
Race in Hector
The most populous races in Hector are White / Caucasian (1,001 | 88.8%), Two or more Races (81 | 7.2%), and Hispanic or Latino (74 | 6.6%).
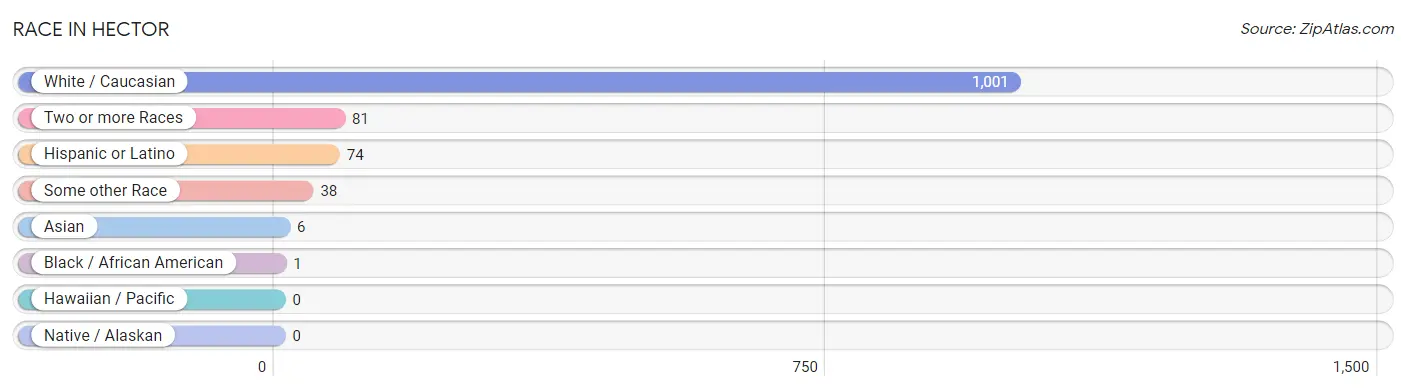
| Race | # Population | % Population |
| Asian | 6 | 0.5% |
| Black / African American | 1 | 0.1% |
| Hawaiian / Pacific | 0 | 0.0% |
| Hispanic or Latino | 74 | 6.6% |
| Native / Alaskan | 0 | 0.0% |
| White / Caucasian | 1,001 | 88.8% |
| Two or more Races | 81 | 7.2% |
| Some other Race | 38 | 3.4% |
| Total | 1,127 | 100.0% |
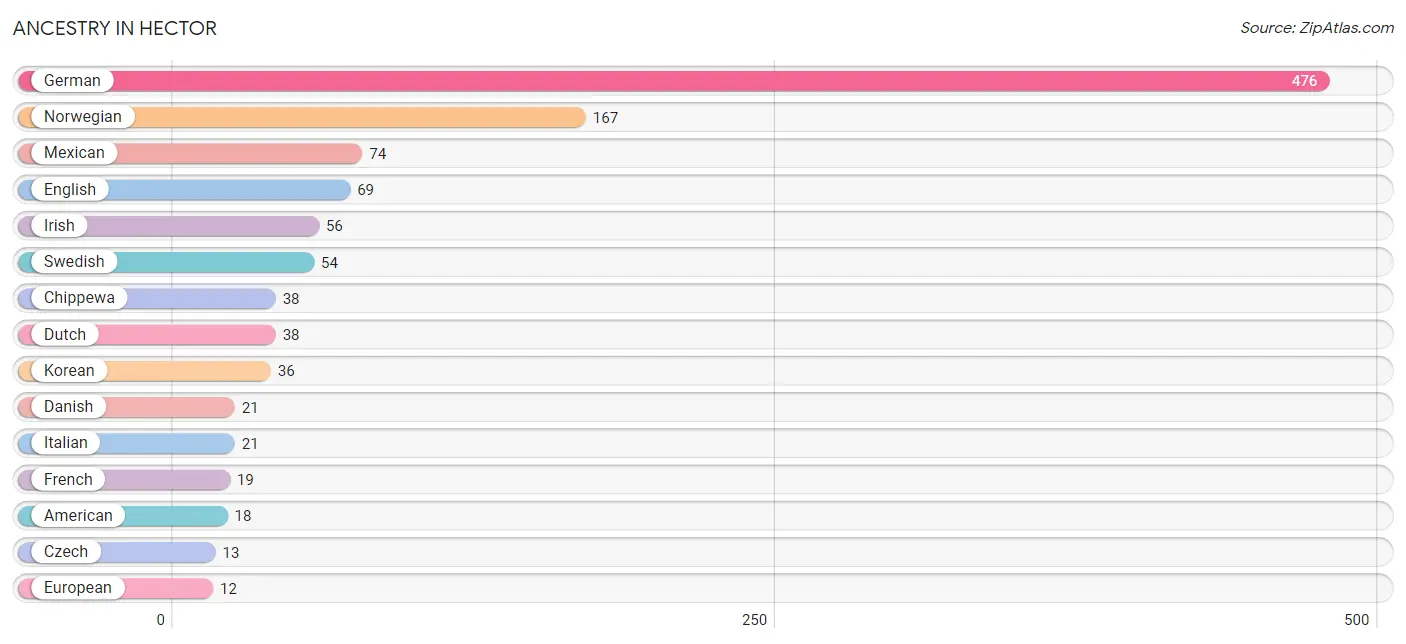
Ancestry in Hector
The most populous ancestries reported in Hector are German (476 | 42.2%), Norwegian (167 | 14.8%), Mexican (74 | 6.6%), English (69 | 6.1%), and Irish (56 | 5.0%), together accounting for 74.7% of all Hector residents.
| Ancestry | # Population | % Population |
| American | 18 | 1.6% |
| Belgian | 3 | 0.3% |
| Chippewa | 38 | 3.4% |
| Czech | 13 | 1.1% |
| Danish | 21 | 1.9% |
| Dutch | 38 | 3.4% |
| English | 69 | 6.1% |
| European | 12 | 1.1% |
| French | 19 | 1.7% |
| German | 476 | 42.2% |
| Indonesian | 6 | 0.5% |
| Irish | 56 | 5.0% |
| Italian | 21 | 1.9% |
| Korean | 36 | 3.2% |
| Mexican | 74 | 6.6% |
| Northern European | 3 | 0.3% |
| Norwegian | 167 | 14.8% |
| Polish | 3 | 0.3% |
| Russian | 7 | 0.6% |
| Scandinavian | 7 | 0.6% |
| Scottish | 3 | 0.3% |
| Slavic | 4 | 0.4% |
| Swedish | 54 | 4.8% |
| Ukrainian | 2 | 0.2% |
| Yugoslavian | 4 | 0.4% | View All 25 Rows |
Immigrants in Hector
The most numerous immigrant groups reported in Hector came from Central America (13 | 1.1%), Latin America (13 | 1.1%), Mexico (13 | 1.1%), Asia (6 | 0.5%), and South Eastern Asia (6 | 0.5%), together accounting for 4.5% of all Hector residents.
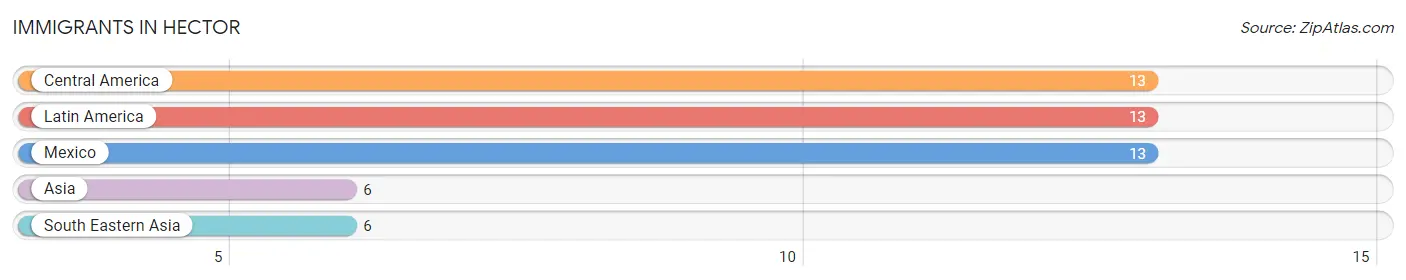
| Immigration Origin | # Population | % Population |
| Asia | 6 | 0.5% |
| Central America | 13 | 1.1% |
| Latin America | 13 | 1.1% |
| Mexico | 13 | 1.1% |
| South Eastern Asia | 6 | 0.5% | View All 5 Rows |
Sex and Age in Hector
Sex and Age in Hector
The most populous age groups in Hector are 25 to 29 Years (62 | 11.0%) for men and 20 to 24 Years (103 | 18.2%) for women.
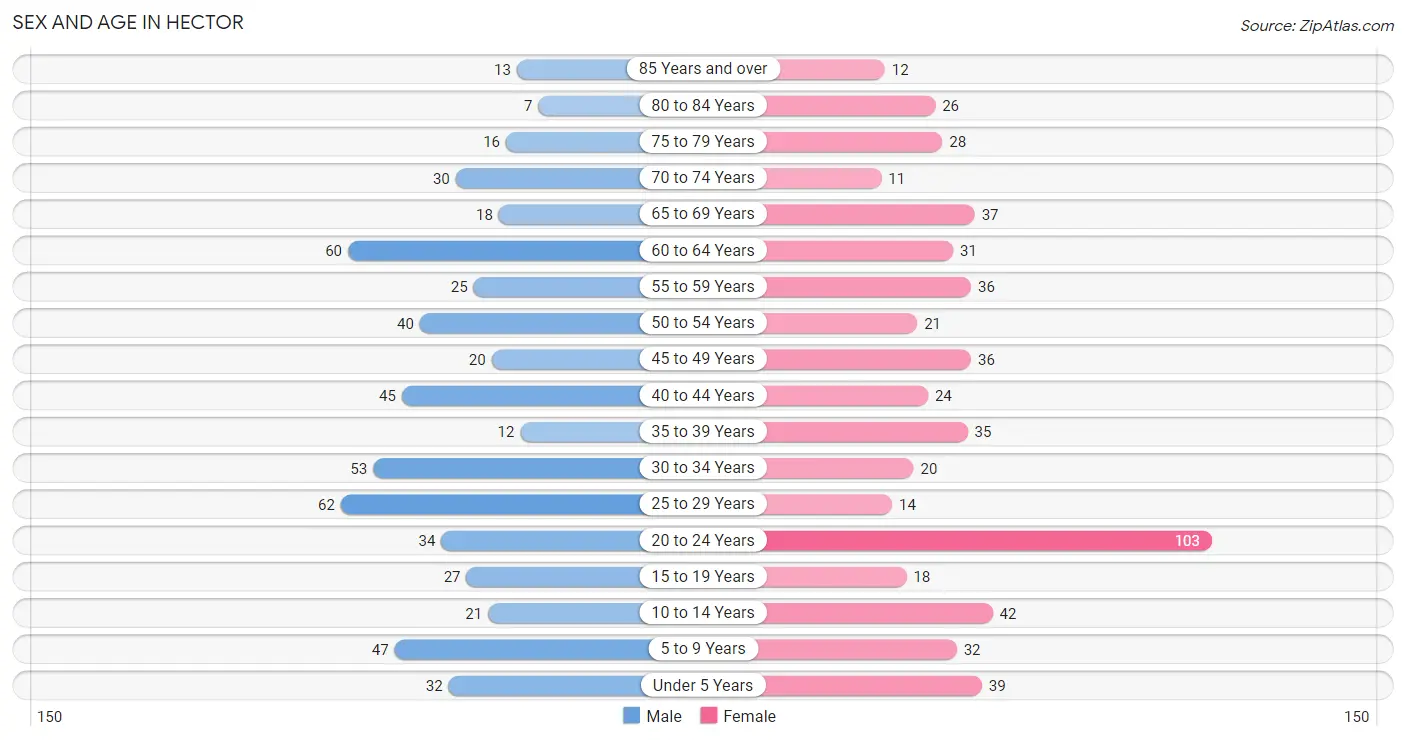
| Age Bracket | Male | Female |
| Under 5 Years | 32 (5.7%) | 39 (6.9%) |
| 5 to 9 Years | 47 (8.4%) | 32 (5.7%) |
| 10 to 14 Years | 21 (3.7%) | 42 (7.4%) |
| 15 to 19 Years | 27 (4.8%) | 18 (3.2%) |
| 20 to 24 Years | 34 (6.0%) | 103 (18.2%) |
| 25 to 29 Years | 62 (11.0%) | 14 (2.5%) |
| 30 to 34 Years | 53 (9.4%) | 20 (3.5%) |
| 35 to 39 Years | 12 (2.1%) | 35 (6.2%) |
| 40 to 44 Years | 45 (8.0%) | 24 (4.3%) |
| 45 to 49 Years | 20 (3.6%) | 36 (6.4%) |
| 50 to 54 Years | 40 (7.1%) | 21 (3.7%) |
| 55 to 59 Years | 25 (4.4%) | 36 (6.4%) |
| 60 to 64 Years | 60 (10.7%) | 31 (5.5%) |
| 65 to 69 Years | 18 (3.2%) | 37 (6.6%) |
| 70 to 74 Years | 30 (5.3%) | 11 (1.9%) |
| 75 to 79 Years | 16 (2.9%) | 28 (5.0%) |
| 80 to 84 Years | 7 (1.3%) | 26 (4.6%) |
| 85 Years and over | 13 (2.3%) | 12 (2.1%) |
| Total | 562 (100.0%) | 565 (100.0%) |
Families and Households in Hector
Median Family Size in Hector
The median family size in Hector is 3.32 persons per family, with single female/mother families (60 | 23.9%) accounting for the largest median family size of 3.43 persons per family. On the other hand, single male/father families (23 | 9.2%) represent the smallest median family size with 2.91 persons per family.
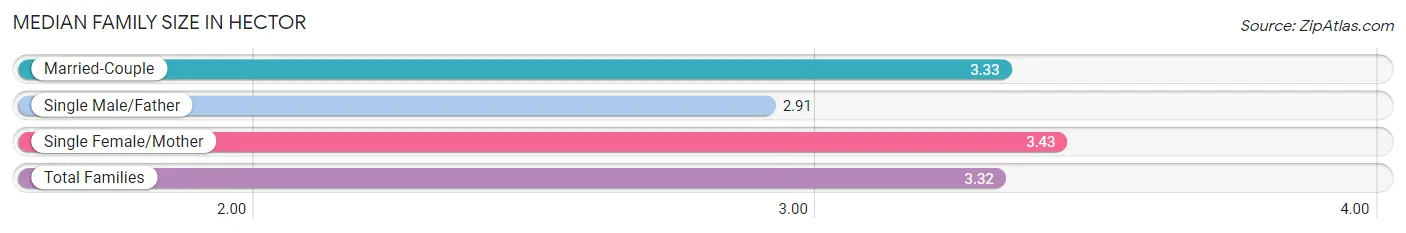
| Family Type | # Families | Family Size |
| Married-Couple | 168 (66.9%) | 3.33 |
| Single Male/Father | 23 (9.2%) | 2.91 |
| Single Female/Mother | 60 (23.9%) | 3.43 |
| Total Families | 251 (100.0%) | 3.32 |
Median Household Size in Hector
The median household size in Hector is 2.65 persons per household, with single female/mother households (60 | 14.1%) accounting for the largest median household size of 4.28 persons per household. non-family households (173 | 40.8%) represent the smallest median household size with 1.21 persons per household.
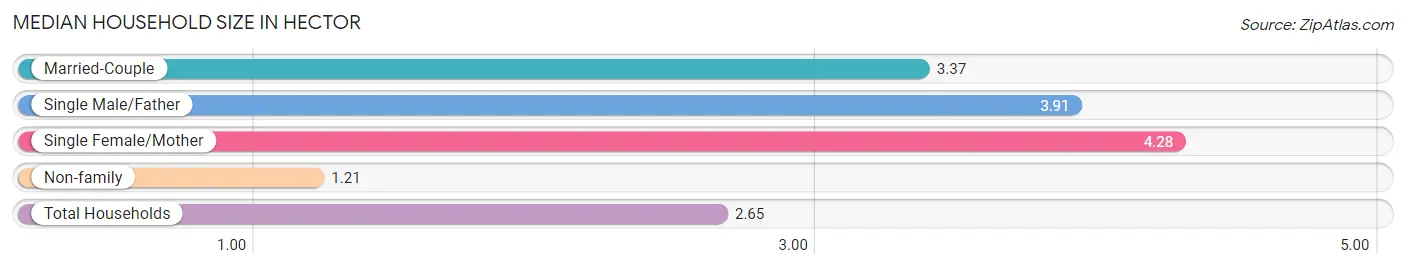
| Household Type | # Households | Household Size |
| Married-Couple | 168 (39.6%) | 3.37 |
| Single Male/Father | 23 (5.4%) | 3.91 |
| Single Female/Mother | 60 (14.1%) | 4.28 |
| Non-family | 173 (40.8%) | 1.21 |
| Total Households | 424 (100.0%) | 2.65 |
Household Size by Marriage Status in Hector
Out of a total of 424 households in Hector, 251 (59.2%) are family households, while 173 (40.8%) are nonfamily households. The most numerous type of family households are 2-person households, comprising 122, and the most common type of nonfamily households are 1-person households, comprising 142.
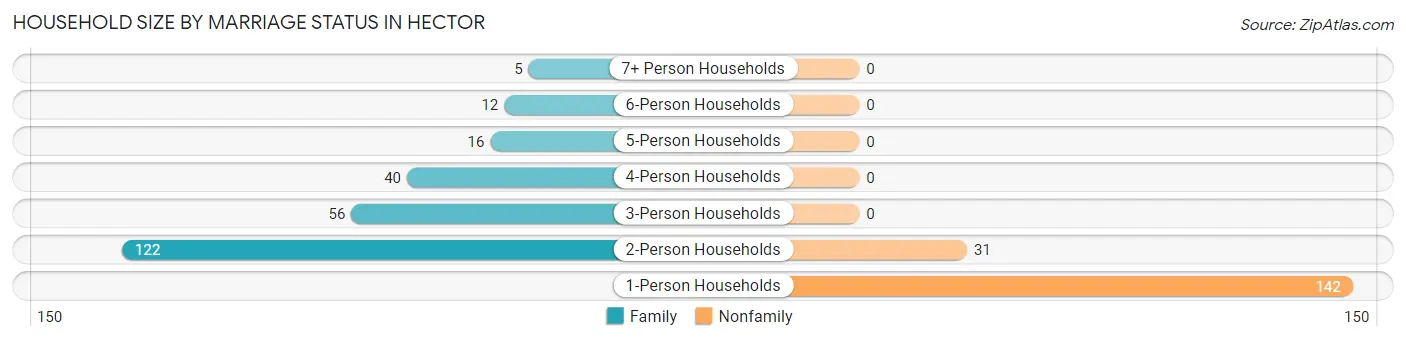
| Household Size | Family Households | Nonfamily Households |
| 1-Person Households | - | 142 (33.5%) |
| 2-Person Households | 122 (28.8%) | 31 (7.3%) |
| 3-Person Households | 56 (13.2%) | 0 (0.0%) |
| 4-Person Households | 40 (9.4%) | 0 (0.0%) |
| 5-Person Households | 16 (3.8%) | 0 (0.0%) |
| 6-Person Households | 12 (2.8%) | 0 (0.0%) |
| 7+ Person Households | 5 (1.2%) | 0 (0.0%) |
| Total | 251 (59.2%) | 173 (40.8%) |
Female Fertility in Hector
Fertility by Age in Hector
Average fertility rate in Hector is 20.0 births per 1,000 women. Women in the age bracket of 20 to 34 years have the highest fertility rate with 36.0 births per 1,000 women. Women in the age bracket of 20 to 34 years acount for 100.0% of all women with births.
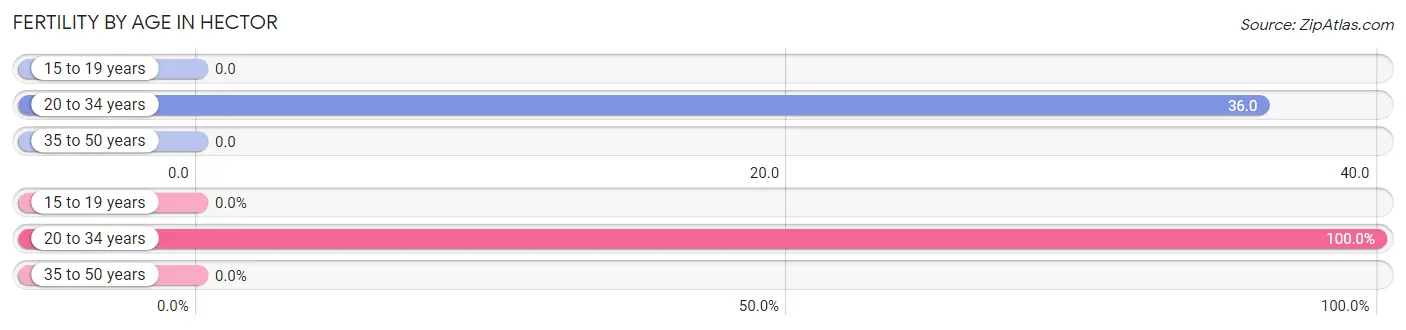
| Age Bracket | Women with Births | Births / 1,000 Women |
| 15 to 19 years | 0 (0.0%) | 0.0 |
| 20 to 34 years | 5 (100.0%) | 36.0 |
| 35 to 50 years | 0 (0.0%) | 0.0 |
| Total | 5 (100.0%) | 20.0 |
Fertility by Age by Marriage Status in Hector
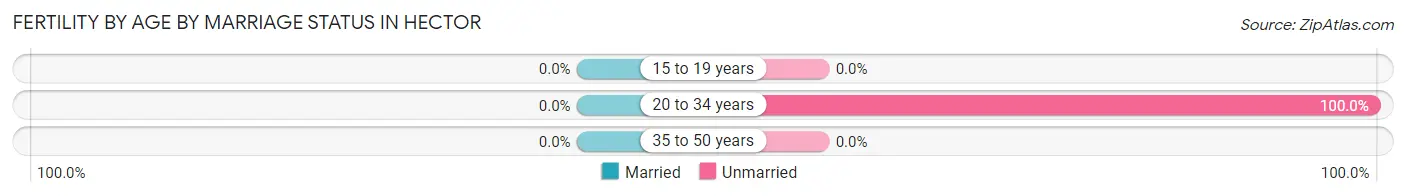
| Age Bracket | Married | Unmarried |
| 15 to 19 years | 0 (0.0%) | 0 (0.0%) |
| 20 to 34 years | 0 (0.0%) | 5 (100.0%) |
| 35 to 50 years | 0 (0.0%) | 0 (0.0%) |
| Total | 0 (0.0%) | 5 (100.0%) |
Fertility by Education in Hector
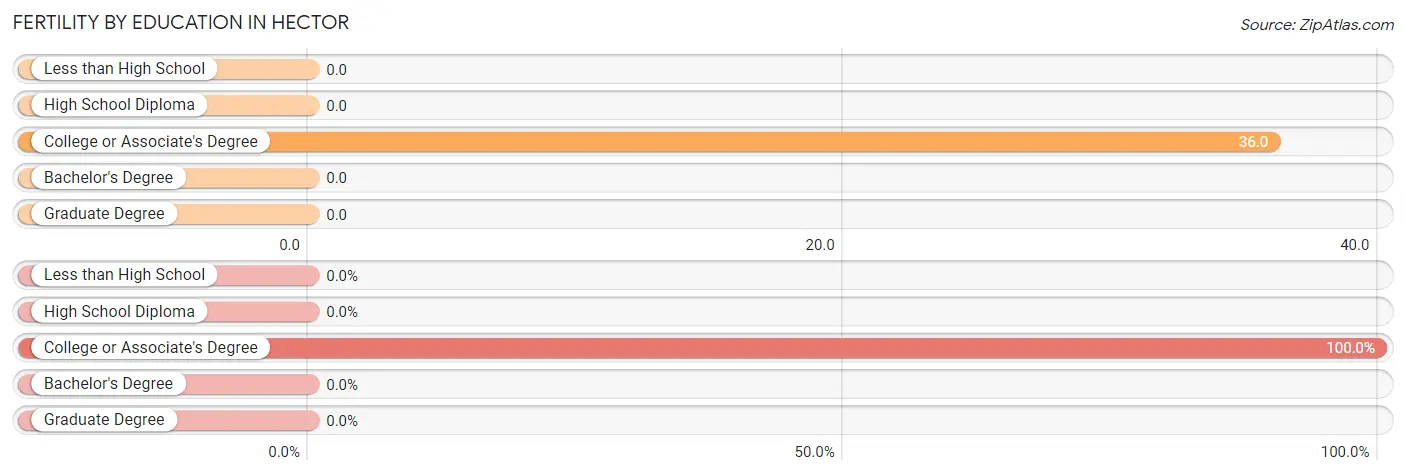
| Educational Attainment | Women with Births | Births / 1,000 Women |
| Less than High School | 0 (0.0%) | 0.0 |
| High School Diploma | 0 (0.0%) | 0.0 |
| College or Associate's Degree | 5 (100.0%) | 36.0 |
| Bachelor's Degree | 0 (0.0%) | 0.0 |
| Graduate Degree | 0 (0.0%) | 0.0 |
| Total | 5 (100.0%) | 20.0 |
Fertility by Education by Marriage Status in Hector
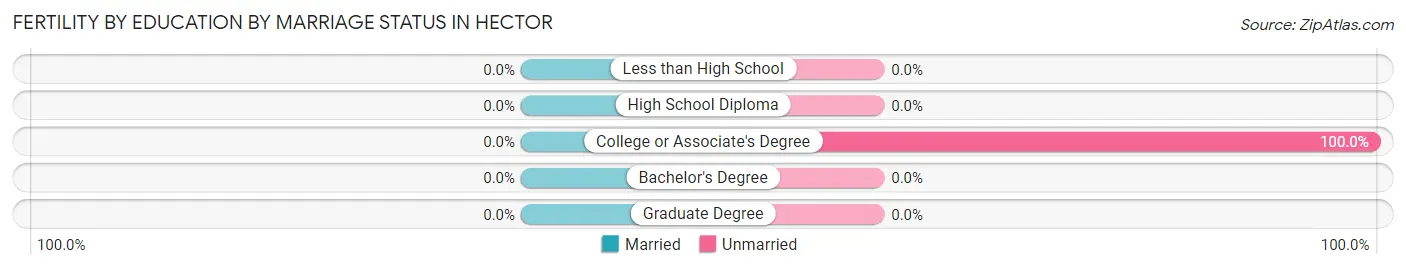
| Educational Attainment | Married | Unmarried |
| Less than High School | 0 (0.0%) | 0 (0.0%) |
| High School Diploma | 0 (0.0%) | 0 (0.0%) |
| College or Associate's Degree | 0 (0.0%) | 5 (100.0%) |
| Bachelor's Degree | 0 (0.0%) | 0 (0.0%) |
| Graduate Degree | 0 (0.0%) | 0 (0.0%) |
| Total | 0 (0.0%) | 5 (100.0%) |
Employment Characteristics in Hector
Employment by Class of Employer in Hector
Among the 618 employed individuals in Hector, private company employees (477 | 77.2%), not-for-profit organizations (66 | 10.7%), and local government employees (34 | 5.5%) make up the most common classes of employment.
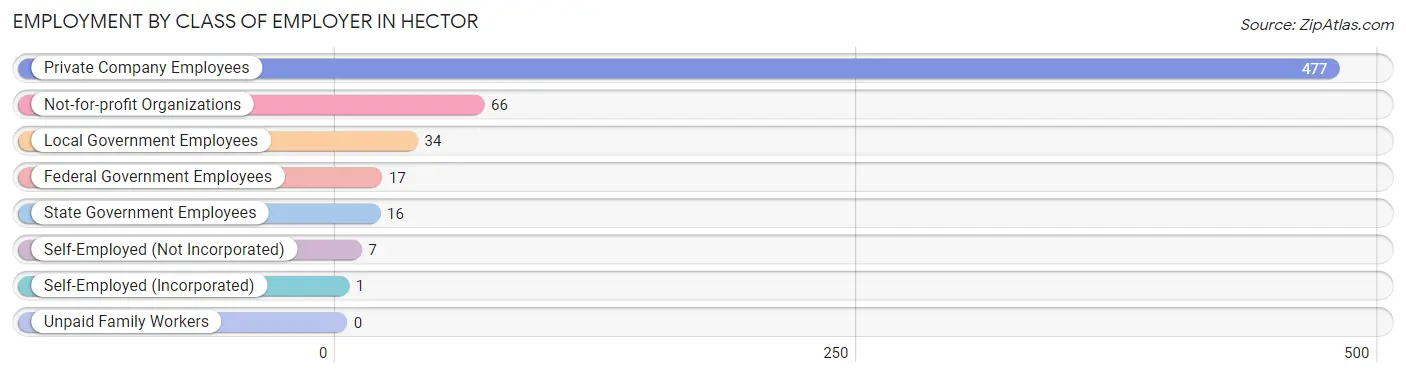
| Employer Class | # Employees | % Employees |
| Private Company Employees | 477 | 77.2% |
| Self-Employed (Incorporated) | 1 | 0.2% |
| Self-Employed (Not Incorporated) | 7 | 1.1% |
| Not-for-profit Organizations | 66 | 10.7% |
| Local Government Employees | 34 | 5.5% |
| State Government Employees | 16 | 2.6% |
| Federal Government Employees | 17 | 2.8% |
| Unpaid Family Workers | 0 | 0.0% |
| Total | 618 | 100.0% |
Employment Status by Age in Hector
According to the labor force statistics for Hector, out of the total population over 16 years of age (901), 70.9% or 639 individuals are in the labor force, with 0.9% or 6 of them unemployed. The age group with the highest labor force participation rate is 20 to 24 years, with 100.0% or 137 individuals in the labor force. Within the labor force, the 16 to 19 years age range has the highest percentage of unemployed individuals, with 18.2% or 5 of them being unemployed.
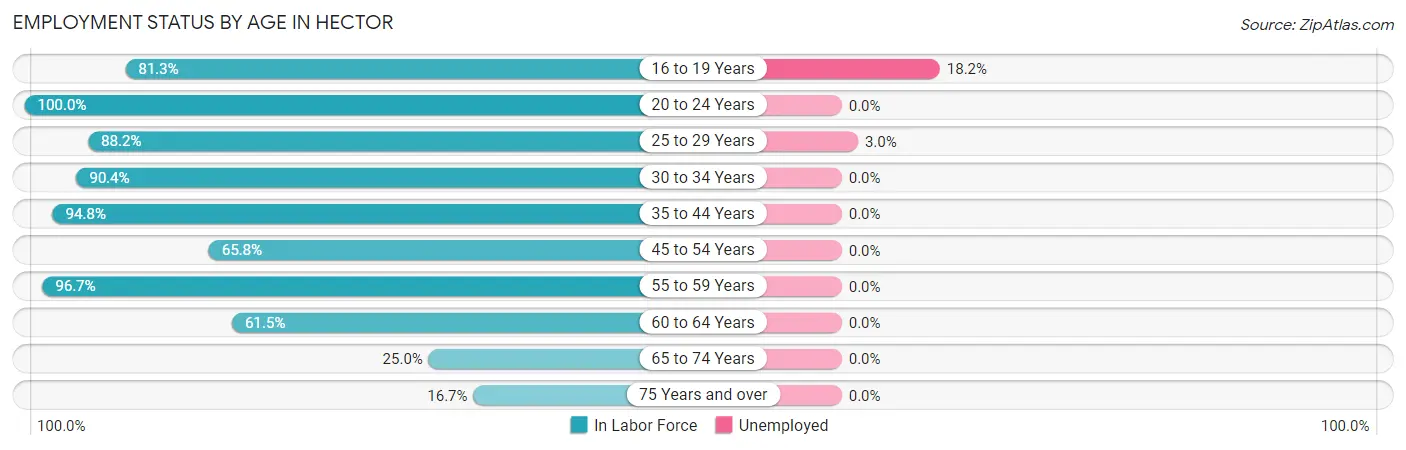
| Age Bracket | In Labor Force | Unemployed |
| 16 to 19 Years | 26 (81.3%) | 5 (18.2%) |
| 20 to 24 Years | 137 (100.0%) | 0 (0.0%) |
| 25 to 29 Years | 67 (88.2%) | 2 (3.0%) |
| 30 to 34 Years | 66 (90.4%) | 0 (0.0%) |
| 35 to 44 Years | 110 (94.8%) | 0 (0.0%) |
| 45 to 54 Years | 77 (65.8%) | 0 (0.0%) |
| 55 to 59 Years | 59 (96.7%) | 0 (0.0%) |
| 60 to 64 Years | 56 (61.5%) | 0 (0.0%) |
| 65 to 74 Years | 24 (25.0%) | 0 (0.0%) |
| 75 Years and over | 17 (16.7%) | 0 (0.0%) |
| Total | 639 (70.9%) | 6 (0.9%) |
Employment Status by Educational Attainment in Hector
According to labor force statistics for Hector, 81.5% of individuals (435) out of the total population between 25 and 64 years of age (534) are in the labor force, with 0.5% or 2 of them being unemployed. The group with the highest labor force participation rate are those with the educational attainment of bachelor's degree or higher, with 100.0% or 74 individuals in the labor force. Within the labor force, individuals with less than high school education have the highest percentage of unemployment, with 3.4% or 2 of them being unemployed.
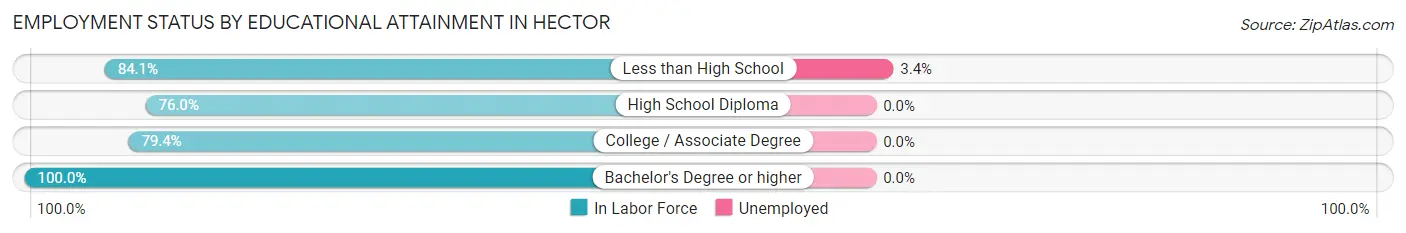
| Educational Attainment | In Labor Force | Unemployed |
| Less than High School | 58 (84.1%) | 2 (3.4%) |
| High School Diploma | 168 (76.0%) | 0 (0.0%) |
| College / Associate Degree | 135 (79.4%) | 0 (0.0%) |
| Bachelor's Degree or higher | 74 (100.0%) | 0 (0.0%) |
| Total | 435 (81.5%) | 3 (0.5%) |
Employment Occupations by Sex in Hector
Management, Business, Science and Arts Occupations
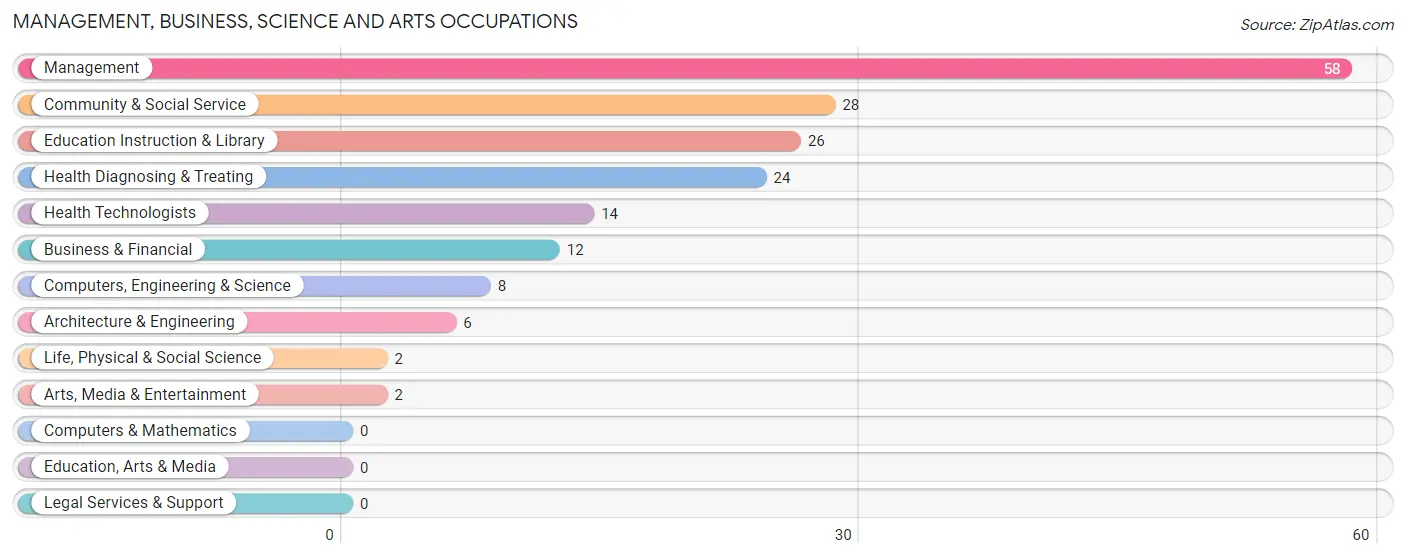
The most common Management, Business, Science and Arts occupations in Hector are Management (58 | 9.2%), Community & Social Service (28 | 4.4%), Education Instruction & Library (26 | 4.1%), Health Diagnosing & Treating (24 | 3.8%), and Health Technologists (14 | 2.2%).
Management, Business, Science and Arts Occupations by Sex
Within the Management, Business, Science and Arts occupations in Hector, the most male-oriented occupations are Computers, Engineering & Science (100.0%), Architecture & Engineering (100.0%), and Life, Physical & Social Science (100.0%), while the most female-oriented occupations are Health Diagnosing & Treating (100.0%), Health Technologists (100.0%), and Education Instruction & Library (61.5%).
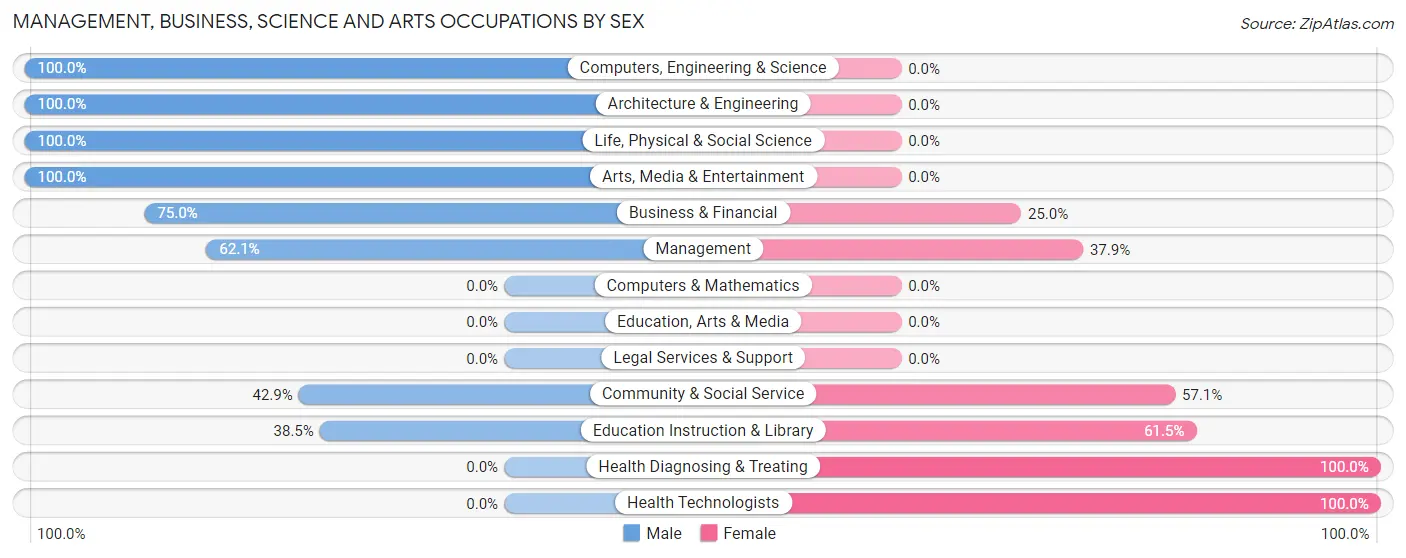
| Occupation | Male | Female |
| Management | 36 (62.1%) | 22 (37.9%) |
| Business & Financial | 9 (75.0%) | 3 (25.0%) |
| Computers, Engineering & Science | 8 (100.0%) | 0 (0.0%) |
| Computers & Mathematics | 0 (0.0%) | 0 (0.0%) |
| Architecture & Engineering | 6 (100.0%) | 0 (0.0%) |
| Life, Physical & Social Science | 2 (100.0%) | 0 (0.0%) |
| Community & Social Service | 12 (42.9%) | 16 (57.1%) |
| Education, Arts & Media | 0 (0.0%) | 0 (0.0%) |
| Legal Services & Support | 0 (0.0%) | 0 (0.0%) |
| Education Instruction & Library | 10 (38.5%) | 16 (61.5%) |
| Arts, Media & Entertainment | 2 (100.0%) | 0 (0.0%) |
| Health Diagnosing & Treating | 0 (0.0%) | 24 (100.0%) |
| Health Technologists | 0 (0.0%) | 14 (100.0%) |
| Total (Category) | 65 (50.0%) | 65 (50.0%) |
| Total (Overall) | 313 (49.8%) | 316 (50.2%) |
Services Occupations
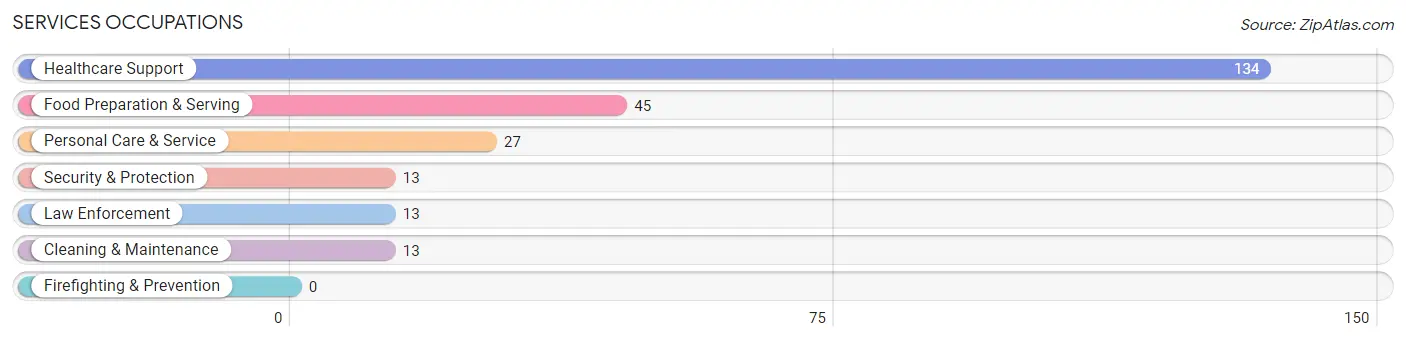
The most common Services occupations in Hector are Healthcare Support (134 | 21.3%), Food Preparation & Serving (45 | 7.1%), Personal Care & Service (27 | 4.3%), Security & Protection (13 | 2.1%), and Law Enforcement (13 | 2.1%).
Services Occupations by Sex
Within the Services occupations in Hector, the most male-oriented occupations are Security & Protection (100.0%), Law Enforcement (100.0%), and Cleaning & Maintenance (100.0%), while the most female-oriented occupations are Healthcare Support (73.1%), Food Preparation & Serving (26.7%), and Personal Care & Service (7.4%).
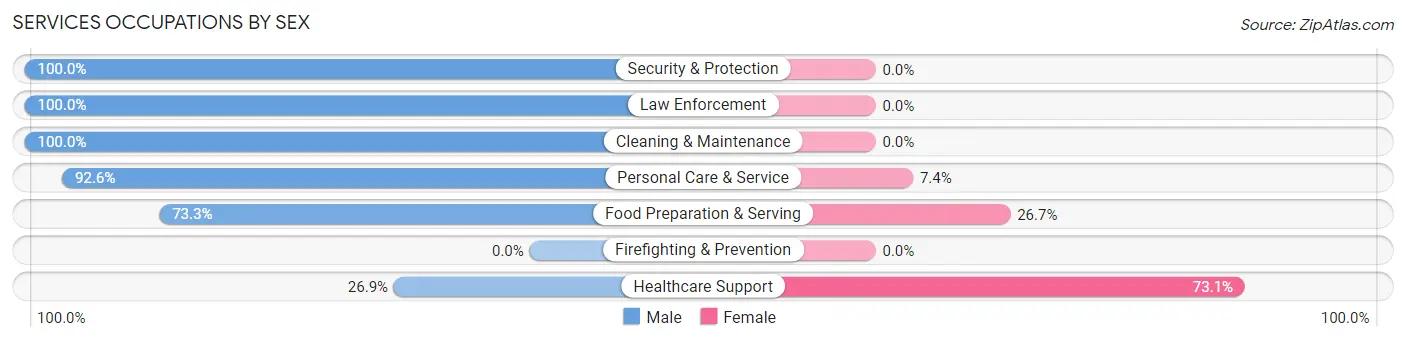
| Occupation | Male | Female |
| Healthcare Support | 36 (26.9%) | 98 (73.1%) |
| Security & Protection | 13 (100.0%) | 0 (0.0%) |
| Firefighting & Prevention | 0 (0.0%) | 0 (0.0%) |
| Law Enforcement | 13 (100.0%) | 0 (0.0%) |
| Food Preparation & Serving | 33 (73.3%) | 12 (26.7%) |
| Cleaning & Maintenance | 13 (100.0%) | 0 (0.0%) |
| Personal Care & Service | 25 (92.6%) | 2 (7.4%) |
| Total (Category) | 120 (51.7%) | 112 (48.3%) |
| Total (Overall) | 313 (49.8%) | 316 (50.2%) |
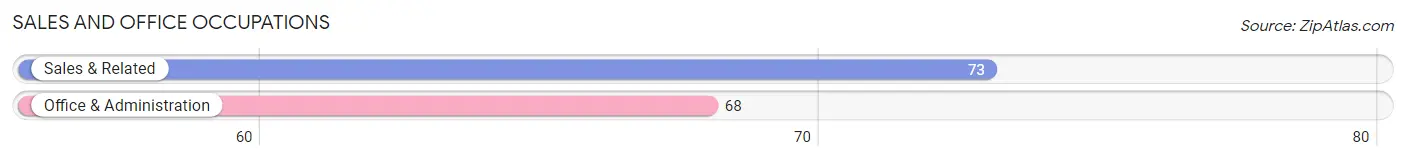
Sales and Office Occupations
The most common Sales and Office occupations in Hector are Sales & Related (73 | 11.6%), and Office & Administration (68 | 10.8%).
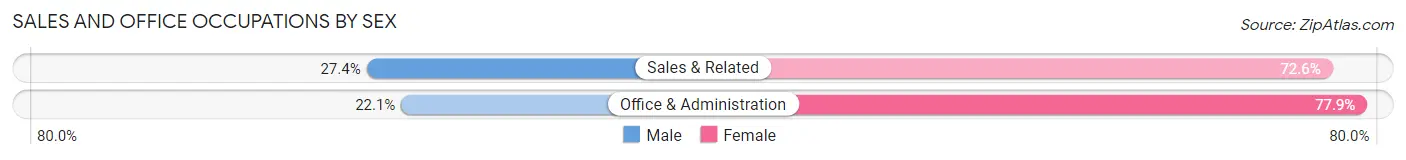
Sales and Office Occupations by Sex
| Occupation | Male | Female |
| Sales & Related | 20 (27.4%) | 53 (72.6%) |
| Office & Administration | 15 (22.1%) | 53 (77.9%) |
| Total (Category) | 35 (24.8%) | 106 (75.2%) |
| Total (Overall) | 313 (49.8%) | 316 (50.2%) |
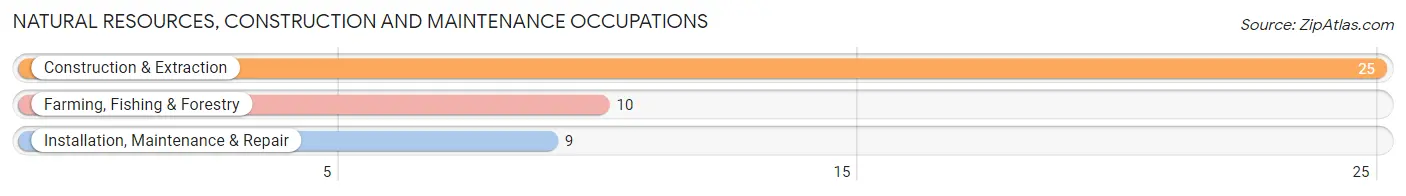
Natural Resources, Construction and Maintenance Occupations
The most common Natural Resources, Construction and Maintenance occupations in Hector are Construction & Extraction (25 | 4.0%), Farming, Fishing & Forestry (10 | 1.6%), and Installation, Maintenance & Repair (9 | 1.4%).
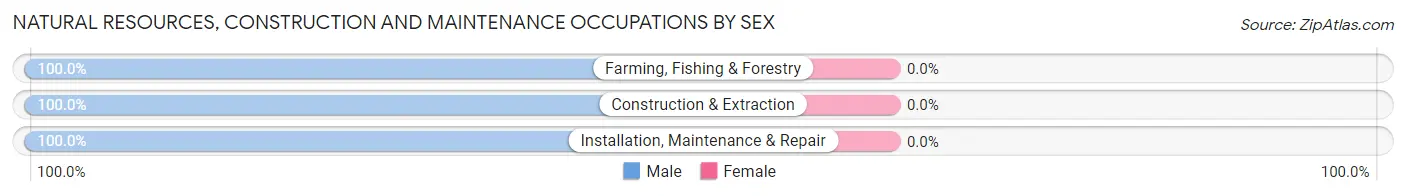
Natural Resources, Construction and Maintenance Occupations by Sex
| Occupation | Male | Female |
| Farming, Fishing & Forestry | 10 (100.0%) | 0 (0.0%) |
| Construction & Extraction | 25 (100.0%) | 0 (0.0%) |
| Installation, Maintenance & Repair | 9 (100.0%) | 0 (0.0%) |
| Total (Category) | 44 (100.0%) | 0 (0.0%) |
| Total (Overall) | 313 (49.8%) | 316 (50.2%) |
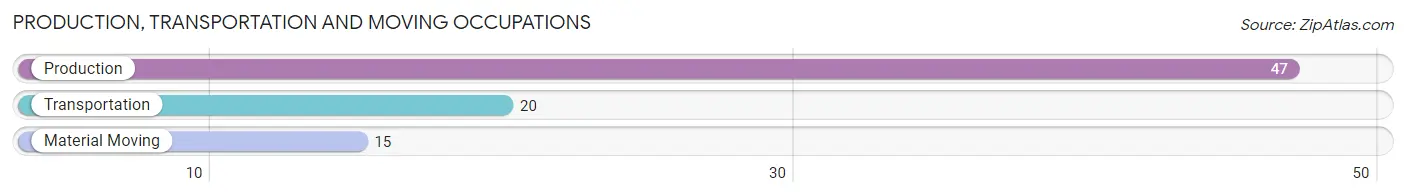
Production, Transportation and Moving Occupations
The most common Production, Transportation and Moving occupations in Hector are Production (47 | 7.5%), Transportation (20 | 3.2%), and Material Moving (15 | 2.4%).
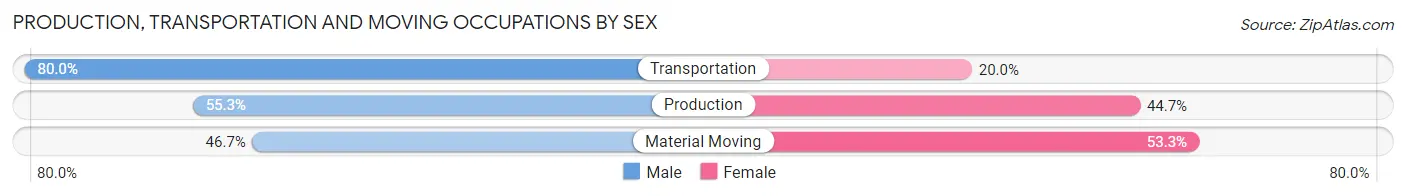
Production, Transportation and Moving Occupations by Sex
| Occupation | Male | Female |
| Production | 26 (55.3%) | 21 (44.7%) |
| Transportation | 16 (80.0%) | 4 (20.0%) |
| Material Moving | 7 (46.7%) | 8 (53.3%) |
| Total (Category) | 49 (59.8%) | 33 (40.2%) |
| Total (Overall) | 313 (49.8%) | 316 (50.2%) |
Employment Industries by Sex in Hector
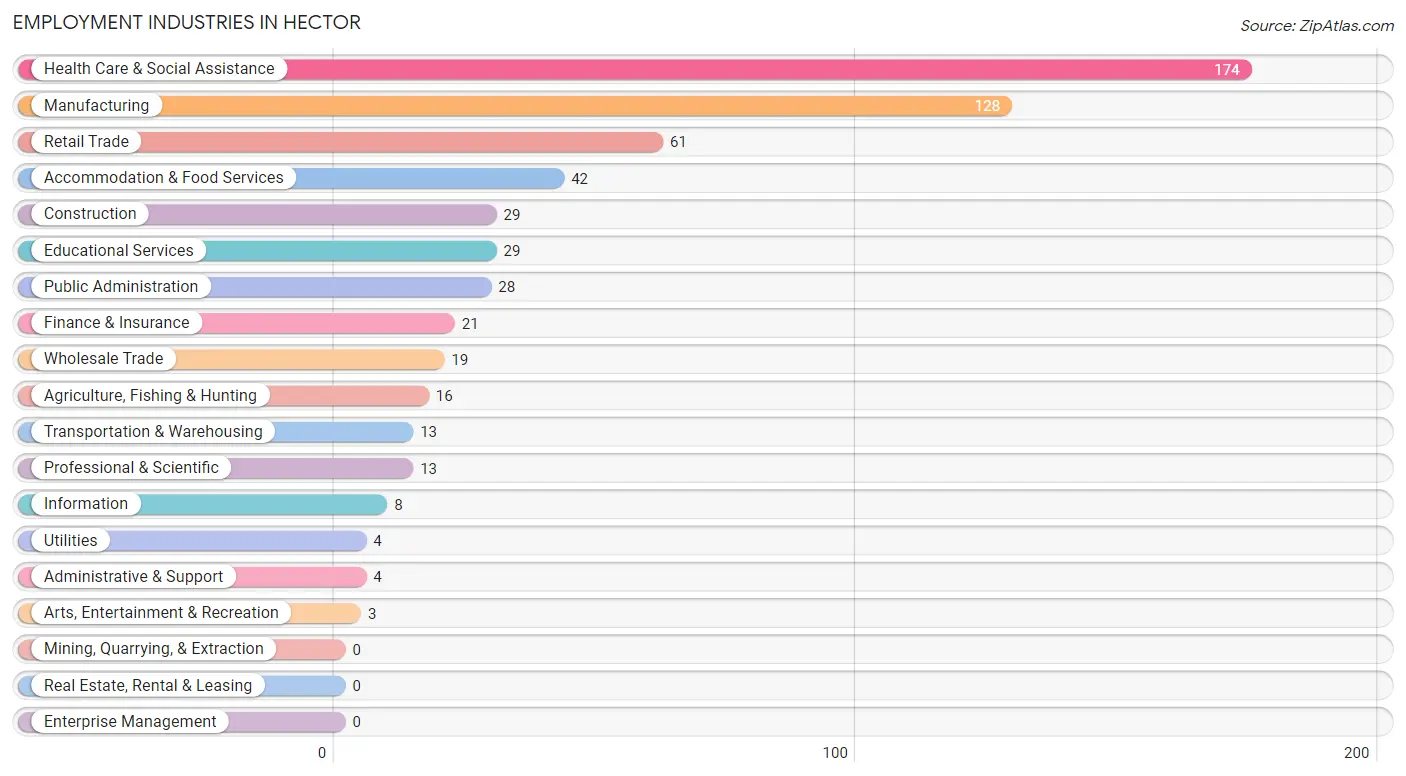
Employment Industries in Hector
The major employment industries in Hector include Health Care & Social Assistance (174 | 27.7%), Manufacturing (128 | 20.3%), Retail Trade (61 | 9.7%), Accommodation & Food Services (42 | 6.7%), and Construction (29 | 4.6%).
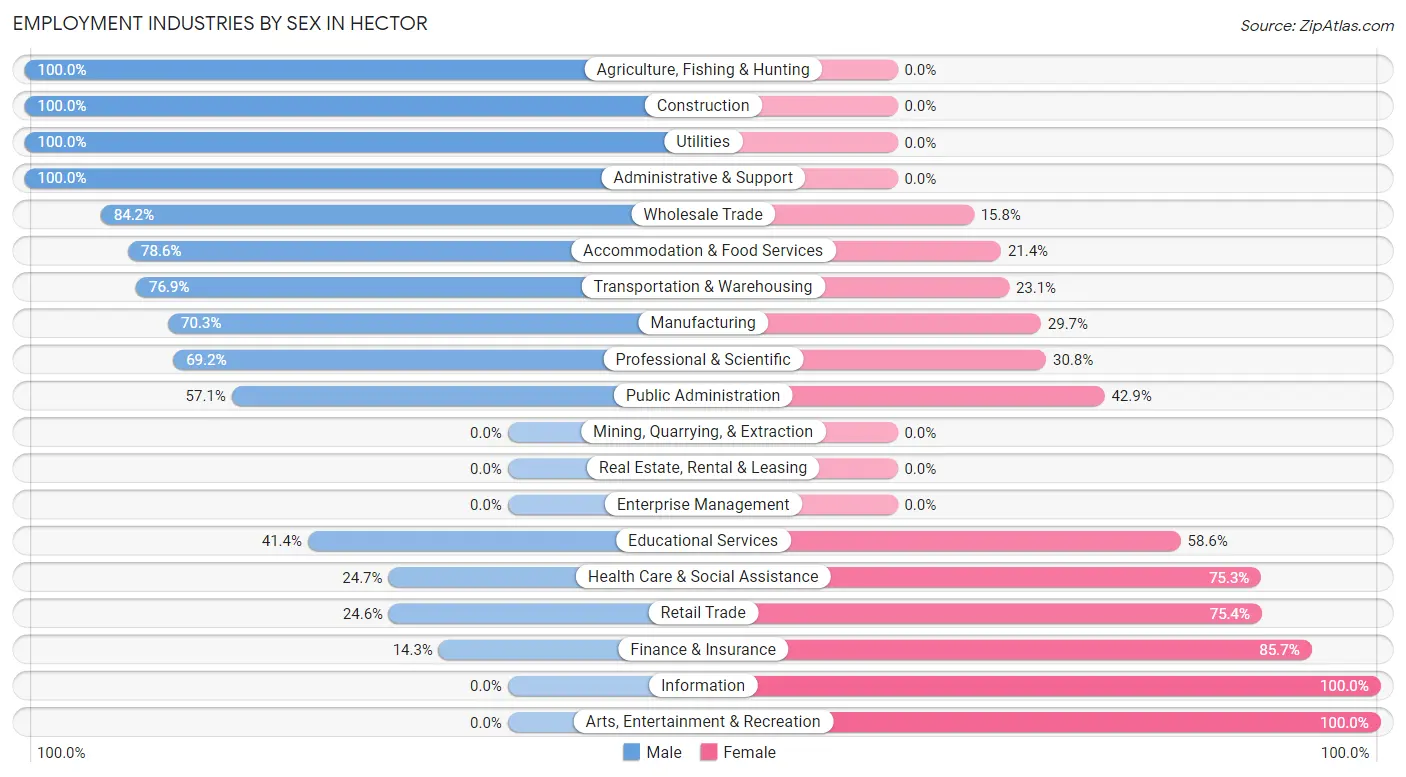
Employment Industries by Sex in Hector
The Hector industries that see more men than women are Agriculture, Fishing & Hunting (100.0%), Construction (100.0%), and Utilities (100.0%), whereas the industries that tend to have a higher number of women are Information (100.0%), Arts, Entertainment & Recreation (100.0%), and Finance & Insurance (85.7%).
| Industry | Male | Female |
| Agriculture, Fishing & Hunting | 16 (100.0%) | 0 (0.0%) |
| Mining, Quarrying, & Extraction | 0 (0.0%) | 0 (0.0%) |
| Construction | 29 (100.0%) | 0 (0.0%) |
| Manufacturing | 90 (70.3%) | 38 (29.7%) |
| Wholesale Trade | 16 (84.2%) | 3 (15.8%) |
| Retail Trade | 15 (24.6%) | 46 (75.4%) |
| Transportation & Warehousing | 10 (76.9%) | 3 (23.1%) |
| Utilities | 4 (100.0%) | 0 (0.0%) |
| Information | 0 (0.0%) | 8 (100.0%) |
| Finance & Insurance | 3 (14.3%) | 18 (85.7%) |
| Real Estate, Rental & Leasing | 0 (0.0%) | 0 (0.0%) |
| Professional & Scientific | 9 (69.2%) | 4 (30.8%) |
| Enterprise Management | 0 (0.0%) | 0 (0.0%) |
| Administrative & Support | 4 (100.0%) | 0 (0.0%) |
| Educational Services | 12 (41.4%) | 17 (58.6%) |
| Health Care & Social Assistance | 43 (24.7%) | 131 (75.3%) |
| Arts, Entertainment & Recreation | 0 (0.0%) | 3 (100.0%) |
| Accommodation & Food Services | 33 (78.6%) | 9 (21.4%) |
| Public Administration | 16 (57.1%) | 12 (42.9%) |
| Total | 313 (49.8%) | 316 (50.2%) |
Education in Hector
School Enrollment in Hector
The most common levels of schooling among the 262 students in Hector are college / undergraduate (73 | 27.9%), elementary school (70 | 26.7%), and high school (41 | 15.7%).
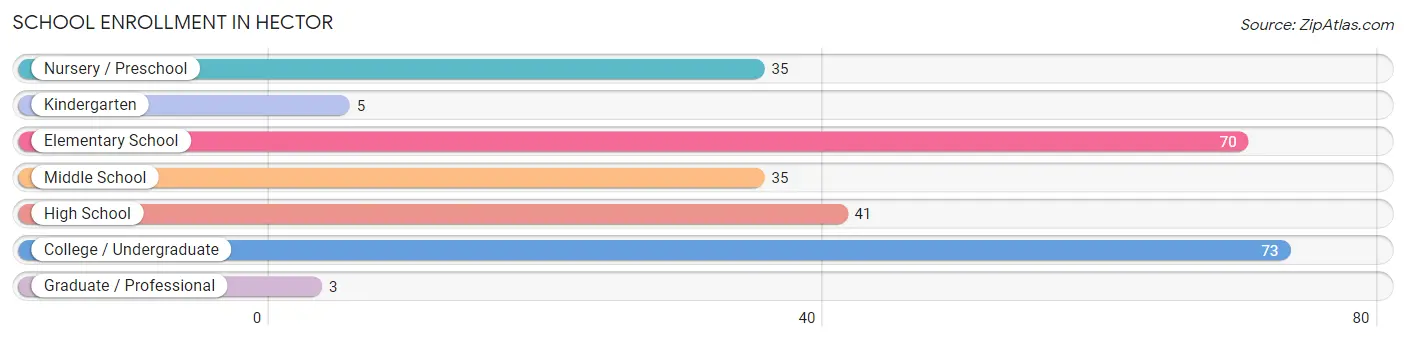
| School Level | # Students | % Students |
| Nursery / Preschool | 35 | 13.4% |
| Kindergarten | 5 | 1.9% |
| Elementary School | 70 | 26.7% |
| Middle School | 35 | 13.4% |
| High School | 41 | 15.7% |
| College / Undergraduate | 73 | 27.9% |
| Graduate / Professional | 3 | 1.1% |
| Total | 262 | 100.0% |
School Enrollment by Age by Funding Source in Hector
Out of a total of 262 students who are enrolled in schools in Hector, 31 (11.8%) attend a private institution, while the remaining 231 (88.2%) are enrolled in public schools. The age group of 20 to 24 year olds has the highest likelihood of being enrolled in private schools, with 28 (40.6% in the age bracket) enrolled. Conversely, the age group of 3 to 4 year olds has the lowest likelihood of being enrolled in a private school, with 19 (100.0% in the age bracket) attending a public institution.
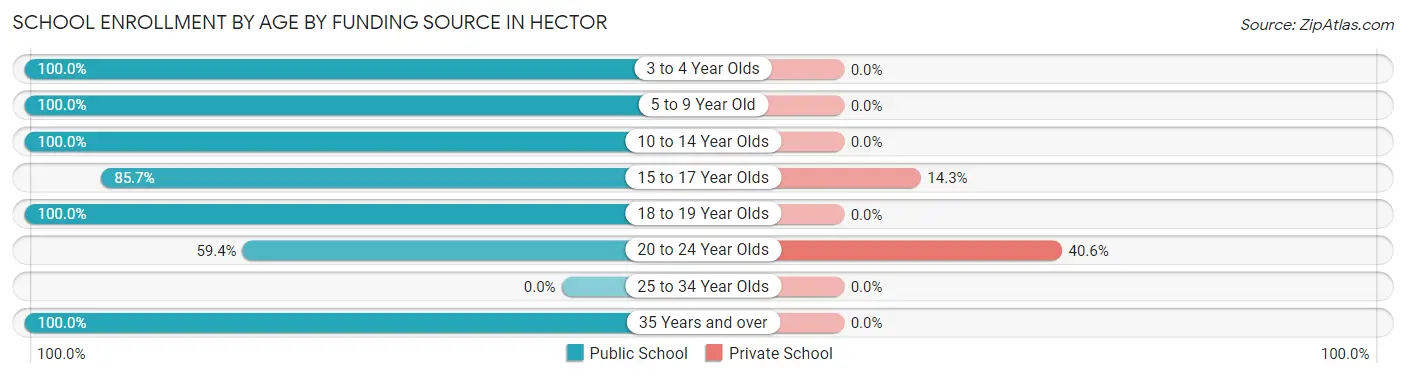
| Age Bracket | Public School | Private School |
| 3 to 4 Year Olds | 19 (100.0%) | 0 (0.0%) |
| 5 to 9 Year Old | 77 (100.0%) | 0 (0.0%) |
| 10 to 14 Year Olds | 59 (100.0%) | 0 (0.0%) |
| 15 to 17 Year Olds | 18 (85.7%) | 3 (14.3%) |
| 18 to 19 Year Olds | 14 (100.0%) | 0 (0.0%) |
| 20 to 24 Year Olds | 41 (59.4%) | 28 (40.6%) |
| 25 to 34 Year Olds | 0 (0.0%) | 0 (0.0%) |
| 35 Years and over | 3 (100.0%) | 0 (0.0%) |
| Total | 231 (88.2%) | 31 (11.8%) |
Educational Attainment by Field of Study in Hector
Education (37 | 38.1%), business (14 | 14.4%), arts & humanities (11 | 11.3%), bio, nature & agricultural (10 | 10.3%), and science & technology (10 | 10.3%) are the most common fields of study among 97 individuals in Hector who have obtained a bachelor's degree or higher.
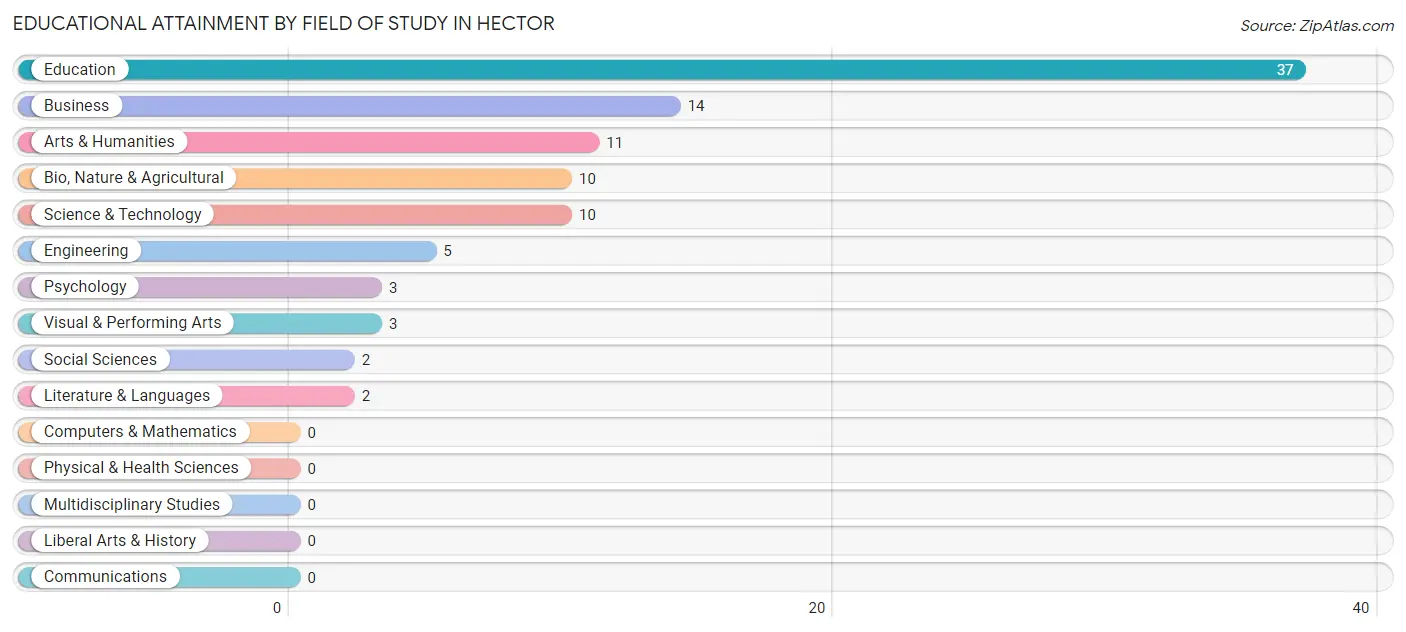
| Field of Study | # Graduates | % Graduates |
| Computers & Mathematics | 0 | 0.0% |
| Bio, Nature & Agricultural | 10 | 10.3% |
| Physical & Health Sciences | 0 | 0.0% |
| Psychology | 3 | 3.1% |
| Social Sciences | 2 | 2.1% |
| Engineering | 5 | 5.1% |
| Multidisciplinary Studies | 0 | 0.0% |
| Science & Technology | 10 | 10.3% |
| Business | 14 | 14.4% |
| Education | 37 | 38.1% |
| Literature & Languages | 2 | 2.1% |
| Liberal Arts & History | 0 | 0.0% |
| Visual & Performing Arts | 3 | 3.1% |
| Communications | 0 | 0.0% |
| Arts & Humanities | 11 | 11.3% |
| Total | 97 | 100.0% |
Transportation & Commute in Hector
Vehicle Availability by Sex in Hector
The most prevalent vehicle ownership categories in Hector are males with 2 vehicles (125, accounting for 39.4%) and females with 2 vehicles (117, making up 41.5%).
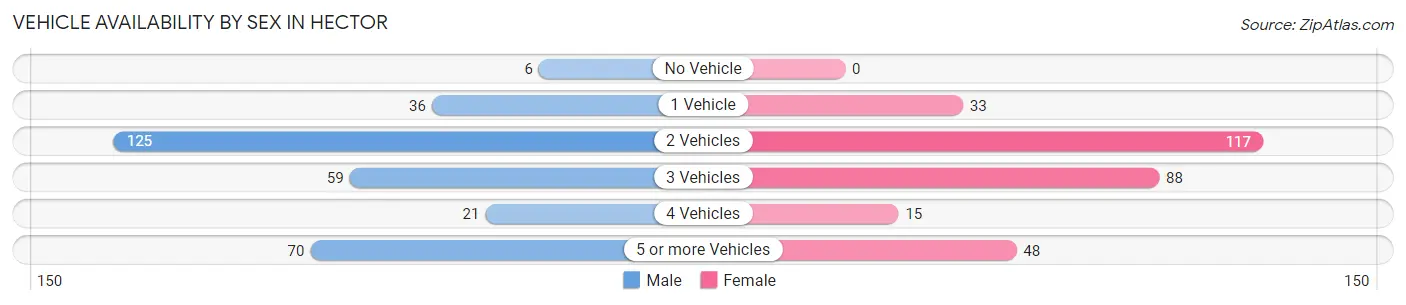
| Vehicles Available | Male | Female |
| No Vehicle | 6 (1.9%) | 0 (0.0%) |
| 1 Vehicle | 36 (11.4%) | 33 (11.0%) |
| 2 Vehicles | 125 (39.4%) | 117 (38.9%) |
| 3 Vehicles | 59 (18.6%) | 88 (29.2%) |
| 4 Vehicles | 21 (6.6%) | 15 (5.0%) |
| 5 or more Vehicles | 70 (22.1%) | 48 (16.0%) |
| Total | 317 (100.0%) | 301 (100.0%) |
Commute Time in Hector
The most frequently occuring commute durations in Hector are 5 to 9 minutes (189 commuters, 31.6%), 10 to 14 minutes (99 commuters, 16.5%), and 30 to 34 minutes (72 commuters, 12.0%).
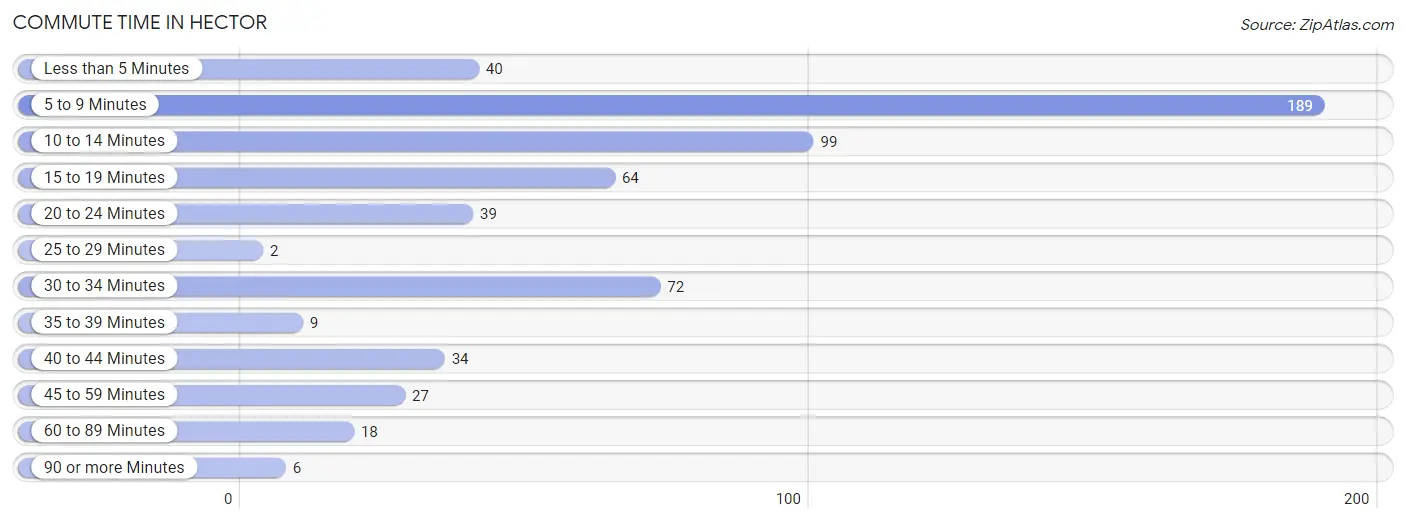
| Commute Time | # Commuters | % Commuters |
| Less than 5 Minutes | 40 | 6.7% |
| 5 to 9 Minutes | 189 | 31.6% |
| 10 to 14 Minutes | 99 | 16.5% |
| 15 to 19 Minutes | 64 | 10.7% |
| 20 to 24 Minutes | 39 | 6.5% |
| 25 to 29 Minutes | 2 | 0.3% |
| 30 to 34 Minutes | 72 | 12.0% |
| 35 to 39 Minutes | 9 | 1.5% |
| 40 to 44 Minutes | 34 | 5.7% |
| 45 to 59 Minutes | 27 | 4.5% |
| 60 to 89 Minutes | 18 | 3.0% |
| 90 or more Minutes | 6 | 1.0% |
Commute Time by Sex in Hector
The most common commute times in Hector are 10 to 14 minutes (68 commuters, 21.7%) for males and 5 to 9 minutes (140 commuters, 49.1%) for females.
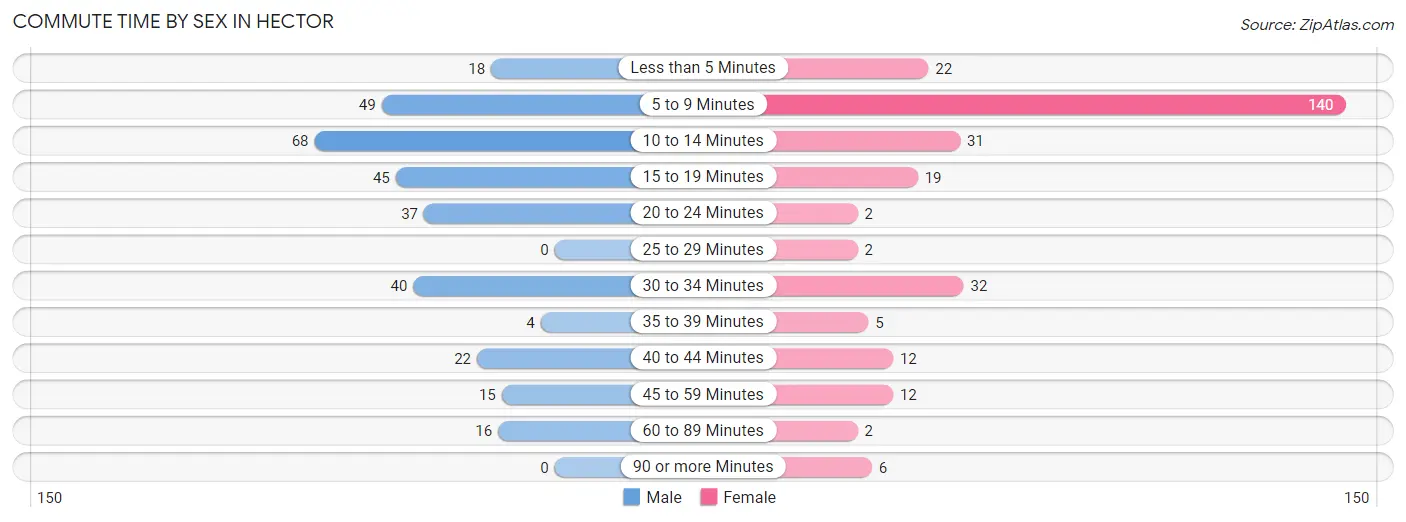
| Commute Time | Male | Female |
| Less than 5 Minutes | 18 (5.7%) | 22 (7.7%) |
| 5 to 9 Minutes | 49 (15.6%) | 140 (49.1%) |
| 10 to 14 Minutes | 68 (21.7%) | 31 (10.9%) |
| 15 to 19 Minutes | 45 (14.3%) | 19 (6.7%) |
| 20 to 24 Minutes | 37 (11.8%) | 2 (0.7%) |
| 25 to 29 Minutes | 0 (0.0%) | 2 (0.7%) |
| 30 to 34 Minutes | 40 (12.7%) | 32 (11.2%) |
| 35 to 39 Minutes | 4 (1.3%) | 5 (1.8%) |
| 40 to 44 Minutes | 22 (7.0%) | 12 (4.2%) |
| 45 to 59 Minutes | 15 (4.8%) | 12 (4.2%) |
| 60 to 89 Minutes | 16 (5.1%) | 2 (0.7%) |
| 90 or more Minutes | 0 (0.0%) | 6 (2.1%) |
Time of Departure to Work by Sex in Hector
The most frequent times of departure to work in Hector are 12:00 PM to 3:59 PM (78, 24.8%) for males and 12:00 PM to 3:59 PM (56, 19.7%) for females.
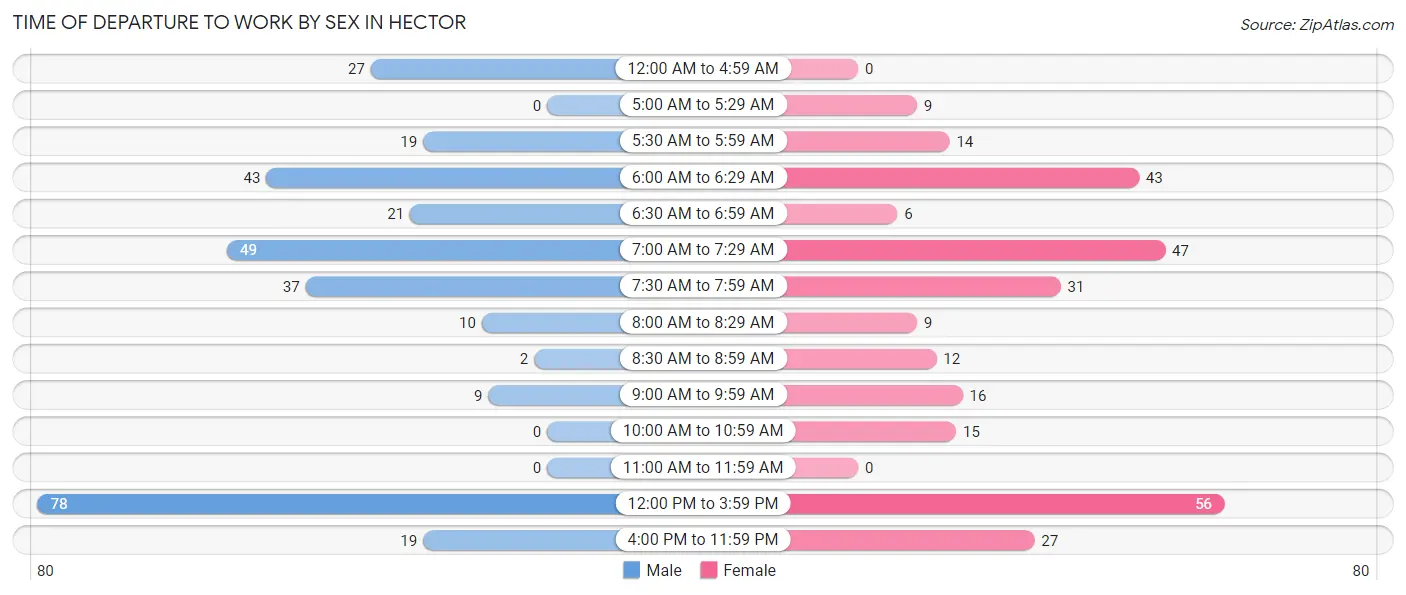
| Time of Departure | Male | Female |
| 12:00 AM to 4:59 AM | 27 (8.6%) | 0 (0.0%) |
| 5:00 AM to 5:29 AM | 0 (0.0%) | 9 (3.2%) |
| 5:30 AM to 5:59 AM | 19 (6.0%) | 14 (4.9%) |
| 6:00 AM to 6:29 AM | 43 (13.7%) | 43 (15.1%) |
| 6:30 AM to 6:59 AM | 21 (6.7%) | 6 (2.1%) |
| 7:00 AM to 7:29 AM | 49 (15.6%) | 47 (16.5%) |
| 7:30 AM to 7:59 AM | 37 (11.8%) | 31 (10.9%) |
| 8:00 AM to 8:29 AM | 10 (3.2%) | 9 (3.2%) |
| 8:30 AM to 8:59 AM | 2 (0.6%) | 12 (4.2%) |
| 9:00 AM to 9:59 AM | 9 (2.9%) | 16 (5.6%) |
| 10:00 AM to 10:59 AM | 0 (0.0%) | 15 (5.3%) |
| 11:00 AM to 11:59 AM | 0 (0.0%) | 0 (0.0%) |
| 12:00 PM to 3:59 PM | 78 (24.8%) | 56 (19.7%) |
| 4:00 PM to 11:59 PM | 19 (6.0%) | 27 (9.5%) |
| Total | 314 (100.0%) | 285 (100.0%) |
Housing Occupancy in Hector
Occupancy by Ownership in Hector
Of the total 424 dwellings in Hector, owner-occupied units account for 325 (76.6%), while renter-occupied units make up 99 (23.4%).
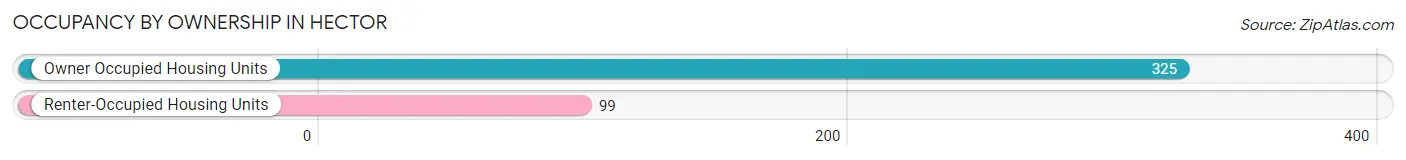
| Occupancy | # Housing Units | % Housing Units |
| Owner Occupied Housing Units | 325 | 76.6% |
| Renter-Occupied Housing Units | 99 | 23.4% |
| Total Occupied Housing Units | 424 | 100.0% |
Occupancy by Household Size in Hector
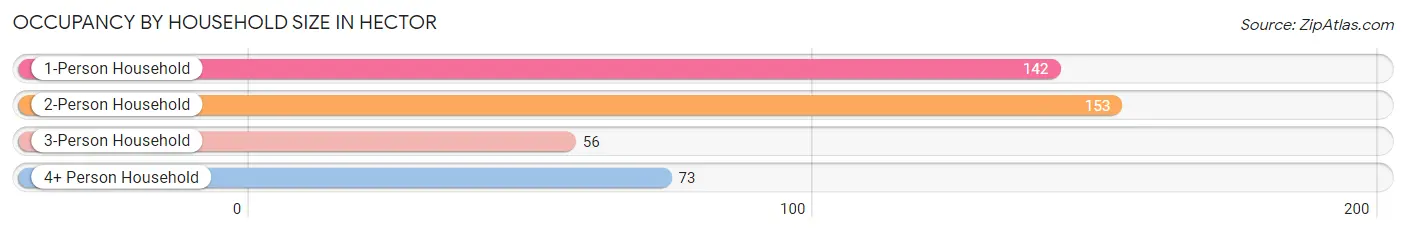
| Household Size | # Housing Units | % Housing Units |
| 1-Person Household | 142 | 33.5% |
| 2-Person Household | 153 | 36.1% |
| 3-Person Household | 56 | 13.2% |
| 4+ Person Household | 73 | 17.2% |
| Total Housing Units | 424 | 100.0% |
Occupancy by Ownership by Household Size in Hector
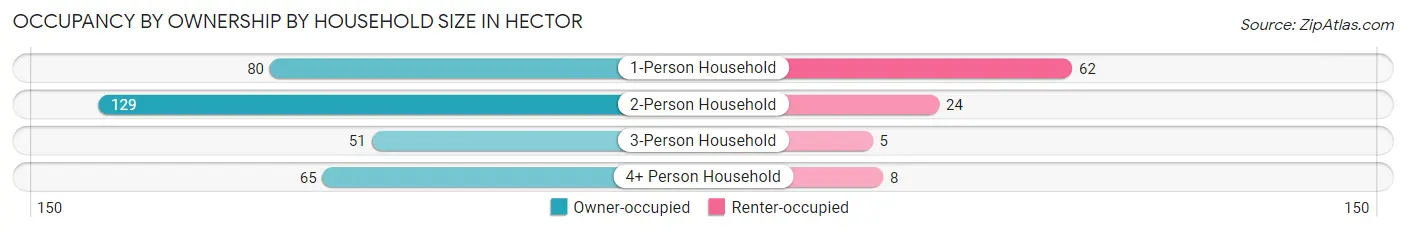
| Household Size | Owner-occupied | Renter-occupied |
| 1-Person Household | 80 (56.3%) | 62 (43.7%) |
| 2-Person Household | 129 (84.3%) | 24 (15.7%) |
| 3-Person Household | 51 (91.1%) | 5 (8.9%) |
| 4+ Person Household | 65 (89.0%) | 8 (11.0%) |
| Total Housing Units | 325 (76.6%) | 99 (23.4%) |
Occupancy by Educational Attainment in Hector
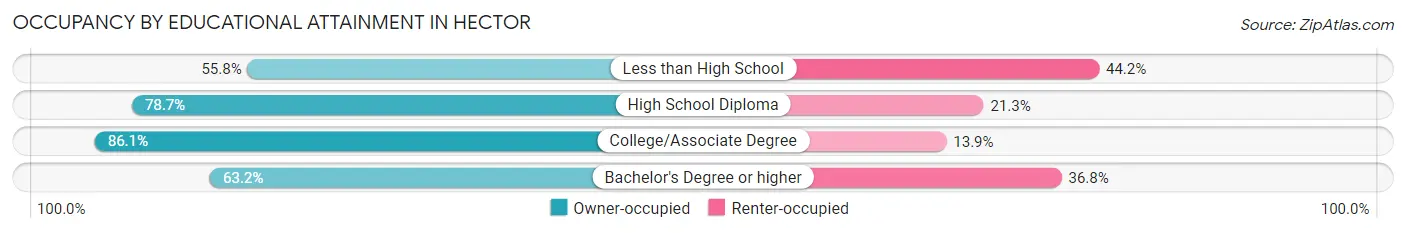
| Household Size | Owner-occupied | Renter-occupied |
| Less than High School | 24 (55.8%) | 19 (44.2%) |
| High School Diploma | 122 (78.7%) | 33 (21.3%) |
| College/Associate Degree | 136 (86.1%) | 22 (13.9%) |
| Bachelor's Degree or higher | 43 (63.2%) | 25 (36.8%) |
Occupancy by Age of Householder in Hector
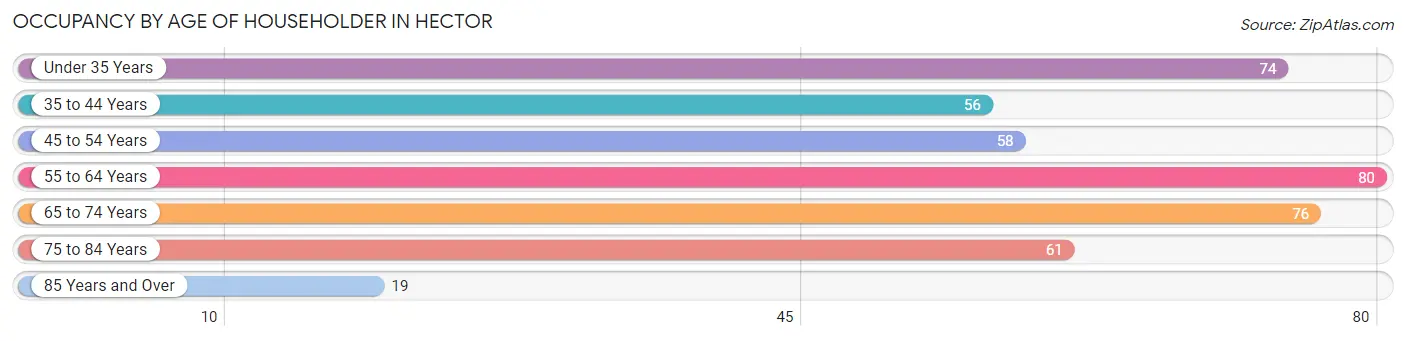
| Age Bracket | # Households | % Households |
| Under 35 Years | 74 | 17.4% |
| 35 to 44 Years | 56 | 13.2% |
| 45 to 54 Years | 58 | 13.7% |
| 55 to 64 Years | 80 | 18.9% |
| 65 to 74 Years | 76 | 17.9% |
| 75 to 84 Years | 61 | 14.4% |
| 85 Years and Over | 19 | 4.5% |
| Total | 424 | 100.0% |
Housing Finances in Hector
Median Income by Occupancy in Hector
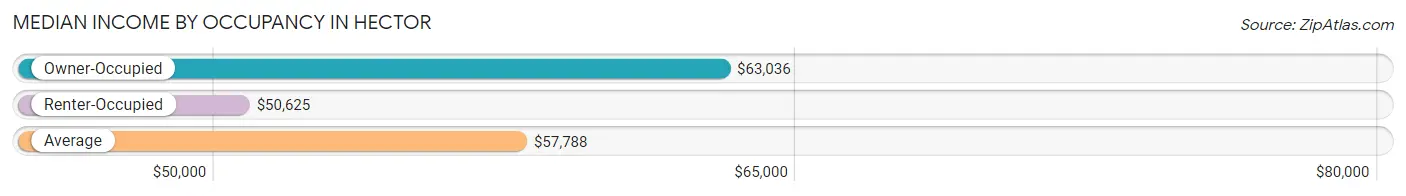
| Occupancy Type | # Households | Median Income |
| Owner-Occupied | 325 (76.6%) | $63,036 |
| Renter-Occupied | 99 (23.4%) | $50,625 |
| Average | 424 (100.0%) | $57,788 |
Occupancy by Householder Income Bracket in Hector
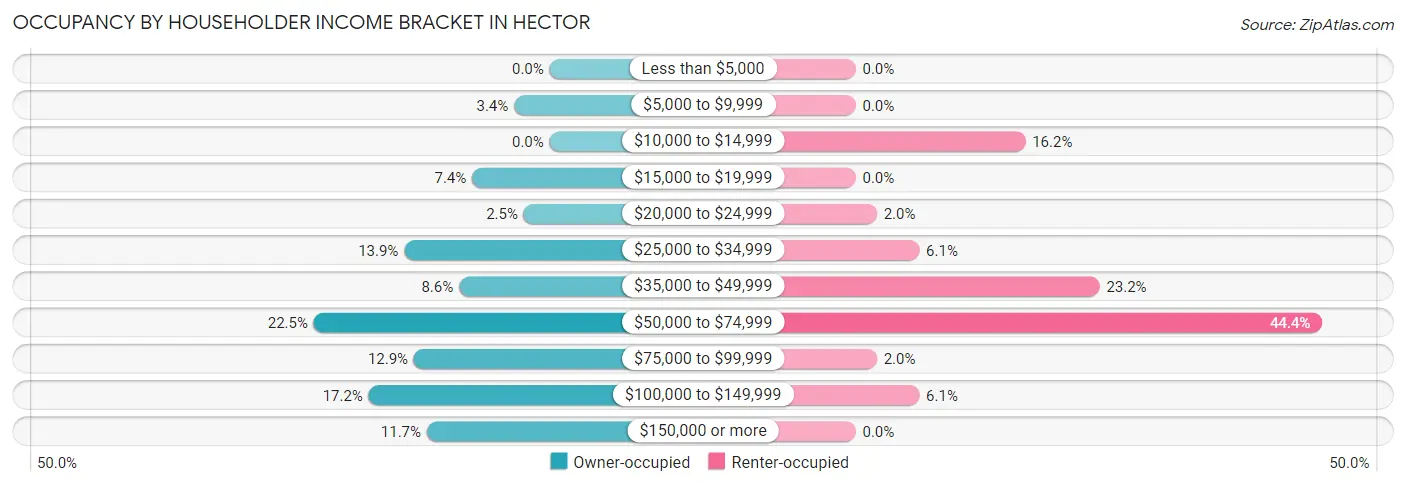
| Income Bracket | Owner-occupied | Renter-occupied |
| Less than $5,000 | 0 (0.0%) | 0 (0.0%) |
| $5,000 to $9,999 | 11 (3.4%) | 0 (0.0%) |
| $10,000 to $14,999 | 0 (0.0%) | 16 (16.2%) |
| $15,000 to $19,999 | 24 (7.4%) | 0 (0.0%) |
| $20,000 to $24,999 | 8 (2.5%) | 2 (2.0%) |
| $25,000 to $34,999 | 45 (13.9%) | 6 (6.1%) |
| $35,000 to $49,999 | 28 (8.6%) | 23 (23.2%) |
| $50,000 to $74,999 | 73 (22.5%) | 44 (44.4%) |
| $75,000 to $99,999 | 42 (12.9%) | 2 (2.0%) |
| $100,000 to $149,999 | 56 (17.2%) | 6 (6.1%) |
| $150,000 or more | 38 (11.7%) | 0 (0.0%) |
| Total | 325 (100.0%) | 99 (100.0%) |
Monthly Housing Cost Tiers in Hector
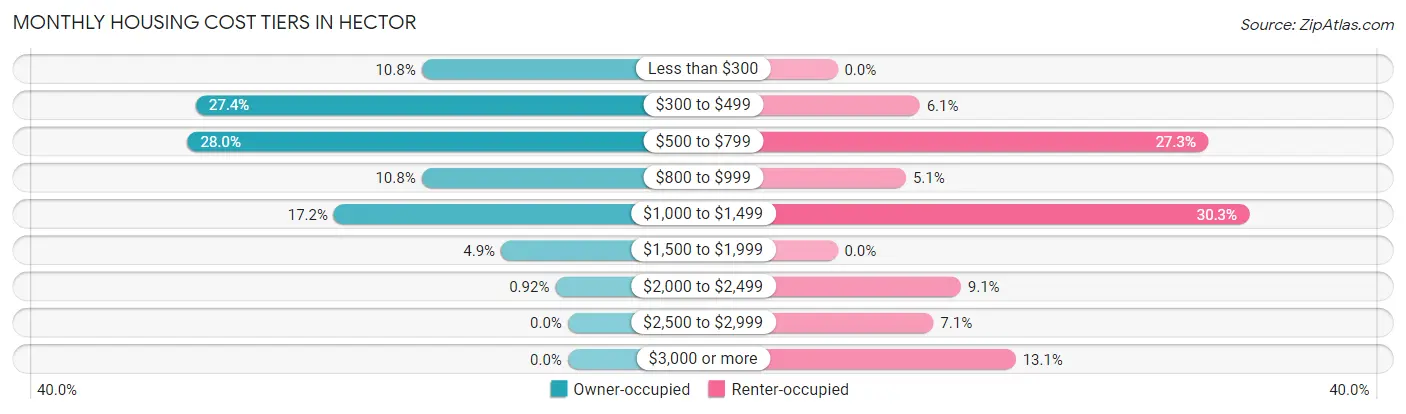
| Monthly Cost | Owner-occupied | Renter-occupied |
| Less than $300 | 35 (10.8%) | 0 (0.0%) |
| $300 to $499 | 89 (27.4%) | 6 (6.1%) |
| $500 to $799 | 91 (28.0%) | 27 (27.3%) |
| $800 to $999 | 35 (10.8%) | 5 (5.1%) |
| $1,000 to $1,499 | 56 (17.2%) | 30 (30.3%) |
| $1,500 to $1,999 | 16 (4.9%) | 0 (0.0%) |
| $2,000 to $2,499 | 3 (0.9%) | 9 (9.1%) |
| $2,500 to $2,999 | 0 (0.0%) | 7 (7.1%) |
| $3,000 or more | 0 (0.0%) | 13 (13.1%) |
| Total | 325 (100.0%) | 99 (100.0%) |
Physical Housing Characteristics in Hector
Housing Structures in Hector
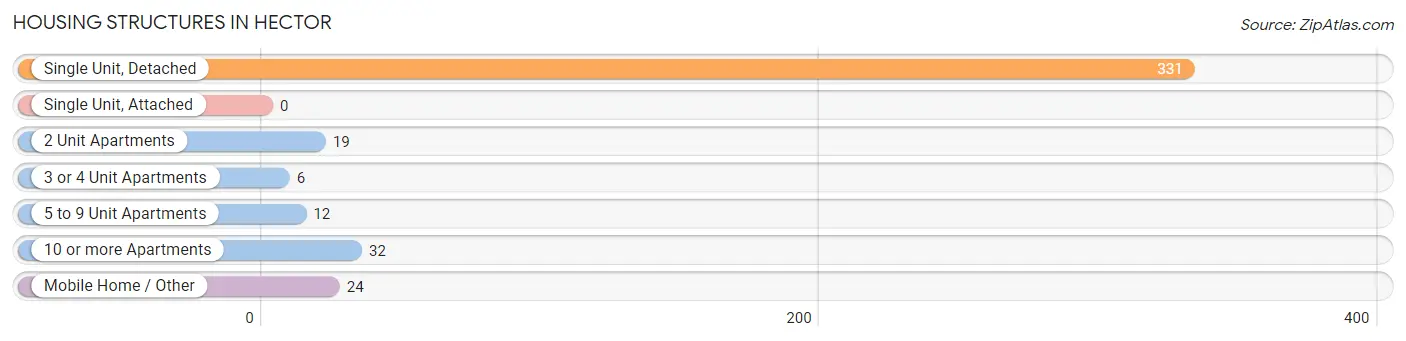
| Structure Type | # Housing Units | % Housing Units |
| Single Unit, Detached | 331 | 78.1% |
| Single Unit, Attached | 0 | 0.0% |
| 2 Unit Apartments | 19 | 4.5% |
| 3 or 4 Unit Apartments | 6 | 1.4% |
| 5 to 9 Unit Apartments | 12 | 2.8% |
| 10 or more Apartments | 32 | 7.5% |
| Mobile Home / Other | 24 | 5.7% |
| Total | 424 | 100.0% |
Housing Structures by Occupancy in Hector
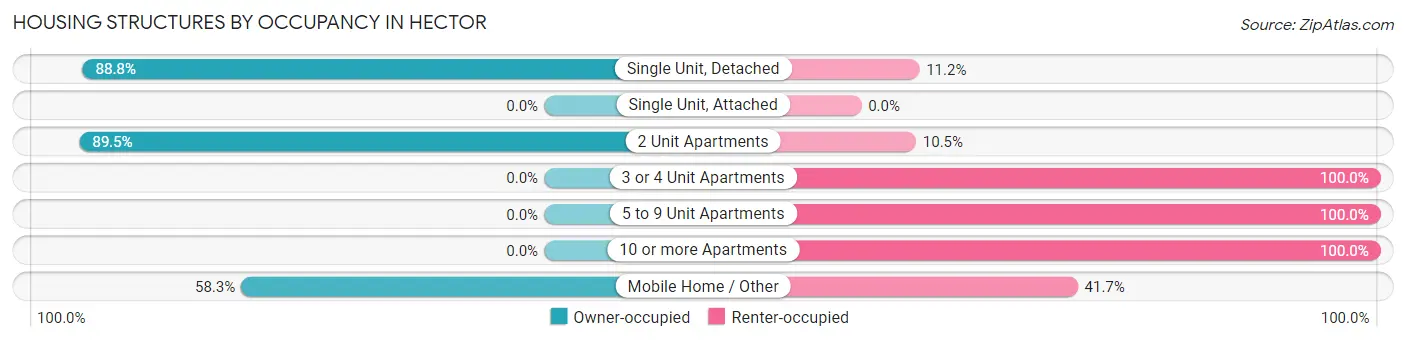
| Structure Type | Owner-occupied | Renter-occupied |
| Single Unit, Detached | 294 (88.8%) | 37 (11.2%) |
| Single Unit, Attached | 0 (0.0%) | 0 (0.0%) |
| 2 Unit Apartments | 17 (89.5%) | 2 (10.5%) |
| 3 or 4 Unit Apartments | 0 (0.0%) | 6 (100.0%) |
| 5 to 9 Unit Apartments | 0 (0.0%) | 12 (100.0%) |
| 10 or more Apartments | 0 (0.0%) | 32 (100.0%) |
| Mobile Home / Other | 14 (58.3%) | 10 (41.7%) |
| Total | 325 (76.6%) | 99 (23.4%) |
Housing Structures by Number of Rooms in Hector
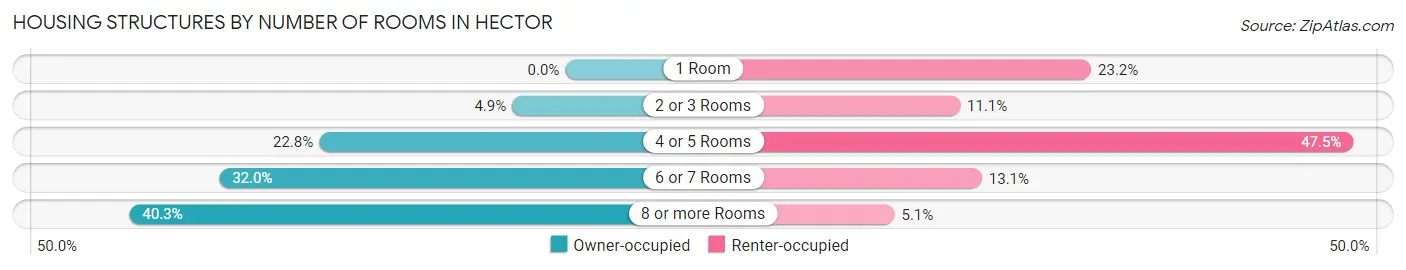
| Number of Rooms | Owner-occupied | Renter-occupied |
| 1 Room | 0 (0.0%) | 23 (23.2%) |
| 2 or 3 Rooms | 16 (4.9%) | 11 (11.1%) |
| 4 or 5 Rooms | 74 (22.8%) | 47 (47.5%) |
| 6 or 7 Rooms | 104 (32.0%) | 13 (13.1%) |
| 8 or more Rooms | 131 (40.3%) | 5 (5.1%) |
| Total | 325 (100.0%) | 99 (100.0%) |
Housing Structure by Heating Type in Hector
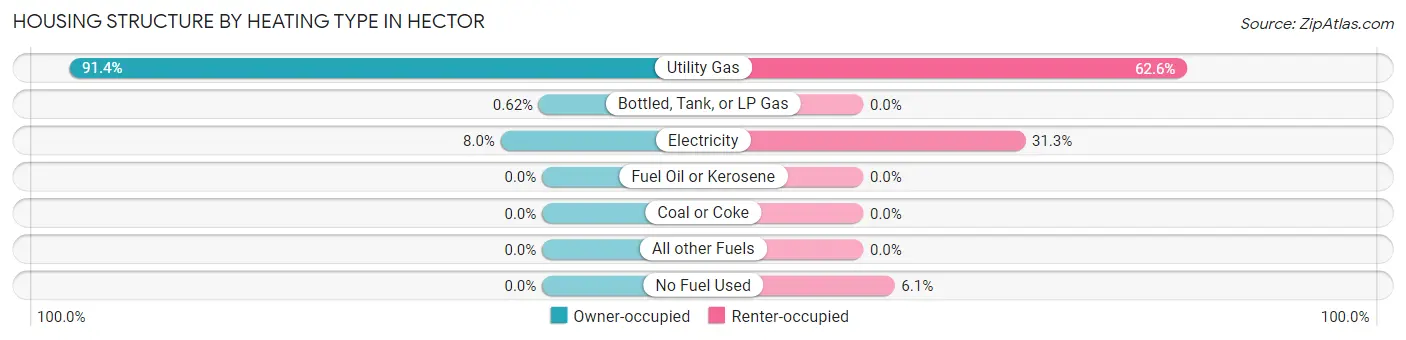
| Heating Type | Owner-occupied | Renter-occupied |
| Utility Gas | 297 (91.4%) | 62 (62.6%) |
| Bottled, Tank, or LP Gas | 2 (0.6%) | 0 (0.0%) |
| Electricity | 26 (8.0%) | 31 (31.3%) |
| Fuel Oil or Kerosene | 0 (0.0%) | 0 (0.0%) |
| Coal or Coke | 0 (0.0%) | 0 (0.0%) |
| All other Fuels | 0 (0.0%) | 0 (0.0%) |
| No Fuel Used | 0 (0.0%) | 6 (6.1%) |
| Total | 325 (100.0%) | 99 (100.0%) |
Household Vehicle Usage in Hector
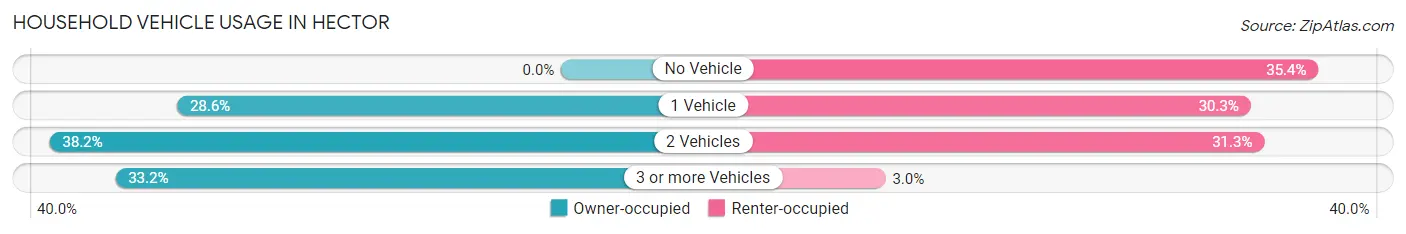
| Vehicles per Household | Owner-occupied | Renter-occupied |
| No Vehicle | 0 (0.0%) | 35 (35.3%) |
| 1 Vehicle | 93 (28.6%) | 30 (30.3%) |
| 2 Vehicles | 124 (38.2%) | 31 (31.3%) |
| 3 or more Vehicles | 108 (33.2%) | 3 (3.0%) |
| Total | 325 (100.0%) | 99 (100.0%) |
Real Estate & Mortgages in Hector
Real Estate and Mortgage Overview in Hector
| Characteristic | Without Mortgage | With Mortgage |
| Housing Units | 222 | 103 |
| Median Property Value | $108,200 | $123,100 |
| Median Household Income | $57,813 | $13 |
| Monthly Housing Costs | $479 | $0 |
| Real Estate Taxes | $1,016 | $0 |
Property Value by Mortgage Status in Hector
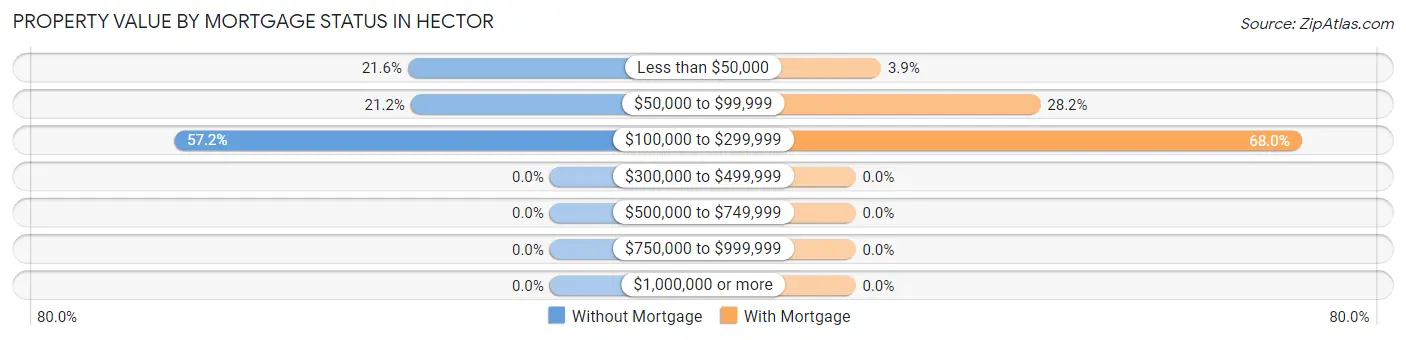
| Property Value | Without Mortgage | With Mortgage |
| Less than $50,000 | 48 (21.6%) | 4 (3.9%) |
| $50,000 to $99,999 | 47 (21.2%) | 29 (28.2%) |
| $100,000 to $299,999 | 127 (57.2%) | 70 (68.0%) |
| $300,000 to $499,999 | 0 (0.0%) | 0 (0.0%) |
| $500,000 to $749,999 | 0 (0.0%) | 0 (0.0%) |
| $750,000 to $999,999 | 0 (0.0%) | 0 (0.0%) |
| $1,000,000 or more | 0 (0.0%) | 0 (0.0%) |
| Total | 222 (100.0%) | 103 (100.0%) |
Household Income by Mortgage Status in Hector
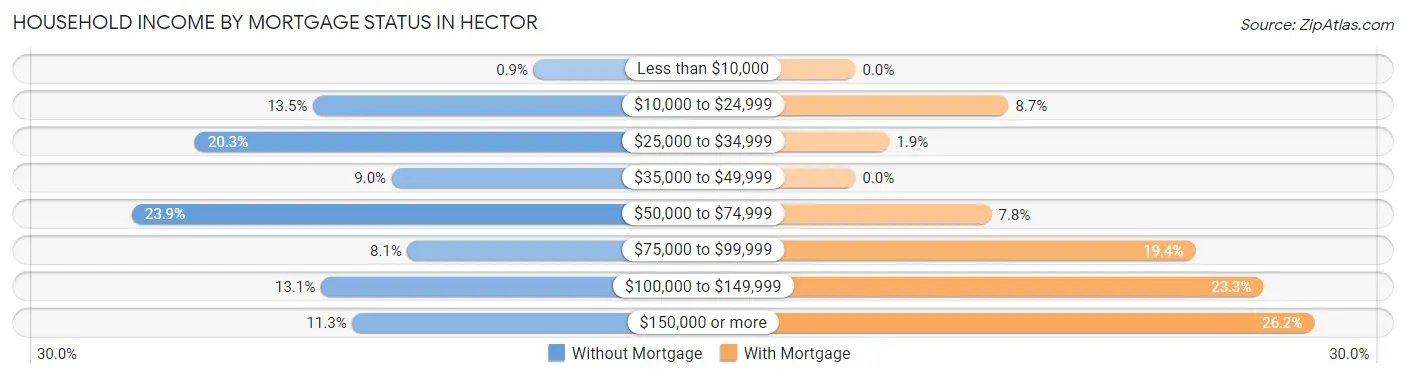
| Household Income | Without Mortgage | With Mortgage |
| Less than $10,000 | 2 (0.9%) | 0 (0.0%) |
| $10,000 to $24,999 | 30 (13.5%) | 9 (8.7%) |
| $25,000 to $34,999 | 45 (20.3%) | 2 (1.9%) |
| $35,000 to $49,999 | 20 (9.0%) | 0 (0.0%) |
| $50,000 to $74,999 | 53 (23.9%) | 8 (7.8%) |
| $75,000 to $99,999 | 18 (8.1%) | 20 (19.4%) |
| $100,000 to $149,999 | 29 (13.1%) | 24 (23.3%) |
| $150,000 or more | 25 (11.3%) | 27 (26.2%) |
| Total | 222 (100.0%) | 103 (100.0%) |
Property Value to Household Income Ratio in Hector
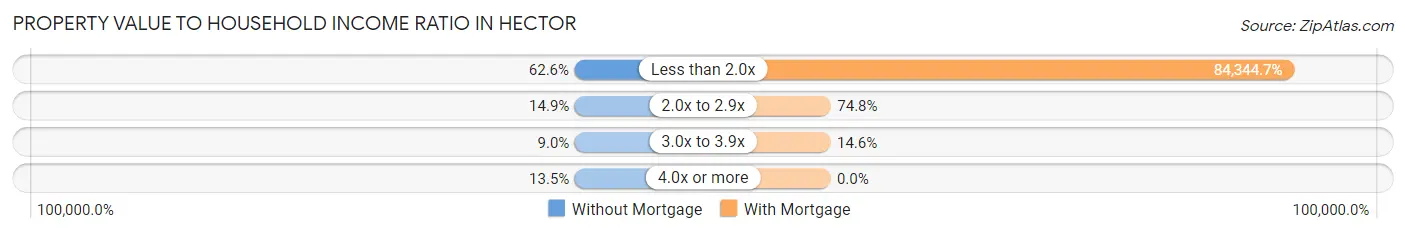
| Value-to-Income Ratio | Without Mortgage | With Mortgage |
| Less than 2.0x | 139 (62.6%) | 86,875 (84,344.7%) |
| 2.0x to 2.9x | 33 (14.9%) | 77 (74.8%) |
| 3.0x to 3.9x | 20 (9.0%) | 15 (14.6%) |
| 4.0x or more | 30 (13.5%) | 0 (0.0%) |
| Total | 222 (100.0%) | 103 (100.0%) |
Real Estate Taxes by Mortgage Status in Hector
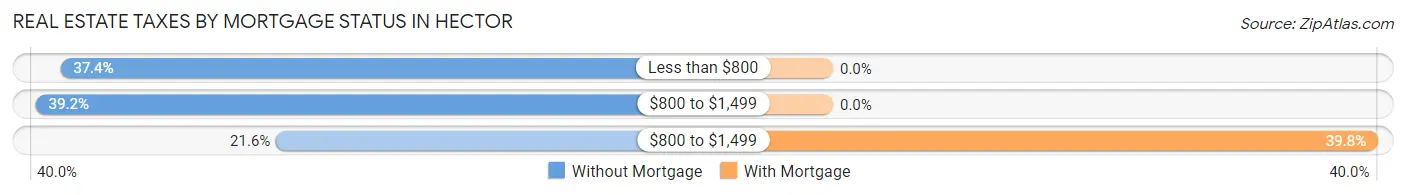
| Property Taxes | Without Mortgage | With Mortgage |
| Less than $800 | 83 (37.4%) | 0 (0.0%) |
| $800 to $1,499 | 87 (39.2%) | 0 (0.0%) |
| $800 to $1,499 | 48 (21.6%) | 41 (39.8%) |
| Total | 222 (100.0%) | 103 (100.0%) |
Health & Disability in Hector
Health Insurance Coverage by Age in Hector
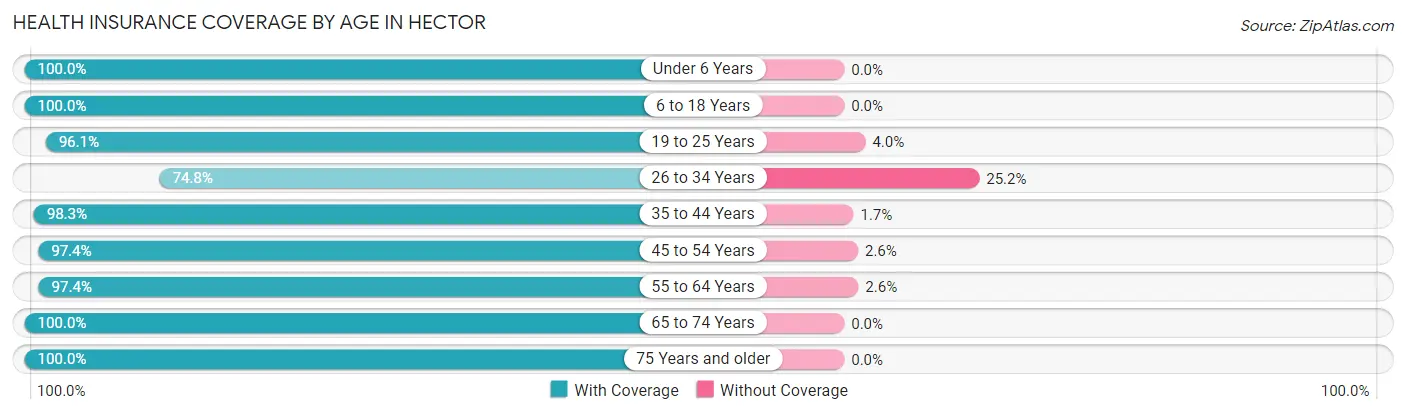
| Age Bracket | With Coverage | Without Coverage |
| Under 6 Years | 96 (100.0%) | 0 (0.0%) |
| 6 to 18 Years | 144 (100.0%) | 0 (0.0%) |
| 19 to 25 Years | 146 (96.1%) | 6 (4.0%) |
| 26 to 34 Years | 107 (74.8%) | 36 (25.2%) |
| 35 to 44 Years | 114 (98.3%) | 2 (1.7%) |
| 45 to 54 Years | 114 (97.4%) | 3 (2.6%) |
| 55 to 64 Years | 148 (97.4%) | 4 (2.6%) |
| 65 to 74 Years | 96 (100.0%) | 0 (0.0%) |
| 75 Years and older | 102 (100.0%) | 0 (0.0%) |
| Total | 1,067 (95.4%) | 51 (4.6%) |
Health Insurance Coverage by Citizenship Status in Hector
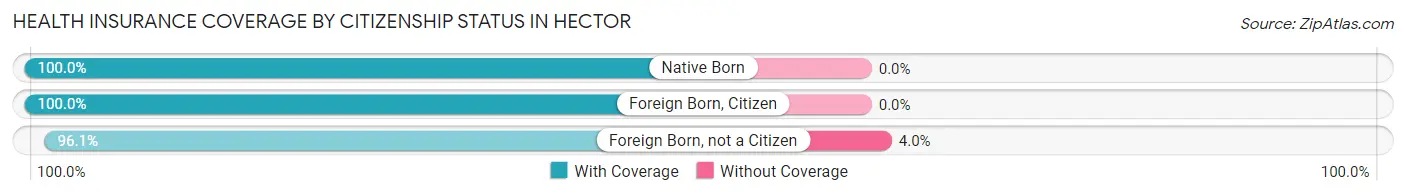
| Citizenship Status | With Coverage | Without Coverage |
| Native Born | 96 (100.0%) | 0 (0.0%) |
| Foreign Born, Citizen | 144 (100.0%) | 0 (0.0%) |
| Foreign Born, not a Citizen | 146 (96.1%) | 6 (4.0%) |
Health Insurance Coverage by Household Income in Hector
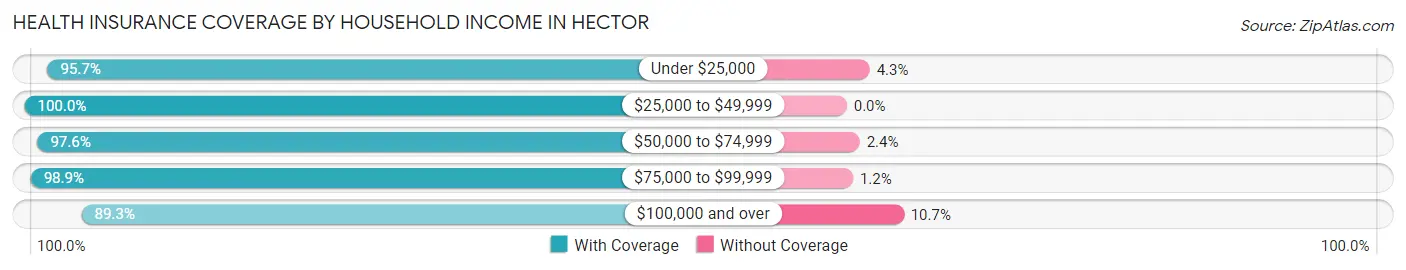
| Household Income | With Coverage | Without Coverage |
| Under $25,000 | 67 (95.7%) | 3 (4.3%) |
| $25,000 to $49,999 | 251 (100.0%) | 0 (0.0%) |
| $50,000 to $74,999 | 242 (97.6%) | 6 (2.4%) |
| $75,000 to $99,999 | 172 (98.9%) | 2 (1.1%) |
| $100,000 and over | 335 (89.3%) | 40 (10.7%) |
Public vs Private Health Insurance Coverage by Age in Hector
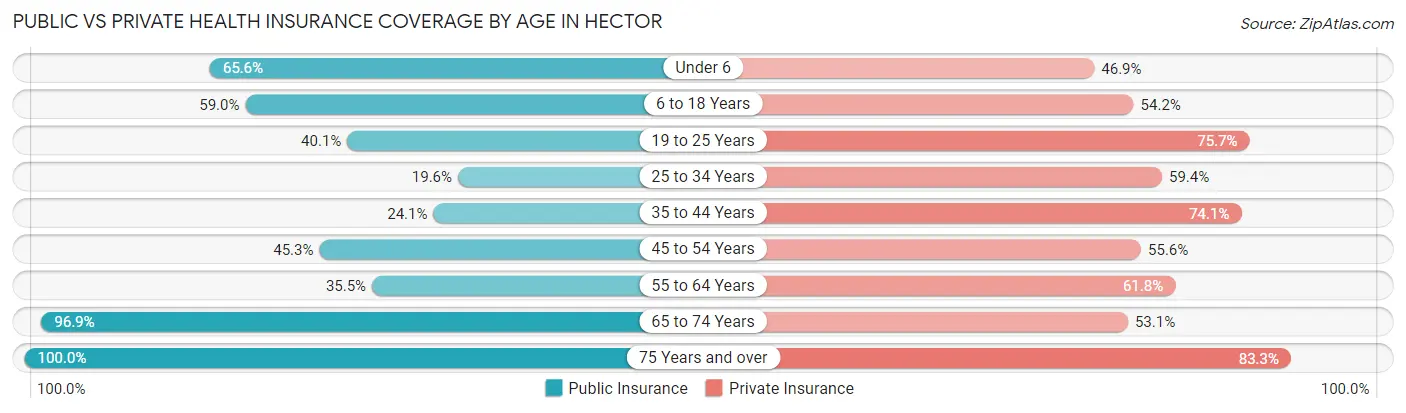
| Age Bracket | Public Insurance | Private Insurance |
| Under 6 | 63 (65.6%) | 45 (46.9%) |
| 6 to 18 Years | 85 (59.0%) | 78 (54.2%) |
| 19 to 25 Years | 61 (40.1%) | 115 (75.7%) |
| 25 to 34 Years | 28 (19.6%) | 85 (59.4%) |
| 35 to 44 Years | 28 (24.1%) | 86 (74.1%) |
| 45 to 54 Years | 53 (45.3%) | 65 (55.6%) |
| 55 to 64 Years | 54 (35.5%) | 94 (61.8%) |
| 65 to 74 Years | 93 (96.9%) | 51 (53.1%) |
| 75 Years and over | 102 (100.0%) | 85 (83.3%) |
| Total | 567 (50.7%) | 704 (63.0%) |
Disability Status by Sex by Age in Hector
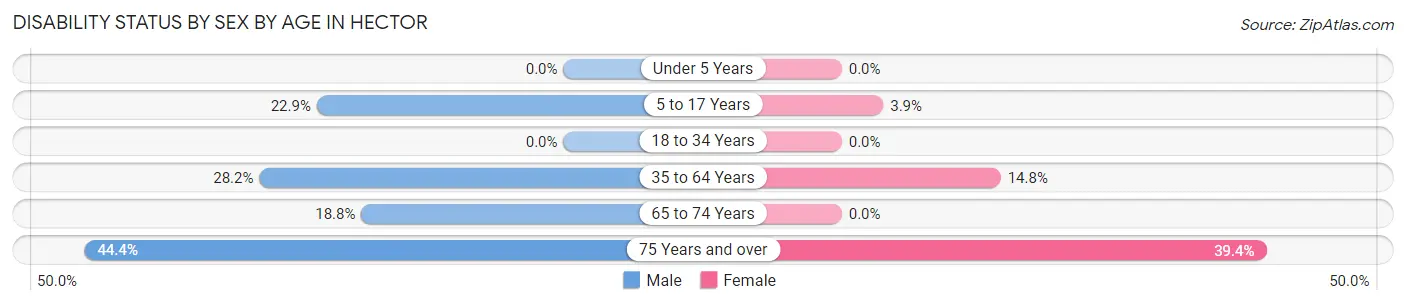
| Age Bracket | Male | Female |
| Under 5 Years | 0 (0.0%) | 0 (0.0%) |
| 5 to 17 Years | 19 (22.9%) | 3 (3.8%) |
| 18 to 34 Years | 0 (0.0%) | 0 (0.0%) |
| 35 to 64 Years | 57 (28.2%) | 27 (14.7%) |
| 65 to 74 Years | 9 (18.8%) | 0 (0.0%) |
| 75 Years and over | 16 (44.4%) | 26 (39.4%) |
Disability Class by Sex by Age in Hector
Disability Class: Hearing Difficulty
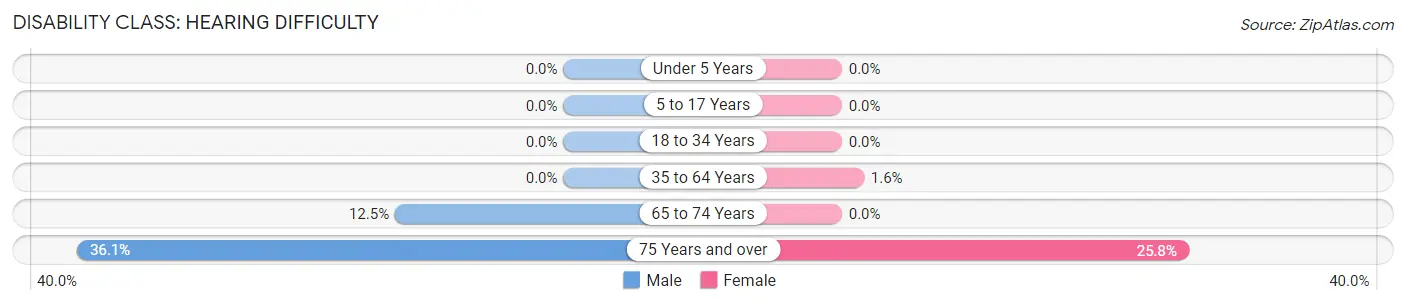
| Age Bracket | Male | Female |
| Under 5 Years | 0 (0.0%) | 0 (0.0%) |
| 5 to 17 Years | 0 (0.0%) | 0 (0.0%) |
| 18 to 34 Years | 0 (0.0%) | 0 (0.0%) |
| 35 to 64 Years | 0 (0.0%) | 3 (1.6%) |
| 65 to 74 Years | 6 (12.5%) | 0 (0.0%) |
| 75 Years and over | 13 (36.1%) | 17 (25.8%) |
Disability Class: Vision Difficulty
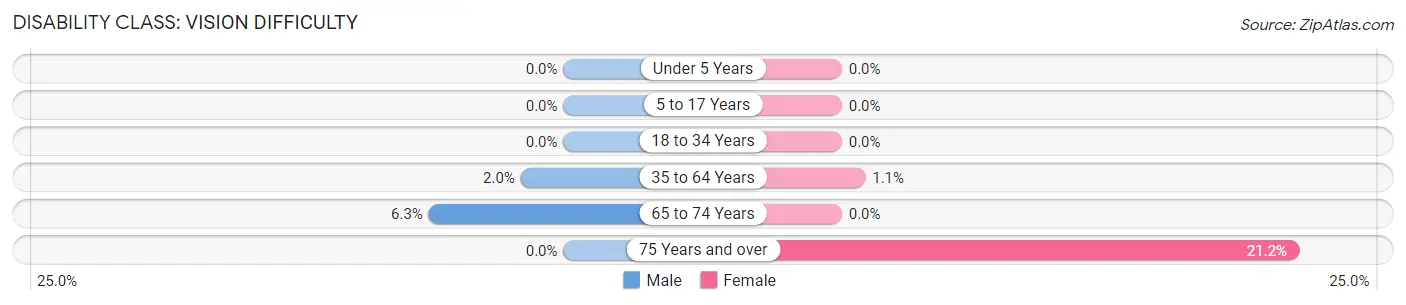
| Age Bracket | Male | Female |
| Under 5 Years | 0 (0.0%) | 0 (0.0%) |
| 5 to 17 Years | 0 (0.0%) | 0 (0.0%) |
| 18 to 34 Years | 0 (0.0%) | 0 (0.0%) |
| 35 to 64 Years | 4 (2.0%) | 2 (1.1%) |
| 65 to 74 Years | 3 (6.2%) | 0 (0.0%) |
| 75 Years and over | 0 (0.0%) | 14 (21.2%) |
Disability Class: Cognitive Difficulty
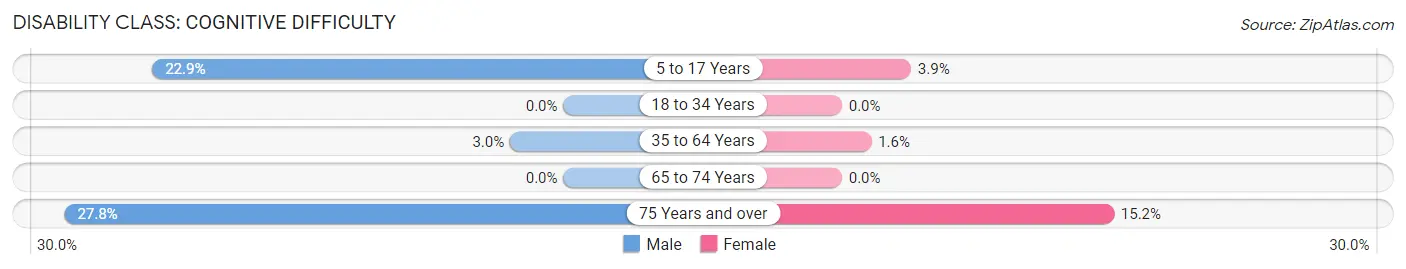
| Age Bracket | Male | Female |
| 5 to 17 Years | 19 (22.9%) | 3 (3.8%) |
| 18 to 34 Years | 0 (0.0%) | 0 (0.0%) |
| 35 to 64 Years | 6 (3.0%) | 3 (1.6%) |
| 65 to 74 Years | 0 (0.0%) | 0 (0.0%) |
| 75 Years and over | 10 (27.8%) | 10 (15.1%) |
Disability Class: Ambulatory Difficulty
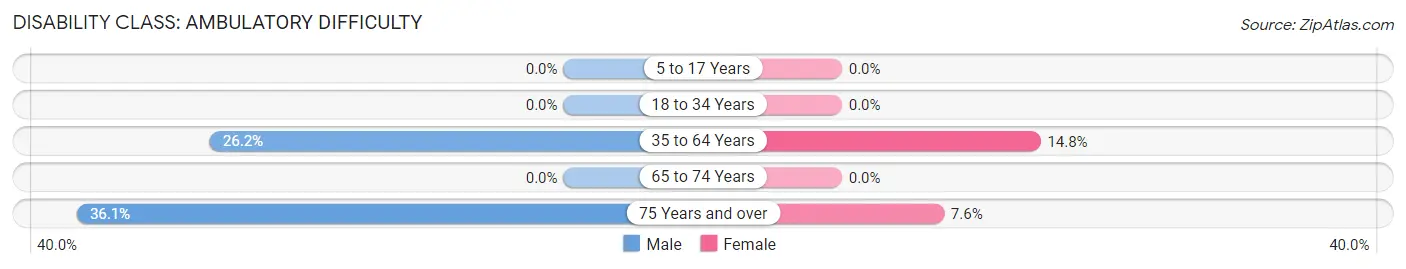
| Age Bracket | Male | Female |
| 5 to 17 Years | 0 (0.0%) | 0 (0.0%) |
| 18 to 34 Years | 0 (0.0%) | 0 (0.0%) |
| 35 to 64 Years | 53 (26.2%) | 27 (14.7%) |
| 65 to 74 Years | 0 (0.0%) | 0 (0.0%) |
| 75 Years and over | 13 (36.1%) | 5 (7.6%) |
Disability Class: Self-Care Difficulty
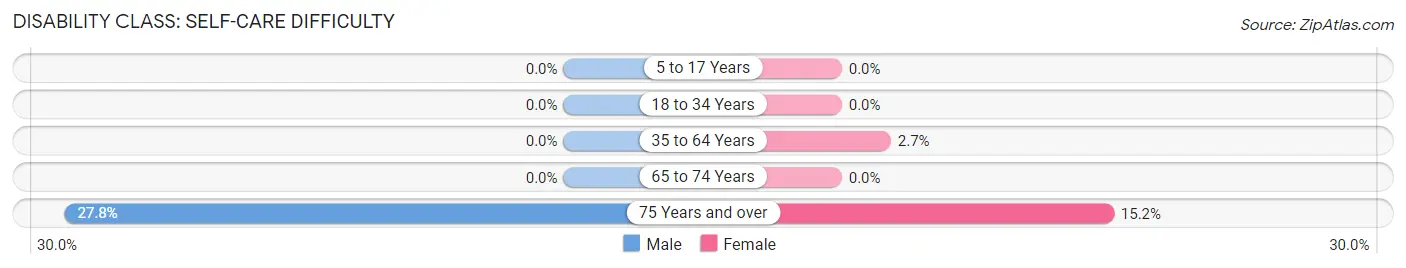
| Age Bracket | Male | Female |
| 5 to 17 Years | 0 (0.0%) | 0 (0.0%) |
| 18 to 34 Years | 0 (0.0%) | 0 (0.0%) |
| 35 to 64 Years | 0 (0.0%) | 5 (2.7%) |
| 65 to 74 Years | 0 (0.0%) | 0 (0.0%) |
| 75 Years and over | 10 (27.8%) | 10 (15.1%) |
Technology Access in Hector
Computing Device Access in Hector
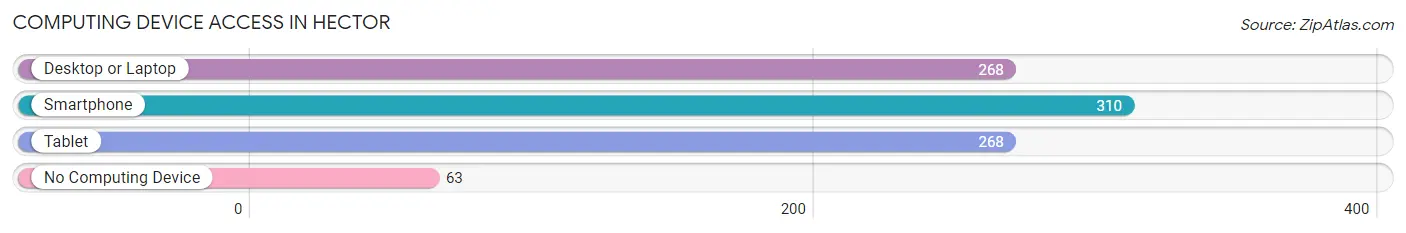
| Device Type | # Households | % Households |
| Desktop or Laptop | 268 | 63.2% |
| Smartphone | 310 | 73.1% |
| Tablet | 268 | 63.2% |
| No Computing Device | 63 | 14.9% |
| Total | 424 | 100.0% |
Internet Access in Hector
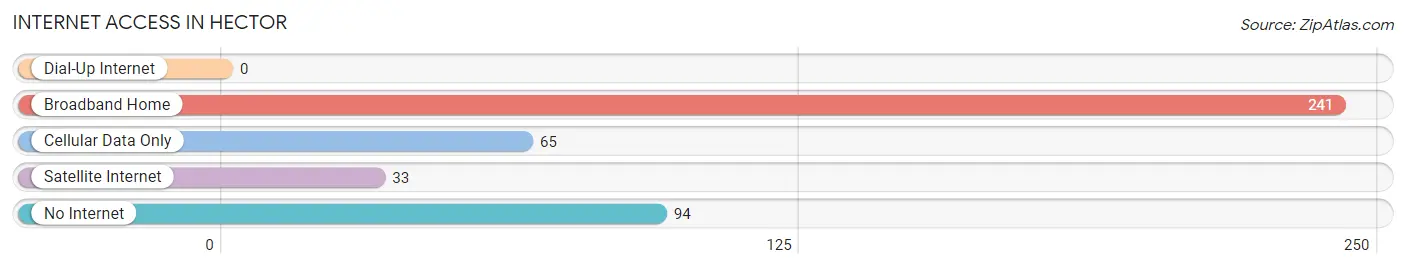
| Internet Type | # Households | % Households |
| Dial-Up Internet | 0 | 0.0% |
| Broadband Home | 241 | 56.8% |
| Cellular Data Only | 65 | 15.3% |
| Satellite Internet | 33 | 7.8% |
| No Internet | 94 | 22.2% |
| Total | 424 | 100.0% |
Hector Summary
Hector, Minnesota is a small city located in Renville County in the southwestern part of the state. It is situated on the banks of the Minnesota River, about 25 miles northwest of Mankato. The city has a population of 1,717 people, according to the 2010 census.
Hector was founded in 1856 by a group of settlers from Norway. The city was named after the Greek hero, Hector, and was incorporated in 1872. The city was originally a farming community, but it has since become a bedroom community for Mankato and the surrounding area.
Geography
Hector is located in the Minnesota River Valley, which is part of the larger Minnesota River Basin. The city is situated on the banks of the Minnesota River, about 25 miles northwest of Mankato. The city is surrounded by rolling hills and farmland, and is located in the middle of the Minnesota River Valley.
The climate in Hector is typical of the Midwest, with cold winters and hot summers. The average temperature in January is around 10 degrees Fahrenheit, and the average temperature in July is around 75 degrees Fahrenheit.
Economy
Hector's economy is largely based on agriculture and tourism. The city is home to several farms, which produce a variety of crops, including corn, soybeans, and wheat. The city is also home to several small businesses, including restaurants, retail stores, and service providers.
The city is also a popular tourist destination, due to its proximity to the Minnesota River and its many outdoor activities. The city is home to several parks, including the Hector City Park, which features a playground, picnic areas, and a walking trail. The city also hosts several annual events, including the Hector Days Festival, which is held every summer.
Demographics
According to the 2010 census, the population of Hector was 1,717 people. The racial makeup of the city was 97.2% White, 0.6% African American, 0.3% Native American, 0.2% Asian, 0.1% Pacific Islander, 0.7% from other races, and 0.9% from two or more races. Hispanic or Latino of any race were 1.3% of the population.
The median household income in Hector was $45,938, and the median family income was $51,938. The per capita income for the city was $20,938. About 8.2% of families and 10.2% of the population were below the poverty line, including 14.2% of those under age 18 and 8.2% of those age 65 or over.
Conclusion
Hector, Minnesota is a small city located in Renville County in the southwestern part of the state. It is situated on the banks of the Minnesota River, about 25 miles northwest of Mankato. The city has a population of 1,717 people, according to the 2010 census. Hector was founded in 1856 by a group of settlers from Norway, and was incorporated in 1872. The city's economy is largely based on agriculture and tourism, and it is a popular tourist destination due to its proximity to the Minnesota River and its many outdoor activities. The racial makeup of the city is 97.2% White, 0.6% African American, 0.3% Native American, 0.2% Asian, 0.1% Pacific Islander, 0.7% from other races, and 0.9% from two or more races. The median household income in Hector was $45,938, and the median family income was $51,938. The per capita income for the city was $20,938.
Common Questions
What is Per Capita Income in Hector?
Per Capita income in Hector is $29,783.
What is the Median Family Income in Hector?
Median Family Income in Hector is $70,313.
What is the Median Household income in Hector?
Median Household Income in Hector is $57,788.
What is Income or Wage Gap in Hector?
Income or Wage Gap in Hector is 10.2%.
Women in Hector earn 89.8 cents for every dollar earned by a man.
What is Family Income Deficit in Hector?
Family Income Deficit in Hector is $10,914.
Families that are below poverty line in Hector earn $10,914 less on average than the poverty threshold level.
What is Inequality or Gini Index in Hector?
Inequality or Gini Index in Hector is 0.38.
What is the Total Population of Hector?
Total Population of Hector is 1,127.
What is the Total Male Population of Hector?
Total Male Population of Hector is 562.
What is the Total Female Population of Hector?
Total Female Population of Hector is 565.
What is the Ratio of Males per 100 Females in Hector?
There are 99.47 Males per 100 Females in Hector.
What is the Ratio of Females per 100 Males in Hector?
There are 100.53 Females per 100 Males in Hector.
What is the Median Population Age in Hector?
Median Population Age in Hector is 38.3 Years.
What is the Average Family Size in Hector
Average Family Size in Hector is 3.3 People.
What is the Average Household Size in Hector
Average Household Size in Hector is 2.6 People.
How Large is the Labor Force in Hector?
There are 639 People in the Labor Forcein in Hector.
What is the Percentage of People in the Labor Force in Hector?
70.9% of People are in the Labor Force in Hector.
What is the Unemployment Rate in Hector?
Unemployment Rate in Hector is 0.9%.