Hawley, MN Map & Demographics
Hawley Map
Hawley Overview
$36,650
PER CAPITA INCOME
$105,893
AVG FAMILY INCOME
$86,667
AVG HOUSEHOLD INCOME
28.3%
WAGE / INCOME GAP [ % ]
71.7¢/ $1
WAGE / INCOME GAP [ $ ]
$4,396
FAMILY INCOME DEFICIT
0.38
INEQUALITY / GINI INDEX
2,065
TOTAL POPULATION
946
MALE POPULATION
1,119
FEMALE POPULATION
84.54
MALES / 100 FEMALES
118.29
FEMALES / 100 MALES
35.2
MEDIAN AGE
3.2
AVG FAMILY SIZE
2.6
AVG HOUSEHOLD SIZE
1,026
LABOR FORCE [ PEOPLE ]
71.8%
PERCENT IN LABOR FORCE
1.4%
UNEMPLOYMENT RATE
Hawley Zip Codes
Hawley Area Codes
Income in Hawley
Income Overview in Hawley
Per Capita Income in Hawley is $36,650, while median incomes of families and households are $105,893 and $86,667 respectively.
| Characteristic | Number | Measure |
| Per Capita Income | 2,065 | $36,650 |
| Median Family Income | 549 | $105,893 |
| Mean Family Income | 549 | $112,637 |
| Median Household Income | 792 | $86,667 |
| Mean Household Income | 792 | $93,652 |
| Income Deficit | 549 | $4,396 |
| Wage / Income Gap (%) | 2,065 | 28.29% |
| Wage / Income Gap ($) | 2,065 | 71.71¢ per $1 |
| Gini / Inequality Index | 2,065 | 0.38 |
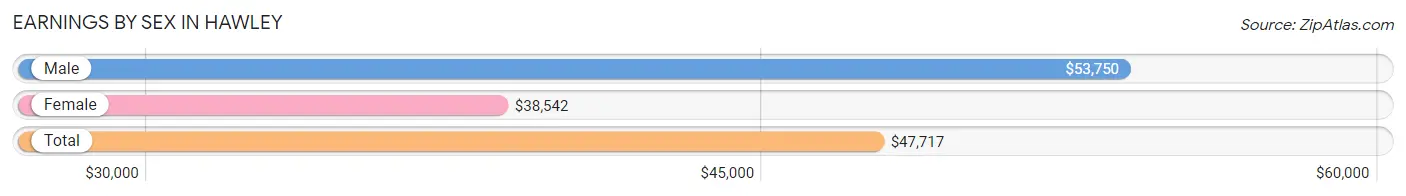
Earnings by Sex in Hawley
Average Earnings in Hawley are $47,717, $53,750 for men and $38,542 for women, a difference of 28.3%.
| Sex | Number | Average Earnings |
| Male | 469 (43.0%) | $53,750 |
| Female | 621 (57.0%) | $38,542 |
| Total | 1,090 (100.0%) | $47,717 |
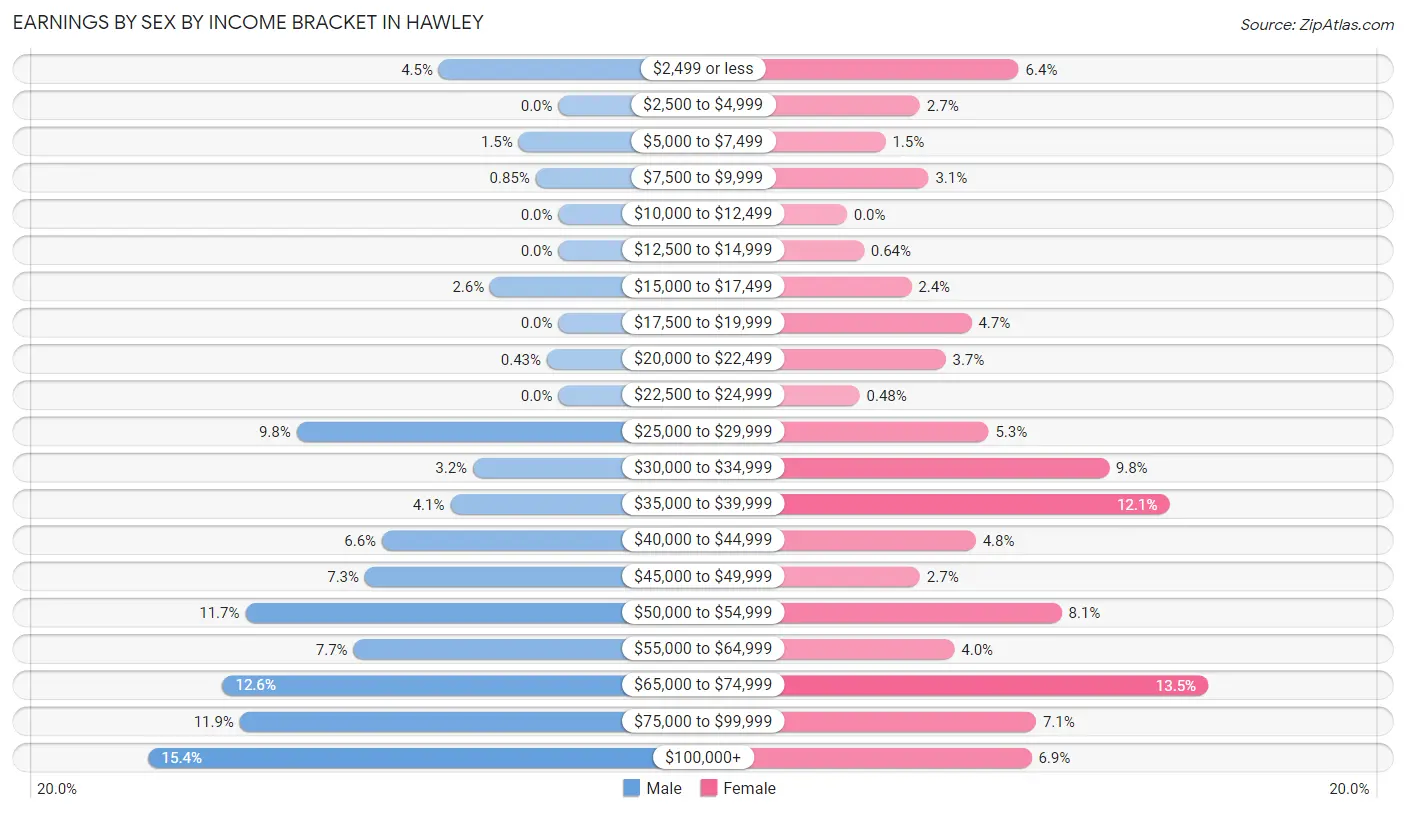
Earnings by Sex by Income Bracket in Hawley
The most common earnings brackets in Hawley are $100,000+ for men (72 | 15.3%) and $65,000 to $74,999 for women (84 | 13.5%).
| Income | Male | Female |
| $2,499 or less | 21 (4.5%) | 40 (6.4%) |
| $2,500 to $4,999 | 0 (0.0%) | 17 (2.7%) |
| $5,000 to $7,499 | 7 (1.5%) | 9 (1.5%) |
| $7,500 to $9,999 | 4 (0.9%) | 19 (3.1%) |
| $10,000 to $12,499 | 0 (0.0%) | 0 (0.0%) |
| $12,500 to $14,999 | 0 (0.0%) | 4 (0.6%) |
| $15,000 to $17,499 | 12 (2.6%) | 15 (2.4%) |
| $17,500 to $19,999 | 0 (0.0%) | 29 (4.7%) |
| $20,000 to $22,499 | 2 (0.4%) | 23 (3.7%) |
| $22,500 to $24,999 | 0 (0.0%) | 3 (0.5%) |
| $25,000 to $29,999 | 46 (9.8%) | 33 (5.3%) |
| $30,000 to $34,999 | 15 (3.2%) | 61 (9.8%) |
| $35,000 to $39,999 | 19 (4.1%) | 75 (12.1%) |
| $40,000 to $44,999 | 31 (6.6%) | 30 (4.8%) |
| $45,000 to $49,999 | 34 (7.2%) | 17 (2.7%) |
| $50,000 to $54,999 | 55 (11.7%) | 50 (8.1%) |
| $55,000 to $64,999 | 36 (7.7%) | 25 (4.0%) |
| $65,000 to $74,999 | 59 (12.6%) | 84 (13.5%) |
| $75,000 to $99,999 | 56 (11.9%) | 44 (7.1%) |
| $100,000+ | 72 (15.3%) | 43 (6.9%) |
| Total | 469 (100.0%) | 621 (100.0%) |
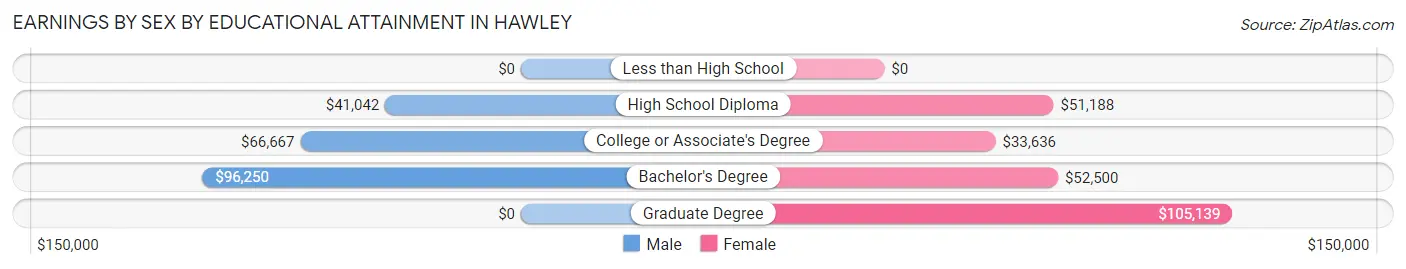
Earnings by Sex by Educational Attainment in Hawley
Average earnings in Hawley are $55,000 for men and $40,125 for women, a difference of 27.1%. Men with an educational attainment of bachelor's degree enjoy the highest average annual earnings of $96,250, while those with high school diploma education earn the least with $41,042. Women with an educational attainment of graduate degree earn the most with the average annual earnings of $105,139, while those with college or associate's degree education have the smallest earnings of $33,636.
| Educational Attainment | Male Income | Female Income |
| Less than High School | - | - |
| High School Diploma | $41,042 | $51,188 |
| College or Associate's Degree | $66,667 | $33,636 |
| Bachelor's Degree | $96,250 | $52,500 |
| Graduate Degree | - | - |
| Total | $55,000 | $40,125 |
Family Income in Hawley
Family Income Brackets in Hawley
According to the Hawley family income data, there are 165 families falling into the $100,000 to $149,999 income range, which is the most common income bracket and makes up 30.0% of all families.
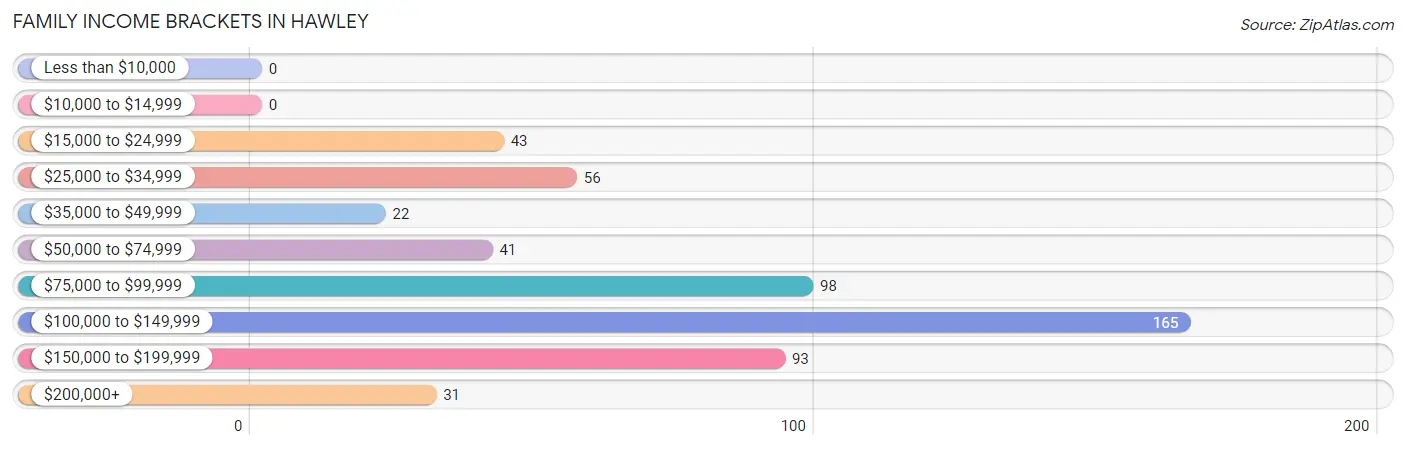
| Income Bracket | # Families | % Families |
| Less than $10,000 | 0 | 0.0% |
| $10,000 to $14,999 | 0 | 0.0% |
| $15,000 to $24,999 | 43 | 7.8% |
| $25,000 to $34,999 | 56 | 10.2% |
| $35,000 to $49,999 | 22 | 4.0% |
| $50,000 to $74,999 | 41 | 7.5% |
| $75,000 to $99,999 | 98 | 17.9% |
| $100,000 to $149,999 | 165 | 30.1% |
| $150,000 to $199,999 | 93 | 16.9% |
| $200,000+ | 31 | 5.6% |
Family Income by Famaliy Size in Hawley
2-person families (202 | 36.8%) account for the highest median family income in Hawley with $131,000 per family, while 2-person families (202 | 36.8%) have the highest median income of $65,500 per family member.
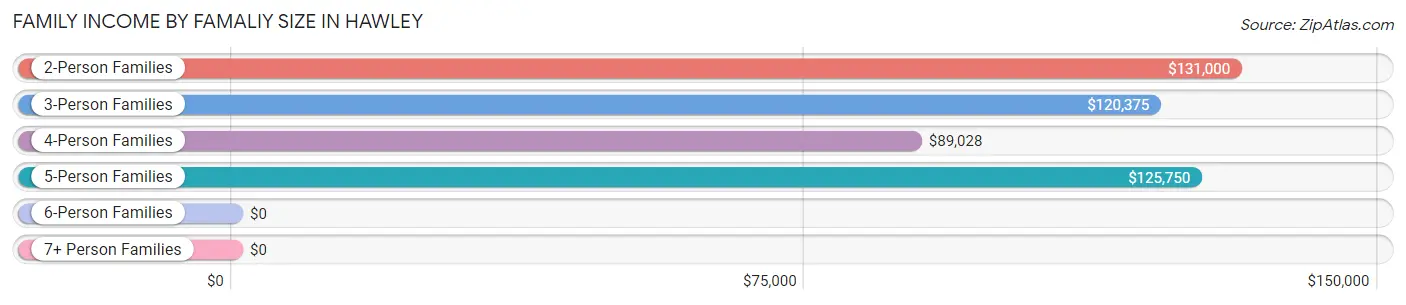
| Income Bracket | # Families | Median Income |
| 2-Person Families | 202 (36.8%) | $131,000 |
| 3-Person Families | 137 (24.9%) | $120,375 |
| 4-Person Families | 145 (26.4%) | $89,028 |
| 5-Person Families | 59 (10.7%) | $125,750 |
| 6-Person Families | 6 (1.1%) | $0 |
| 7+ Person Families | 0 (0.0%) | $0 |
| Total | 549 (100.0%) | $105,893 |
Family Income by Number of Earners in Hawley
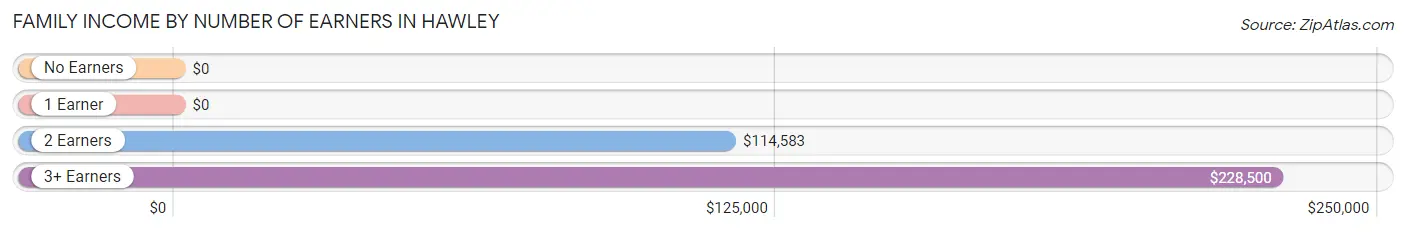
| Number of Earners | # Families | Median Income |
| No Earners | 30 (5.5%) | $0 |
| 1 Earner | 209 (38.1%) | $0 |
| 2 Earners | 270 (49.2%) | $114,583 |
| 3+ Earners | 40 (7.3%) | $228,500 |
| Total | 549 (100.0%) | $105,893 |
Household Income in Hawley
Household Income Brackets in Hawley
With 180 households falling in the category, the $100,000 to $149,999 income range is the most frequent in Hawley, accounting for 22.7% of all households.
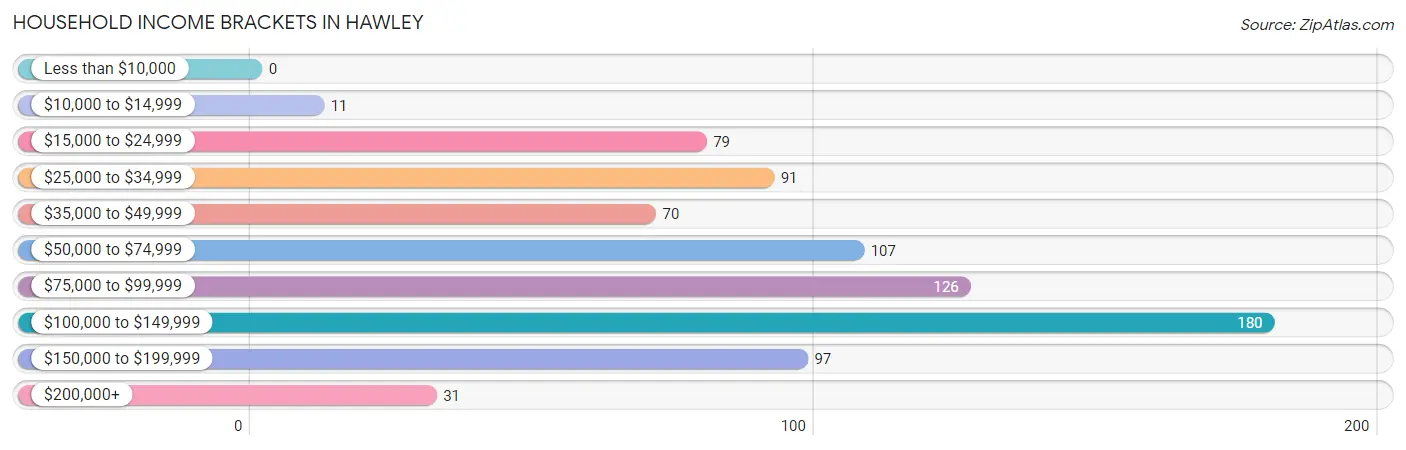
| Income Bracket | # Households | % Households |
| Less than $10,000 | 0 | 0.0% |
| $10,000 to $14,999 | 11 | 1.4% |
| $15,000 to $24,999 | 79 | 10.0% |
| $25,000 to $34,999 | 91 | 11.5% |
| $35,000 to $49,999 | 70 | 8.8% |
| $50,000 to $74,999 | 107 | 13.5% |
| $75,000 to $99,999 | 126 | 15.9% |
| $100,000 to $149,999 | 180 | 22.7% |
| $150,000 to $199,999 | 97 | 12.2% |
| $200,000+ | 31 | 3.9% |
Household Income by Householder Age in Hawley
The median household income in Hawley is $86,667, with the highest median household income of $126,750 found in the 45 to 64 years age bracket for the primary householder. A total of 248 households (31.3%) fall into this category. Meanwhile, the 15 to 24 years age bracket for the primary householder has the lowest median household income of $0, with 7 households (0.9%) in this group.
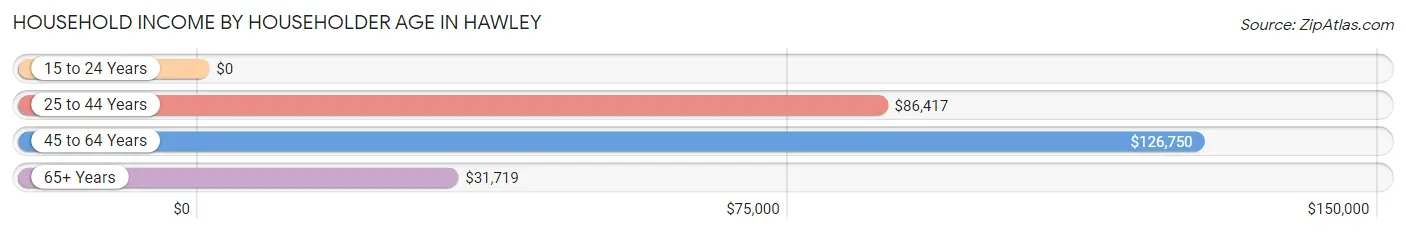
| Income Bracket | # Households | Median Income |
| 15 to 24 Years | 7 (0.9%) | $0 |
| 25 to 44 Years | 359 (45.3%) | $86,417 |
| 45 to 64 Years | 248 (31.3%) | $126,750 |
| 65+ Years | 178 (22.5%) | $31,719 |
| Total | 792 (100.0%) | $86,667 |
Poverty in Hawley
Income Below Poverty by Sex and Age in Hawley
With 5.3% poverty level for males and 10.9% for females among the residents of Hawley, 12 to 14 year old males and 6 to 11 year old females are the most vulnerable to poverty, with 10 males (31.2%) and 40 females (35.4%) in their respective age groups living below the poverty level.
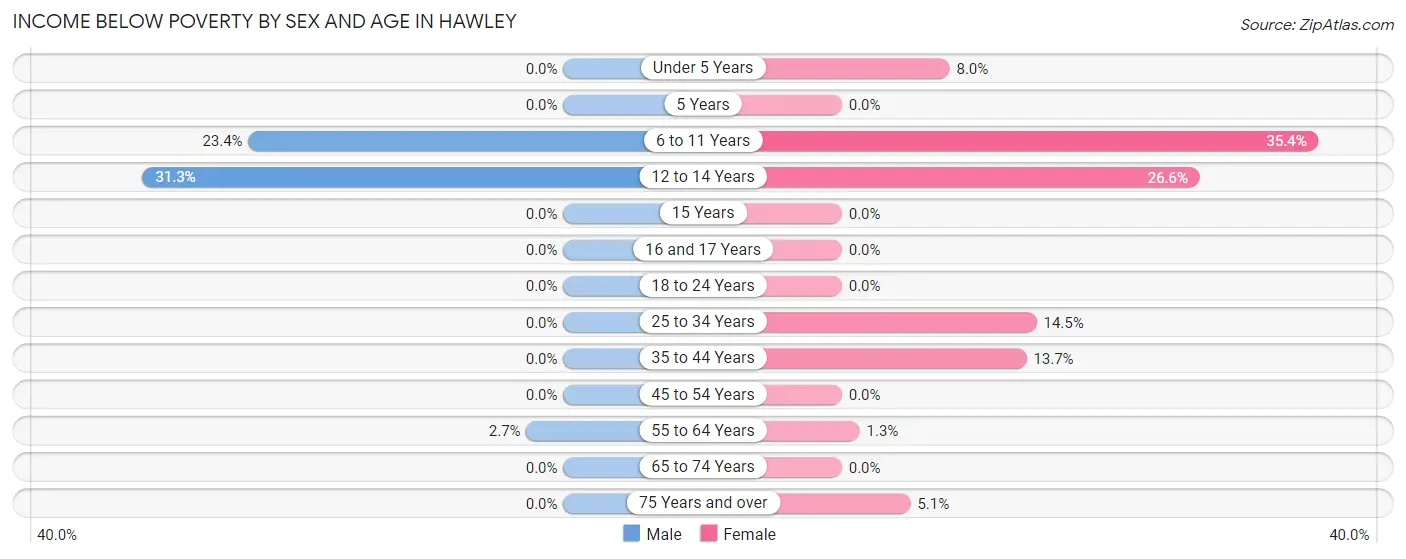
| Age Bracket | Male | Female |
| Under 5 Years | 0 (0.0%) | 6 (8.0%) |
| 5 Years | 0 (0.0%) | 0 (0.0%) |
| 6 to 11 Years | 36 (23.4%) | 40 (35.4%) |
| 12 to 14 Years | 10 (31.2%) | 21 (26.6%) |
| 15 Years | 0 (0.0%) | 0 (0.0%) |
| 16 and 17 Years | 0 (0.0%) | 0 (0.0%) |
| 18 to 24 Years | 0 (0.0%) | 0 (0.0%) |
| 25 to 34 Years | 0 (0.0%) | 24 (14.5%) |
| 35 to 44 Years | 0 (0.0%) | 24 (13.7%) |
| 45 to 54 Years | 0 (0.0%) | 0 (0.0%) |
| 55 to 64 Years | 4 (2.7%) | 2 (1.3%) |
| 65 to 74 Years | 0 (0.0%) | 0 (0.0%) |
| 75 Years and over | 0 (0.0%) | 5 (5.1%) |
| Total | 50 (5.3%) | 122 (10.9%) |
Income Above Poverty by Sex and Age in Hawley
According to the poverty statistics in Hawley, males aged under 5 years and females aged 5 years are the age groups that are most secure financially, with 100.0% of males and 100.0% of females in these age groups living above the poverty line.
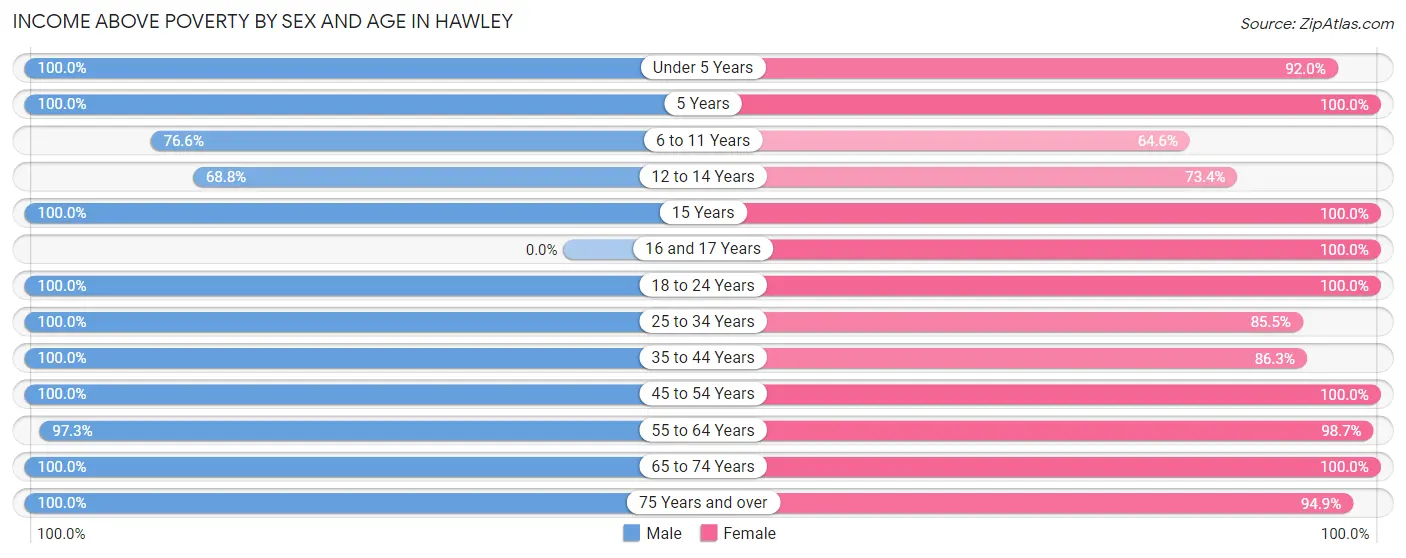
| Age Bracket | Male | Female |
| Under 5 Years | 111 (100.0%) | 69 (92.0%) |
| 5 Years | 14 (100.0%) | 28 (100.0%) |
| 6 to 11 Years | 118 (76.6%) | 73 (64.6%) |
| 12 to 14 Years | 22 (68.8%) | 58 (73.4%) |
| 15 Years | 17 (100.0%) | 13 (100.0%) |
| 16 and 17 Years | 0 (0.0%) | 27 (100.0%) |
| 18 to 24 Years | 23 (100.0%) | 25 (100.0%) |
| 25 to 34 Years | 144 (100.0%) | 142 (85.5%) |
| 35 to 44 Years | 155 (100.0%) | 151 (86.3%) |
| 45 to 54 Years | 47 (100.0%) | 108 (100.0%) |
| 55 to 64 Years | 142 (97.3%) | 149 (98.7%) |
| 65 to 74 Years | 39 (100.0%) | 61 (100.0%) |
| 75 Years and over | 64 (100.0%) | 93 (94.9%) |
| Total | 896 (94.7%) | 997 (89.1%) |
Income Below Poverty Among Married-Couple Families in Hawley
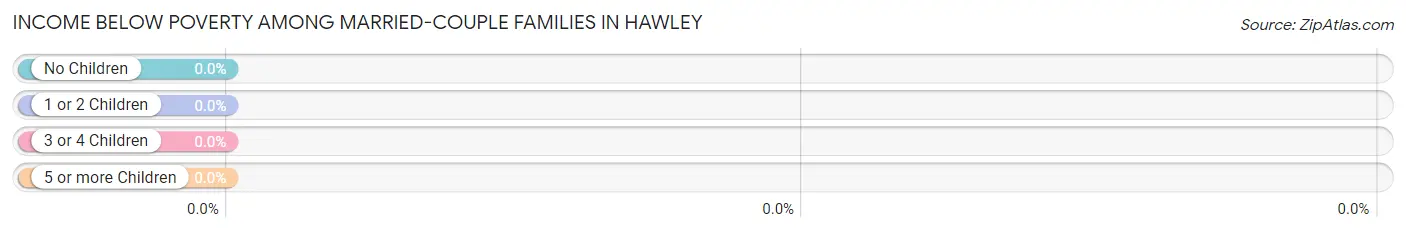
| Children | Above Poverty | Below Poverty |
| No Children | 201 (100.0%) | 0 (0.0%) |
| 1 or 2 Children | 177 (100.0%) | 0 (0.0%) |
| 3 or 4 Children | 45 (100.0%) | 0 (0.0%) |
| 5 or more Children | 0 (0.0%) | 0 (0.0%) |
| Total | 423 (100.0%) | 0 (0.0%) |
Income Below Poverty Among Single-Parent Households in Hawley
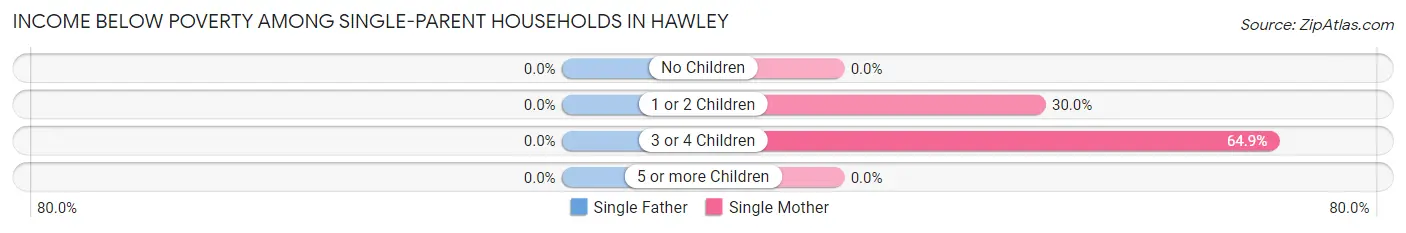
| Children | Single Father | Single Mother |
| No Children | 0 (0.0%) | 0 (0.0%) |
| 1 or 2 Children | 0 (0.0%) | 24 (30.0%) |
| 3 or 4 Children | 0 (0.0%) | 24 (64.9%) |
| 5 or more Children | 0 (0.0%) | 0 (0.0%) |
| Total | 0 (0.0%) | 48 (39.7%) |
Income Below Poverty Among Married-Couple vs Single-Parent Households in Hawley
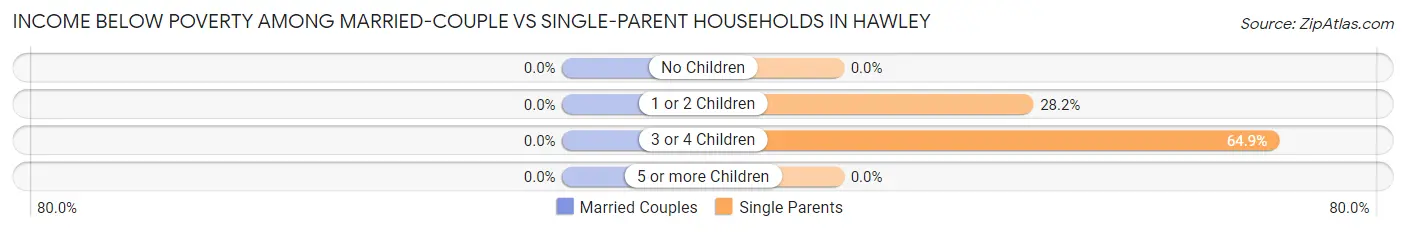
| Children | Married-Couple Families | Single-Parent Households |
| No Children | 0 (0.0%) | 0 (0.0%) |
| 1 or 2 Children | 0 (0.0%) | 24 (28.2%) |
| 3 or 4 Children | 0 (0.0%) | 24 (64.9%) |
| 5 or more Children | 0 (0.0%) | 0 (0.0%) |
| Total | 0 (0.0%) | 48 (38.1%) |
Race in Hawley
The most populous races in Hawley are White / Caucasian (2,012 | 97.4%), Hispanic or Latino (44 | 2.1%), and Black / African American (18 | 0.9%).
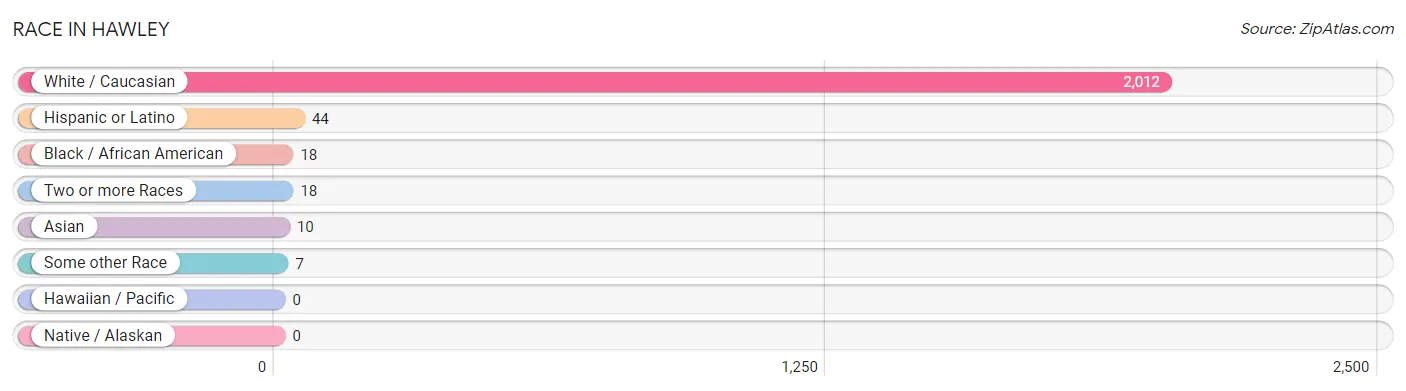
| Race | # Population | % Population |
| Asian | 10 | 0.5% |
| Black / African American | 18 | 0.9% |
| Hawaiian / Pacific | 0 | 0.0% |
| Hispanic or Latino | 44 | 2.1% |
| Native / Alaskan | 0 | 0.0% |
| White / Caucasian | 2,012 | 97.4% |
| Two or more Races | 18 | 0.9% |
| Some other Race | 7 | 0.3% |
| Total | 2,065 | 100.0% |
Ancestry in Hawley
The most populous ancestries reported in Hawley are German (868 | 42.0%), Norwegian (727 | 35.2%), Polish (155 | 7.5%), Irish (135 | 6.5%), and Swedish (131 | 6.3%), together accounting for 97.6% of all Hawley residents.
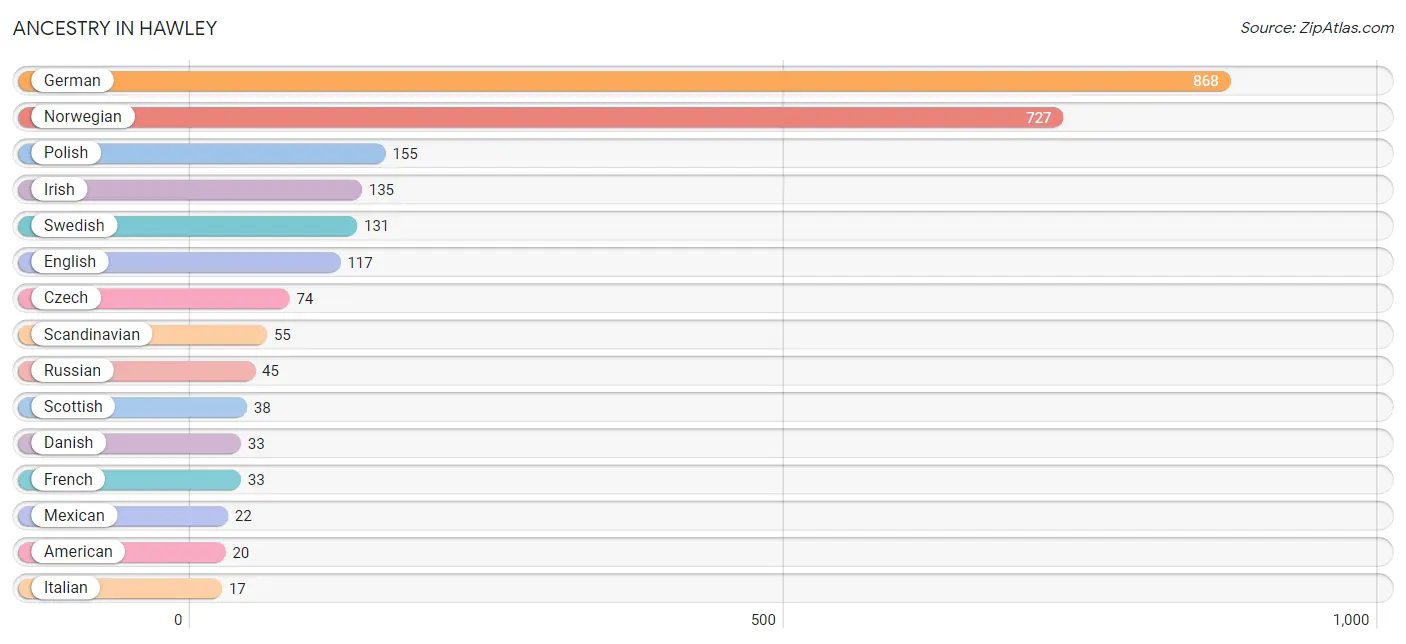
| Ancestry | # Population | % Population |
| American | 20 | 1.0% |
| Czech | 74 | 3.6% |
| Czechoslovakian | 15 | 0.7% |
| Danish | 33 | 1.6% |
| Dominican | 6 | 0.3% |
| English | 117 | 5.7% |
| Finnish | 14 | 0.7% |
| French | 33 | 1.6% |
| German | 868 | 42.0% |
| Irish | 135 | 6.5% |
| Italian | 17 | 0.8% |
| Korean | 16 | 0.8% |
| Mexican | 22 | 1.1% |
| Norwegian | 727 | 35.2% |
| Polish | 155 | 7.5% |
| Russian | 45 | 2.2% |
| Scandinavian | 55 | 2.7% |
| Scottish | 38 | 1.8% |
| Spaniard | 16 | 0.8% |
| Swedish | 131 | 6.3% |
| Swiss | 6 | 0.3% |
| Ukrainian | 2 | 0.1% |
| Welsh | 5 | 0.2% | View All 23 Rows |
Immigrants in Hawley

| Immigration Origin | # Population | % Population | View All 0 Rows |
Sex and Age in Hawley
Sex and Age in Hawley
The most populous age groups in Hawley are Under 5 Years (111 | 11.7%) for men and 5 to 9 Years (131 | 11.7%) for women.
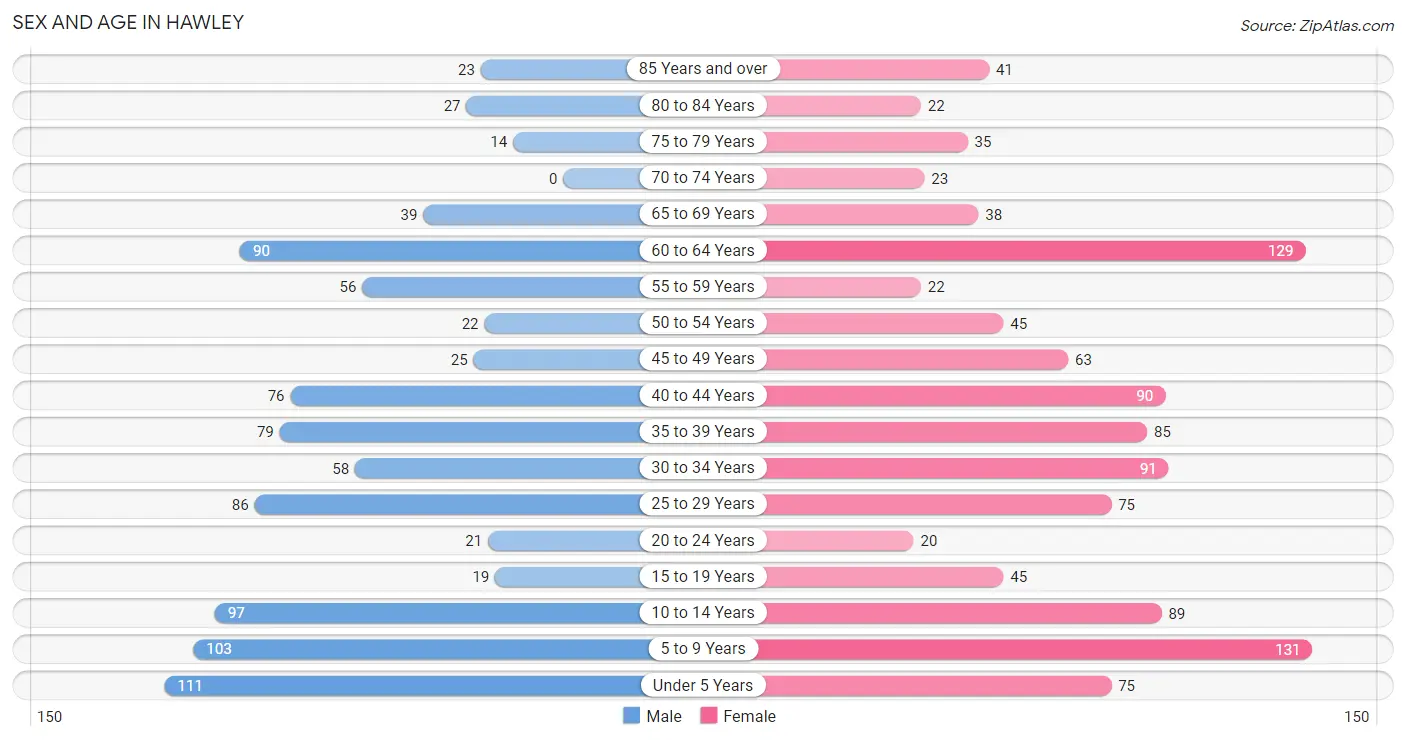
| Age Bracket | Male | Female |
| Under 5 Years | 111 (11.7%) | 75 (6.7%) |
| 5 to 9 Years | 103 (10.9%) | 131 (11.7%) |
| 10 to 14 Years | 97 (10.2%) | 89 (8.0%) |
| 15 to 19 Years | 19 (2.0%) | 45 (4.0%) |
| 20 to 24 Years | 21 (2.2%) | 20 (1.8%) |
| 25 to 29 Years | 86 (9.1%) | 75 (6.7%) |
| 30 to 34 Years | 58 (6.1%) | 91 (8.1%) |
| 35 to 39 Years | 79 (8.4%) | 85 (7.6%) |
| 40 to 44 Years | 76 (8.0%) | 90 (8.0%) |
| 45 to 49 Years | 25 (2.6%) | 63 (5.6%) |
| 50 to 54 Years | 22 (2.3%) | 45 (4.0%) |
| 55 to 59 Years | 56 (5.9%) | 22 (2.0%) |
| 60 to 64 Years | 90 (9.5%) | 129 (11.5%) |
| 65 to 69 Years | 39 (4.1%) | 38 (3.4%) |
| 70 to 74 Years | 0 (0.0%) | 23 (2.1%) |
| 75 to 79 Years | 14 (1.5%) | 35 (3.1%) |
| 80 to 84 Years | 27 (2.9%) | 22 (2.0%) |
| 85 Years and over | 23 (2.4%) | 41 (3.7%) |
| Total | 946 (100.0%) | 1,119 (100.0%) |
Families and Households in Hawley
Median Family Size in Hawley
The median family size in Hawley is 3.20 persons per family, with married-couple families (423 | 77.0%) accounting for the largest median family size of 3.27 persons per family. On the other hand, single male/father families (5 | 0.9%) represent the smallest median family size with 2.60 persons per family.
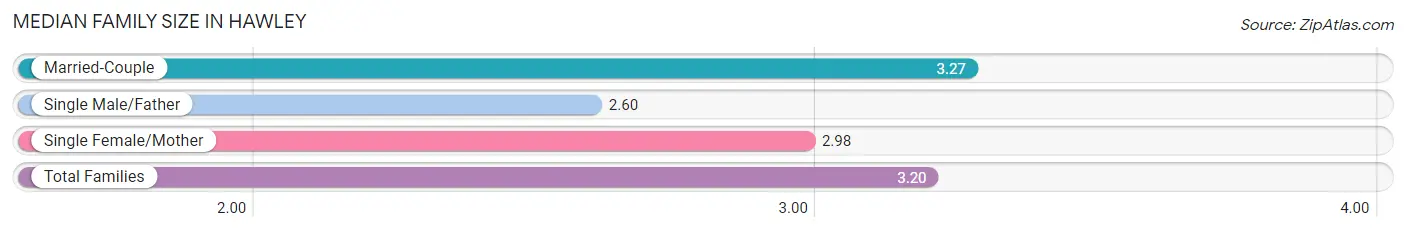
| Family Type | # Families | Family Size |
| Married-Couple | 423 (77.0%) | 3.27 |
| Single Male/Father | 5 (0.9%) | 2.60 |
| Single Female/Mother | 121 (22.0%) | 2.98 |
| Total Families | 549 (100.0%) | 3.20 |
Median Household Size in Hawley
The median household size in Hawley is 2.61 persons per household, with single female/mother households (121 | 15.3%) accounting for the largest median household size of 3.41 persons per household. non-family households (243 | 30.7%) represent the smallest median household size with 1.05 persons per household.
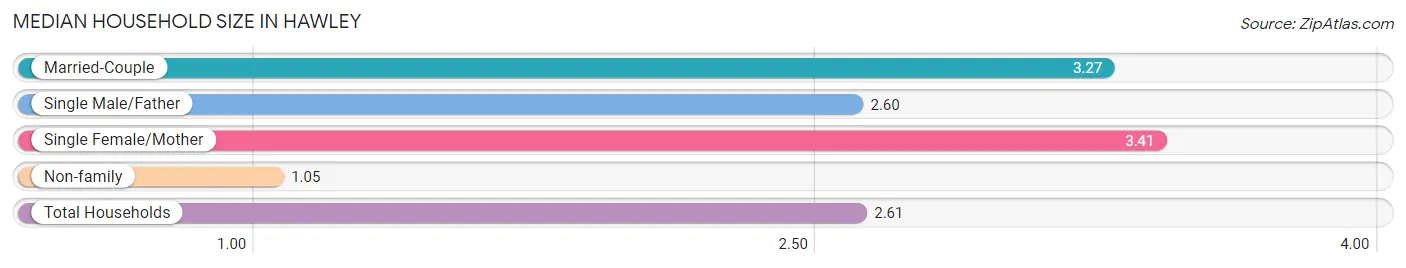
| Household Type | # Households | Household Size |
| Married-Couple | 423 (53.4%) | 3.27 |
| Single Male/Father | 5 (0.6%) | 2.60 |
| Single Female/Mother | 121 (15.3%) | 3.41 |
| Non-family | 243 (30.7%) | 1.05 |
| Total Households | 792 (100.0%) | 2.61 |
Household Size by Marriage Status in Hawley
Out of a total of 792 households in Hawley, 549 (69.3%) are family households, while 243 (30.7%) are nonfamily households. The most numerous type of family households are 2-person households, comprising 187, and the most common type of nonfamily households are 1-person households, comprising 233.
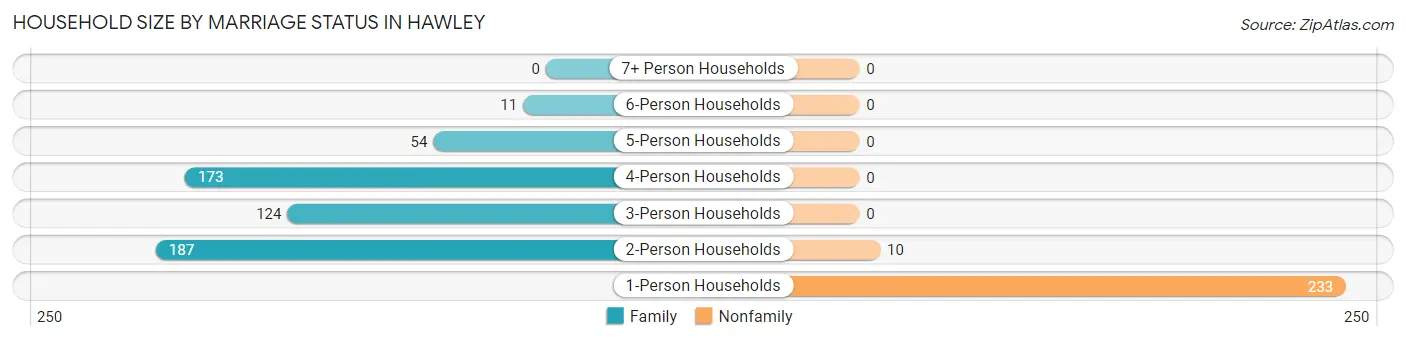
| Household Size | Family Households | Nonfamily Households |
| 1-Person Households | - | 233 (29.4%) |
| 2-Person Households | 187 (23.6%) | 10 (1.3%) |
| 3-Person Households | 124 (15.7%) | 0 (0.0%) |
| 4-Person Households | 173 (21.8%) | 0 (0.0%) |
| 5-Person Households | 54 (6.8%) | 0 (0.0%) |
| 6-Person Households | 11 (1.4%) | 0 (0.0%) |
| 7+ Person Households | 0 (0.0%) | 0 (0.0%) |
| Total | 549 (69.3%) | 243 (30.7%) |
Female Fertility in Hawley
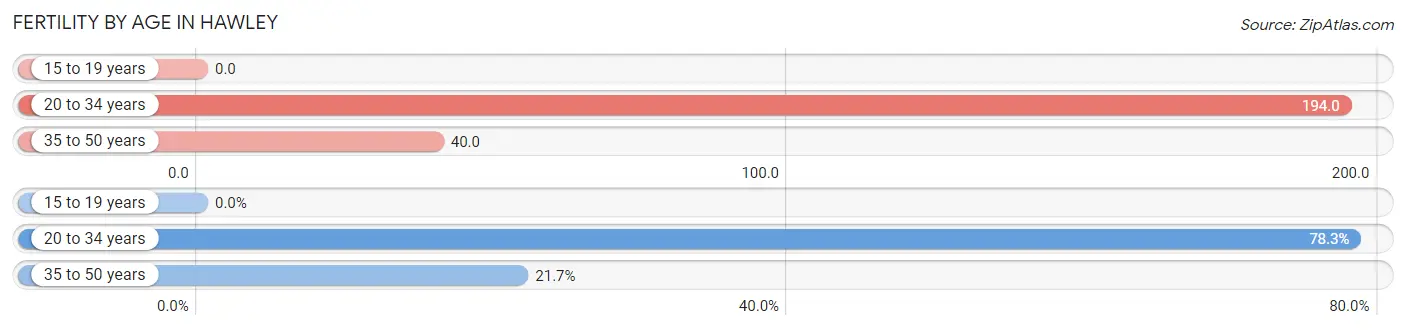
Fertility by Age in Hawley
Average fertility rate in Hawley is 96.0 births per 1,000 women. Women in the age bracket of 20 to 34 years have the highest fertility rate with 194.0 births per 1,000 women. Women in the age bracket of 20 to 34 years acount for 78.3% of all women with births.
| Age Bracket | Women with Births | Births / 1,000 Women |
| 15 to 19 years | 0 (0.0%) | 0.0 |
| 20 to 34 years | 36 (78.3%) | 194.0 |
| 35 to 50 years | 10 (21.7%) | 40.0 |
| Total | 46 (100.0%) | 96.0 |
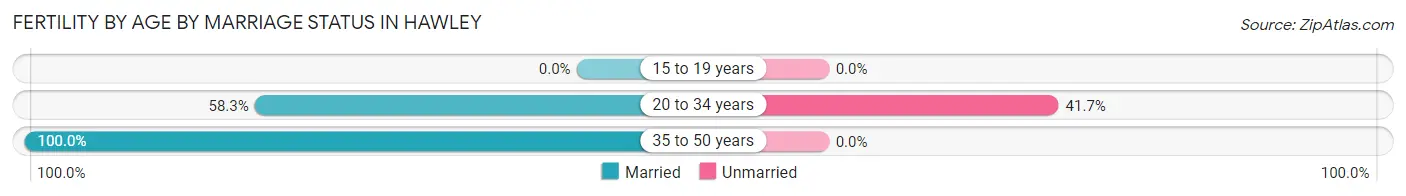
Fertility by Age by Marriage Status in Hawley
67.4% of women with births (46) in Hawley are married. The highest percentage of unmarried women with births falls into 20 to 34 years age bracket with 41.7% of them unmarried at the time of birth, while the lowest percentage of unmarried women with births belong to 35 to 50 years age bracket with 0.0% of them unmarried.
| Age Bracket | Married | Unmarried |
| 15 to 19 years | 0 (0.0%) | 0 (0.0%) |
| 20 to 34 years | 21 (58.3%) | 15 (41.7%) |
| 35 to 50 years | 10 (100.0%) | 0 (0.0%) |
| Total | 31 (67.4%) | 15 (32.6%) |
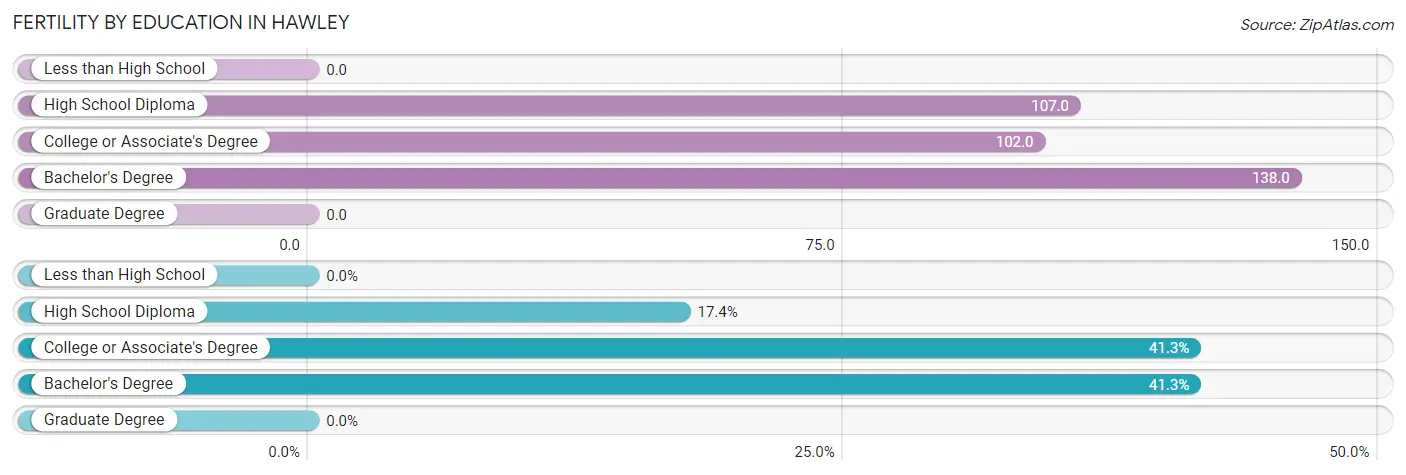
Fertility by Education in Hawley
| Educational Attainment | Women with Births | Births / 1,000 Women |
| Less than High School | 0 (0.0%) | 0.0 |
| High School Diploma | 8 (17.4%) | 107.0 |
| College or Associate's Degree | 19 (41.3%) | 102.0 |
| Bachelor's Degree | 19 (41.3%) | 138.0 |
| Graduate Degree | 0 (0.0%) | 0.0 |
| Total | 46 (100.0%) | 96.0 |
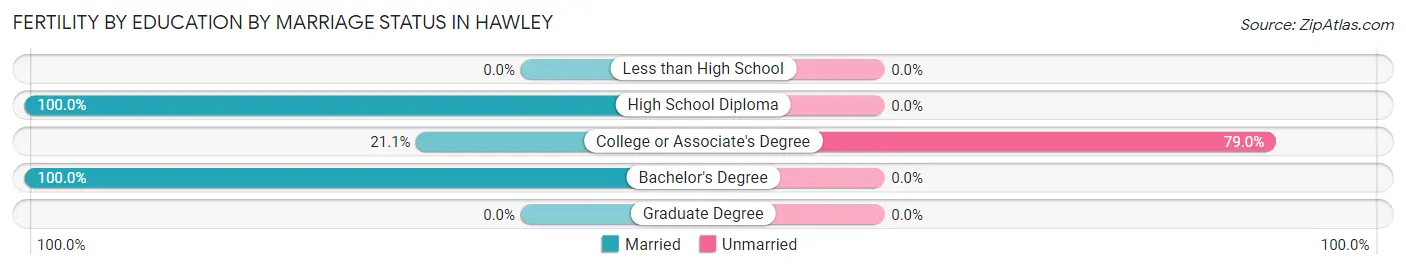
Fertility by Education by Marriage Status in Hawley
32.6% of women with births in Hawley are unmarried. Women with the educational attainment of high school diploma are most likely to be married with 100.0% of them married at childbirth, while women with the educational attainment of college or associate's degree are least likely to be married with 78.9% of them unmarried at childbirth.
| Educational Attainment | Married | Unmarried |
| Less than High School | 0 (0.0%) | 0 (0.0%) |
| High School Diploma | 8 (100.0%) | 0 (0.0%) |
| College or Associate's Degree | 4 (21.0%) | 15 (78.9%) |
| Bachelor's Degree | 19 (100.0%) | 0 (0.0%) |
| Graduate Degree | 0 (0.0%) | 0 (0.0%) |
| Total | 31 (67.4%) | 15 (32.6%) |
Employment Characteristics in Hawley
Employment by Class of Employer in Hawley
Among the 984 employed individuals in Hawley, private company employees (695 | 70.6%), not-for-profit organizations (111 | 11.3%), and local government employees (94 | 9.6%) make up the most common classes of employment.
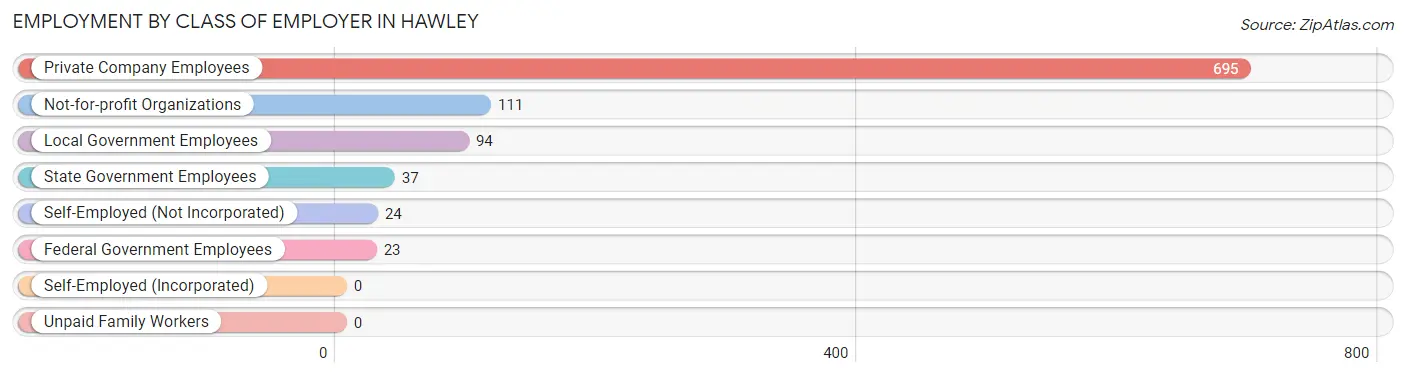
| Employer Class | # Employees | % Employees |
| Private Company Employees | 695 | 70.6% |
| Self-Employed (Incorporated) | 0 | 0.0% |
| Self-Employed (Not Incorporated) | 24 | 2.4% |
| Not-for-profit Organizations | 111 | 11.3% |
| Local Government Employees | 94 | 9.6% |
| State Government Employees | 37 | 3.8% |
| Federal Government Employees | 23 | 2.3% |
| Unpaid Family Workers | 0 | 0.0% |
| Total | 984 | 100.0% |
Employment Status by Age in Hawley
According to the labor force statistics for Hawley, out of the total population over 16 years of age (1,429), 71.8% or 1,026 individuals are in the labor force, with 1.4% or 14 of them unemployed. The age group with the highest labor force participation rate is 25 to 29 years, with 100.0% or 161 individuals in the labor force. Within the labor force, the 16 to 19 years age range has the highest percentage of unemployed individuals, with 17.2% or 5 of them being unemployed.
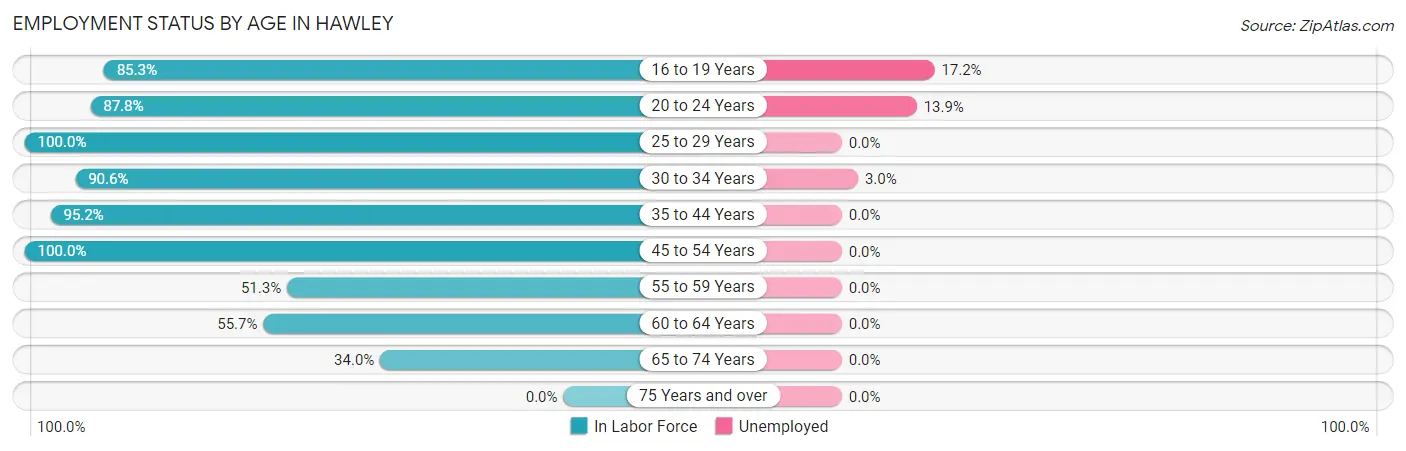
| Age Bracket | In Labor Force | Unemployed |
| 16 to 19 Years | 29 (85.3%) | 5 (17.2%) |
| 20 to 24 Years | 36 (87.8%) | 5 (13.9%) |
| 25 to 29 Years | 161 (100.0%) | 0 (0.0%) |
| 30 to 34 Years | 135 (90.6%) | 4 (3.0%) |
| 35 to 44 Years | 314 (95.2%) | 0 (0.0%) |
| 45 to 54 Years | 155 (100.0%) | 0 (0.0%) |
| 55 to 59 Years | 40 (51.3%) | 0 (0.0%) |
| 60 to 64 Years | 122 (55.7%) | 0 (0.0%) |
| 65 to 74 Years | 34 (34.0%) | 0 (0.0%) |
| 75 Years and over | 0 (0.0%) | 0 (0.0%) |
| Total | 1,026 (71.8%) | 14 (1.4%) |
Employment Status by Educational Attainment in Hawley
According to labor force statistics for Hawley, 84.9% of individuals (927) out of the total population between 25 and 64 years of age (1,092) are in the labor force, with 0.4% or 4 of them being unemployed. The group with the highest labor force participation rate are those with the educational attainment of bachelor's degree or higher, with 99.3% or 291 individuals in the labor force. Within the labor force, individuals with high school diploma education have the highest percentage of unemployment, with 1.4% or 4 of them being unemployed.
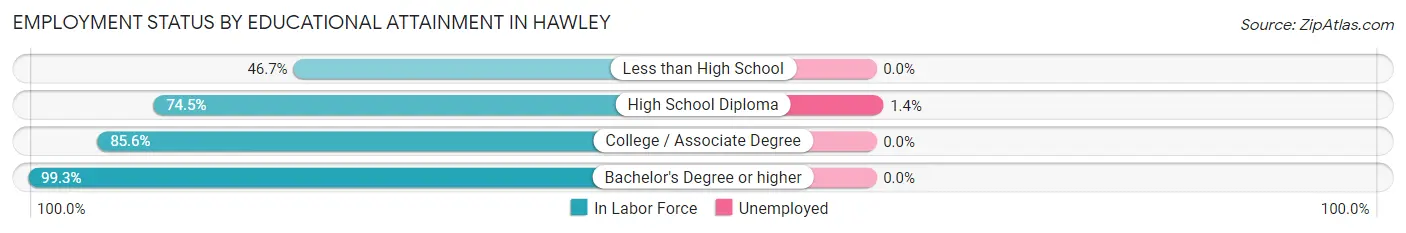
| Educational Attainment | In Labor Force | Unemployed |
| Less than High School | 7 (46.7%) | 0 (0.0%) |
| High School Diploma | 283 (74.5%) | 5 (1.4%) |
| College / Associate Degree | 346 (85.6%) | 0 (0.0%) |
| Bachelor's Degree or higher | 291 (99.3%) | 0 (0.0%) |
| Total | 927 (84.9%) | 4 (0.4%) |
Employment Occupations by Sex in Hawley
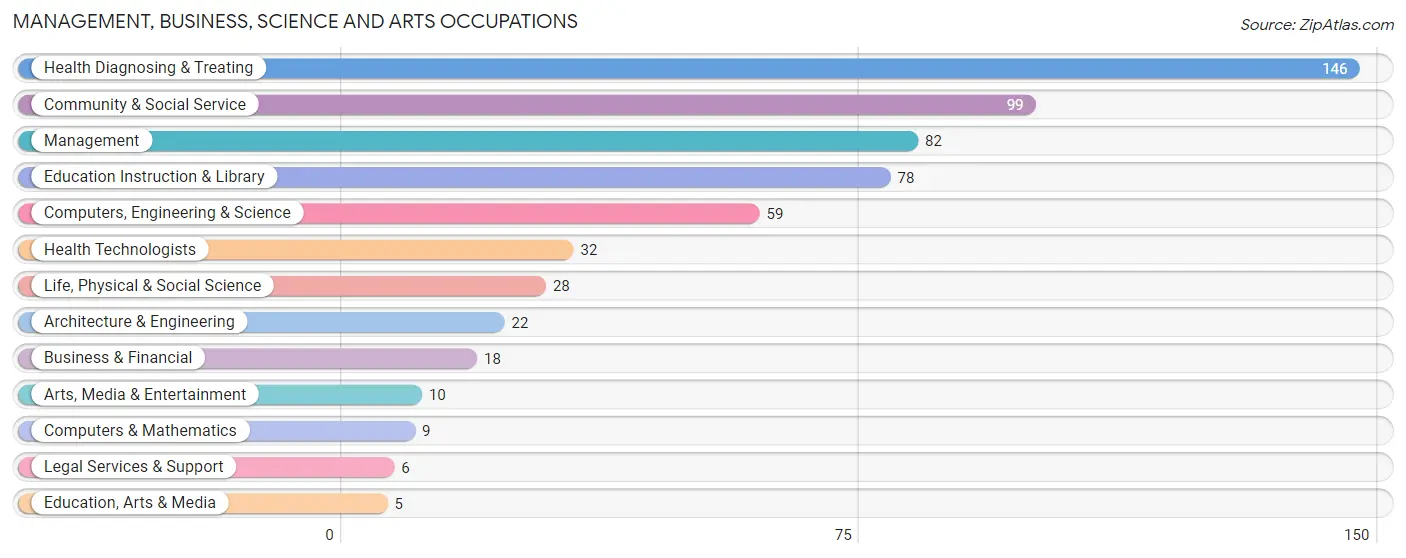
Management, Business, Science and Arts Occupations
The most common Management, Business, Science and Arts occupations in Hawley are Health Diagnosing & Treating (146 | 14.4%), Community & Social Service (99 | 9.8%), Management (82 | 8.1%), Education Instruction & Library (78 | 7.7%), and Computers, Engineering & Science (59 | 5.8%).
Management, Business, Science and Arts Occupations by Sex
Within the Management, Business, Science and Arts occupations in Hawley, the most male-oriented occupations are Computers & Mathematics (100.0%), Architecture & Engineering (100.0%), and Management (59.8%), while the most female-oriented occupations are Life, Physical & Social Science (100.0%), Education, Arts & Media (100.0%), and Legal Services & Support (100.0%).
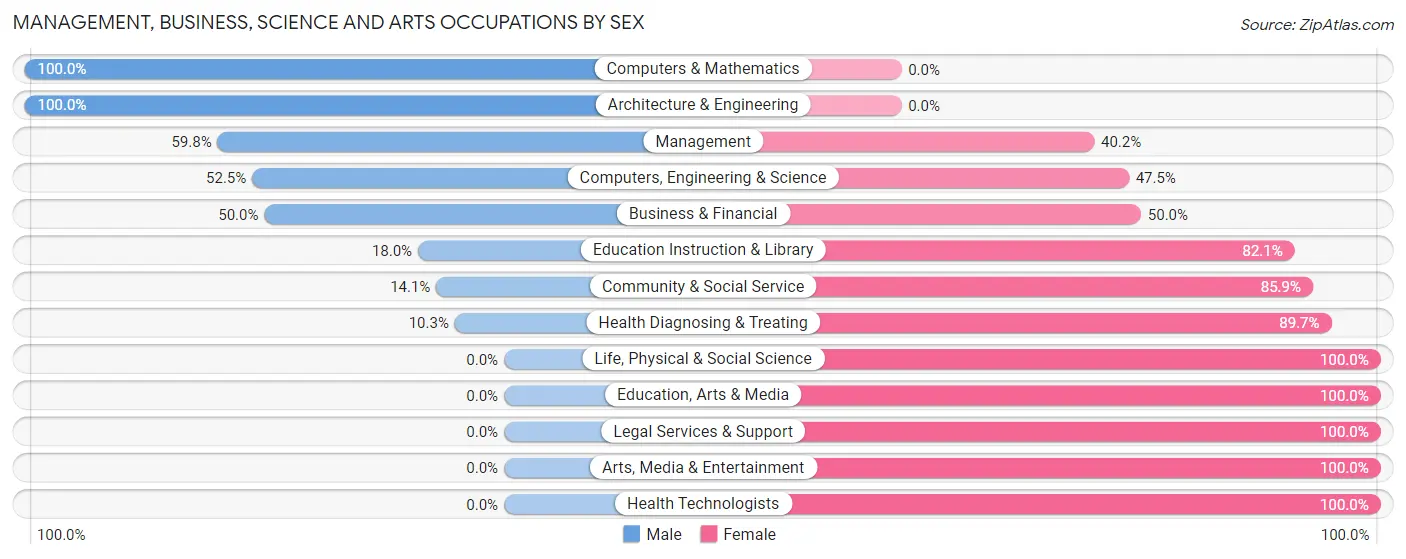
| Occupation | Male | Female |
| Management | 49 (59.8%) | 33 (40.2%) |
| Business & Financial | 9 (50.0%) | 9 (50.0%) |
| Computers, Engineering & Science | 31 (52.5%) | 28 (47.5%) |
| Computers & Mathematics | 9 (100.0%) | 0 (0.0%) |
| Architecture & Engineering | 22 (100.0%) | 0 (0.0%) |
| Life, Physical & Social Science | 0 (0.0%) | 28 (100.0%) |
| Community & Social Service | 14 (14.1%) | 85 (85.9%) |
| Education, Arts & Media | 0 (0.0%) | 5 (100.0%) |
| Legal Services & Support | 0 (0.0%) | 6 (100.0%) |
| Education Instruction & Library | 14 (17.9%) | 64 (82.1%) |
| Arts, Media & Entertainment | 0 (0.0%) | 10 (100.0%) |
| Health Diagnosing & Treating | 15 (10.3%) | 131 (89.7%) |
| Health Technologists | 0 (0.0%) | 32 (100.0%) |
| Total (Category) | 118 (29.2%) | 286 (70.8%) |
| Total (Overall) | 430 (42.5%) | 582 (57.5%) |
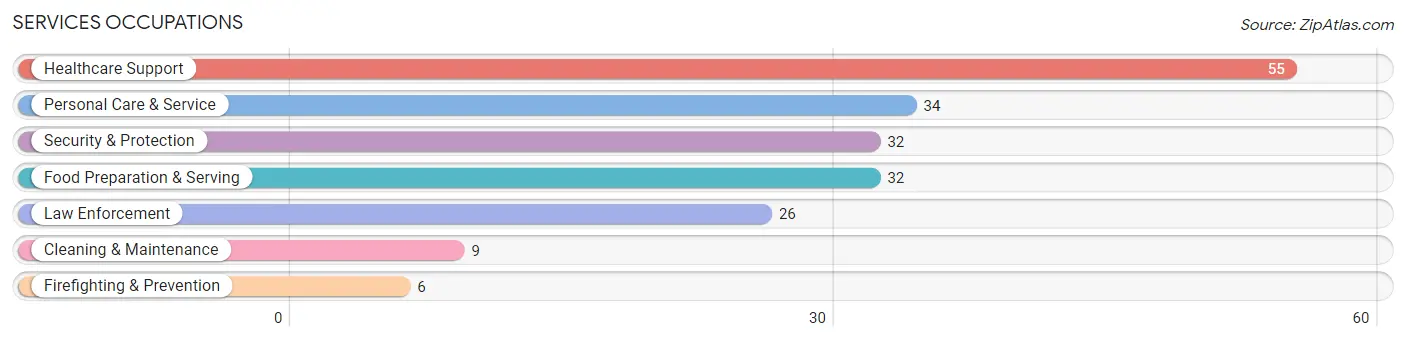
Services Occupations
The most common Services occupations in Hawley are Healthcare Support (55 | 5.4%), Personal Care & Service (34 | 3.4%), Security & Protection (32 | 3.2%), Food Preparation & Serving (32 | 3.2%), and Law Enforcement (26 | 2.6%).
Services Occupations by Sex
Within the Services occupations in Hawley, the most male-oriented occupations are Security & Protection (100.0%), Firefighting & Prevention (100.0%), and Law Enforcement (100.0%), while the most female-oriented occupations are Food Preparation & Serving (100.0%), Personal Care & Service (91.2%), and Healthcare Support (72.7%).
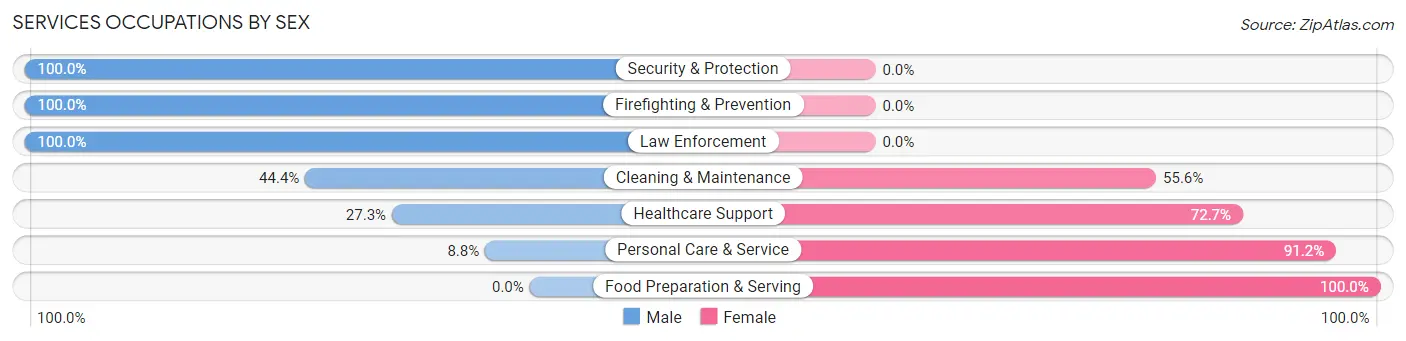
| Occupation | Male | Female |
| Healthcare Support | 15 (27.3%) | 40 (72.7%) |
| Security & Protection | 32 (100.0%) | 0 (0.0%) |
| Firefighting & Prevention | 6 (100.0%) | 0 (0.0%) |
| Law Enforcement | 26 (100.0%) | 0 (0.0%) |
| Food Preparation & Serving | 0 (0.0%) | 32 (100.0%) |
| Cleaning & Maintenance | 4 (44.4%) | 5 (55.6%) |
| Personal Care & Service | 3 (8.8%) | 31 (91.2%) |
| Total (Category) | 54 (33.3%) | 108 (66.7%) |
| Total (Overall) | 430 (42.5%) | 582 (57.5%) |
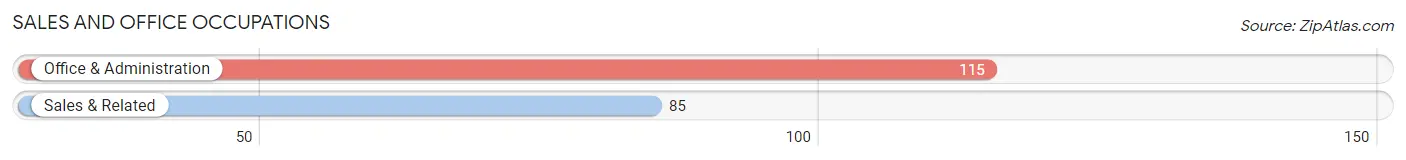
Sales and Office Occupations
The most common Sales and Office occupations in Hawley are Office & Administration (115 | 11.4%), and Sales & Related (85 | 8.4%).
Sales and Office Occupations by Sex
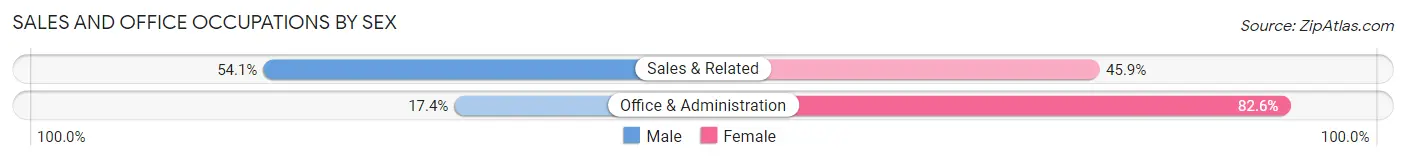
| Occupation | Male | Female |
| Sales & Related | 46 (54.1%) | 39 (45.9%) |
| Office & Administration | 20 (17.4%) | 95 (82.6%) |
| Total (Category) | 66 (33.0%) | 134 (67.0%) |
| Total (Overall) | 430 (42.5%) | 582 (57.5%) |
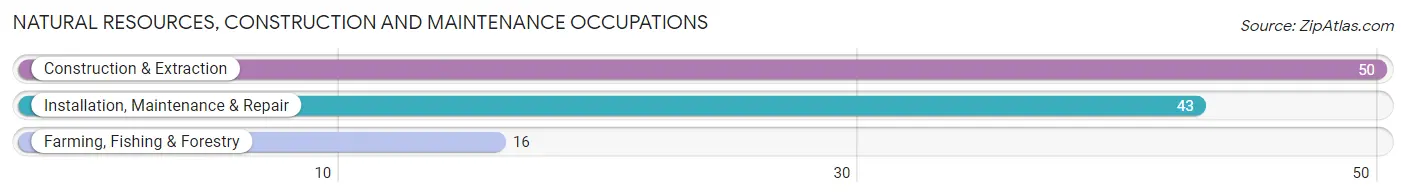
Natural Resources, Construction and Maintenance Occupations
The most common Natural Resources, Construction and Maintenance occupations in Hawley are Construction & Extraction (50 | 4.9%), Installation, Maintenance & Repair (43 | 4.3%), and Farming, Fishing & Forestry (16 | 1.6%).
Natural Resources, Construction and Maintenance Occupations by Sex
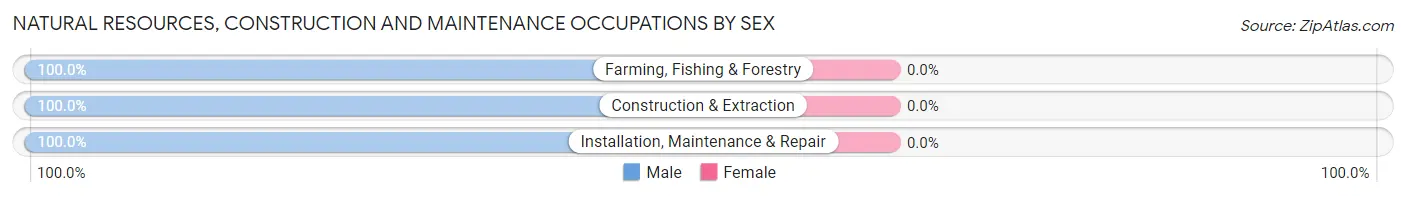
| Occupation | Male | Female |
| Farming, Fishing & Forestry | 16 (100.0%) | 0 (0.0%) |
| Construction & Extraction | 50 (100.0%) | 0 (0.0%) |
| Installation, Maintenance & Repair | 43 (100.0%) | 0 (0.0%) |
| Total (Category) | 109 (100.0%) | 0 (0.0%) |
| Total (Overall) | 430 (42.5%) | 582 (57.5%) |
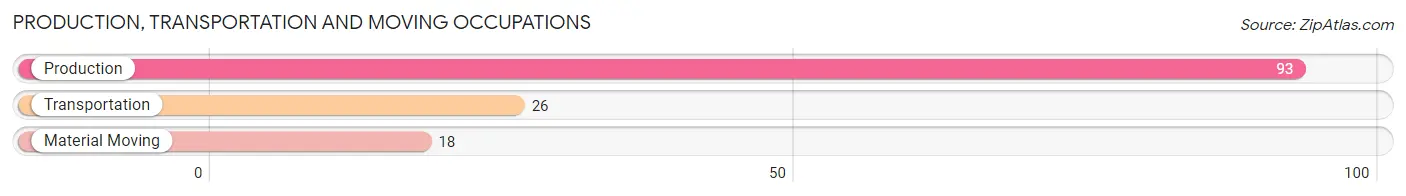
Production, Transportation and Moving Occupations
The most common Production, Transportation and Moving occupations in Hawley are Production (93 | 9.2%), Transportation (26 | 2.6%), and Material Moving (18 | 1.8%).
Production, Transportation and Moving Occupations by Sex
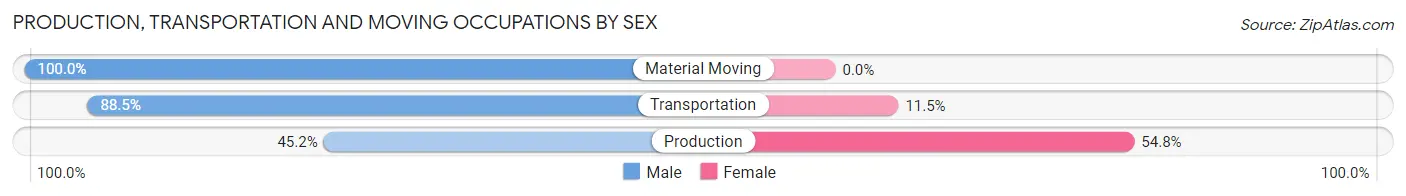
| Occupation | Male | Female |
| Production | 42 (45.2%) | 51 (54.8%) |
| Transportation | 23 (88.5%) | 3 (11.5%) |
| Material Moving | 18 (100.0%) | 0 (0.0%) |
| Total (Category) | 83 (60.6%) | 54 (39.4%) |
| Total (Overall) | 430 (42.5%) | 582 (57.5%) |
Employment Industries by Sex in Hawley
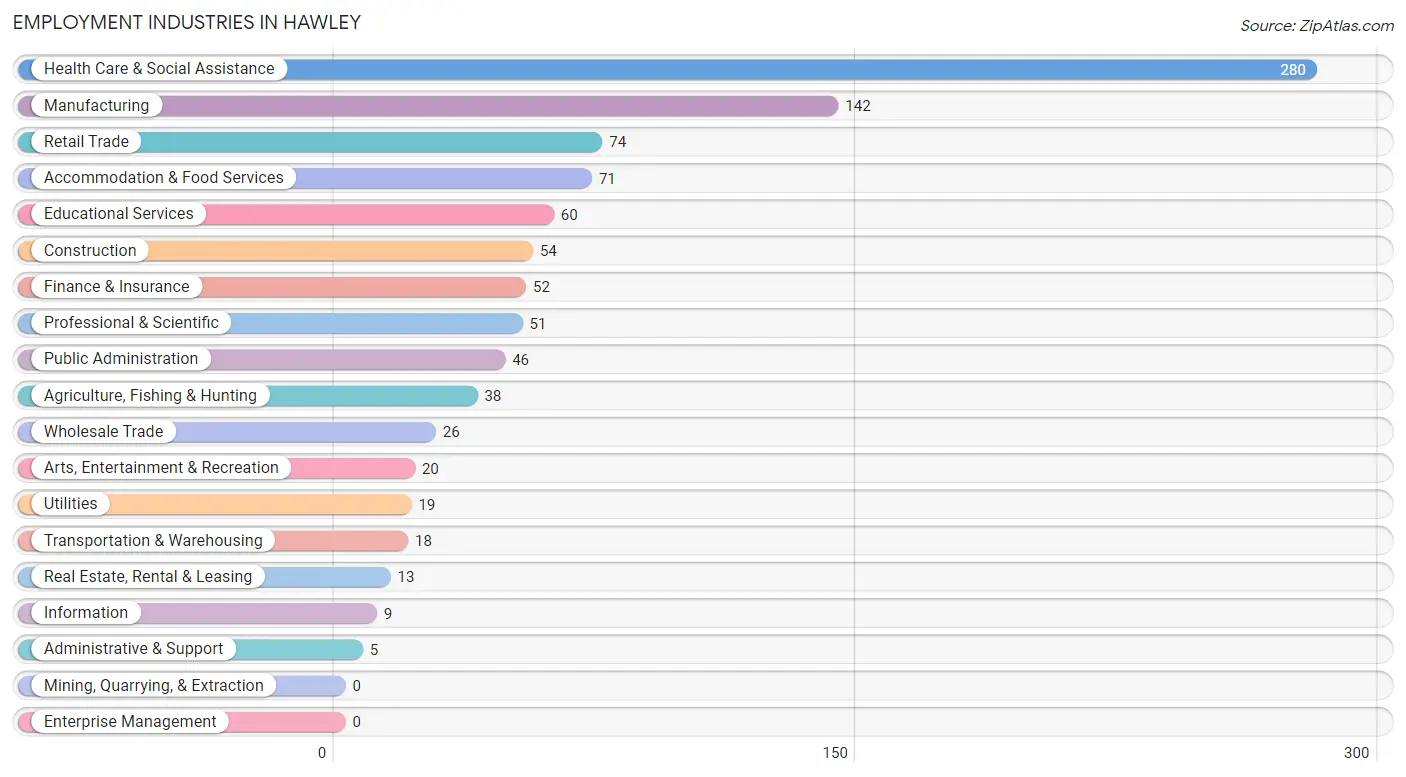
Employment Industries in Hawley
The major employment industries in Hawley include Health Care & Social Assistance (280 | 27.7%), Manufacturing (142 | 14.0%), Retail Trade (74 | 7.3%), Accommodation & Food Services (71 | 7.0%), and Educational Services (60 | 5.9%).
Employment Industries by Sex in Hawley
The Hawley industries that see more men than women are Agriculture, Fishing & Hunting (100.0%), Construction (100.0%), and Transportation & Warehousing (100.0%), whereas the industries that tend to have a higher number of women are Information (100.0%), Finance & Insurance (100.0%), and Administrative & Support (100.0%).
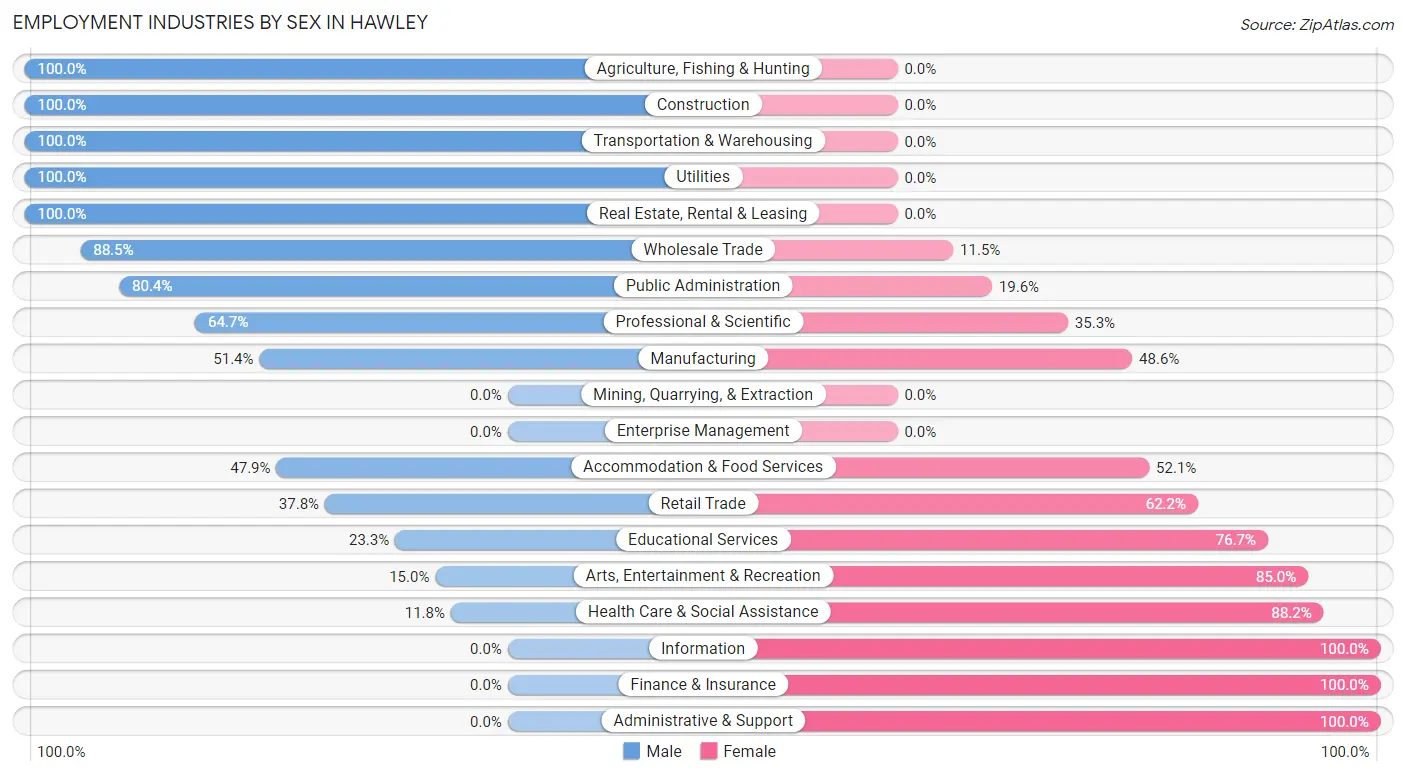
| Industry | Male | Female |
| Agriculture, Fishing & Hunting | 38 (100.0%) | 0 (0.0%) |
| Mining, Quarrying, & Extraction | 0 (0.0%) | 0 (0.0%) |
| Construction | 54 (100.0%) | 0 (0.0%) |
| Manufacturing | 73 (51.4%) | 69 (48.6%) |
| Wholesale Trade | 23 (88.5%) | 3 (11.5%) |
| Retail Trade | 28 (37.8%) | 46 (62.2%) |
| Transportation & Warehousing | 18 (100.0%) | 0 (0.0%) |
| Utilities | 19 (100.0%) | 0 (0.0%) |
| Information | 0 (0.0%) | 9 (100.0%) |
| Finance & Insurance | 0 (0.0%) | 52 (100.0%) |
| Real Estate, Rental & Leasing | 13 (100.0%) | 0 (0.0%) |
| Professional & Scientific | 33 (64.7%) | 18 (35.3%) |
| Enterprise Management | 0 (0.0%) | 0 (0.0%) |
| Administrative & Support | 0 (0.0%) | 5 (100.0%) |
| Educational Services | 14 (23.3%) | 46 (76.7%) |
| Health Care & Social Assistance | 33 (11.8%) | 247 (88.2%) |
| Arts, Entertainment & Recreation | 3 (15.0%) | 17 (85.0%) |
| Accommodation & Food Services | 34 (47.9%) | 37 (52.1%) |
| Public Administration | 37 (80.4%) | 9 (19.6%) |
| Total | 430 (42.5%) | 582 (57.5%) |
Education in Hawley
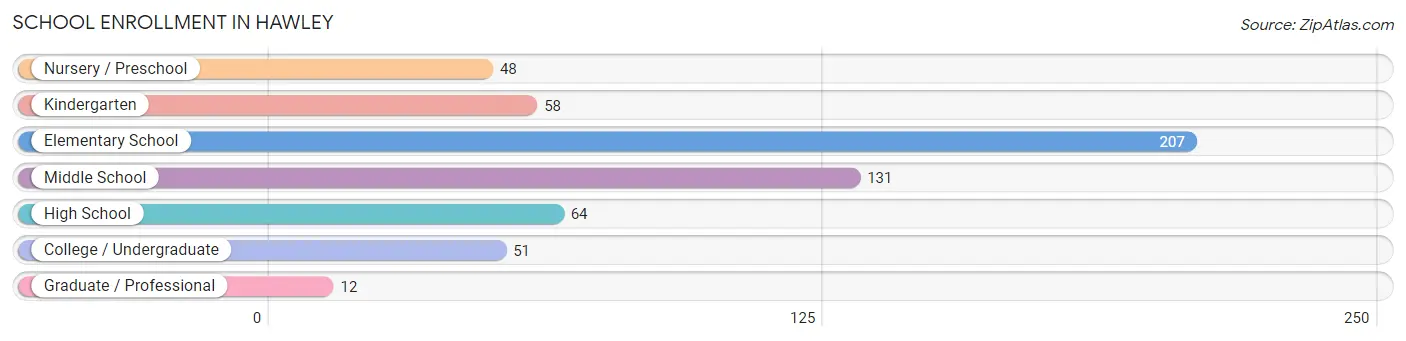
School Enrollment in Hawley
The most common levels of schooling among the 571 students in Hawley are elementary school (207 | 36.2%), middle school (131 | 22.9%), and high school (64 | 11.2%).
| School Level | # Students | % Students |
| Nursery / Preschool | 48 | 8.4% |
| Kindergarten | 58 | 10.2% |
| Elementary School | 207 | 36.2% |
| Middle School | 131 | 22.9% |
| High School | 64 | 11.2% |
| College / Undergraduate | 51 | 8.9% |
| Graduate / Professional | 12 | 2.1% |
| Total | 571 | 100.0% |
School Enrollment by Age by Funding Source in Hawley
Out of a total of 571 students who are enrolled in schools in Hawley, 75 (13.1%) attend a private institution, while the remaining 496 (86.9%) are enrolled in public schools. The age group of 35 years and over has the highest likelihood of being enrolled in private schools, with 7 (53.8% in the age bracket) enrolled. Conversely, the age group of 15 to 17 year olds has the lowest likelihood of being enrolled in a private school, with 57 (100.0% in the age bracket) attending a public institution.
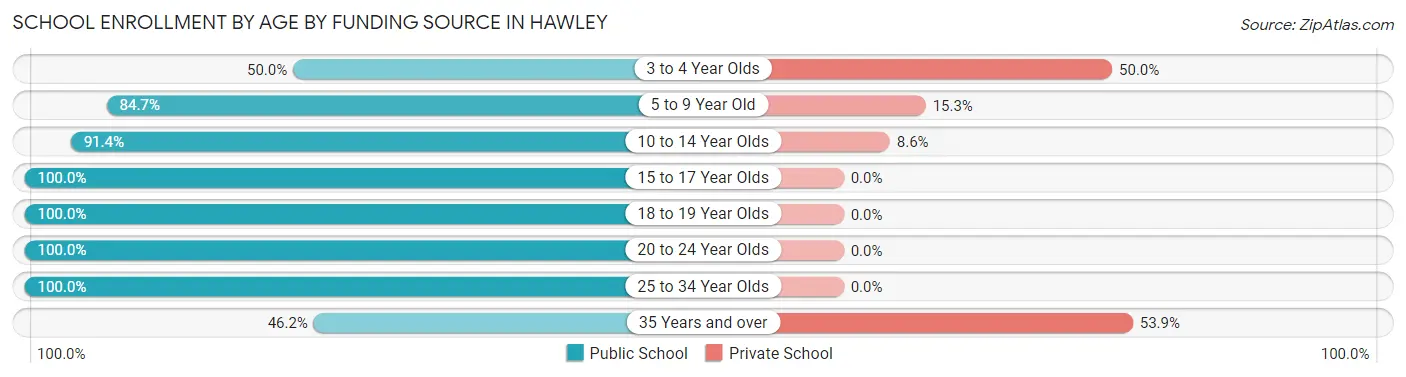
| Age Bracket | Public School | Private School |
| 3 to 4 Year Olds | 17 (50.0%) | 17 (50.0%) |
| 5 to 9 Year Old | 194 (84.7%) | 35 (15.3%) |
| 10 to 14 Year Olds | 170 (91.4%) | 16 (8.6%) |
| 15 to 17 Year Olds | 57 (100.0%) | 0 (0.0%) |
| 18 to 19 Year Olds | 7 (100.0%) | 0 (0.0%) |
| 20 to 24 Year Olds | 10 (100.0%) | 0 (0.0%) |
| 25 to 34 Year Olds | 35 (100.0%) | 0 (0.0%) |
| 35 Years and over | 6 (46.2%) | 7 (53.8%) |
| Total | 496 (86.9%) | 75 (13.1%) |
Educational Attainment by Field of Study in Hawley
Business (73 | 17.5%), arts & humanities (71 | 17.0%), bio, nature & agricultural (48 | 11.5%), education (43 | 10.3%), and science & technology (40 | 9.6%) are the most common fields of study among 418 individuals in Hawley who have obtained a bachelor's degree or higher.
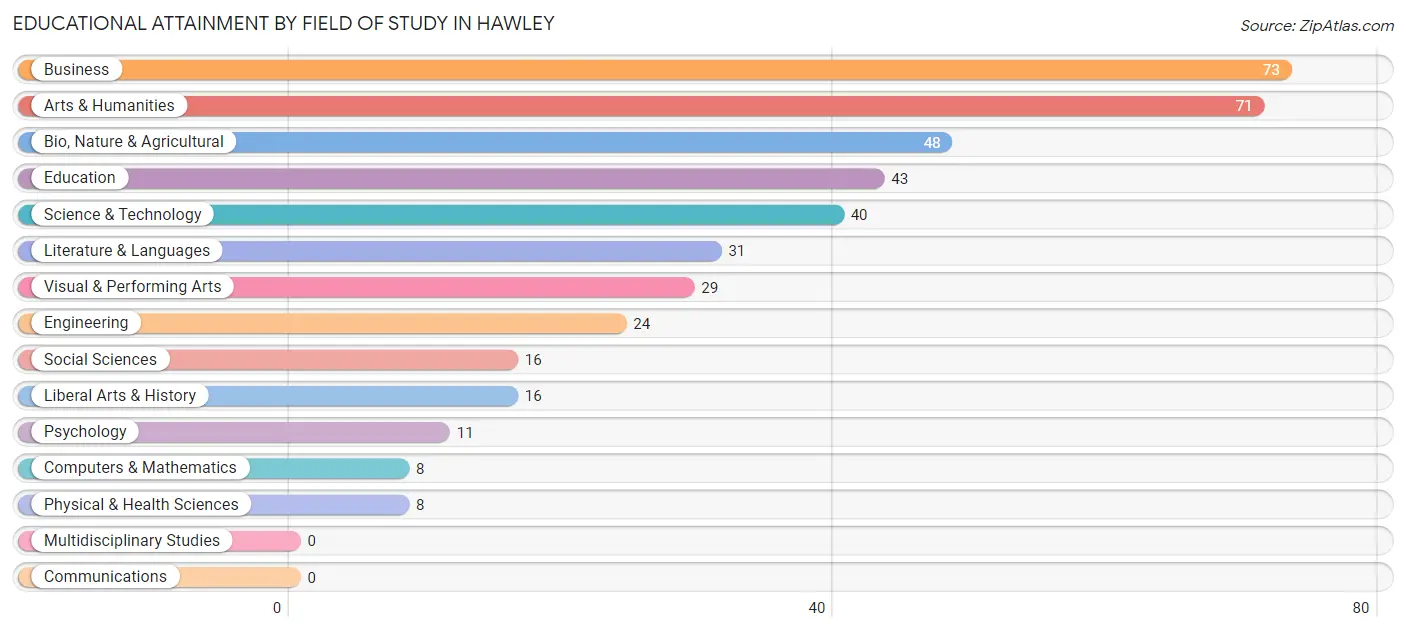
| Field of Study | # Graduates | % Graduates |
| Computers & Mathematics | 8 | 1.9% |
| Bio, Nature & Agricultural | 48 | 11.5% |
| Physical & Health Sciences | 8 | 1.9% |
| Psychology | 11 | 2.6% |
| Social Sciences | 16 | 3.8% |
| Engineering | 24 | 5.7% |
| Multidisciplinary Studies | 0 | 0.0% |
| Science & Technology | 40 | 9.6% |
| Business | 73 | 17.5% |
| Education | 43 | 10.3% |
| Literature & Languages | 31 | 7.4% |
| Liberal Arts & History | 16 | 3.8% |
| Visual & Performing Arts | 29 | 6.9% |
| Communications | 0 | 0.0% |
| Arts & Humanities | 71 | 17.0% |
| Total | 418 | 100.0% |
Transportation & Commute in Hawley
Vehicle Availability by Sex in Hawley
The most prevalent vehicle ownership categories in Hawley are males with 2 vehicles (221, accounting for 54.6%) and females with 2 vehicles (218, making up 38.2%).
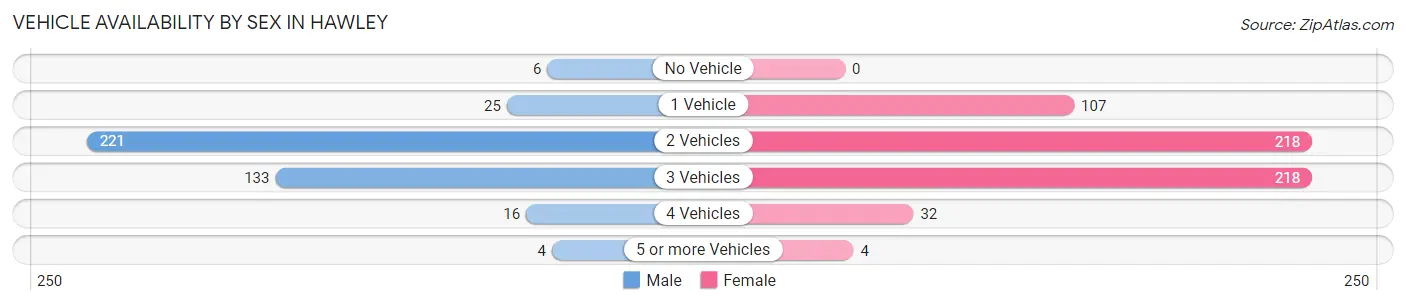
| Vehicles Available | Male | Female |
| No Vehicle | 6 (1.5%) | 0 (0.0%) |
| 1 Vehicle | 25 (6.2%) | 107 (18.5%) |
| 2 Vehicles | 221 (54.6%) | 218 (37.7%) |
| 3 Vehicles | 133 (32.8%) | 218 (37.7%) |
| 4 Vehicles | 16 (4.0%) | 32 (5.5%) |
| 5 or more Vehicles | 4 (1.0%) | 4 (0.7%) |
| Total | 405 (100.0%) | 579 (100.0%) |
Commute Time in Hawley
The most frequently occuring commute durations in Hawley are 30 to 34 minutes (203 commuters, 22.5%), 5 to 9 minutes (139 commuters, 15.4%), and 35 to 39 minutes (104 commuters, 11.5%).
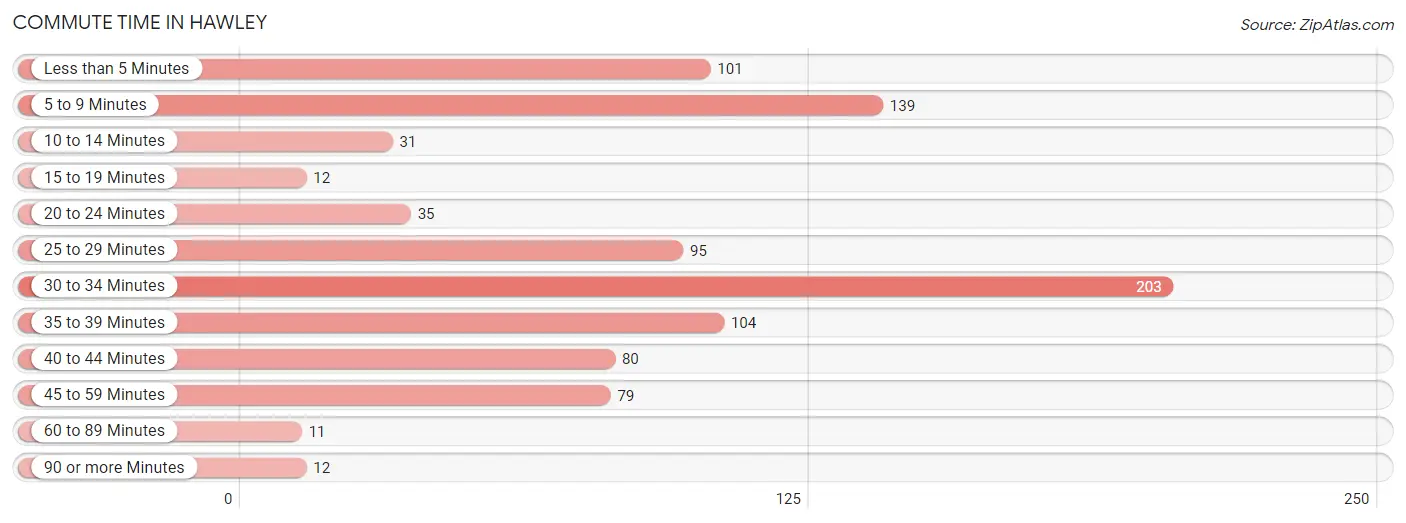
| Commute Time | # Commuters | % Commuters |
| Less than 5 Minutes | 101 | 11.2% |
| 5 to 9 Minutes | 139 | 15.4% |
| 10 to 14 Minutes | 31 | 3.4% |
| 15 to 19 Minutes | 12 | 1.3% |
| 20 to 24 Minutes | 35 | 3.9% |
| 25 to 29 Minutes | 95 | 10.5% |
| 30 to 34 Minutes | 203 | 22.5% |
| 35 to 39 Minutes | 104 | 11.5% |
| 40 to 44 Minutes | 80 | 8.9% |
| 45 to 59 Minutes | 79 | 8.8% |
| 60 to 89 Minutes | 11 | 1.2% |
| 90 or more Minutes | 12 | 1.3% |
Commute Time by Sex in Hawley
The most common commute times in Hawley are 30 to 34 minutes (107 commuters, 28.8%) for males and 30 to 34 minutes (96 commuters, 18.1%) for females.
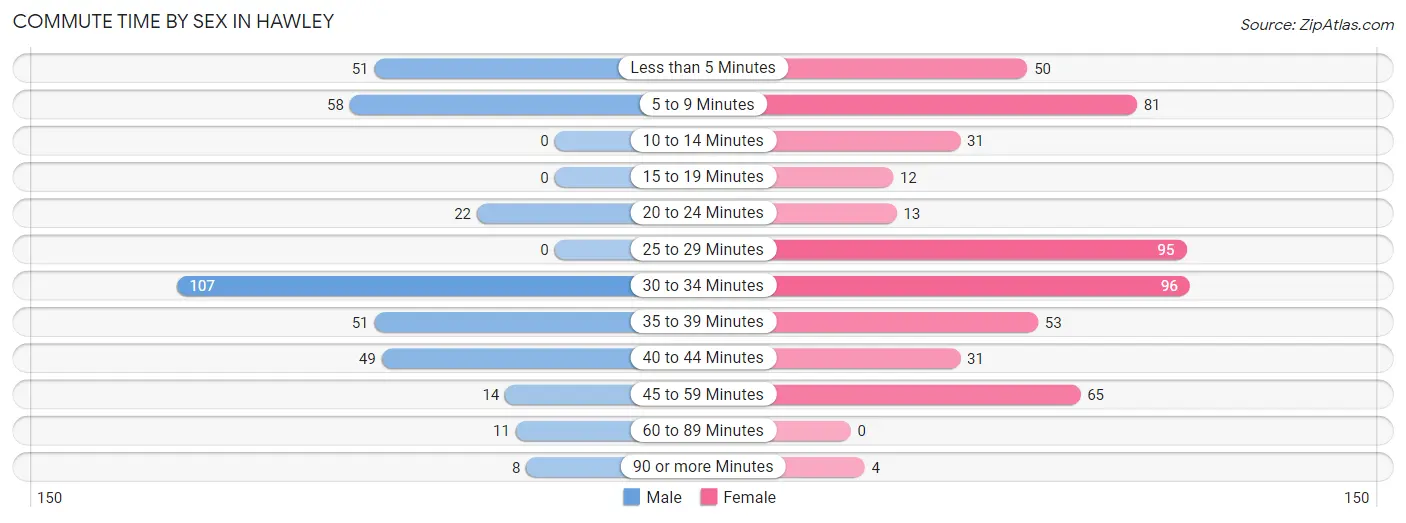
| Commute Time | Male | Female |
| Less than 5 Minutes | 51 (13.8%) | 50 (9.4%) |
| 5 to 9 Minutes | 58 (15.6%) | 81 (15.2%) |
| 10 to 14 Minutes | 0 (0.0%) | 31 (5.8%) |
| 15 to 19 Minutes | 0 (0.0%) | 12 (2.3%) |
| 20 to 24 Minutes | 22 (5.9%) | 13 (2.5%) |
| 25 to 29 Minutes | 0 (0.0%) | 95 (17.9%) |
| 30 to 34 Minutes | 107 (28.8%) | 96 (18.1%) |
| 35 to 39 Minutes | 51 (13.8%) | 53 (10.0%) |
| 40 to 44 Minutes | 49 (13.2%) | 31 (5.8%) |
| 45 to 59 Minutes | 14 (3.8%) | 65 (12.2%) |
| 60 to 89 Minutes | 11 (3.0%) | 0 (0.0%) |
| 90 or more Minutes | 8 (2.2%) | 4 (0.7%) |
Time of Departure to Work by Sex in Hawley
The most frequent times of departure to work in Hawley are 7:00 AM to 7:29 AM (92, 24.8%) for males and 7:30 AM to 7:59 AM (149, 28.1%) for females.
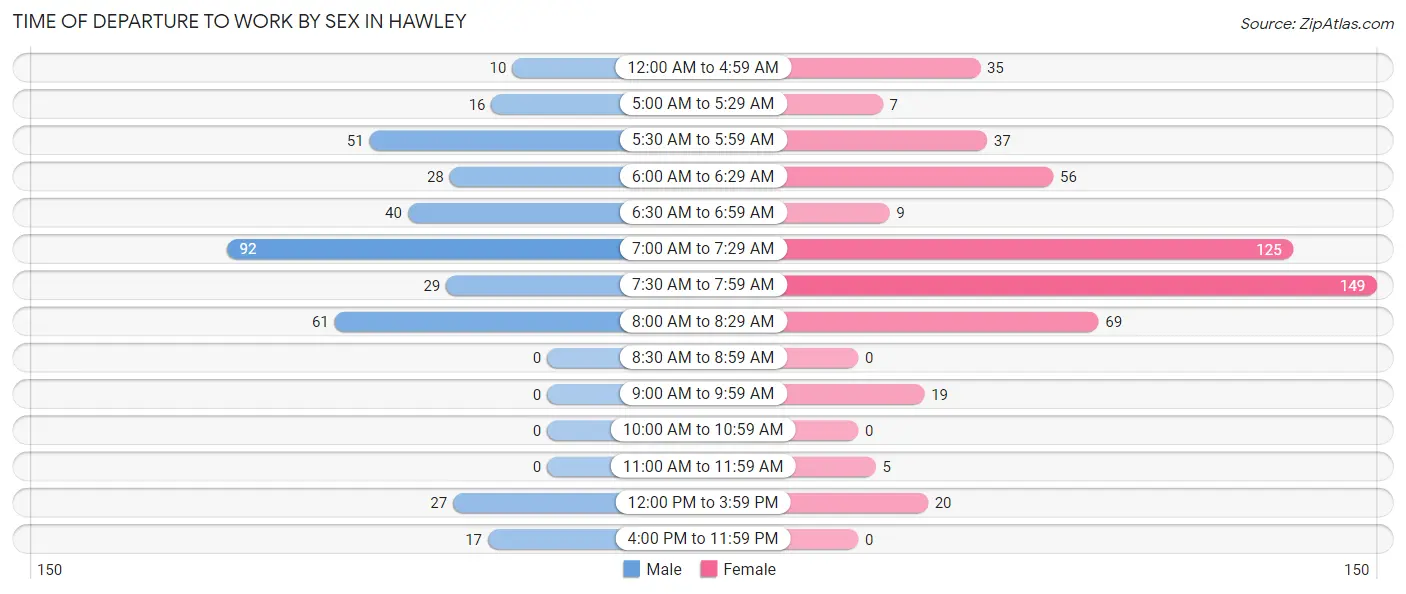
| Time of Departure | Male | Female |
| 12:00 AM to 4:59 AM | 10 (2.7%) | 35 (6.6%) |
| 5:00 AM to 5:29 AM | 16 (4.3%) | 7 (1.3%) |
| 5:30 AM to 5:59 AM | 51 (13.8%) | 37 (7.0%) |
| 6:00 AM to 6:29 AM | 28 (7.5%) | 56 (10.5%) |
| 6:30 AM to 6:59 AM | 40 (10.8%) | 9 (1.7%) |
| 7:00 AM to 7:29 AM | 92 (24.8%) | 125 (23.5%) |
| 7:30 AM to 7:59 AM | 29 (7.8%) | 149 (28.1%) |
| 8:00 AM to 8:29 AM | 61 (16.4%) | 69 (13.0%) |
| 8:30 AM to 8:59 AM | 0 (0.0%) | 0 (0.0%) |
| 9:00 AM to 9:59 AM | 0 (0.0%) | 19 (3.6%) |
| 10:00 AM to 10:59 AM | 0 (0.0%) | 0 (0.0%) |
| 11:00 AM to 11:59 AM | 0 (0.0%) | 5 (0.9%) |
| 12:00 PM to 3:59 PM | 27 (7.3%) | 20 (3.8%) |
| 4:00 PM to 11:59 PM | 17 (4.6%) | 0 (0.0%) |
| Total | 371 (100.0%) | 531 (100.0%) |
Housing Occupancy in Hawley
Occupancy by Ownership in Hawley
Of the total 792 dwellings in Hawley, owner-occupied units account for 545 (68.8%), while renter-occupied units make up 247 (31.2%).
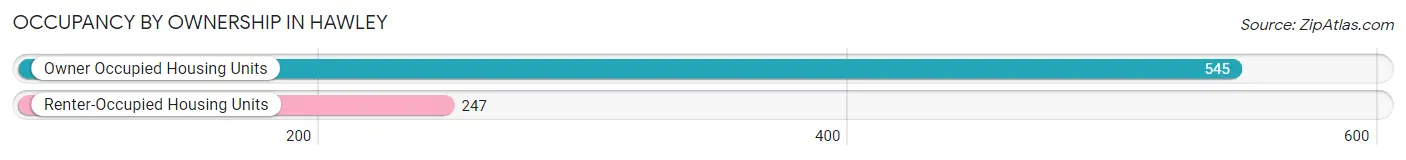
| Occupancy | # Housing Units | % Housing Units |
| Owner Occupied Housing Units | 545 | 68.8% |
| Renter-Occupied Housing Units | 247 | 31.2% |
| Total Occupied Housing Units | 792 | 100.0% |
Occupancy by Household Size in Hawley
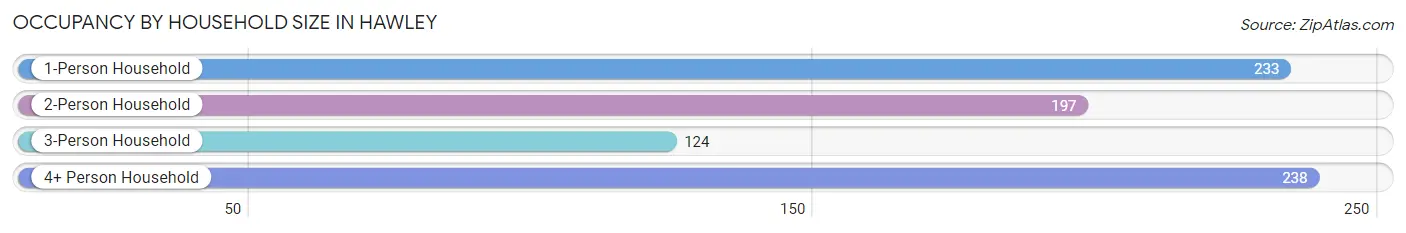
| Household Size | # Housing Units | % Housing Units |
| 1-Person Household | 233 | 29.4% |
| 2-Person Household | 197 | 24.9% |
| 3-Person Household | 124 | 15.7% |
| 4+ Person Household | 238 | 30.0% |
| Total Housing Units | 792 | 100.0% |
Occupancy by Ownership by Household Size in Hawley
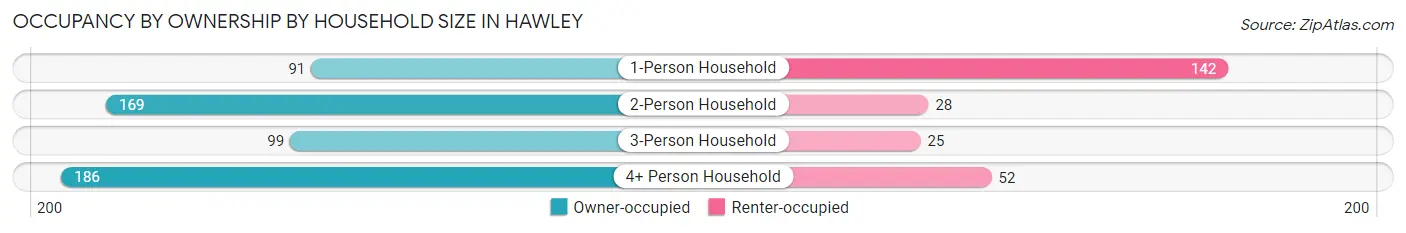
| Household Size | Owner-occupied | Renter-occupied |
| 1-Person Household | 91 (39.1%) | 142 (60.9%) |
| 2-Person Household | 169 (85.8%) | 28 (14.2%) |
| 3-Person Household | 99 (79.8%) | 25 (20.2%) |
| 4+ Person Household | 186 (78.1%) | 52 (21.8%) |
| Total Housing Units | 545 (68.8%) | 247 (31.2%) |
Occupancy by Educational Attainment in Hawley
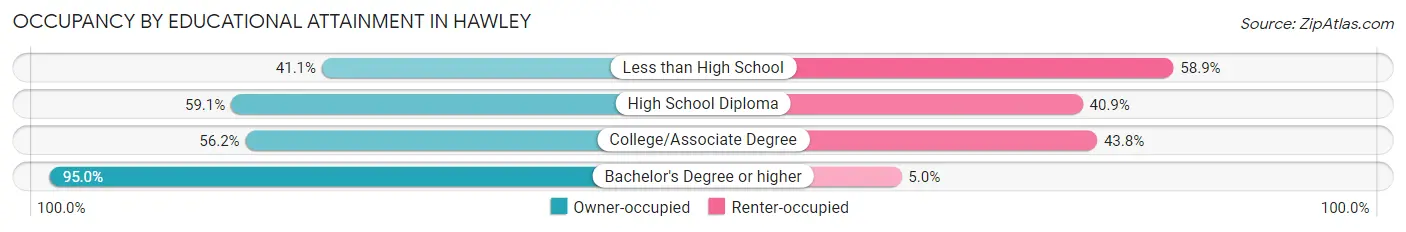
| Household Size | Owner-occupied | Renter-occupied |
| Less than High School | 23 (41.1%) | 33 (58.9%) |
| High School Diploma | 153 (59.1%) | 106 (40.9%) |
| College/Associate Degree | 122 (56.2%) | 95 (43.8%) |
| Bachelor's Degree or higher | 247 (95.0%) | 13 (5.0%) |
Occupancy by Age of Householder in Hawley
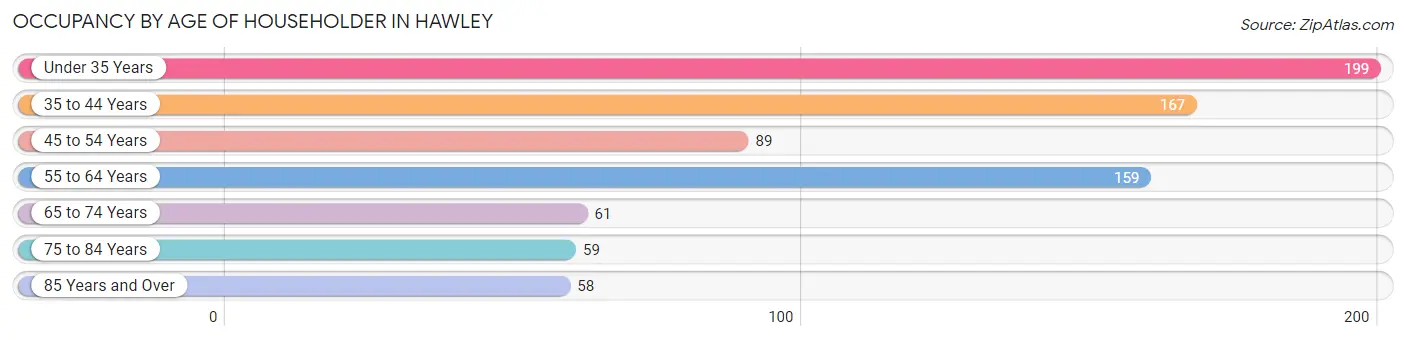
| Age Bracket | # Households | % Households |
| Under 35 Years | 199 | 25.1% |
| 35 to 44 Years | 167 | 21.1% |
| 45 to 54 Years | 89 | 11.2% |
| 55 to 64 Years | 159 | 20.1% |
| 65 to 74 Years | 61 | 7.7% |
| 75 to 84 Years | 59 | 7.4% |
| 85 Years and Over | 58 | 7.3% |
| Total | 792 | 100.0% |
Housing Finances in Hawley
Median Income by Occupancy in Hawley
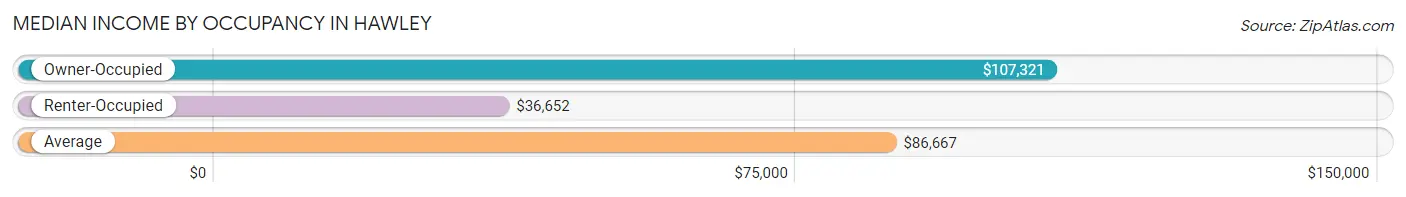
| Occupancy Type | # Households | Median Income |
| Owner-Occupied | 545 (68.8%) | $107,321 |
| Renter-Occupied | 247 (31.2%) | $36,652 |
| Average | 792 (100.0%) | $86,667 |
Occupancy by Householder Income Bracket in Hawley
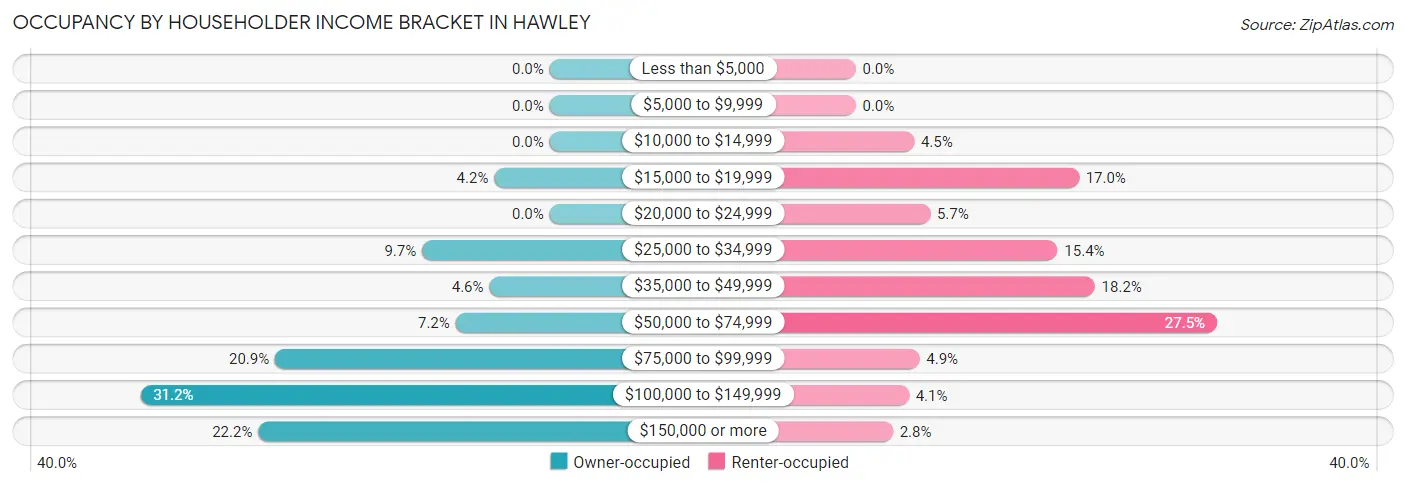
| Income Bracket | Owner-occupied | Renter-occupied |
| Less than $5,000 | 0 (0.0%) | 0 (0.0%) |
| $5,000 to $9,999 | 0 (0.0%) | 0 (0.0%) |
| $10,000 to $14,999 | 0 (0.0%) | 11 (4.4%) |
| $15,000 to $19,999 | 23 (4.2%) | 42 (17.0%) |
| $20,000 to $24,999 | 0 (0.0%) | 14 (5.7%) |
| $25,000 to $34,999 | 53 (9.7%) | 38 (15.4%) |
| $35,000 to $49,999 | 25 (4.6%) | 45 (18.2%) |
| $50,000 to $74,999 | 39 (7.2%) | 68 (27.5%) |
| $75,000 to $99,999 | 114 (20.9%) | 12 (4.9%) |
| $100,000 to $149,999 | 170 (31.2%) | 10 (4.1%) |
| $150,000 or more | 121 (22.2%) | 7 (2.8%) |
| Total | 545 (100.0%) | 247 (100.0%) |
Monthly Housing Cost Tiers in Hawley
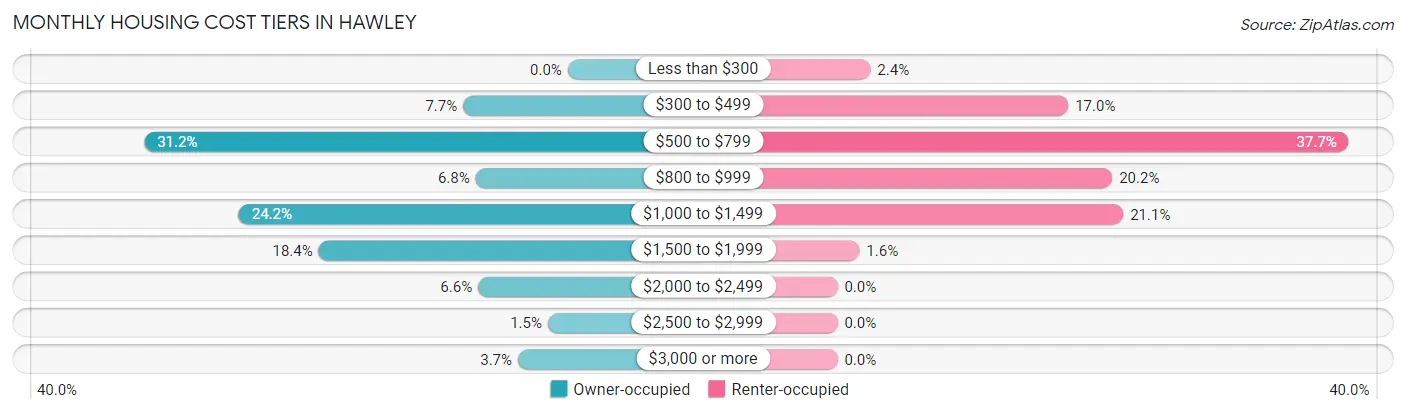
| Monthly Cost | Owner-occupied | Renter-occupied |
| Less than $300 | 0 (0.0%) | 6 (2.4%) |
| $300 to $499 | 42 (7.7%) | 42 (17.0%) |
| $500 to $799 | 170 (31.2%) | 93 (37.7%) |
| $800 to $999 | 37 (6.8%) | 50 (20.2%) |
| $1,000 to $1,499 | 132 (24.2%) | 52 (21.0%) |
| $1,500 to $1,999 | 100 (18.3%) | 4 (1.6%) |
| $2,000 to $2,499 | 36 (6.6%) | 0 (0.0%) |
| $2,500 to $2,999 | 8 (1.5%) | 0 (0.0%) |
| $3,000 or more | 20 (3.7%) | 0 (0.0%) |
| Total | 545 (100.0%) | 247 (100.0%) |
Physical Housing Characteristics in Hawley
Housing Structures in Hawley
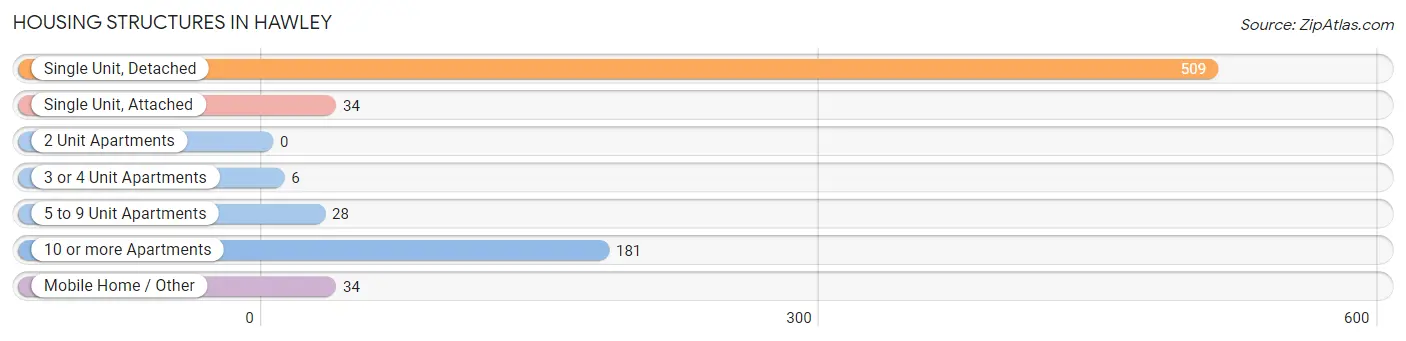
| Structure Type | # Housing Units | % Housing Units |
| Single Unit, Detached | 509 | 64.3% |
| Single Unit, Attached | 34 | 4.3% |
| 2 Unit Apartments | 0 | 0.0% |
| 3 or 4 Unit Apartments | 6 | 0.8% |
| 5 to 9 Unit Apartments | 28 | 3.5% |
| 10 or more Apartments | 181 | 22.9% |
| Mobile Home / Other | 34 | 4.3% |
| Total | 792 | 100.0% |
Housing Structures by Occupancy in Hawley
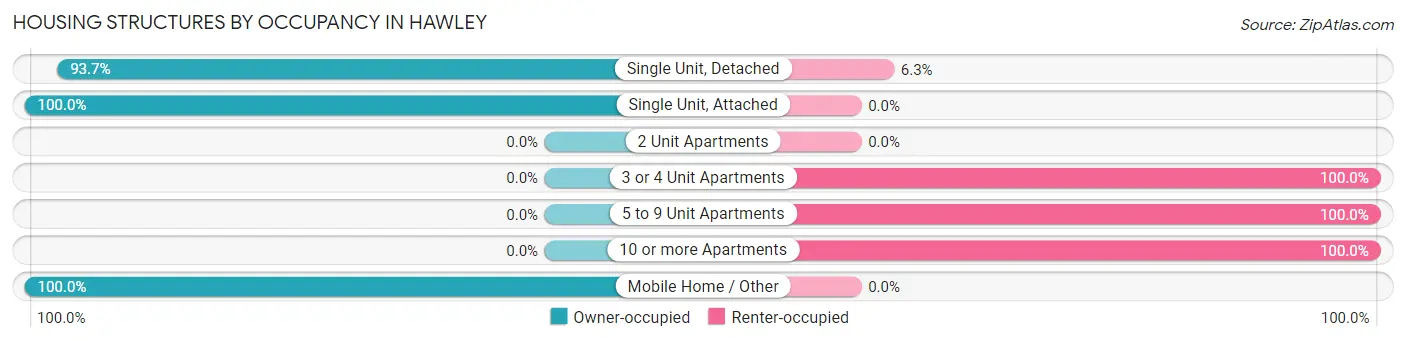
| Structure Type | Owner-occupied | Renter-occupied |
| Single Unit, Detached | 477 (93.7%) | 32 (6.3%) |
| Single Unit, Attached | 34 (100.0%) | 0 (0.0%) |
| 2 Unit Apartments | 0 (0.0%) | 0 (0.0%) |
| 3 or 4 Unit Apartments | 0 (0.0%) | 6 (100.0%) |
| 5 to 9 Unit Apartments | 0 (0.0%) | 28 (100.0%) |
| 10 or more Apartments | 0 (0.0%) | 181 (100.0%) |
| Mobile Home / Other | 34 (100.0%) | 0 (0.0%) |
| Total | 545 (68.8%) | 247 (31.2%) |
Housing Structures by Number of Rooms in Hawley
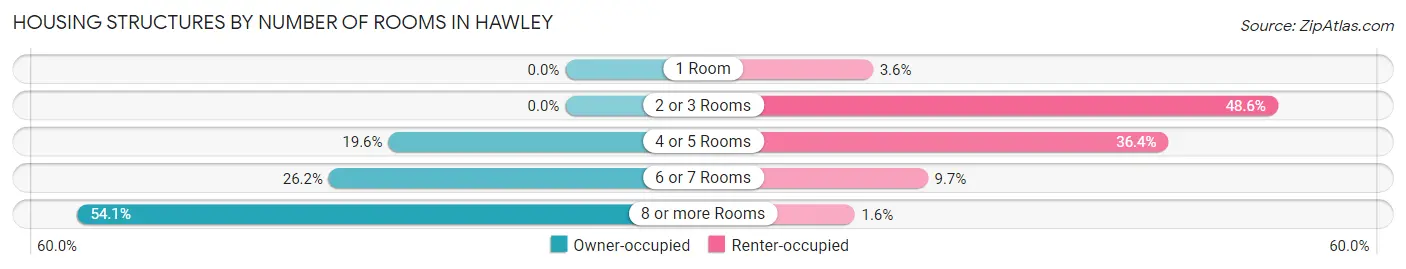
| Number of Rooms | Owner-occupied | Renter-occupied |
| 1 Room | 0 (0.0%) | 9 (3.6%) |
| 2 or 3 Rooms | 0 (0.0%) | 120 (48.6%) |
| 4 or 5 Rooms | 107 (19.6%) | 90 (36.4%) |
| 6 or 7 Rooms | 143 (26.2%) | 24 (9.7%) |
| 8 or more Rooms | 295 (54.1%) | 4 (1.6%) |
| Total | 545 (100.0%) | 247 (100.0%) |
Housing Structure by Heating Type in Hawley
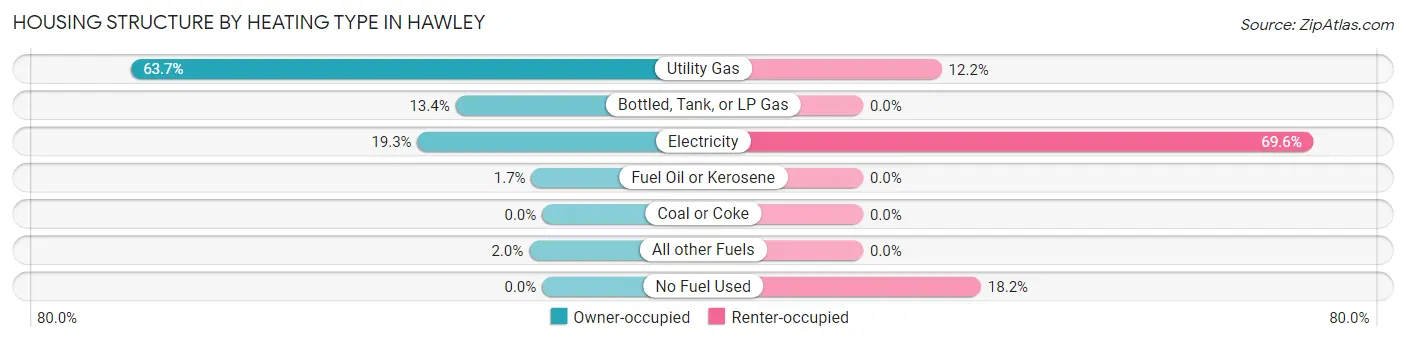
| Heating Type | Owner-occupied | Renter-occupied |
| Utility Gas | 347 (63.7%) | 30 (12.1%) |
| Bottled, Tank, or LP Gas | 73 (13.4%) | 0 (0.0%) |
| Electricity | 105 (19.3%) | 172 (69.6%) |
| Fuel Oil or Kerosene | 9 (1.7%) | 0 (0.0%) |
| Coal or Coke | 0 (0.0%) | 0 (0.0%) |
| All other Fuels | 11 (2.0%) | 0 (0.0%) |
| No Fuel Used | 0 (0.0%) | 45 (18.2%) |
| Total | 545 (100.0%) | 247 (100.0%) |
Household Vehicle Usage in Hawley
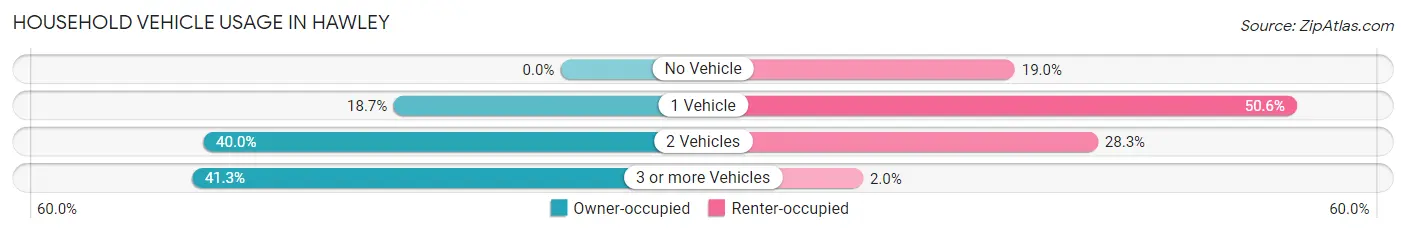
| Vehicles per Household | Owner-occupied | Renter-occupied |
| No Vehicle | 0 (0.0%) | 47 (19.0%) |
| 1 Vehicle | 102 (18.7%) | 125 (50.6%) |
| 2 Vehicles | 218 (40.0%) | 70 (28.3%) |
| 3 or more Vehicles | 225 (41.3%) | 5 (2.0%) |
| Total | 545 (100.0%) | 247 (100.0%) |
Real Estate & Mortgages in Hawley
Real Estate and Mortgage Overview in Hawley
| Characteristic | Without Mortgage | With Mortgage |
| Housing Units | 237 | 308 |
| Median Property Value | $245,700 | $228,500 |
| Median Household Income | $82,250 | $93 |
| Monthly Housing Costs | $632 | $20 |
| Real Estate Taxes | $3,086 | $15 |
Property Value by Mortgage Status in Hawley
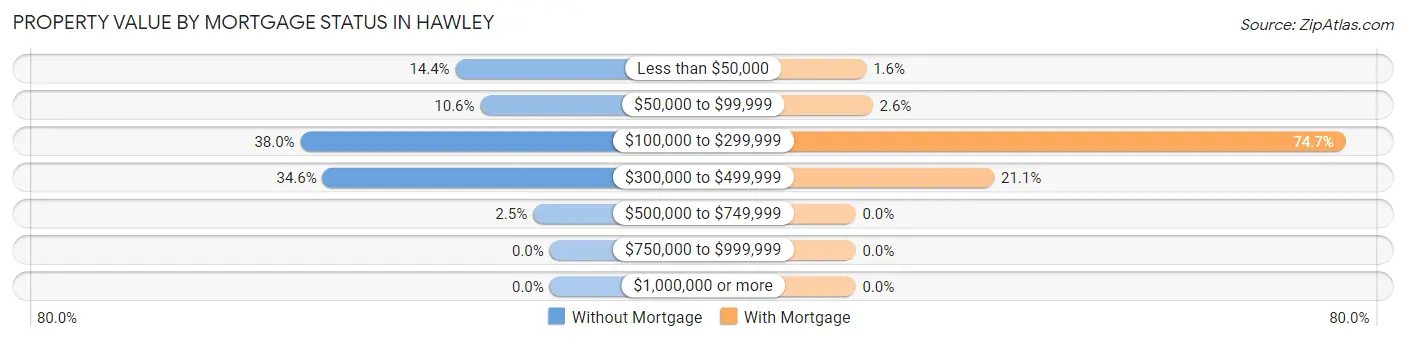
| Property Value | Without Mortgage | With Mortgage |
| Less than $50,000 | 34 (14.3%) | 5 (1.6%) |
| $50,000 to $99,999 | 25 (10.5%) | 8 (2.6%) |
| $100,000 to $299,999 | 90 (38.0%) | 230 (74.7%) |
| $300,000 to $499,999 | 82 (34.6%) | 65 (21.1%) |
| $500,000 to $749,999 | 6 (2.5%) | 0 (0.0%) |
| $750,000 to $999,999 | 0 (0.0%) | 0 (0.0%) |
| $1,000,000 or more | 0 (0.0%) | 0 (0.0%) |
| Total | 237 (100.0%) | 308 (100.0%) |
Household Income by Mortgage Status in Hawley
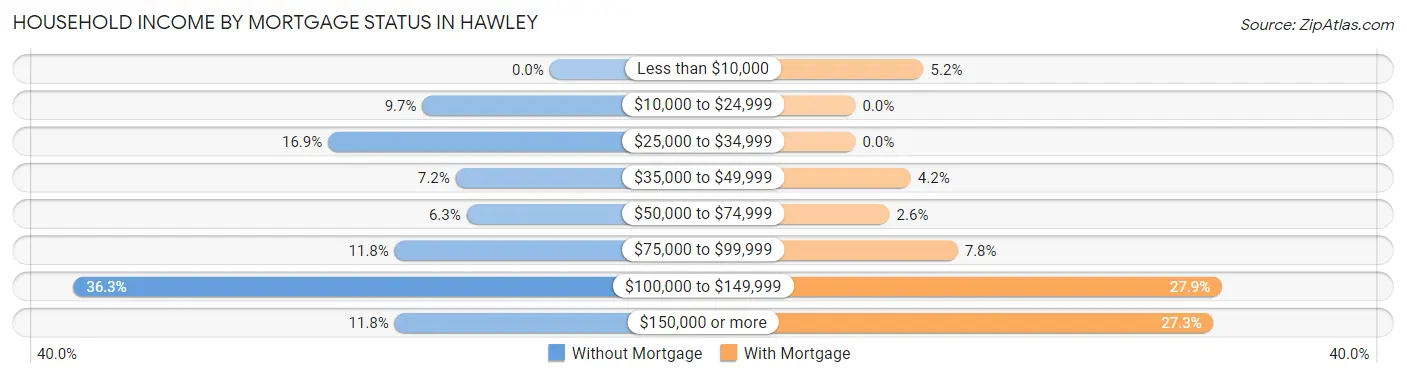
| Household Income | Without Mortgage | With Mortgage |
| Less than $10,000 | 0 (0.0%) | 16 (5.2%) |
| $10,000 to $24,999 | 23 (9.7%) | 0 (0.0%) |
| $25,000 to $34,999 | 40 (16.9%) | 0 (0.0%) |
| $35,000 to $49,999 | 17 (7.2%) | 13 (4.2%) |
| $50,000 to $74,999 | 15 (6.3%) | 8 (2.6%) |
| $75,000 to $99,999 | 28 (11.8%) | 24 (7.8%) |
| $100,000 to $149,999 | 86 (36.3%) | 86 (27.9%) |
| $150,000 or more | 28 (11.8%) | 84 (27.3%) |
| Total | 237 (100.0%) | 308 (100.0%) |
Property Value to Household Income Ratio in Hawley
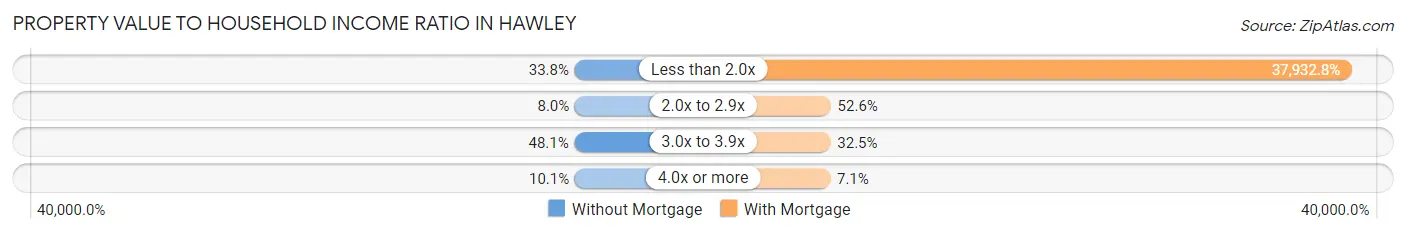
| Value-to-Income Ratio | Without Mortgage | With Mortgage |
| Less than 2.0x | 80 (33.8%) | 116,833 (37,932.8%) |
| 2.0x to 2.9x | 19 (8.0%) | 162 (52.6%) |
| 3.0x to 3.9x | 114 (48.1%) | 100 (32.5%) |
| 4.0x or more | 24 (10.1%) | 22 (7.1%) |
| Total | 237 (100.0%) | 308 (100.0%) |
Real Estate Taxes by Mortgage Status in Hawley
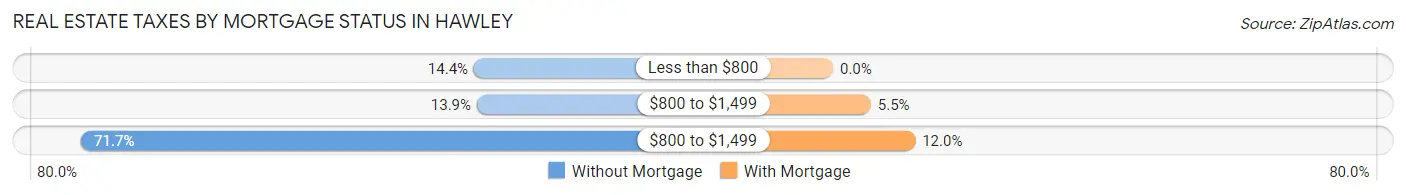
| Property Taxes | Without Mortgage | With Mortgage |
| Less than $800 | 34 (14.3%) | 0 (0.0%) |
| $800 to $1,499 | 33 (13.9%) | 17 (5.5%) |
| $800 to $1,499 | 170 (71.7%) | 37 (12.0%) |
| Total | 237 (100.0%) | 308 (100.0%) |
Health & Disability in Hawley
Health Insurance Coverage by Age in Hawley
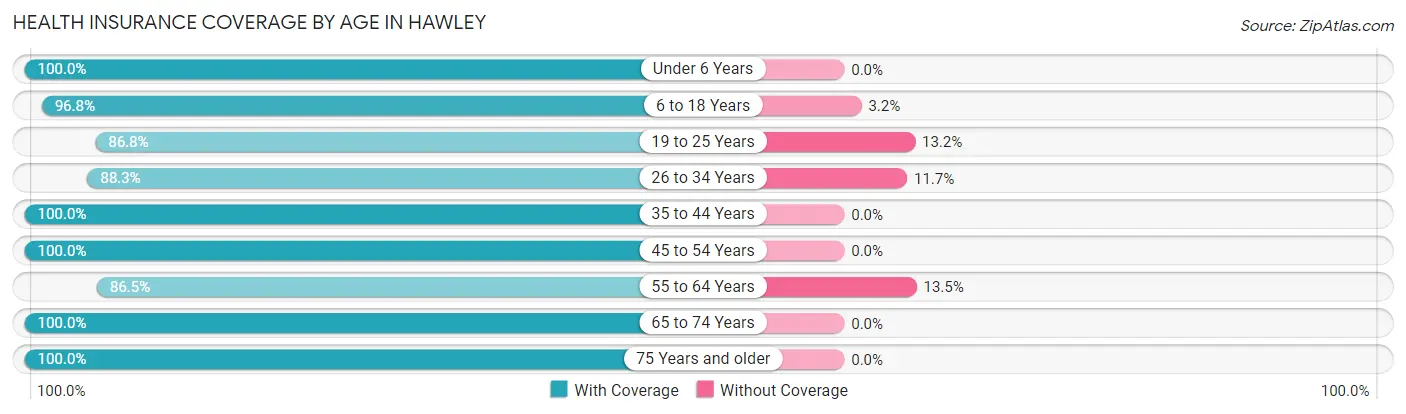
| Age Bracket | With Coverage | Without Coverage |
| Under 6 Years | 228 (100.0%) | 0 (0.0%) |
| 6 to 18 Years | 423 (96.8%) | 14 (3.2%) |
| 19 to 25 Years | 79 (86.8%) | 12 (13.2%) |
| 26 to 34 Years | 234 (88.3%) | 31 (11.7%) |
| 35 to 44 Years | 330 (100.0%) | 0 (0.0%) |
| 45 to 54 Years | 155 (100.0%) | 0 (0.0%) |
| 55 to 64 Years | 257 (86.5%) | 40 (13.5%) |
| 65 to 74 Years | 100 (100.0%) | 0 (0.0%) |
| 75 Years and older | 162 (100.0%) | 0 (0.0%) |
| Total | 1,968 (95.3%) | 97 (4.7%) |
Health Insurance Coverage by Citizenship Status in Hawley
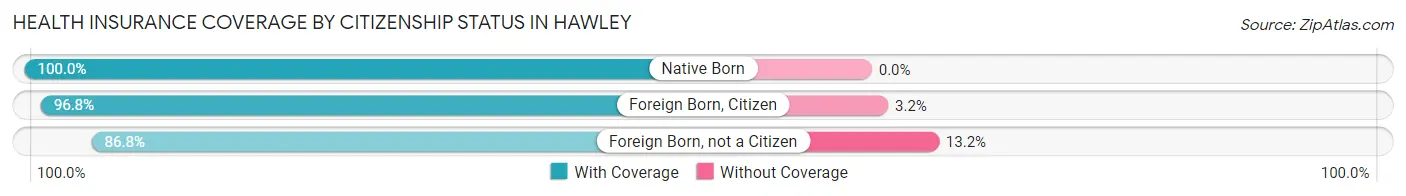
| Citizenship Status | With Coverage | Without Coverage |
| Native Born | 228 (100.0%) | 0 (0.0%) |
| Foreign Born, Citizen | 423 (96.8%) | 14 (3.2%) |
| Foreign Born, not a Citizen | 79 (86.8%) | 12 (13.2%) |
Health Insurance Coverage by Household Income in Hawley
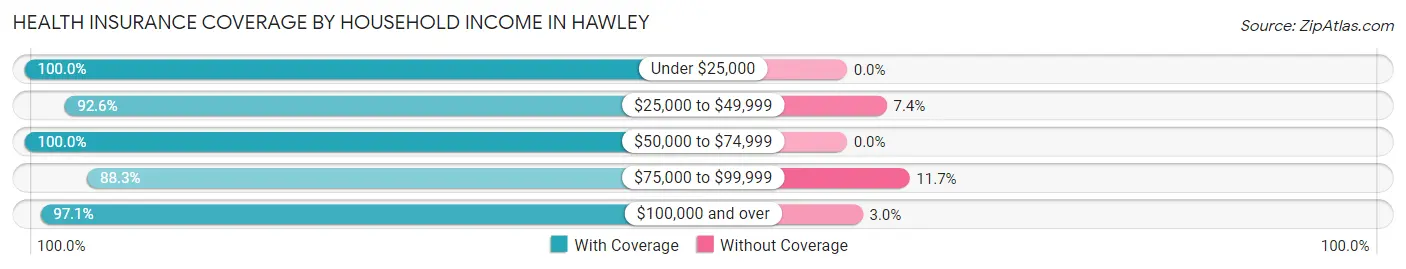
| Household Income | With Coverage | Without Coverage |
| Under $25,000 | 111 (100.0%) | 0 (0.0%) |
| $25,000 to $49,999 | 286 (92.6%) | 23 (7.4%) |
| $50,000 to $74,999 | 304 (100.0%) | 0 (0.0%) |
| $75,000 to $99,999 | 346 (88.3%) | 46 (11.7%) |
| $100,000 and over | 921 (97.1%) | 28 (2.9%) |
Public vs Private Health Insurance Coverage by Age in Hawley
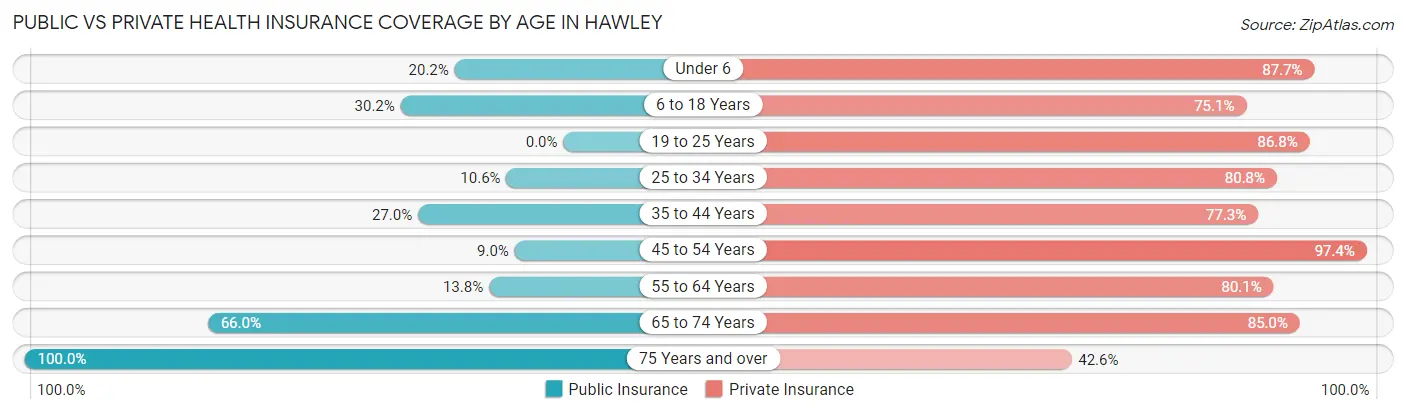
| Age Bracket | Public Insurance | Private Insurance |
| Under 6 | 46 (20.2%) | 200 (87.7%) |
| 6 to 18 Years | 132 (30.2%) | 328 (75.1%) |
| 19 to 25 Years | 0 (0.0%) | 79 (86.8%) |
| 25 to 34 Years | 28 (10.6%) | 214 (80.7%) |
| 35 to 44 Years | 89 (27.0%) | 255 (77.3%) |
| 45 to 54 Years | 14 (9.0%) | 151 (97.4%) |
| 55 to 64 Years | 41 (13.8%) | 238 (80.1%) |
| 65 to 74 Years | 66 (66.0%) | 85 (85.0%) |
| 75 Years and over | 162 (100.0%) | 69 (42.6%) |
| Total | 578 (28.0%) | 1,619 (78.4%) |
Disability Status by Sex by Age in Hawley
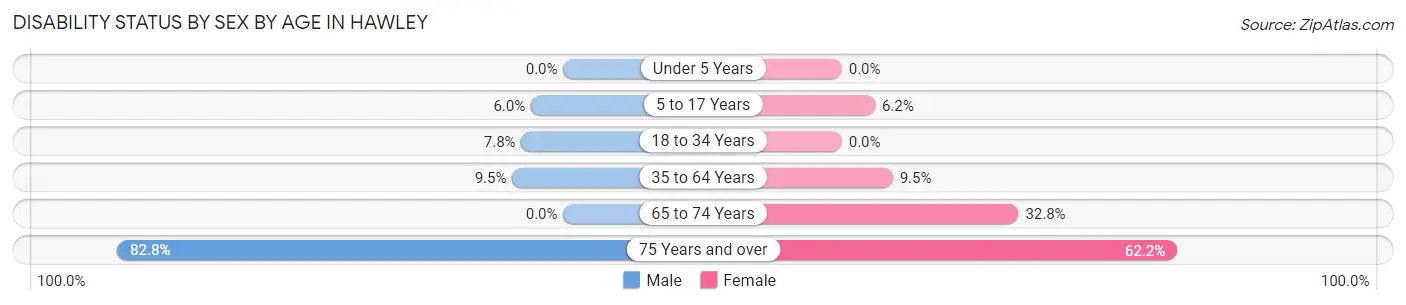
| Age Bracket | Male | Female |
| Under 5 Years | 0 (0.0%) | 0 (0.0%) |
| 5 to 17 Years | 13 (6.0%) | 16 (6.1%) |
| 18 to 34 Years | 13 (7.8%) | 0 (0.0%) |
| 35 to 64 Years | 33 (9.5%) | 41 (9.5%) |
| 65 to 74 Years | 0 (0.0%) | 20 (32.8%) |
| 75 Years and over | 53 (82.8%) | 61 (62.2%) |
Disability Class by Sex by Age in Hawley
Disability Class: Hearing Difficulty
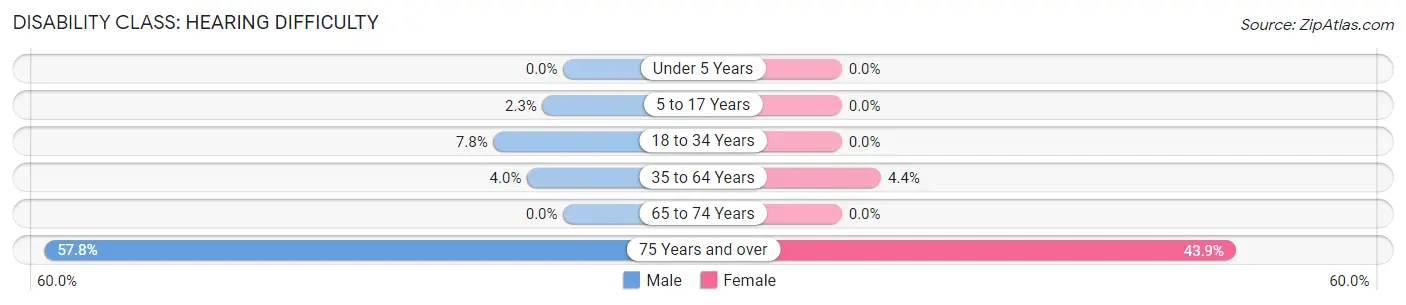
| Age Bracket | Male | Female |
| Under 5 Years | 0 (0.0%) | 0 (0.0%) |
| 5 to 17 Years | 5 (2.3%) | 0 (0.0%) |
| 18 to 34 Years | 13 (7.8%) | 0 (0.0%) |
| 35 to 64 Years | 14 (4.0%) | 19 (4.4%) |
| 65 to 74 Years | 0 (0.0%) | 0 (0.0%) |
| 75 Years and over | 37 (57.8%) | 43 (43.9%) |
Disability Class: Vision Difficulty
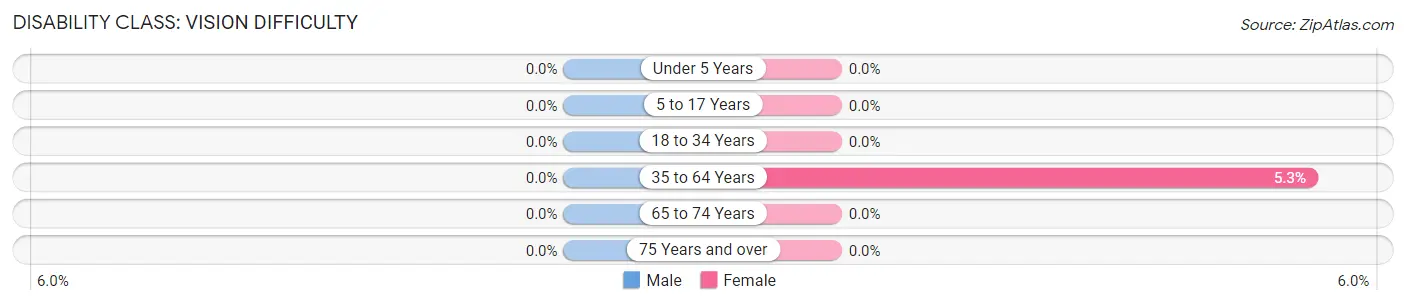
| Age Bracket | Male | Female |
| Under 5 Years | 0 (0.0%) | 0 (0.0%) |
| 5 to 17 Years | 0 (0.0%) | 0 (0.0%) |
| 18 to 34 Years | 0 (0.0%) | 0 (0.0%) |
| 35 to 64 Years | 0 (0.0%) | 23 (5.3%) |
| 65 to 74 Years | 0 (0.0%) | 0 (0.0%) |
| 75 Years and over | 0 (0.0%) | 0 (0.0%) |
Disability Class: Cognitive Difficulty
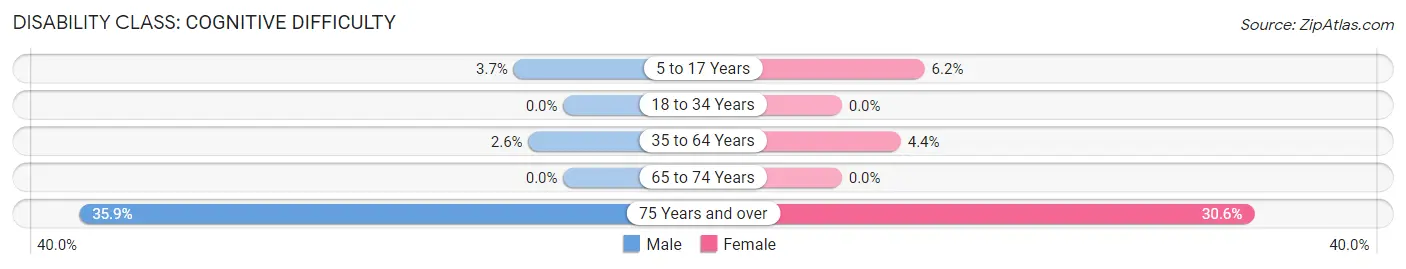
| Age Bracket | Male | Female |
| 5 to 17 Years | 8 (3.7%) | 16 (6.1%) |
| 18 to 34 Years | 0 (0.0%) | 0 (0.0%) |
| 35 to 64 Years | 9 (2.6%) | 19 (4.4%) |
| 65 to 74 Years | 0 (0.0%) | 0 (0.0%) |
| 75 Years and over | 23 (35.9%) | 30 (30.6%) |
Disability Class: Ambulatory Difficulty
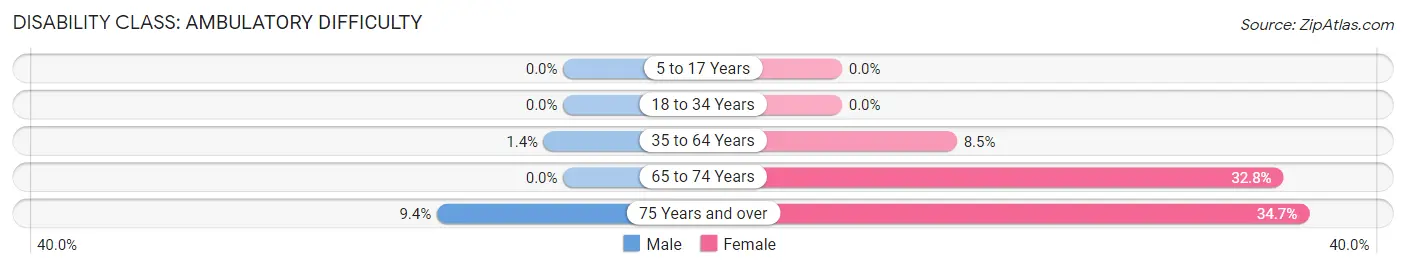
| Age Bracket | Male | Female |
| 5 to 17 Years | 0 (0.0%) | 0 (0.0%) |
| 18 to 34 Years | 0 (0.0%) | 0 (0.0%) |
| 35 to 64 Years | 5 (1.4%) | 37 (8.5%) |
| 65 to 74 Years | 0 (0.0%) | 20 (32.8%) |
| 75 Years and over | 6 (9.4%) | 34 (34.7%) |
Disability Class: Self-Care Difficulty
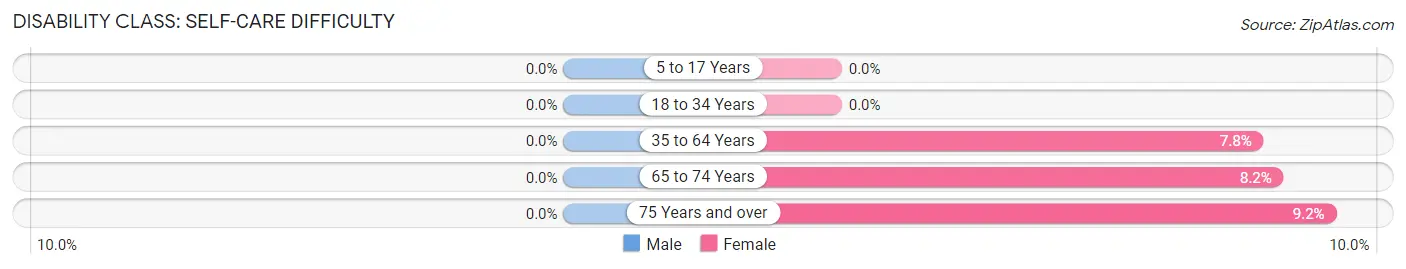
| Age Bracket | Male | Female |
| 5 to 17 Years | 0 (0.0%) | 0 (0.0%) |
| 18 to 34 Years | 0 (0.0%) | 0 (0.0%) |
| 35 to 64 Years | 0 (0.0%) | 34 (7.8%) |
| 65 to 74 Years | 0 (0.0%) | 5 (8.2%) |
| 75 Years and over | 0 (0.0%) | 9 (9.2%) |
Technology Access in Hawley
Computing Device Access in Hawley
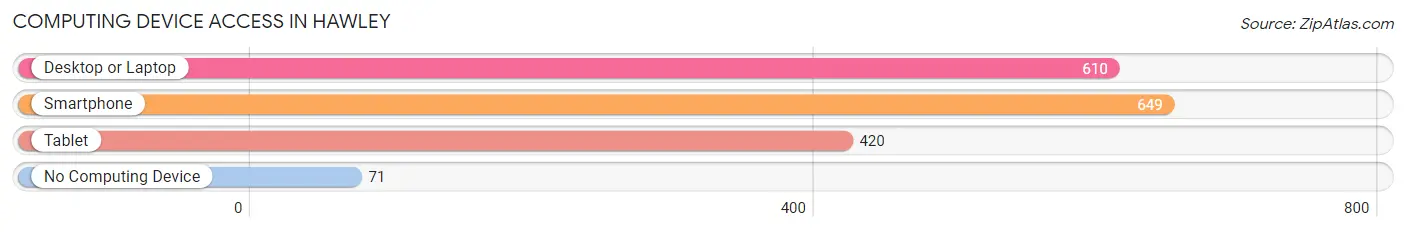
| Device Type | # Households | % Households |
| Desktop or Laptop | 610 | 77.0% |
| Smartphone | 649 | 81.9% |
| Tablet | 420 | 53.0% |
| No Computing Device | 71 | 9.0% |
| Total | 792 | 100.0% |
Internet Access in Hawley
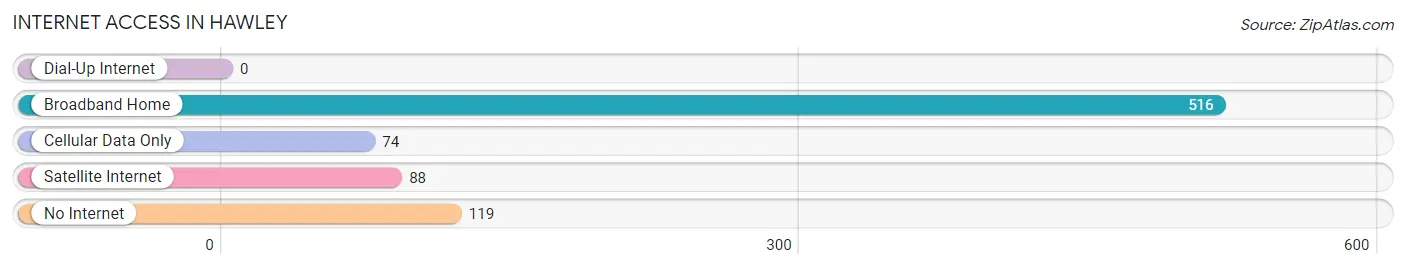
| Internet Type | # Households | % Households |
| Dial-Up Internet | 0 | 0.0% |
| Broadband Home | 516 | 65.1% |
| Cellular Data Only | 74 | 9.3% |
| Satellite Internet | 88 | 11.1% |
| No Internet | 119 | 15.0% |
| Total | 792 | 100.0% |
Hawley Summary
Hawley, Minnesota is a small city located in Clay County, in the northwestern part of the state. It is situated on the Red River of the North, and is part of the Fargo-Moorhead metropolitan area. The city has a population of 2,845, according to the 2010 census.
History
The area that is now Hawley was first settled in 1871 by a group of Norwegian immigrants. The city was named after a local settler, William Hawley. The city was officially incorporated in 1881.
In the early 1900s, Hawley was a thriving agricultural community. The city was home to a number of grain elevators, and the area was known for its production of wheat, oats, and barley. The city also had a number of businesses, including a bank, a hotel, a lumberyard, and a creamery.
In the 1950s, Hawley began to experience a decline in population as many of its residents moved away in search of better economic opportunities. The city’s population dropped from a peak of 3,000 in 1950 to 2,845 in 2010.
Geography
Hawley is located in Clay County, in the northwestern part of Minnesota. It is situated on the Red River of the North, and is part of the Fargo-Moorhead metropolitan area. The city has a total area of 2.2 square miles, all of which is land.
The city is located in a flat, open area, with no major hills or mountains. The terrain is mostly flat, with some rolling hills in the area. The climate is humid continental, with cold winters and warm summers.
Economy
The economy of Hawley is largely based on agriculture. The city is home to a number of grain elevators, and the area is known for its production of wheat, oats, and barley. The city also has a number of businesses, including a bank, a hotel, a lumberyard, and a creamery.
The city is also home to a number of manufacturing companies, including a plastics manufacturer, a metal fabricator, and a food processor. The city is also home to a number of retail stores, including a grocery store, a hardware store, and a furniture store.
Demographics
According to the 2010 census, the population of Hawley was 2,845. The racial makeup of the city was 97.3% White, 0.7% African American, 0.3% Native American, 0.3% Asian, 0.1% Pacific Islander, 0.3% from other races, and 1.0% from two or more races. Hispanic or Latino of any race were 1.2% of the population.
The median household income in Hawley was $41,944, and the median family income was $50,625. The per capita income for the city was $20,845. About 8.3% of families and 10.3% of the population were below the poverty line, including 14.2% of those under age 18 and 8.2% of those age 65 or over.
Common Questions
What is Per Capita Income in Hawley?
Per Capita income in Hawley is $36,650.
What is the Median Family Income in Hawley?
Median Family Income in Hawley is $105,893.
What is the Median Household income in Hawley?
Median Household Income in Hawley is $86,667.
What is Income or Wage Gap in Hawley?
Income or Wage Gap in Hawley is 28.3%.
Women in Hawley earn 71.7 cents for every dollar earned by a man.
What is Family Income Deficit in Hawley?
Family Income Deficit in Hawley is $4,396.
Families that are below poverty line in Hawley earn $4,396 less on average than the poverty threshold level.
What is Inequality or Gini Index in Hawley?
Inequality or Gini Index in Hawley is 0.38.
What is the Total Population of Hawley?
Total Population of Hawley is 2,065.
What is the Total Male Population of Hawley?
Total Male Population of Hawley is 946.
What is the Total Female Population of Hawley?
Total Female Population of Hawley is 1,119.
What is the Ratio of Males per 100 Females in Hawley?
There are 84.54 Males per 100 Females in Hawley.
What is the Ratio of Females per 100 Males in Hawley?
There are 118.29 Females per 100 Males in Hawley.
What is the Median Population Age in Hawley?
Median Population Age in Hawley is 35.2 Years.
What is the Average Family Size in Hawley
Average Family Size in Hawley is 3.2 People.
What is the Average Household Size in Hawley
Average Household Size in Hawley is 2.6 People.
How Large is the Labor Force in Hawley?
There are 1,026 People in the Labor Forcein in Hawley.
What is the Percentage of People in the Labor Force in Hawley?
71.8% of People are in the Labor Force in Hawley.
What is the Unemployment Rate in Hawley?
Unemployment Rate in Hawley is 1.4%.