Harmony, MN Map & Demographics
Harmony Map
Harmony Overview
$40,224
PER CAPITA INCOME
$89,875
AVG FAMILY INCOME
$64,300
AVG HOUSEHOLD INCOME
33.9%
WAGE / INCOME GAP [ % ]
66.1¢/ $1
WAGE / INCOME GAP [ $ ]
0.41
INEQUALITY / GINI INDEX
1,018
TOTAL POPULATION
476
MALE POPULATION
542
FEMALE POPULATION
87.82
MALES / 100 FEMALES
113.87
FEMALES / 100 MALES
58.8
MEDIAN AGE
2.6
AVG FAMILY SIZE
1.9
AVG HOUSEHOLD SIZE
519
LABOR FORCE [ PEOPLE ]
57.7%
PERCENT IN LABOR FORCE
4.0%
UNEMPLOYMENT RATE
Harmony Zip Codes
Harmony Area Codes
Income in Harmony
Income Overview in Harmony
Per Capita Income in Harmony is $40,224, while median incomes of families and households are $89,875 and $64,300 respectively.
| Characteristic | Number | Measure |
| Per Capita Income | 1,018 | $40,224 |
| Median Family Income | 219 | $89,875 |
| Mean Family Income | 219 | $106,691 |
| Median Household Income | 506 | $64,300 |
| Mean Household Income | 506 | $76,412 |
| Income Deficit | 219 | $0 |
| Wage / Income Gap (%) | 1,018 | 33.94% |
| Wage / Income Gap ($) | 1,018 | 66.06¢ per $1 |
| Gini / Inequality Index | 1,018 | 0.41 |
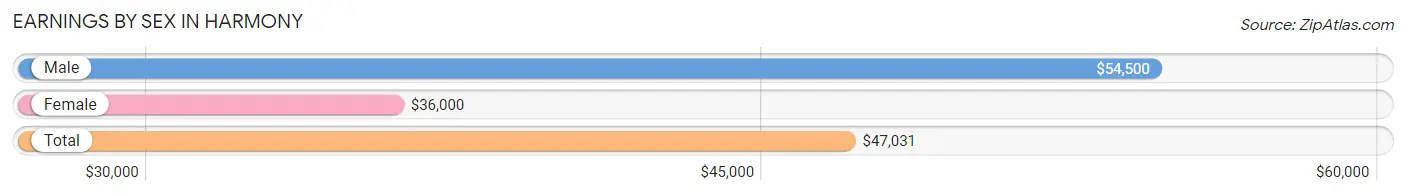
Earnings by Sex in Harmony
Average Earnings in Harmony are $47,031, $54,500 for men and $36,000 for women, a difference of 33.9%.
| Sex | Number | Average Earnings |
| Male | 294 (55.7%) | $54,500 |
| Female | 234 (44.3%) | $36,000 |
| Total | 528 (100.0%) | $47,031 |
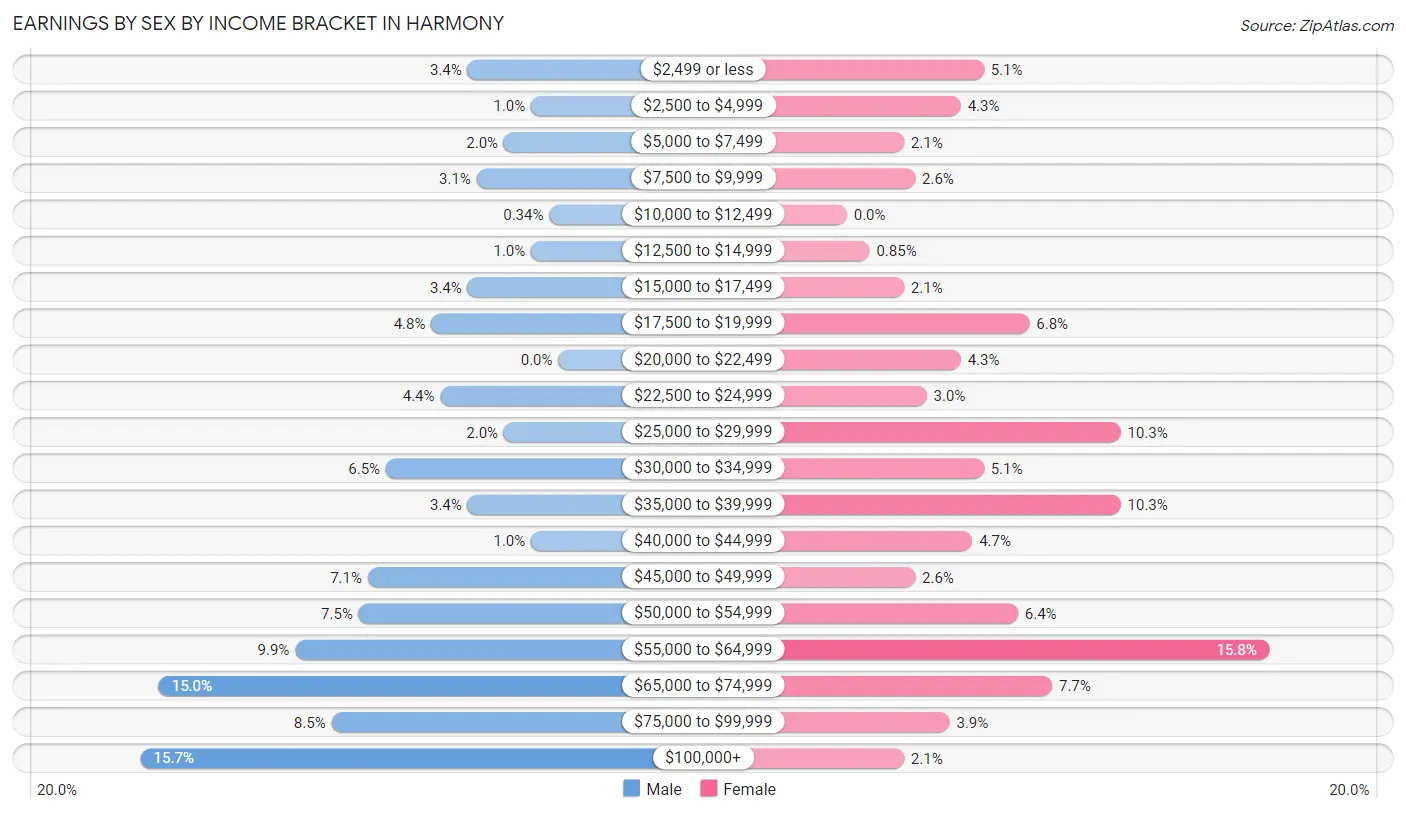
Earnings by Sex by Income Bracket in Harmony
The most common earnings brackets in Harmony are $100,000+ for men (46 | 15.7%) and $55,000 to $64,999 for women (37 | 15.8%).
| Income | Male | Female |
| $2,499 or less | 10 (3.4%) | 12 (5.1%) |
| $2,500 to $4,999 | 3 (1.0%) | 10 (4.3%) |
| $5,000 to $7,499 | 6 (2.0%) | 5 (2.1%) |
| $7,500 to $9,999 | 9 (3.1%) | 6 (2.6%) |
| $10,000 to $12,499 | 1 (0.3%) | 0 (0.0%) |
| $12,500 to $14,999 | 3 (1.0%) | 2 (0.9%) |
| $15,000 to $17,499 | 10 (3.4%) | 5 (2.1%) |
| $17,500 to $19,999 | 14 (4.8%) | 16 (6.8%) |
| $20,000 to $22,499 | 0 (0.0%) | 10 (4.3%) |
| $22,500 to $24,999 | 13 (4.4%) | 7 (3.0%) |
| $25,000 to $29,999 | 6 (2.0%) | 24 (10.3%) |
| $30,000 to $34,999 | 19 (6.5%) | 12 (5.1%) |
| $35,000 to $39,999 | 10 (3.4%) | 24 (10.3%) |
| $40,000 to $44,999 | 3 (1.0%) | 11 (4.7%) |
| $45,000 to $49,999 | 21 (7.1%) | 6 (2.6%) |
| $50,000 to $54,999 | 22 (7.5%) | 15 (6.4%) |
| $55,000 to $64,999 | 29 (9.9%) | 37 (15.8%) |
| $65,000 to $74,999 | 44 (15.0%) | 18 (7.7%) |
| $75,000 to $99,999 | 25 (8.5%) | 9 (3.8%) |
| $100,000+ | 46 (15.7%) | 5 (2.1%) |
| Total | 294 (100.0%) | 234 (100.0%) |
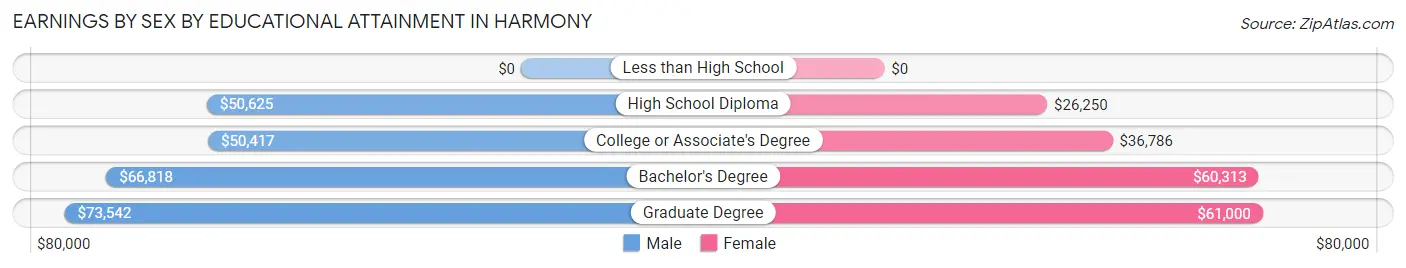
Earnings by Sex by Educational Attainment in Harmony
Average earnings in Harmony are $55,375 for men and $36,688 for women, a difference of 33.8%. Men with an educational attainment of graduate degree enjoy the highest average annual earnings of $73,542, while those with college or associate's degree education earn the least with $50,417. Women with an educational attainment of graduate degree earn the most with the average annual earnings of $61,000, while those with high school diploma education have the smallest earnings of $26,250.
| Educational Attainment | Male Income | Female Income |
| Less than High School | - | - |
| High School Diploma | $50,625 | $26,250 |
| College or Associate's Degree | $50,417 | $36,786 |
| Bachelor's Degree | $66,818 | $60,313 |
| Graduate Degree | $73,542 | $61,000 |
| Total | $55,375 | $36,688 |
Family Income in Harmony
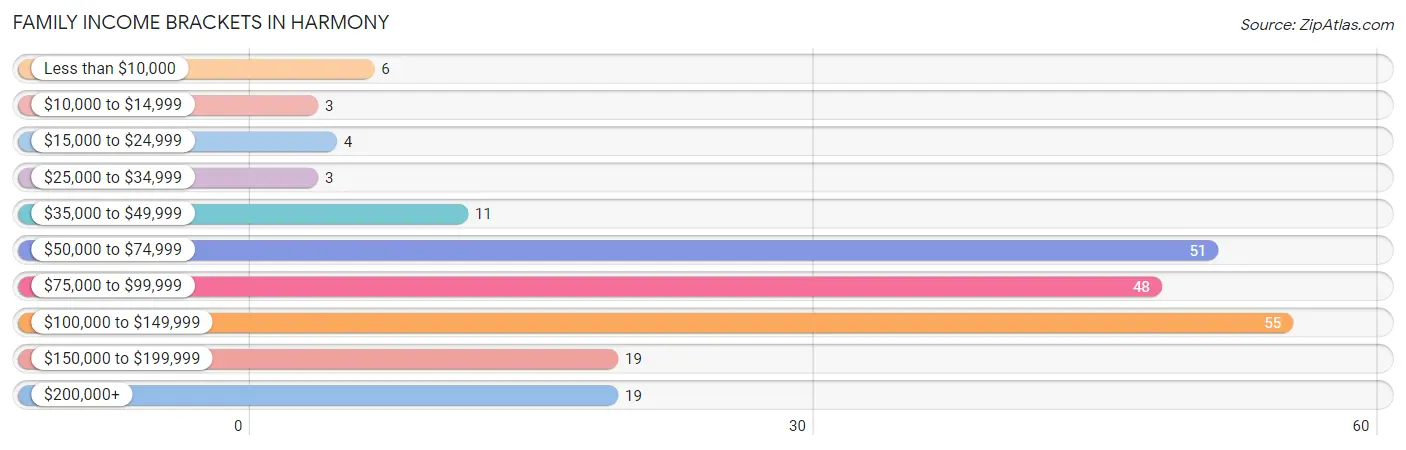
Family Income Brackets in Harmony
According to the Harmony family income data, there are 55 families falling into the $100,000 to $149,999 income range, which is the most common income bracket and makes up 25.1% of all families. Conversely, the $10,000 to $14,999 income bracket is the least frequent group with only 3 families (1.4%) belonging to this category.
| Income Bracket | # Families | % Families |
| Less than $10,000 | 6 | 2.7% |
| $10,000 to $14,999 | 3 | 1.4% |
| $15,000 to $24,999 | 4 | 1.8% |
| $25,000 to $34,999 | 3 | 1.4% |
| $35,000 to $49,999 | 11 | 5.0% |
| $50,000 to $74,999 | 51 | 23.3% |
| $75,000 to $99,999 | 48 | 21.9% |
| $100,000 to $149,999 | 55 | 25.1% |
| $150,000 to $199,999 | 19 | 8.7% |
| $200,000+ | 19 | 8.7% |
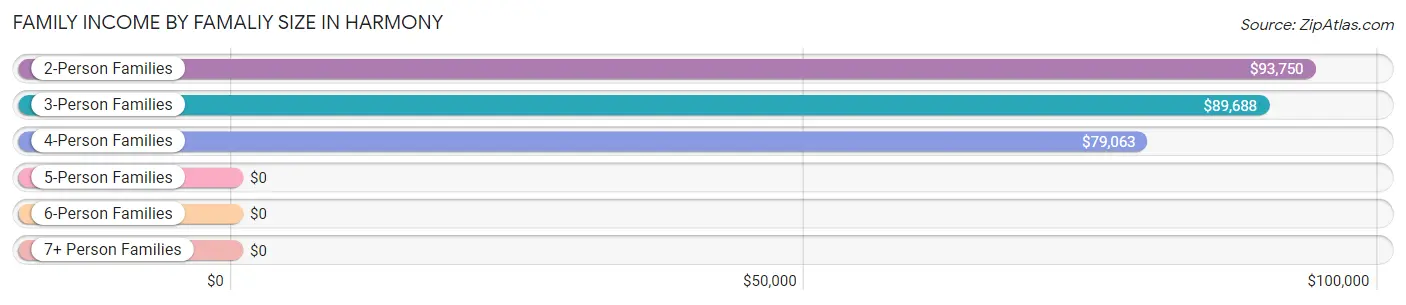
Family Income by Famaliy Size in Harmony
2-person families (134 | 61.2%) account for the highest median family income in Harmony with $93,750 per family, while 2-person families (134 | 61.2%) have the highest median income of $46,875 per family member.
| Income Bracket | # Families | Median Income |
| 2-Person Families | 134 (61.2%) | $93,750 |
| 3-Person Families | 56 (25.6%) | $89,688 |
| 4-Person Families | 19 (8.7%) | $79,063 |
| 5-Person Families | 6 (2.7%) | $0 |
| 6-Person Families | 4 (1.8%) | $0 |
| 7+ Person Families | 0 (0.0%) | $0 |
| Total | 219 (100.0%) | $89,875 |
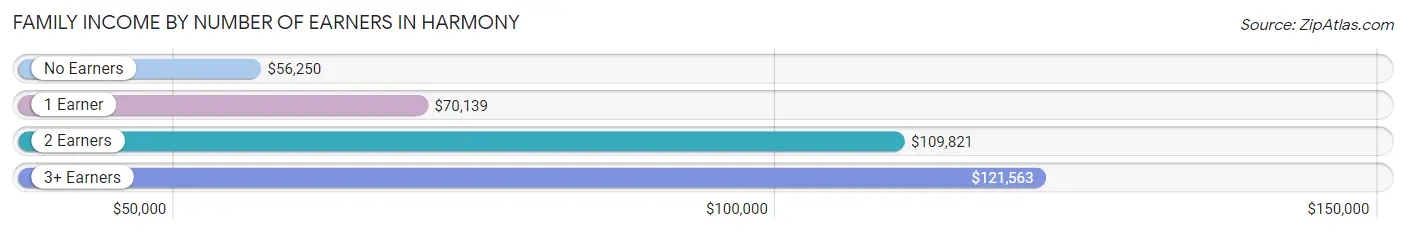
Family Income by Number of Earners in Harmony
The median family income in Harmony is $89,875, with families comprising 3+ earners (11) having the highest median family income of $121,563, while families with no earners (22) have the lowest median family income of $56,250, accounting for 5.0% and 10.1% of families, respectively.
| Number of Earners | # Families | Median Income |
| No Earners | 22 (10.1%) | $56,250 |
| 1 Earner | 75 (34.3%) | $70,139 |
| 2 Earners | 111 (50.7%) | $109,821 |
| 3+ Earners | 11 (5.0%) | $121,563 |
| Total | 219 (100.0%) | $89,875 |
Household Income in Harmony
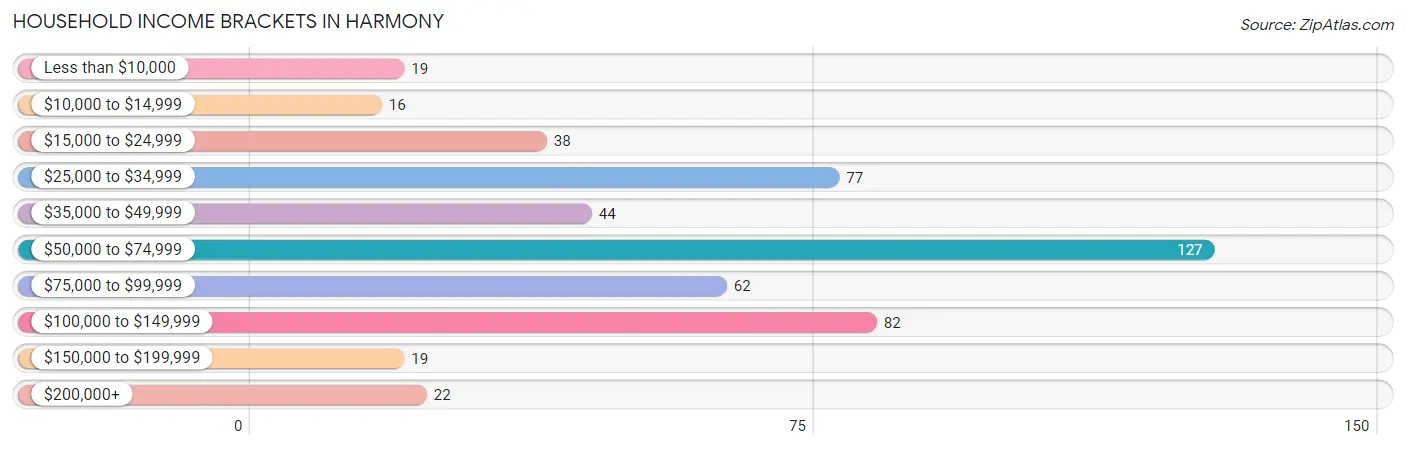
Household Income Brackets in Harmony
With 127 households falling in the category, the $50,000 to $74,999 income range is the most frequent in Harmony, accounting for 25.1% of all households. In contrast, only 16 households (3.2%) fall into the $10,000 to $14,999 income bracket, making it the least populous group.
| Income Bracket | # Households | % Households |
| Less than $10,000 | 19 | 3.8% |
| $10,000 to $14,999 | 16 | 3.2% |
| $15,000 to $24,999 | 38 | 7.5% |
| $25,000 to $34,999 | 77 | 15.2% |
| $35,000 to $49,999 | 44 | 8.7% |
| $50,000 to $74,999 | 127 | 25.1% |
| $75,000 to $99,999 | 62 | 12.3% |
| $100,000 to $149,999 | 82 | 16.2% |
| $150,000 to $199,999 | 19 | 3.8% |
| $200,000+ | 22 | 4.3% |
Household Income by Householder Age in Harmony
The median household income in Harmony is $64,300, with the highest median household income of $77,656 found in the 25 to 44 years age bracket for the primary householder. A total of 97 households (19.2%) fall into this category. Meanwhile, the 15 to 24 years age bracket for the primary householder has the lowest median household income of $0, with 23 households (4.5%) in this group.
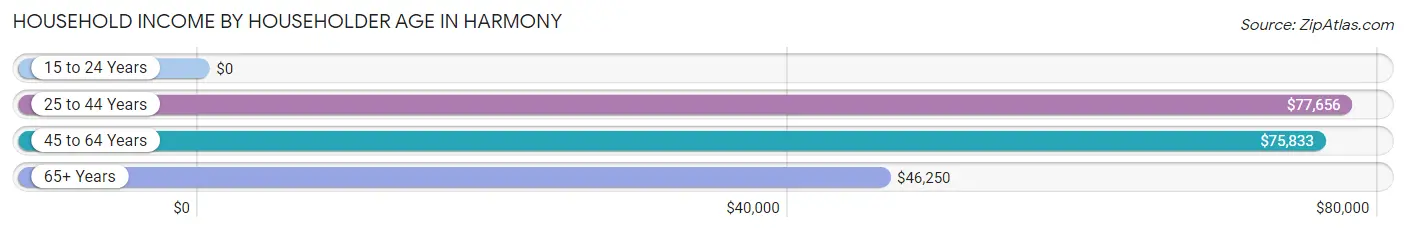
| Income Bracket | # Households | Median Income |
| 15 to 24 Years | 23 (4.5%) | $0 |
| 25 to 44 Years | 97 (19.2%) | $77,656 |
| 45 to 64 Years | 154 (30.4%) | $75,833 |
| 65+ Years | 232 (45.9%) | $46,250 |
| Total | 506 (100.0%) | $64,300 |
Poverty in Harmony
Income Below Poverty by Sex and Age in Harmony
With 11.5% poverty level for males and 11.3% for females among the residents of Harmony, 5 year old males and 18 to 24 year old females are the most vulnerable to poverty, with 5 males (100.0%) and 10 females (47.6%) in their respective age groups living below the poverty level.
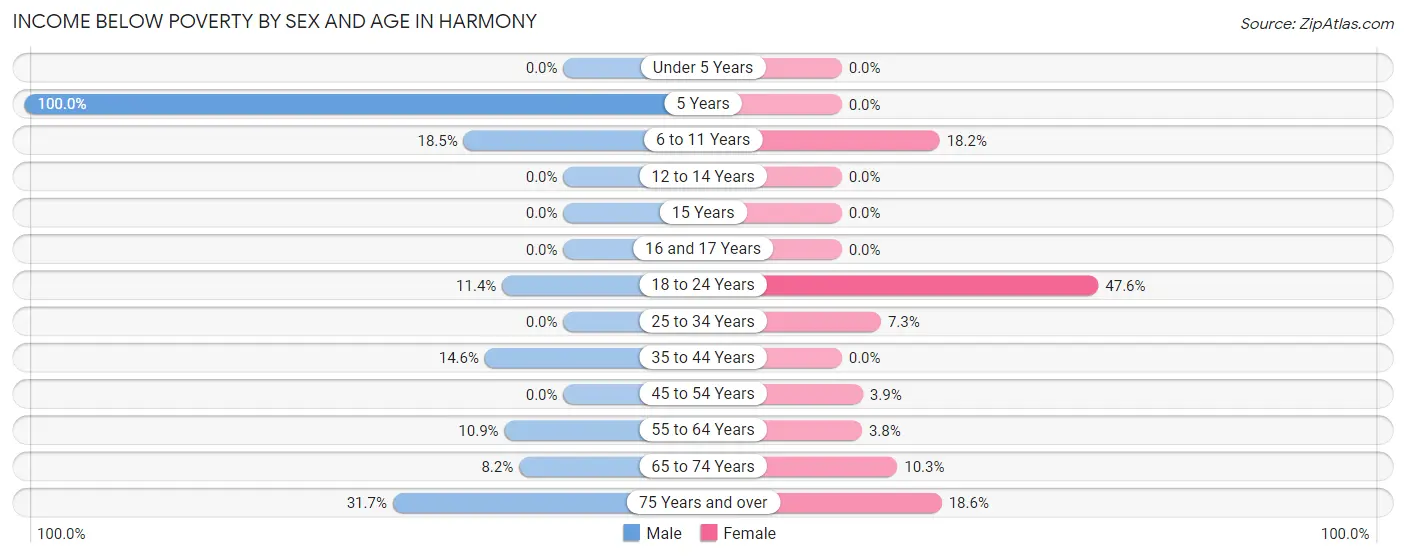
| Age Bracket | Male | Female |
| Under 5 Years | 0 (0.0%) | 0 (0.0%) |
| 5 Years | 5 (100.0%) | 0 (0.0%) |
| 6 to 11 Years | 5 (18.5%) | 4 (18.2%) |
| 12 to 14 Years | 0 (0.0%) | 0 (0.0%) |
| 15 Years | 0 (0.0%) | 0 (0.0%) |
| 16 and 17 Years | 0 (0.0%) | 0 (0.0%) |
| 18 to 24 Years | 5 (11.4%) | 10 (47.6%) |
| 25 to 34 Years | 0 (0.0%) | 4 (7.3%) |
| 35 to 44 Years | 7 (14.6%) | 0 (0.0%) |
| 45 to 54 Years | 0 (0.0%) | 2 (3.9%) |
| 55 to 64 Years | 7 (10.9%) | 3 (3.7%) |
| 65 to 74 Years | 6 (8.2%) | 10 (10.3%) |
| 75 Years and over | 19 (31.7%) | 23 (18.5%) |
| Total | 54 (11.5%) | 56 (11.3%) |
Income Above Poverty by Sex and Age in Harmony
According to the poverty statistics in Harmony, males aged under 5 years and females aged under 5 years are the age groups that are most secure financially, with 100.0% of males and 100.0% of females in these age groups living above the poverty line.
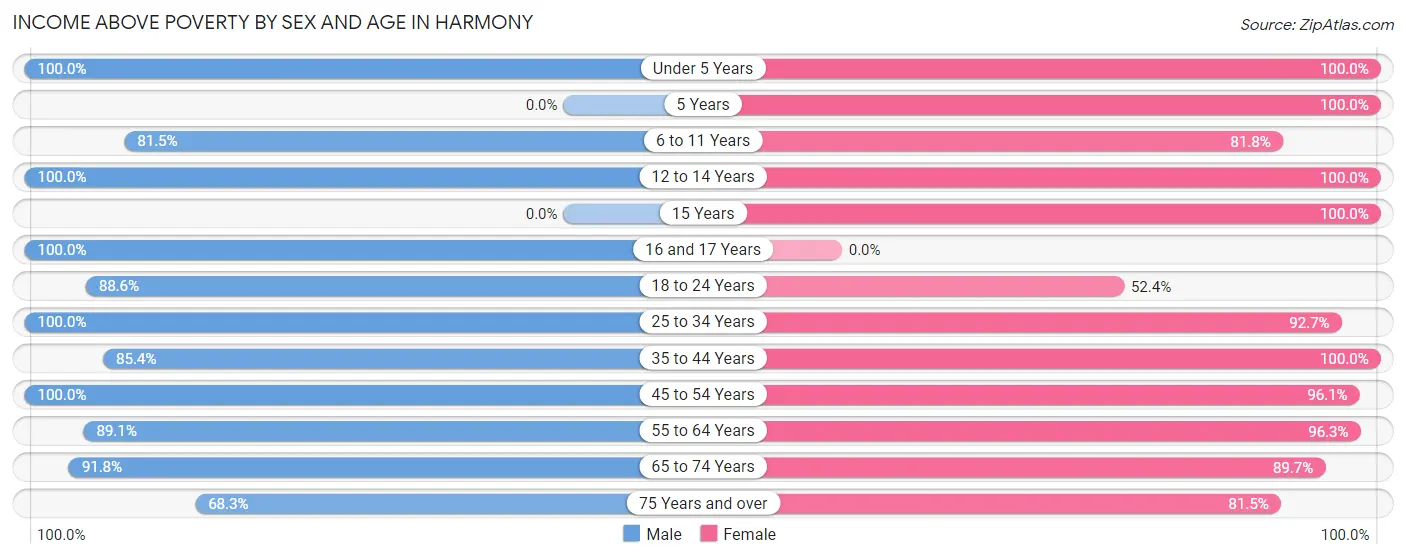
| Age Bracket | Male | Female |
| Under 5 Years | 8 (100.0%) | 9 (100.0%) |
| 5 Years | 0 (0.0%) | 3 (100.0%) |
| 6 to 11 Years | 22 (81.5%) | 18 (81.8%) |
| 12 to 14 Years | 26 (100.0%) | 11 (100.0%) |
| 15 Years | 0 (0.0%) | 7 (100.0%) |
| 16 and 17 Years | 8 (100.0%) | 0 (0.0%) |
| 18 to 24 Years | 39 (88.6%) | 11 (52.4%) |
| 25 to 34 Years | 50 (100.0%) | 51 (92.7%) |
| 35 to 44 Years | 41 (85.4%) | 16 (100.0%) |
| 45 to 54 Years | 57 (100.0%) | 49 (96.1%) |
| 55 to 64 Years | 57 (89.1%) | 77 (96.3%) |
| 65 to 74 Years | 67 (91.8%) | 87 (89.7%) |
| 75 Years and over | 41 (68.3%) | 101 (81.5%) |
| Total | 416 (88.5%) | 440 (88.7%) |
Income Below Poverty Among Married-Couple Families in Harmony
The poverty statistics for married-couple families in Harmony show that 3.3% or 6 of the total 182 families live below the poverty line. Families with no children have the highest poverty rate of 4.4%, comprising of 6 families. On the other hand, families with 1 or 2 children have the lowest poverty rate of 0.0%, which includes 0 families.
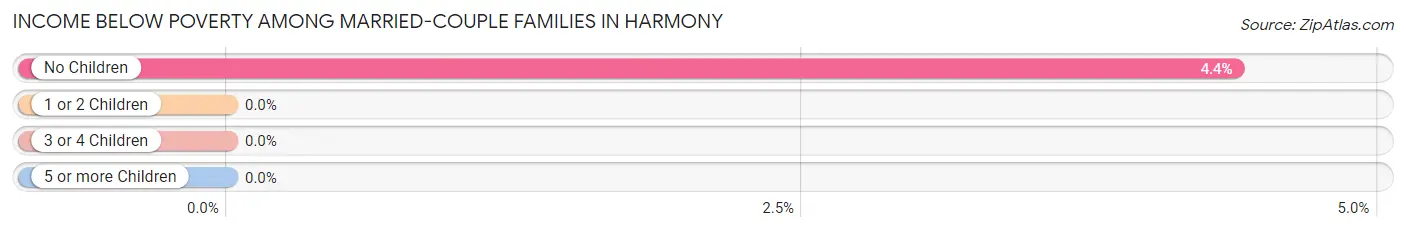
| Children | Above Poverty | Below Poverty |
| No Children | 131 (95.6%) | 6 (4.4%) |
| 1 or 2 Children | 39 (100.0%) | 0 (0.0%) |
| 3 or 4 Children | 6 (100.0%) | 0 (0.0%) |
| 5 or more Children | 0 (0.0%) | 0 (0.0%) |
| Total | 176 (96.7%) | 6 (3.3%) |
Income Below Poverty Among Single-Parent Households in Harmony
According to the poverty data in Harmony, 18.8% or 3 single-father households and 19.1% or 4 single-mother households are living below the poverty line. Among single-father households, those with no children have the highest poverty rate, with 3 households (100.0%) experiencing poverty. Likewise, among single-mother households, those with 3 or 4 children have the highest poverty rate, with 4 households (100.0%) falling below the poverty line.
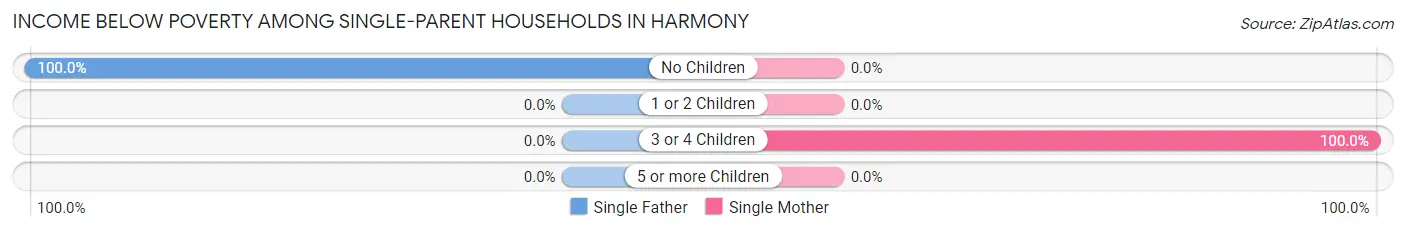
| Children | Single Father | Single Mother |
| No Children | 3 (100.0%) | 0 (0.0%) |
| 1 or 2 Children | 0 (0.0%) | 0 (0.0%) |
| 3 or 4 Children | 0 (0.0%) | 4 (100.0%) |
| 5 or more Children | 0 (0.0%) | 0 (0.0%) |
| Total | 3 (18.8%) | 4 (19.1%) |
Income Below Poverty Among Married-Couple vs Single-Parent Households in Harmony
The poverty data for Harmony shows that 6 of the married-couple family households (3.3%) and 7 of the single-parent households (18.9%) are living below the poverty level. Within the married-couple family households, those with no children have the highest poverty rate, with 6 households (4.4%) falling below the poverty line. Among the single-parent households, those with 3 or 4 children have the highest poverty rate, with 4 household (100.0%) living below poverty.
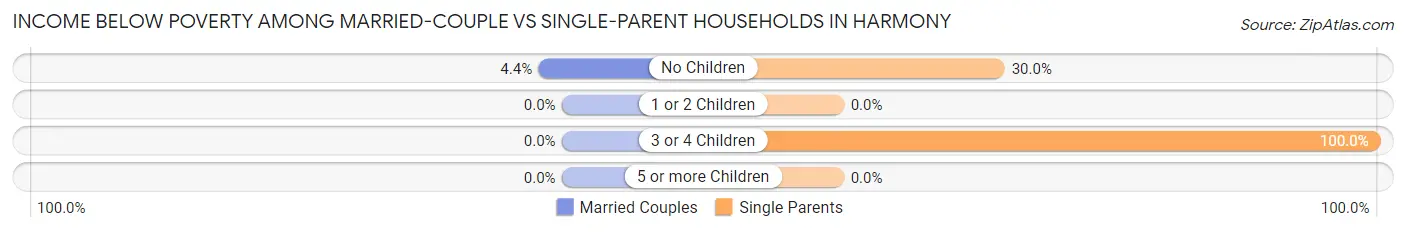
| Children | Married-Couple Families | Single-Parent Households |
| No Children | 6 (4.4%) | 3 (30.0%) |
| 1 or 2 Children | 0 (0.0%) | 0 (0.0%) |
| 3 or 4 Children | 0 (0.0%) | 4 (100.0%) |
| 5 or more Children | 0 (0.0%) | 0 (0.0%) |
| Total | 6 (3.3%) | 7 (18.9%) |
Race in Harmony
The most populous races in Harmony are White / Caucasian (965 | 94.8%), Two or more Races (34 | 3.3%), and Black / African American (17 | 1.7%).
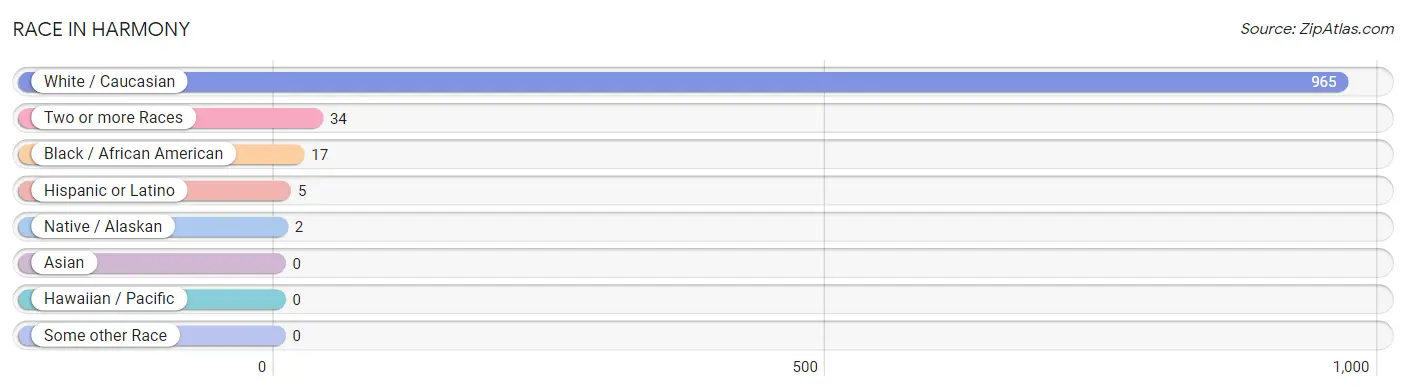
| Race | # Population | % Population |
| Asian | 0 | 0.0% |
| Black / African American | 17 | 1.7% |
| Hawaiian / Pacific | 0 | 0.0% |
| Hispanic or Latino | 5 | 0.5% |
| Native / Alaskan | 2 | 0.2% |
| White / Caucasian | 965 | 94.8% |
| Two or more Races | 34 | 3.3% |
| Some other Race | 0 | 0.0% |
| Total | 1,018 | 100.0% |
Ancestry in Harmony
The most populous ancestries reported in Harmony are Norwegian (324 | 31.8%), German (276 | 27.1%), American (109 | 10.7%), Irish (86 | 8.5%), and Dutch (32 | 3.1%), together accounting for 81.2% of all Harmony residents.
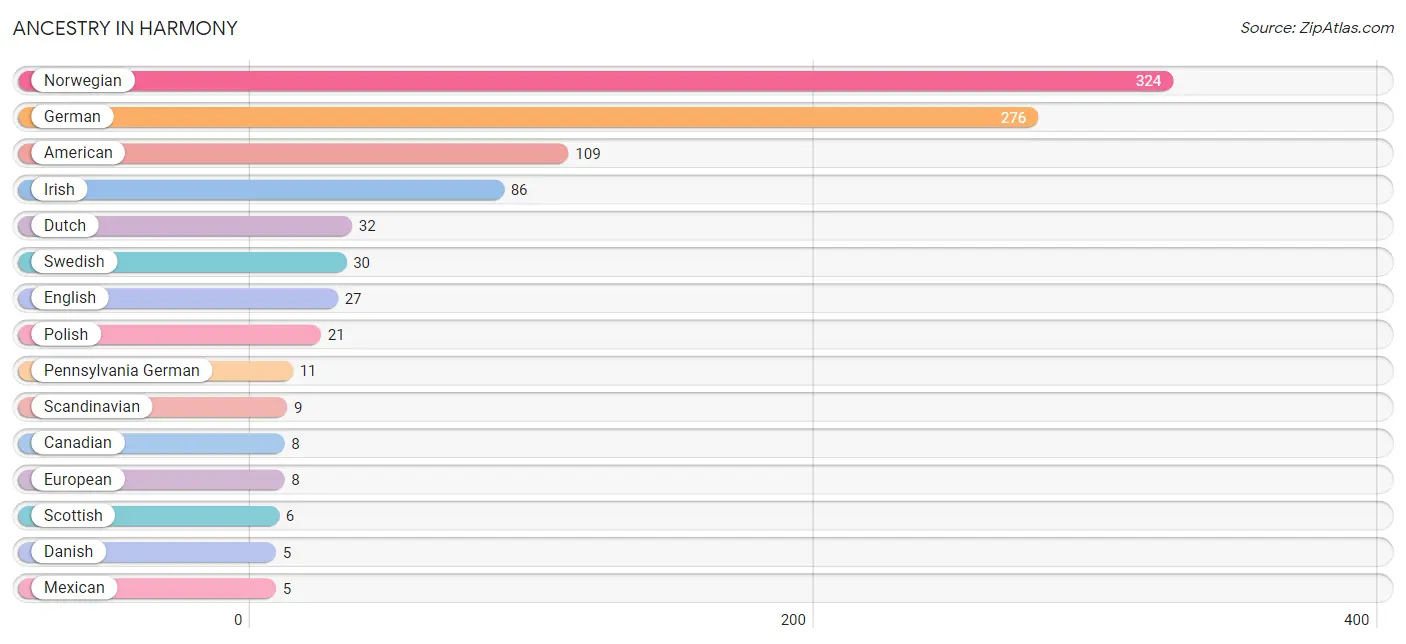
| Ancestry | # Population | % Population |
| American | 109 | 10.7% |
| Canadian | 8 | 0.8% |
| Czech | 2 | 0.2% |
| Czechoslovakian | 4 | 0.4% |
| Danish | 5 | 0.5% |
| Dutch | 32 | 3.1% |
| English | 27 | 2.6% |
| European | 8 | 0.8% |
| French | 3 | 0.3% |
| French Canadian | 3 | 0.3% |
| German | 276 | 27.1% |
| Irish | 86 | 8.5% |
| Italian | 3 | 0.3% |
| Mexican | 5 | 0.5% |
| Norwegian | 324 | 31.8% |
| Pennsylvania German | 11 | 1.1% |
| Polish | 21 | 2.1% |
| Russian | 3 | 0.3% |
| Scandinavian | 9 | 0.9% |
| Scottish | 6 | 0.6% |
| Swedish | 30 | 2.9% | View All 21 Rows |
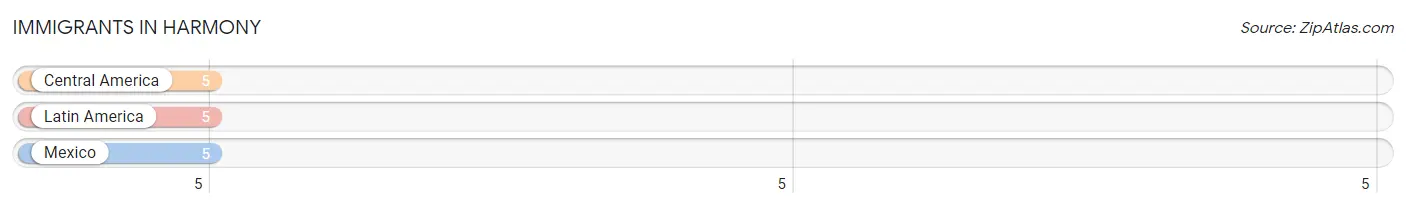
Immigrants in Harmony
The most numerous immigrant groups reported in Harmony came from Central America (5 | 0.5%), Latin America (5 | 0.5%), and Mexico (5 | 0.5%), together accounting for 1.5% of all Harmony residents.
| Immigration Origin | # Population | % Population |
| Central America | 5 | 0.5% |
| Latin America | 5 | 0.5% |
| Mexico | 5 | 0.5% | View All 3 Rows |
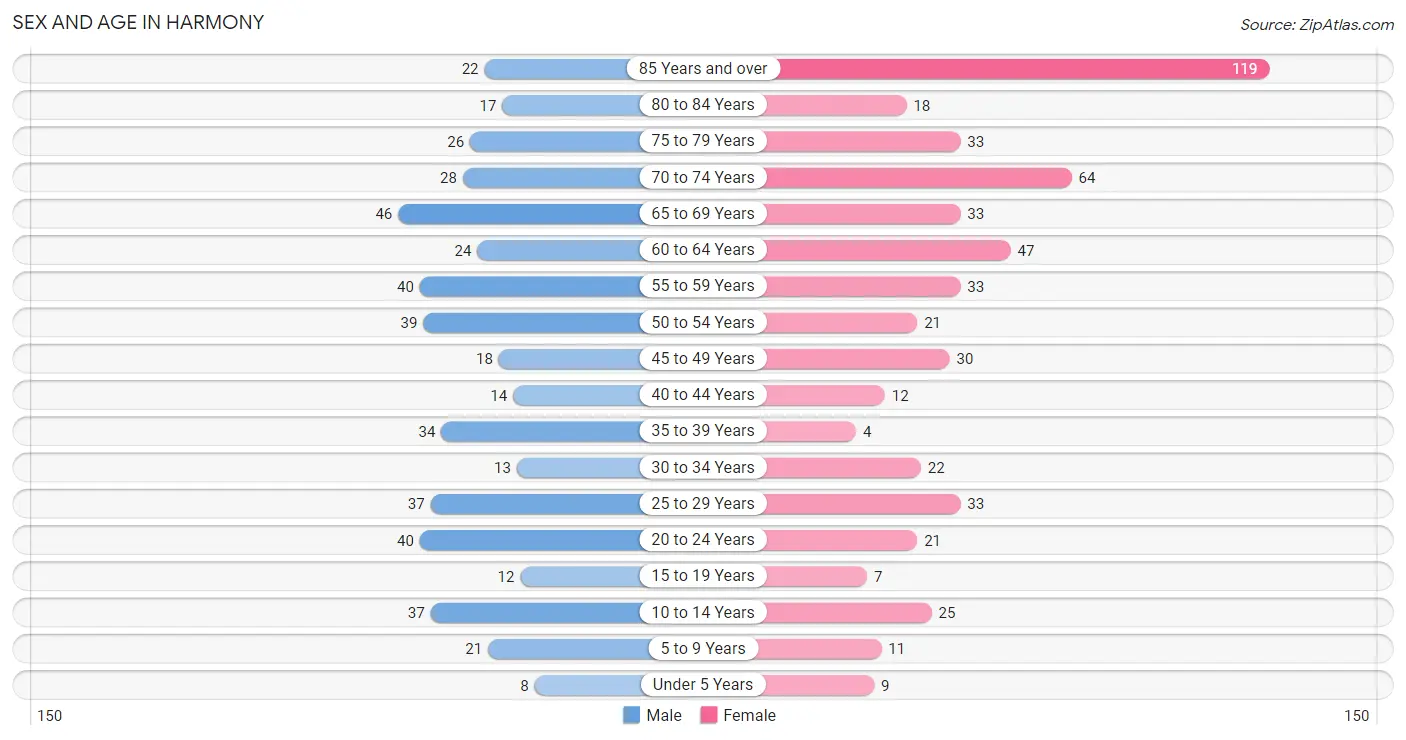
Sex and Age in Harmony
Sex and Age in Harmony
The most populous age groups in Harmony are 65 to 69 Years (46 | 9.7%) for men and 85 Years and over (119 | 22.0%) for women.
| Age Bracket | Male | Female |
| Under 5 Years | 8 (1.7%) | 9 (1.7%) |
| 5 to 9 Years | 21 (4.4%) | 11 (2.0%) |
| 10 to 14 Years | 37 (7.8%) | 25 (4.6%) |
| 15 to 19 Years | 12 (2.5%) | 7 (1.3%) |
| 20 to 24 Years | 40 (8.4%) | 21 (3.9%) |
| 25 to 29 Years | 37 (7.8%) | 33 (6.1%) |
| 30 to 34 Years | 13 (2.7%) | 22 (4.1%) |
| 35 to 39 Years | 34 (7.1%) | 4 (0.7%) |
| 40 to 44 Years | 14 (2.9%) | 12 (2.2%) |
| 45 to 49 Years | 18 (3.8%) | 30 (5.5%) |
| 50 to 54 Years | 39 (8.2%) | 21 (3.9%) |
| 55 to 59 Years | 40 (8.4%) | 33 (6.1%) |
| 60 to 64 Years | 24 (5.0%) | 47 (8.7%) |
| 65 to 69 Years | 46 (9.7%) | 33 (6.1%) |
| 70 to 74 Years | 28 (5.9%) | 64 (11.8%) |
| 75 to 79 Years | 26 (5.5%) | 33 (6.1%) |
| 80 to 84 Years | 17 (3.6%) | 18 (3.3%) |
| 85 Years and over | 22 (4.6%) | 119 (22.0%) |
| Total | 476 (100.0%) | 542 (100.0%) |
Families and Households in Harmony
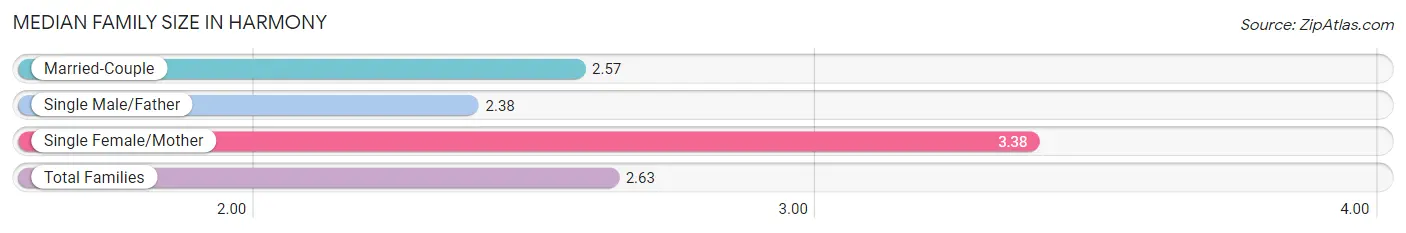
Median Family Size in Harmony
The median family size in Harmony is 2.63 persons per family, with single female/mother families (21 | 9.6%) accounting for the largest median family size of 3.38 persons per family. On the other hand, single male/father families (16 | 7.3%) represent the smallest median family size with 2.38 persons per family.
| Family Type | # Families | Family Size |
| Married-Couple | 182 (83.1%) | 2.57 |
| Single Male/Father | 16 (7.3%) | 2.38 |
| Single Female/Mother | 21 (9.6%) | 3.38 |
| Total Families | 219 (100.0%) | 2.63 |
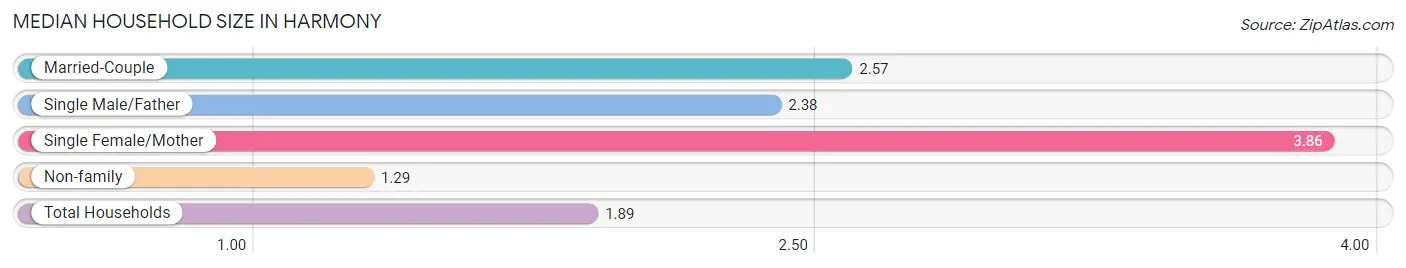
Median Household Size in Harmony
The median household size in Harmony is 1.89 persons per household, with single female/mother households (21 | 4.2%) accounting for the largest median household size of 3.86 persons per household. non-family households (287 | 56.7%) represent the smallest median household size with 1.29 persons per household.
| Household Type | # Households | Household Size |
| Married-Couple | 182 (36.0%) | 2.57 |
| Single Male/Father | 16 (3.2%) | 2.38 |
| Single Female/Mother | 21 (4.2%) | 3.86 |
| Non-family | 287 (56.7%) | 1.29 |
| Total Households | 506 (100.0%) | 1.89 |
Household Size by Marriage Status in Harmony
Out of a total of 506 households in Harmony, 219 (43.3%) are family households, while 287 (56.7%) are nonfamily households. The most numerous type of family households are 2-person households, comprising 131, and the most common type of nonfamily households are 1-person households, comprising 261.
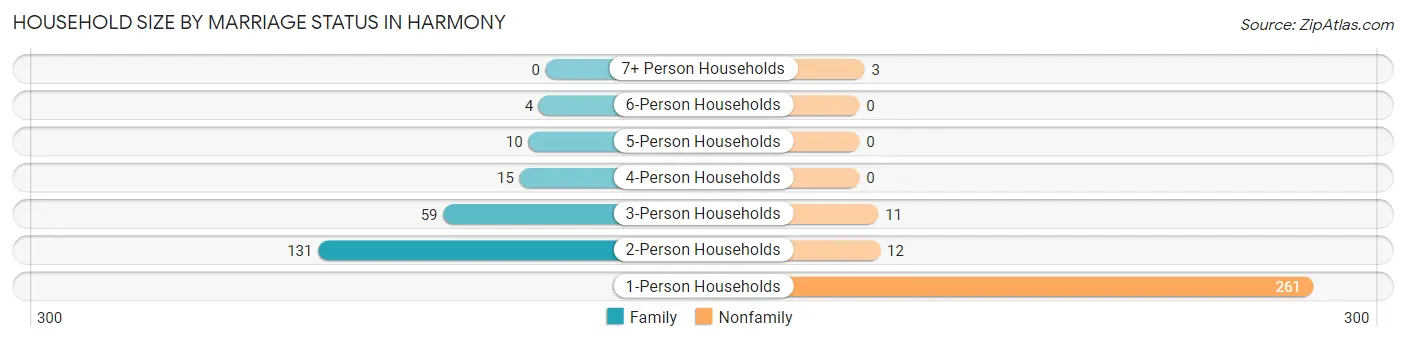
| Household Size | Family Households | Nonfamily Households |
| 1-Person Households | - | 261 (51.6%) |
| 2-Person Households | 131 (25.9%) | 12 (2.4%) |
| 3-Person Households | 59 (11.7%) | 11 (2.2%) |
| 4-Person Households | 15 (3.0%) | 0 (0.0%) |
| 5-Person Households | 10 (2.0%) | 0 (0.0%) |
| 6-Person Households | 4 (0.8%) | 0 (0.0%) |
| 7+ Person Households | 0 (0.0%) | 3 (0.6%) |
| Total | 219 (43.3%) | 287 (56.7%) |
Female Fertility in Harmony
Fertility by Age in Harmony
Average fertility rate in Harmony is 38.0 births per 1,000 women. Women in the age bracket of 20 to 34 years have the highest fertility rate with 66.0 births per 1,000 women. Women in the age bracket of 20 to 34 years acount for 100.0% of all women with births.
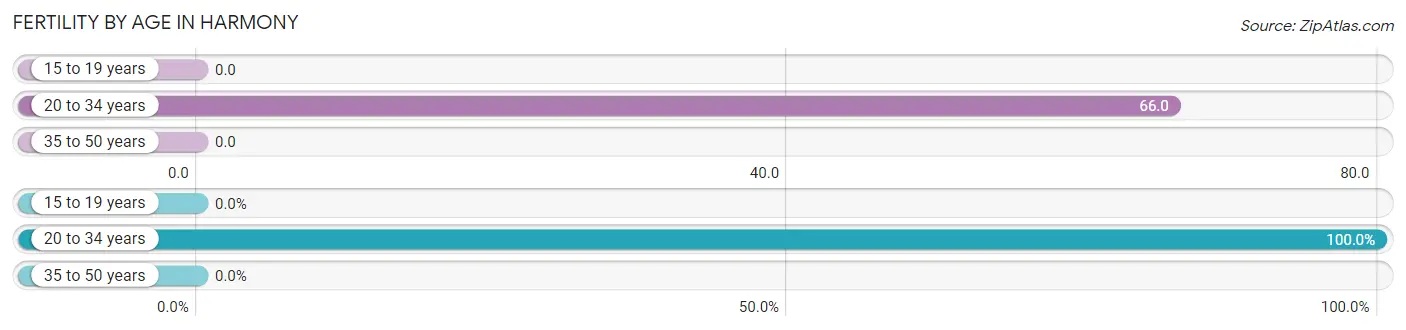
| Age Bracket | Women with Births | Births / 1,000 Women |
| 15 to 19 years | 0 (0.0%) | 0.0 |
| 20 to 34 years | 5 (100.0%) | 66.0 |
| 35 to 50 years | 0 (0.0%) | 0.0 |
| Total | 5 (100.0%) | 38.0 |
Fertility by Age by Marriage Status in Harmony
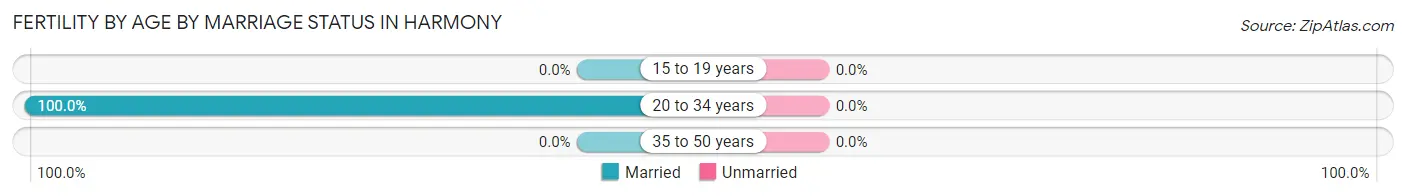
| Age Bracket | Married | Unmarried |
| 15 to 19 years | 0 (0.0%) | 0 (0.0%) |
| 20 to 34 years | 5 (100.0%) | 0 (0.0%) |
| 35 to 50 years | 0 (0.0%) | 0 (0.0%) |
| Total | 5 (100.0%) | 0 (0.0%) |
Fertility by Education in Harmony
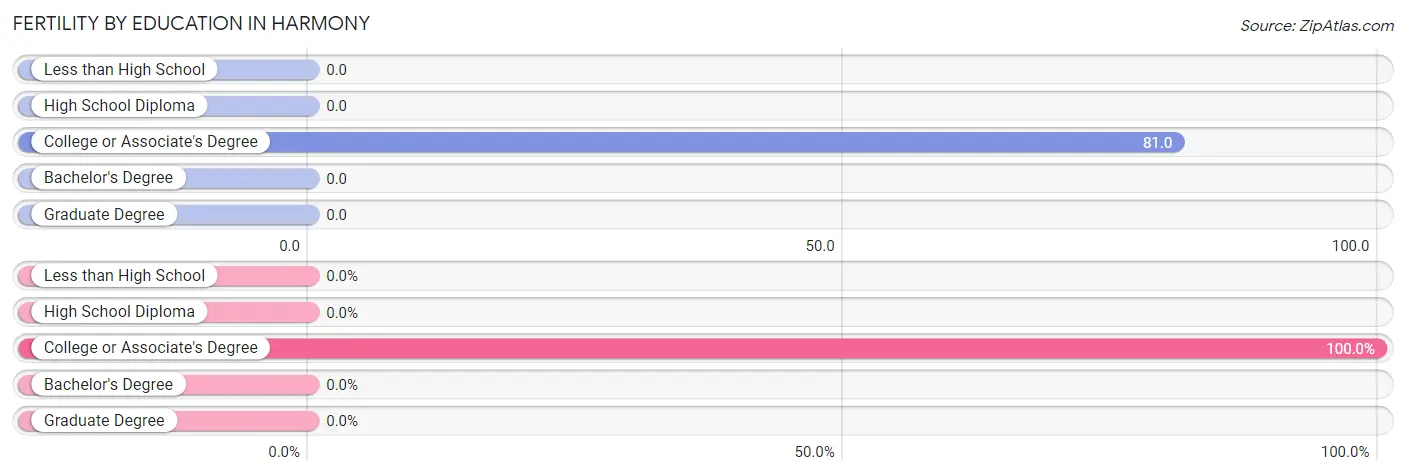
| Educational Attainment | Women with Births | Births / 1,000 Women |
| Less than High School | 0 (0.0%) | 0.0 |
| High School Diploma | 0 (0.0%) | 0.0 |
| College or Associate's Degree | 5 (100.0%) | 81.0 |
| Bachelor's Degree | 0 (0.0%) | 0.0 |
| Graduate Degree | 0 (0.0%) | 0.0 |
| Total | 5 (100.0%) | 38.0 |
Fertility by Education by Marriage Status in Harmony
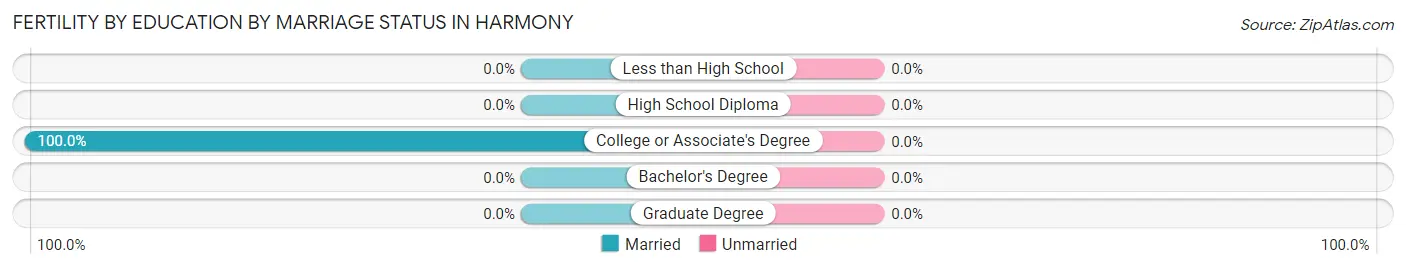
| Educational Attainment | Married | Unmarried |
| Less than High School | 0 (0.0%) | 0 (0.0%) |
| High School Diploma | 0 (0.0%) | 0 (0.0%) |
| College or Associate's Degree | 5 (100.0%) | 0 (0.0%) |
| Bachelor's Degree | 0 (0.0%) | 0 (0.0%) |
| Graduate Degree | 0 (0.0%) | 0 (0.0%) |
| Total | 5 (100.0%) | 0 (0.0%) |
Employment Characteristics in Harmony
Employment by Class of Employer in Harmony
Among the 493 employed individuals in Harmony, private company employees (291 | 59.0%), not-for-profit organizations (88 | 17.8%), and local government employees (56 | 11.4%) make up the most common classes of employment.
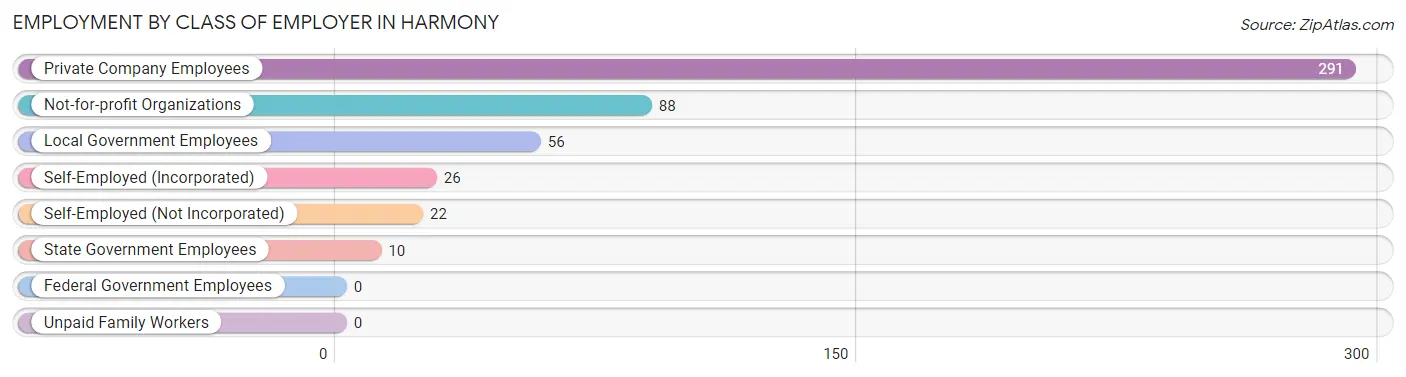
| Employer Class | # Employees | % Employees |
| Private Company Employees | 291 | 59.0% |
| Self-Employed (Incorporated) | 26 | 5.3% |
| Self-Employed (Not Incorporated) | 22 | 4.5% |
| Not-for-profit Organizations | 88 | 17.8% |
| Local Government Employees | 56 | 11.4% |
| State Government Employees | 10 | 2.0% |
| Federal Government Employees | 0 | 0.0% |
| Unpaid Family Workers | 0 | 0.0% |
| Total | 493 | 100.0% |
Employment Status by Age in Harmony
According to the labor force statistics for Harmony, out of the total population over 16 years of age (900), 57.7% or 519 individuals are in the labor force, with 4.0% or 21 of them unemployed. The age group with the highest labor force participation rate is 25 to 29 years, with 100.0% or 70 individuals in the labor force. Within the labor force, the 20 to 24 years age range has the highest percentage of unemployed individuals, with 33.3% or 12 of them being unemployed.
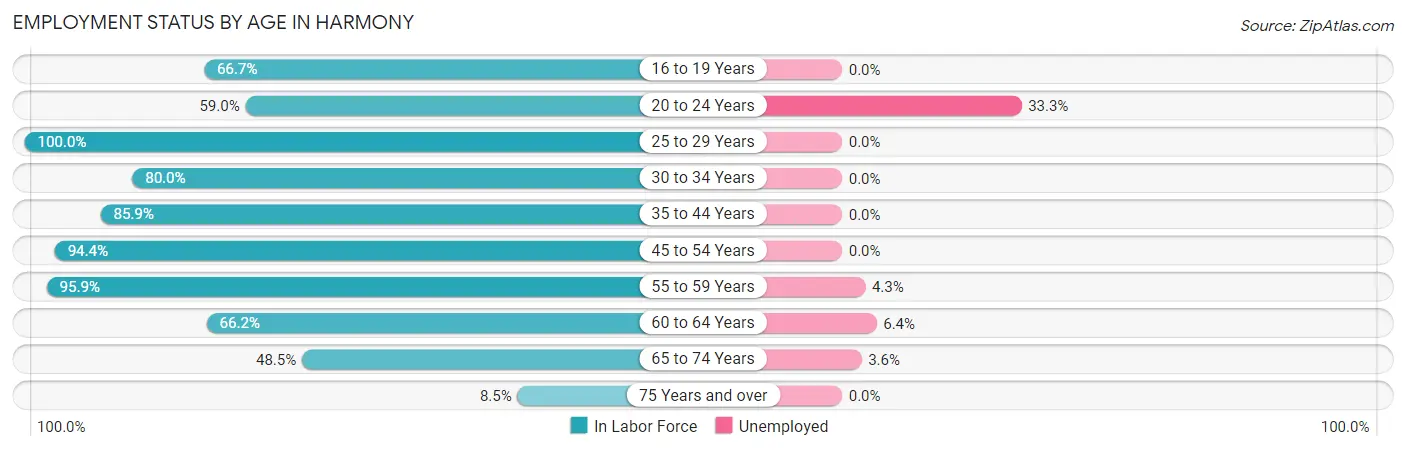
| Age Bracket | In Labor Force | Unemployed |
| 16 to 19 Years | 8 (66.7%) | 0 (0.0%) |
| 20 to 24 Years | 36 (59.0%) | 12 (33.3%) |
| 25 to 29 Years | 70 (100.0%) | 0 (0.0%) |
| 30 to 34 Years | 28 (80.0%) | 0 (0.0%) |
| 35 to 44 Years | 55 (85.9%) | 0 (0.0%) |
| 45 to 54 Years | 102 (94.4%) | 0 (0.0%) |
| 55 to 59 Years | 70 (95.9%) | 3 (4.3%) |
| 60 to 64 Years | 47 (66.2%) | 3 (6.4%) |
| 65 to 74 Years | 83 (48.5%) | 3 (3.6%) |
| 75 Years and over | 20 (8.5%) | 0 (0.0%) |
| Total | 519 (57.7%) | 21 (4.0%) |
Employment Status by Educational Attainment in Harmony
According to labor force statistics for Harmony, 88.4% of individuals (372) out of the total population between 25 and 64 years of age (421) are in the labor force, with 1.6% or 6 of them being unemployed. The group with the highest labor force participation rate are those with the educational attainment of less than high school, with 100.0% or 22 individuals in the labor force. Within the labor force, individuals with less than high school education have the highest percentage of unemployment, with 13.6% or 3 of them being unemployed.
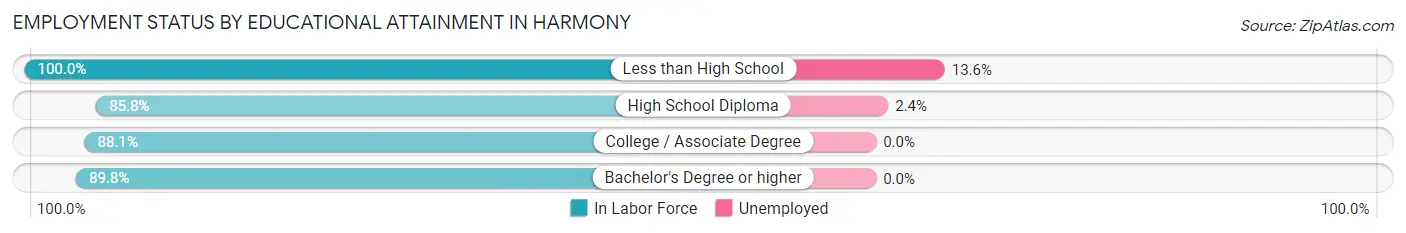
| Educational Attainment | In Labor Force | Unemployed |
| Less than High School | 22 (100.0%) | 3 (13.6%) |
| High School Diploma | 127 (85.8%) | 4 (2.4%) |
| College / Associate Degree | 126 (88.1%) | 0 (0.0%) |
| Bachelor's Degree or higher | 97 (89.8%) | 0 (0.0%) |
| Total | 372 (88.4%) | 7 (1.6%) |
Employment Occupations by Sex in Harmony
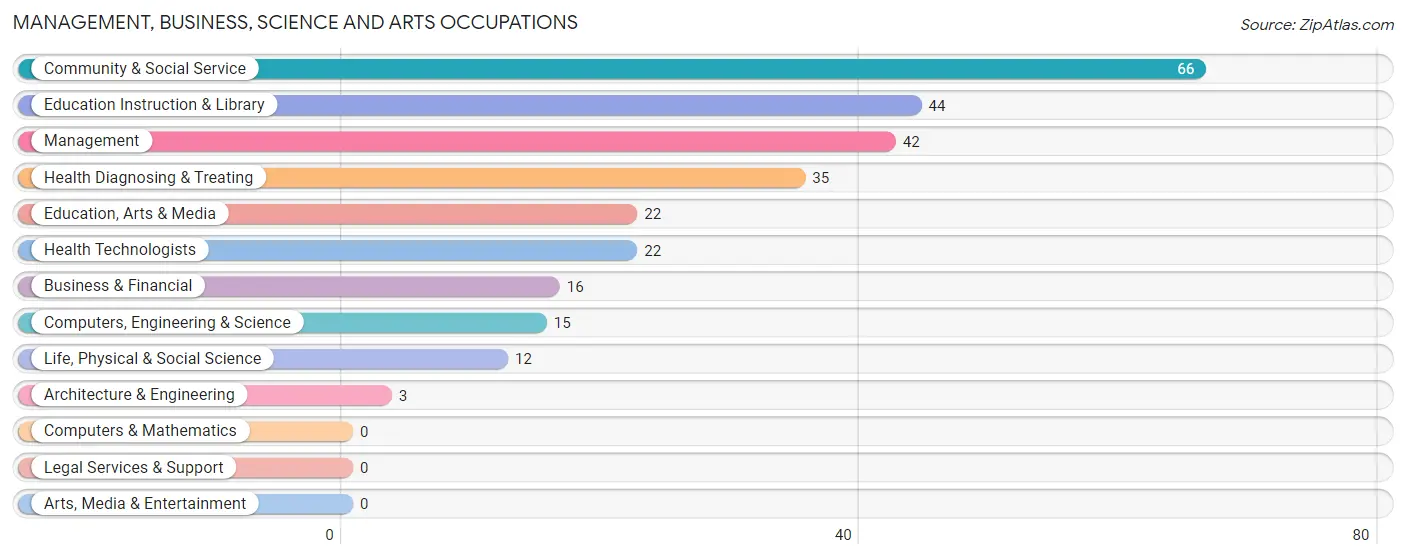
Management, Business, Science and Arts Occupations
The most common Management, Business, Science and Arts occupations in Harmony are Community & Social Service (66 | 13.3%), Education Instruction & Library (44 | 8.8%), Management (42 | 8.4%), Health Diagnosing & Treating (35 | 7.0%), and Education, Arts & Media (22 | 4.4%).
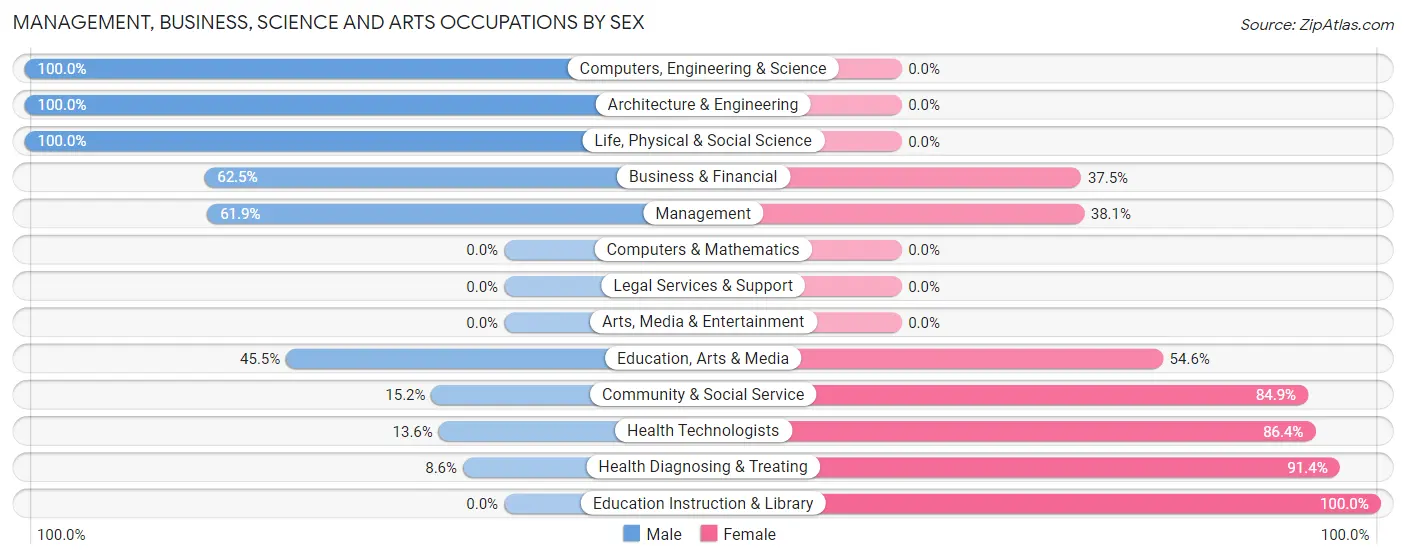
Management, Business, Science and Arts Occupations by Sex
Within the Management, Business, Science and Arts occupations in Harmony, the most male-oriented occupations are Computers, Engineering & Science (100.0%), Architecture & Engineering (100.0%), and Life, Physical & Social Science (100.0%), while the most female-oriented occupations are Education Instruction & Library (100.0%), Health Diagnosing & Treating (91.4%), and Health Technologists (86.4%).
| Occupation | Male | Female |
| Management | 26 (61.9%) | 16 (38.1%) |
| Business & Financial | 10 (62.5%) | 6 (37.5%) |
| Computers, Engineering & Science | 15 (100.0%) | 0 (0.0%) |
| Computers & Mathematics | 0 (0.0%) | 0 (0.0%) |
| Architecture & Engineering | 3 (100.0%) | 0 (0.0%) |
| Life, Physical & Social Science | 12 (100.0%) | 0 (0.0%) |
| Community & Social Service | 10 (15.1%) | 56 (84.9%) |
| Education, Arts & Media | 10 (45.5%) | 12 (54.5%) |
| Legal Services & Support | 0 (0.0%) | 0 (0.0%) |
| Education Instruction & Library | 0 (0.0%) | 44 (100.0%) |
| Arts, Media & Entertainment | 0 (0.0%) | 0 (0.0%) |
| Health Diagnosing & Treating | 3 (8.6%) | 32 (91.4%) |
| Health Technologists | 3 (13.6%) | 19 (86.4%) |
| Total (Category) | 64 (36.8%) | 110 (63.2%) |
| Total (Overall) | 272 (54.6%) | 226 (45.4%) |
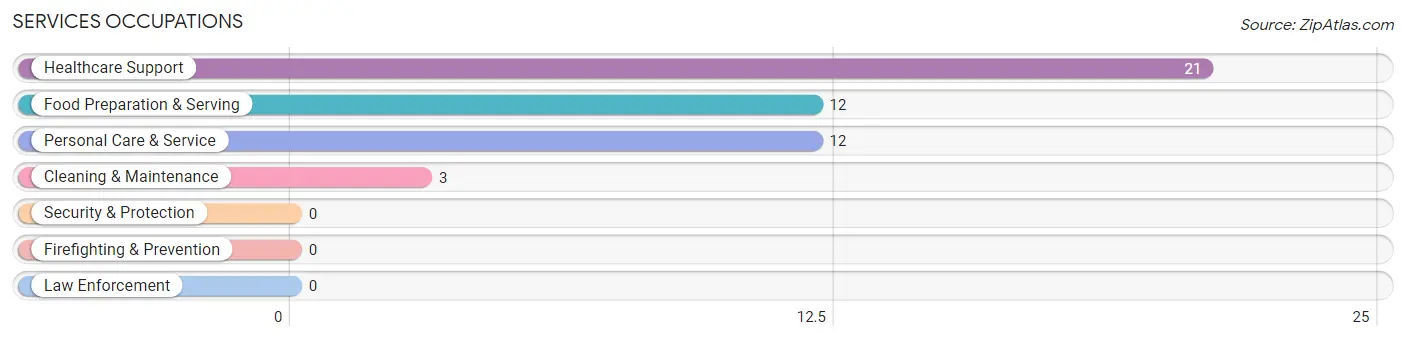
Services Occupations
The most common Services occupations in Harmony are Healthcare Support (21 | 4.2%), Food Preparation & Serving (12 | 2.4%), Personal Care & Service (12 | 2.4%), and Cleaning & Maintenance (3 | 0.6%).
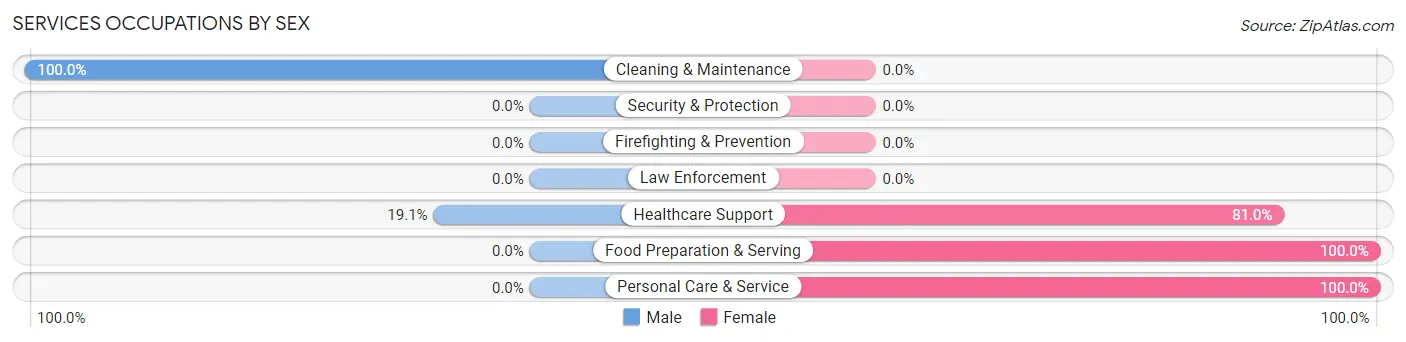
Services Occupations by Sex
Within the Services occupations in Harmony, the most male-oriented occupations are Cleaning & Maintenance (100.0%), and Healthcare Support (19.1%), while the most female-oriented occupations are Food Preparation & Serving (100.0%), Personal Care & Service (100.0%), and Healthcare Support (80.9%).
| Occupation | Male | Female |
| Healthcare Support | 4 (19.1%) | 17 (80.9%) |
| Security & Protection | 0 (0.0%) | 0 (0.0%) |
| Firefighting & Prevention | 0 (0.0%) | 0 (0.0%) |
| Law Enforcement | 0 (0.0%) | 0 (0.0%) |
| Food Preparation & Serving | 0 (0.0%) | 12 (100.0%) |
| Cleaning & Maintenance | 3 (100.0%) | 0 (0.0%) |
| Personal Care & Service | 0 (0.0%) | 12 (100.0%) |
| Total (Category) | 7 (14.6%) | 41 (85.4%) |
| Total (Overall) | 272 (54.6%) | 226 (45.4%) |
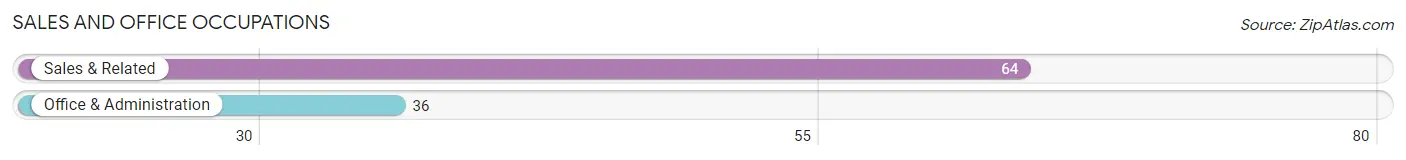
Sales and Office Occupations
The most common Sales and Office occupations in Harmony are Sales & Related (64 | 12.9%), and Office & Administration (36 | 7.2%).
Sales and Office Occupations by Sex
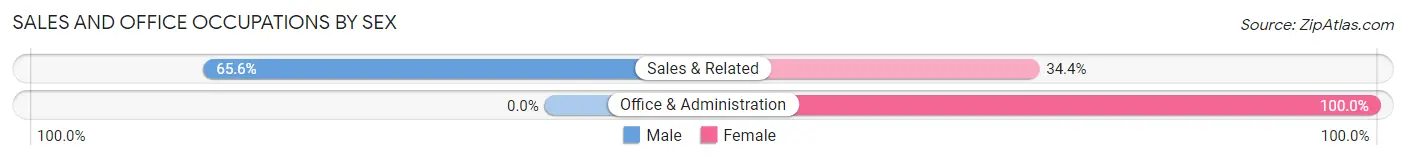
| Occupation | Male | Female |
| Sales & Related | 42 (65.6%) | 22 (34.4%) |
| Office & Administration | 0 (0.0%) | 36 (100.0%) |
| Total (Category) | 42 (42.0%) | 58 (58.0%) |
| Total (Overall) | 272 (54.6%) | 226 (45.4%) |
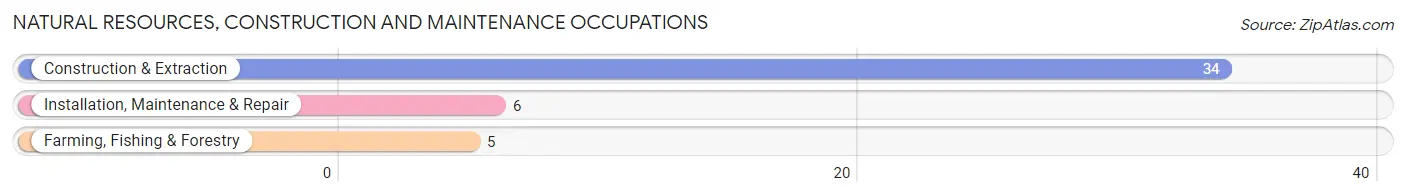
Natural Resources, Construction and Maintenance Occupations
The most common Natural Resources, Construction and Maintenance occupations in Harmony are Construction & Extraction (34 | 6.8%), Installation, Maintenance & Repair (6 | 1.2%), and Farming, Fishing & Forestry (5 | 1.0%).
Natural Resources, Construction and Maintenance Occupations by Sex
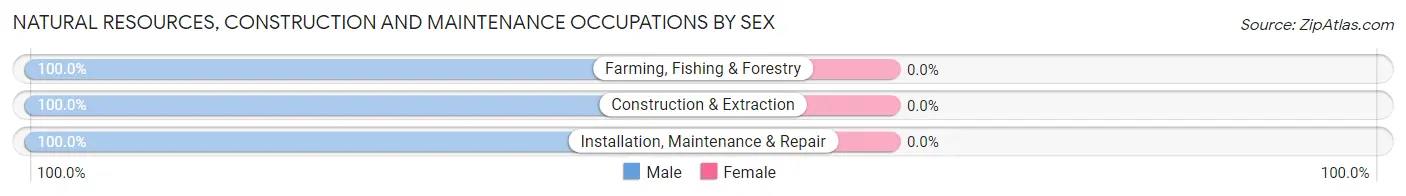
| Occupation | Male | Female |
| Farming, Fishing & Forestry | 5 (100.0%) | 0 (0.0%) |
| Construction & Extraction | 34 (100.0%) | 0 (0.0%) |
| Installation, Maintenance & Repair | 6 (100.0%) | 0 (0.0%) |
| Total (Category) | 45 (100.0%) | 0 (0.0%) |
| Total (Overall) | 272 (54.6%) | 226 (45.4%) |
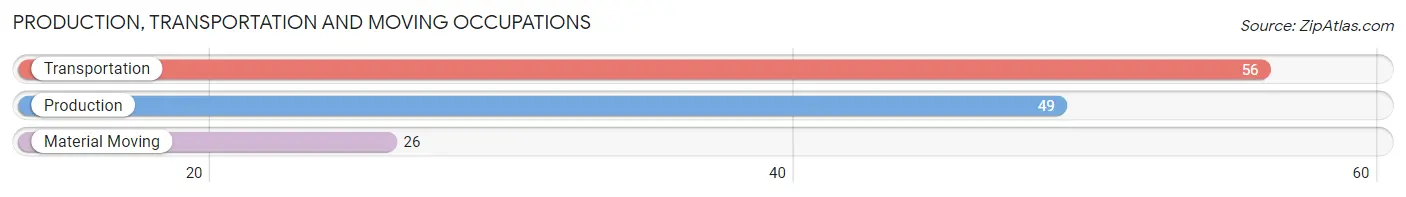
Production, Transportation and Moving Occupations
The most common Production, Transportation and Moving occupations in Harmony are Transportation (56 | 11.2%), Production (49 | 9.8%), and Material Moving (26 | 5.2%).
Production, Transportation and Moving Occupations by Sex
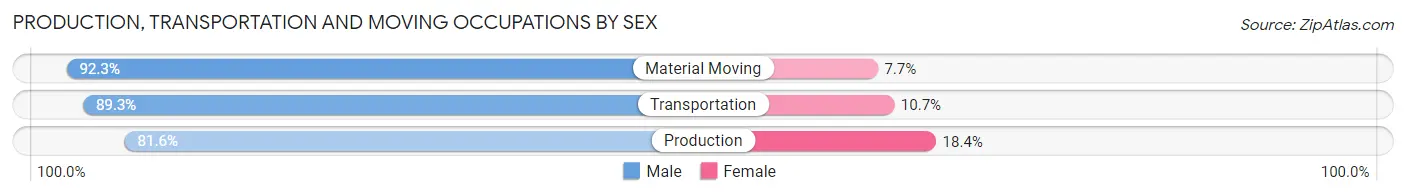
| Occupation | Male | Female |
| Production | 40 (81.6%) | 9 (18.4%) |
| Transportation | 50 (89.3%) | 6 (10.7%) |
| Material Moving | 24 (92.3%) | 2 (7.7%) |
| Total (Category) | 114 (87.0%) | 17 (13.0%) |
| Total (Overall) | 272 (54.6%) | 226 (45.4%) |
Employment Industries by Sex in Harmony
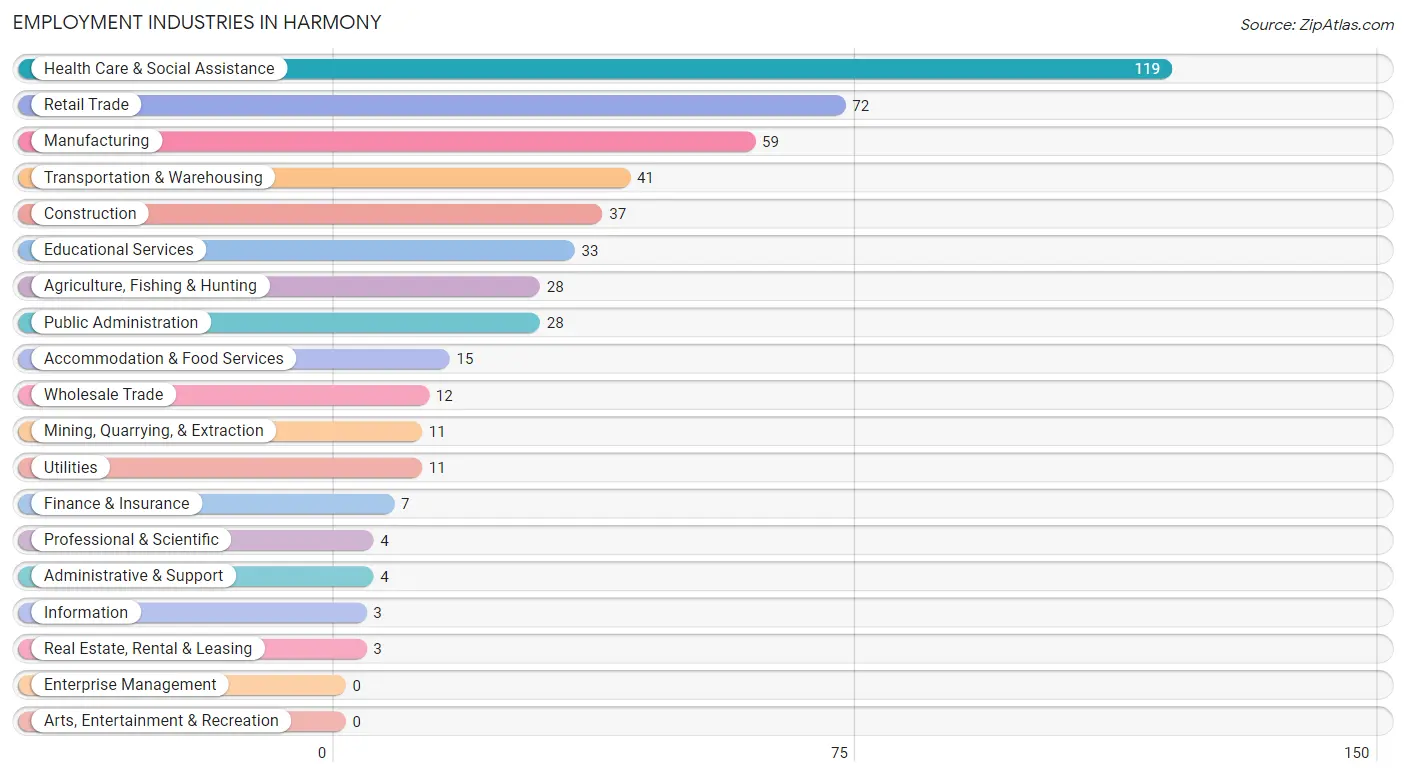
Employment Industries in Harmony
The major employment industries in Harmony include Health Care & Social Assistance (119 | 23.9%), Retail Trade (72 | 14.5%), Manufacturing (59 | 11.8%), Transportation & Warehousing (41 | 8.2%), and Construction (37 | 7.4%).
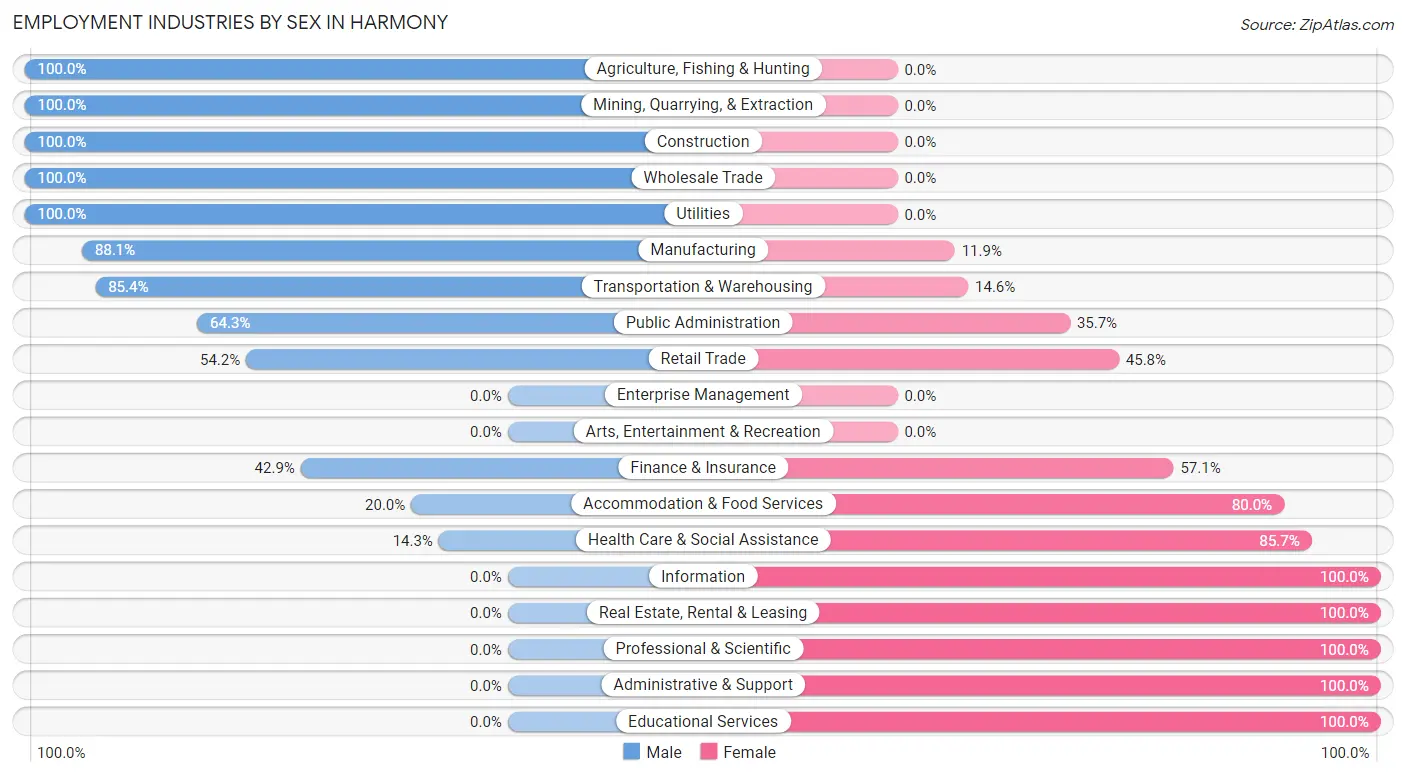
Employment Industries by Sex in Harmony
The Harmony industries that see more men than women are Agriculture, Fishing & Hunting (100.0%), Mining, Quarrying, & Extraction (100.0%), and Construction (100.0%), whereas the industries that tend to have a higher number of women are Information (100.0%), Real Estate, Rental & Leasing (100.0%), and Professional & Scientific (100.0%).
| Industry | Male | Female |
| Agriculture, Fishing & Hunting | 28 (100.0%) | 0 (0.0%) |
| Mining, Quarrying, & Extraction | 11 (100.0%) | 0 (0.0%) |
| Construction | 37 (100.0%) | 0 (0.0%) |
| Manufacturing | 52 (88.1%) | 7 (11.9%) |
| Wholesale Trade | 12 (100.0%) | 0 (0.0%) |
| Retail Trade | 39 (54.2%) | 33 (45.8%) |
| Transportation & Warehousing | 35 (85.4%) | 6 (14.6%) |
| Utilities | 11 (100.0%) | 0 (0.0%) |
| Information | 0 (0.0%) | 3 (100.0%) |
| Finance & Insurance | 3 (42.9%) | 4 (57.1%) |
| Real Estate, Rental & Leasing | 0 (0.0%) | 3 (100.0%) |
| Professional & Scientific | 0 (0.0%) | 4 (100.0%) |
| Enterprise Management | 0 (0.0%) | 0 (0.0%) |
| Administrative & Support | 0 (0.0%) | 4 (100.0%) |
| Educational Services | 0 (0.0%) | 33 (100.0%) |
| Health Care & Social Assistance | 17 (14.3%) | 102 (85.7%) |
| Arts, Entertainment & Recreation | 0 (0.0%) | 0 (0.0%) |
| Accommodation & Food Services | 3 (20.0%) | 12 (80.0%) |
| Public Administration | 18 (64.3%) | 10 (35.7%) |
| Total | 272 (54.6%) | 226 (45.4%) |
Education in Harmony
School Enrollment in Harmony
The most common levels of schooling among the 124 students in Harmony are middle school (48 | 38.7%), elementary school (31 | 25.0%), and high school (22 | 17.7%).
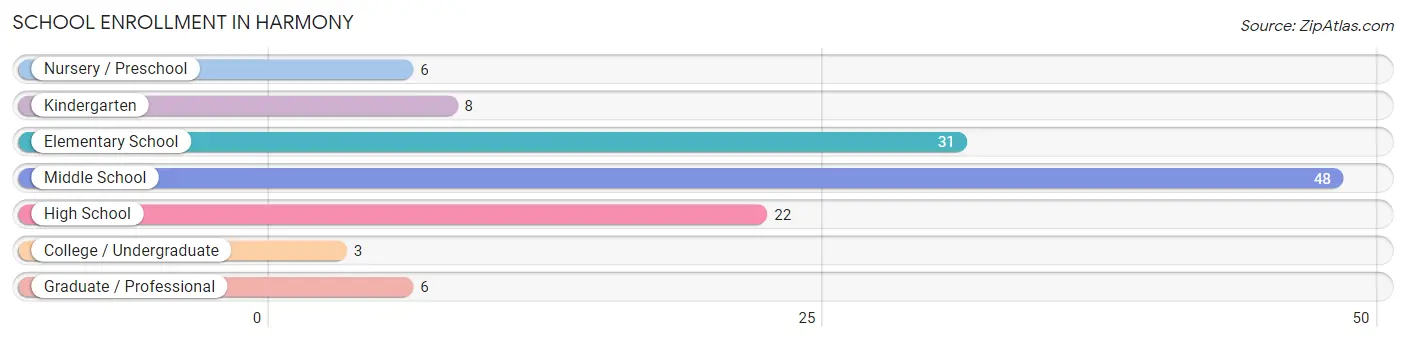
| School Level | # Students | % Students |
| Nursery / Preschool | 6 | 4.8% |
| Kindergarten | 8 | 6.5% |
| Elementary School | 31 | 25.0% |
| Middle School | 48 | 38.7% |
| High School | 22 | 17.7% |
| College / Undergraduate | 3 | 2.4% |
| Graduate / Professional | 6 | 4.8% |
| Total | 124 | 100.0% |
School Enrollment by Age by Funding Source in Harmony
Out of a total of 124 students who are enrolled in schools in Harmony, 14 (11.3%) attend a private institution, while the remaining 110 (88.7%) are enrolled in public schools. The age group of 5 to 9 year old has the highest likelihood of being enrolled in private schools, with 9 (28.1% in the age bracket) enrolled. Conversely, the age group of 3 to 4 year olds has the lowest likelihood of being enrolled in a private school, with 6 (100.0% in the age bracket) attending a public institution.
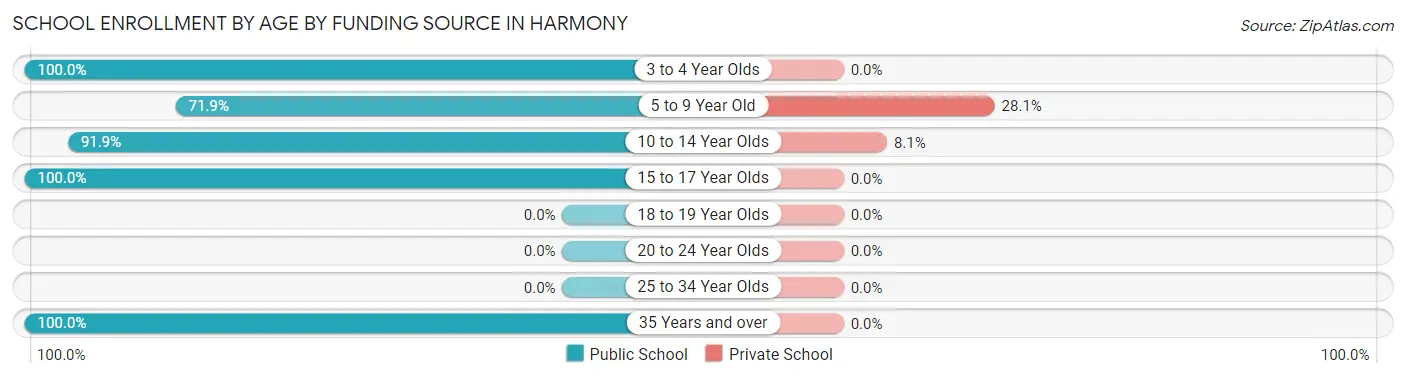
| Age Bracket | Public School | Private School |
| 3 to 4 Year Olds | 6 (100.0%) | 0 (0.0%) |
| 5 to 9 Year Old | 23 (71.9%) | 9 (28.1%) |
| 10 to 14 Year Olds | 57 (91.9%) | 5 (8.1%) |
| 15 to 17 Year Olds | 15 (100.0%) | 0 (0.0%) |
| 18 to 19 Year Olds | 0 (0.0%) | 0 (0.0%) |
| 20 to 24 Year Olds | 0 (0.0%) | 0 (0.0%) |
| 25 to 34 Year Olds | 0 (0.0%) | 0 (0.0%) |
| 35 Years and over | 9 (100.0%) | 0 (0.0%) |
| Total | 110 (88.7%) | 14 (11.3%) |
Educational Attainment by Field of Study in Harmony
Education (50 | 28.4%), business (32 | 18.2%), science & technology (25 | 14.2%), arts & humanities (18 | 10.2%), and bio, nature & agricultural (10 | 5.7%) are the most common fields of study among 176 individuals in Harmony who have obtained a bachelor's degree or higher.
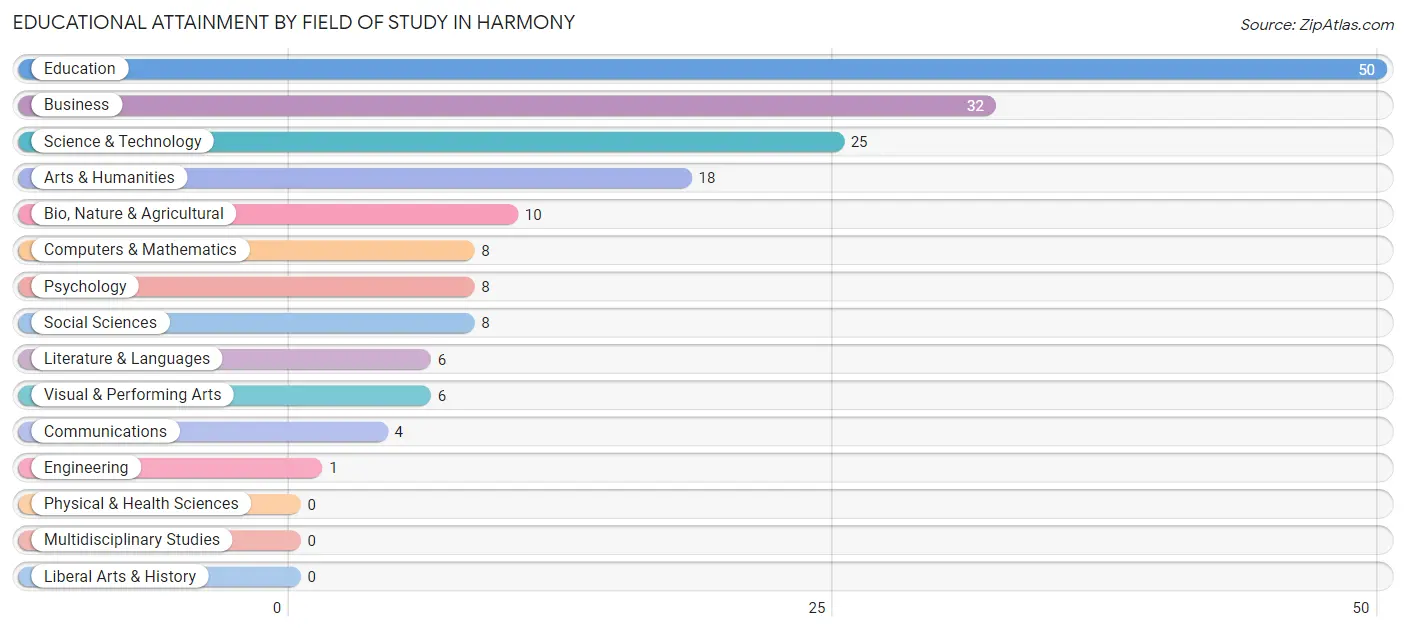
| Field of Study | # Graduates | % Graduates |
| Computers & Mathematics | 8 | 4.5% |
| Bio, Nature & Agricultural | 10 | 5.7% |
| Physical & Health Sciences | 0 | 0.0% |
| Psychology | 8 | 4.5% |
| Social Sciences | 8 | 4.5% |
| Engineering | 1 | 0.6% |
| Multidisciplinary Studies | 0 | 0.0% |
| Science & Technology | 25 | 14.2% |
| Business | 32 | 18.2% |
| Education | 50 | 28.4% |
| Literature & Languages | 6 | 3.4% |
| Liberal Arts & History | 0 | 0.0% |
| Visual & Performing Arts | 6 | 3.4% |
| Communications | 4 | 2.3% |
| Arts & Humanities | 18 | 10.2% |
| Total | 176 | 100.0% |
Transportation & Commute in Harmony
Vehicle Availability by Sex in Harmony
The most prevalent vehicle ownership categories in Harmony are males with 2 vehicles (113, accounting for 41.5%) and females with 2 vehicles (105, making up 51.1%).
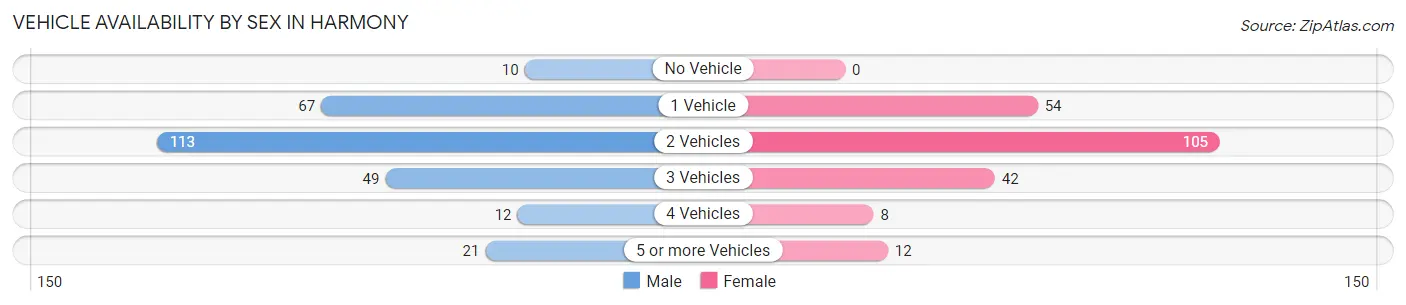
| Vehicles Available | Male | Female |
| No Vehicle | 10 (3.7%) | 0 (0.0%) |
| 1 Vehicle | 67 (24.6%) | 54 (24.4%) |
| 2 Vehicles | 113 (41.5%) | 105 (47.5%) |
| 3 Vehicles | 49 (18.0%) | 42 (19.0%) |
| 4 Vehicles | 12 (4.4%) | 8 (3.6%) |
| 5 or more Vehicles | 21 (7.7%) | 12 (5.4%) |
| Total | 272 (100.0%) | 221 (100.0%) |
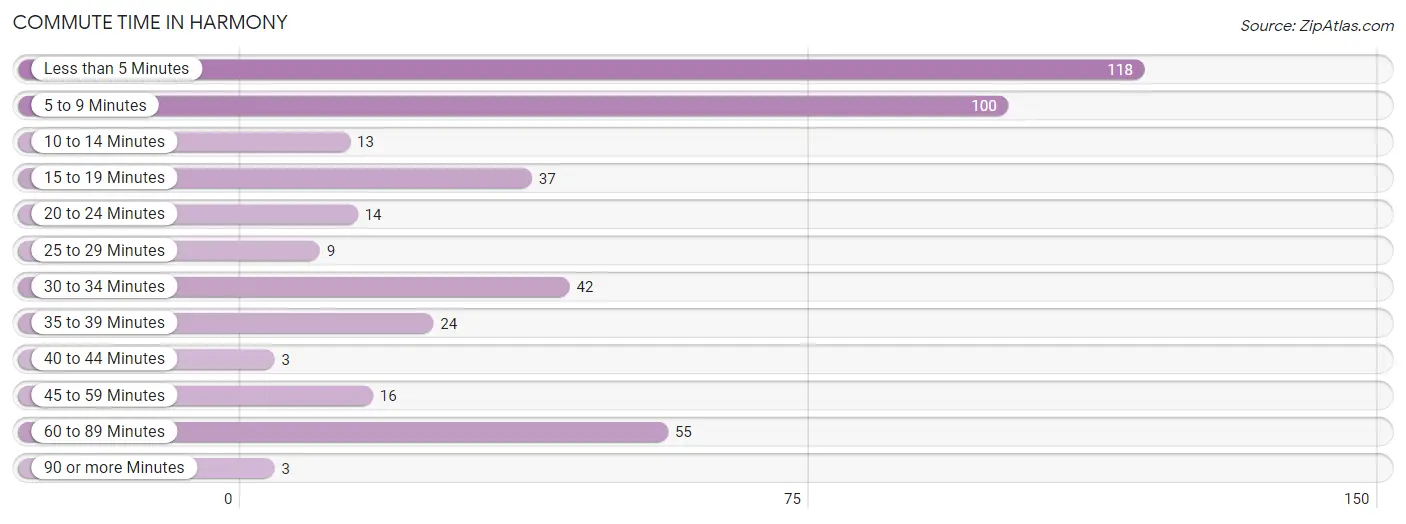
Commute Time in Harmony
The most frequently occuring commute durations in Harmony are less than 5 minutes (118 commuters, 27.2%), 5 to 9 minutes (100 commuters, 23.0%), and 60 to 89 minutes (55 commuters, 12.7%).
| Commute Time | # Commuters | % Commuters |
| Less than 5 Minutes | 118 | 27.2% |
| 5 to 9 Minutes | 100 | 23.0% |
| 10 to 14 Minutes | 13 | 3.0% |
| 15 to 19 Minutes | 37 | 8.5% |
| 20 to 24 Minutes | 14 | 3.2% |
| 25 to 29 Minutes | 9 | 2.1% |
| 30 to 34 Minutes | 42 | 9.7% |
| 35 to 39 Minutes | 24 | 5.5% |
| 40 to 44 Minutes | 3 | 0.7% |
| 45 to 59 Minutes | 16 | 3.7% |
| 60 to 89 Minutes | 55 | 12.7% |
| 90 or more Minutes | 3 | 0.7% |
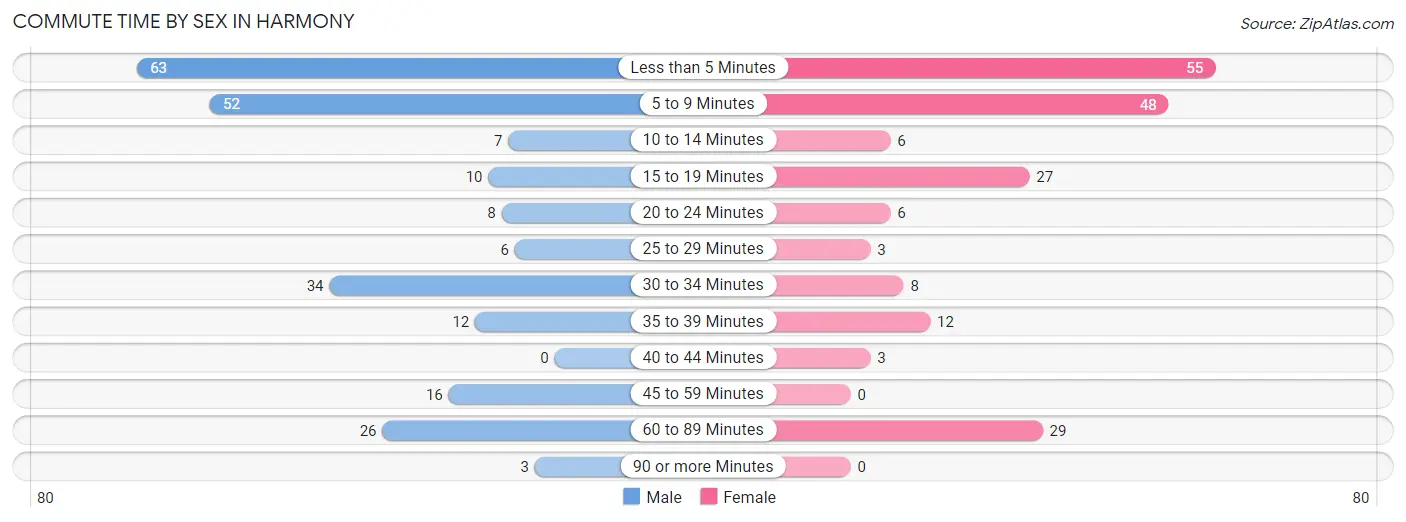
Commute Time by Sex in Harmony
The most common commute times in Harmony are less than 5 minutes (63 commuters, 26.6%) for males and less than 5 minutes (55 commuters, 27.9%) for females.
| Commute Time | Male | Female |
| Less than 5 Minutes | 63 (26.6%) | 55 (27.9%) |
| 5 to 9 Minutes | 52 (21.9%) | 48 (24.4%) |
| 10 to 14 Minutes | 7 (2.9%) | 6 (3.0%) |
| 15 to 19 Minutes | 10 (4.2%) | 27 (13.7%) |
| 20 to 24 Minutes | 8 (3.4%) | 6 (3.0%) |
| 25 to 29 Minutes | 6 (2.5%) | 3 (1.5%) |
| 30 to 34 Minutes | 34 (14.3%) | 8 (4.1%) |
| 35 to 39 Minutes | 12 (5.1%) | 12 (6.1%) |
| 40 to 44 Minutes | 0 (0.0%) | 3 (1.5%) |
| 45 to 59 Minutes | 16 (6.8%) | 0 (0.0%) |
| 60 to 89 Minutes | 26 (11.0%) | 29 (14.7%) |
| 90 or more Minutes | 3 (1.3%) | 0 (0.0%) |
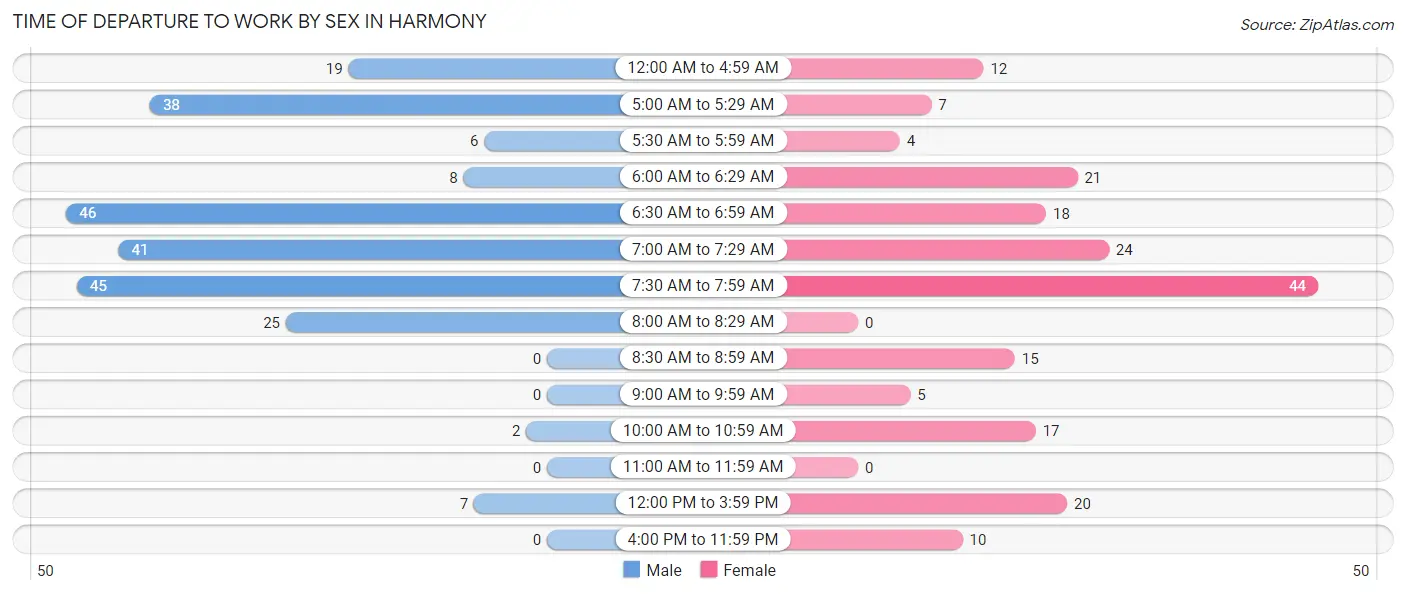
Time of Departure to Work by Sex in Harmony
The most frequent times of departure to work in Harmony are 6:30 AM to 6:59 AM (46, 19.4%) for males and 7:30 AM to 7:59 AM (44, 22.3%) for females.
| Time of Departure | Male | Female |
| 12:00 AM to 4:59 AM | 19 (8.0%) | 12 (6.1%) |
| 5:00 AM to 5:29 AM | 38 (16.0%) | 7 (3.5%) |
| 5:30 AM to 5:59 AM | 6 (2.5%) | 4 (2.0%) |
| 6:00 AM to 6:29 AM | 8 (3.4%) | 21 (10.7%) |
| 6:30 AM to 6:59 AM | 46 (19.4%) | 18 (9.1%) |
| 7:00 AM to 7:29 AM | 41 (17.3%) | 24 (12.2%) |
| 7:30 AM to 7:59 AM | 45 (19.0%) | 44 (22.3%) |
| 8:00 AM to 8:29 AM | 25 (10.5%) | 0 (0.0%) |
| 8:30 AM to 8:59 AM | 0 (0.0%) | 15 (7.6%) |
| 9:00 AM to 9:59 AM | 0 (0.0%) | 5 (2.5%) |
| 10:00 AM to 10:59 AM | 2 (0.8%) | 17 (8.6%) |
| 11:00 AM to 11:59 AM | 0 (0.0%) | 0 (0.0%) |
| 12:00 PM to 3:59 PM | 7 (2.9%) | 20 (10.2%) |
| 4:00 PM to 11:59 PM | 0 (0.0%) | 10 (5.1%) |
| Total | 237 (100.0%) | 197 (100.0%) |
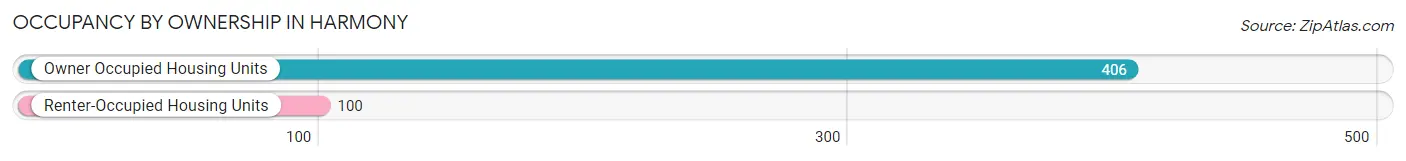
Housing Occupancy in Harmony
Occupancy by Ownership in Harmony
Of the total 506 dwellings in Harmony, owner-occupied units account for 406 (80.2%), while renter-occupied units make up 100 (19.8%).
| Occupancy | # Housing Units | % Housing Units |
| Owner Occupied Housing Units | 406 | 80.2% |
| Renter-Occupied Housing Units | 100 | 19.8% |
| Total Occupied Housing Units | 506 | 100.0% |
Occupancy by Household Size in Harmony
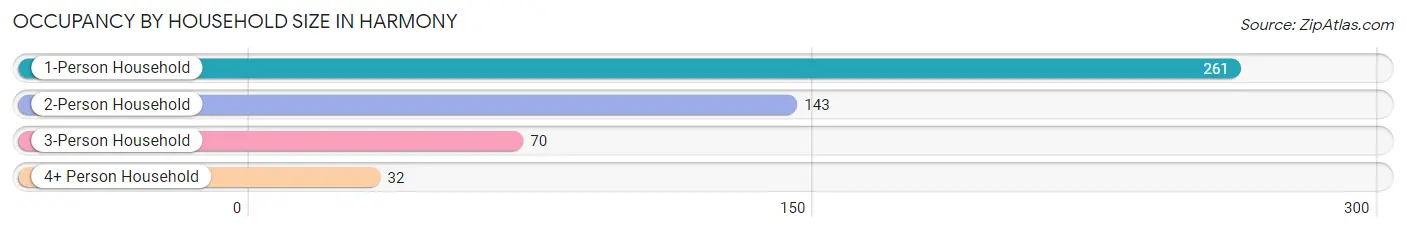
| Household Size | # Housing Units | % Housing Units |
| 1-Person Household | 261 | 51.6% |
| 2-Person Household | 143 | 28.3% |
| 3-Person Household | 70 | 13.8% |
| 4+ Person Household | 32 | 6.3% |
| Total Housing Units | 506 | 100.0% |
Occupancy by Ownership by Household Size in Harmony
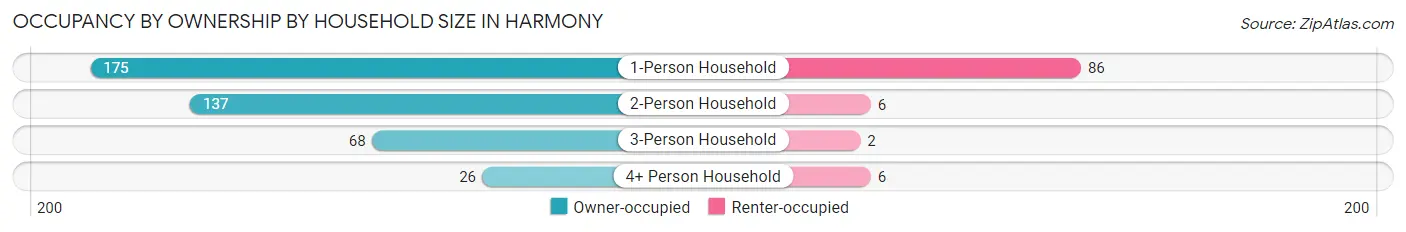
| Household Size | Owner-occupied | Renter-occupied |
| 1-Person Household | 175 (67.0%) | 86 (33.0%) |
| 2-Person Household | 137 (95.8%) | 6 (4.2%) |
| 3-Person Household | 68 (97.1%) | 2 (2.9%) |
| 4+ Person Household | 26 (81.2%) | 6 (18.8%) |
| Total Housing Units | 406 (80.2%) | 100 (19.8%) |
Occupancy by Educational Attainment in Harmony
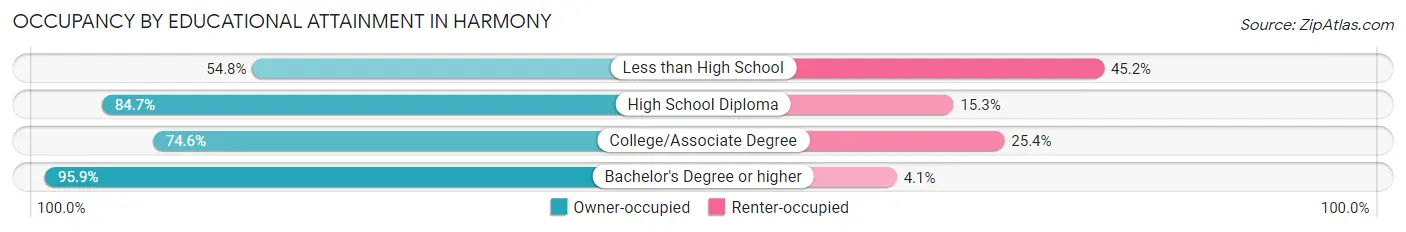
| Household Size | Owner-occupied | Renter-occupied |
| Less than High School | 17 (54.8%) | 14 (45.2%) |
| High School Diploma | 116 (84.7%) | 21 (15.3%) |
| College/Associate Degree | 179 (74.6%) | 61 (25.4%) |
| Bachelor's Degree or higher | 94 (95.9%) | 4 (4.1%) |
Occupancy by Age of Householder in Harmony
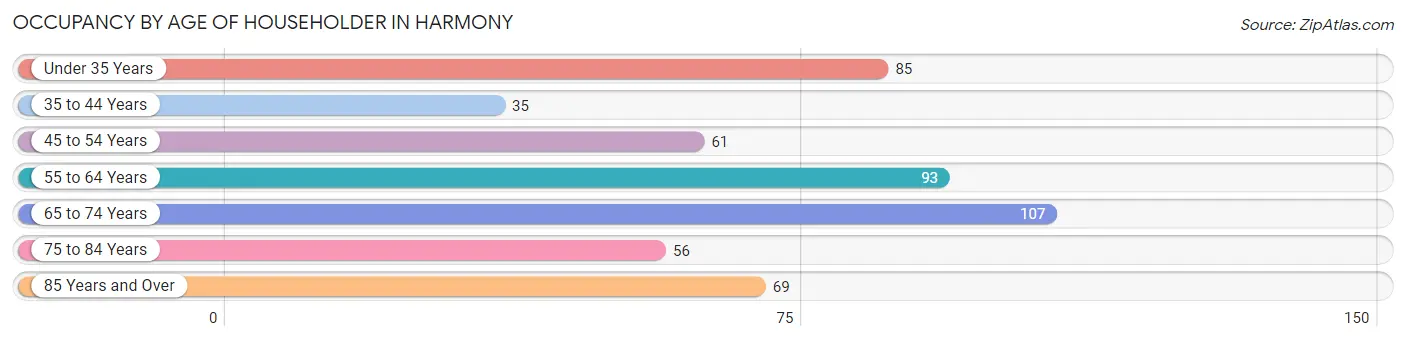
| Age Bracket | # Households | % Households |
| Under 35 Years | 85 | 16.8% |
| 35 to 44 Years | 35 | 6.9% |
| 45 to 54 Years | 61 | 12.1% |
| 55 to 64 Years | 93 | 18.4% |
| 65 to 74 Years | 107 | 21.1% |
| 75 to 84 Years | 56 | 11.1% |
| 85 Years and Over | 69 | 13.6% |
| Total | 506 | 100.0% |
Housing Finances in Harmony
Median Income by Occupancy in Harmony
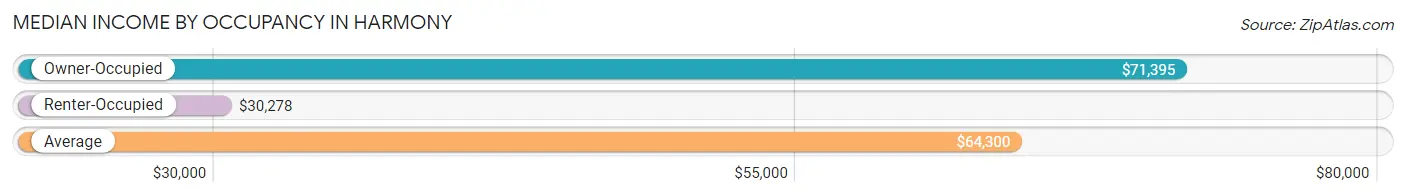
| Occupancy Type | # Households | Median Income |
| Owner-Occupied | 406 (80.2%) | $71,395 |
| Renter-Occupied | 100 (19.8%) | $30,278 |
| Average | 506 (100.0%) | $64,300 |
Occupancy by Householder Income Bracket in Harmony
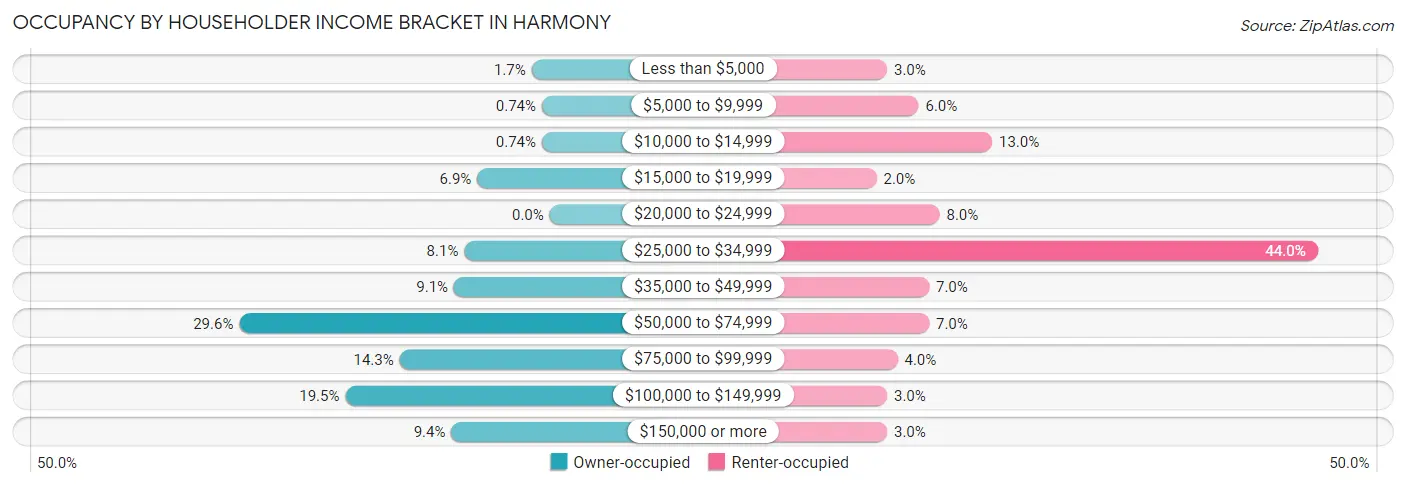
| Income Bracket | Owner-occupied | Renter-occupied |
| Less than $5,000 | 7 (1.7%) | 3 (3.0%) |
| $5,000 to $9,999 | 3 (0.7%) | 6 (6.0%) |
| $10,000 to $14,999 | 3 (0.7%) | 13 (13.0%) |
| $15,000 to $19,999 | 28 (6.9%) | 2 (2.0%) |
| $20,000 to $24,999 | 0 (0.0%) | 8 (8.0%) |
| $25,000 to $34,999 | 33 (8.1%) | 44 (44.0%) |
| $35,000 to $49,999 | 37 (9.1%) | 7 (7.0%) |
| $50,000 to $74,999 | 120 (29.6%) | 7 (7.0%) |
| $75,000 to $99,999 | 58 (14.3%) | 4 (4.0%) |
| $100,000 to $149,999 | 79 (19.5%) | 3 (3.0%) |
| $150,000 or more | 38 (9.4%) | 3 (3.0%) |
| Total | 406 (100.0%) | 100 (100.0%) |
Monthly Housing Cost Tiers in Harmony
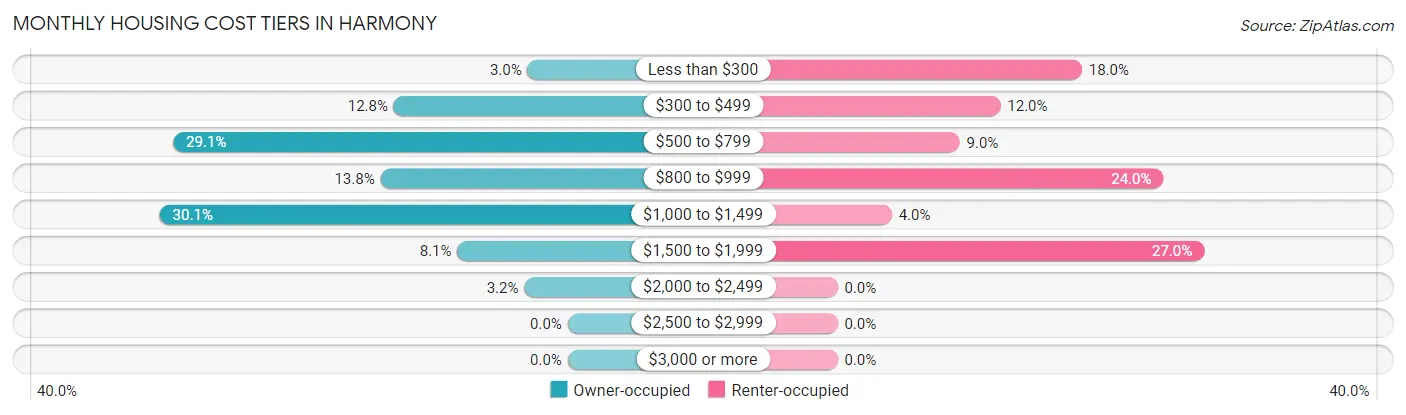
| Monthly Cost | Owner-occupied | Renter-occupied |
| Less than $300 | 12 (3.0%) | 18 (18.0%) |
| $300 to $499 | 52 (12.8%) | 12 (12.0%) |
| $500 to $799 | 118 (29.1%) | 9 (9.0%) |
| $800 to $999 | 56 (13.8%) | 24 (24.0%) |
| $1,000 to $1,499 | 122 (30.0%) | 4 (4.0%) |
| $1,500 to $1,999 | 33 (8.1%) | 27 (27.0%) |
| $2,000 to $2,499 | 13 (3.2%) | 0 (0.0%) |
| $2,500 to $2,999 | 0 (0.0%) | 0 (0.0%) |
| $3,000 or more | 0 (0.0%) | 0 (0.0%) |
| Total | 406 (100.0%) | 100 (100.0%) |
Physical Housing Characteristics in Harmony
Housing Structures in Harmony
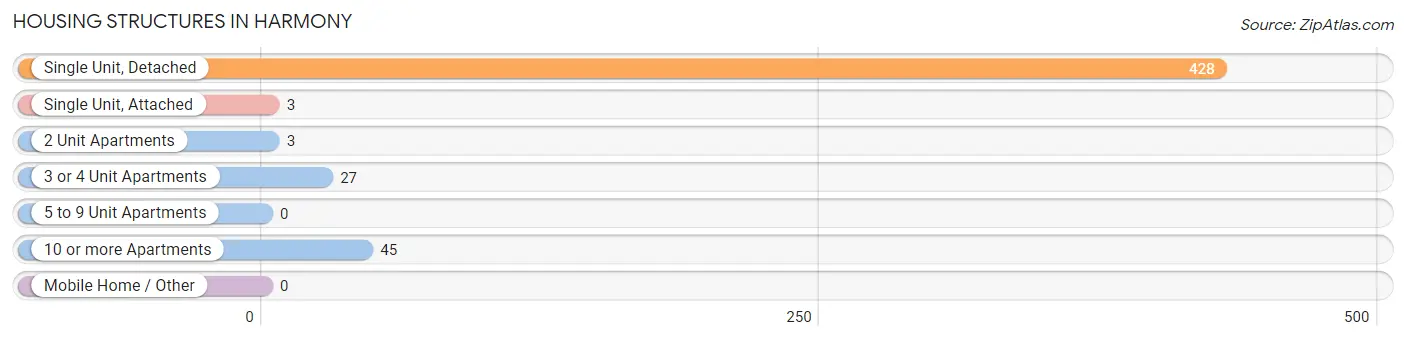
| Structure Type | # Housing Units | % Housing Units |
| Single Unit, Detached | 428 | 84.6% |
| Single Unit, Attached | 3 | 0.6% |
| 2 Unit Apartments | 3 | 0.6% |
| 3 or 4 Unit Apartments | 27 | 5.3% |
| 5 to 9 Unit Apartments | 0 | 0.0% |
| 10 or more Apartments | 45 | 8.9% |
| Mobile Home / Other | 0 | 0.0% |
| Total | 506 | 100.0% |
Housing Structures by Occupancy in Harmony
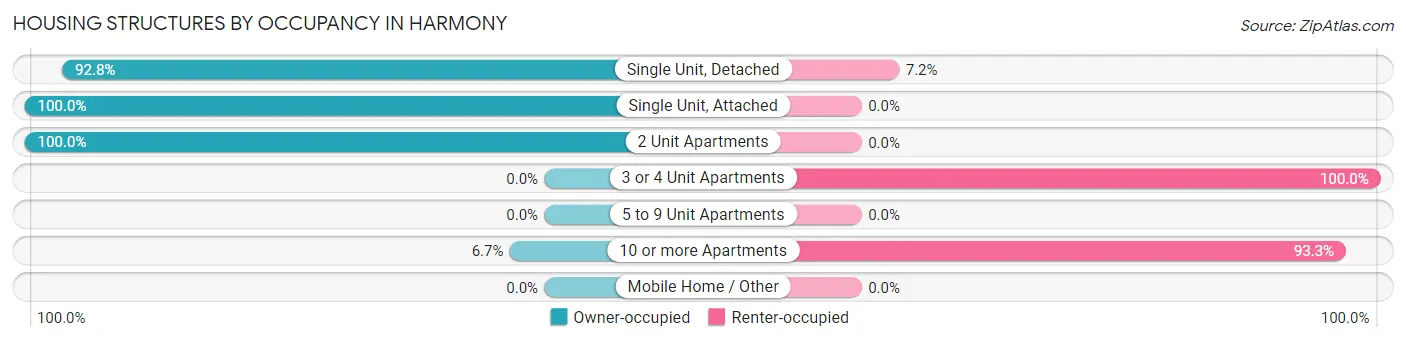
| Structure Type | Owner-occupied | Renter-occupied |
| Single Unit, Detached | 397 (92.8%) | 31 (7.2%) |
| Single Unit, Attached | 3 (100.0%) | 0 (0.0%) |
| 2 Unit Apartments | 3 (100.0%) | 0 (0.0%) |
| 3 or 4 Unit Apartments | 0 (0.0%) | 27 (100.0%) |
| 5 to 9 Unit Apartments | 0 (0.0%) | 0 (0.0%) |
| 10 or more Apartments | 3 (6.7%) | 42 (93.3%) |
| Mobile Home / Other | 0 (0.0%) | 0 (0.0%) |
| Total | 406 (80.2%) | 100 (19.8%) |
Housing Structures by Number of Rooms in Harmony
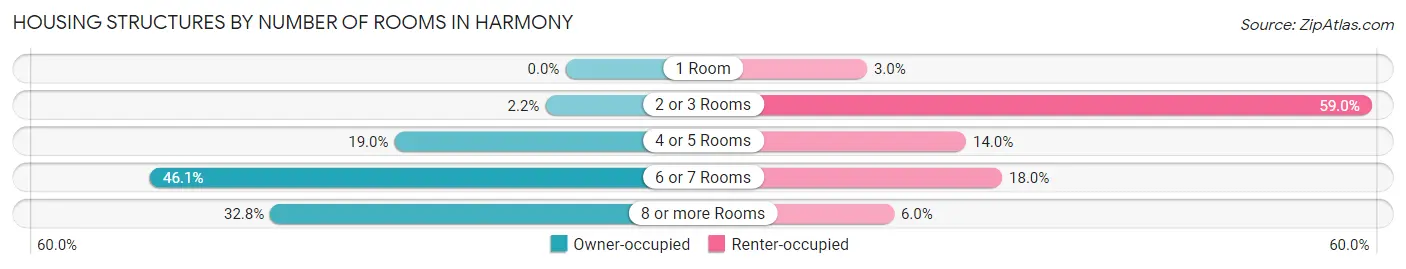
| Number of Rooms | Owner-occupied | Renter-occupied |
| 1 Room | 0 (0.0%) | 3 (3.0%) |
| 2 or 3 Rooms | 9 (2.2%) | 59 (59.0%) |
| 4 or 5 Rooms | 77 (19.0%) | 14 (14.0%) |
| 6 or 7 Rooms | 187 (46.1%) | 18 (18.0%) |
| 8 or more Rooms | 133 (32.8%) | 6 (6.0%) |
| Total | 406 (100.0%) | 100 (100.0%) |
Housing Structure by Heating Type in Harmony
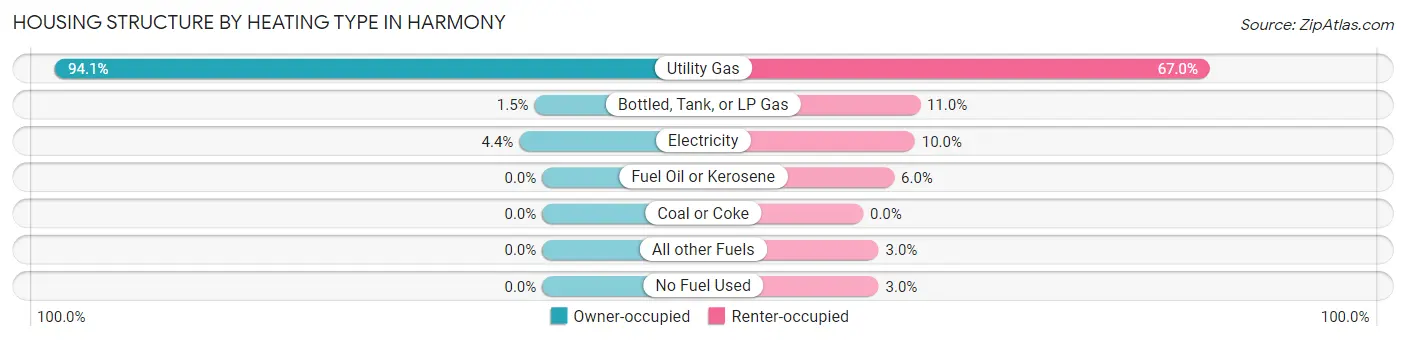
| Heating Type | Owner-occupied | Renter-occupied |
| Utility Gas | 382 (94.1%) | 67 (67.0%) |
| Bottled, Tank, or LP Gas | 6 (1.5%) | 11 (11.0%) |
| Electricity | 18 (4.4%) | 10 (10.0%) |
| Fuel Oil or Kerosene | 0 (0.0%) | 6 (6.0%) |
| Coal or Coke | 0 (0.0%) | 0 (0.0%) |
| All other Fuels | 0 (0.0%) | 3 (3.0%) |
| No Fuel Used | 0 (0.0%) | 3 (3.0%) |
| Total | 406 (100.0%) | 100 (100.0%) |
Household Vehicle Usage in Harmony
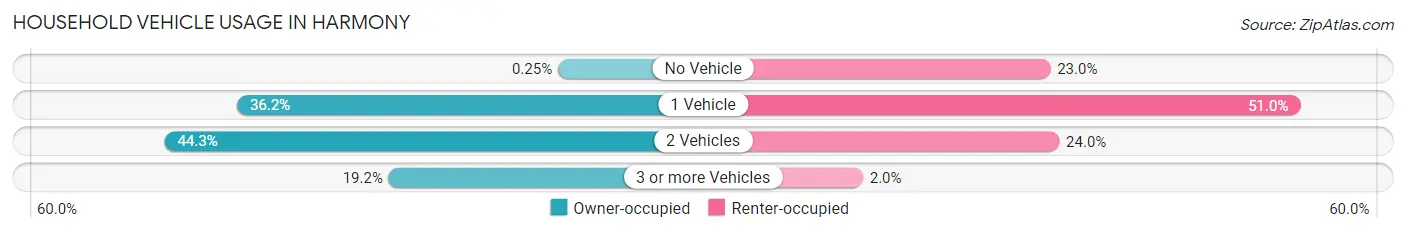
| Vehicles per Household | Owner-occupied | Renter-occupied |
| No Vehicle | 1 (0.3%) | 23 (23.0%) |
| 1 Vehicle | 147 (36.2%) | 51 (51.0%) |
| 2 Vehicles | 180 (44.3%) | 24 (24.0%) |
| 3 or more Vehicles | 78 (19.2%) | 2 (2.0%) |
| Total | 406 (100.0%) | 100 (100.0%) |
Real Estate & Mortgages in Harmony
Real Estate and Mortgage Overview in Harmony
| Characteristic | Without Mortgage | With Mortgage |
| Housing Units | 179 | 227 |
| Median Property Value | $186,700 | $145,800 |
| Median Household Income | $70,785 | $15 |
| Monthly Housing Costs | $588 | $0 |
| Real Estate Taxes | $1,932 | $0 |
Property Value by Mortgage Status in Harmony
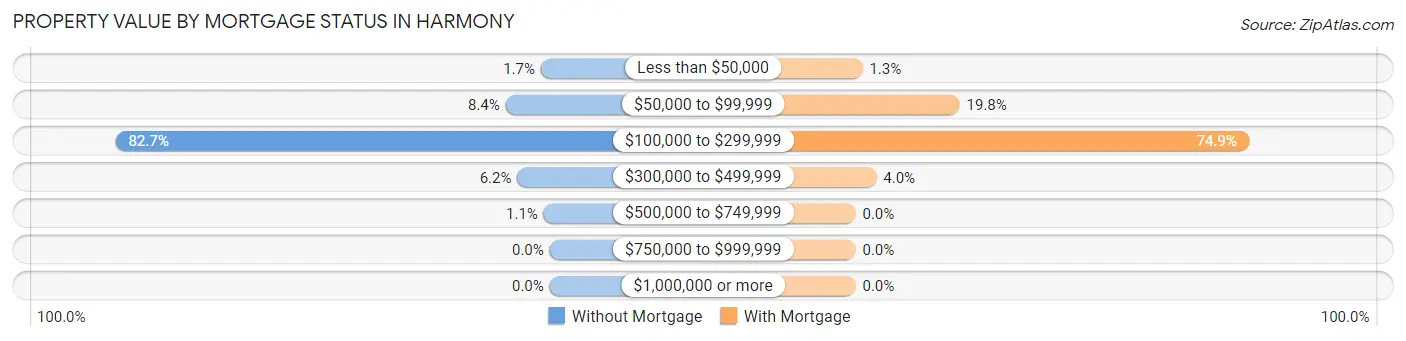
| Property Value | Without Mortgage | With Mortgage |
| Less than $50,000 | 3 (1.7%) | 3 (1.3%) |
| $50,000 to $99,999 | 15 (8.4%) | 45 (19.8%) |
| $100,000 to $299,999 | 148 (82.7%) | 170 (74.9%) |
| $300,000 to $499,999 | 11 (6.1%) | 9 (4.0%) |
| $500,000 to $749,999 | 2 (1.1%) | 0 (0.0%) |
| $750,000 to $999,999 | 0 (0.0%) | 0 (0.0%) |
| $1,000,000 or more | 0 (0.0%) | 0 (0.0%) |
| Total | 179 (100.0%) | 227 (100.0%) |
Household Income by Mortgage Status in Harmony
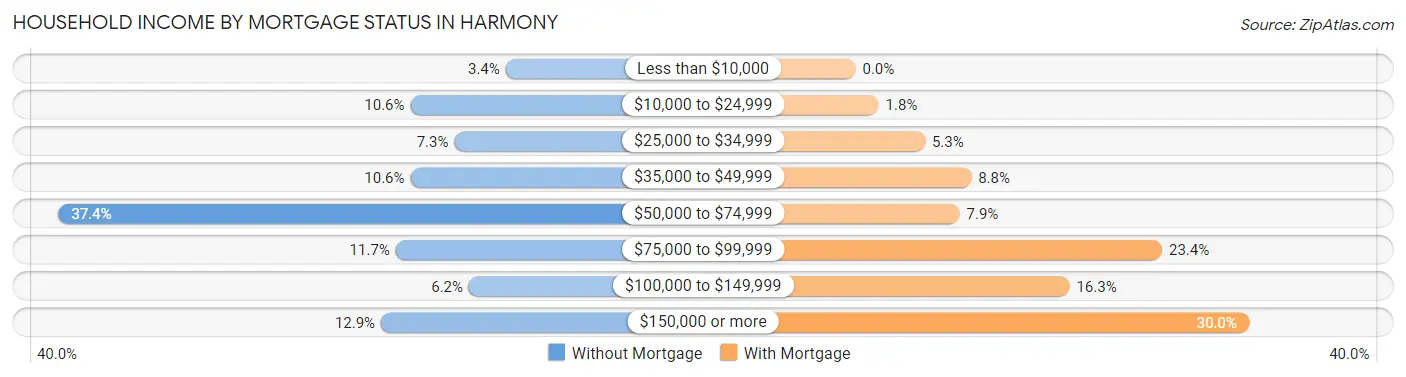
| Household Income | Without Mortgage | With Mortgage |
| Less than $10,000 | 6 (3.4%) | 0 (0.0%) |
| $10,000 to $24,999 | 19 (10.6%) | 4 (1.8%) |
| $25,000 to $34,999 | 13 (7.3%) | 12 (5.3%) |
| $35,000 to $49,999 | 19 (10.6%) | 20 (8.8%) |
| $50,000 to $74,999 | 67 (37.4%) | 18 (7.9%) |
| $75,000 to $99,999 | 21 (11.7%) | 53 (23.4%) |
| $100,000 to $149,999 | 11 (6.1%) | 37 (16.3%) |
| $150,000 or more | 23 (12.9%) | 68 (30.0%) |
| Total | 179 (100.0%) | 227 (100.0%) |
Property Value to Household Income Ratio in Harmony
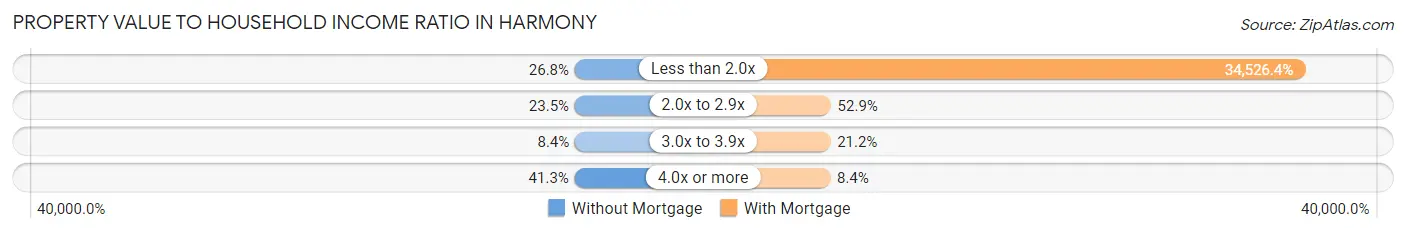
| Value-to-Income Ratio | Without Mortgage | With Mortgage |
| Less than 2.0x | 48 (26.8%) | 78,375 (34,526.4%) |
| 2.0x to 2.9x | 42 (23.5%) | 120 (52.9%) |
| 3.0x to 3.9x | 15 (8.4%) | 48 (21.1%) |
| 4.0x or more | 74 (41.3%) | 19 (8.4%) |
| Total | 179 (100.0%) | 227 (100.0%) |
Real Estate Taxes by Mortgage Status in Harmony
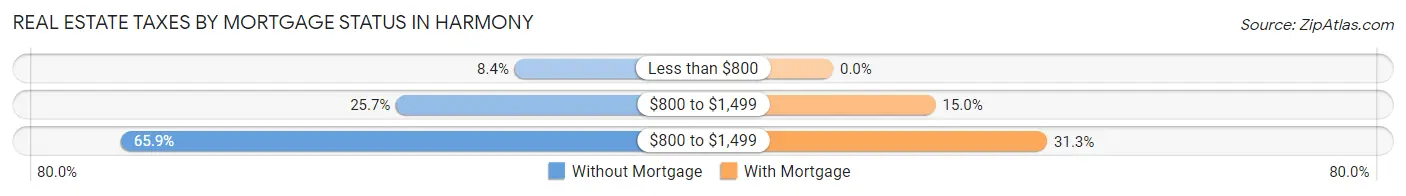
| Property Taxes | Without Mortgage | With Mortgage |
| Less than $800 | 15 (8.4%) | 0 (0.0%) |
| $800 to $1,499 | 46 (25.7%) | 34 (15.0%) |
| $800 to $1,499 | 118 (65.9%) | 71 (31.3%) |
| Total | 179 (100.0%) | 227 (100.0%) |
Health & Disability in Harmony
Health Insurance Coverage by Age in Harmony
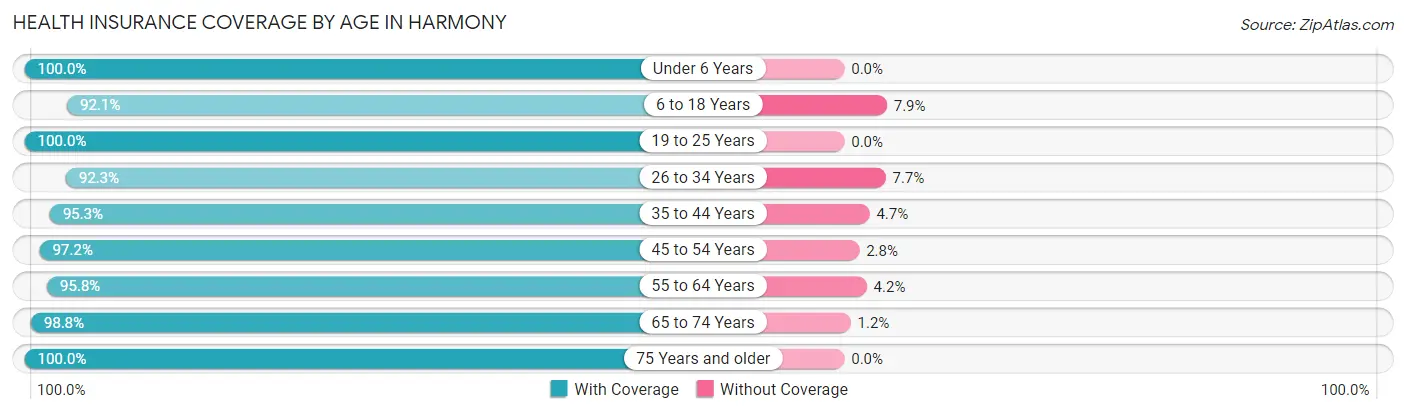
| Age Bracket | With Coverage | Without Coverage |
| Under 6 Years | 25 (100.0%) | 0 (0.0%) |
| 6 to 18 Years | 93 (92.1%) | 8 (7.9%) |
| 19 to 25 Years | 79 (100.0%) | 0 (0.0%) |
| 26 to 34 Years | 84 (92.3%) | 7 (7.7%) |
| 35 to 44 Years | 61 (95.3%) | 3 (4.7%) |
| 45 to 54 Years | 105 (97.2%) | 3 (2.8%) |
| 55 to 64 Years | 138 (95.8%) | 6 (4.2%) |
| 65 to 74 Years | 168 (98.8%) | 2 (1.2%) |
| 75 Years and older | 184 (100.0%) | 0 (0.0%) |
| Total | 937 (97.0%) | 29 (3.0%) |
Health Insurance Coverage by Citizenship Status in Harmony
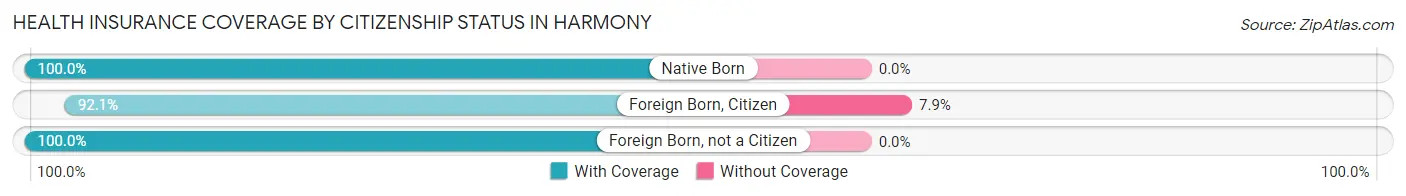
| Citizenship Status | With Coverage | Without Coverage |
| Native Born | 25 (100.0%) | 0 (0.0%) |
| Foreign Born, Citizen | 93 (92.1%) | 8 (7.9%) |
| Foreign Born, not a Citizen | 79 (100.0%) | 0 (0.0%) |
Health Insurance Coverage by Household Income in Harmony
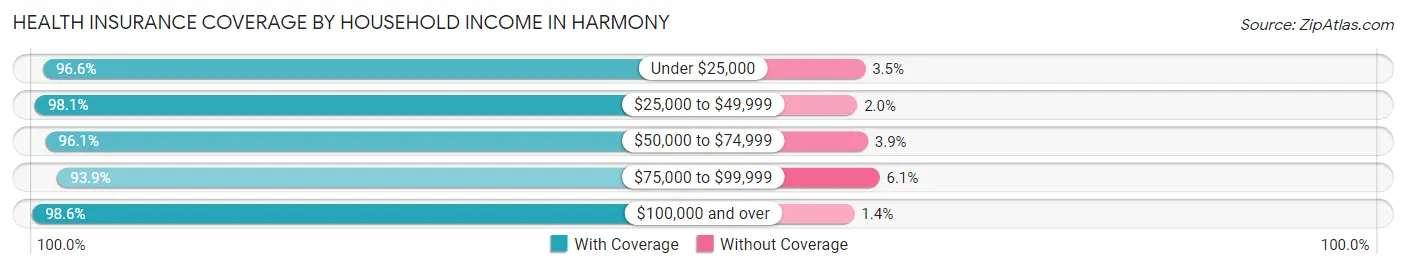
| Household Income | With Coverage | Without Coverage |
| Under $25,000 | 84 (96.6%) | 3 (3.5%) |
| $25,000 to $49,999 | 151 (98.1%) | 3 (1.9%) |
| $50,000 to $74,999 | 195 (96.1%) | 8 (3.9%) |
| $75,000 to $99,999 | 153 (93.9%) | 10 (6.1%) |
| $100,000 and over | 344 (98.6%) | 5 (1.4%) |
Public vs Private Health Insurance Coverage by Age in Harmony
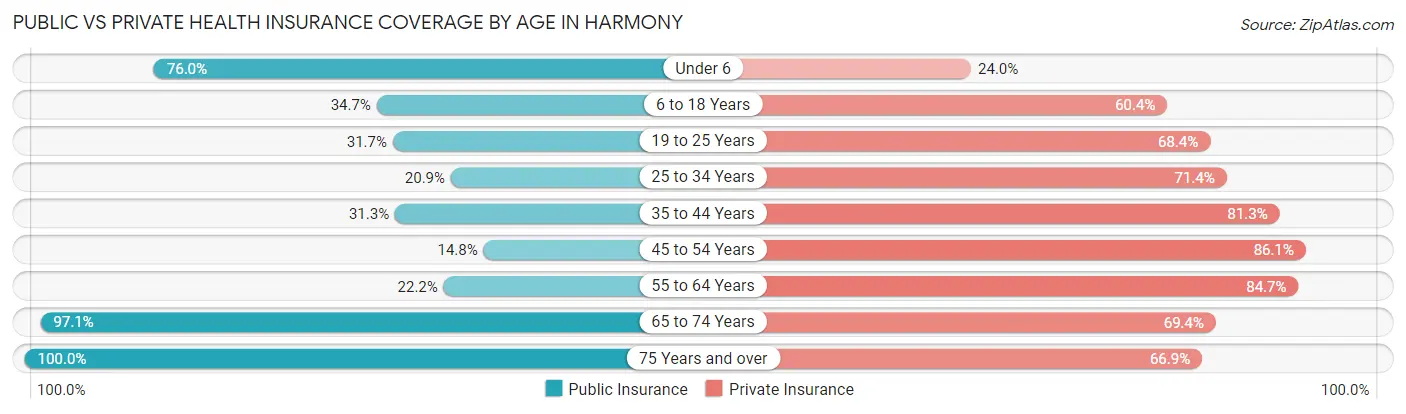
| Age Bracket | Public Insurance | Private Insurance |
| Under 6 | 19 (76.0%) | 6 (24.0%) |
| 6 to 18 Years | 35 (34.6%) | 61 (60.4%) |
| 19 to 25 Years | 25 (31.7%) | 54 (68.3%) |
| 25 to 34 Years | 19 (20.9%) | 65 (71.4%) |
| 35 to 44 Years | 20 (31.2%) | 52 (81.2%) |
| 45 to 54 Years | 16 (14.8%) | 93 (86.1%) |
| 55 to 64 Years | 32 (22.2%) | 122 (84.7%) |
| 65 to 74 Years | 165 (97.1%) | 118 (69.4%) |
| 75 Years and over | 184 (100.0%) | 123 (66.8%) |
| Total | 515 (53.3%) | 694 (71.8%) |
Disability Status by Sex by Age in Harmony
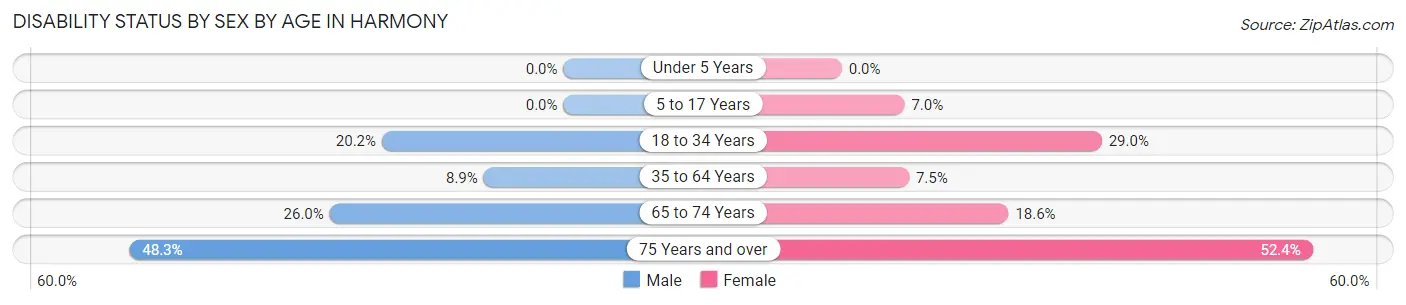
| Age Bracket | Male | Female |
| Under 5 Years | 0 (0.0%) | 0 (0.0%) |
| 5 to 17 Years | 0 (0.0%) | 3 (7.0%) |
| 18 to 34 Years | 19 (20.2%) | 22 (28.9%) |
| 35 to 64 Years | 15 (8.9%) | 11 (7.5%) |
| 65 to 74 Years | 19 (26.0%) | 18 (18.6%) |
| 75 Years and over | 29 (48.3%) | 65 (52.4%) |
Disability Class by Sex by Age in Harmony
Disability Class: Hearing Difficulty
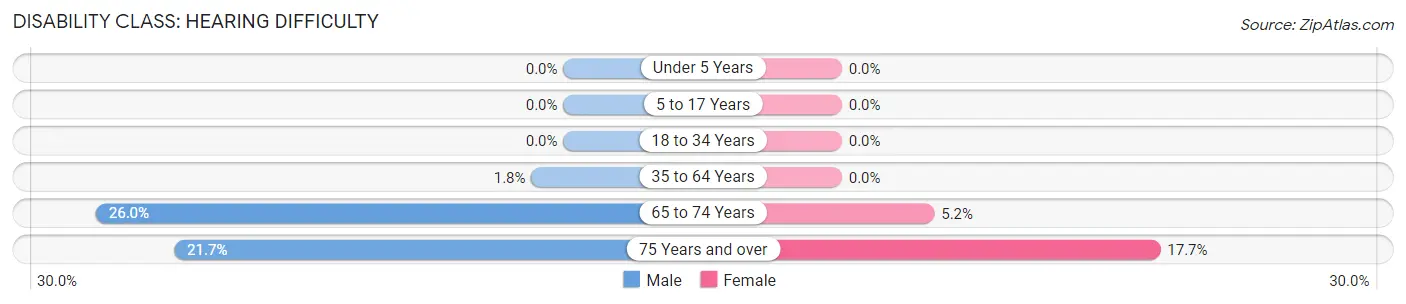
| Age Bracket | Male | Female |
| Under 5 Years | 0 (0.0%) | 0 (0.0%) |
| 5 to 17 Years | 0 (0.0%) | 0 (0.0%) |
| 18 to 34 Years | 0 (0.0%) | 0 (0.0%) |
| 35 to 64 Years | 3 (1.8%) | 0 (0.0%) |
| 65 to 74 Years | 19 (26.0%) | 5 (5.1%) |
| 75 Years and over | 13 (21.7%) | 22 (17.7%) |
Disability Class: Vision Difficulty
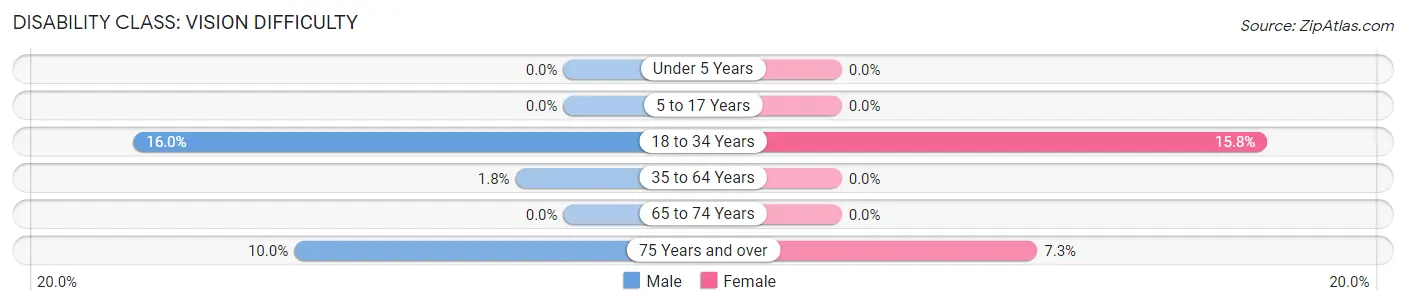
| Age Bracket | Male | Female |
| Under 5 Years | 0 (0.0%) | 0 (0.0%) |
| 5 to 17 Years | 0 (0.0%) | 0 (0.0%) |
| 18 to 34 Years | 15 (16.0%) | 12 (15.8%) |
| 35 to 64 Years | 3 (1.8%) | 0 (0.0%) |
| 65 to 74 Years | 0 (0.0%) | 0 (0.0%) |
| 75 Years and over | 6 (10.0%) | 9 (7.3%) |
Disability Class: Cognitive Difficulty
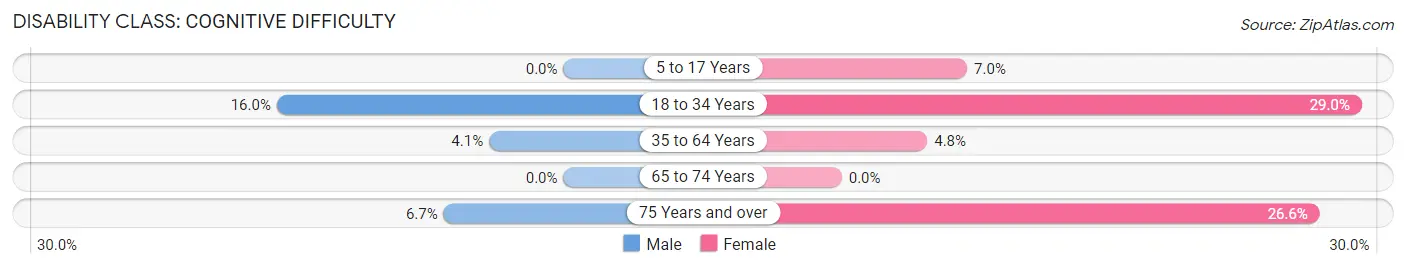
| Age Bracket | Male | Female |
| 5 to 17 Years | 0 (0.0%) | 3 (7.0%) |
| 18 to 34 Years | 15 (16.0%) | 22 (28.9%) |
| 35 to 64 Years | 7 (4.1%) | 7 (4.8%) |
| 65 to 74 Years | 0 (0.0%) | 0 (0.0%) |
| 75 Years and over | 4 (6.7%) | 33 (26.6%) |
Disability Class: Ambulatory Difficulty
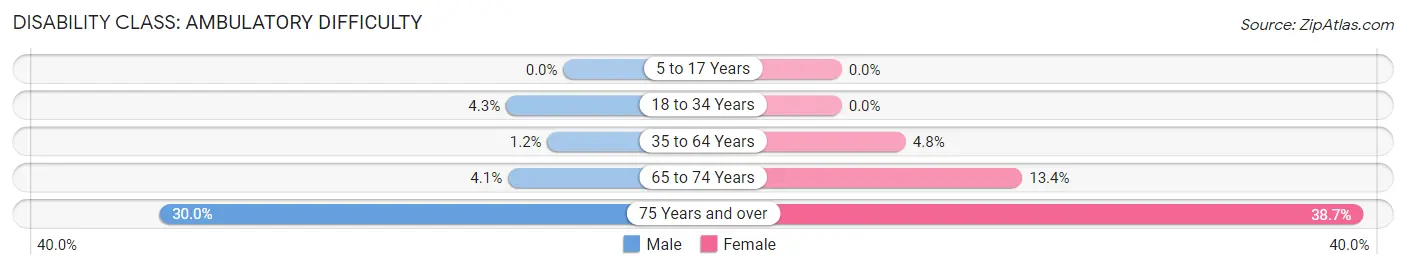
| Age Bracket | Male | Female |
| 5 to 17 Years | 0 (0.0%) | 0 (0.0%) |
| 18 to 34 Years | 4 (4.3%) | 0 (0.0%) |
| 35 to 64 Years | 2 (1.2%) | 7 (4.8%) |
| 65 to 74 Years | 3 (4.1%) | 13 (13.4%) |
| 75 Years and over | 18 (30.0%) | 48 (38.7%) |
Disability Class: Self-Care Difficulty
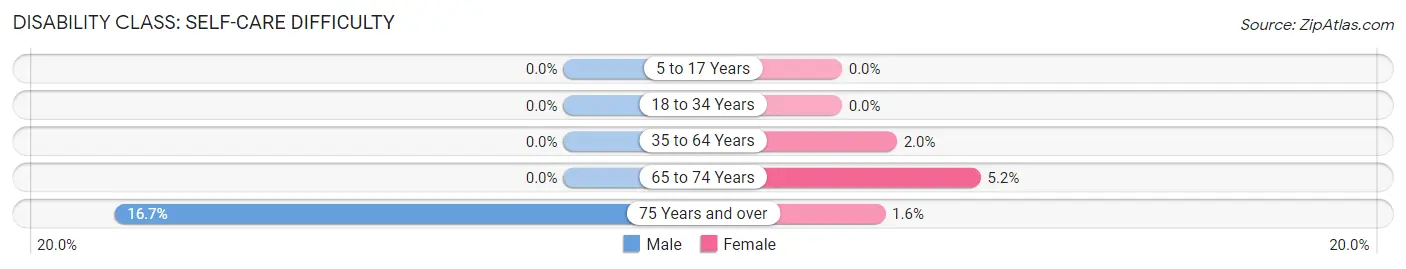
| Age Bracket | Male | Female |
| 5 to 17 Years | 0 (0.0%) | 0 (0.0%) |
| 18 to 34 Years | 0 (0.0%) | 0 (0.0%) |
| 35 to 64 Years | 0 (0.0%) | 3 (2.0%) |
| 65 to 74 Years | 0 (0.0%) | 5 (5.1%) |
| 75 Years and over | 10 (16.7%) | 2 (1.6%) |
Technology Access in Harmony
Computing Device Access in Harmony
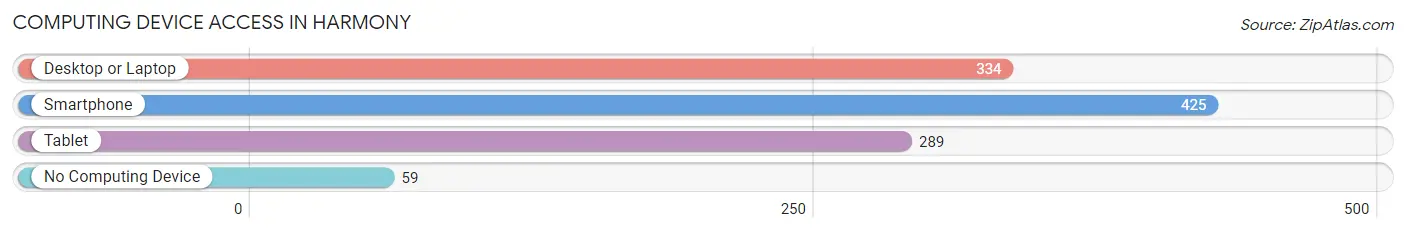
| Device Type | # Households | % Households |
| Desktop or Laptop | 334 | 66.0% |
| Smartphone | 425 | 84.0% |
| Tablet | 289 | 57.1% |
| No Computing Device | 59 | 11.7% |
| Total | 506 | 100.0% |
Internet Access in Harmony
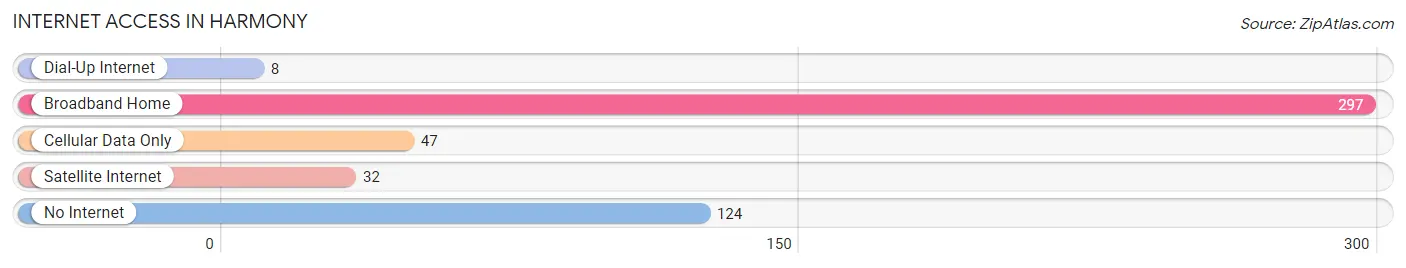
| Internet Type | # Households | % Households |
| Dial-Up Internet | 8 | 1.6% |
| Broadband Home | 297 | 58.7% |
| Cellular Data Only | 47 | 9.3% |
| Satellite Internet | 32 | 6.3% |
| No Internet | 124 | 24.5% |
| Total | 506 | 100.0% |
Harmony Summary
Harmony, Minnesota is a small city located in Fillmore County in the southeastern corner of the state. It is situated on the Root River, which is a tributary of the Mississippi River. The city has a population of 1,072 people, according to the 2010 census.
History
Harmony was founded in 1854 by a group of settlers from New York. The city was named after the town of Harmony, New York, which was the hometown of many of the settlers. The settlers were attracted to the area by the abundance of timber and the potential for farming.
The first settlers built a sawmill and a gristmill, which provided the foundation for the city's economy. The city was incorporated in 1858 and the first mayor was elected in 1859.
In the late 19th century, Harmony was a thriving community with a variety of businesses, including a bank, a hotel, a newspaper, and a variety of stores. The city was also home to a number of churches, including the First Congregational Church, which was founded in 1867.
In the early 20th century, Harmony experienced a period of decline as the timber industry declined and the population decreased. The city was able to recover in the mid-20th century, however, as the economy shifted to agriculture and tourism.
Geography
Harmony is located in southeastern Minnesota, in Fillmore County. The city is situated on the Root River, which is a tributary of the Mississippi River. The city is surrounded by rolling hills and farmland.
The climate in Harmony is typical of the Midwest, with cold winters and hot, humid summers. The average temperature in January is around 20 degrees Fahrenheit, while the average temperature in July is around 75 degrees Fahrenheit.
Economy
The economy of Harmony is largely based on agriculture and tourism. The city is home to a number of farms, which produce a variety of crops, including corn, soybeans, and wheat. The city is also home to a number of tourist attractions, including the Root River State Trail, which is a popular destination for hikers and bicyclists.
The city is also home to a number of businesses, including a grocery store, a hardware store, and a variety of restaurants. The city is also home to a number of manufacturing companies, including a furniture manufacturer and a plastics manufacturer.
Demographics
According to the 2010 census, the population of Harmony is 1,072 people. The population is predominantly white, with 95.3% of the population identifying as white. The median household income is $45,000, and the median age is 43.
Conclusion
Harmony, Minnesota is a small city located in Fillmore County in the southeastern corner of the state. It is situated on the Root River, which is a tributary of the Mississippi River. The city has a population of 1,072 people, according to the 2010 census. The economy of Harmony is largely based on agriculture and tourism, and the city is home to a number of businesses, including a grocery store, a hardware store, and a variety of restaurants. The population is predominantly white, with 95.3% of the population identifying as white. The median household income is $45,000, and the median age is 43.
Common Questions
What is Per Capita Income in Harmony?
Per Capita income in Harmony is $40,224.
What is the Median Family Income in Harmony?
Median Family Income in Harmony is $89,875.
What is the Median Household income in Harmony?
Median Household Income in Harmony is $64,300.
What is Income or Wage Gap in Harmony?
Income or Wage Gap in Harmony is 33.9%.
Women in Harmony earn 66.1 cents for every dollar earned by a man.
What is Inequality or Gini Index in Harmony?
Inequality or Gini Index in Harmony is 0.41.
What is the Total Population of Harmony?
Total Population of Harmony is 1,018.
What is the Total Male Population of Harmony?
Total Male Population of Harmony is 476.
What is the Total Female Population of Harmony?
Total Female Population of Harmony is 542.
What is the Ratio of Males per 100 Females in Harmony?
There are 87.82 Males per 100 Females in Harmony.
What is the Ratio of Females per 100 Males in Harmony?
There are 113.87 Females per 100 Males in Harmony.
What is the Median Population Age in Harmony?
Median Population Age in Harmony is 58.8 Years.
What is the Average Family Size in Harmony
Average Family Size in Harmony is 2.6 People.
What is the Average Household Size in Harmony
Average Household Size in Harmony is 1.9 People.
How Large is the Labor Force in Harmony?
There are 519 People in the Labor Forcein in Harmony.
What is the Percentage of People in the Labor Force in Harmony?
57.7% of People are in the Labor Force in Harmony.
What is the Unemployment Rate in Harmony?
Unemployment Rate in Harmony is 4.0%.