Glenwood, MN Map & Demographics
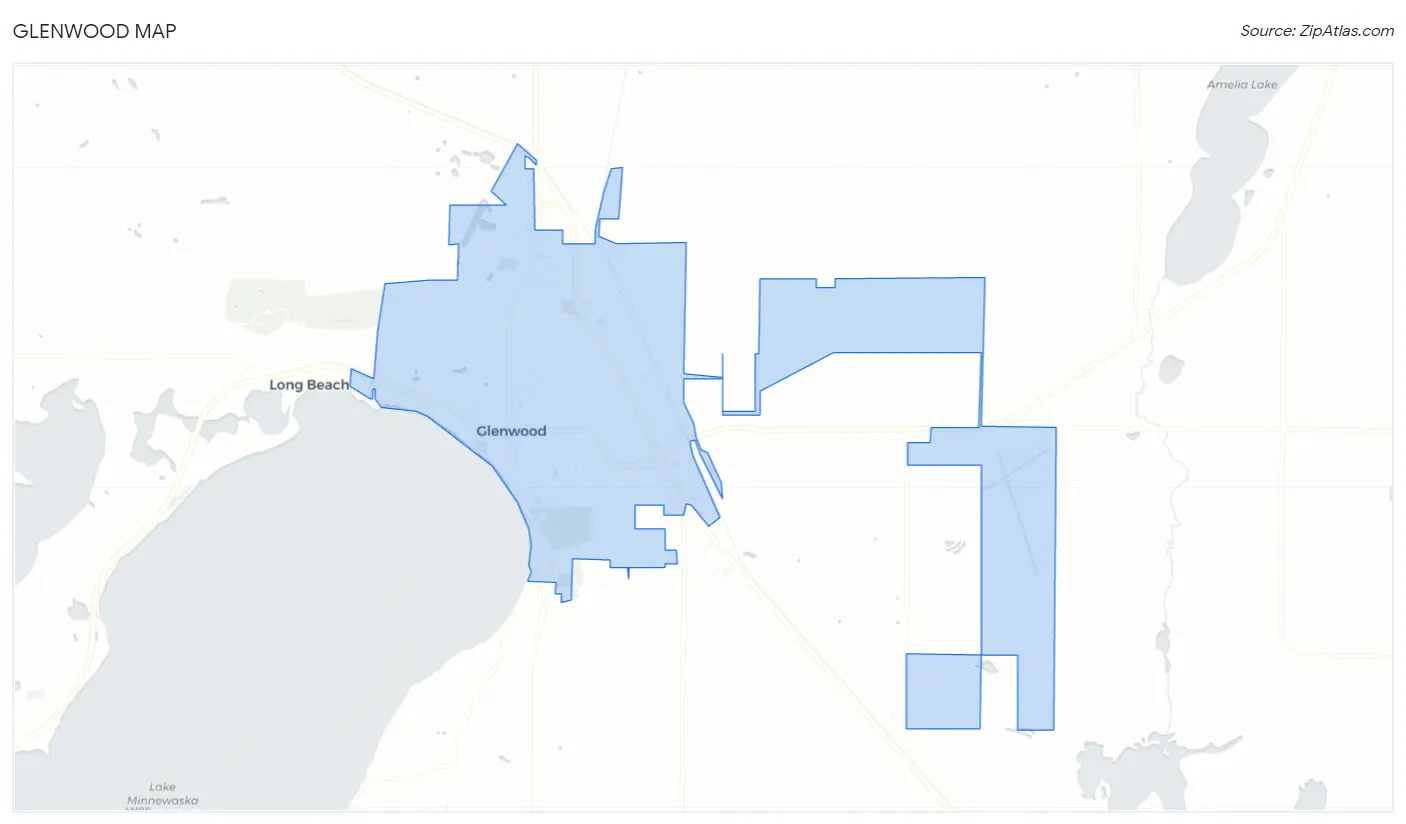
Glenwood Map
Glenwood Overview
$30,356
PER CAPITA INCOME
$80,357
AVG FAMILY INCOME
$50,767
AVG HOUSEHOLD INCOME
2.9%
WAGE / INCOME GAP [ % ]
97.1¢/ $1
WAGE / INCOME GAP [ $ ]
0.45
INEQUALITY / GINI INDEX
2,628
TOTAL POPULATION
1,315
MALE POPULATION
1,313
FEMALE POPULATION
100.15
MALES / 100 FEMALES
99.85
FEMALES / 100 MALES
40.0
MEDIAN AGE
3.0
AVG FAMILY SIZE
2.1
AVG HOUSEHOLD SIZE
1,383
LABOR FORCE [ PEOPLE ]
66.5%
PERCENT IN LABOR FORCE
0.4%
UNEMPLOYMENT RATE
Glenwood Zip Codes
Glenwood Area Codes
Income in Glenwood
Income Overview in Glenwood
Per Capita Income in Glenwood is $30,356, while median incomes of families and households are $80,357 and $50,767 respectively.
| Characteristic | Number | Measure |
| Per Capita Income | 2,628 | $30,356 |
| Median Family Income | 606 | $80,357 |
| Mean Family Income | 606 | $91,530 |
| Median Household Income | 1,181 | $50,767 |
| Mean Household Income | 1,181 | $64,739 |
| Income Deficit | 606 | $0 |
| Wage / Income Gap (%) | 2,628 | 2.88% |
| Wage / Income Gap ($) | 2,628 | 97.12¢ per $1 |
| Gini / Inequality Index | 2,628 | 0.45 |
Earnings by Sex in Glenwood
Average Earnings in Glenwood are $36,434, $36,087 for men and $37,159 for women, a difference of 2.9%.
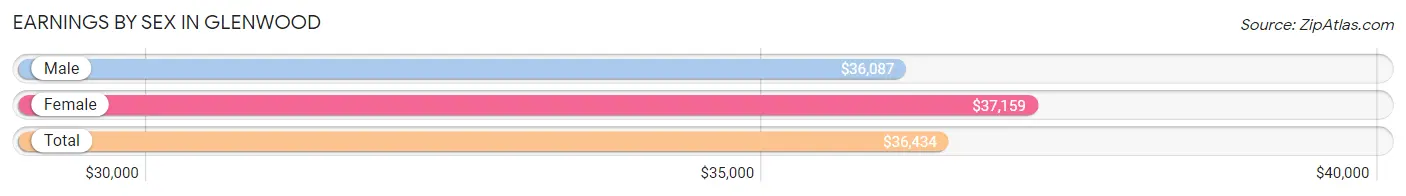
| Sex | Number | Average Earnings |
| Male | 754 (52.3%) | $36,087 |
| Female | 687 (47.7%) | $37,159 |
| Total | 1,441 (100.0%) | $36,434 |
Earnings by Sex by Income Bracket in Glenwood
The most common earnings brackets in Glenwood are $2,499 or less for men (79 | 10.5%) and $55,000 to $64,999 for women (101 | 14.7%).
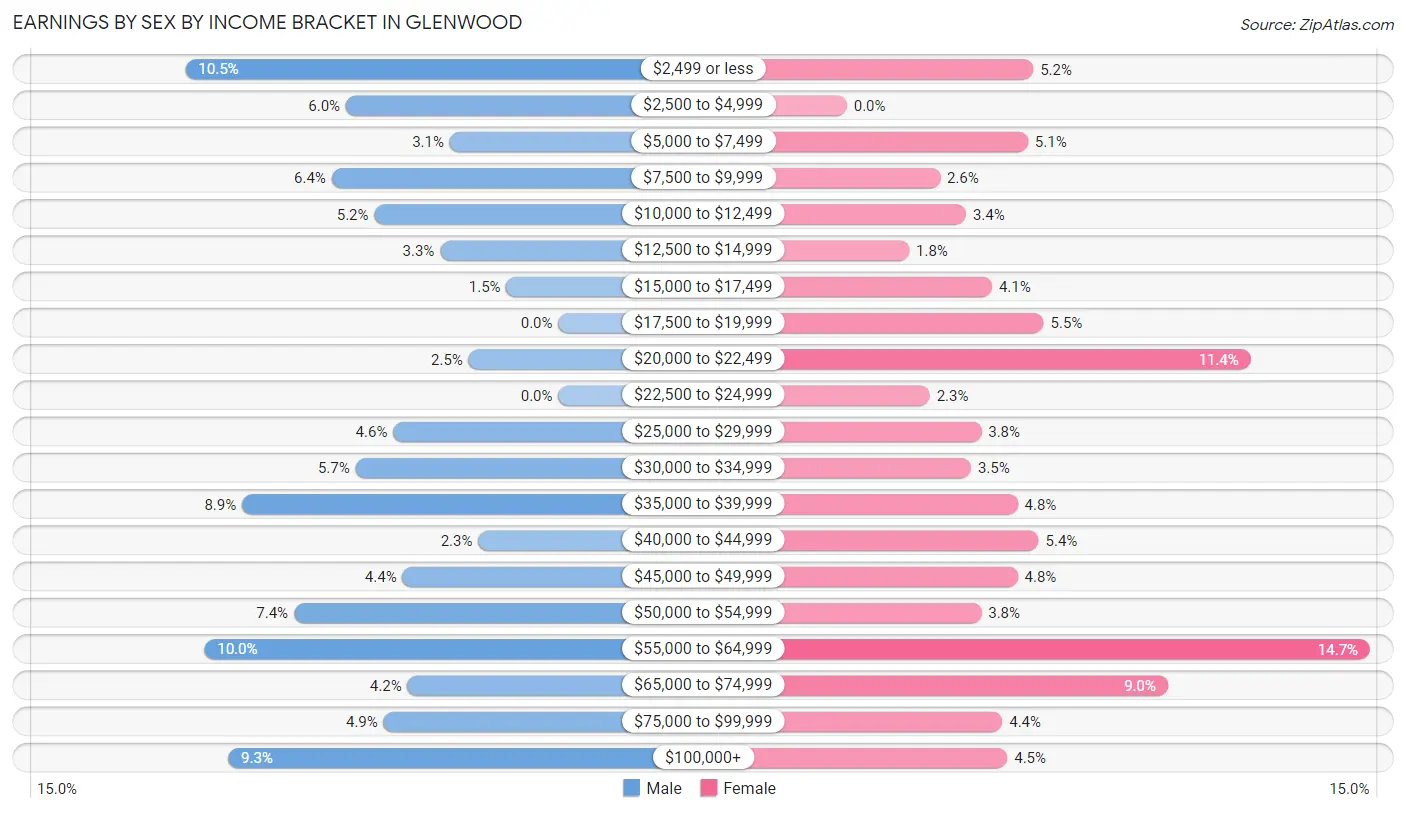
| Income | Male | Female |
| $2,499 or less | 79 (10.5%) | 36 (5.2%) |
| $2,500 to $4,999 | 45 (6.0%) | 0 (0.0%) |
| $5,000 to $7,499 | 23 (3.0%) | 35 (5.1%) |
| $7,500 to $9,999 | 48 (6.4%) | 18 (2.6%) |
| $10,000 to $12,499 | 39 (5.2%) | 23 (3.4%) |
| $12,500 to $14,999 | 25 (3.3%) | 12 (1.8%) |
| $15,000 to $17,499 | 11 (1.5%) | 28 (4.1%) |
| $17,500 to $19,999 | 0 (0.0%) | 38 (5.5%) |
| $20,000 to $22,499 | 19 (2.5%) | 78 (11.4%) |
| $22,500 to $24,999 | 0 (0.0%) | 16 (2.3%) |
| $25,000 to $29,999 | 35 (4.6%) | 26 (3.8%) |
| $30,000 to $34,999 | 43 (5.7%) | 24 (3.5%) |
| $35,000 to $39,999 | 67 (8.9%) | 33 (4.8%) |
| $40,000 to $44,999 | 17 (2.2%) | 37 (5.4%) |
| $45,000 to $49,999 | 33 (4.4%) | 33 (4.8%) |
| $50,000 to $54,999 | 56 (7.4%) | 26 (3.8%) |
| $55,000 to $64,999 | 75 (10.0%) | 101 (14.7%) |
| $65,000 to $74,999 | 32 (4.2%) | 62 (9.0%) |
| $75,000 to $99,999 | 37 (4.9%) | 30 (4.4%) |
| $100,000+ | 70 (9.3%) | 31 (4.5%) |
| Total | 754 (100.0%) | 687 (100.0%) |
Earnings by Sex by Educational Attainment in Glenwood
Average earnings in Glenwood are $45,250 for men and $41,591 for women, a difference of 8.1%. Men with an educational attainment of bachelor's degree enjoy the highest average annual earnings of $51,500, while those with high school diploma education earn the least with $37,011. Women with an educational attainment of bachelor's degree earn the most with the average annual earnings of $59,750, while those with high school diploma education have the smallest earnings of $19,618.
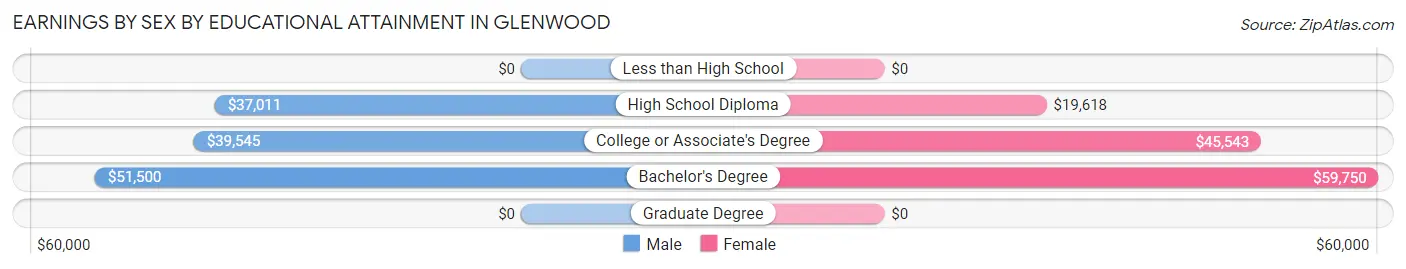
| Educational Attainment | Male Income | Female Income |
| Less than High School | - | - |
| High School Diploma | $37,011 | $19,618 |
| College or Associate's Degree | $39,545 | $45,543 |
| Bachelor's Degree | $51,500 | $59,750 |
| Graduate Degree | - | - |
| Total | $45,250 | $41,591 |
Family Income in Glenwood
Family Income Brackets in Glenwood
According to the Glenwood family income data, there are 134 families falling into the $100,000 to $149,999 income range, which is the most common income bracket and makes up 22.1% of all families. Conversely, the $200,000+ income bracket is the least frequent group with only 6 families (1.0%) belonging to this category.
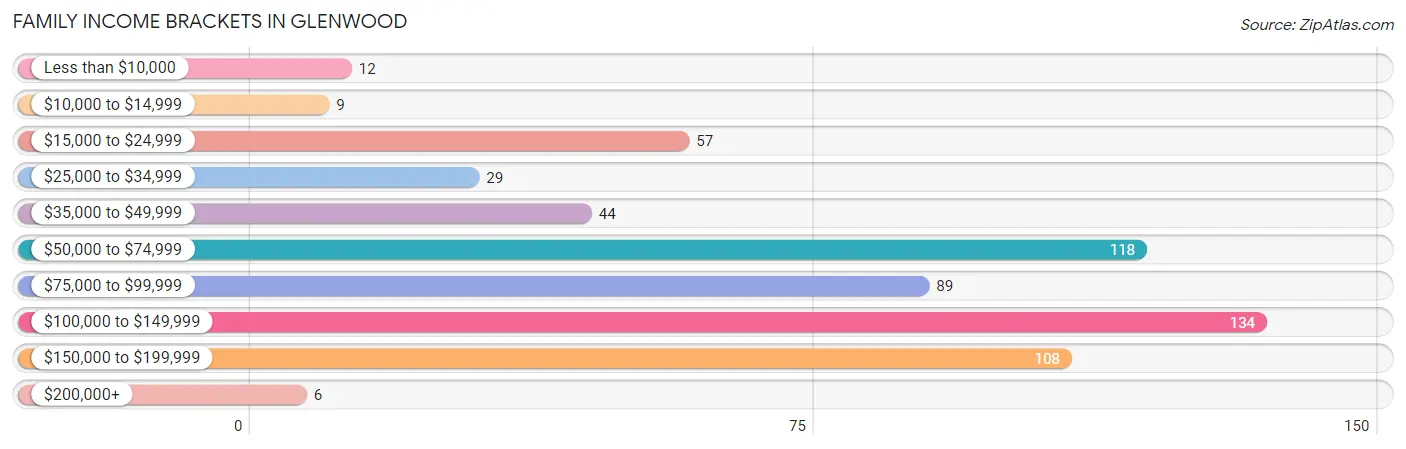
| Income Bracket | # Families | % Families |
| Less than $10,000 | 12 | 2.0% |
| $10,000 to $14,999 | 9 | 1.5% |
| $15,000 to $24,999 | 57 | 9.4% |
| $25,000 to $34,999 | 29 | 4.8% |
| $35,000 to $49,999 | 44 | 7.3% |
| $50,000 to $74,999 | 118 | 19.5% |
| $75,000 to $99,999 | 89 | 14.7% |
| $100,000 to $149,999 | 134 | 22.1% |
| $150,000 to $199,999 | 108 | 17.8% |
| $200,000+ | 6 | 1.0% |
Family Income by Famaliy Size in Glenwood
4-person families (132 | 21.8%) account for the highest median family income in Glenwood with $114,250 per family, while 2-person families (272 | 44.9%) have the highest median income of $35,341 per family member.
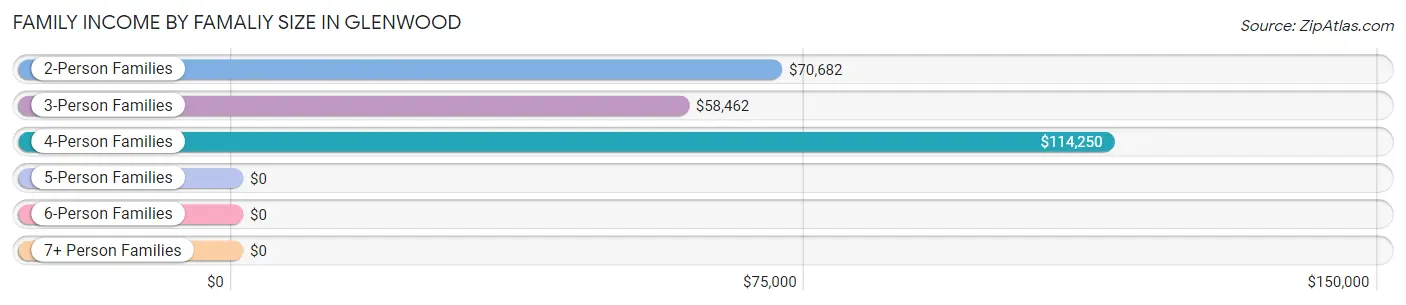
| Income Bracket | # Families | Median Income |
| 2-Person Families | 272 (44.9%) | $70,682 |
| 3-Person Families | 116 (19.1%) | $58,462 |
| 4-Person Families | 132 (21.8%) | $114,250 |
| 5-Person Families | 61 (10.1%) | $0 |
| 6-Person Families | 25 (4.1%) | $0 |
| 7+ Person Families | 0 (0.0%) | $0 |
| Total | 606 (100.0%) | $80,357 |
Family Income by Number of Earners in Glenwood
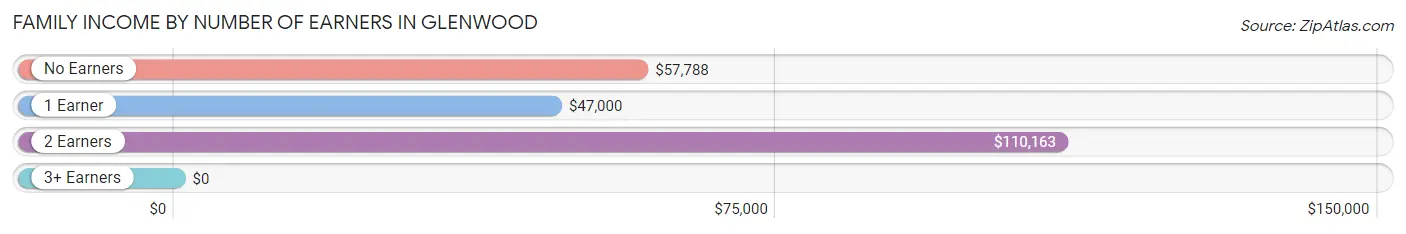
| Number of Earners | # Families | Median Income |
| No Earners | 72 (11.9%) | $57,788 |
| 1 Earner | 116 (19.1%) | $47,000 |
| 2 Earners | 365 (60.2%) | $110,163 |
| 3+ Earners | 53 (8.7%) | $0 |
| Total | 606 (100.0%) | $80,357 |
Household Income in Glenwood
Household Income Brackets in Glenwood
With 208 households falling in the category, the $50,000 to $74,999 income range is the most frequent in Glenwood, accounting for 17.6% of all households. In contrast, only 6 households (0.5%) fall into the $200,000+ income bracket, making it the least populous group.
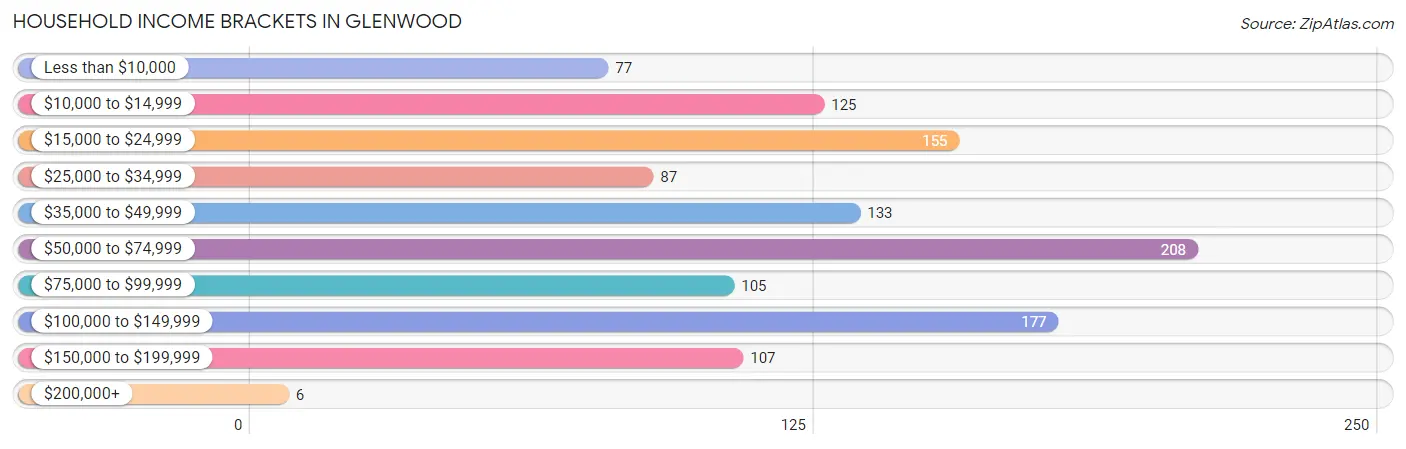
| Income Bracket | # Households | % Households |
| Less than $10,000 | 77 | 6.5% |
| $10,000 to $14,999 | 125 | 10.6% |
| $15,000 to $24,999 | 155 | 13.1% |
| $25,000 to $34,999 | 87 | 7.4% |
| $35,000 to $49,999 | 133 | 11.3% |
| $50,000 to $74,999 | 208 | 17.6% |
| $75,000 to $99,999 | 105 | 8.9% |
| $100,000 to $149,999 | 177 | 15.0% |
| $150,000 to $199,999 | 107 | 9.1% |
| $200,000+ | 6 | 0.5% |
Household Income by Householder Age in Glenwood
The median household income in Glenwood is $50,767, with the highest median household income of $89,931 found in the 25 to 44 years age bracket for the primary householder. A total of 357 households (30.2%) fall into this category. Meanwhile, the 65+ years age bracket for the primary householder has the lowest median household income of $33,438, with 453 households (38.4%) in this group.
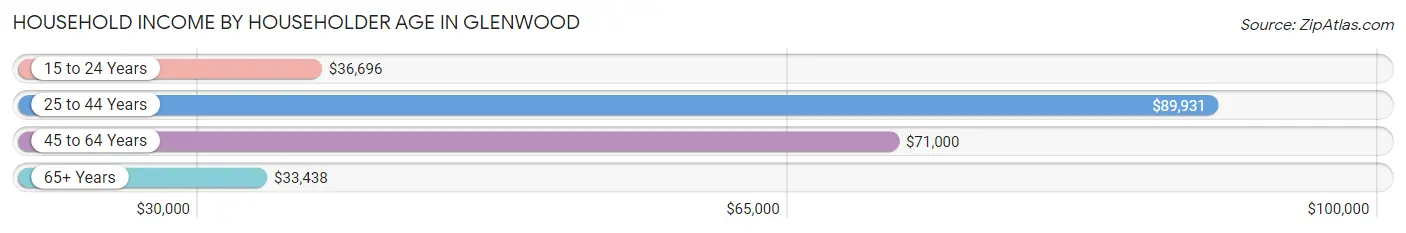
| Income Bracket | # Households | Median Income |
| 15 to 24 Years | 91 (7.7%) | $36,696 |
| 25 to 44 Years | 357 (30.2%) | $89,931 |
| 45 to 64 Years | 280 (23.7%) | $71,000 |
| 65+ Years | 453 (38.4%) | $33,438 |
| Total | 1,181 (100.0%) | $50,767 |
Poverty in Glenwood
Income Below Poverty by Sex and Age in Glenwood
With 19.9% poverty level for males and 16.2% for females among the residents of Glenwood, 18 to 24 year old males and 5 year old females are the most vulnerable to poverty, with 52 males (42.6%) and 25 females (100.0%) in their respective age groups living below the poverty level.
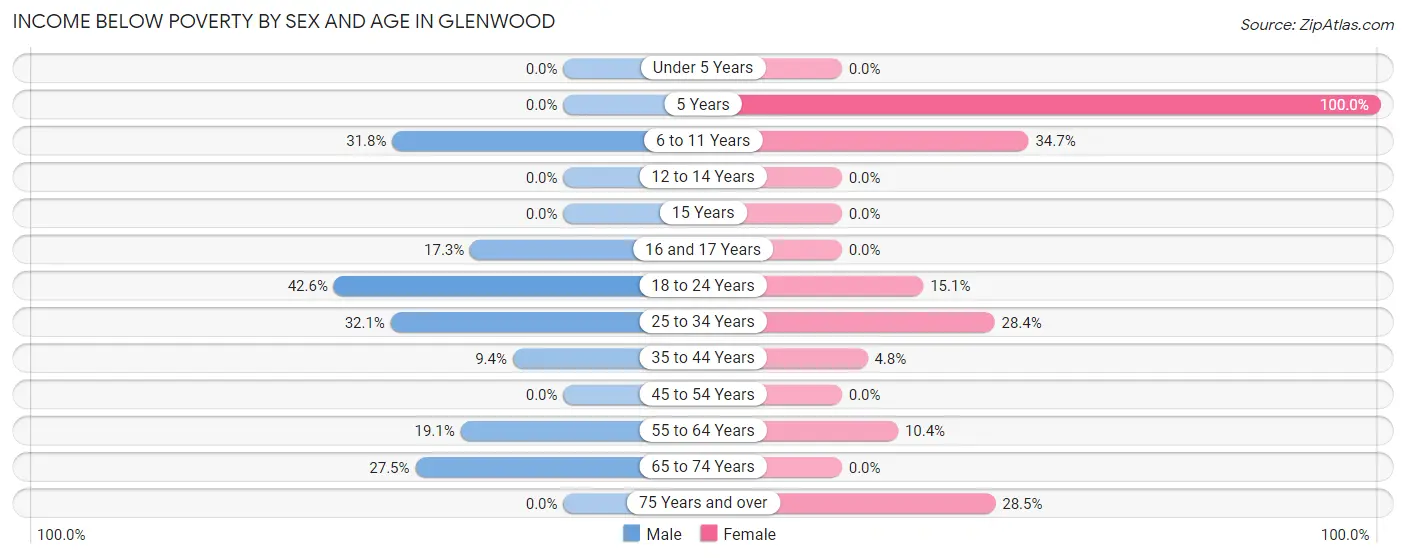
| Age Bracket | Male | Female |
| Under 5 Years | 0 (0.0%) | 0 (0.0%) |
| 5 Years | 0 (0.0%) | 25 (100.0%) |
| 6 to 11 Years | 60 (31.8%) | 44 (34.6%) |
| 12 to 14 Years | 0 (0.0%) | 0 (0.0%) |
| 15 Years | 0 (0.0%) | 0 (0.0%) |
| 16 and 17 Years | 9 (17.3%) | 0 (0.0%) |
| 18 to 24 Years | 52 (42.6%) | 13 (15.1%) |
| 25 to 34 Years | 50 (32.1%) | 38 (28.4%) |
| 35 to 44 Years | 15 (9.4%) | 8 (4.8%) |
| 45 to 54 Years | 0 (0.0%) | 0 (0.0%) |
| 55 to 64 Years | 21 (19.1%) | 20 (10.4%) |
| 65 to 74 Years | 50 (27.5%) | 0 (0.0%) |
| 75 Years and over | 0 (0.0%) | 49 (28.5%) |
| Total | 257 (19.9%) | 197 (16.2%) |
Income Above Poverty by Sex and Age in Glenwood
According to the poverty statistics in Glenwood, males aged under 5 years and females aged under 5 years are the age groups that are most secure financially, with 100.0% of males and 100.0% of females in these age groups living above the poverty line.
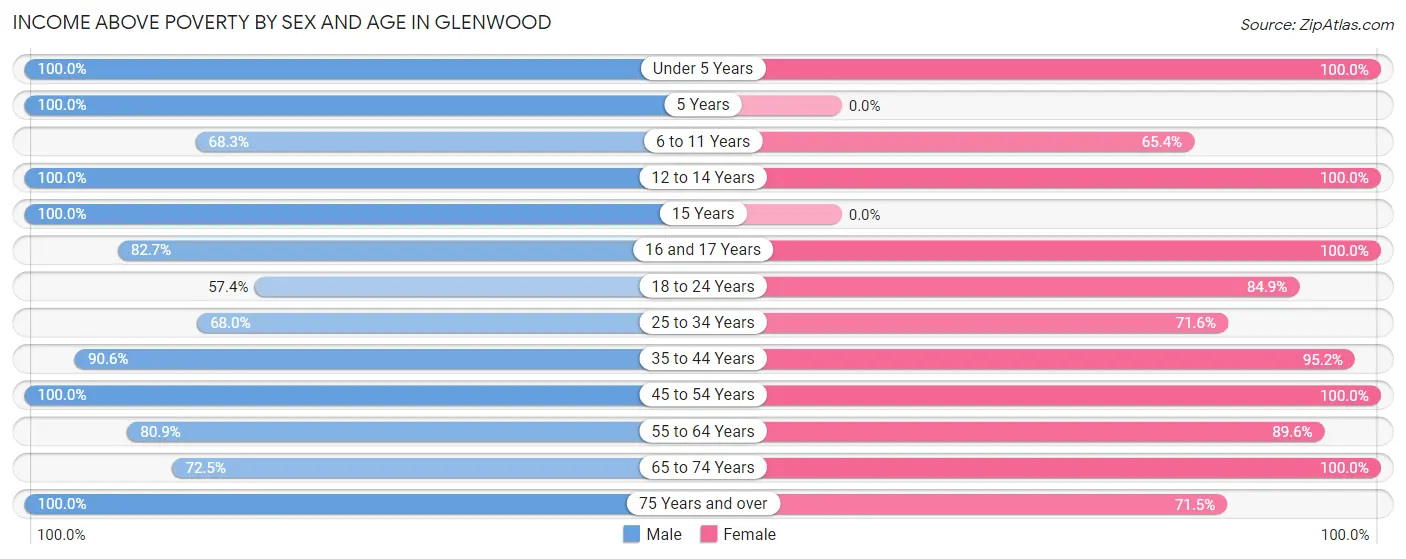
| Age Bracket | Male | Female |
| Under 5 Years | 30 (100.0%) | 49 (100.0%) |
| 5 Years | 5 (100.0%) | 0 (0.0%) |
| 6 to 11 Years | 129 (68.2%) | 83 (65.3%) |
| 12 to 14 Years | 75 (100.0%) | 30 (100.0%) |
| 15 Years | 18 (100.0%) | 0 (0.0%) |
| 16 and 17 Years | 43 (82.7%) | 11 (100.0%) |
| 18 to 24 Years | 70 (57.4%) | 73 (84.9%) |
| 25 to 34 Years | 106 (67.9%) | 96 (71.6%) |
| 35 to 44 Years | 145 (90.6%) | 160 (95.2%) |
| 45 to 54 Years | 108 (100.0%) | 87 (100.0%) |
| 55 to 64 Years | 89 (80.9%) | 172 (89.6%) |
| 65 to 74 Years | 132 (72.5%) | 139 (100.0%) |
| 75 Years and over | 84 (100.0%) | 123 (71.5%) |
| Total | 1,034 (80.1%) | 1,023 (83.9%) |
Income Below Poverty Among Married-Couple Families in Glenwood
The poverty statistics for married-couple families in Glenwood show that 9.5% or 48 of the total 503 families live below the poverty line. Families with 3 or 4 children have the highest poverty rate of 31.4%, comprising of 27 families. On the other hand, families with no children have the lowest poverty rate of 4.3%, which includes 12 families.
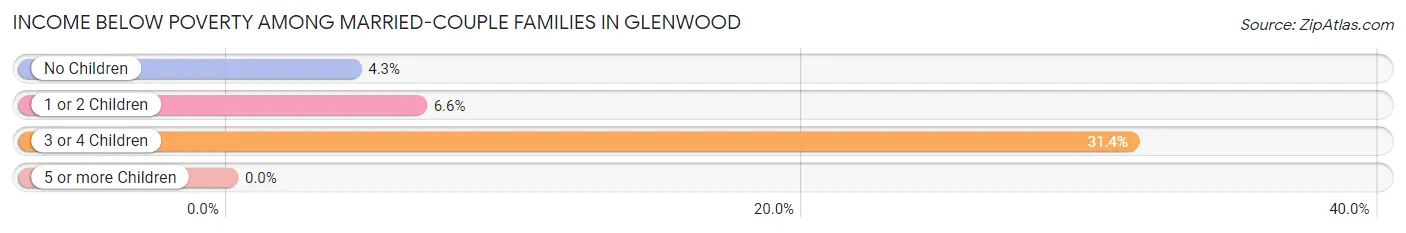
| Children | Above Poverty | Below Poverty |
| No Children | 268 (95.7%) | 12 (4.3%) |
| 1 or 2 Children | 128 (93.4%) | 9 (6.6%) |
| 3 or 4 Children | 59 (68.6%) | 27 (31.4%) |
| 5 or more Children | 0 (0.0%) | 0 (0.0%) |
| Total | 455 (90.5%) | 48 (9.5%) |
Income Below Poverty Among Single-Parent Households in Glenwood
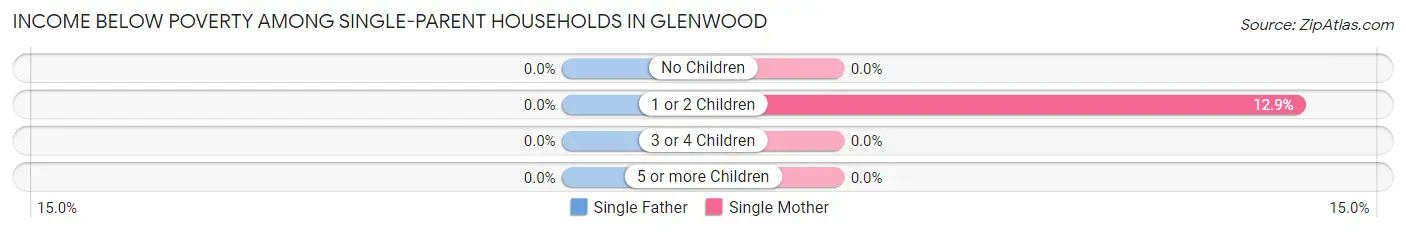
| Children | Single Father | Single Mother |
| No Children | 0 (0.0%) | 0 (0.0%) |
| 1 or 2 Children | 0 (0.0%) | 8 (12.9%) |
| 3 or 4 Children | 0 (0.0%) | 0 (0.0%) |
| 5 or more Children | 0 (0.0%) | 0 (0.0%) |
| Total | 0 (0.0%) | 8 (10.5%) |
Income Below Poverty Among Married-Couple vs Single-Parent Households in Glenwood
The poverty data for Glenwood shows that 48 of the married-couple family households (9.5%) and 8 of the single-parent households (7.8%) are living below the poverty level. Within the married-couple family households, those with 3 or 4 children have the highest poverty rate, with 27 households (31.4%) falling below the poverty line. Among the single-parent households, those with 1 or 2 children have the highest poverty rate, with 8 household (9.3%) living below poverty.
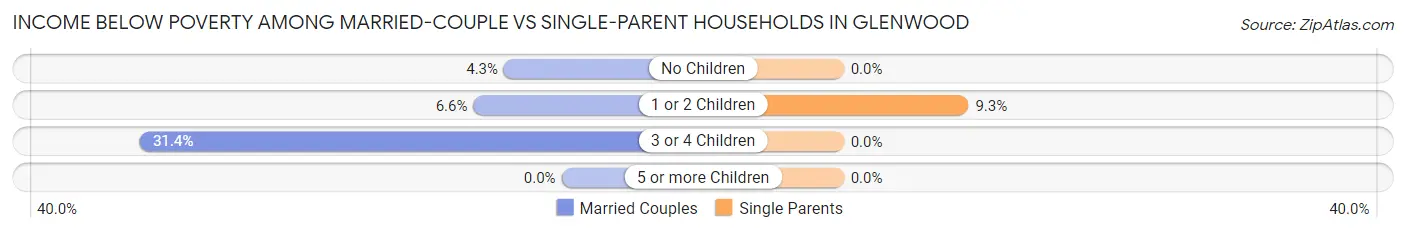
| Children | Married-Couple Families | Single-Parent Households |
| No Children | 12 (4.3%) | 0 (0.0%) |
| 1 or 2 Children | 9 (6.6%) | 8 (9.3%) |
| 3 or 4 Children | 27 (31.4%) | 0 (0.0%) |
| 5 or more Children | 0 (0.0%) | 0 (0.0%) |
| Total | 48 (9.5%) | 8 (7.8%) |
Race in Glenwood
The most populous races in Glenwood are White / Caucasian (2,536 | 96.5%), Two or more Races (58 | 2.2%), and Asian (32 | 1.2%).
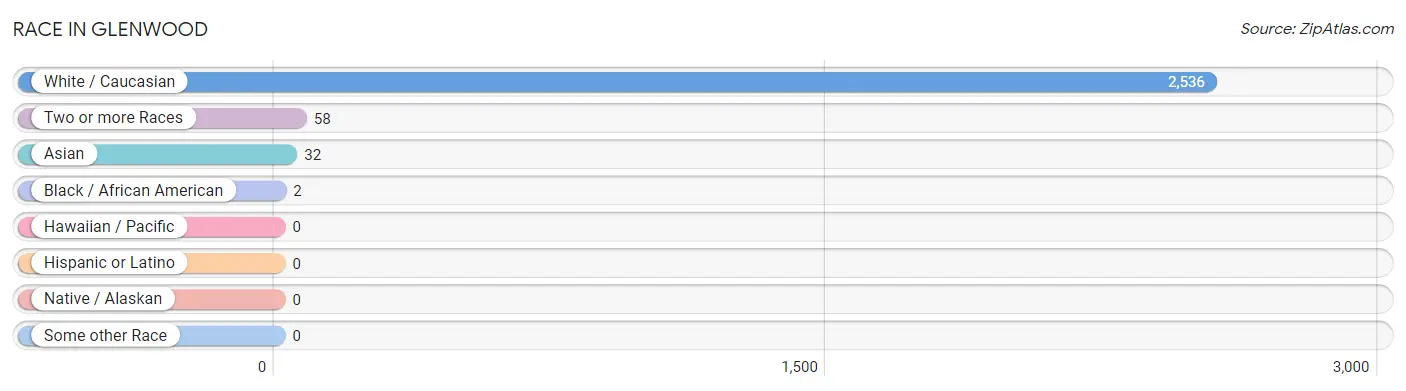
| Race | # Population | % Population |
| Asian | 32 | 1.2% |
| Black / African American | 2 | 0.1% |
| Hawaiian / Pacific | 0 | 0.0% |
| Hispanic or Latino | 0 | 0.0% |
| Native / Alaskan | 0 | 0.0% |
| White / Caucasian | 2,536 | 96.5% |
| Two or more Races | 58 | 2.2% |
| Some other Race | 0 | 0.0% |
| Total | 2,628 | 100.0% |
Ancestry in Glenwood
The most populous ancestries reported in Glenwood are German (976 | 37.1%), Norwegian (751 | 28.6%), Swedish (202 | 7.7%), Irish (160 | 6.1%), and English (114 | 4.3%), together accounting for 83.8% of all Glenwood residents.
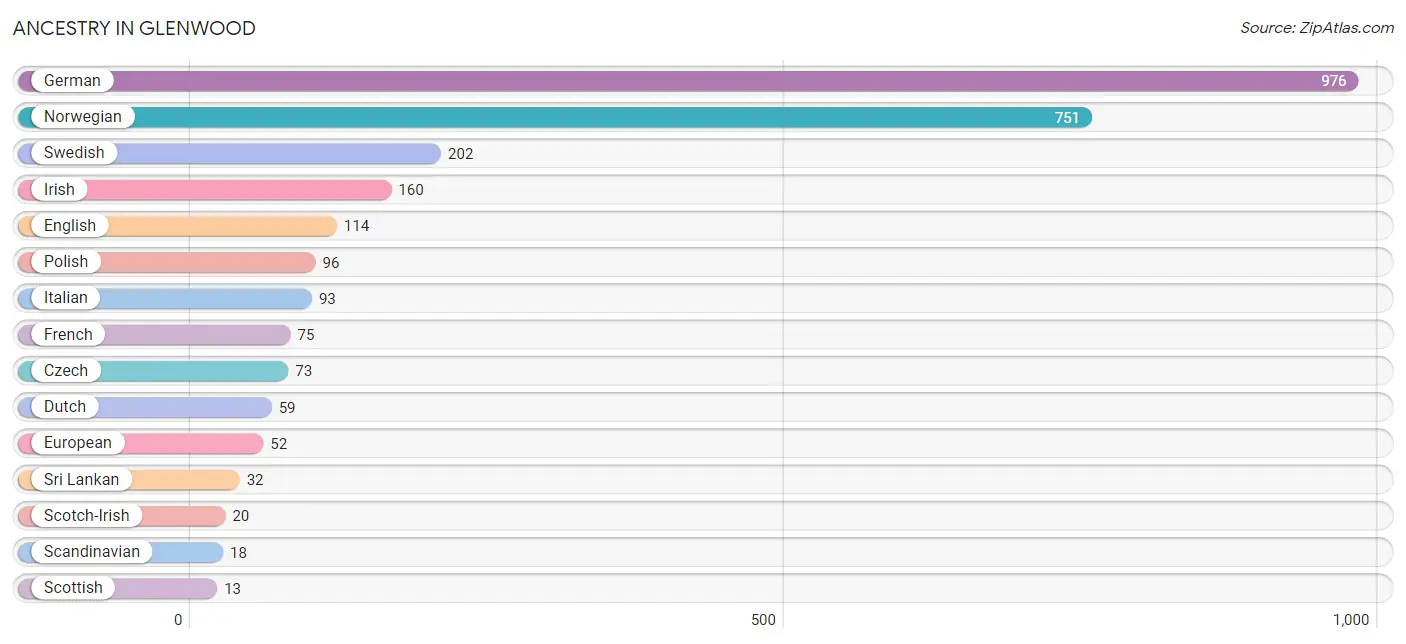
| Ancestry | # Population | % Population |
| American | 6 | 0.2% |
| Belgian | 11 | 0.4% |
| Czech | 73 | 2.8% |
| Danish | 7 | 0.3% |
| Dutch | 59 | 2.2% |
| English | 114 | 4.3% |
| European | 52 | 2.0% |
| Finnish | 9 | 0.3% |
| French | 75 | 2.9% |
| French Canadian | 7 | 0.3% |
| German | 976 | 37.1% |
| Icelander | 5 | 0.2% |
| Irish | 160 | 6.1% |
| Italian | 93 | 3.5% |
| Norwegian | 751 | 28.6% |
| Polish | 96 | 3.6% |
| Scandinavian | 18 | 0.7% |
| Scotch-Irish | 20 | 0.8% |
| Scottish | 13 | 0.5% |
| Sri Lankan | 32 | 1.2% |
| Swedish | 202 | 7.7% | View All 21 Rows |
Immigrants in Glenwood
The most numerous immigrant groups reported in Glenwood came from Asia (43 | 1.6%), South Eastern Asia (32 | 1.2%), Vietnam (32 | 1.2%), China (11 | 0.4%), and Eastern Asia (11 | 0.4%), together accounting for 4.9% of all Glenwood residents.
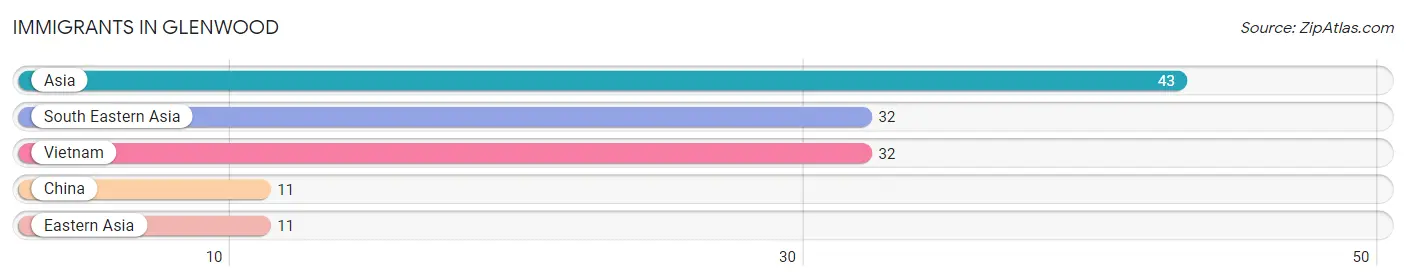
| Immigration Origin | # Population | % Population |
| Asia | 43 | 1.6% |
| China | 11 | 0.4% |
| Eastern Asia | 11 | 0.4% |
| South Eastern Asia | 32 | 1.2% |
| Vietnam | 32 | 1.2% | View All 5 Rows |
Sex and Age in Glenwood
Sex and Age in Glenwood
The most populous age groups in Glenwood are 65 to 69 Years (158 | 12.0%) for men and 85 Years and over (135 | 10.3%) for women.
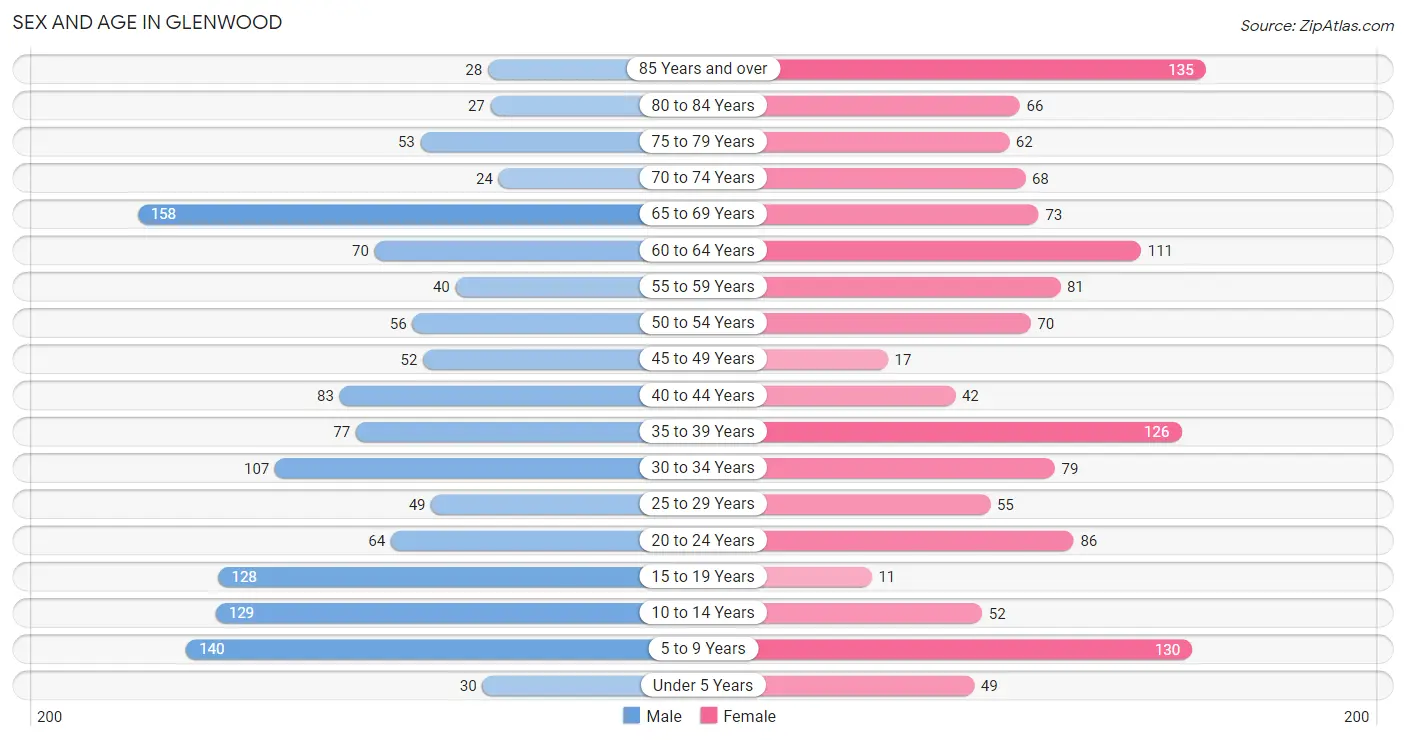
| Age Bracket | Male | Female |
| Under 5 Years | 30 (2.3%) | 49 (3.7%) |
| 5 to 9 Years | 140 (10.6%) | 130 (9.9%) |
| 10 to 14 Years | 129 (9.8%) | 52 (4.0%) |
| 15 to 19 Years | 128 (9.7%) | 11 (0.8%) |
| 20 to 24 Years | 64 (4.9%) | 86 (6.6%) |
| 25 to 29 Years | 49 (3.7%) | 55 (4.2%) |
| 30 to 34 Years | 107 (8.1%) | 79 (6.0%) |
| 35 to 39 Years | 77 (5.9%) | 126 (9.6%) |
| 40 to 44 Years | 83 (6.3%) | 42 (3.2%) |
| 45 to 49 Years | 52 (4.0%) | 17 (1.3%) |
| 50 to 54 Years | 56 (4.3%) | 70 (5.3%) |
| 55 to 59 Years | 40 (3.0%) | 81 (6.2%) |
| 60 to 64 Years | 70 (5.3%) | 111 (8.5%) |
| 65 to 69 Years | 158 (12.0%) | 73 (5.6%) |
| 70 to 74 Years | 24 (1.8%) | 68 (5.2%) |
| 75 to 79 Years | 53 (4.0%) | 62 (4.7%) |
| 80 to 84 Years | 27 (2.1%) | 66 (5.0%) |
| 85 Years and over | 28 (2.1%) | 135 (10.3%) |
| Total | 1,315 (100.0%) | 1,313 (100.0%) |
Families and Households in Glenwood
Median Family Size in Glenwood
The median family size in Glenwood is 2.95 persons per family, with single male/father families (27 | 4.5%) accounting for the largest median family size of 3.19 persons per family. On the other hand, single female/mother families (76 | 12.5%) represent the smallest median family size with 2.62 persons per family.
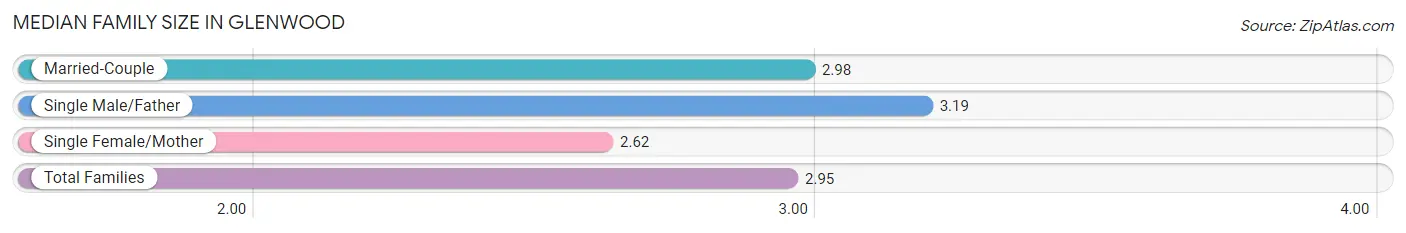
| Family Type | # Families | Family Size |
| Married-Couple | 503 (83.0%) | 2.98 |
| Single Male/Father | 27 (4.5%) | 3.19 |
| Single Female/Mother | 76 (12.5%) | 2.62 |
| Total Families | 606 (100.0%) | 2.95 |
Median Household Size in Glenwood
The median household size in Glenwood is 2.12 persons per household, with single male/father households (27 | 2.3%) accounting for the largest median household size of 3.67 persons per household. non-family households (575 | 48.7%) represent the smallest median household size with 1.20 persons per household.
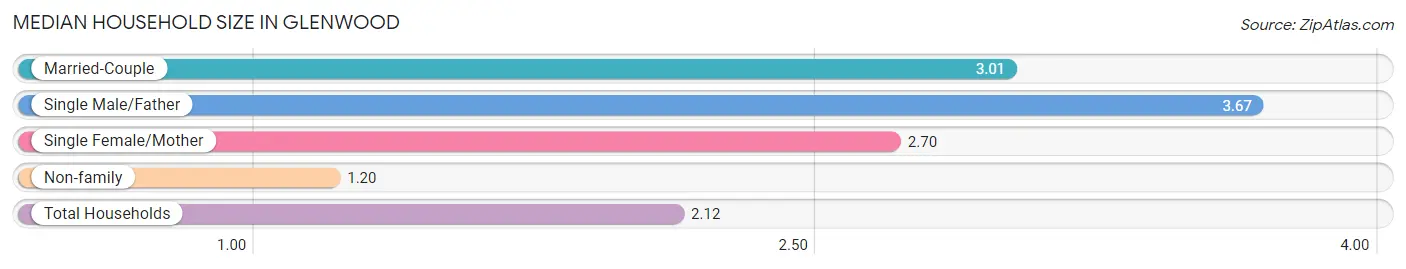
| Household Type | # Households | Household Size |
| Married-Couple | 503 (42.6%) | 3.01 |
| Single Male/Father | 27 (2.3%) | 3.67 |
| Single Female/Mother | 76 (6.4%) | 2.70 |
| Non-family | 575 (48.7%) | 1.20 |
| Total Households | 1,181 (100.0%) | 2.12 |
Household Size by Marriage Status in Glenwood
Out of a total of 1,181 households in Glenwood, 606 (51.3%) are family households, while 575 (48.7%) are nonfamily households. The most numerous type of family households are 2-person households, comprising 272, and the most common type of nonfamily households are 1-person households, comprising 489.
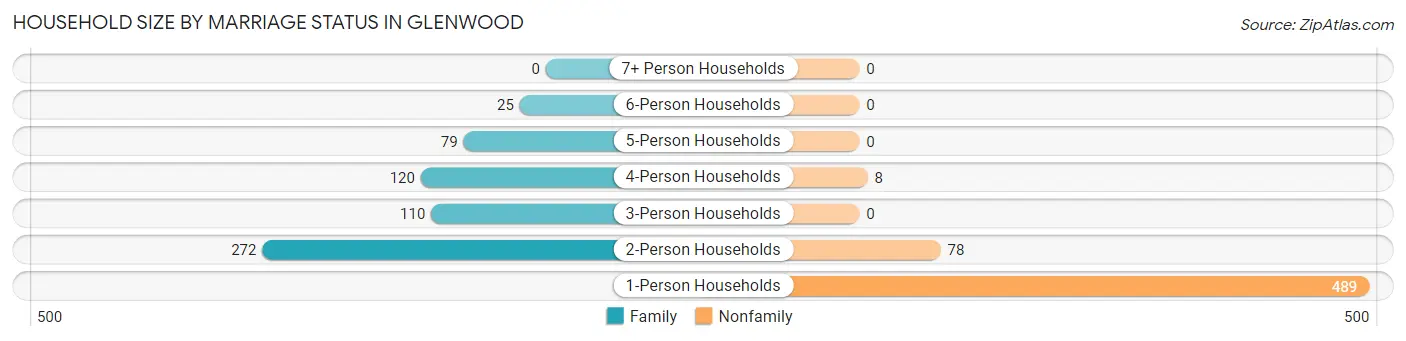
| Household Size | Family Households | Nonfamily Households |
| 1-Person Households | - | 489 (41.4%) |
| 2-Person Households | 272 (23.0%) | 78 (6.6%) |
| 3-Person Households | 110 (9.3%) | 0 (0.0%) |
| 4-Person Households | 120 (10.2%) | 8 (0.7%) |
| 5-Person Households | 79 (6.7%) | 0 (0.0%) |
| 6-Person Households | 25 (2.1%) | 0 (0.0%) |
| 7+ Person Households | 0 (0.0%) | 0 (0.0%) |
| Total | 606 (51.3%) | 575 (48.7%) |
Female Fertility in Glenwood
Fertility by Age in Glenwood
Average fertility rate in Glenwood is 92.0 births per 1,000 women. Women in the age bracket of 20 to 34 years have the highest fertility rate with 123.0 births per 1,000 women. Women in the age bracket of 20 to 34 years acount for 65.8% of all women with births.
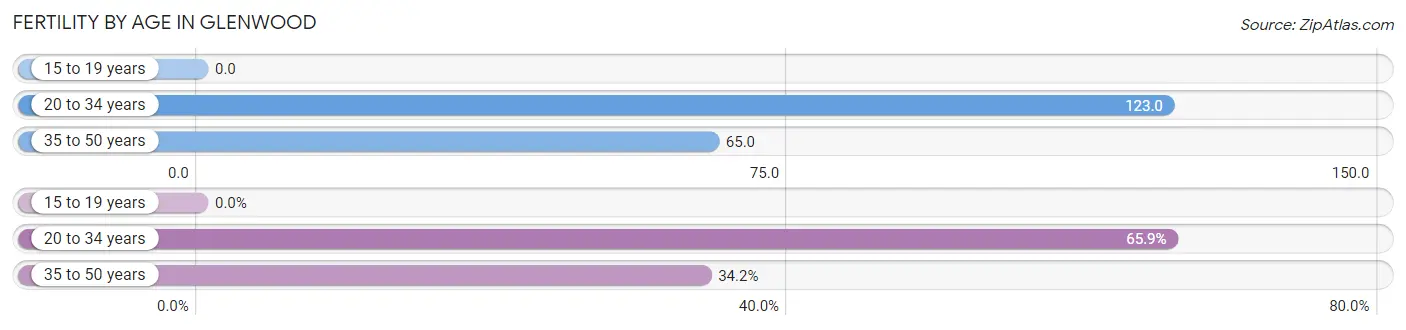
| Age Bracket | Women with Births | Births / 1,000 Women |
| 15 to 19 years | 0 (0.0%) | 0.0 |
| 20 to 34 years | 27 (65.8%) | 123.0 |
| 35 to 50 years | 14 (34.2%) | 65.0 |
| Total | 41 (100.0%) | 92.0 |
Fertility by Age by Marriage Status in Glenwood
65.9% of women with births (41) in Glenwood are married. The highest percentage of unmarried women with births falls into 20 to 34 years age bracket with 37.0% of them unmarried at the time of birth, while the lowest percentage of unmarried women with births belong to 35 to 50 years age bracket with 28.6% of them unmarried.
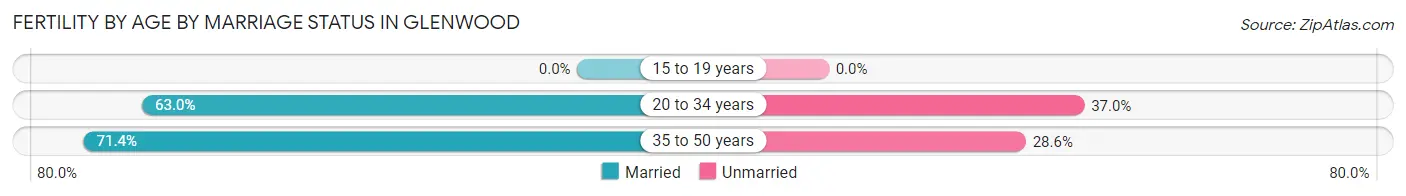
| Age Bracket | Married | Unmarried |
| 15 to 19 years | 0 (0.0%) | 0 (0.0%) |
| 20 to 34 years | 17 (63.0%) | 10 (37.0%) |
| 35 to 50 years | 10 (71.4%) | 4 (28.6%) |
| Total | 27 (65.8%) | 14 (34.2%) |
Fertility by Education in Glenwood
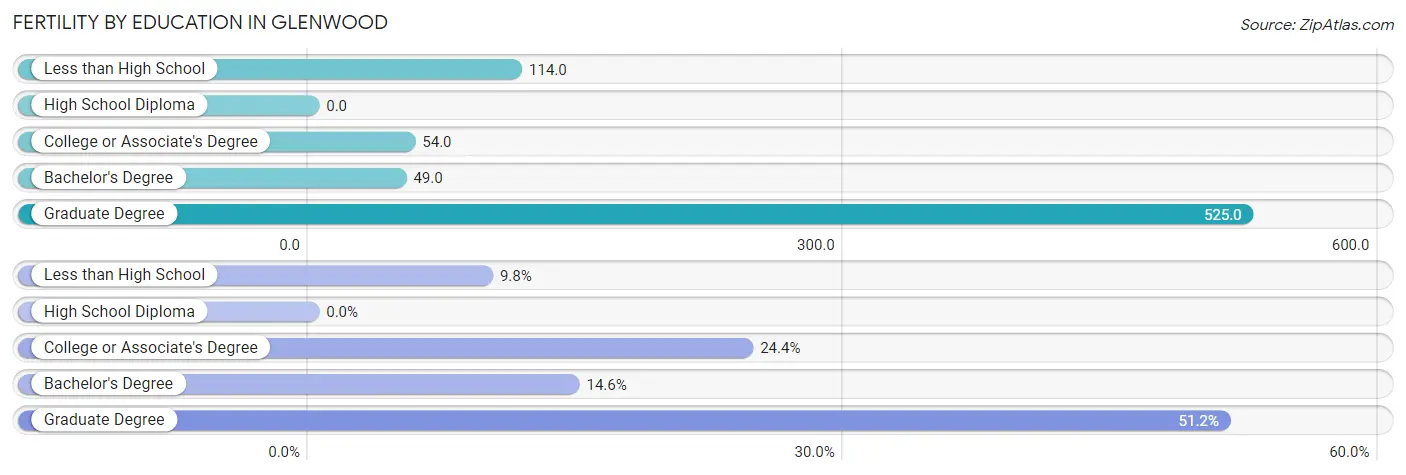
| Educational Attainment | Women with Births | Births / 1,000 Women |
| Less than High School | 4 (9.8%) | 114.0 |
| High School Diploma | 0 (0.0%) | 0.0 |
| College or Associate's Degree | 10 (24.4%) | 54.0 |
| Bachelor's Degree | 6 (14.6%) | 49.0 |
| Graduate Degree | 21 (51.2%) | 525.0 |
| Total | 41 (100.0%) | 92.0 |
Fertility by Education by Marriage Status in Glenwood
34.2% of women with births in Glenwood are unmarried. Women with the educational attainment of college or associate's degree are most likely to be married with 100.0% of them married at childbirth, while women with the educational attainment of less than high school are least likely to be married with 100.0% of them unmarried at childbirth.
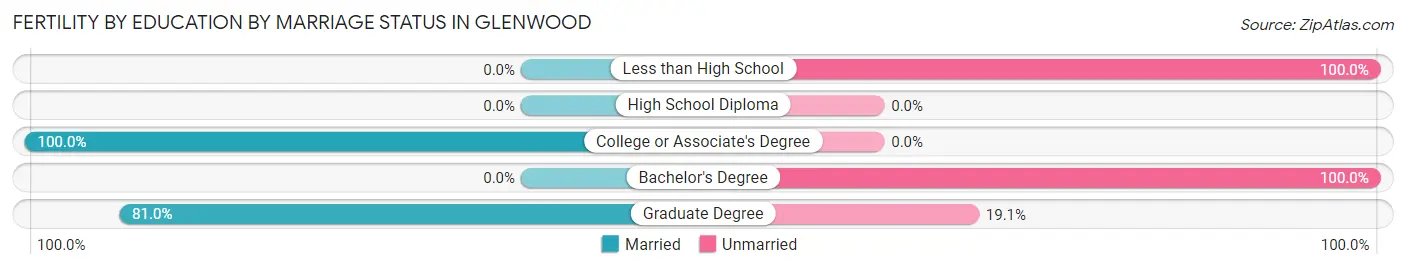
| Educational Attainment | Married | Unmarried |
| Less than High School | 0 (0.0%) | 4 (100.0%) |
| High School Diploma | 0 (0.0%) | 0 (0.0%) |
| College or Associate's Degree | 10 (100.0%) | 0 (0.0%) |
| Bachelor's Degree | 0 (0.0%) | 6 (100.0%) |
| Graduate Degree | 17 (80.9%) | 4 (19.1%) |
| Total | 27 (65.8%) | 14 (34.2%) |
Employment Characteristics in Glenwood
Employment by Class of Employer in Glenwood
Among the 1,374 employed individuals in Glenwood, private company employees (837 | 60.9%), not-for-profit organizations (205 | 14.9%), and self-employed (not incorporated) (141 | 10.3%) make up the most common classes of employment.
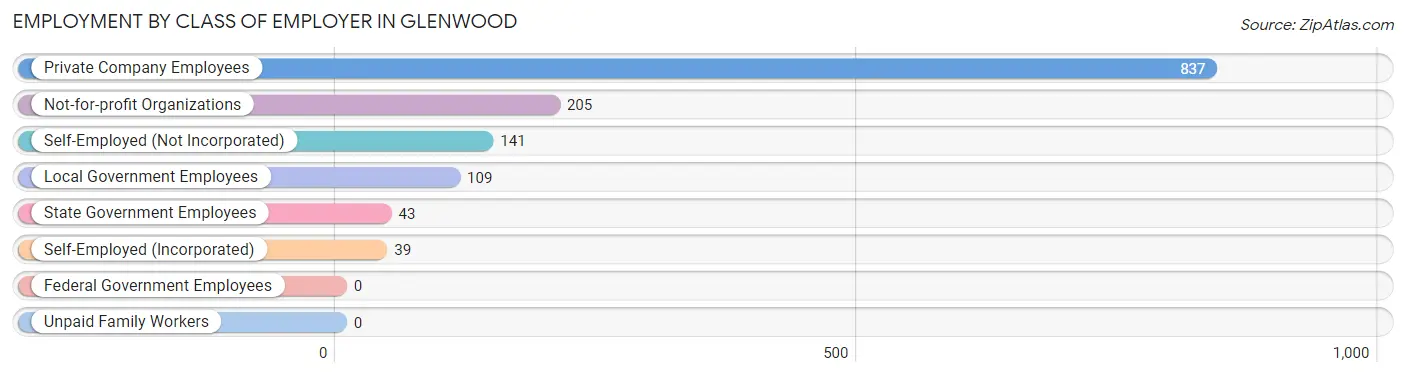
| Employer Class | # Employees | % Employees |
| Private Company Employees | 837 | 60.9% |
| Self-Employed (Incorporated) | 39 | 2.8% |
| Self-Employed (Not Incorporated) | 141 | 10.3% |
| Not-for-profit Organizations | 205 | 14.9% |
| Local Government Employees | 109 | 7.9% |
| State Government Employees | 43 | 3.1% |
| Federal Government Employees | 0 | 0.0% |
| Unpaid Family Workers | 0 | 0.0% |
| Total | 1,374 | 100.0% |
Employment Status by Age in Glenwood
According to the labor force statistics for Glenwood, out of the total population over 16 years of age (2,080), 66.5% or 1,383 individuals are in the labor force, with 0.4% or 6 of them unemployed. The age group with the highest labor force participation rate is 20 to 24 years, with 100.0% or 150 individuals in the labor force. Within the labor force, the 16 to 19 years age range has the highest percentage of unemployed individuals, with 7.2% or 6 of them being unemployed.
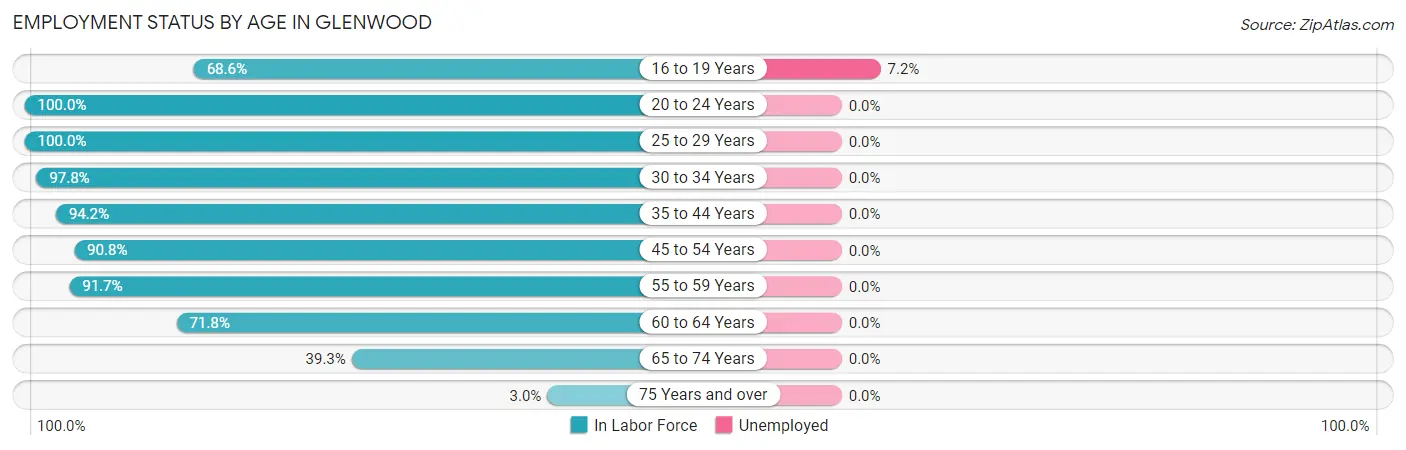
| Age Bracket | In Labor Force | Unemployed |
| 16 to 19 Years | 83 (68.6%) | 6 (7.2%) |
| 20 to 24 Years | 150 (100.0%) | 0 (0.0%) |
| 25 to 29 Years | 104 (100.0%) | 0 (0.0%) |
| 30 to 34 Years | 182 (97.8%) | 0 (0.0%) |
| 35 to 44 Years | 309 (94.2%) | 0 (0.0%) |
| 45 to 54 Years | 177 (90.8%) | 0 (0.0%) |
| 55 to 59 Years | 111 (91.7%) | 0 (0.0%) |
| 60 to 64 Years | 130 (71.8%) | 0 (0.0%) |
| 65 to 74 Years | 127 (39.3%) | 0 (0.0%) |
| 75 Years and over | 11 (3.0%) | 0 (0.0%) |
| Total | 1,383 (66.5%) | 6 (0.4%) |
Employment Status by Educational Attainment in Glenwood
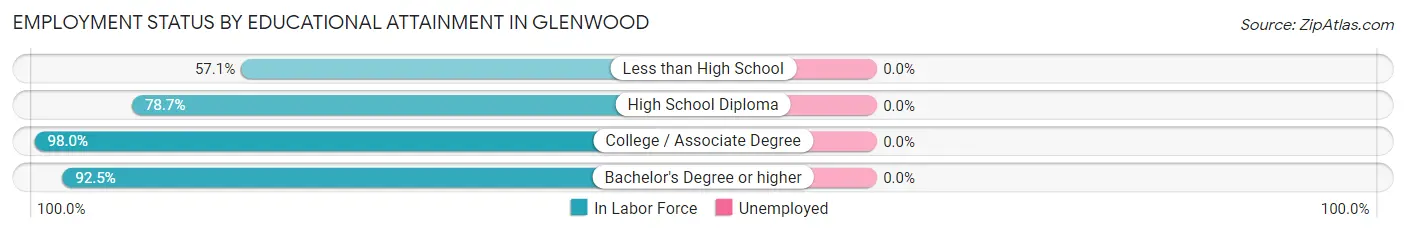
| Educational Attainment | In Labor Force | Unemployed |
| Less than High School | 16 (57.1%) | 0 (0.0%) |
| High School Diploma | 210 (78.7%) | 0 (0.0%) |
| College / Associate Degree | 502 (98.0%) | 0 (0.0%) |
| Bachelor's Degree or higher | 285 (92.5%) | 0 (0.0%) |
| Total | 1,014 (90.9%) | 0 (0.0%) |
Employment Occupations by Sex in Glenwood
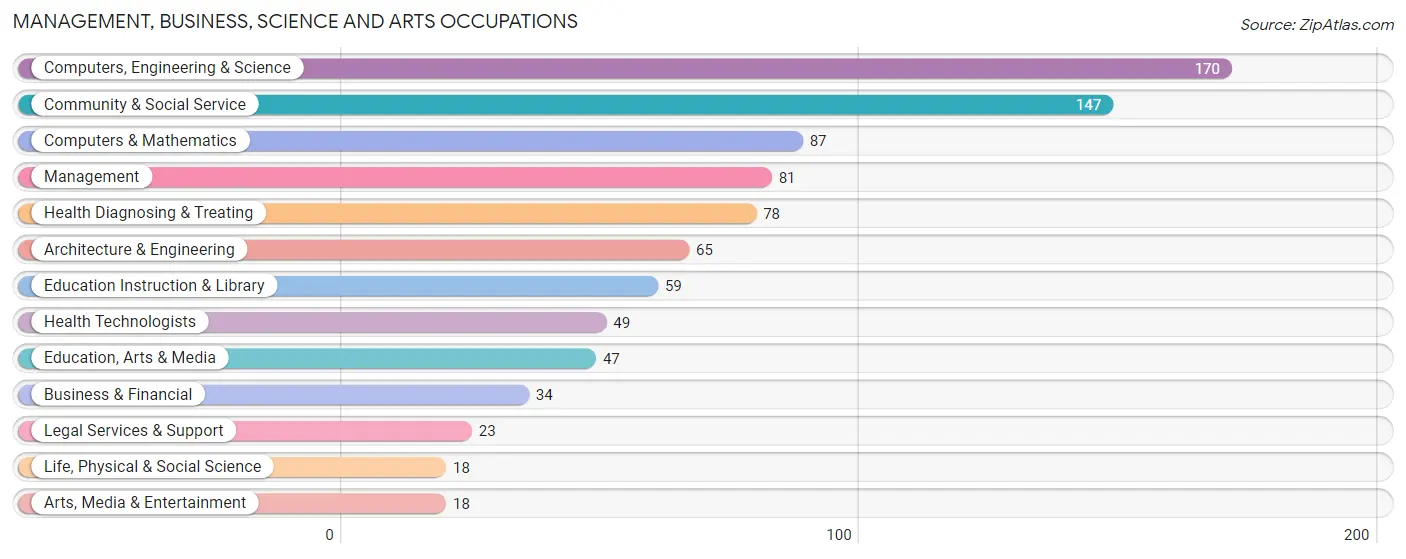
Management, Business, Science and Arts Occupations
The most common Management, Business, Science and Arts occupations in Glenwood are Computers, Engineering & Science (170 | 12.3%), Community & Social Service (147 | 10.7%), Computers & Mathematics (87 | 6.3%), Management (81 | 5.9%), and Health Diagnosing & Treating (78 | 5.7%).
Management, Business, Science and Arts Occupations by Sex
Within the Management, Business, Science and Arts occupations in Glenwood, the most male-oriented occupations are Management (100.0%), Business & Financial (61.8%), and Architecture & Engineering (58.5%), while the most female-oriented occupations are Computers & Mathematics (100.0%), Life, Physical & Social Science (100.0%), and Legal Services & Support (100.0%).
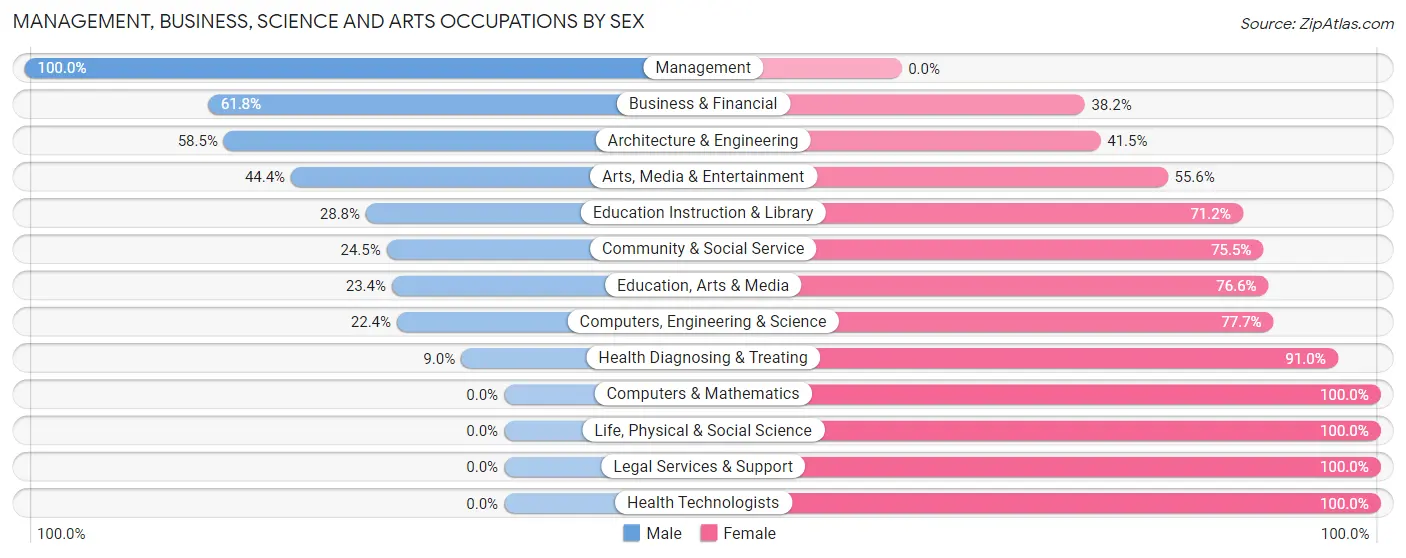
| Occupation | Male | Female |
| Management | 81 (100.0%) | 0 (0.0%) |
| Business & Financial | 21 (61.8%) | 13 (38.2%) |
| Computers, Engineering & Science | 38 (22.4%) | 132 (77.6%) |
| Computers & Mathematics | 0 (0.0%) | 87 (100.0%) |
| Architecture & Engineering | 38 (58.5%) | 27 (41.5%) |
| Life, Physical & Social Science | 0 (0.0%) | 18 (100.0%) |
| Community & Social Service | 36 (24.5%) | 111 (75.5%) |
| Education, Arts & Media | 11 (23.4%) | 36 (76.6%) |
| Legal Services & Support | 0 (0.0%) | 23 (100.0%) |
| Education Instruction & Library | 17 (28.8%) | 42 (71.2%) |
| Arts, Media & Entertainment | 8 (44.4%) | 10 (55.6%) |
| Health Diagnosing & Treating | 7 (9.0%) | 71 (91.0%) |
| Health Technologists | 0 (0.0%) | 49 (100.0%) |
| Total (Category) | 183 (35.9%) | 327 (64.1%) |
| Total (Overall) | 691 (50.1%) | 687 (49.8%) |
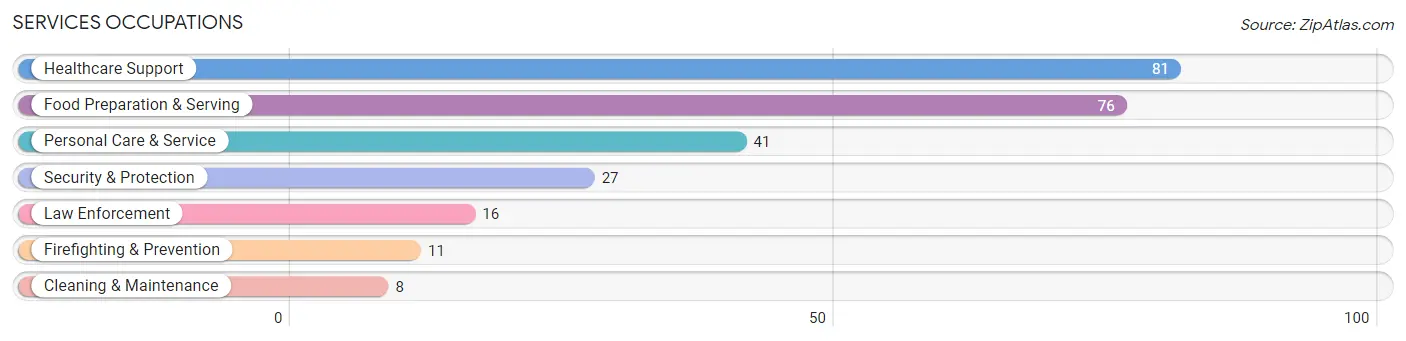
Services Occupations
The most common Services occupations in Glenwood are Healthcare Support (81 | 5.9%), Food Preparation & Serving (76 | 5.5%), Personal Care & Service (41 | 3.0%), Security & Protection (27 | 2.0%), and Law Enforcement (16 | 1.2%).
Services Occupations by Sex
Within the Services occupations in Glenwood, the most male-oriented occupations are Cleaning & Maintenance (75.0%), Food Preparation & Serving (63.2%), and Law Enforcement (56.2%), while the most female-oriented occupations are Healthcare Support (100.0%), Firefighting & Prevention (100.0%), and Security & Protection (66.7%).
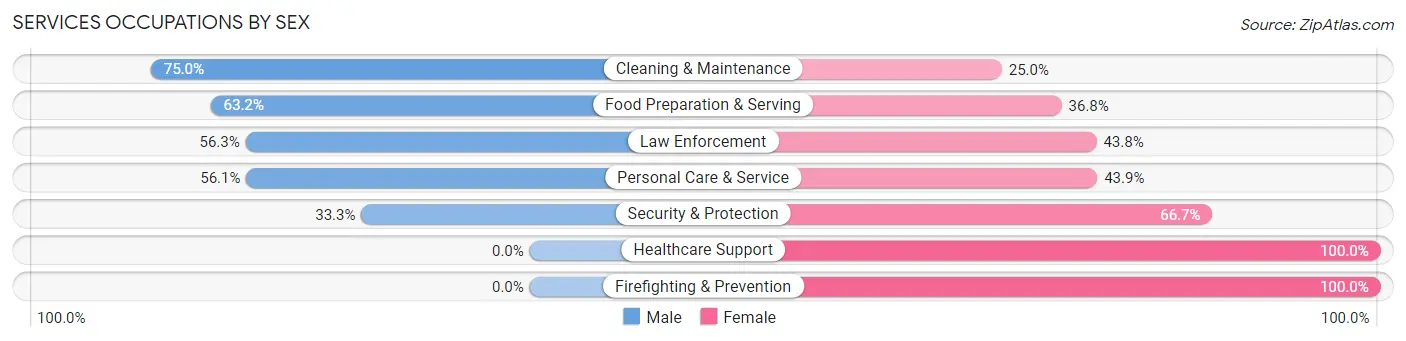
| Occupation | Male | Female |
| Healthcare Support | 0 (0.0%) | 81 (100.0%) |
| Security & Protection | 9 (33.3%) | 18 (66.7%) |
| Firefighting & Prevention | 0 (0.0%) | 11 (100.0%) |
| Law Enforcement | 9 (56.2%) | 7 (43.8%) |
| Food Preparation & Serving | 48 (63.2%) | 28 (36.8%) |
| Cleaning & Maintenance | 6 (75.0%) | 2 (25.0%) |
| Personal Care & Service | 23 (56.1%) | 18 (43.9%) |
| Total (Category) | 86 (36.9%) | 147 (63.1%) |
| Total (Overall) | 691 (50.1%) | 687 (49.8%) |
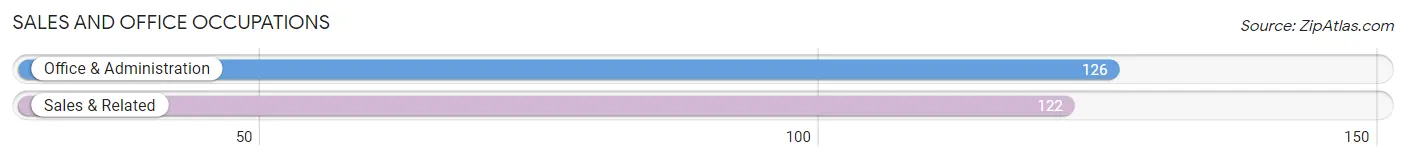
Sales and Office Occupations
The most common Sales and Office occupations in Glenwood are Office & Administration (126 | 9.1%), and Sales & Related (122 | 8.8%).
Sales and Office Occupations by Sex
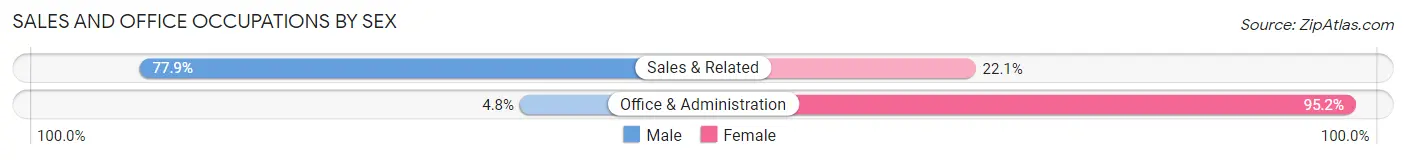
| Occupation | Male | Female |
| Sales & Related | 95 (77.9%) | 27 (22.1%) |
| Office & Administration | 6 (4.8%) | 120 (95.2%) |
| Total (Category) | 101 (40.7%) | 147 (59.3%) |
| Total (Overall) | 691 (50.1%) | 687 (49.8%) |
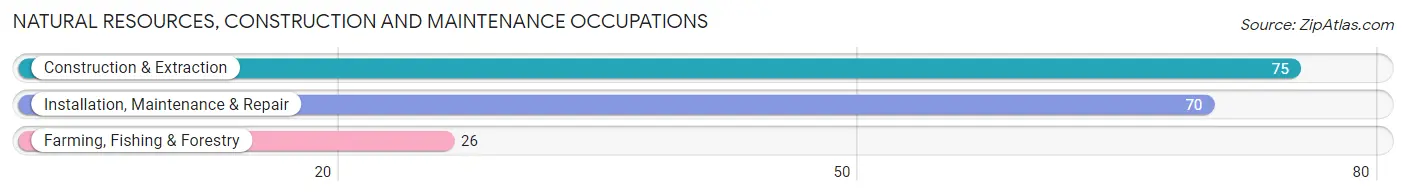
Natural Resources, Construction and Maintenance Occupations
The most common Natural Resources, Construction and Maintenance occupations in Glenwood are Construction & Extraction (75 | 5.4%), Installation, Maintenance & Repair (70 | 5.1%), and Farming, Fishing & Forestry (26 | 1.9%).
Natural Resources, Construction and Maintenance Occupations by Sex
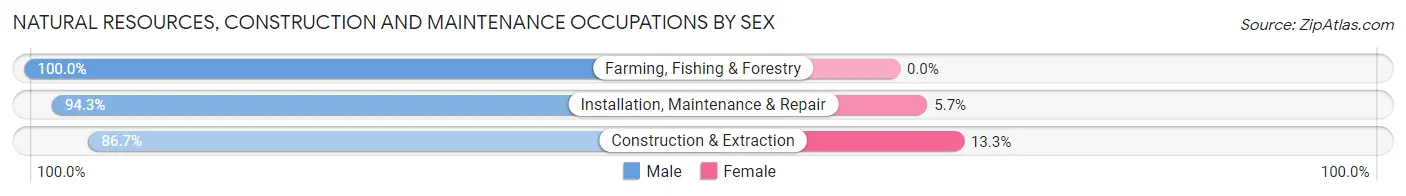
| Occupation | Male | Female |
| Farming, Fishing & Forestry | 26 (100.0%) | 0 (0.0%) |
| Construction & Extraction | 65 (86.7%) | 10 (13.3%) |
| Installation, Maintenance & Repair | 66 (94.3%) | 4 (5.7%) |
| Total (Category) | 157 (91.8%) | 14 (8.2%) |
| Total (Overall) | 691 (50.1%) | 687 (49.8%) |
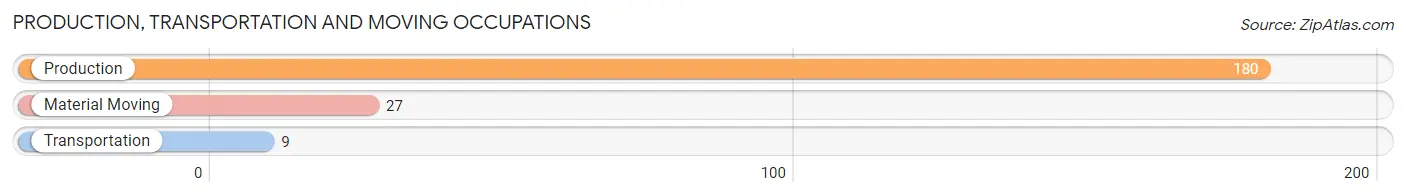
Production, Transportation and Moving Occupations
The most common Production, Transportation and Moving occupations in Glenwood are Production (180 | 13.1%), Material Moving (27 | 2.0%), and Transportation (9 | 0.6%).
Production, Transportation and Moving Occupations by Sex
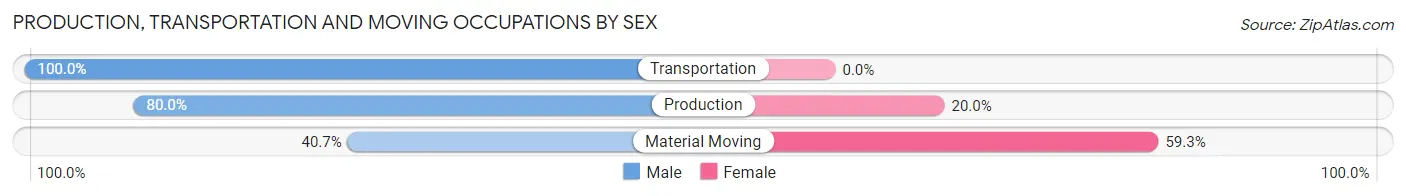
| Occupation | Male | Female |
| Production | 144 (80.0%) | 36 (20.0%) |
| Transportation | 9 (100.0%) | 0 (0.0%) |
| Material Moving | 11 (40.7%) | 16 (59.3%) |
| Total (Category) | 164 (75.9%) | 52 (24.1%) |
| Total (Overall) | 691 (50.1%) | 687 (49.8%) |
Employment Industries by Sex in Glenwood
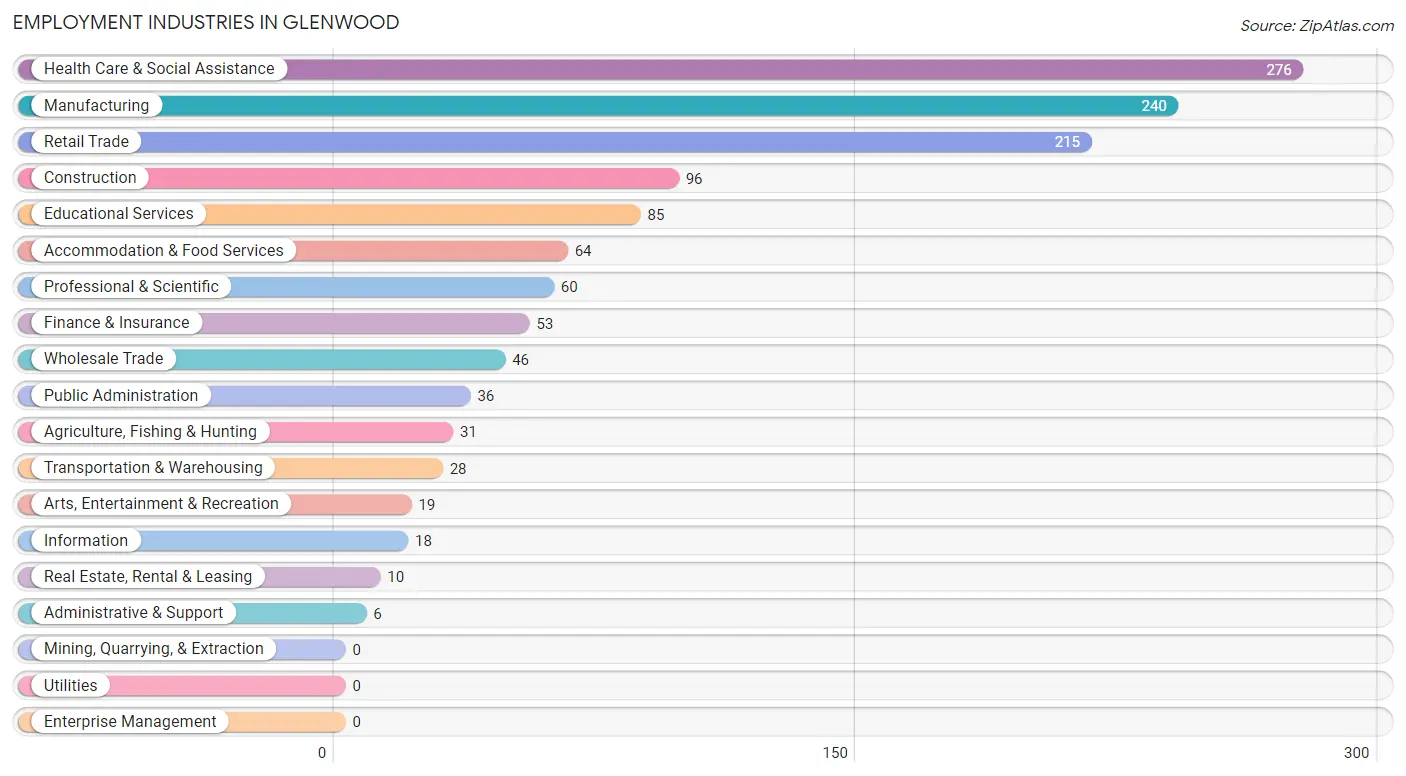
Employment Industries in Glenwood
The major employment industries in Glenwood include Health Care & Social Assistance (276 | 20.0%), Manufacturing (240 | 17.4%), Retail Trade (215 | 15.6%), Construction (96 | 7.0%), and Educational Services (85 | 6.2%).
Employment Industries by Sex in Glenwood
The Glenwood industries that see more men than women are Agriculture, Fishing & Hunting (100.0%), Wholesale Trade (100.0%), and Administrative & Support (100.0%), whereas the industries that tend to have a higher number of women are Real Estate, Rental & Leasing (100.0%), Arts, Entertainment & Recreation (94.7%), and Professional & Scientific (86.7%).
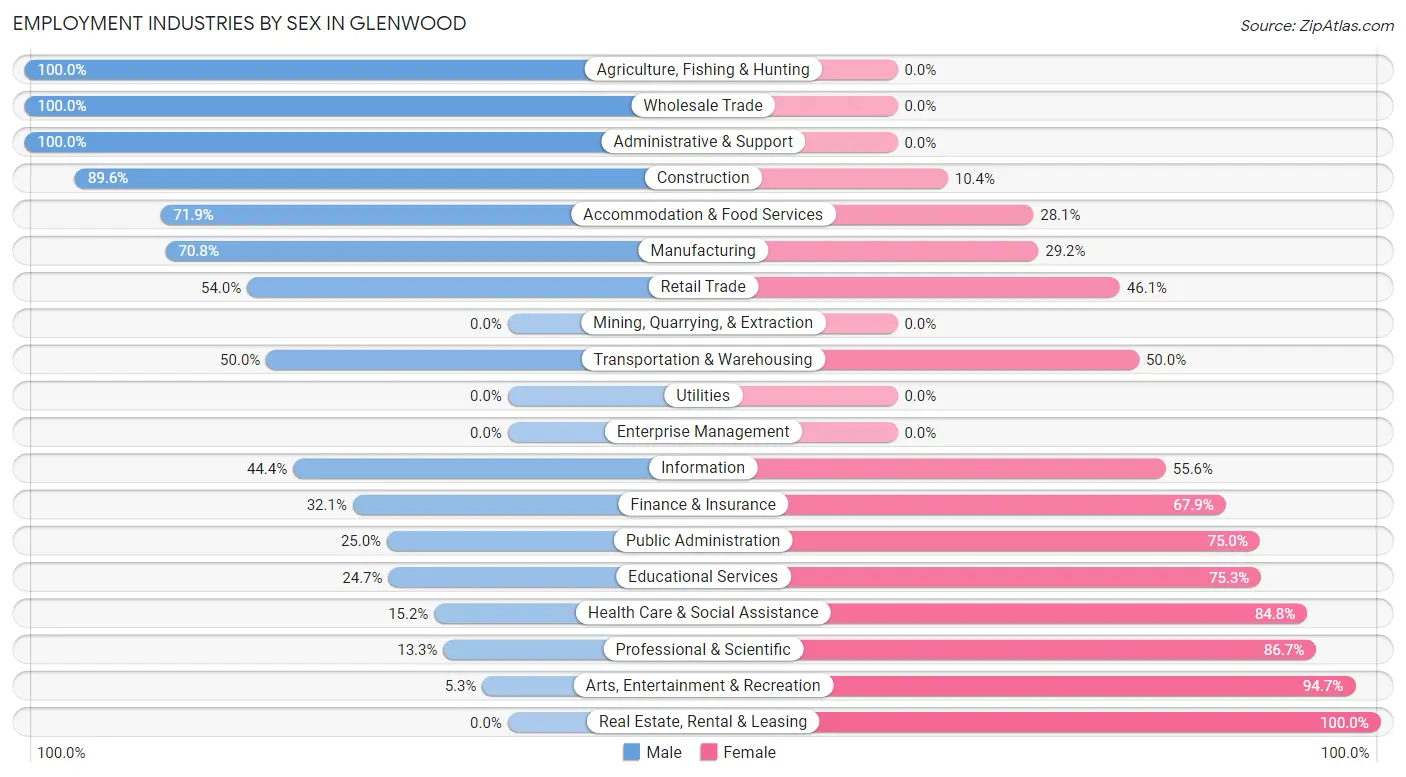
| Industry | Male | Female |
| Agriculture, Fishing & Hunting | 31 (100.0%) | 0 (0.0%) |
| Mining, Quarrying, & Extraction | 0 (0.0%) | 0 (0.0%) |
| Construction | 86 (89.6%) | 10 (10.4%) |
| Manufacturing | 170 (70.8%) | 70 (29.2%) |
| Wholesale Trade | 46 (100.0%) | 0 (0.0%) |
| Retail Trade | 116 (53.9%) | 99 (46.1%) |
| Transportation & Warehousing | 14 (50.0%) | 14 (50.0%) |
| Utilities | 0 (0.0%) | 0 (0.0%) |
| Information | 8 (44.4%) | 10 (55.6%) |
| Finance & Insurance | 17 (32.1%) | 36 (67.9%) |
| Real Estate, Rental & Leasing | 0 (0.0%) | 10 (100.0%) |
| Professional & Scientific | 8 (13.3%) | 52 (86.7%) |
| Enterprise Management | 0 (0.0%) | 0 (0.0%) |
| Administrative & Support | 6 (100.0%) | 0 (0.0%) |
| Educational Services | 21 (24.7%) | 64 (75.3%) |
| Health Care & Social Assistance | 42 (15.2%) | 234 (84.8%) |
| Arts, Entertainment & Recreation | 1 (5.3%) | 18 (94.7%) |
| Accommodation & Food Services | 46 (71.9%) | 18 (28.1%) |
| Public Administration | 9 (25.0%) | 27 (75.0%) |
| Total | 691 (50.1%) | 687 (49.8%) |
Education in Glenwood
School Enrollment in Glenwood
The most common levels of schooling among the 633 students in Glenwood are elementary school (220 | 34.8%), middle school (136 | 21.5%), and high school (133 | 21.0%).
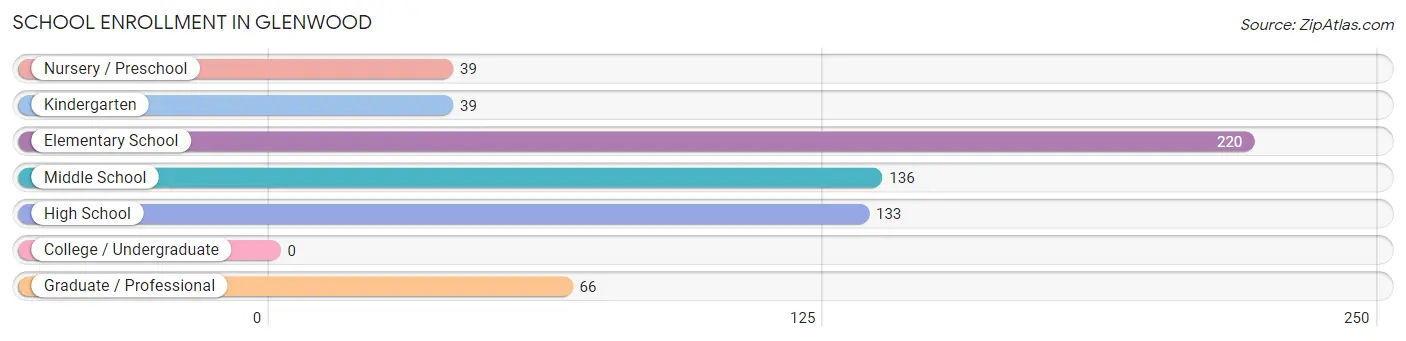
| School Level | # Students | % Students |
| Nursery / Preschool | 39 | 6.2% |
| Kindergarten | 39 | 6.2% |
| Elementary School | 220 | 34.8% |
| Middle School | 136 | 21.5% |
| High School | 133 | 21.0% |
| College / Undergraduate | 0 | 0.0% |
| Graduate / Professional | 66 | 10.4% |
| Total | 633 | 100.0% |
School Enrollment by Age by Funding Source in Glenwood
Out of a total of 633 students who are enrolled in schools in Glenwood, 66 (10.4%) attend a private institution, while the remaining 567 (89.6%) are enrolled in public schools. The age group of 25 to 34 year olds has the highest likelihood of being enrolled in private schools, with 8 (57.1% in the age bracket) enrolled. Conversely, the age group of 3 to 4 year olds has the lowest likelihood of being enrolled in a private school, with 9 (100.0% in the age bracket) attending a public institution.
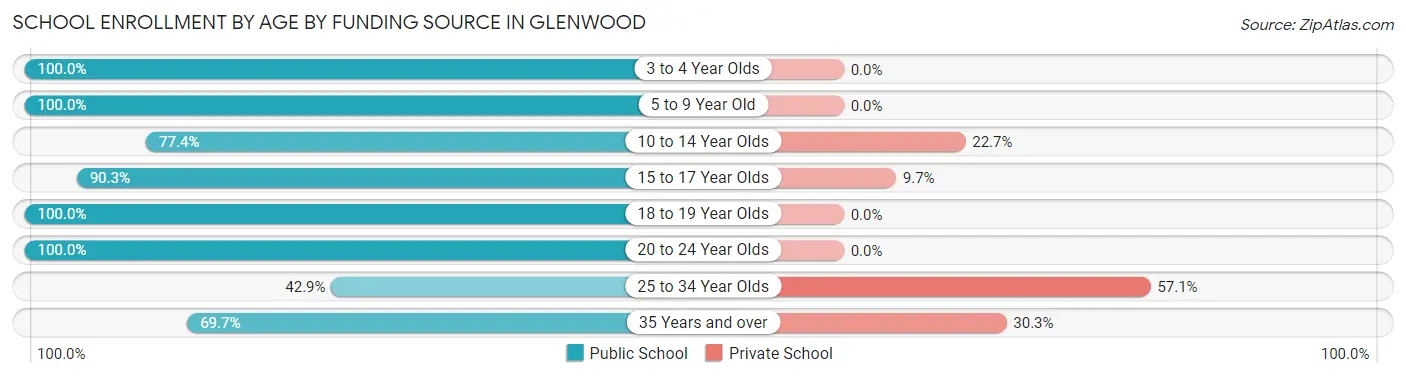
| Age Bracket | Public School | Private School |
| 3 to 4 Year Olds | 9 (100.0%) | 0 (0.0%) |
| 5 to 9 Year Old | 270 (100.0%) | 0 (0.0%) |
| 10 to 14 Year Olds | 140 (77.3%) | 41 (22.7%) |
| 15 to 17 Year Olds | 65 (90.3%) | 7 (9.7%) |
| 18 to 19 Year Olds | 35 (100.0%) | 0 (0.0%) |
| 20 to 24 Year Olds | 19 (100.0%) | 0 (0.0%) |
| 25 to 34 Year Olds | 6 (42.9%) | 8 (57.1%) |
| 35 Years and over | 23 (69.7%) | 10 (30.3%) |
| Total | 567 (89.6%) | 66 (10.4%) |
Educational Attainment by Field of Study in Glenwood
Education (68 | 14.7%), business (67 | 14.5%), arts & humanities (59 | 12.8%), communications (48 | 10.4%), and science & technology (47 | 10.2%) are the most common fields of study among 461 individuals in Glenwood who have obtained a bachelor's degree or higher.
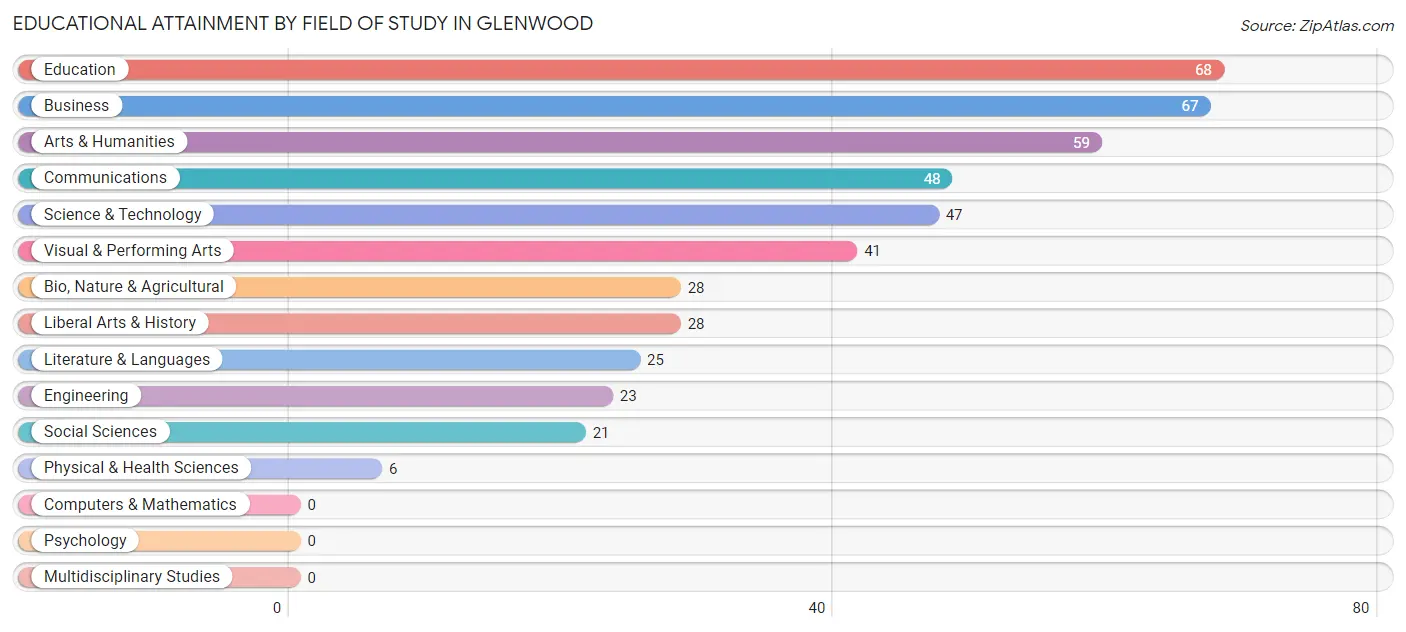
| Field of Study | # Graduates | % Graduates |
| Computers & Mathematics | 0 | 0.0% |
| Bio, Nature & Agricultural | 28 | 6.1% |
| Physical & Health Sciences | 6 | 1.3% |
| Psychology | 0 | 0.0% |
| Social Sciences | 21 | 4.6% |
| Engineering | 23 | 5.0% |
| Multidisciplinary Studies | 0 | 0.0% |
| Science & Technology | 47 | 10.2% |
| Business | 67 | 14.5% |
| Education | 68 | 14.7% |
| Literature & Languages | 25 | 5.4% |
| Liberal Arts & History | 28 | 6.1% |
| Visual & Performing Arts | 41 | 8.9% |
| Communications | 48 | 10.4% |
| Arts & Humanities | 59 | 12.8% |
| Total | 461 | 100.0% |
Transportation & Commute in Glenwood
Vehicle Availability by Sex in Glenwood
The most prevalent vehicle ownership categories in Glenwood are males with 2 vehicles (258, accounting for 37.6%) and females with 2 vehicles (315, making up 37.8%).
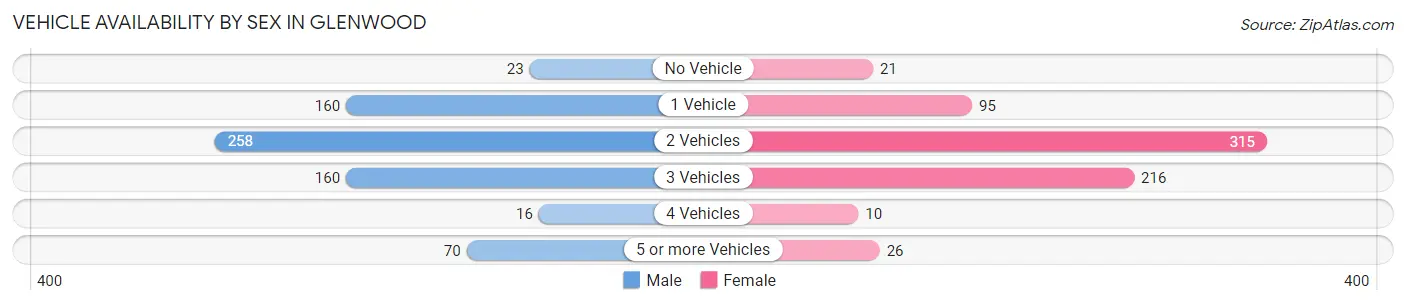
| Vehicles Available | Male | Female |
| No Vehicle | 23 (3.4%) | 21 (3.1%) |
| 1 Vehicle | 160 (23.3%) | 95 (13.9%) |
| 2 Vehicles | 258 (37.6%) | 315 (46.1%) |
| 3 Vehicles | 160 (23.3%) | 216 (31.6%) |
| 4 Vehicles | 16 (2.3%) | 10 (1.5%) |
| 5 or more Vehicles | 70 (10.2%) | 26 (3.8%) |
| Total | 687 (100.0%) | 683 (100.0%) |
Commute Time in Glenwood
The most frequently occuring commute durations in Glenwood are 5 to 9 minutes (360 commuters, 28.0%), less than 5 minutes (250 commuters, 19.5%), and 10 to 14 minutes (197 commuters, 15.3%).
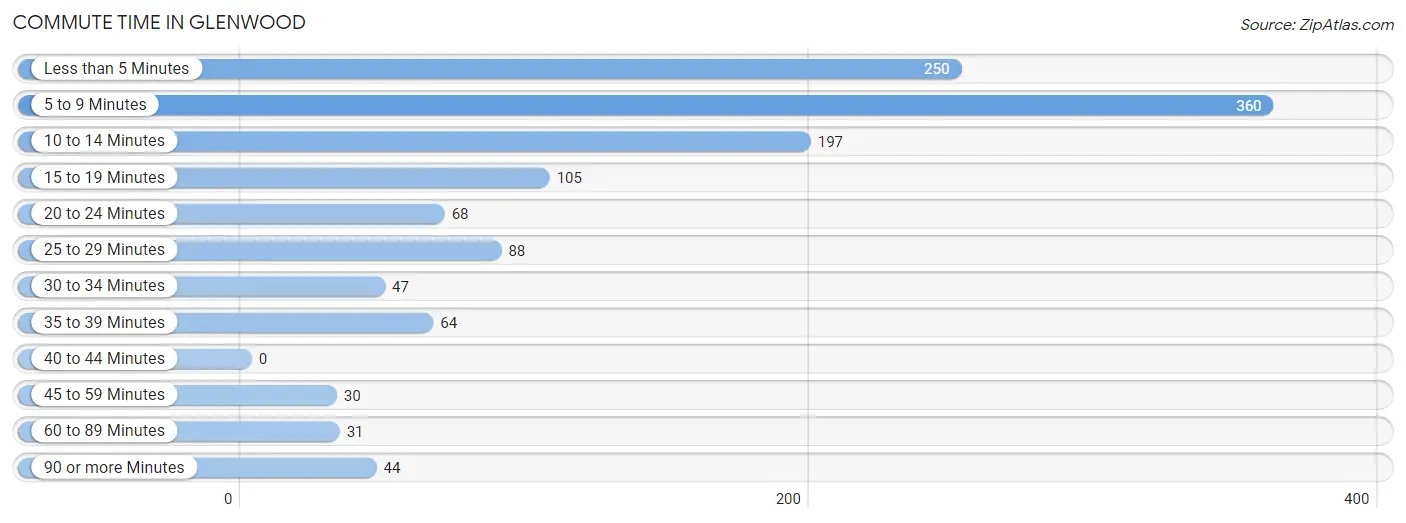
| Commute Time | # Commuters | % Commuters |
| Less than 5 Minutes | 250 | 19.5% |
| 5 to 9 Minutes | 360 | 28.0% |
| 10 to 14 Minutes | 197 | 15.3% |
| 15 to 19 Minutes | 105 | 8.2% |
| 20 to 24 Minutes | 68 | 5.3% |
| 25 to 29 Minutes | 88 | 6.9% |
| 30 to 34 Minutes | 47 | 3.7% |
| 35 to 39 Minutes | 64 | 5.0% |
| 40 to 44 Minutes | 0 | 0.0% |
| 45 to 59 Minutes | 30 | 2.3% |
| 60 to 89 Minutes | 31 | 2.4% |
| 90 or more Minutes | 44 | 3.4% |
Commute Time by Sex in Glenwood
The most common commute times in Glenwood are 5 to 9 minutes (149 commuters, 22.5%) for males and 5 to 9 minutes (211 commuters, 33.9%) for females.
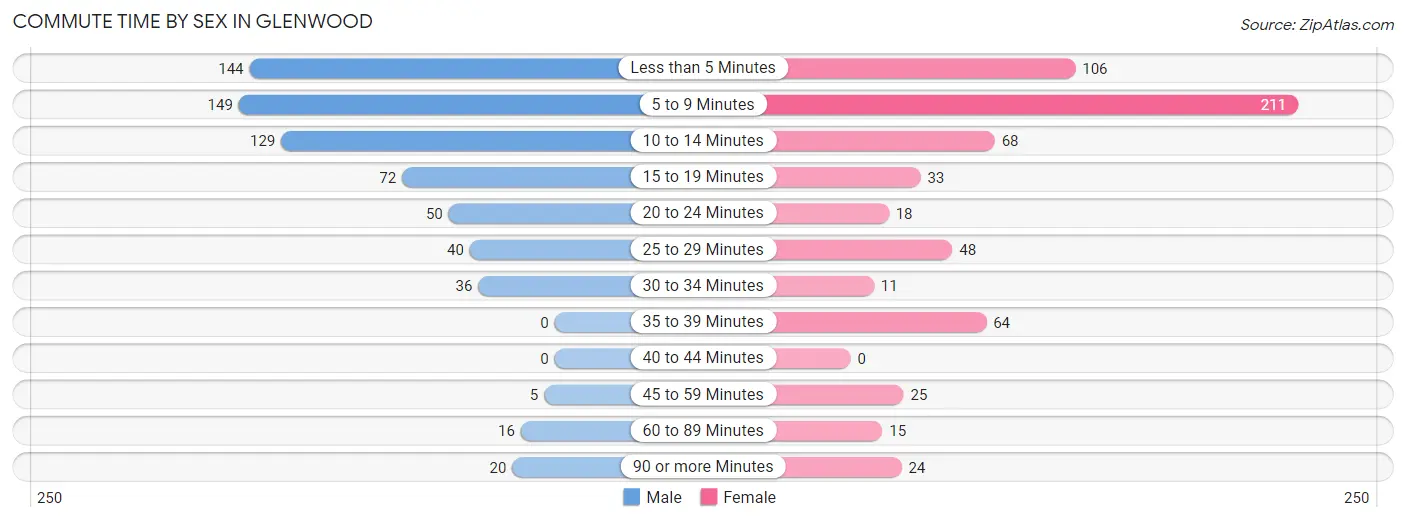
| Commute Time | Male | Female |
| Less than 5 Minutes | 144 (21.8%) | 106 (17.0%) |
| 5 to 9 Minutes | 149 (22.5%) | 211 (33.9%) |
| 10 to 14 Minutes | 129 (19.5%) | 68 (10.9%) |
| 15 to 19 Minutes | 72 (10.9%) | 33 (5.3%) |
| 20 to 24 Minutes | 50 (7.6%) | 18 (2.9%) |
| 25 to 29 Minutes | 40 (6.0%) | 48 (7.7%) |
| 30 to 34 Minutes | 36 (5.4%) | 11 (1.8%) |
| 35 to 39 Minutes | 0 (0.0%) | 64 (10.3%) |
| 40 to 44 Minutes | 0 (0.0%) | 0 (0.0%) |
| 45 to 59 Minutes | 5 (0.8%) | 25 (4.0%) |
| 60 to 89 Minutes | 16 (2.4%) | 15 (2.4%) |
| 90 or more Minutes | 20 (3.0%) | 24 (3.8%) |
Time of Departure to Work by Sex in Glenwood
The most frequent times of departure to work in Glenwood are 7:30 AM to 7:59 AM (108, 16.3%) for males and 7:00 AM to 7:29 AM (150, 24.1%) for females.
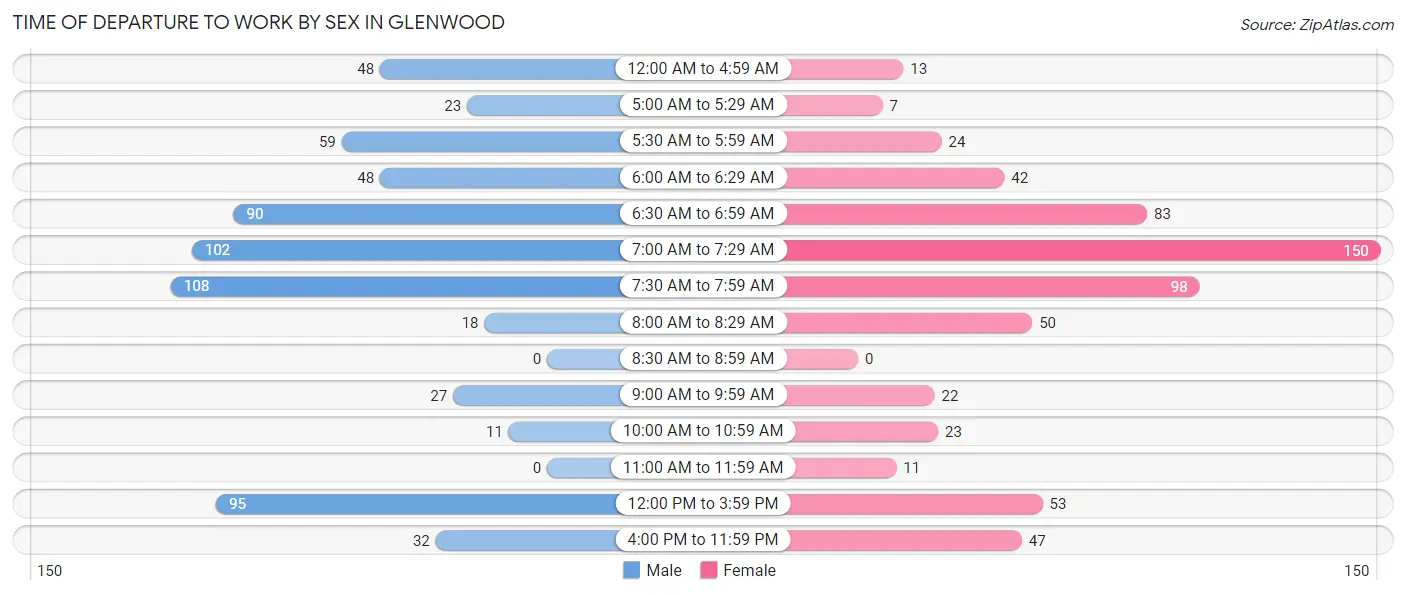
| Time of Departure | Male | Female |
| 12:00 AM to 4:59 AM | 48 (7.3%) | 13 (2.1%) |
| 5:00 AM to 5:29 AM | 23 (3.5%) | 7 (1.1%) |
| 5:30 AM to 5:59 AM | 59 (8.9%) | 24 (3.8%) |
| 6:00 AM to 6:29 AM | 48 (7.3%) | 42 (6.7%) |
| 6:30 AM to 6:59 AM | 90 (13.6%) | 83 (13.3%) |
| 7:00 AM to 7:29 AM | 102 (15.4%) | 150 (24.1%) |
| 7:30 AM to 7:59 AM | 108 (16.3%) | 98 (15.7%) |
| 8:00 AM to 8:29 AM | 18 (2.7%) | 50 (8.0%) |
| 8:30 AM to 8:59 AM | 0 (0.0%) | 0 (0.0%) |
| 9:00 AM to 9:59 AM | 27 (4.1%) | 22 (3.5%) |
| 10:00 AM to 10:59 AM | 11 (1.7%) | 23 (3.7%) |
| 11:00 AM to 11:59 AM | 0 (0.0%) | 11 (1.8%) |
| 12:00 PM to 3:59 PM | 95 (14.4%) | 53 (8.5%) |
| 4:00 PM to 11:59 PM | 32 (4.8%) | 47 (7.5%) |
| Total | 661 (100.0%) | 623 (100.0%) |
Housing Occupancy in Glenwood
Occupancy by Ownership in Glenwood
Of the total 1,181 dwellings in Glenwood, owner-occupied units account for 704 (59.6%), while renter-occupied units make up 477 (40.4%).
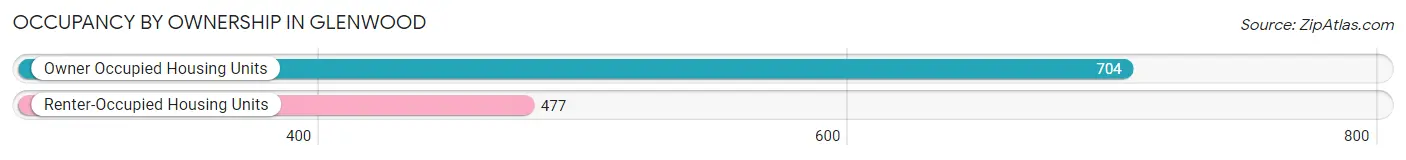
| Occupancy | # Housing Units | % Housing Units |
| Owner Occupied Housing Units | 704 | 59.6% |
| Renter-Occupied Housing Units | 477 | 40.4% |
| Total Occupied Housing Units | 1,181 | 100.0% |
Occupancy by Household Size in Glenwood
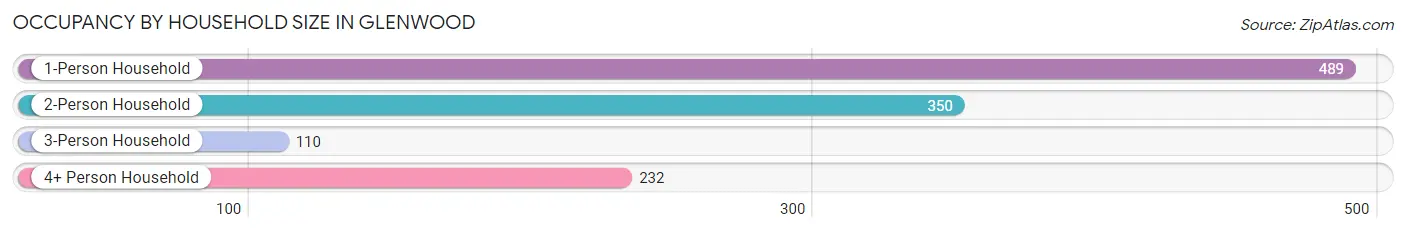
| Household Size | # Housing Units | % Housing Units |
| 1-Person Household | 489 | 41.4% |
| 2-Person Household | 350 | 29.6% |
| 3-Person Household | 110 | 9.3% |
| 4+ Person Household | 232 | 19.6% |
| Total Housing Units | 1,181 | 100.0% |
Occupancy by Ownership by Household Size in Glenwood
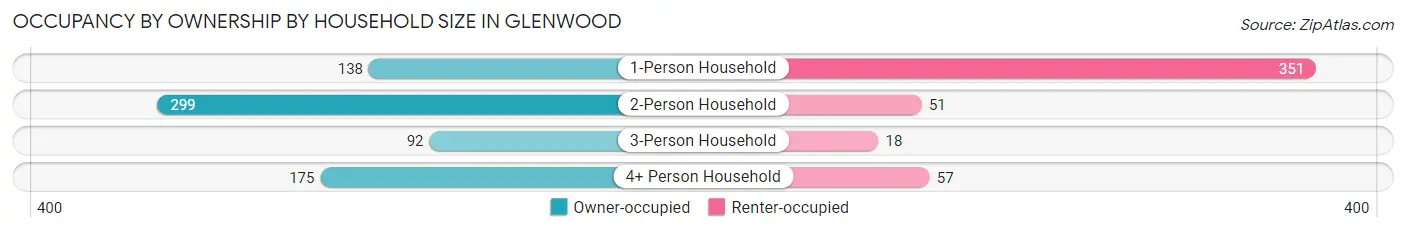
| Household Size | Owner-occupied | Renter-occupied |
| 1-Person Household | 138 (28.2%) | 351 (71.8%) |
| 2-Person Household | 299 (85.4%) | 51 (14.6%) |
| 3-Person Household | 92 (83.6%) | 18 (16.4%) |
| 4+ Person Household | 175 (75.4%) | 57 (24.6%) |
| Total Housing Units | 704 (59.6%) | 477 (40.4%) |
Occupancy by Educational Attainment in Glenwood
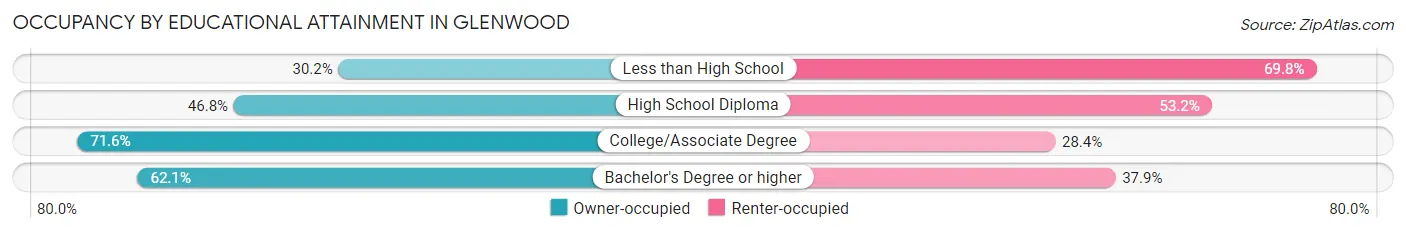
| Household Size | Owner-occupied | Renter-occupied |
| Less than High School | 29 (30.2%) | 67 (69.8%) |
| High School Diploma | 139 (46.8%) | 158 (53.2%) |
| College/Associate Degree | 351 (71.6%) | 139 (28.4%) |
| Bachelor's Degree or higher | 185 (62.1%) | 113 (37.9%) |
Occupancy by Age of Householder in Glenwood
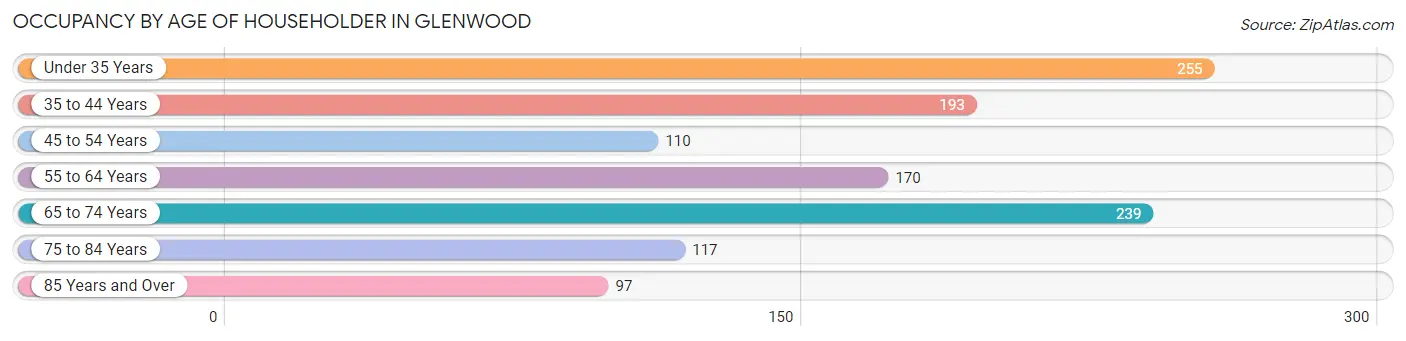
| Age Bracket | # Households | % Households |
| Under 35 Years | 255 | 21.6% |
| 35 to 44 Years | 193 | 16.3% |
| 45 to 54 Years | 110 | 9.3% |
| 55 to 64 Years | 170 | 14.4% |
| 65 to 74 Years | 239 | 20.2% |
| 75 to 84 Years | 117 | 9.9% |
| 85 Years and Over | 97 | 8.2% |
| Total | 1,181 | 100.0% |
Housing Finances in Glenwood
Median Income by Occupancy in Glenwood
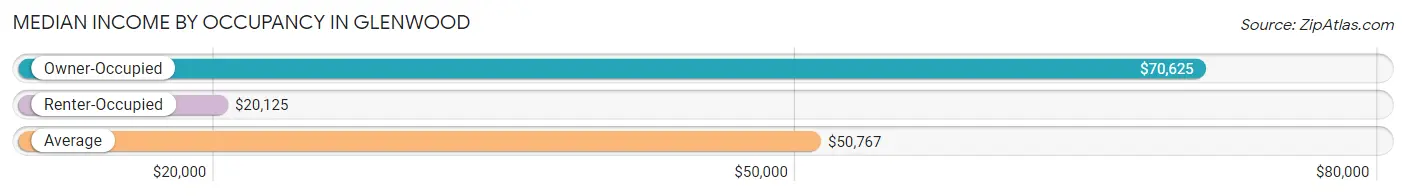
| Occupancy Type | # Households | Median Income |
| Owner-Occupied | 704 (59.6%) | $70,625 |
| Renter-Occupied | 477 (40.4%) | $20,125 |
| Average | 1,181 (100.0%) | $50,767 |
Occupancy by Householder Income Bracket in Glenwood
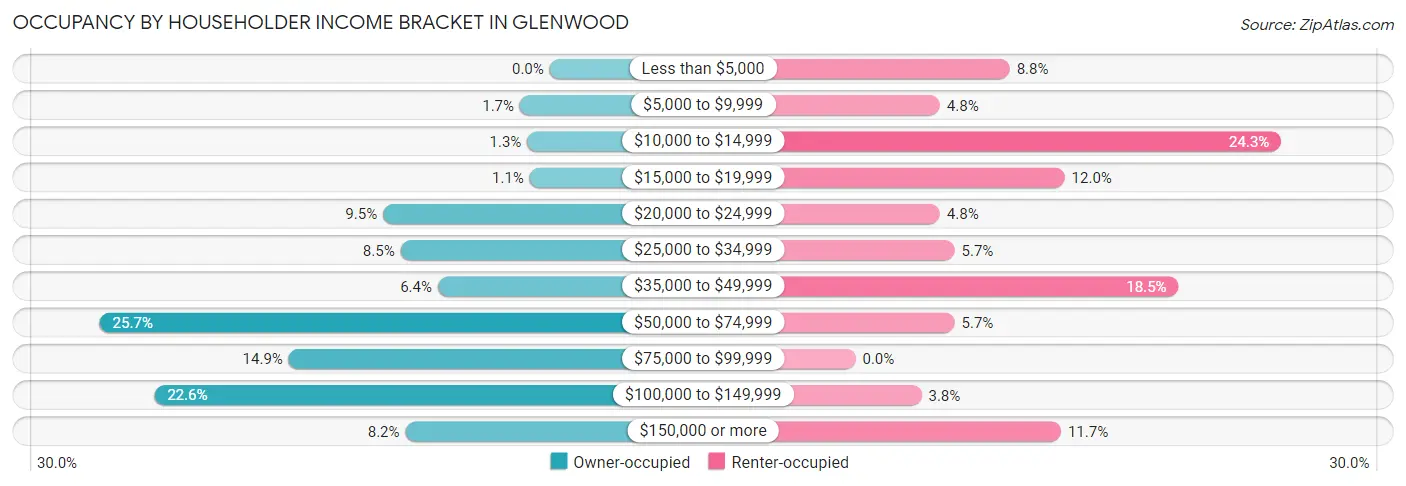
| Income Bracket | Owner-occupied | Renter-occupied |
| Less than $5,000 | 0 (0.0%) | 42 (8.8%) |
| $5,000 to $9,999 | 12 (1.7%) | 23 (4.8%) |
| $10,000 to $14,999 | 9 (1.3%) | 116 (24.3%) |
| $15,000 to $19,999 | 8 (1.1%) | 57 (11.9%) |
| $20,000 to $24,999 | 67 (9.5%) | 23 (4.8%) |
| $25,000 to $34,999 | 60 (8.5%) | 27 (5.7%) |
| $35,000 to $49,999 | 45 (6.4%) | 88 (18.4%) |
| $50,000 to $74,999 | 181 (25.7%) | 27 (5.7%) |
| $75,000 to $99,999 | 105 (14.9%) | 0 (0.0%) |
| $100,000 to $149,999 | 159 (22.6%) | 18 (3.8%) |
| $150,000 or more | 58 (8.2%) | 56 (11.7%) |
| Total | 704 (100.0%) | 477 (100.0%) |
Monthly Housing Cost Tiers in Glenwood
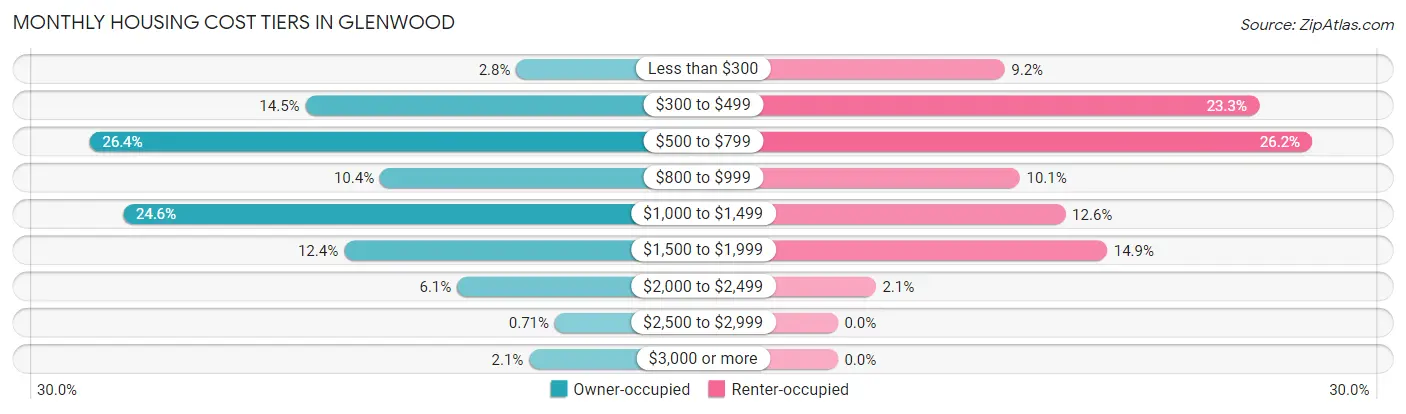
| Monthly Cost | Owner-occupied | Renter-occupied |
| Less than $300 | 20 (2.8%) | 44 (9.2%) |
| $300 to $499 | 102 (14.5%) | 111 (23.3%) |
| $500 to $799 | 186 (26.4%) | 125 (26.2%) |
| $800 to $999 | 73 (10.4%) | 48 (10.1%) |
| $1,000 to $1,499 | 173 (24.6%) | 60 (12.6%) |
| $1,500 to $1,999 | 87 (12.4%) | 71 (14.9%) |
| $2,000 to $2,499 | 43 (6.1%) | 10 (2.1%) |
| $2,500 to $2,999 | 5 (0.7%) | 0 (0.0%) |
| $3,000 or more | 15 (2.1%) | 0 (0.0%) |
| Total | 704 (100.0%) | 477 (100.0%) |
Physical Housing Characteristics in Glenwood
Housing Structures in Glenwood
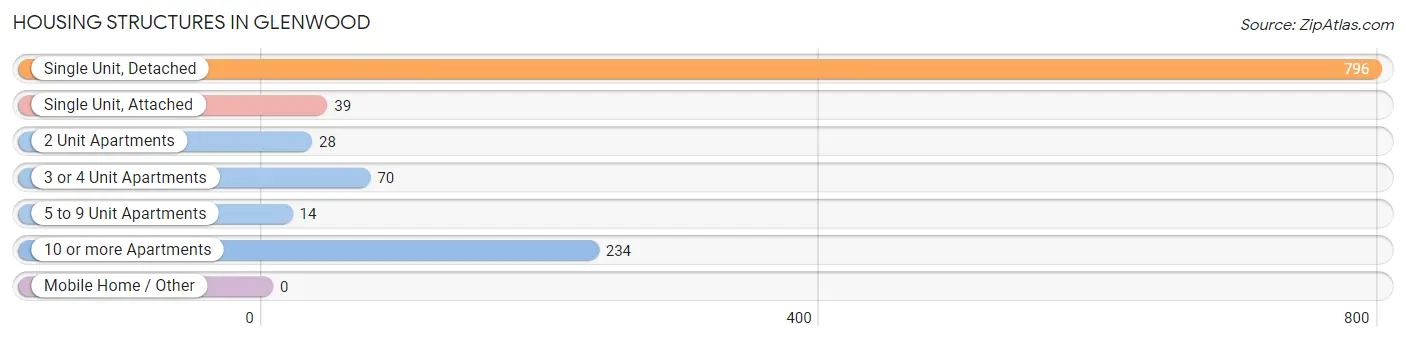
| Structure Type | # Housing Units | % Housing Units |
| Single Unit, Detached | 796 | 67.4% |
| Single Unit, Attached | 39 | 3.3% |
| 2 Unit Apartments | 28 | 2.4% |
| 3 or 4 Unit Apartments | 70 | 5.9% |
| 5 to 9 Unit Apartments | 14 | 1.2% |
| 10 or more Apartments | 234 | 19.8% |
| Mobile Home / Other | 0 | 0.0% |
| Total | 1,181 | 100.0% |
Housing Structures by Occupancy in Glenwood
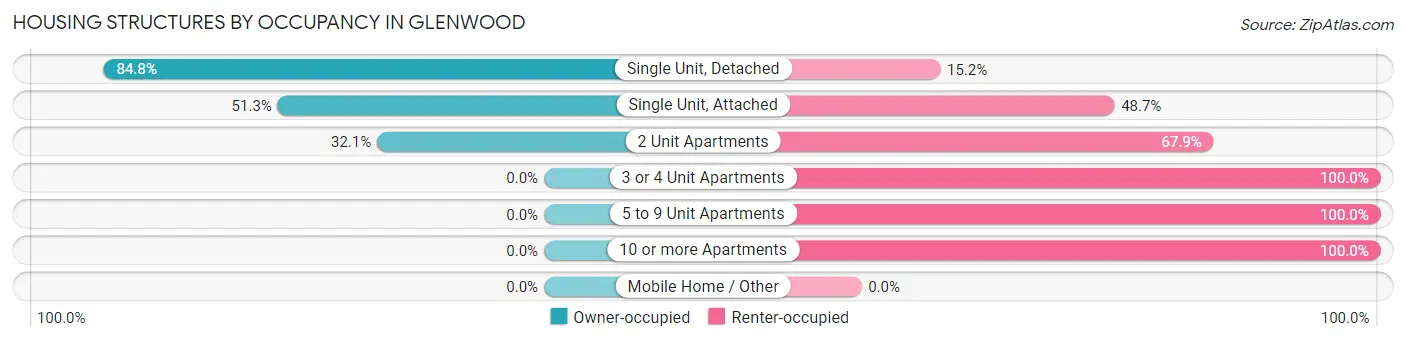
| Structure Type | Owner-occupied | Renter-occupied |
| Single Unit, Detached | 675 (84.8%) | 121 (15.2%) |
| Single Unit, Attached | 20 (51.3%) | 19 (48.7%) |
| 2 Unit Apartments | 9 (32.1%) | 19 (67.9%) |
| 3 or 4 Unit Apartments | 0 (0.0%) | 70 (100.0%) |
| 5 to 9 Unit Apartments | 0 (0.0%) | 14 (100.0%) |
| 10 or more Apartments | 0 (0.0%) | 234 (100.0%) |
| Mobile Home / Other | 0 (0.0%) | 0 (0.0%) |
| Total | 704 (59.6%) | 477 (40.4%) |
Housing Structures by Number of Rooms in Glenwood
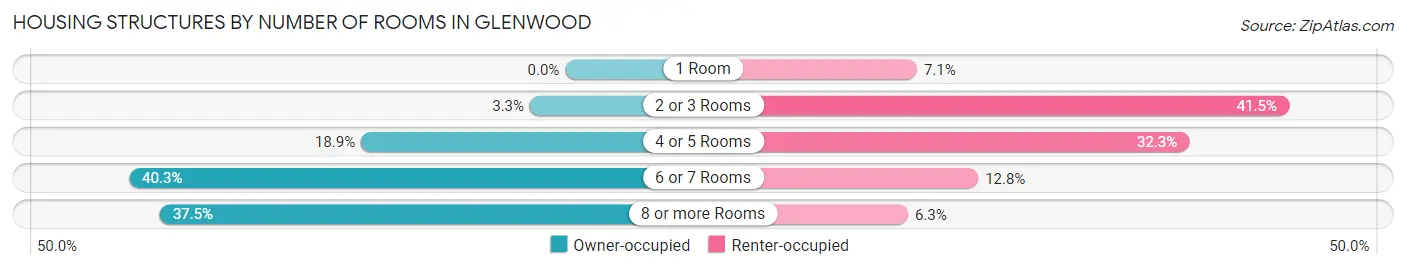
| Number of Rooms | Owner-occupied | Renter-occupied |
| 1 Room | 0 (0.0%) | 34 (7.1%) |
| 2 or 3 Rooms | 23 (3.3%) | 198 (41.5%) |
| 4 or 5 Rooms | 133 (18.9%) | 154 (32.3%) |
| 6 or 7 Rooms | 284 (40.3%) | 61 (12.8%) |
| 8 or more Rooms | 264 (37.5%) | 30 (6.3%) |
| Total | 704 (100.0%) | 477 (100.0%) |
Housing Structure by Heating Type in Glenwood
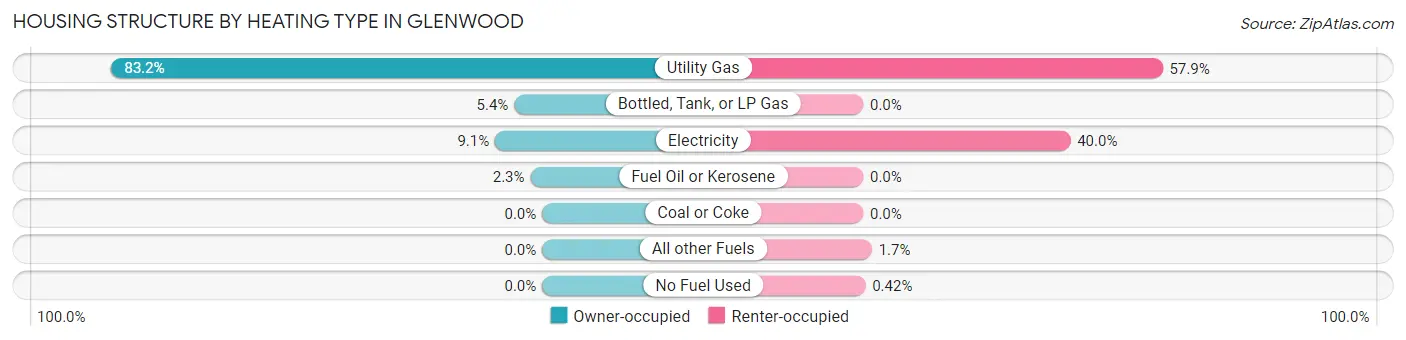
| Heating Type | Owner-occupied | Renter-occupied |
| Utility Gas | 586 (83.2%) | 276 (57.9%) |
| Bottled, Tank, or LP Gas | 38 (5.4%) | 0 (0.0%) |
| Electricity | 64 (9.1%) | 191 (40.0%) |
| Fuel Oil or Kerosene | 16 (2.3%) | 0 (0.0%) |
| Coal or Coke | 0 (0.0%) | 0 (0.0%) |
| All other Fuels | 0 (0.0%) | 8 (1.7%) |
| No Fuel Used | 0 (0.0%) | 2 (0.4%) |
| Total | 704 (100.0%) | 477 (100.0%) |
Household Vehicle Usage in Glenwood
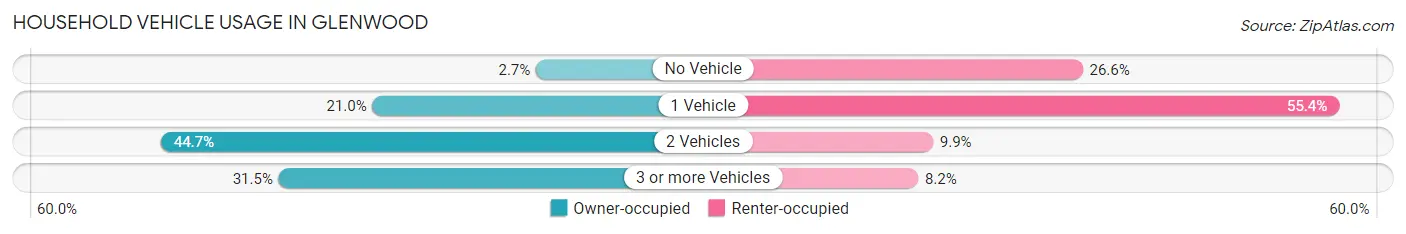
| Vehicles per Household | Owner-occupied | Renter-occupied |
| No Vehicle | 19 (2.7%) | 127 (26.6%) |
| 1 Vehicle | 148 (21.0%) | 264 (55.3%) |
| 2 Vehicles | 315 (44.7%) | 47 (9.9%) |
| 3 or more Vehicles | 222 (31.5%) | 39 (8.2%) |
| Total | 704 (100.0%) | 477 (100.0%) |
Real Estate & Mortgages in Glenwood
Real Estate and Mortgage Overview in Glenwood
| Characteristic | Without Mortgage | With Mortgage |
| Housing Units | 271 | 433 |
| Median Property Value | $137,200 | $186,400 |
| Median Household Income | $53,319 | $47 |
| Monthly Housing Costs | $517 | $15 |
| Real Estate Taxes | $1,719 | $4 |
Property Value by Mortgage Status in Glenwood
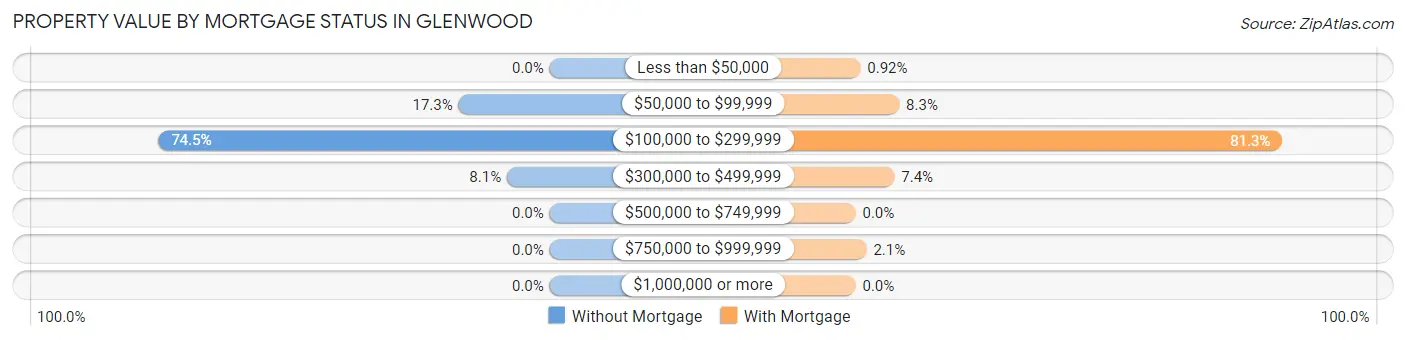
| Property Value | Without Mortgage | With Mortgage |
| Less than $50,000 | 0 (0.0%) | 4 (0.9%) |
| $50,000 to $99,999 | 47 (17.3%) | 36 (8.3%) |
| $100,000 to $299,999 | 202 (74.5%) | 352 (81.3%) |
| $300,000 to $499,999 | 22 (8.1%) | 32 (7.4%) |
| $500,000 to $749,999 | 0 (0.0%) | 0 (0.0%) |
| $750,000 to $999,999 | 0 (0.0%) | 9 (2.1%) |
| $1,000,000 or more | 0 (0.0%) | 0 (0.0%) |
| Total | 271 (100.0%) | 433 (100.0%) |
Household Income by Mortgage Status in Glenwood
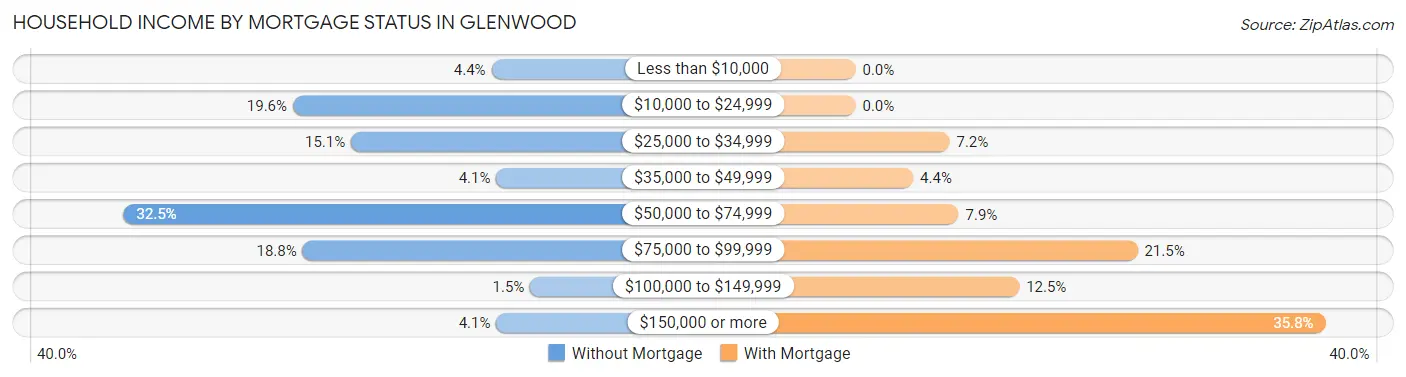
| Household Income | Without Mortgage | With Mortgage |
| Less than $10,000 | 12 (4.4%) | 0 (0.0%) |
| $10,000 to $24,999 | 53 (19.6%) | 0 (0.0%) |
| $25,000 to $34,999 | 41 (15.1%) | 31 (7.2%) |
| $35,000 to $49,999 | 11 (4.1%) | 19 (4.4%) |
| $50,000 to $74,999 | 88 (32.5%) | 34 (7.9%) |
| $75,000 to $99,999 | 51 (18.8%) | 93 (21.5%) |
| $100,000 to $149,999 | 4 (1.5%) | 54 (12.5%) |
| $150,000 or more | 11 (4.1%) | 155 (35.8%) |
| Total | 271 (100.0%) | 433 (100.0%) |
Property Value to Household Income Ratio in Glenwood
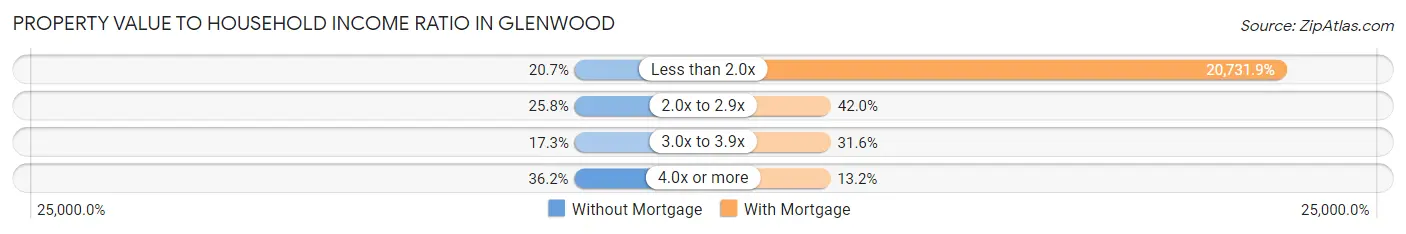
| Value-to-Income Ratio | Without Mortgage | With Mortgage |
| Less than 2.0x | 56 (20.7%) | 89,769 (20,731.9%) |
| 2.0x to 2.9x | 70 (25.8%) | 182 (42.0%) |
| 3.0x to 3.9x | 47 (17.3%) | 137 (31.6%) |
| 4.0x or more | 98 (36.2%) | 57 (13.2%) |
| Total | 271 (100.0%) | 433 (100.0%) |
Real Estate Taxes by Mortgage Status in Glenwood
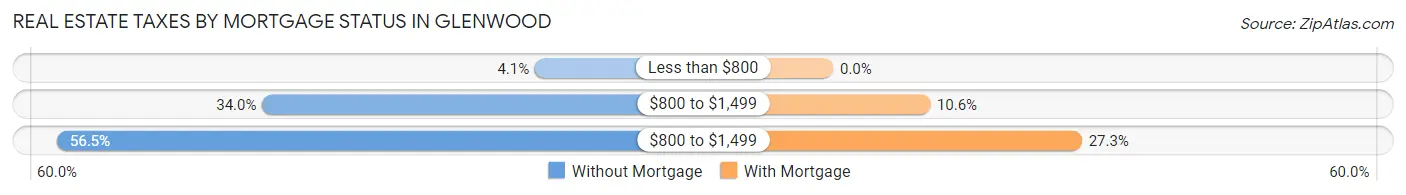
| Property Taxes | Without Mortgage | With Mortgage |
| Less than $800 | 11 (4.1%) | 0 (0.0%) |
| $800 to $1,499 | 92 (34.0%) | 46 (10.6%) |
| $800 to $1,499 | 153 (56.5%) | 118 (27.3%) |
| Total | 271 (100.0%) | 433 (100.0%) |
Health & Disability in Glenwood
Health Insurance Coverage by Age in Glenwood
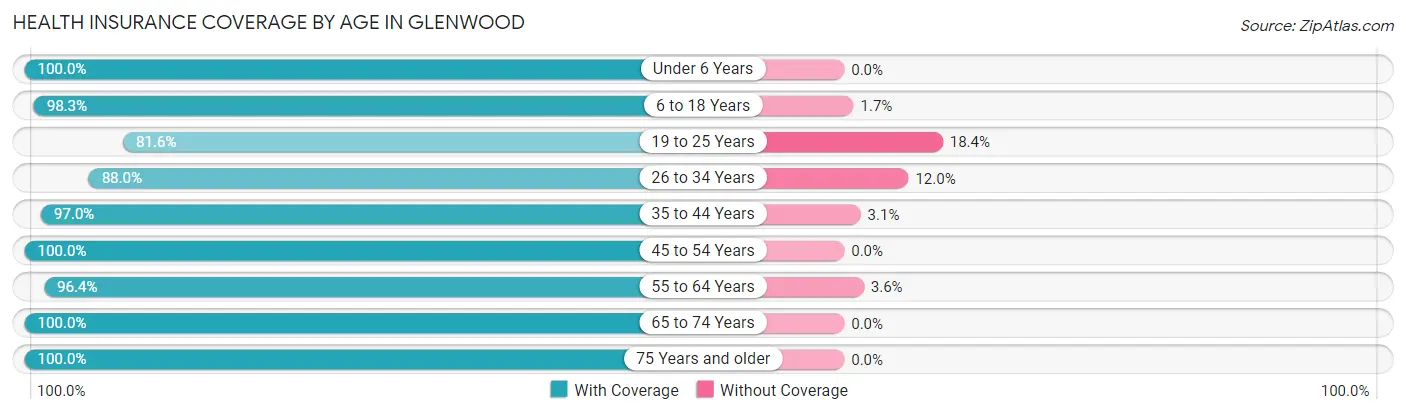
| Age Bracket | With Coverage | Without Coverage |
| Under 6 Years | 109 (100.0%) | 0 (0.0%) |
| 6 to 18 Years | 511 (98.3%) | 9 (1.7%) |
| 19 to 25 Years | 160 (81.6%) | 36 (18.4%) |
| 26 to 34 Years | 250 (88.0%) | 34 (12.0%) |
| 35 to 44 Years | 318 (97.0%) | 10 (3.0%) |
| 45 to 54 Years | 195 (100.0%) | 0 (0.0%) |
| 55 to 64 Years | 291 (96.4%) | 11 (3.6%) |
| 65 to 74 Years | 321 (100.0%) | 0 (0.0%) |
| 75 Years and older | 256 (100.0%) | 0 (0.0%) |
| Total | 2,411 (96.0%) | 100 (4.0%) |
Health Insurance Coverage by Citizenship Status in Glenwood
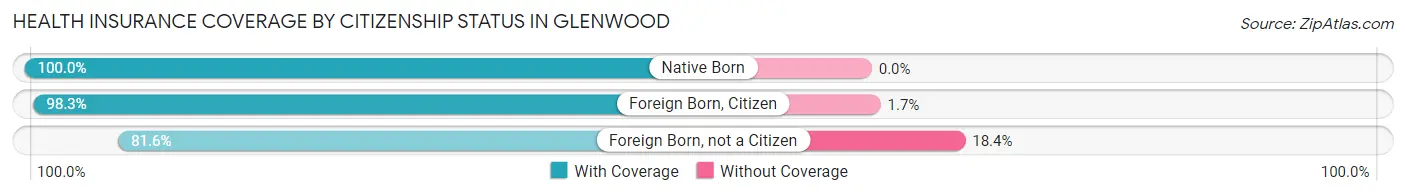
| Citizenship Status | With Coverage | Without Coverage |
| Native Born | 109 (100.0%) | 0 (0.0%) |
| Foreign Born, Citizen | 511 (98.3%) | 9 (1.7%) |
| Foreign Born, not a Citizen | 160 (81.6%) | 36 (18.4%) |
Health Insurance Coverage by Household Income in Glenwood
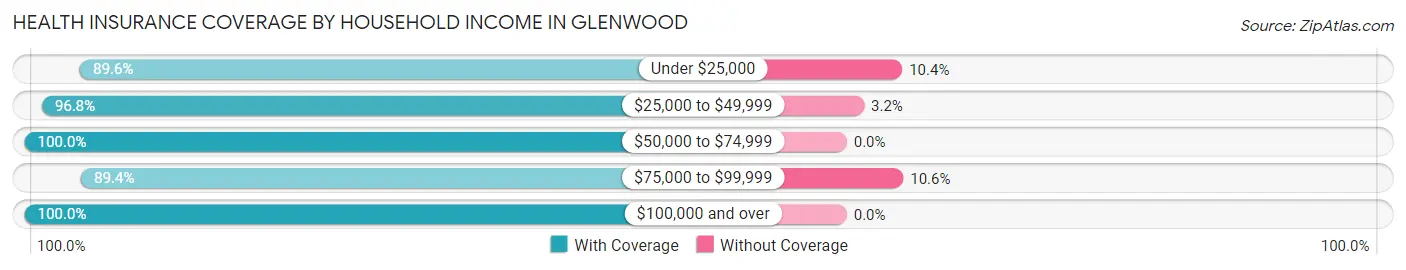
| Household Income | With Coverage | Without Coverage |
| Under $25,000 | 526 (89.6%) | 61 (10.4%) |
| $25,000 to $49,999 | 299 (96.8%) | 10 (3.2%) |
| $50,000 to $74,999 | 378 (100.0%) | 0 (0.0%) |
| $75,000 to $99,999 | 245 (89.4%) | 29 (10.6%) |
| $100,000 and over | 959 (100.0%) | 0 (0.0%) |
Public vs Private Health Insurance Coverage by Age in Glenwood
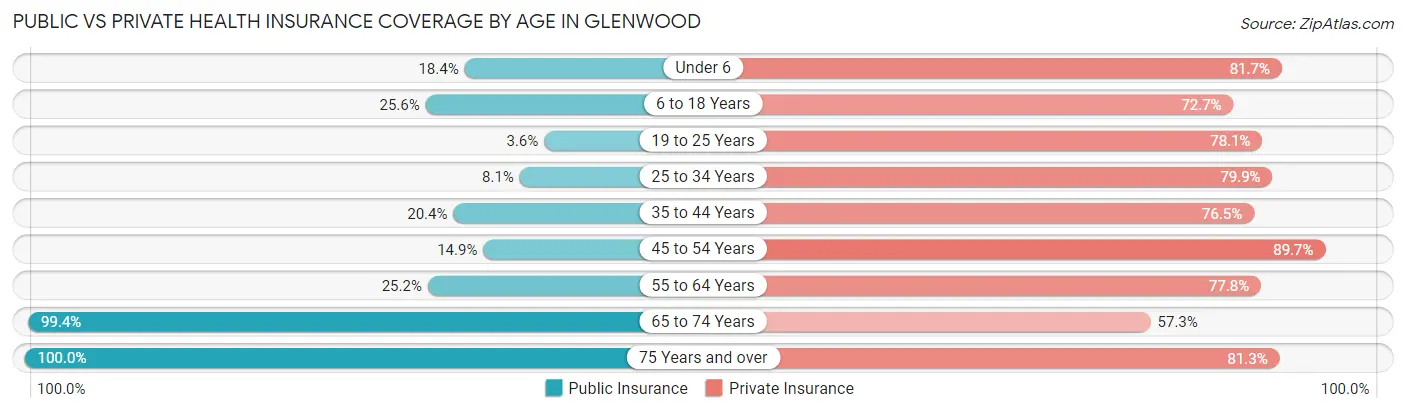
| Age Bracket | Public Insurance | Private Insurance |
| Under 6 | 20 (18.3%) | 89 (81.7%) |
| 6 to 18 Years | 133 (25.6%) | 378 (72.7%) |
| 19 to 25 Years | 7 (3.6%) | 153 (78.1%) |
| 25 to 34 Years | 23 (8.1%) | 227 (79.9%) |
| 35 to 44 Years | 67 (20.4%) | 251 (76.5%) |
| 45 to 54 Years | 29 (14.9%) | 175 (89.7%) |
| 55 to 64 Years | 76 (25.2%) | 235 (77.8%) |
| 65 to 74 Years | 319 (99.4%) | 184 (57.3%) |
| 75 Years and over | 256 (100.0%) | 208 (81.2%) |
| Total | 930 (37.0%) | 1,900 (75.7%) |
Disability Status by Sex by Age in Glenwood
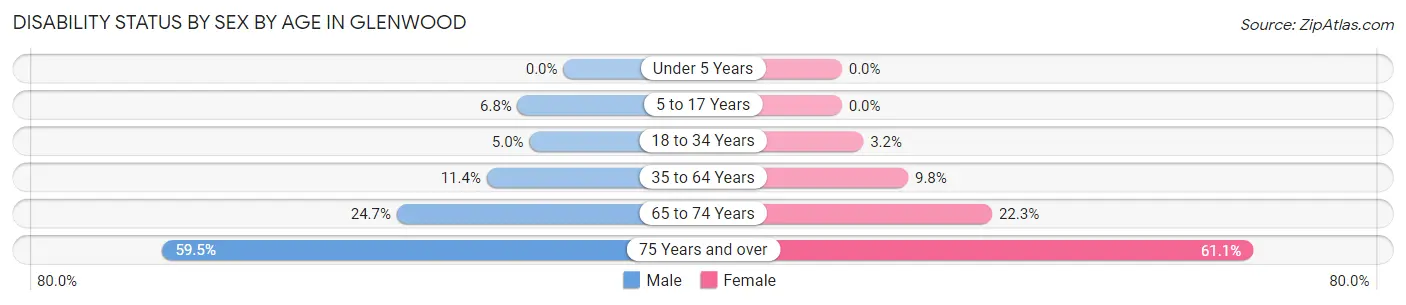
| Age Bracket | Male | Female |
| Under 5 Years | 0 (0.0%) | 0 (0.0%) |
| 5 to 17 Years | 23 (6.8%) | 0 (0.0%) |
| 18 to 34 Years | 14 (5.0%) | 7 (3.2%) |
| 35 to 64 Years | 43 (11.4%) | 44 (9.8%) |
| 65 to 74 Years | 45 (24.7%) | 31 (22.3%) |
| 75 Years and over | 50 (59.5%) | 105 (61.1%) |
Disability Class by Sex by Age in Glenwood
Disability Class: Hearing Difficulty
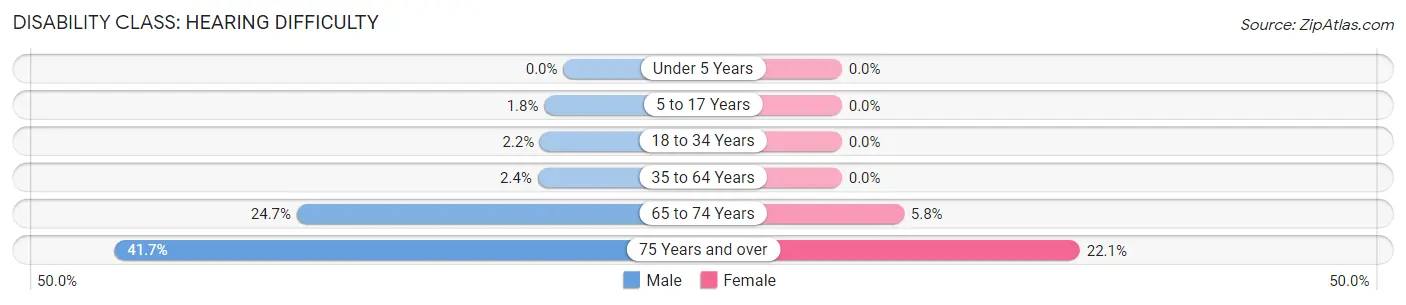
| Age Bracket | Male | Female |
| Under 5 Years | 0 (0.0%) | 0 (0.0%) |
| 5 to 17 Years | 6 (1.8%) | 0 (0.0%) |
| 18 to 34 Years | 6 (2.2%) | 0 (0.0%) |
| 35 to 64 Years | 9 (2.4%) | 0 (0.0%) |
| 65 to 74 Years | 45 (24.7%) | 8 (5.8%) |
| 75 Years and over | 35 (41.7%) | 38 (22.1%) |
Disability Class: Vision Difficulty
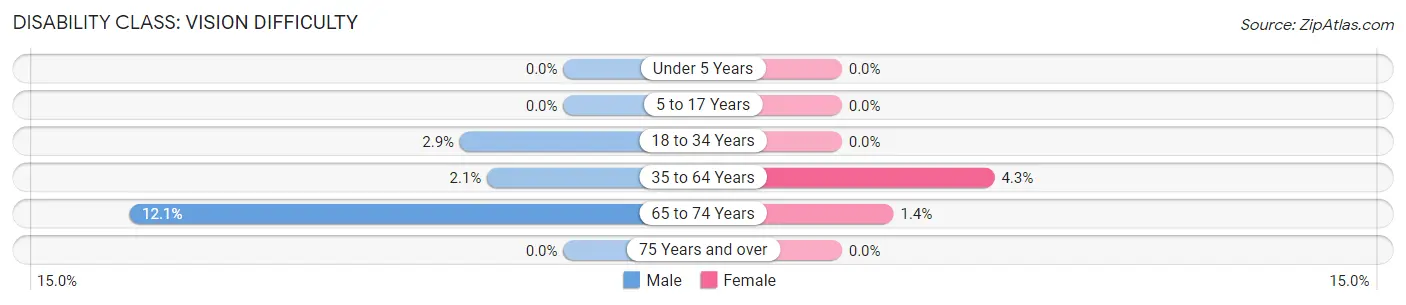
| Age Bracket | Male | Female |
| Under 5 Years | 0 (0.0%) | 0 (0.0%) |
| 5 to 17 Years | 0 (0.0%) | 0 (0.0%) |
| 18 to 34 Years | 8 (2.9%) | 0 (0.0%) |
| 35 to 64 Years | 8 (2.1%) | 19 (4.3%) |
| 65 to 74 Years | 22 (12.1%) | 2 (1.4%) |
| 75 Years and over | 0 (0.0%) | 0 (0.0%) |
Disability Class: Cognitive Difficulty
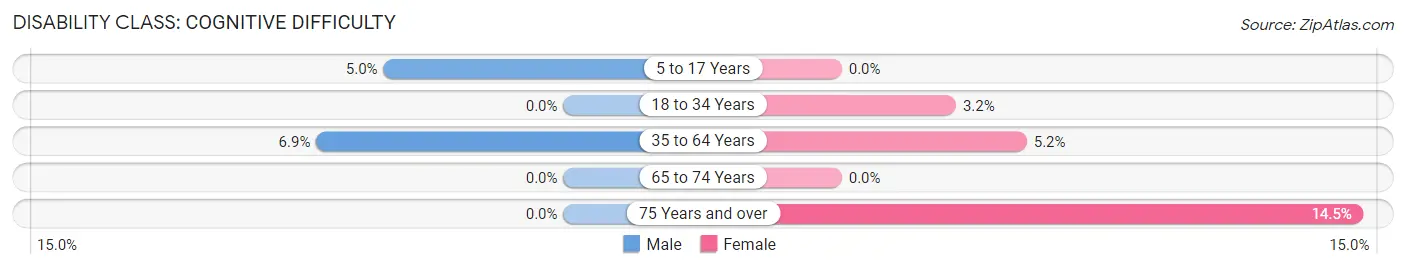
| Age Bracket | Male | Female |
| 5 to 17 Years | 17 (5.0%) | 0 (0.0%) |
| 18 to 34 Years | 0 (0.0%) | 7 (3.2%) |
| 35 to 64 Years | 26 (6.9%) | 23 (5.1%) |
| 65 to 74 Years | 0 (0.0%) | 0 (0.0%) |
| 75 Years and over | 0 (0.0%) | 25 (14.5%) |
Disability Class: Ambulatory Difficulty
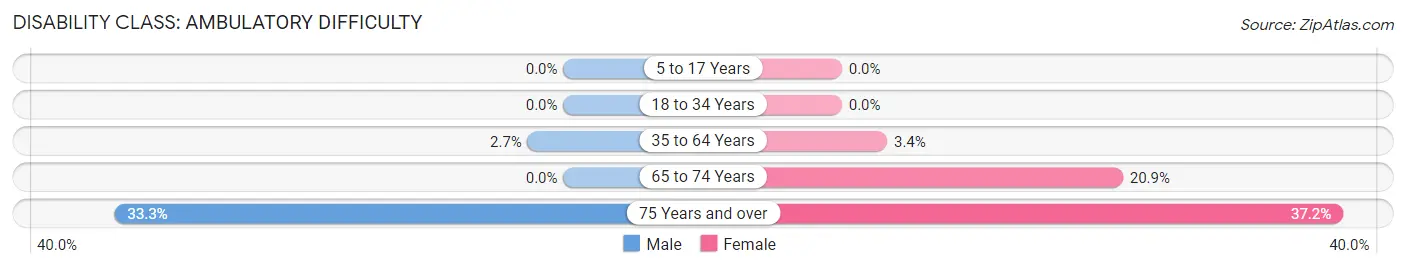
| Age Bracket | Male | Female |
| 5 to 17 Years | 0 (0.0%) | 0 (0.0%) |
| 18 to 34 Years | 0 (0.0%) | 0 (0.0%) |
| 35 to 64 Years | 10 (2.6%) | 15 (3.4%) |
| 65 to 74 Years | 0 (0.0%) | 29 (20.9%) |
| 75 Years and over | 28 (33.3%) | 64 (37.2%) |
Disability Class: Self-Care Difficulty
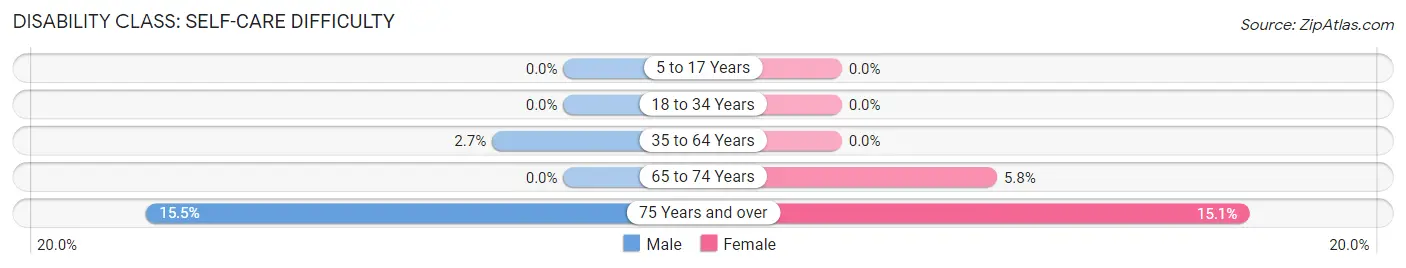
| Age Bracket | Male | Female |
| 5 to 17 Years | 0 (0.0%) | 0 (0.0%) |
| 18 to 34 Years | 0 (0.0%) | 0 (0.0%) |
| 35 to 64 Years | 10 (2.6%) | 0 (0.0%) |
| 65 to 74 Years | 0 (0.0%) | 8 (5.8%) |
| 75 Years and over | 13 (15.5%) | 26 (15.1%) |
Technology Access in Glenwood
Computing Device Access in Glenwood
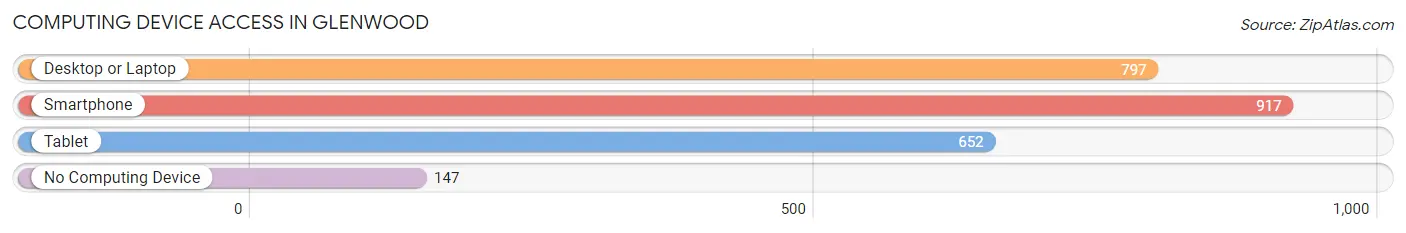
| Device Type | # Households | % Households |
| Desktop or Laptop | 797 | 67.5% |
| Smartphone | 917 | 77.6% |
| Tablet | 652 | 55.2% |
| No Computing Device | 147 | 12.4% |
| Total | 1,181 | 100.0% |
Internet Access in Glenwood
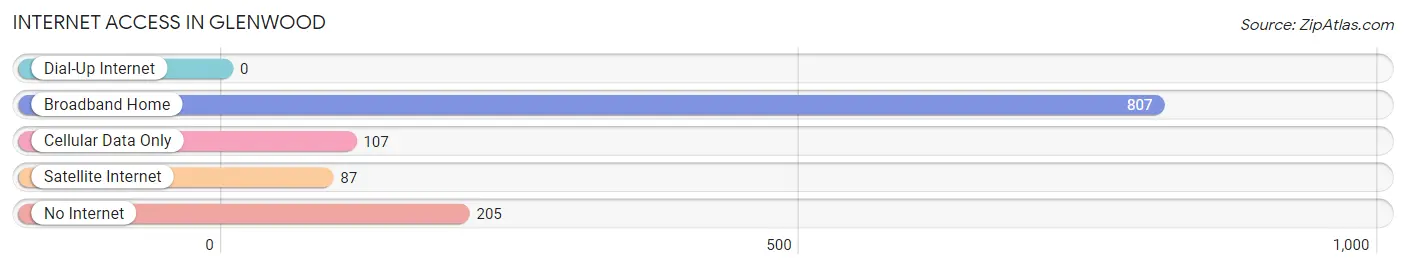
| Internet Type | # Households | % Households |
| Dial-Up Internet | 0 | 0.0% |
| Broadband Home | 807 | 68.3% |
| Cellular Data Only | 107 | 9.1% |
| Satellite Internet | 87 | 7.4% |
| No Internet | 205 | 17.4% |
| Total | 1,181 | 100.0% |
Glenwood Summary
Glenwood, Minnesota is a small city located in Pope County, in the west-central part of the state. It is situated on the banks of the Chippewa River, and is the county seat of Pope County. The city has a population of 2,521, according to the 2010 census.
History
The area that is now Glenwood was first settled in 1856 by a group of Norwegian immigrants. The city was originally named “Glenwood City” after the nearby Glenwood Lake. The city was incorporated in 1872, and the name was shortened to “Glenwood”.
The city was an important stop on the Great Northern Railway, and was a major shipping point for grain and livestock. The city was also home to a large lumber mill, which was the largest employer in the area for many years.
Geography
Glenwood is located in west-central Minnesota, in Pope County. It is situated on the banks of the Chippewa River, and is surrounded by rolling hills and farmland. The city is located about 50 miles northwest of St. Cloud, and about 100 miles northwest of Minneapolis.
The city has a total area of 2.2 square miles, all of which is land. The climate is humid continental, with cold winters and warm summers.
Economy
The economy of Glenwood is largely based on agriculture and tourism. The city is home to several large farms, which produce a variety of crops, including corn, soybeans, and wheat. The city is also home to several small businesses, including restaurants, retail stores, and service providers.
The city is also a popular tourist destination, due to its proximity to several lakes and rivers. The city is home to several parks and recreational areas, including the Chippewa River State Park, which offers camping, fishing, and other outdoor activities.
Demographics
According to the 2010 census, the population of Glenwood was 2,521. The racial makeup of the city was 97.2% White, 0.7% African American, 0.3% Native American, 0.3% Asian, 0.2% from other races, and 1.5% from two or more races. Hispanic or Latino of any race were 1.2% of the population.
The median household income in Glenwood was $41,944, and the median family income was $50,938. The per capita income for the city was $20,945. About 8.2% of families and 10.3% of the population were below the poverty line, including 14.2% of those under age 18 and 8.2% of those age 65 or over.
Common Questions
What is Per Capita Income in Glenwood?
Per Capita income in Glenwood is $30,356.
What is the Median Family Income in Glenwood?
Median Family Income in Glenwood is $80,357.
What is the Median Household income in Glenwood?
Median Household Income in Glenwood is $50,767.
What is Income or Wage Gap in Glenwood?
Income or Wage Gap in Glenwood is 2.9%.
Women in Glenwood earn 97.1 cents for every dollar earned by a man.
What is Inequality or Gini Index in Glenwood?
Inequality or Gini Index in Glenwood is 0.45.
What is the Total Population of Glenwood?
Total Population of Glenwood is 2,628.
What is the Total Male Population of Glenwood?
Total Male Population of Glenwood is 1,315.
What is the Total Female Population of Glenwood?
Total Female Population of Glenwood is 1,313.
What is the Ratio of Males per 100 Females in Glenwood?
There are 100.15 Males per 100 Females in Glenwood.
What is the Ratio of Females per 100 Males in Glenwood?
There are 99.85 Females per 100 Males in Glenwood.
What is the Median Population Age in Glenwood?
Median Population Age in Glenwood is 40.0 Years.
What is the Average Family Size in Glenwood
Average Family Size in Glenwood is 3.0 People.
What is the Average Household Size in Glenwood
Average Household Size in Glenwood is 2.1 People.
How Large is the Labor Force in Glenwood?
There are 1,383 People in the Labor Forcein in Glenwood.
What is the Percentage of People in the Labor Force in Glenwood?
66.5% of People are in the Labor Force in Glenwood.
What is the Unemployment Rate in Glenwood?
Unemployment Rate in Glenwood is 0.4%.