Garrison, MN Map & Demographics
Garrison Map
Garrison Overview
$36,877
PER CAPITA INCOME
$54,583
AVG FAMILY INCOME
$55,000
AVG HOUSEHOLD INCOME
55.4%
WAGE / INCOME GAP [ % ]
44.6¢/ $1
WAGE / INCOME GAP [ $ ]
0.33
INEQUALITY / GINI INDEX
168
TOTAL POPULATION
82
MALE POPULATION
86
FEMALE POPULATION
95.35
MALES / 100 FEMALES
104.88
FEMALES / 100 MALES
57.0
MEDIAN AGE
2.4
AVG FAMILY SIZE
1.7
AVG HOUSEHOLD SIZE
84
LABOR FORCE [ PEOPLE ]
53.5%
PERCENT IN LABOR FORCE
Garrison Zip Codes
Income in Garrison
Income Overview in Garrison
Per Capita Income in Garrison is $36,877, while median incomes of families and households are $54,583 and $55,000 respectively.
| Characteristic | Number | Measure |
| Per Capita Income | 168 | $36,877 |
| Median Family Income | 42 | $54,583 |
| Mean Family Income | 42 | $66,229 |
| Median Household Income | 100 | $55,000 |
| Mean Household Income | 100 | $61,643 |
| Income Deficit | 42 | $0 |
| Wage / Income Gap (%) | 168 | 55.36% |
| Wage / Income Gap ($) | 168 | 44.64¢ per $1 |
| Gini / Inequality Index | 168 | 0.33 |
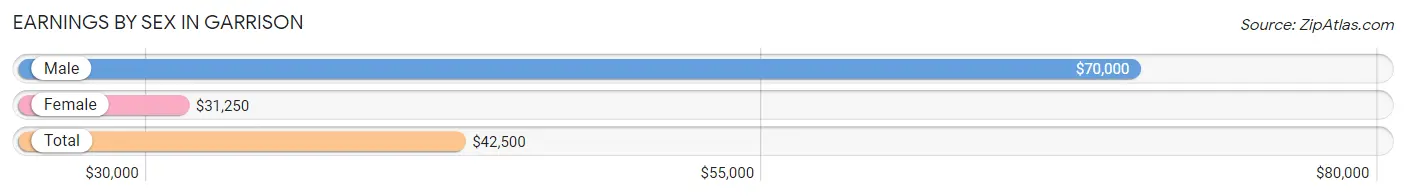
Earnings by Sex in Garrison
Average Earnings in Garrison are $42,500, $70,000 for men and $31,250 for women, a difference of 55.4%.
| Sex | Number | Average Earnings |
| Male | 44 (51.2%) | $70,000 |
| Female | 42 (48.8%) | $31,250 |
| Total | 86 (100.0%) | $42,500 |
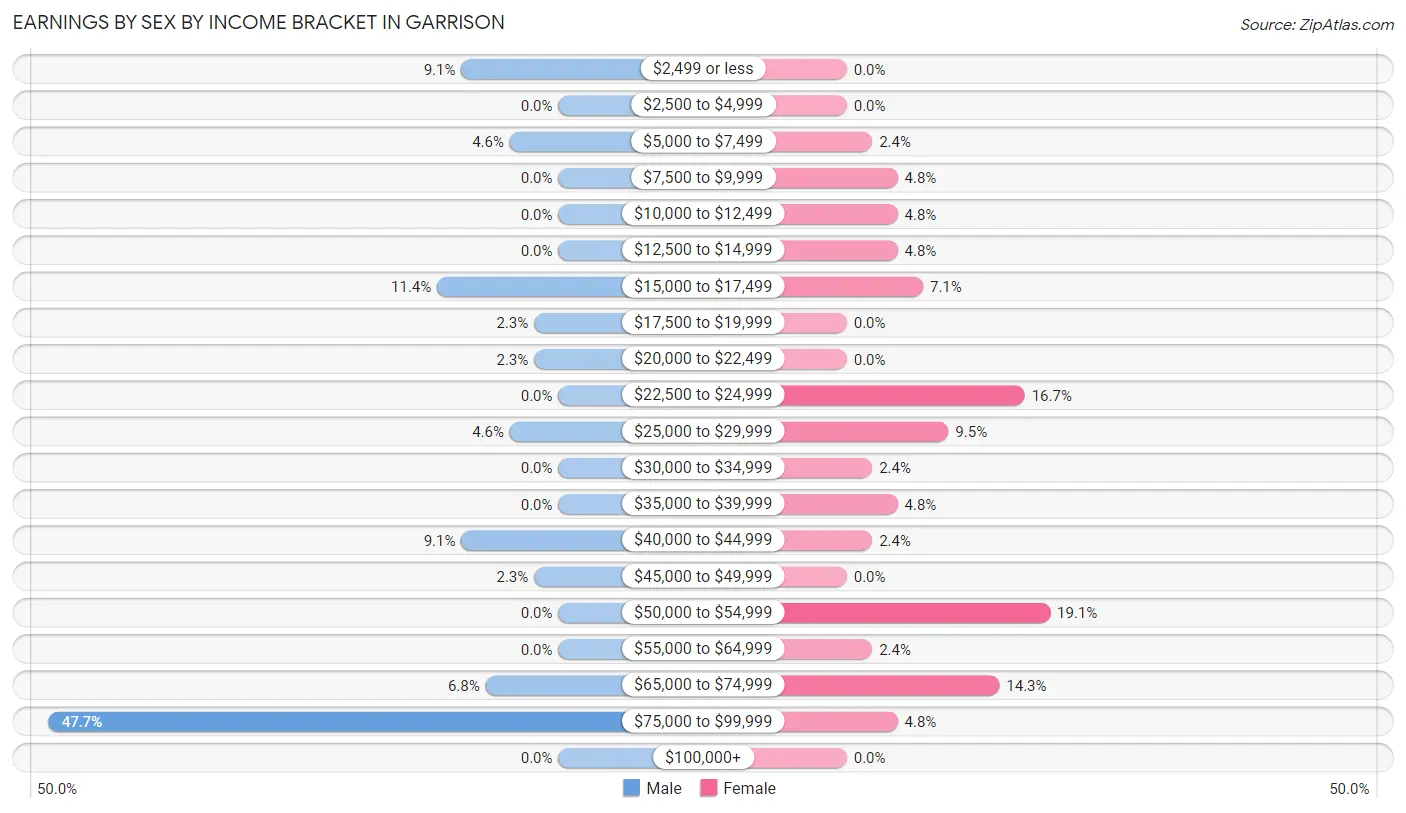
Earnings by Sex by Income Bracket in Garrison
The most common earnings brackets in Garrison are $75,000 to $99,999 for men (21 | 47.7%) and $50,000 to $54,999 for women (8 | 19.1%).
| Income | Male | Female |
| $2,499 or less | 4 (9.1%) | 0 (0.0%) |
| $2,500 to $4,999 | 0 (0.0%) | 0 (0.0%) |
| $5,000 to $7,499 | 2 (4.5%) | 1 (2.4%) |
| $7,500 to $9,999 | 0 (0.0%) | 2 (4.8%) |
| $10,000 to $12,499 | 0 (0.0%) | 2 (4.8%) |
| $12,500 to $14,999 | 0 (0.0%) | 2 (4.8%) |
| $15,000 to $17,499 | 5 (11.4%) | 3 (7.1%) |
| $17,500 to $19,999 | 1 (2.3%) | 0 (0.0%) |
| $20,000 to $22,499 | 1 (2.3%) | 0 (0.0%) |
| $22,500 to $24,999 | 0 (0.0%) | 7 (16.7%) |
| $25,000 to $29,999 | 2 (4.5%) | 4 (9.5%) |
| $30,000 to $34,999 | 0 (0.0%) | 1 (2.4%) |
| $35,000 to $39,999 | 0 (0.0%) | 2 (4.8%) |
| $40,000 to $44,999 | 4 (9.1%) | 1 (2.4%) |
| $45,000 to $49,999 | 1 (2.3%) | 0 (0.0%) |
| $50,000 to $54,999 | 0 (0.0%) | 8 (19.1%) |
| $55,000 to $64,999 | 0 (0.0%) | 1 (2.4%) |
| $65,000 to $74,999 | 3 (6.8%) | 6 (14.3%) |
| $75,000 to $99,999 | 21 (47.7%) | 2 (4.8%) |
| $100,000+ | 0 (0.0%) | 0 (0.0%) |
| Total | 44 (100.0%) | 42 (100.0%) |
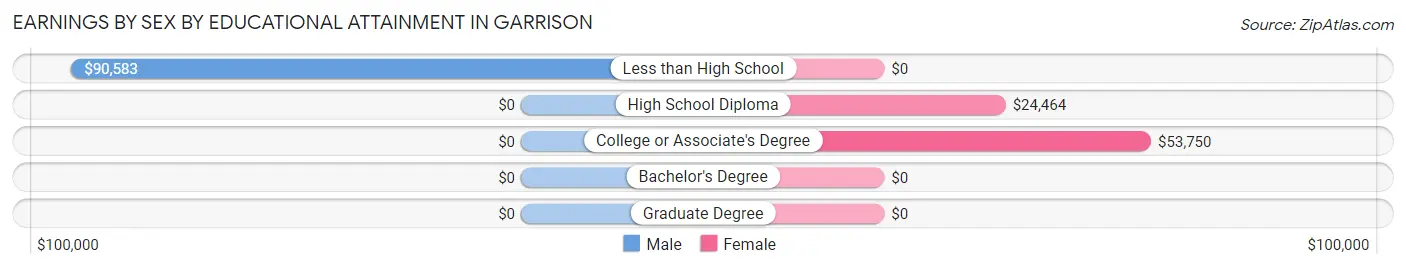
Earnings by Sex by Educational Attainment in Garrison
Average earnings in Garrison are $75,000 for men and $31,250 for women, a difference of 58.3%. Men with an educational attainment of less than high school enjoy the highest average annual earnings of $90,583, while those with less than high school education earn the least with $90,583. Women with an educational attainment of college or associate's degree earn the most with the average annual earnings of $53,750, while those with high school diploma education have the smallest earnings of $24,464.
| Educational Attainment | Male Income | Female Income |
| Less than High School | $90,583 | $0 |
| High School Diploma | - | - |
| College or Associate's Degree | - | - |
| Bachelor's Degree | - | - |
| Graduate Degree | - | - |
| Total | $75,000 | $31,250 |
Family Income in Garrison
Family Income Brackets in Garrison
According to the Garrison family income data, there are 15 families falling into the $50,000 to $74,999 income range, which is the most common income bracket and makes up 35.7% of all families.
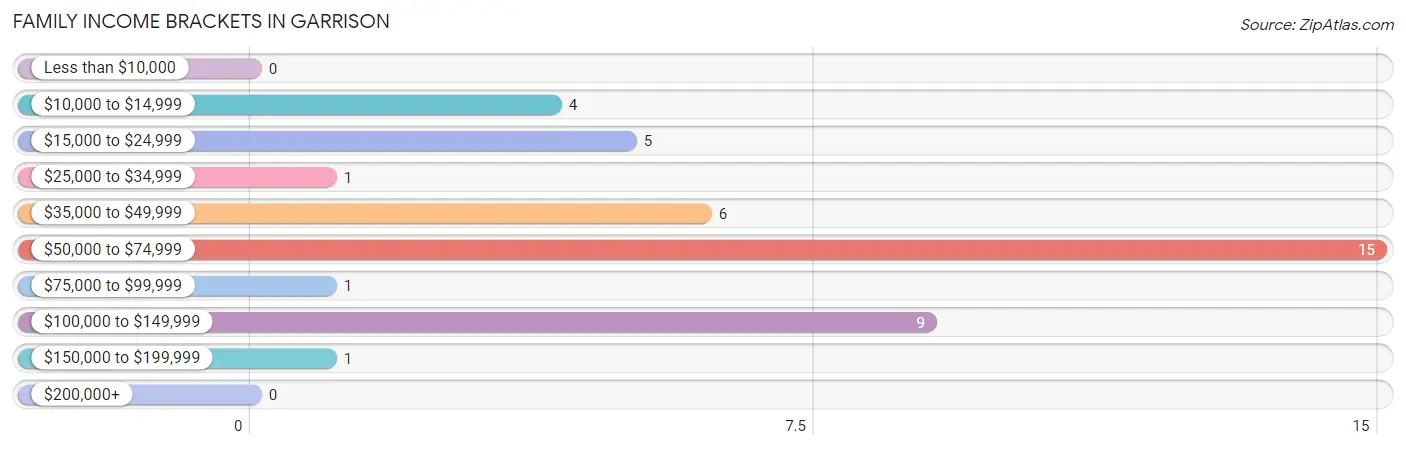
| Income Bracket | # Families | % Families |
| Less than $10,000 | 0 | 0.0% |
| $10,000 to $14,999 | 4 | 9.5% |
| $15,000 to $24,999 | 5 | 11.9% |
| $25,000 to $34,999 | 1 | 2.4% |
| $35,000 to $49,999 | 6 | 14.3% |
| $50,000 to $74,999 | 15 | 35.7% |
| $75,000 to $99,999 | 1 | 2.4% |
| $100,000 to $149,999 | 9 | 21.4% |
| $150,000 to $199,999 | 1 | 2.4% |
| $200,000+ | 0 | 0.0% |
Family Income by Famaliy Size in Garrison
2-person families (33 | 78.6%) account for the highest median family income in Garrison with $52,708 per family, while 2-person families (33 | 78.6%) have the highest median income of $26,354 per family member.
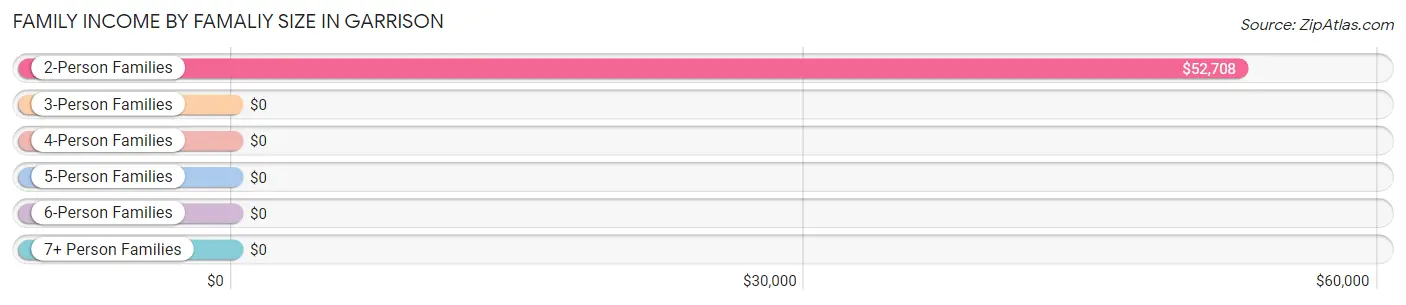
| Income Bracket | # Families | Median Income |
| 2-Person Families | 33 (78.6%) | $52,708 |
| 3-Person Families | 8 (19.1%) | $0 |
| 4-Person Families | 0 (0.0%) | $0 |
| 5-Person Families | 1 (2.4%) | $0 |
| 6-Person Families | 0 (0.0%) | $0 |
| 7+ Person Families | 0 (0.0%) | $0 |
| Total | 42 (100.0%) | $54,583 |
Family Income by Number of Earners in Garrison
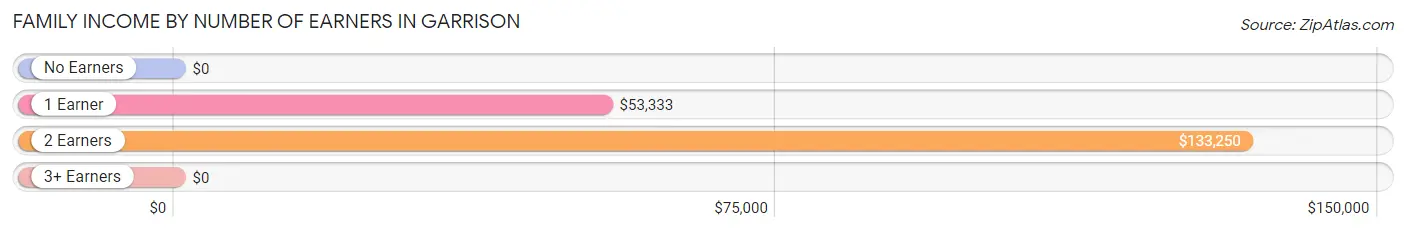
| Number of Earners | # Families | Median Income |
| No Earners | 13 (30.9%) | $0 |
| 1 Earner | 18 (42.9%) | $53,333 |
| 2 Earners | 7 (16.7%) | $133,250 |
| 3+ Earners | 4 (9.5%) | $0 |
| Total | 42 (100.0%) | $54,583 |
Household Income in Garrison
Household Income Brackets in Garrison
With 24 households falling in the category, the $50,000 to $74,999 income range is the most frequent in Garrison, accounting for 24.0% of all households.
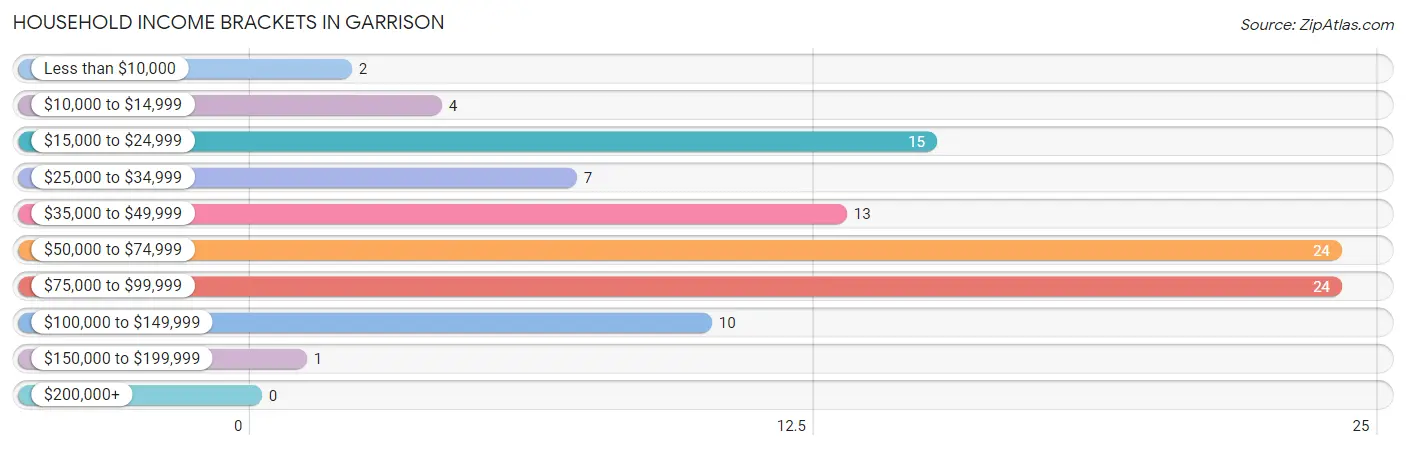
| Income Bracket | # Households | % Households |
| Less than $10,000 | 2 | 2.0% |
| $10,000 to $14,999 | 4 | 4.0% |
| $15,000 to $24,999 | 15 | 15.0% |
| $25,000 to $34,999 | 7 | 7.0% |
| $35,000 to $49,999 | 13 | 13.0% |
| $50,000 to $74,999 | 24 | 24.0% |
| $75,000 to $99,999 | 24 | 24.0% |
| $100,000 to $149,999 | 10 | 10.0% |
| $150,000 to $199,999 | 1 | 1.0% |
| $200,000+ | 0 | 0.0% |
Household Income by Householder Age in Garrison
The median household income in Garrison is $55,000, with the highest median household income of $132,750 found in the 25 to 44 years age bracket for the primary householder. A total of 11 households (11.0%) fall into this category. Meanwhile, the 15 to 24 years age bracket for the primary householder has the lowest median household income of $0, with 2 households (2.0%) in this group.
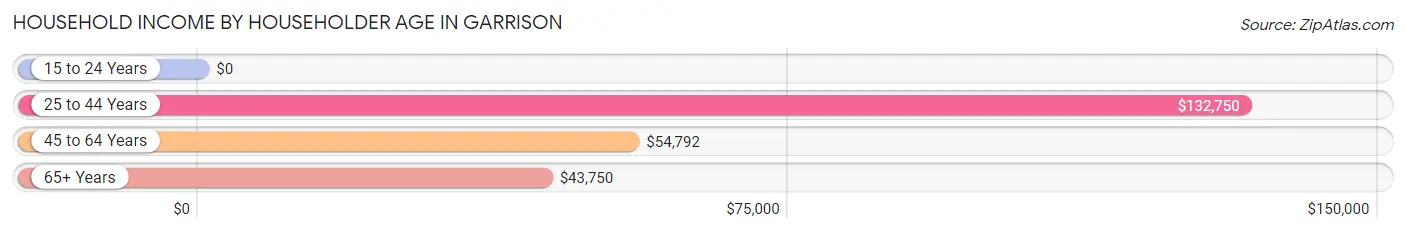
| Income Bracket | # Households | Median Income |
| 15 to 24 Years | 2 (2.0%) | $0 |
| 25 to 44 Years | 11 (11.0%) | $132,750 |
| 45 to 64 Years | 47 (47.0%) | $54,792 |
| 65+ Years | 40 (40.0%) | $43,750 |
| Total | 100 (100.0%) | $55,000 |
Poverty in Garrison
Income Below Poverty by Sex and Age in Garrison
With 6.1% poverty level for males and 17.4% for females among the residents of Garrison, 55 to 64 year old males and 35 to 44 year old females are the most vulnerable to poverty, with 3 males (37.5%) and 4 females (66.7%) in their respective age groups living below the poverty level.
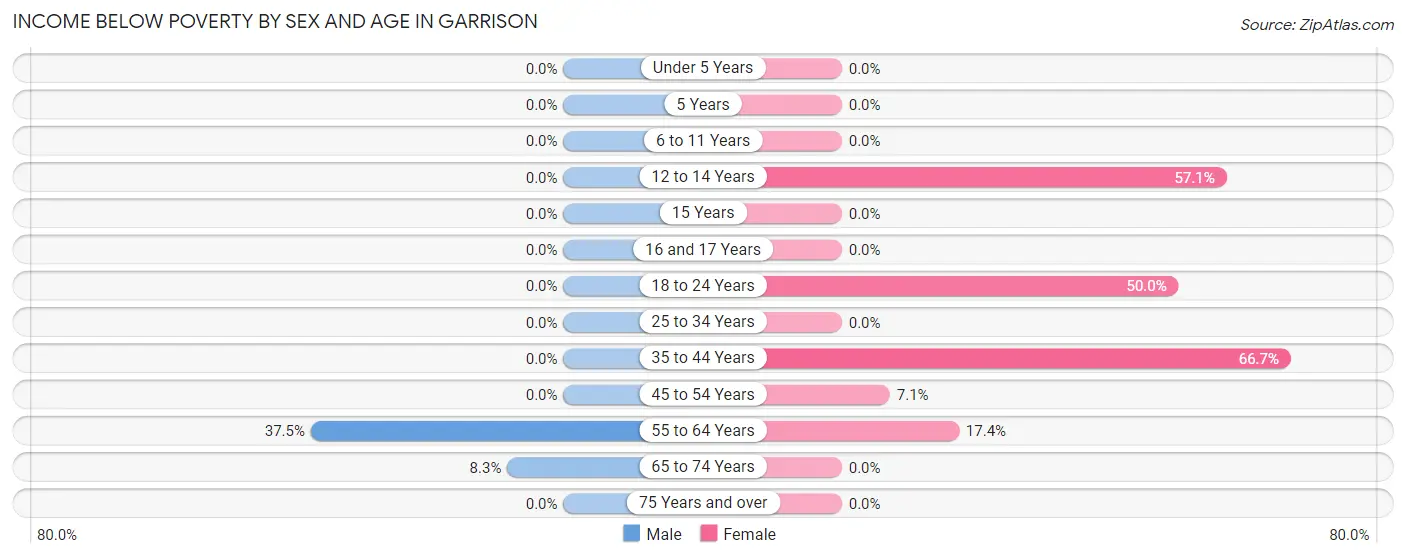
| Age Bracket | Male | Female |
| Under 5 Years | 0 (0.0%) | 0 (0.0%) |
| 5 Years | 0 (0.0%) | 0 (0.0%) |
| 6 to 11 Years | 0 (0.0%) | 0 (0.0%) |
| 12 to 14 Years | 0 (0.0%) | 4 (57.1%) |
| 15 Years | 0 (0.0%) | 0 (0.0%) |
| 16 and 17 Years | 0 (0.0%) | 0 (0.0%) |
| 18 to 24 Years | 0 (0.0%) | 2 (50.0%) |
| 25 to 34 Years | 0 (0.0%) | 0 (0.0%) |
| 35 to 44 Years | 0 (0.0%) | 4 (66.7%) |
| 45 to 54 Years | 0 (0.0%) | 1 (7.1%) |
| 55 to 64 Years | 3 (37.5%) | 4 (17.4%) |
| 65 to 74 Years | 2 (8.3%) | 0 (0.0%) |
| 75 Years and over | 0 (0.0%) | 0 (0.0%) |
| Total | 5 (6.1%) | 15 (17.4%) |
Income Above Poverty by Sex and Age in Garrison
According to the poverty statistics in Garrison, males aged 12 to 14 years and females aged 25 to 34 years are the age groups that are most secure financially, with 100.0% of males and 100.0% of females in these age groups living above the poverty line.
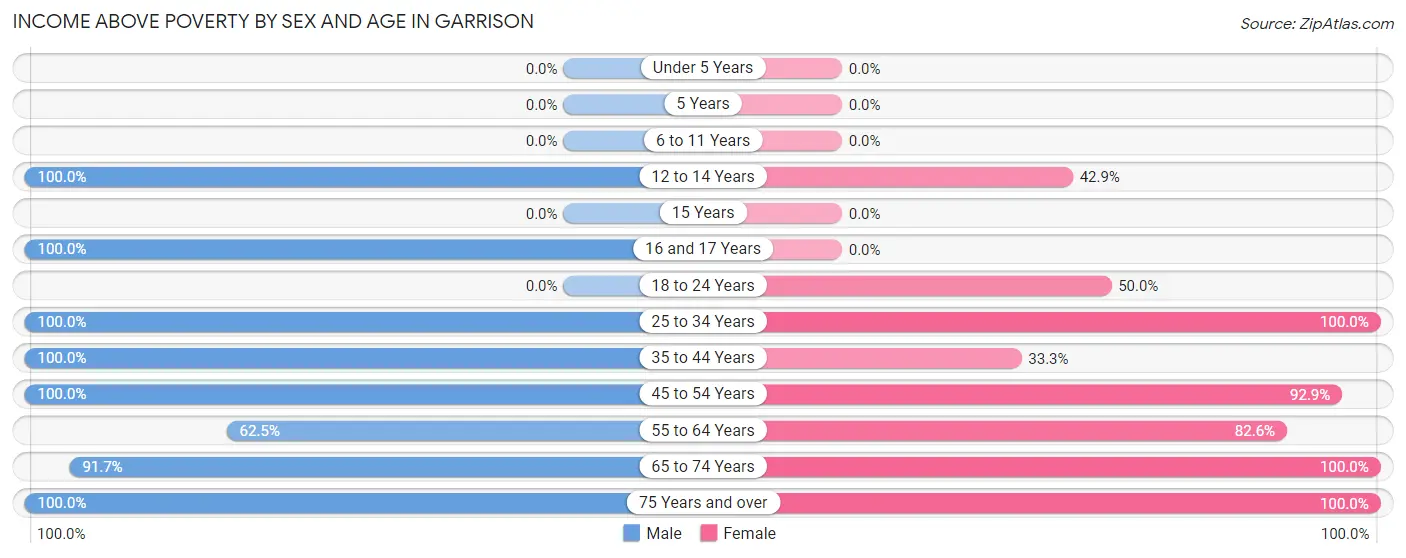
| Age Bracket | Male | Female |
| Under 5 Years | 0 (0.0%) | 0 (0.0%) |
| 5 Years | 0 (0.0%) | 0 (0.0%) |
| 6 to 11 Years | 0 (0.0%) | 0 (0.0%) |
| 12 to 14 Years | 4 (100.0%) | 3 (42.9%) |
| 15 Years | 0 (0.0%) | 0 (0.0%) |
| 16 and 17 Years | 2 (100.0%) | 0 (0.0%) |
| 18 to 24 Years | 0 (0.0%) | 2 (50.0%) |
| 25 to 34 Years | 7 (100.0%) | 6 (100.0%) |
| 35 to 44 Years | 11 (100.0%) | 2 (33.3%) |
| 45 to 54 Years | 17 (100.0%) | 13 (92.9%) |
| 55 to 64 Years | 5 (62.5%) | 19 (82.6%) |
| 65 to 74 Years | 22 (91.7%) | 17 (100.0%) |
| 75 Years and over | 9 (100.0%) | 9 (100.0%) |
| Total | 77 (93.9%) | 71 (82.6%) |
Income Below Poverty Among Married-Couple Families in Garrison
The poverty statistics for married-couple families in Garrison show that 6.2% or 2 of the total 32 families live below the poverty line. Families with no children have the highest poverty rate of 6.5%, comprising of 2 families. On the other hand, families with 3 or 4 children have the lowest poverty rate of 0.0%, which includes 0 families.
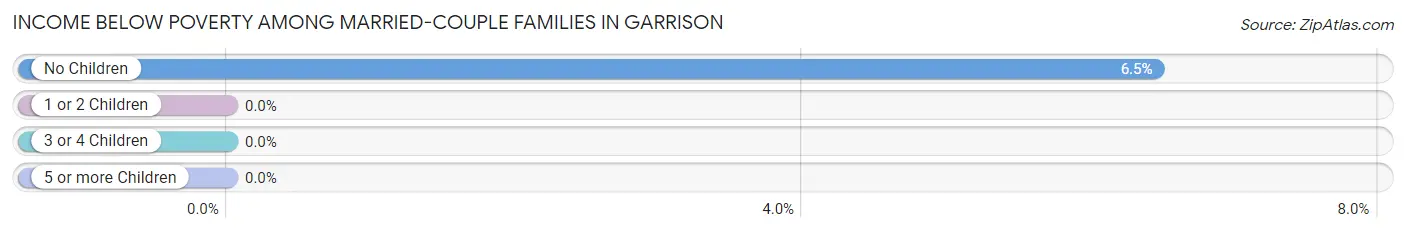
| Children | Above Poverty | Below Poverty |
| No Children | 29 (93.5%) | 2 (6.5%) |
| 1 or 2 Children | 0 (0.0%) | 0 (0.0%) |
| 3 or 4 Children | 1 (100.0%) | 0 (0.0%) |
| 5 or more Children | 0 (0.0%) | 0 (0.0%) |
| Total | 30 (93.8%) | 2 (6.2%) |
Income Below Poverty Among Single-Parent Households in Garrison
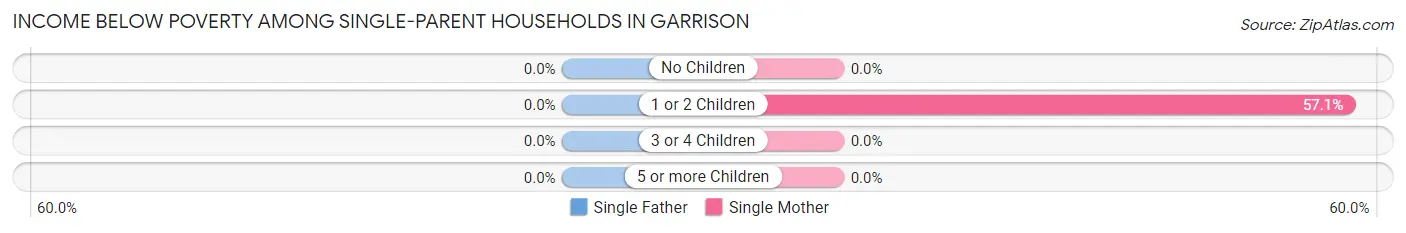
| Children | Single Father | Single Mother |
| No Children | 0 (0.0%) | 0 (0.0%) |
| 1 or 2 Children | 0 (0.0%) | 4 (57.1%) |
| 3 or 4 Children | 0 (0.0%) | 0 (0.0%) |
| 5 or more Children | 0 (0.0%) | 0 (0.0%) |
| Total | 0 (0.0%) | 4 (40.0%) |
Income Below Poverty Among Married-Couple vs Single-Parent Households in Garrison
The poverty data for Garrison shows that 2 of the married-couple family households (6.2%) and 4 of the single-parent households (40.0%) are living below the poverty level. Within the married-couple family households, those with no children have the highest poverty rate, with 2 households (6.5%) falling below the poverty line. Among the single-parent households, those with 1 or 2 children have the highest poverty rate, with 4 household (57.1%) living below poverty.
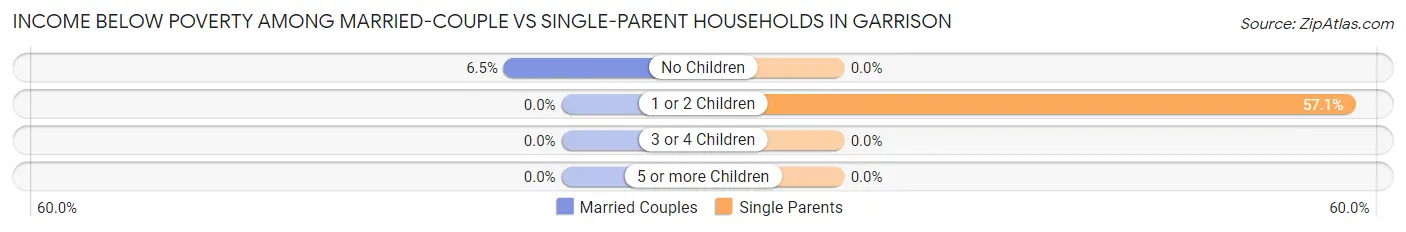
| Children | Married-Couple Families | Single-Parent Households |
| No Children | 2 (6.5%) | 0 (0.0%) |
| 1 or 2 Children | 0 (0.0%) | 4 (57.1%) |
| 3 or 4 Children | 0 (0.0%) | 0 (0.0%) |
| 5 or more Children | 0 (0.0%) | 0 (0.0%) |
| Total | 2 (6.2%) | 4 (40.0%) |
Race in Garrison
The most populous races in Garrison are White / Caucasian (159 | 94.6%), Native / Alaskan (6 | 3.6%), and Hispanic or Latino (4 | 2.4%).
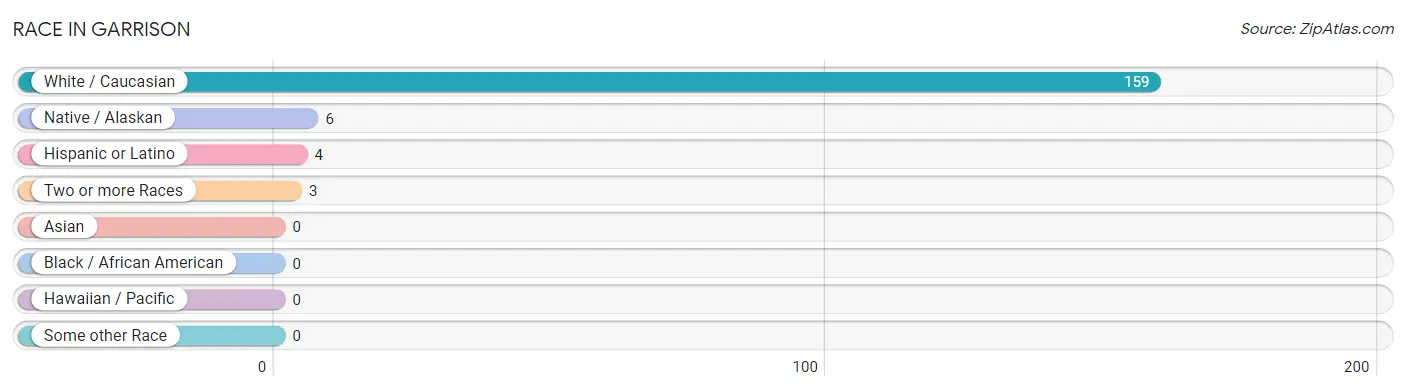
| Race | # Population | % Population |
| Asian | 0 | 0.0% |
| Black / African American | 0 | 0.0% |
| Hawaiian / Pacific | 0 | 0.0% |
| Hispanic or Latino | 4 | 2.4% |
| Native / Alaskan | 6 | 3.6% |
| White / Caucasian | 159 | 94.6% |
| Two or more Races | 3 | 1.8% |
| Some other Race | 0 | 0.0% |
| Total | 168 | 100.0% |
Ancestry in Garrison
The most populous ancestries reported in Garrison are German (61 | 36.3%), Swedish (26 | 15.5%), Polish (24 | 14.3%), Norwegian (22 | 13.1%), and Italian (10 | 5.9%), together accounting for 85.1% of all Garrison residents.
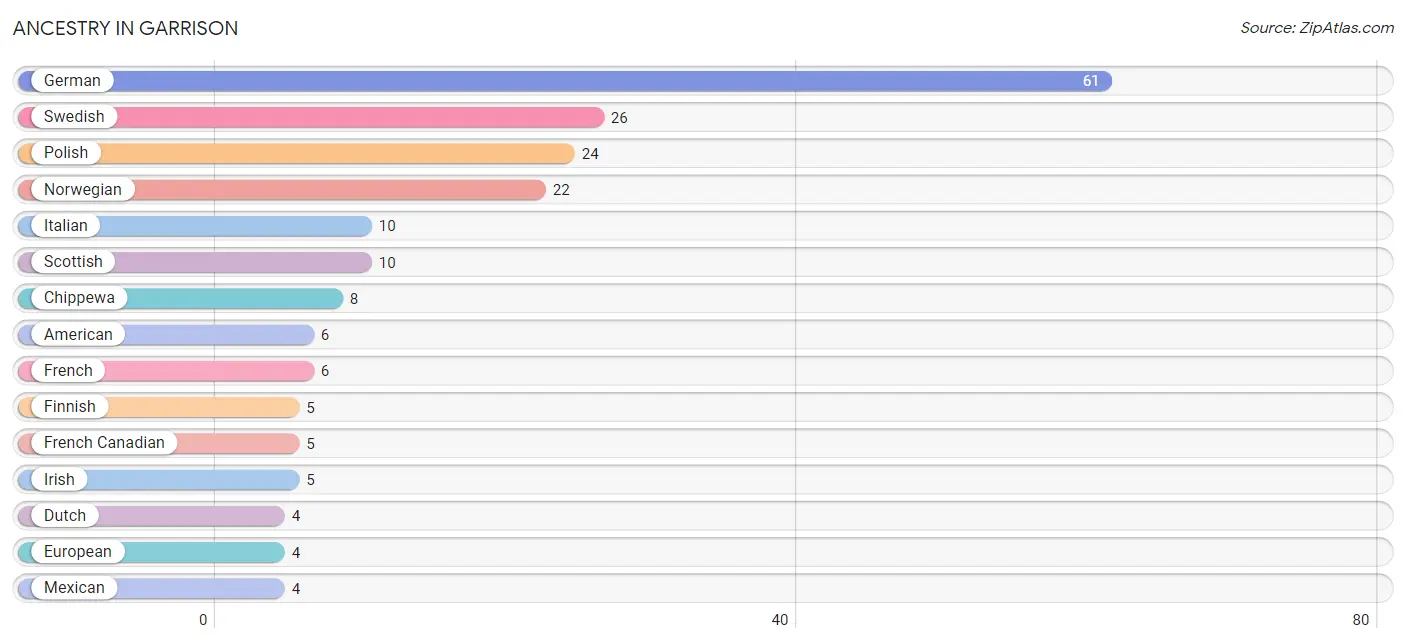
| Ancestry | # Population | % Population |
| American | 6 | 3.6% |
| Chippewa | 8 | 4.8% |
| Croatian | 2 | 1.2% |
| Czech | 1 | 0.6% |
| Danish | 2 | 1.2% |
| Dutch | 4 | 2.4% |
| European | 4 | 2.4% |
| Finnish | 5 | 3.0% |
| French | 6 | 3.6% |
| French Canadian | 5 | 3.0% |
| German | 61 | 36.3% |
| Irish | 5 | 3.0% |
| Italian | 10 | 5.9% |
| Mexican | 4 | 2.4% |
| Northern European | 1 | 0.6% |
| Norwegian | 22 | 13.1% |
| Polish | 24 | 14.3% |
| Scotch-Irish | 2 | 1.2% |
| Scottish | 10 | 5.9% |
| Swedish | 26 | 15.5% | View All 20 Rows |
Immigrants in Garrison

| Immigration Origin | # Population | % Population | View All 0 Rows |
Sex and Age in Garrison
Sex and Age in Garrison
The most populous age groups in Garrison are 45 to 49 Years (15 | 18.3%) for men and 60 to 64 Years (14 | 16.3%) for women.
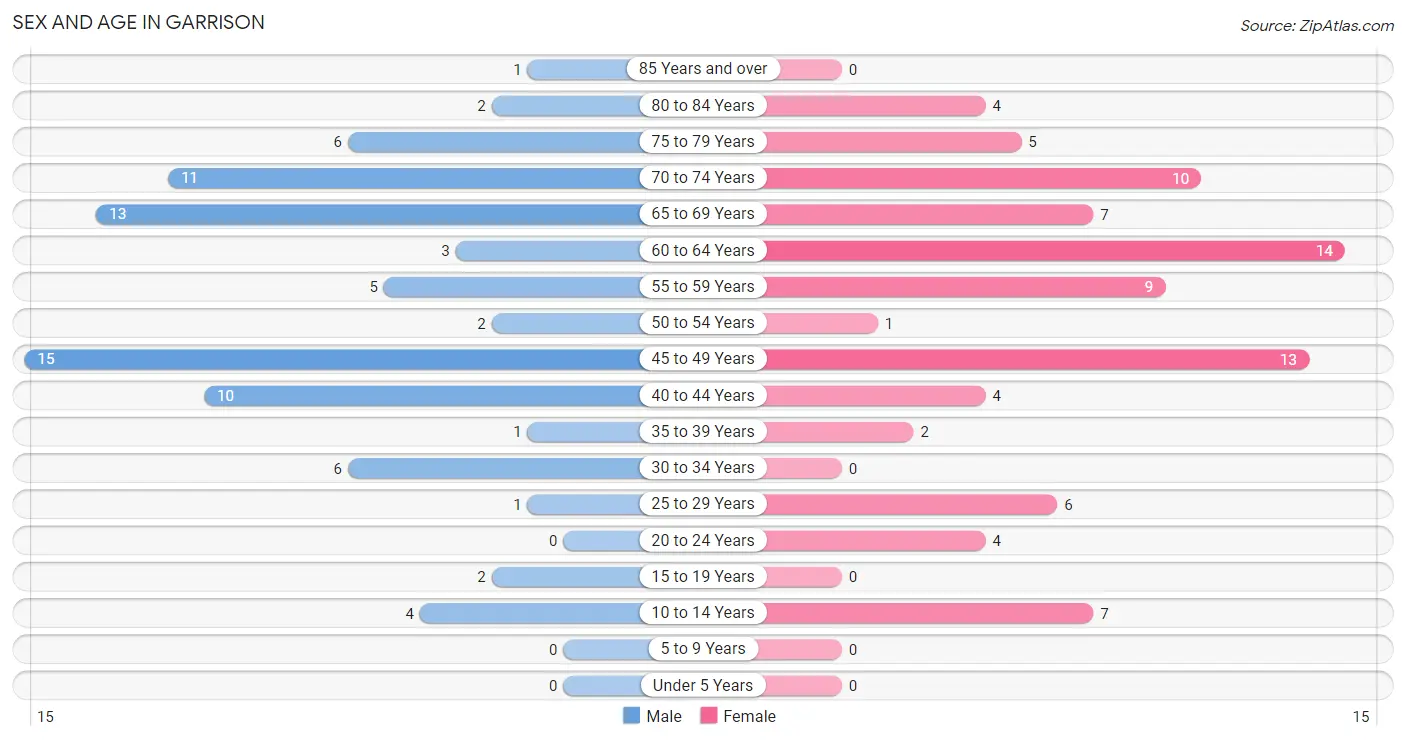
| Age Bracket | Male | Female |
| Under 5 Years | 0 (0.0%) | 0 (0.0%) |
| 5 to 9 Years | 0 (0.0%) | 0 (0.0%) |
| 10 to 14 Years | 4 (4.9%) | 7 (8.1%) |
| 15 to 19 Years | 2 (2.4%) | 0 (0.0%) |
| 20 to 24 Years | 0 (0.0%) | 4 (4.6%) |
| 25 to 29 Years | 1 (1.2%) | 6 (7.0%) |
| 30 to 34 Years | 6 (7.3%) | 0 (0.0%) |
| 35 to 39 Years | 1 (1.2%) | 2 (2.3%) |
| 40 to 44 Years | 10 (12.2%) | 4 (4.6%) |
| 45 to 49 Years | 15 (18.3%) | 13 (15.1%) |
| 50 to 54 Years | 2 (2.4%) | 1 (1.2%) |
| 55 to 59 Years | 5 (6.1%) | 9 (10.5%) |
| 60 to 64 Years | 3 (3.7%) | 14 (16.3%) |
| 65 to 69 Years | 13 (15.9%) | 7 (8.1%) |
| 70 to 74 Years | 11 (13.4%) | 10 (11.6%) |
| 75 to 79 Years | 6 (7.3%) | 5 (5.8%) |
| 80 to 84 Years | 2 (2.4%) | 4 (4.6%) |
| 85 Years and over | 1 (1.2%) | 0 (0.0%) |
| Total | 82 (100.0%) | 86 (100.0%) |
Families and Households in Garrison
Median Family Size in Garrison
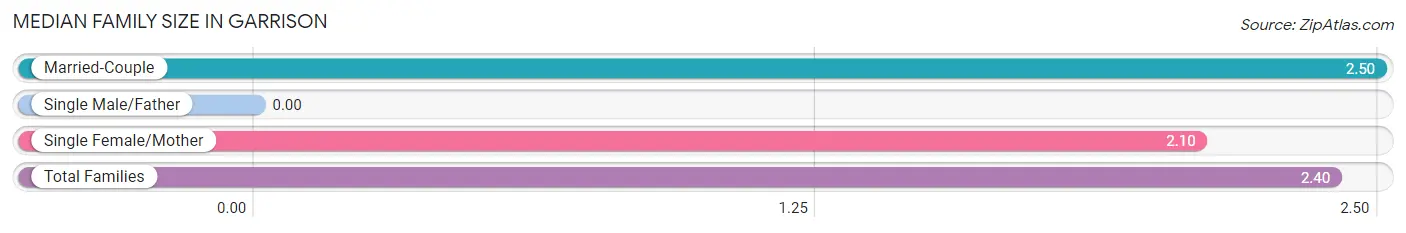
| Family Type | # Families | Family Size |
| Married-Couple | 32 (76.2%) | 2.50 |
| Single Male/Father | 0 (0.0%) | - |
| Single Female/Mother | 10 (23.8%) | 2.10 |
| Total Families | 42 (100.0%) | 2.40 |
Median Household Size in Garrison
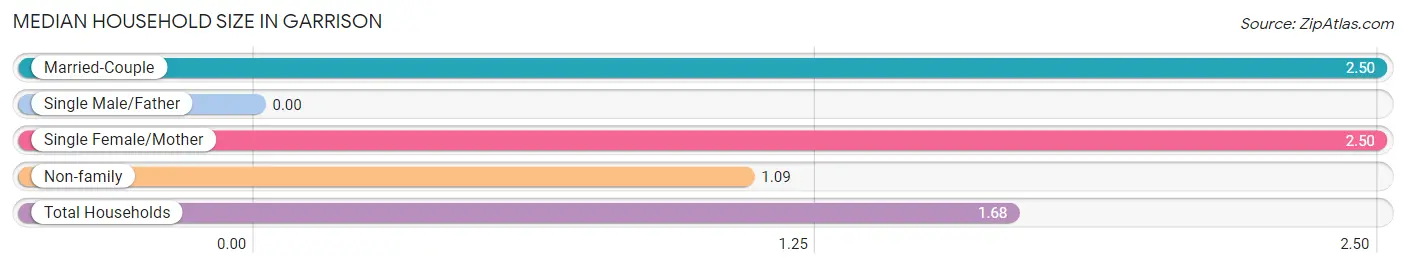
| Household Type | # Households | Household Size |
| Married-Couple | 32 (32.0%) | 2.50 |
| Single Male/Father | 0 (0.0%) | - |
| Single Female/Mother | 10 (10.0%) | 2.50 |
| Non-family | 58 (58.0%) | 1.09 |
| Total Households | 100 (100.0%) | 1.68 |
Household Size by Marriage Status in Garrison
Out of a total of 100 households in Garrison, 42 (42.0%) are family households, while 58 (58.0%) are nonfamily households. The most numerous type of family households are 2-person households, comprising 29, and the most common type of nonfamily households are 1-person households, comprising 55.
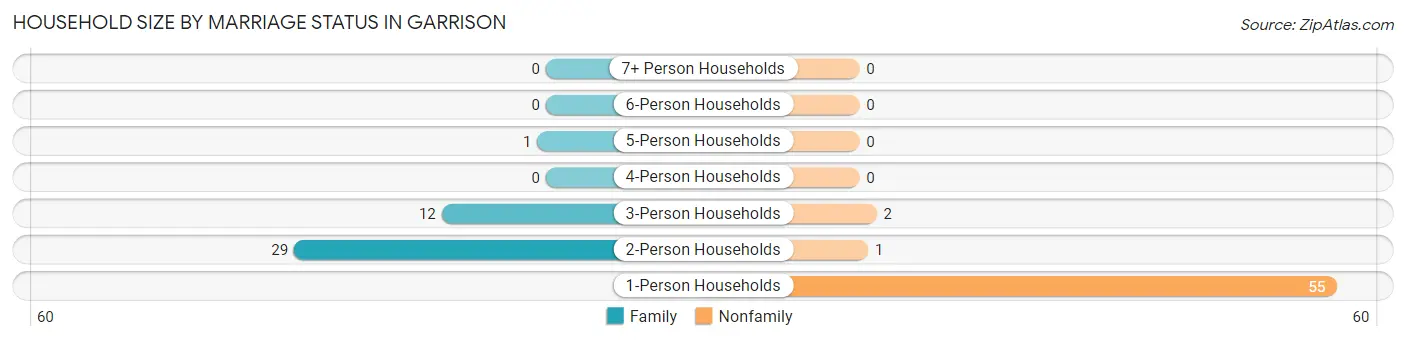
| Household Size | Family Households | Nonfamily Households |
| 1-Person Households | - | 55 (55.0%) |
| 2-Person Households | 29 (29.0%) | 1 (1.0%) |
| 3-Person Households | 12 (12.0%) | 2 (2.0%) |
| 4-Person Households | 0 (0.0%) | 0 (0.0%) |
| 5-Person Households | 1 (1.0%) | 0 (0.0%) |
| 6-Person Households | 0 (0.0%) | 0 (0.0%) |
| 7+ Person Households | 0 (0.0%) | 0 (0.0%) |
| Total | 42 (42.0%) | 58 (58.0%) |
Female Fertility in Garrison
Fertility by Age in Garrison
| Age Bracket | Women with Births | Births / 1,000 Women |
| 15 to 19 years | 0 (0.0%) | 0.0 |
| 20 to 34 years | 0 (0.0%) | 0.0 |
| 35 to 50 years | 0 (0.0%) | 0.0 |
| Total | 0 (0.0%) | 0.0 |
Fertility by Age by Marriage Status in Garrison
| Age Bracket | Married | Unmarried |
| 15 to 19 years | 0 (0.0%) | 0 (0.0%) |
| 20 to 34 years | 0 (0.0%) | 0 (0.0%) |
| 35 to 50 years | 0 (0.0%) | 0 (0.0%) |
| Total | 0 (0.0%) | 0 (0.0%) |
Fertility by Education in Garrison
| Educational Attainment | Women with Births | Births / 1,000 Women |
| Less than High School | 0 (0.0%) | 0.0 |
| High School Diploma | 0 (0.0%) | 0.0 |
| College or Associate's Degree | 0 (0.0%) | 0.0 |
| Bachelor's Degree | 0 (0.0%) | 0.0 |
| Graduate Degree | 0 (0.0%) | 0.0 |
| Total | 0 (0.0%) | 0.0 |
Fertility by Education by Marriage Status in Garrison
| Educational Attainment | Married | Unmarried |
| Less than High School | 0 (0.0%) | 0 (0.0%) |
| High School Diploma | 0 (0.0%) | 0 (0.0%) |
| College or Associate's Degree | 0 (0.0%) | 0 (0.0%) |
| Bachelor's Degree | 0 (0.0%) | 0 (0.0%) |
| Graduate Degree | 0 (0.0%) | 0 (0.0%) |
| Total | 0 (0.0%) | 0 (0.0%) |
Employment Characteristics in Garrison
Employment by Class of Employer in Garrison
Among the 80 employed individuals in Garrison, private company employees (47 | 58.8%), self-employed (not incorporated) (22 | 27.5%), and local government employees (8 | 10.0%) make up the most common classes of employment.
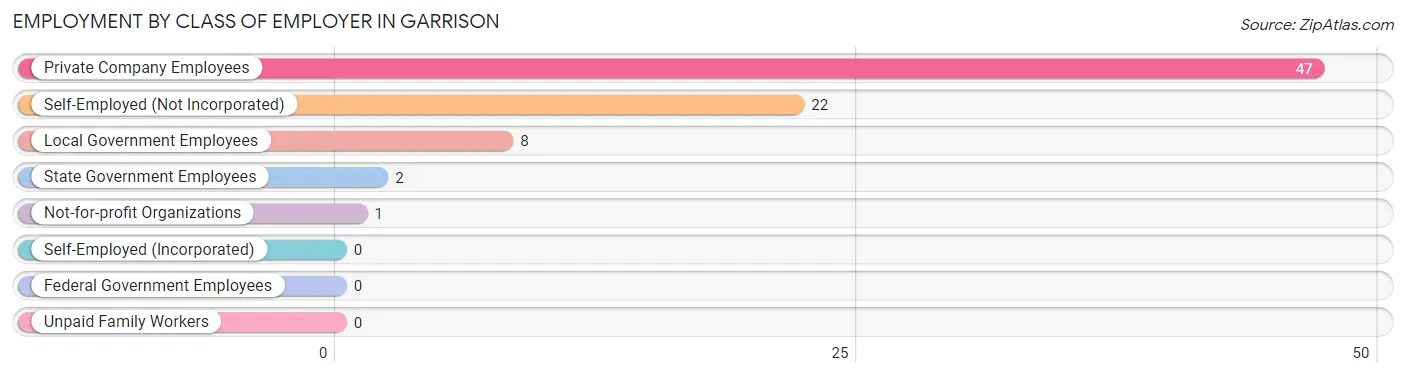
| Employer Class | # Employees | % Employees |
| Private Company Employees | 47 | 58.8% |
| Self-Employed (Incorporated) | 0 | 0.0% |
| Self-Employed (Not Incorporated) | 22 | 27.5% |
| Not-for-profit Organizations | 1 | 1.3% |
| Local Government Employees | 8 | 10.0% |
| State Government Employees | 2 | 2.5% |
| Federal Government Employees | 0 | 0.0% |
| Unpaid Family Workers | 0 | 0.0% |
| Total | 80 | 100.0% |
Employment Status by Age in Garrison
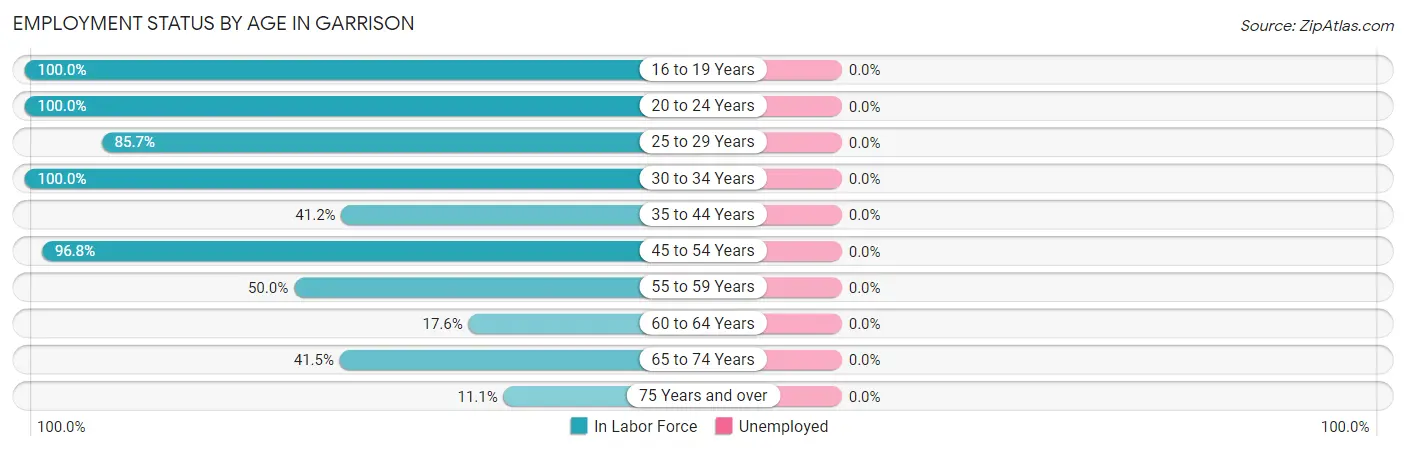
| Age Bracket | In Labor Force | Unemployed |
| 16 to 19 Years | 2 (100.0%) | 0 (0.0%) |
| 20 to 24 Years | 4 (100.0%) | 0 (0.0%) |
| 25 to 29 Years | 6 (85.7%) | 0 (0.0%) |
| 30 to 34 Years | 6 (100.0%) | 0 (0.0%) |
| 35 to 44 Years | 7 (41.2%) | 0 (0.0%) |
| 45 to 54 Years | 30 (96.8%) | 0 (0.0%) |
| 55 to 59 Years | 7 (50.0%) | 0 (0.0%) |
| 60 to 64 Years | 3 (17.6%) | 0 (0.0%) |
| 65 to 74 Years | 17 (41.5%) | 0 (0.0%) |
| 75 Years and over | 2 (11.1%) | 0 (0.0%) |
| Total | 84 (53.5%) | 0 (0.0%) |
Employment Status by Educational Attainment in Garrison
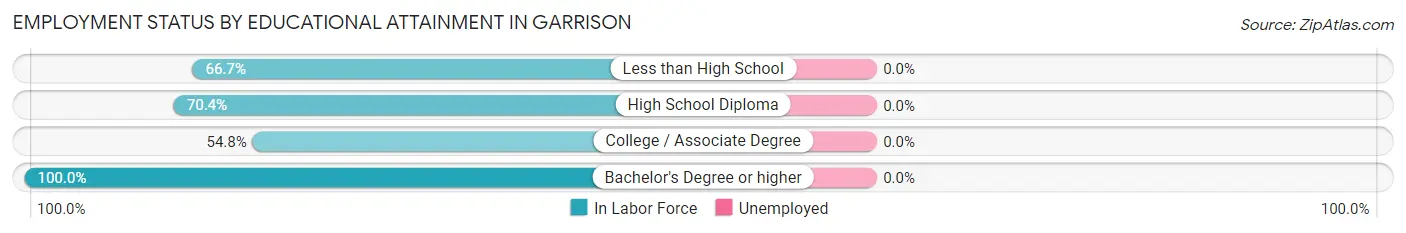
| Educational Attainment | In Labor Force | Unemployed |
| Less than High School | 22 (66.7%) | 0 (0.0%) |
| High School Diploma | 19 (70.4%) | 0 (0.0%) |
| College / Associate Degree | 17 (54.8%) | 0 (0.0%) |
| Bachelor's Degree or higher | 1 (100.0%) | 0 (0.0%) |
| Total | 59 (64.1%) | 0 (0.0%) |
Employment Occupations by Sex in Garrison
Management, Business, Science and Arts Occupations
The most common Management, Business, Science and Arts occupations in Garrison are Management (7 | 8.3%), Business & Financial (6 | 7.1%), Computers, Engineering & Science (2 | 2.4%), Life, Physical & Social Science (2 | 2.4%), and Health Diagnosing & Treating (1 | 1.2%).
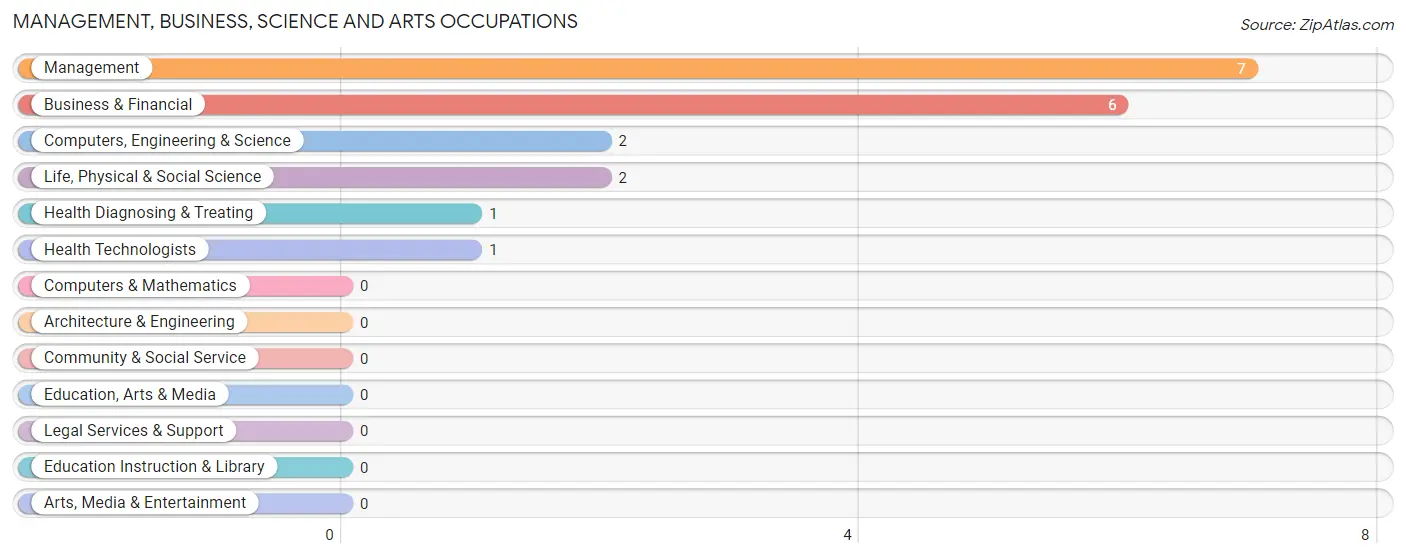
Management, Business, Science and Arts Occupations by Sex
Within the Management, Business, Science and Arts occupations in Garrison, the most male-oriented occupations are Business & Financial (66.7%), and Management (14.3%), while the most female-oriented occupations are Computers, Engineering & Science (100.0%), Life, Physical & Social Science (100.0%), and Health Diagnosing & Treating (100.0%).
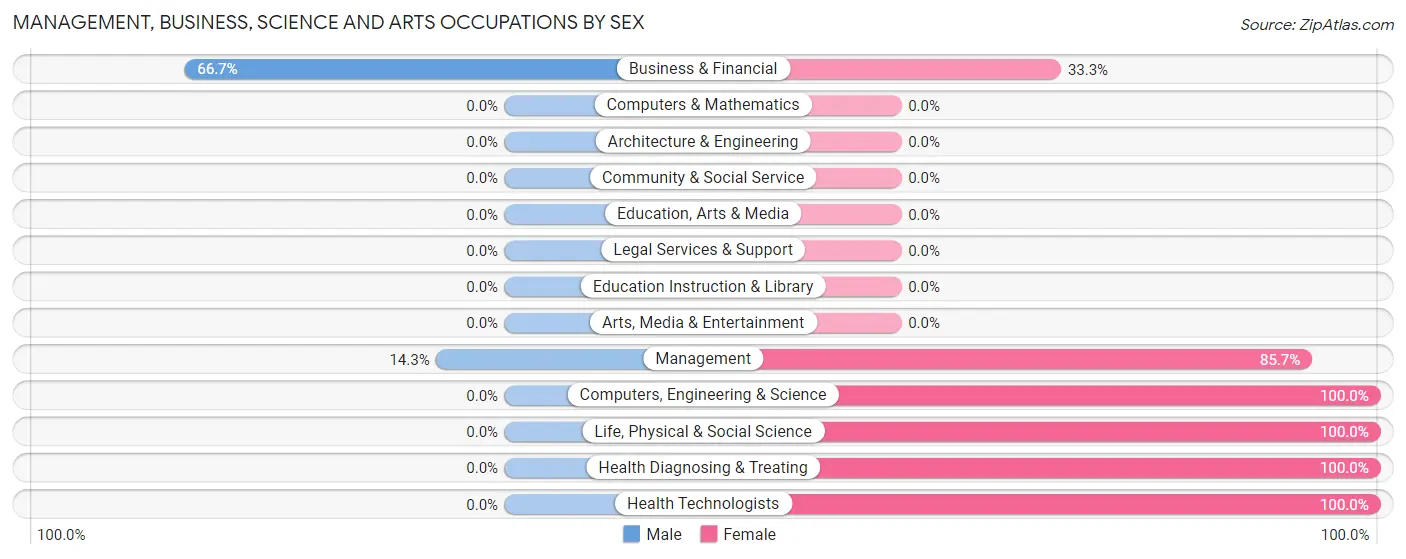
| Occupation | Male | Female |
| Management | 1 (14.3%) | 6 (85.7%) |
| Business & Financial | 4 (66.7%) | 2 (33.3%) |
| Computers, Engineering & Science | 0 (0.0%) | 2 (100.0%) |
| Computers & Mathematics | 0 (0.0%) | 0 (0.0%) |
| Architecture & Engineering | 0 (0.0%) | 0 (0.0%) |
| Life, Physical & Social Science | 0 (0.0%) | 2 (100.0%) |
| Community & Social Service | 0 (0.0%) | 0 (0.0%) |
| Education, Arts & Media | 0 (0.0%) | 0 (0.0%) |
| Legal Services & Support | 0 (0.0%) | 0 (0.0%) |
| Education Instruction & Library | 0 (0.0%) | 0 (0.0%) |
| Arts, Media & Entertainment | 0 (0.0%) | 0 (0.0%) |
| Health Diagnosing & Treating | 0 (0.0%) | 1 (100.0%) |
| Health Technologists | 0 (0.0%) | 1 (100.0%) |
| Total (Category) | 5 (31.2%) | 11 (68.8%) |
| Total (Overall) | 42 (50.0%) | 42 (50.0%) |
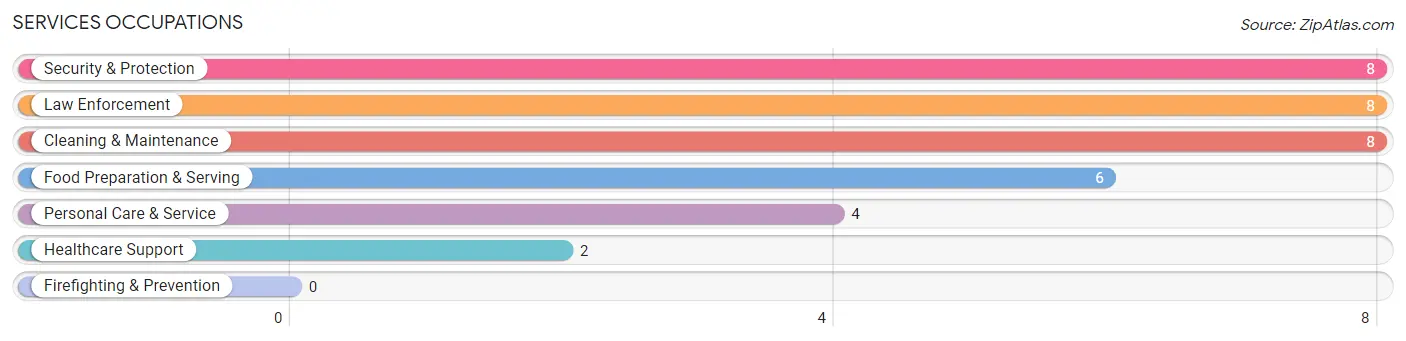
Services Occupations
The most common Services occupations in Garrison are Security & Protection (8 | 9.5%), Law Enforcement (8 | 9.5%), Cleaning & Maintenance (8 | 9.5%), Food Preparation & Serving (6 | 7.1%), and Personal Care & Service (4 | 4.8%).
Services Occupations by Sex
Within the Services occupations in Garrison, the most male-oriented occupations are Cleaning & Maintenance (50.0%), Personal Care & Service (50.0%), and Security & Protection (37.5%), while the most female-oriented occupations are Healthcare Support (100.0%), Food Preparation & Serving (83.3%), and Security & Protection (62.5%).
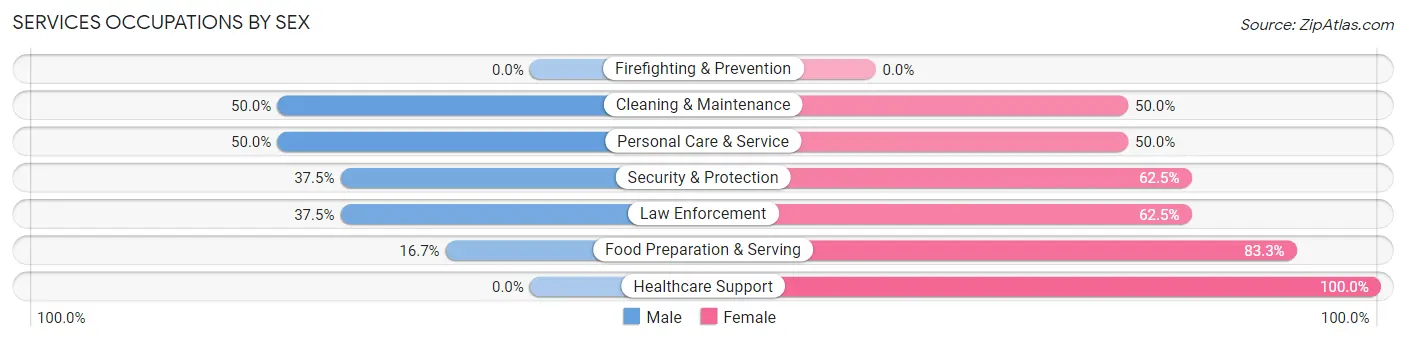
| Occupation | Male | Female |
| Healthcare Support | 0 (0.0%) | 2 (100.0%) |
| Security & Protection | 3 (37.5%) | 5 (62.5%) |
| Firefighting & Prevention | 0 (0.0%) | 0 (0.0%) |
| Law Enforcement | 3 (37.5%) | 5 (62.5%) |
| Food Preparation & Serving | 1 (16.7%) | 5 (83.3%) |
| Cleaning & Maintenance | 4 (50.0%) | 4 (50.0%) |
| Personal Care & Service | 2 (50.0%) | 2 (50.0%) |
| Total (Category) | 10 (35.7%) | 18 (64.3%) |
| Total (Overall) | 42 (50.0%) | 42 (50.0%) |
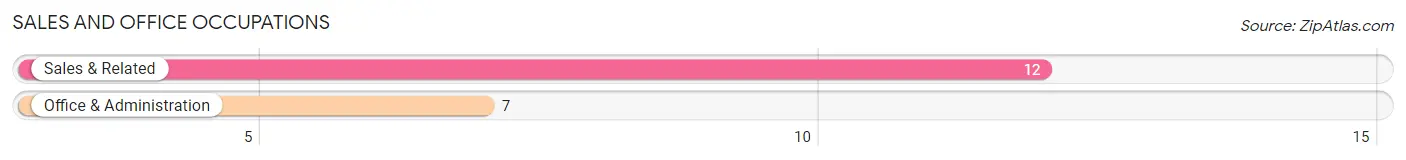
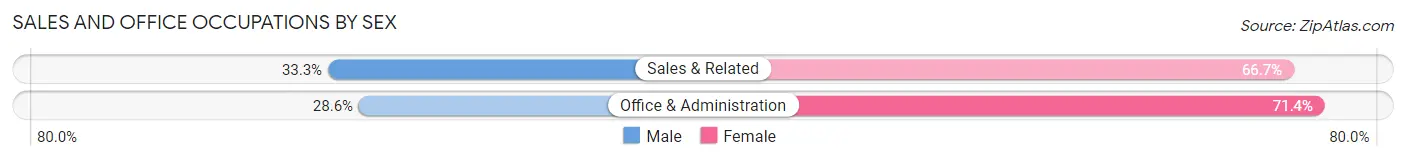
Sales and Office Occupations
The most common Sales and Office occupations in Garrison are Sales & Related (12 | 14.3%), and Office & Administration (7 | 8.3%).
Sales and Office Occupations by Sex
| Occupation | Male | Female |
| Sales & Related | 4 (33.3%) | 8 (66.7%) |
| Office & Administration | 2 (28.6%) | 5 (71.4%) |
| Total (Category) | 6 (31.6%) | 13 (68.4%) |
| Total (Overall) | 42 (50.0%) | 42 (50.0%) |
Natural Resources, Construction and Maintenance Occupations
The most common Natural Resources, Construction and Maintenance occupations in Garrison are , and Construction & Extraction (2 | 2.4%).
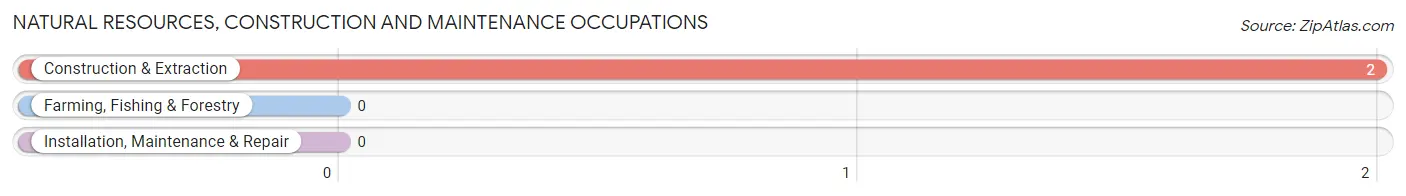
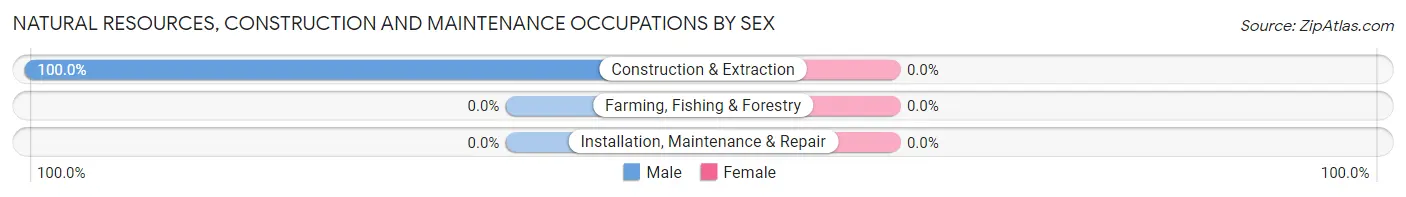
Natural Resources, Construction and Maintenance Occupations by Sex
| Occupation | Male | Female |
| Farming, Fishing & Forestry | 0 (0.0%) | 0 (0.0%) |
| Construction & Extraction | 2 (100.0%) | 0 (0.0%) |
| Installation, Maintenance & Repair | 0 (0.0%) | 0 (0.0%) |
| Total (Category) | 2 (100.0%) | 0 (0.0%) |
| Total (Overall) | 42 (50.0%) | 42 (50.0%) |
Production, Transportation and Moving Occupations
The most common Production, Transportation and Moving occupations in Garrison are Transportation (15 | 17.9%), Production (2 | 2.4%), and Material Moving (2 | 2.4%).
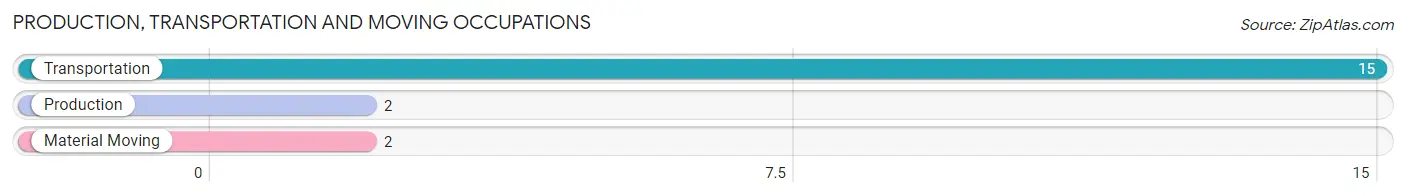
Production, Transportation and Moving Occupations by Sex
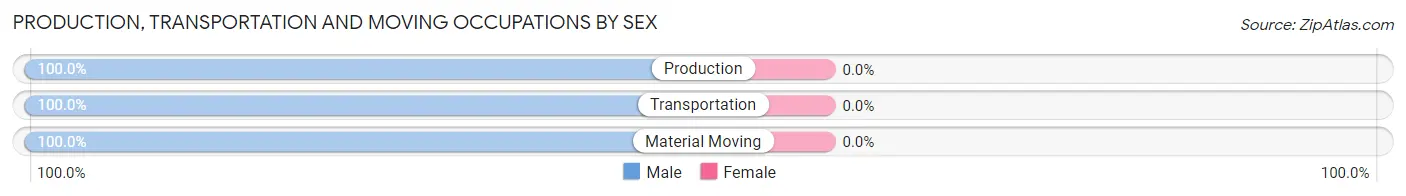
| Occupation | Male | Female |
| Production | 2 (100.0%) | 0 (0.0%) |
| Transportation | 15 (100.0%) | 0 (0.0%) |
| Material Moving | 2 (100.0%) | 0 (0.0%) |
| Total (Category) | 19 (100.0%) | 0 (0.0%) |
| Total (Overall) | 42 (50.0%) | 42 (50.0%) |
Employment Industries by Sex in Garrison
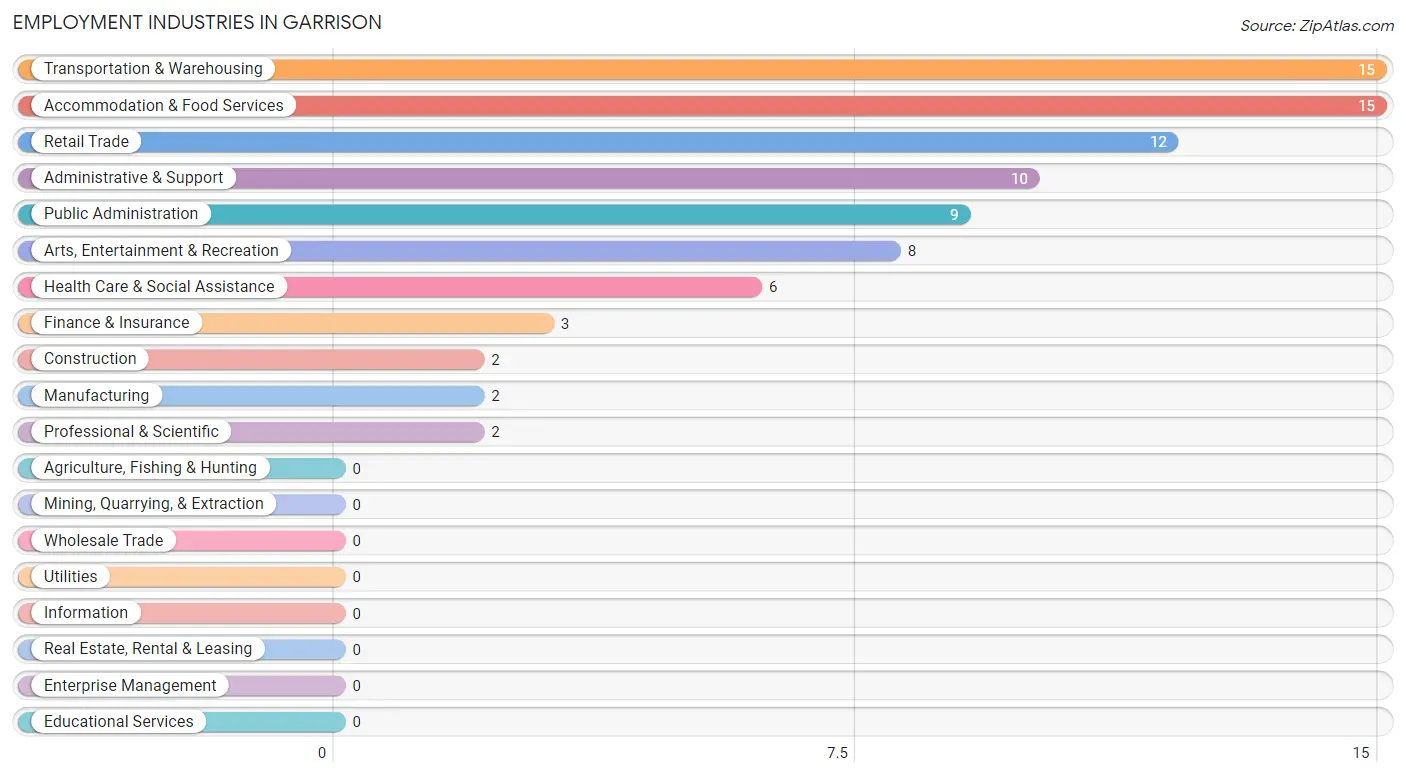
Employment Industries in Garrison
The major employment industries in Garrison include Transportation & Warehousing (15 | 17.9%), Accommodation & Food Services (15 | 17.9%), Retail Trade (12 | 14.3%), Administrative & Support (10 | 11.9%), and Public Administration (9 | 10.7%).
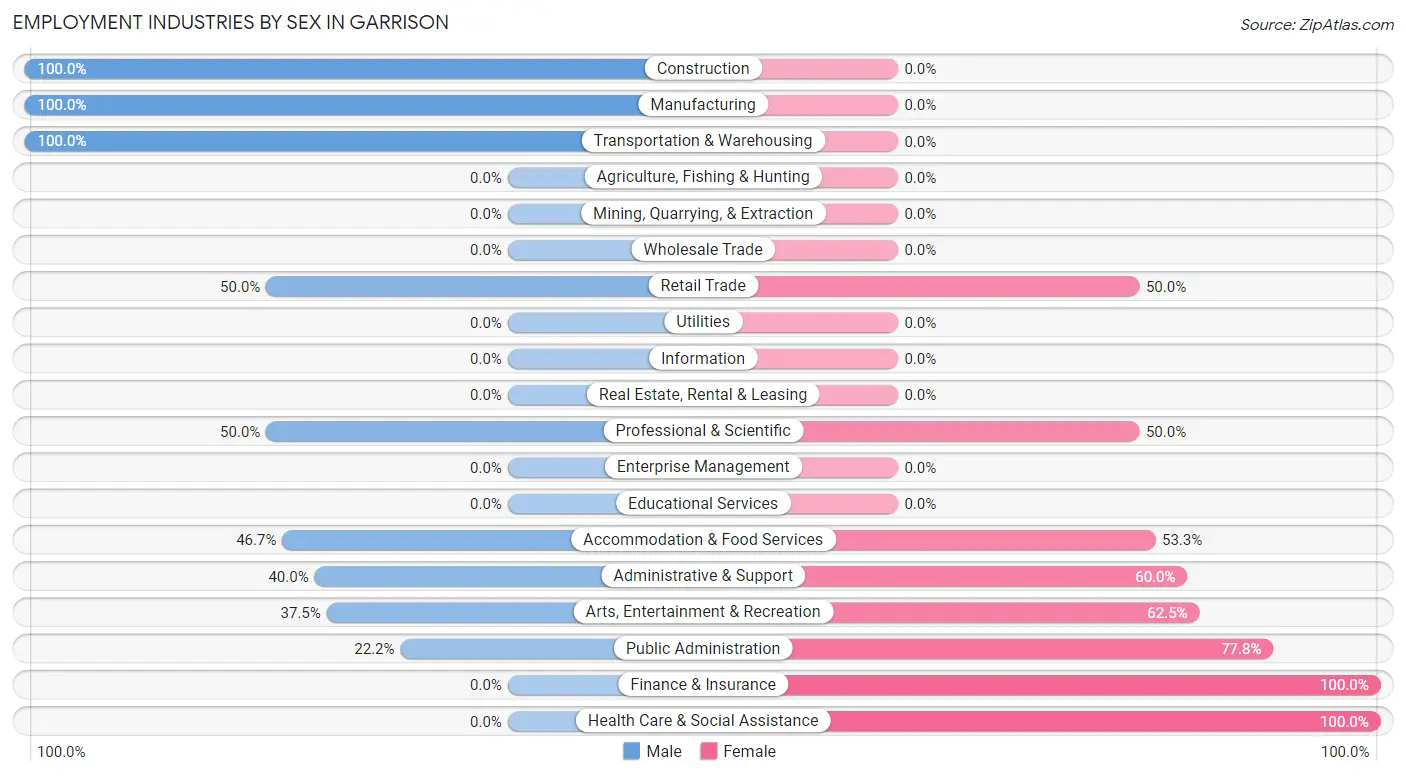
Employment Industries by Sex in Garrison
The Garrison industries that see more men than women are Construction (100.0%), Manufacturing (100.0%), and Transportation & Warehousing (100.0%), whereas the industries that tend to have a higher number of women are Finance & Insurance (100.0%), Health Care & Social Assistance (100.0%), and Public Administration (77.8%).
| Industry | Male | Female |
| Agriculture, Fishing & Hunting | 0 (0.0%) | 0 (0.0%) |
| Mining, Quarrying, & Extraction | 0 (0.0%) | 0 (0.0%) |
| Construction | 2 (100.0%) | 0 (0.0%) |
| Manufacturing | 2 (100.0%) | 0 (0.0%) |
| Wholesale Trade | 0 (0.0%) | 0 (0.0%) |
| Retail Trade | 6 (50.0%) | 6 (50.0%) |
| Transportation & Warehousing | 15 (100.0%) | 0 (0.0%) |
| Utilities | 0 (0.0%) | 0 (0.0%) |
| Information | 0 (0.0%) | 0 (0.0%) |
| Finance & Insurance | 0 (0.0%) | 3 (100.0%) |
| Real Estate, Rental & Leasing | 0 (0.0%) | 0 (0.0%) |
| Professional & Scientific | 1 (50.0%) | 1 (50.0%) |
| Enterprise Management | 0 (0.0%) | 0 (0.0%) |
| Administrative & Support | 4 (40.0%) | 6 (60.0%) |
| Educational Services | 0 (0.0%) | 0 (0.0%) |
| Health Care & Social Assistance | 0 (0.0%) | 6 (100.0%) |
| Arts, Entertainment & Recreation | 3 (37.5%) | 5 (62.5%) |
| Accommodation & Food Services | 7 (46.7%) | 8 (53.3%) |
| Public Administration | 2 (22.2%) | 7 (77.8%) |
| Total | 42 (50.0%) | 42 (50.0%) |
Education in Garrison
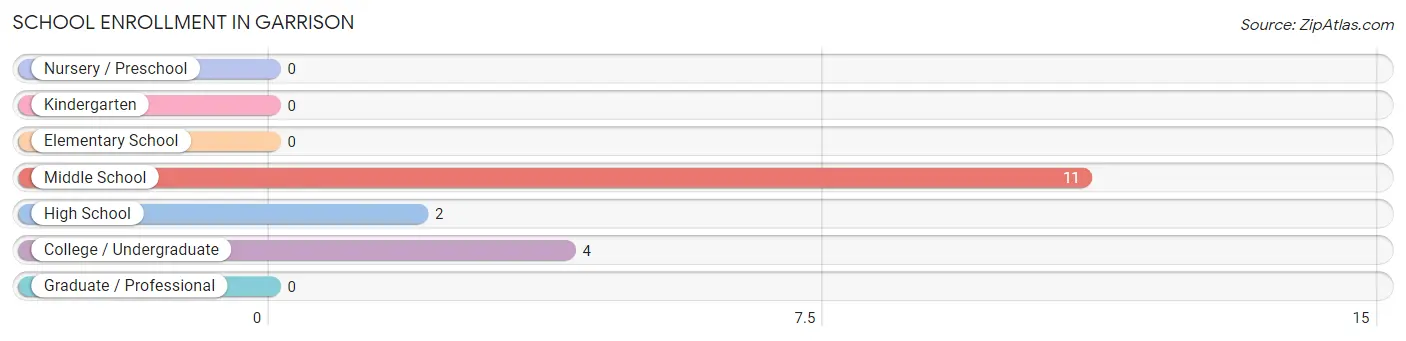
School Enrollment in Garrison
The most common levels of schooling among the 17 students in Garrison are middle school (11 | 64.7%), college / undergraduate (4 | 23.5%), and high school (2 | 11.8%).
| School Level | # Students | % Students |
| Nursery / Preschool | 0 | 0.0% |
| Kindergarten | 0 | 0.0% |
| Elementary School | 0 | 0.0% |
| Middle School | 11 | 64.7% |
| High School | 2 | 11.8% |
| College / Undergraduate | 4 | 23.5% |
| Graduate / Professional | 0 | 0.0% |
| Total | 17 | 100.0% |
School Enrollment by Age by Funding Source in Garrison
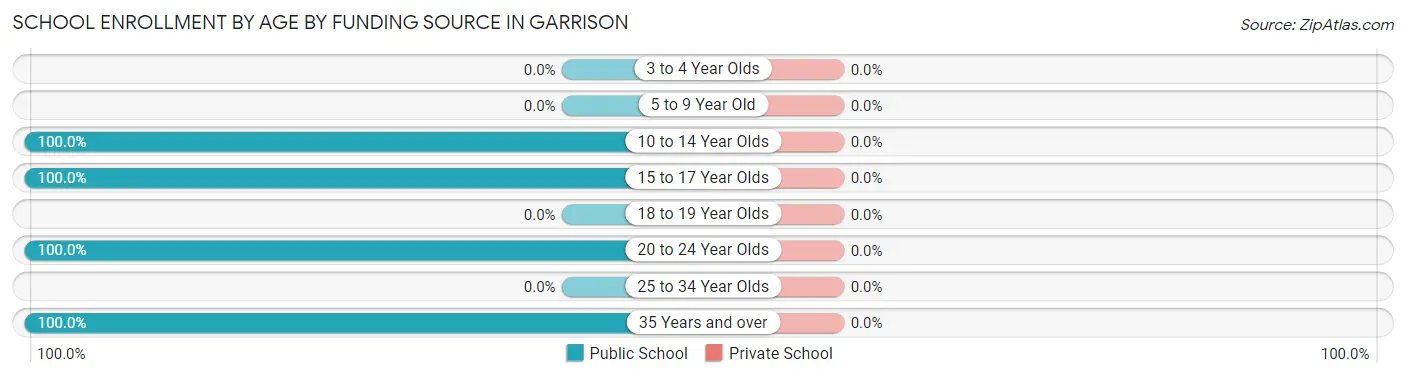
| Age Bracket | Public School | Private School |
| 3 to 4 Year Olds | 0 (0.0%) | 0 (0.0%) |
| 5 to 9 Year Old | 0 (0.0%) | 0 (0.0%) |
| 10 to 14 Year Olds | 11 (100.0%) | 0 (0.0%) |
| 15 to 17 Year Olds | 2 (100.0%) | 0 (0.0%) |
| 18 to 19 Year Olds | 0 (0.0%) | 0 (0.0%) |
| 20 to 24 Year Olds | 2 (100.0%) | 0 (0.0%) |
| 25 to 34 Year Olds | 0 (0.0%) | 0 (0.0%) |
| 35 Years and over | 2 (100.0%) | 0 (0.0%) |
| Total | 17 (100.0%) | 0 (0.0%) |
Educational Attainment by Field of Study in Garrison
Education (3 | 60.0%), business (1 | 20.0%), and communications (1 | 20.0%) are the most common fields of study among 5 individuals in Garrison who have obtained a bachelor's degree or higher.
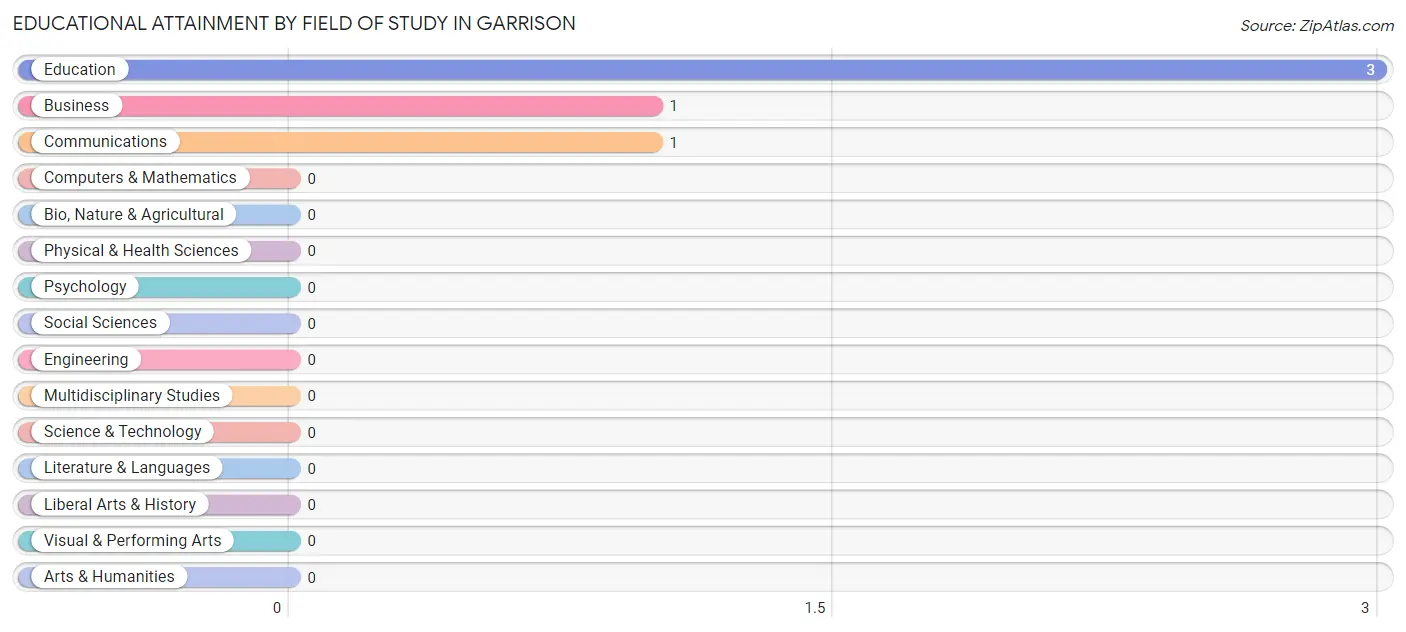
| Field of Study | # Graduates | % Graduates |
| Computers & Mathematics | 0 | 0.0% |
| Bio, Nature & Agricultural | 0 | 0.0% |
| Physical & Health Sciences | 0 | 0.0% |
| Psychology | 0 | 0.0% |
| Social Sciences | 0 | 0.0% |
| Engineering | 0 | 0.0% |
| Multidisciplinary Studies | 0 | 0.0% |
| Science & Technology | 0 | 0.0% |
| Business | 1 | 20.0% |
| Education | 3 | 60.0% |
| Literature & Languages | 0 | 0.0% |
| Liberal Arts & History | 0 | 0.0% |
| Visual & Performing Arts | 0 | 0.0% |
| Communications | 1 | 20.0% |
| Arts & Humanities | 0 | 0.0% |
| Total | 5 | 100.0% |
Transportation & Commute in Garrison
Vehicle Availability by Sex in Garrison
The most prevalent vehicle ownership categories in Garrison are males with 1 vehicle (21, accounting for 55.3%) and females with 1 vehicle (17, making up 50.0%).
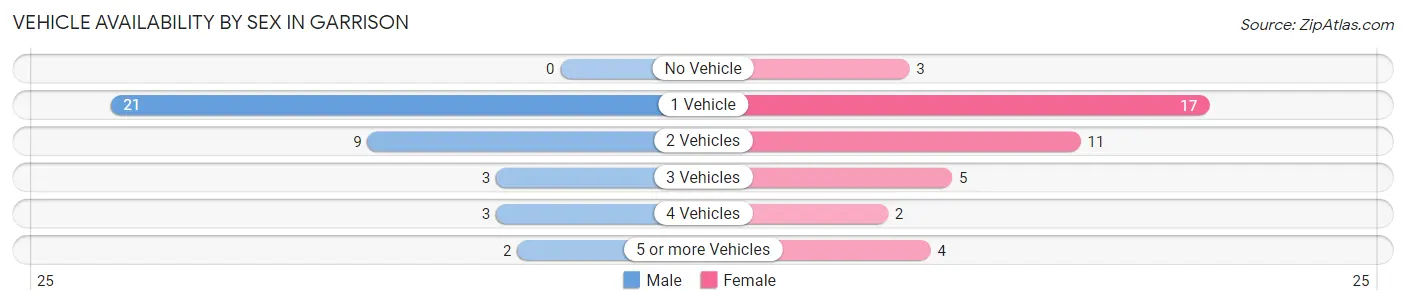
| Vehicles Available | Male | Female |
| No Vehicle | 0 (0.0%) | 3 (7.1%) |
| 1 Vehicle | 21 (55.3%) | 17 (40.5%) |
| 2 Vehicles | 9 (23.7%) | 11 (26.2%) |
| 3 Vehicles | 3 (7.9%) | 5 (11.9%) |
| 4 Vehicles | 3 (7.9%) | 2 (4.8%) |
| 5 or more Vehicles | 2 (5.3%) | 4 (9.5%) |
| Total | 38 (100.0%) | 42 (100.0%) |
Commute Time in Garrison
The most frequently occuring commute durations in Garrison are 5 to 9 minutes (24 commuters, 30.4%), 10 to 14 minutes (17 commuters, 21.5%), and less than 5 minutes (16 commuters, 20.3%).
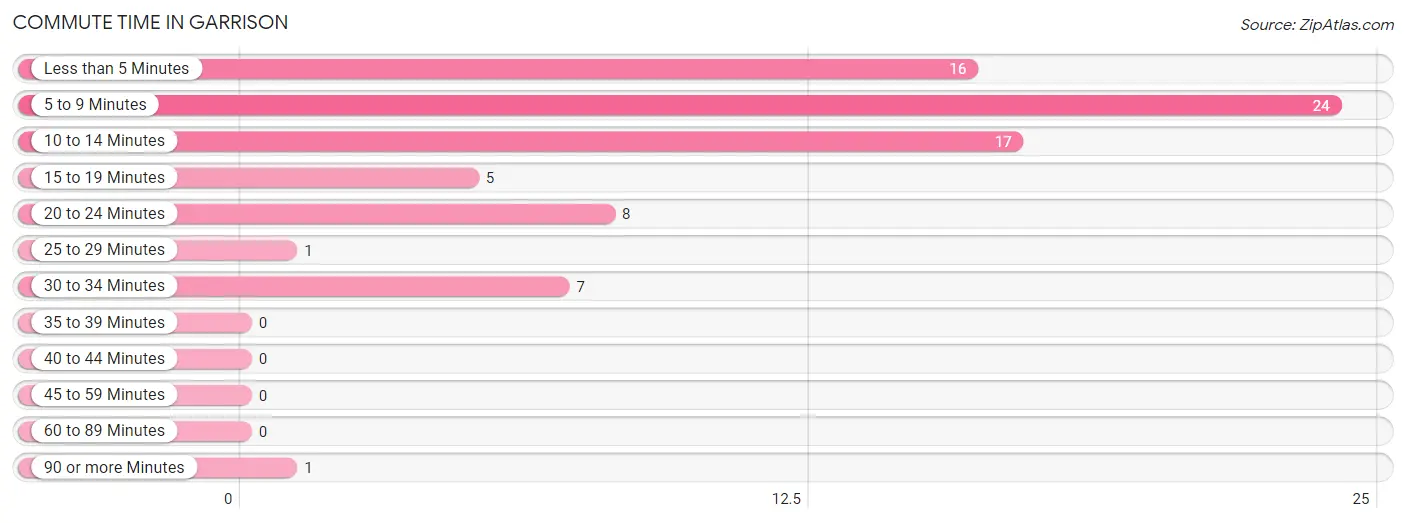
| Commute Time | # Commuters | % Commuters |
| Less than 5 Minutes | 16 | 20.3% |
| 5 to 9 Minutes | 24 | 30.4% |
| 10 to 14 Minutes | 17 | 21.5% |
| 15 to 19 Minutes | 5 | 6.3% |
| 20 to 24 Minutes | 8 | 10.1% |
| 25 to 29 Minutes | 1 | 1.3% |
| 30 to 34 Minutes | 7 | 8.9% |
| 35 to 39 Minutes | 0 | 0.0% |
| 40 to 44 Minutes | 0 | 0.0% |
| 45 to 59 Minutes | 0 | 0.0% |
| 60 to 89 Minutes | 0 | 0.0% |
| 90 or more Minutes | 1 | 1.3% |
Commute Time by Sex in Garrison
The most common commute times in Garrison are less than 5 minutes (15 commuters, 39.5%) for males and 5 to 9 minutes (18 commuters, 43.9%) for females.
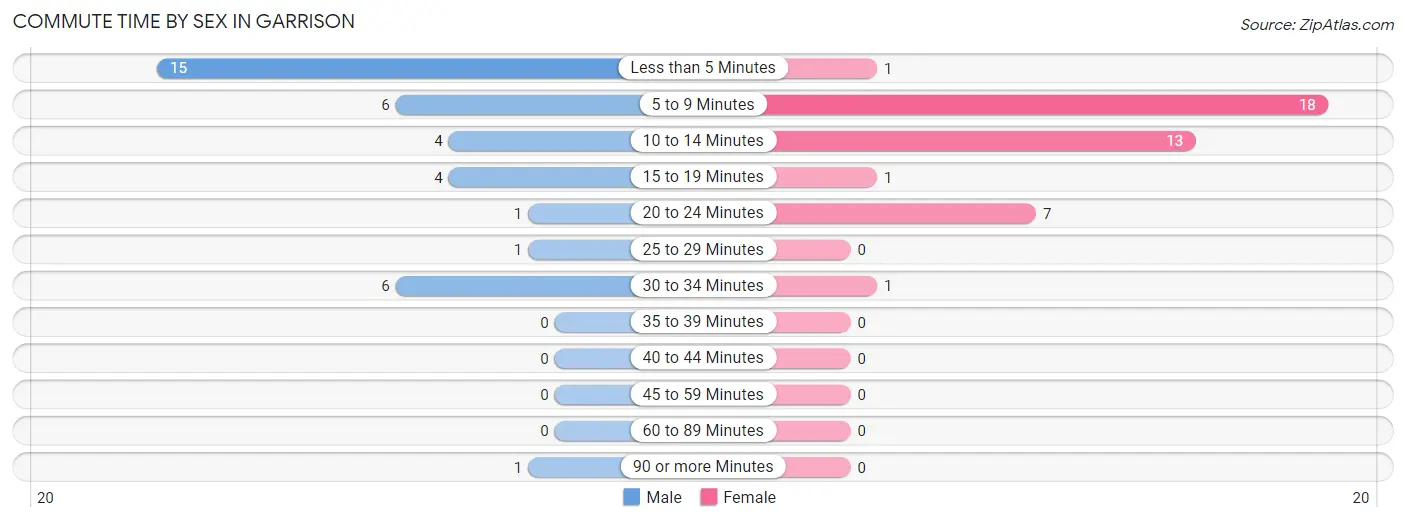
| Commute Time | Male | Female |
| Less than 5 Minutes | 15 (39.5%) | 1 (2.4%) |
| 5 to 9 Minutes | 6 (15.8%) | 18 (43.9%) |
| 10 to 14 Minutes | 4 (10.5%) | 13 (31.7%) |
| 15 to 19 Minutes | 4 (10.5%) | 1 (2.4%) |
| 20 to 24 Minutes | 1 (2.6%) | 7 (17.1%) |
| 25 to 29 Minutes | 1 (2.6%) | 0 (0.0%) |
| 30 to 34 Minutes | 6 (15.8%) | 1 (2.4%) |
| 35 to 39 Minutes | 0 (0.0%) | 0 (0.0%) |
| 40 to 44 Minutes | 0 (0.0%) | 0 (0.0%) |
| 45 to 59 Minutes | 0 (0.0%) | 0 (0.0%) |
| 60 to 89 Minutes | 0 (0.0%) | 0 (0.0%) |
| 90 or more Minutes | 1 (2.6%) | 0 (0.0%) |
Time of Departure to Work by Sex in Garrison
The most frequent times of departure to work in Garrison are 6:30 AM to 6:59 AM (19, 50.0%) for males and 7:00 AM to 7:29 AM (10, 24.4%) for females.
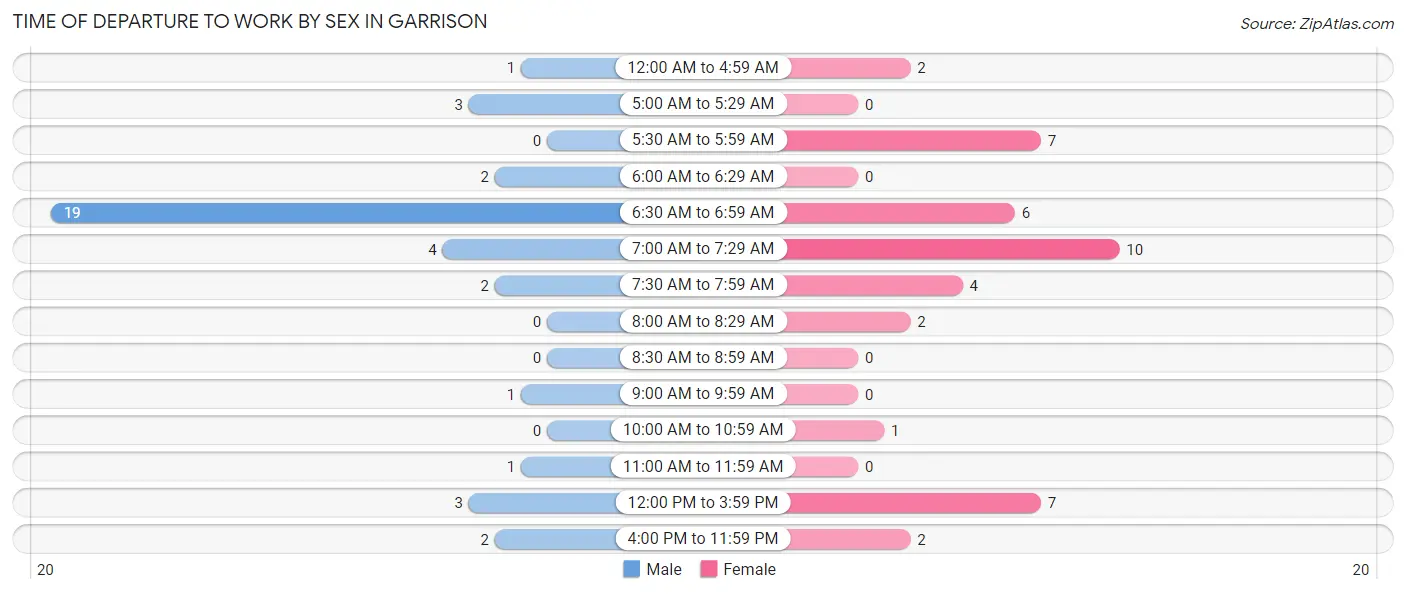
| Time of Departure | Male | Female |
| 12:00 AM to 4:59 AM | 1 (2.6%) | 2 (4.9%) |
| 5:00 AM to 5:29 AM | 3 (7.9%) | 0 (0.0%) |
| 5:30 AM to 5:59 AM | 0 (0.0%) | 7 (17.1%) |
| 6:00 AM to 6:29 AM | 2 (5.3%) | 0 (0.0%) |
| 6:30 AM to 6:59 AM | 19 (50.0%) | 6 (14.6%) |
| 7:00 AM to 7:29 AM | 4 (10.5%) | 10 (24.4%) |
| 7:30 AM to 7:59 AM | 2 (5.3%) | 4 (9.8%) |
| 8:00 AM to 8:29 AM | 0 (0.0%) | 2 (4.9%) |
| 8:30 AM to 8:59 AM | 0 (0.0%) | 0 (0.0%) |
| 9:00 AM to 9:59 AM | 1 (2.6%) | 0 (0.0%) |
| 10:00 AM to 10:59 AM | 0 (0.0%) | 1 (2.4%) |
| 11:00 AM to 11:59 AM | 1 (2.6%) | 0 (0.0%) |
| 12:00 PM to 3:59 PM | 3 (7.9%) | 7 (17.1%) |
| 4:00 PM to 11:59 PM | 2 (5.3%) | 2 (4.9%) |
| Total | 38 (100.0%) | 41 (100.0%) |
Housing Occupancy in Garrison
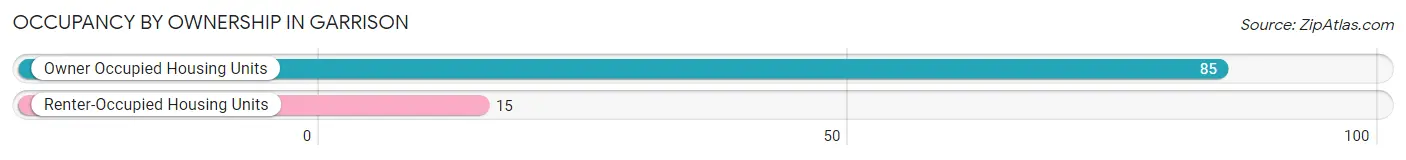
Occupancy by Ownership in Garrison
Of the total 100 dwellings in Garrison, owner-occupied units account for 85 (85.0%), while renter-occupied units make up 15 (15.0%).
| Occupancy | # Housing Units | % Housing Units |
| Owner Occupied Housing Units | 85 | 85.0% |
| Renter-Occupied Housing Units | 15 | 15.0% |
| Total Occupied Housing Units | 100 | 100.0% |
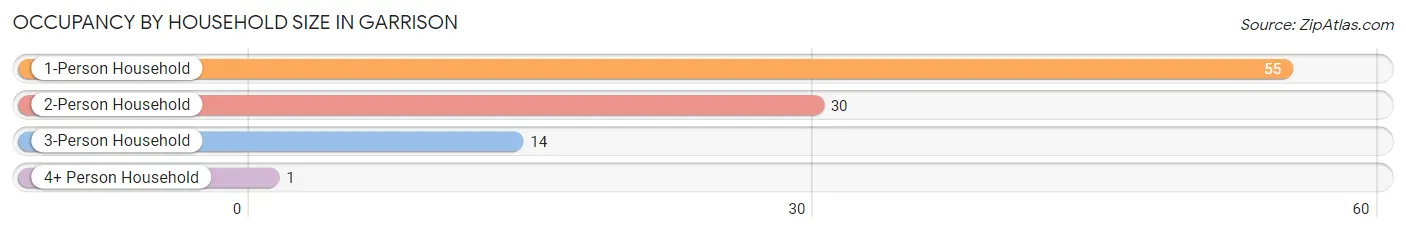
Occupancy by Household Size in Garrison
| Household Size | # Housing Units | % Housing Units |
| 1-Person Household | 55 | 55.0% |
| 2-Person Household | 30 | 30.0% |
| 3-Person Household | 14 | 14.0% |
| 4+ Person Household | 1 | 1.0% |
| Total Housing Units | 100 | 100.0% |
Occupancy by Ownership by Household Size in Garrison
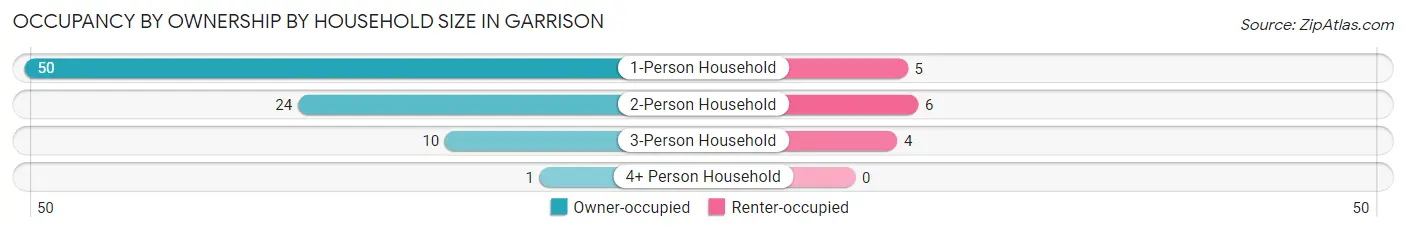
| Household Size | Owner-occupied | Renter-occupied |
| 1-Person Household | 50 (90.9%) | 5 (9.1%) |
| 2-Person Household | 24 (80.0%) | 6 (20.0%) |
| 3-Person Household | 10 (71.4%) | 4 (28.6%) |
| 4+ Person Household | 1 (100.0%) | 0 (0.0%) |
| Total Housing Units | 85 (85.0%) | 15 (15.0%) |
Occupancy by Educational Attainment in Garrison
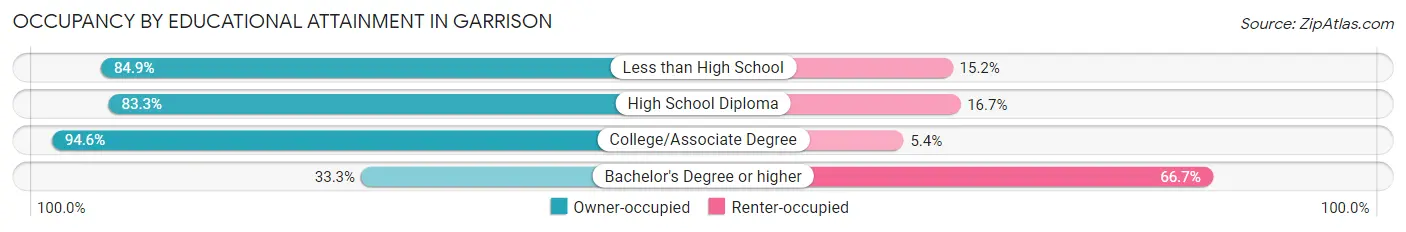
| Household Size | Owner-occupied | Renter-occupied |
| Less than High School | 28 (84.9%) | 5 (15.1%) |
| High School Diploma | 20 (83.3%) | 4 (16.7%) |
| College/Associate Degree | 35 (94.6%) | 2 (5.4%) |
| Bachelor's Degree or higher | 2 (33.3%) | 4 (66.7%) |
Occupancy by Age of Householder in Garrison
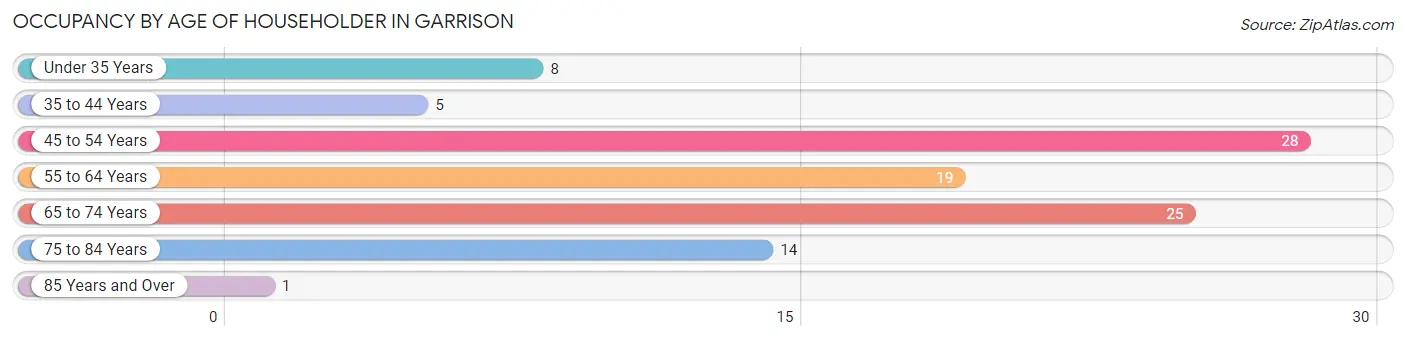
| Age Bracket | # Households | % Households |
| Under 35 Years | 8 | 8.0% |
| 35 to 44 Years | 5 | 5.0% |
| 45 to 54 Years | 28 | 28.0% |
| 55 to 64 Years | 19 | 19.0% |
| 65 to 74 Years | 25 | 25.0% |
| 75 to 84 Years | 14 | 14.0% |
| 85 Years and Over | 1 | 1.0% |
| Total | 100 | 100.0% |
Housing Finances in Garrison
Median Income by Occupancy in Garrison
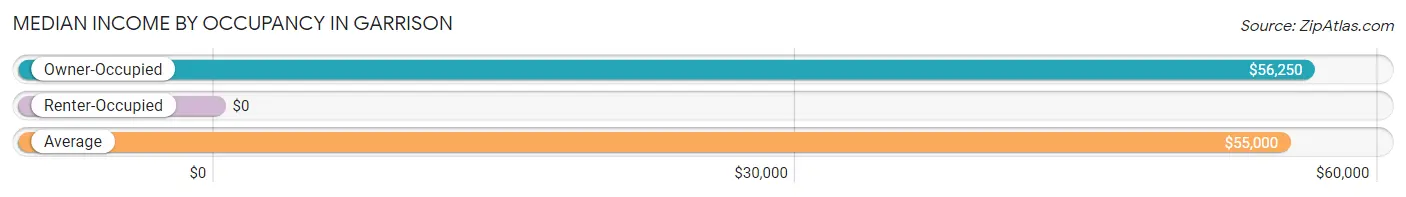
| Occupancy Type | # Households | Median Income |
| Owner-Occupied | 85 (85.0%) | $56,250 |
| Renter-Occupied | 15 (15.0%) | $0 |
| Average | 100 (100.0%) | $55,000 |
Occupancy by Householder Income Bracket in Garrison
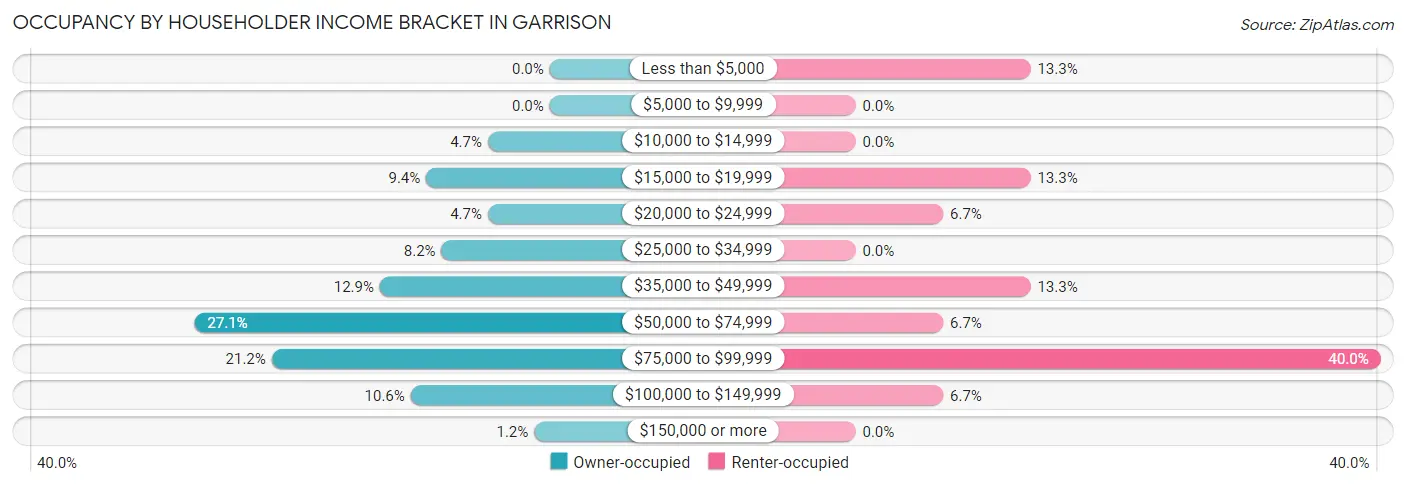
| Income Bracket | Owner-occupied | Renter-occupied |
| Less than $5,000 | 0 (0.0%) | 2 (13.3%) |
| $5,000 to $9,999 | 0 (0.0%) | 0 (0.0%) |
| $10,000 to $14,999 | 4 (4.7%) | 0 (0.0%) |
| $15,000 to $19,999 | 8 (9.4%) | 2 (13.3%) |
| $20,000 to $24,999 | 4 (4.7%) | 1 (6.7%) |
| $25,000 to $34,999 | 7 (8.2%) | 0 (0.0%) |
| $35,000 to $49,999 | 11 (12.9%) | 2 (13.3%) |
| $50,000 to $74,999 | 23 (27.1%) | 1 (6.7%) |
| $75,000 to $99,999 | 18 (21.2%) | 6 (40.0%) |
| $100,000 to $149,999 | 9 (10.6%) | 1 (6.7%) |
| $150,000 or more | 1 (1.2%) | 0 (0.0%) |
| Total | 85 (100.0%) | 15 (100.0%) |
Monthly Housing Cost Tiers in Garrison
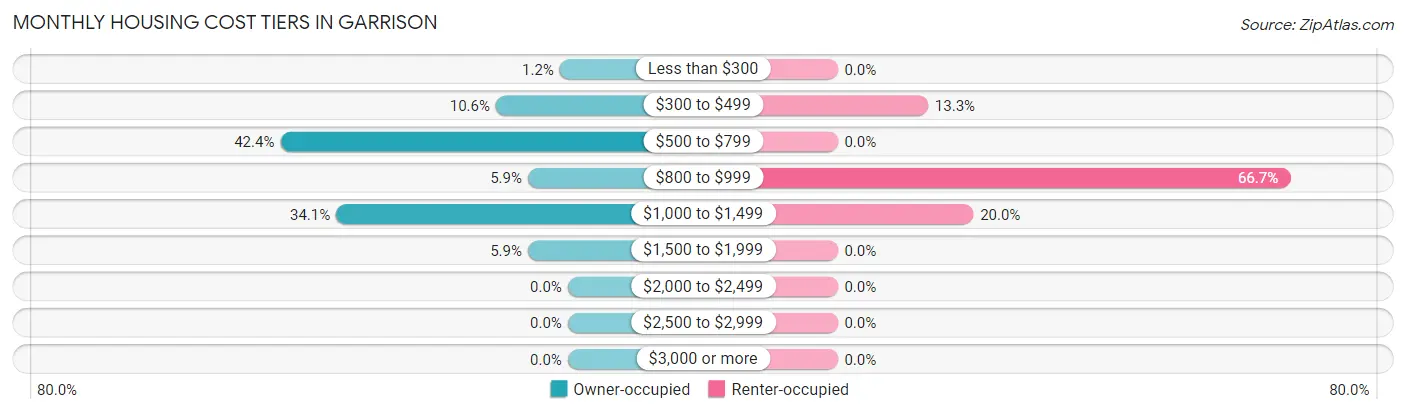
| Monthly Cost | Owner-occupied | Renter-occupied |
| Less than $300 | 1 (1.2%) | 0 (0.0%) |
| $300 to $499 | 9 (10.6%) | 2 (13.3%) |
| $500 to $799 | 36 (42.3%) | 0 (0.0%) |
| $800 to $999 | 5 (5.9%) | 10 (66.7%) |
| $1,000 to $1,499 | 29 (34.1%) | 3 (20.0%) |
| $1,500 to $1,999 | 5 (5.9%) | 0 (0.0%) |
| $2,000 to $2,499 | 0 (0.0%) | 0 (0.0%) |
| $2,500 to $2,999 | 0 (0.0%) | 0 (0.0%) |
| $3,000 or more | 0 (0.0%) | 0 (0.0%) |
| Total | 85 (100.0%) | 15 (100.0%) |
Physical Housing Characteristics in Garrison
Housing Structures in Garrison
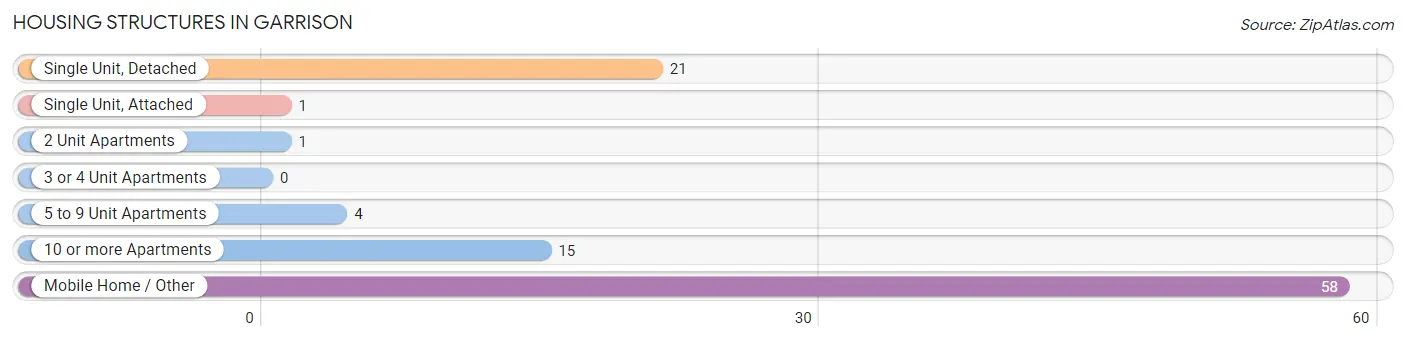
| Structure Type | # Housing Units | % Housing Units |
| Single Unit, Detached | 21 | 21.0% |
| Single Unit, Attached | 1 | 1.0% |
| 2 Unit Apartments | 1 | 1.0% |
| 3 or 4 Unit Apartments | 0 | 0.0% |
| 5 to 9 Unit Apartments | 4 | 4.0% |
| 10 or more Apartments | 15 | 15.0% |
| Mobile Home / Other | 58 | 58.0% |
| Total | 100 | 100.0% |
Housing Structures by Occupancy in Garrison
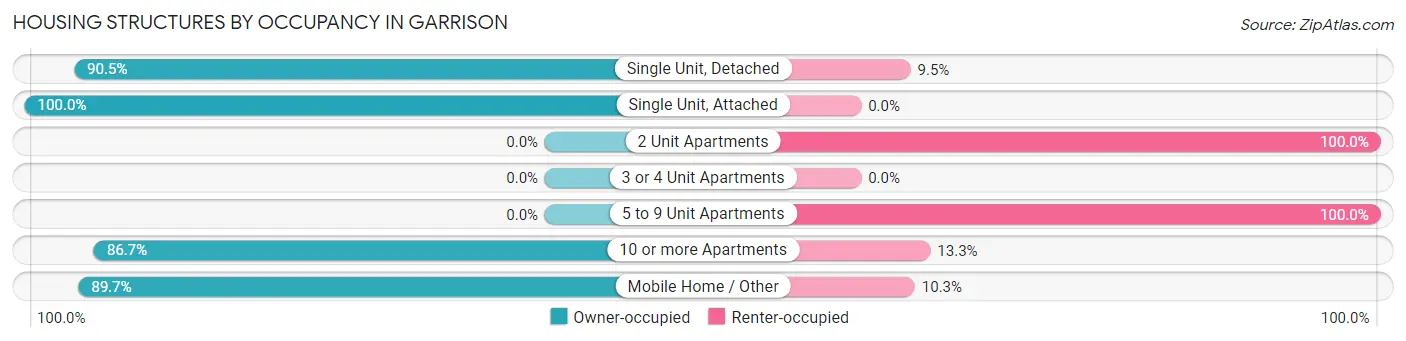
| Structure Type | Owner-occupied | Renter-occupied |
| Single Unit, Detached | 19 (90.5%) | 2 (9.5%) |
| Single Unit, Attached | 1 (100.0%) | 0 (0.0%) |
| 2 Unit Apartments | 0 (0.0%) | 1 (100.0%) |
| 3 or 4 Unit Apartments | 0 (0.0%) | 0 (0.0%) |
| 5 to 9 Unit Apartments | 0 (0.0%) | 4 (100.0%) |
| 10 or more Apartments | 13 (86.7%) | 2 (13.3%) |
| Mobile Home / Other | 52 (89.7%) | 6 (10.3%) |
| Total | 85 (85.0%) | 15 (15.0%) |
Housing Structures by Number of Rooms in Garrison
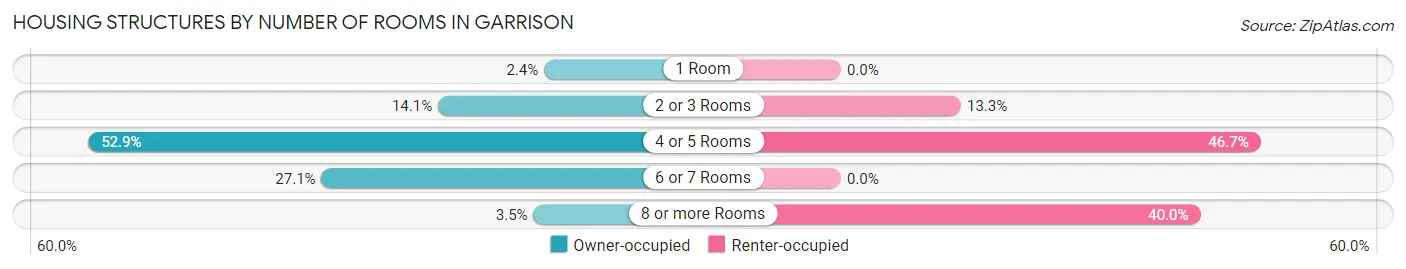
| Number of Rooms | Owner-occupied | Renter-occupied |
| 1 Room | 2 (2.4%) | 0 (0.0%) |
| 2 or 3 Rooms | 12 (14.1%) | 2 (13.3%) |
| 4 or 5 Rooms | 45 (52.9%) | 7 (46.7%) |
| 6 or 7 Rooms | 23 (27.1%) | 0 (0.0%) |
| 8 or more Rooms | 3 (3.5%) | 6 (40.0%) |
| Total | 85 (100.0%) | 15 (100.0%) |
Housing Structure by Heating Type in Garrison
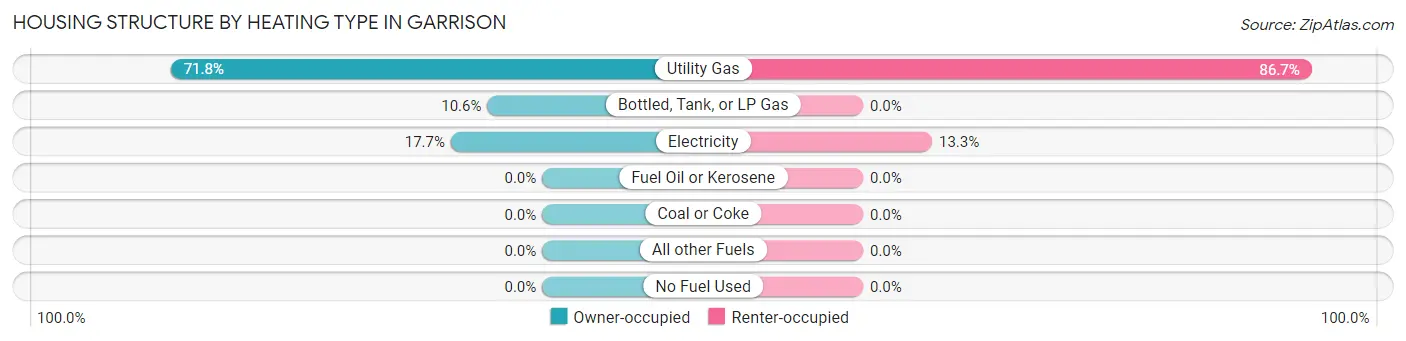
| Heating Type | Owner-occupied | Renter-occupied |
| Utility Gas | 61 (71.8%) | 13 (86.7%) |
| Bottled, Tank, or LP Gas | 9 (10.6%) | 0 (0.0%) |
| Electricity | 15 (17.6%) | 2 (13.3%) |
| Fuel Oil or Kerosene | 0 (0.0%) | 0 (0.0%) |
| Coal or Coke | 0 (0.0%) | 0 (0.0%) |
| All other Fuels | 0 (0.0%) | 0 (0.0%) |
| No Fuel Used | 0 (0.0%) | 0 (0.0%) |
| Total | 85 (100.0%) | 15 (100.0%) |
Household Vehicle Usage in Garrison
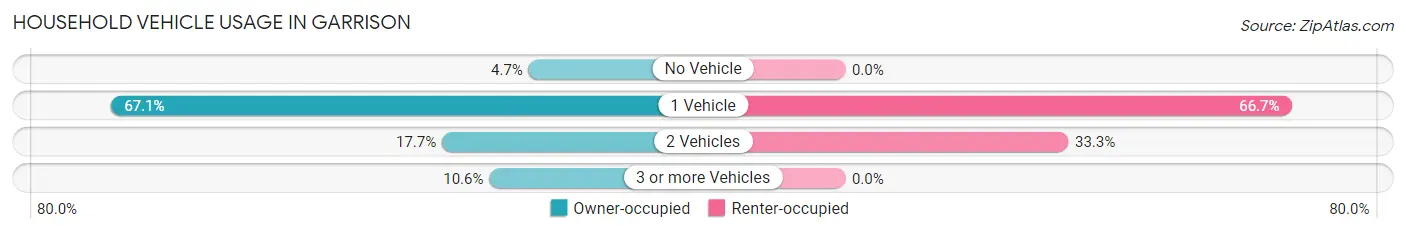
| Vehicles per Household | Owner-occupied | Renter-occupied |
| No Vehicle | 4 (4.7%) | 0 (0.0%) |
| 1 Vehicle | 57 (67.1%) | 10 (66.7%) |
| 2 Vehicles | 15 (17.6%) | 5 (33.3%) |
| 3 or more Vehicles | 9 (10.6%) | 0 (0.0%) |
| Total | 85 (100.0%) | 15 (100.0%) |
Real Estate & Mortgages in Garrison
Real Estate and Mortgage Overview in Garrison
| Characteristic | Without Mortgage | With Mortgage |
| Housing Units | 50 | 35 |
| Median Property Value | - | - |
| Median Household Income | $63,333 | $1 |
| Monthly Housing Costs | $563 | $0 |
| Real Estate Taxes | $199 | $1 |
Property Value by Mortgage Status in Garrison
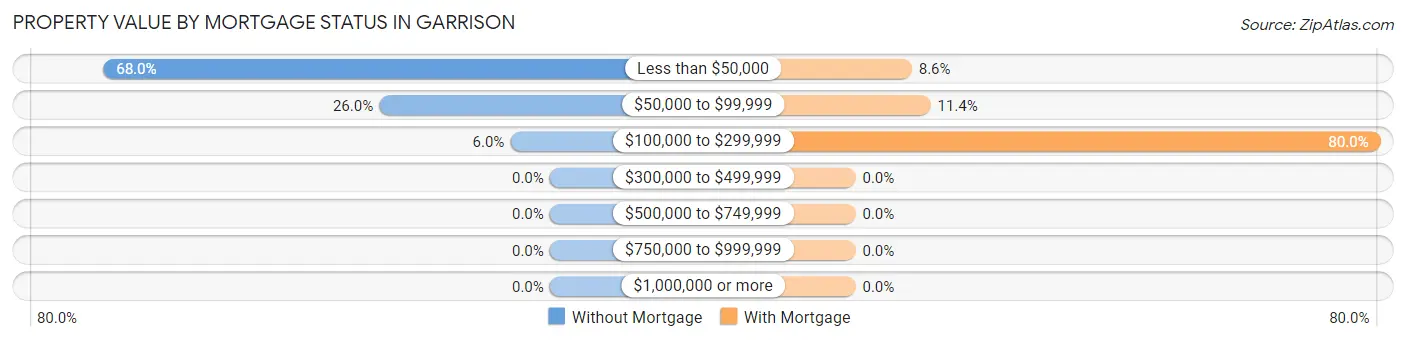
| Property Value | Without Mortgage | With Mortgage |
| Less than $50,000 | 34 (68.0%) | 3 (8.6%) |
| $50,000 to $99,999 | 13 (26.0%) | 4 (11.4%) |
| $100,000 to $299,999 | 3 (6.0%) | 28 (80.0%) |
| $300,000 to $499,999 | 0 (0.0%) | 0 (0.0%) |
| $500,000 to $749,999 | 0 (0.0%) | 0 (0.0%) |
| $750,000 to $999,999 | 0 (0.0%) | 0 (0.0%) |
| $1,000,000 or more | 0 (0.0%) | 0 (0.0%) |
| Total | 50 (100.0%) | 35 (100.0%) |
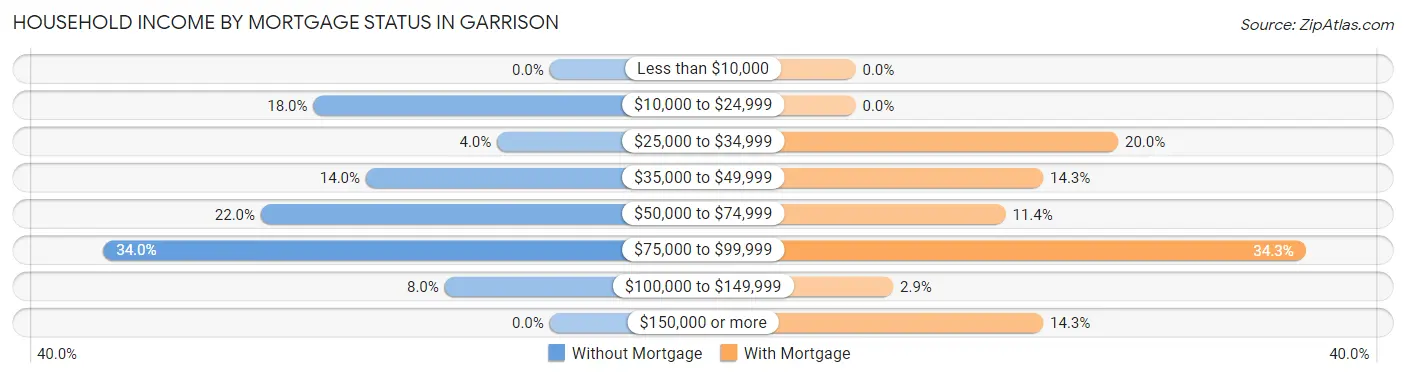
Household Income by Mortgage Status in Garrison
| Household Income | Without Mortgage | With Mortgage |
| Less than $10,000 | 0 (0.0%) | 0 (0.0%) |
| $10,000 to $24,999 | 9 (18.0%) | 0 (0.0%) |
| $25,000 to $34,999 | 2 (4.0%) | 7 (20.0%) |
| $35,000 to $49,999 | 7 (14.0%) | 5 (14.3%) |
| $50,000 to $74,999 | 11 (22.0%) | 4 (11.4%) |
| $75,000 to $99,999 | 17 (34.0%) | 12 (34.3%) |
| $100,000 to $149,999 | 4 (8.0%) | 1 (2.9%) |
| $150,000 or more | 0 (0.0%) | 5 (14.3%) |
| Total | 50 (100.0%) | 35 (100.0%) |
Property Value to Household Income Ratio in Garrison
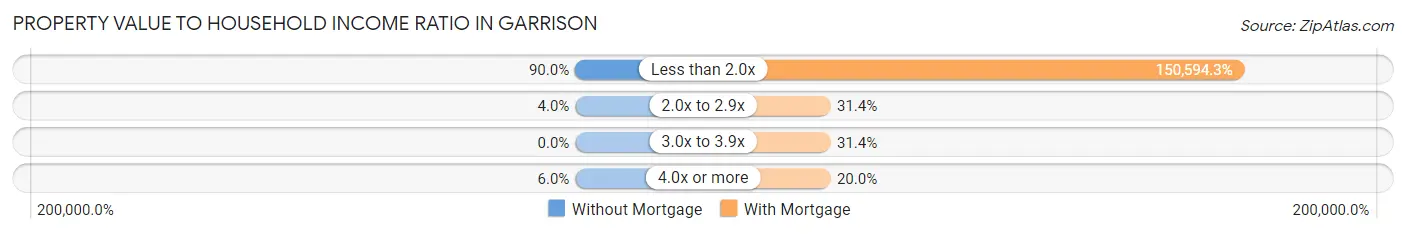
| Value-to-Income Ratio | Without Mortgage | With Mortgage |
| Less than 2.0x | 45 (90.0%) | 52,708 (150,594.3%) |
| 2.0x to 2.9x | 2 (4.0%) | 11 (31.4%) |
| 3.0x to 3.9x | 0 (0.0%) | 11 (31.4%) |
| 4.0x or more | 3 (6.0%) | 7 (20.0%) |
| Total | 50 (100.0%) | 35 (100.0%) |
Real Estate Taxes by Mortgage Status in Garrison
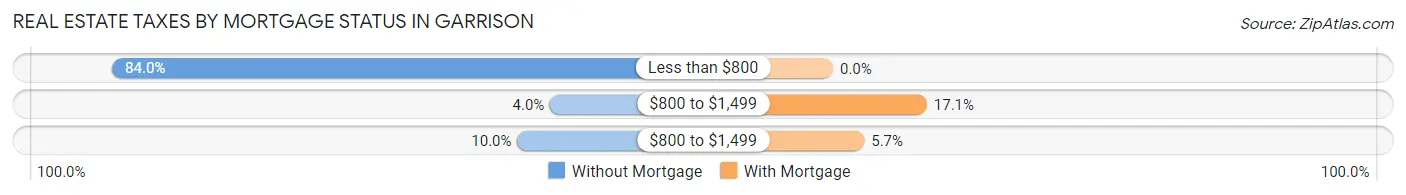
| Property Taxes | Without Mortgage | With Mortgage |
| Less than $800 | 42 (84.0%) | 0 (0.0%) |
| $800 to $1,499 | 2 (4.0%) | 6 (17.1%) |
| $800 to $1,499 | 5 (10.0%) | 2 (5.7%) |
| Total | 50 (100.0%) | 35 (100.0%) |
Health & Disability in Garrison
Health Insurance Coverage by Age in Garrison
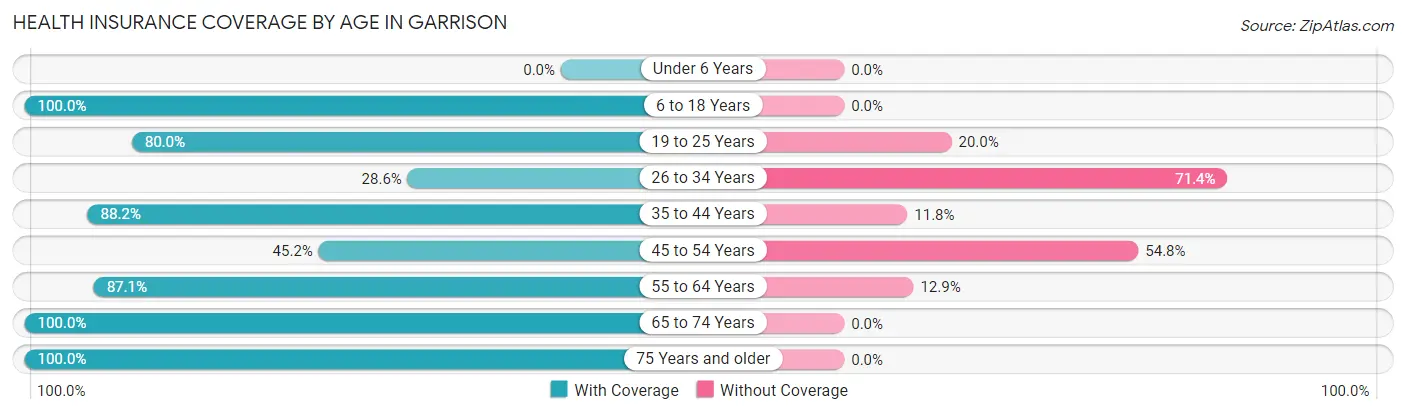
| Age Bracket | With Coverage | Without Coverage |
| Under 6 Years | 0 (0.0%) | 0 (0.0%) |
| 6 to 18 Years | 13 (100.0%) | 0 (0.0%) |
| 19 to 25 Years | 8 (80.0%) | 2 (20.0%) |
| 26 to 34 Years | 2 (28.6%) | 5 (71.4%) |
| 35 to 44 Years | 15 (88.2%) | 2 (11.8%) |
| 45 to 54 Years | 14 (45.2%) | 17 (54.8%) |
| 55 to 64 Years | 27 (87.1%) | 4 (12.9%) |
| 65 to 74 Years | 41 (100.0%) | 0 (0.0%) |
| 75 Years and older | 18 (100.0%) | 0 (0.0%) |
| Total | 138 (82.1%) | 30 (17.9%) |
Health Insurance Coverage by Citizenship Status in Garrison
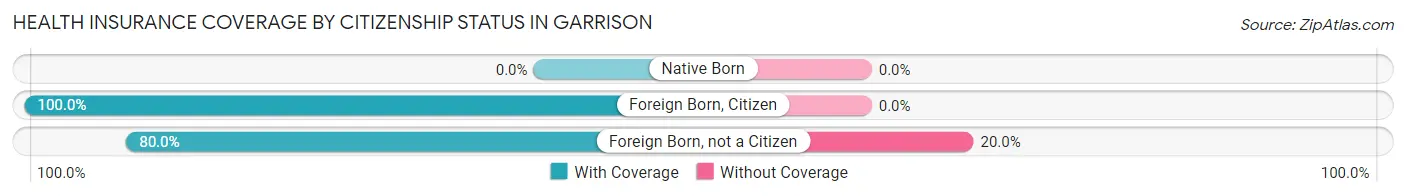
| Citizenship Status | With Coverage | Without Coverage |
| Native Born | 0 (0.0%) | 0 (0.0%) |
| Foreign Born, Citizen | 13 (100.0%) | 0 (0.0%) |
| Foreign Born, not a Citizen | 8 (80.0%) | 2 (20.0%) |
Health Insurance Coverage by Household Income in Garrison
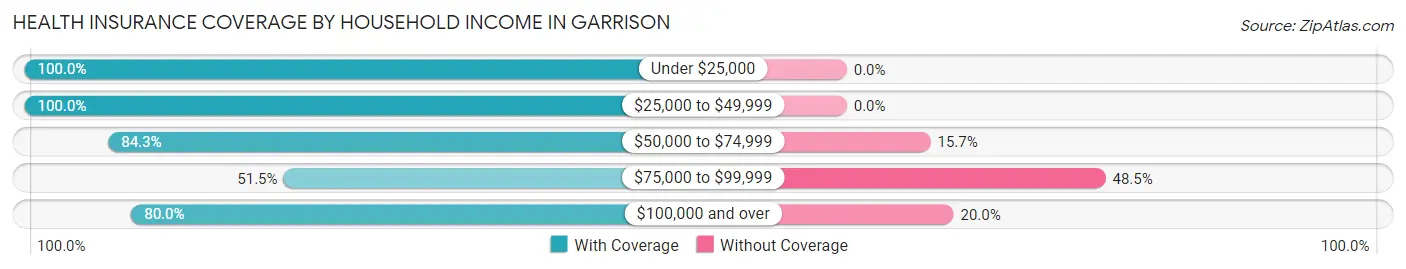
| Household Income | With Coverage | Without Coverage |
| Under $25,000 | 27 (100.0%) | 0 (0.0%) |
| $25,000 to $49,999 | 27 (100.0%) | 0 (0.0%) |
| $50,000 to $74,999 | 43 (84.3%) | 8 (15.7%) |
| $75,000 to $99,999 | 17 (51.5%) | 16 (48.5%) |
| $100,000 and over | 24 (80.0%) | 6 (20.0%) |
Public vs Private Health Insurance Coverage by Age in Garrison
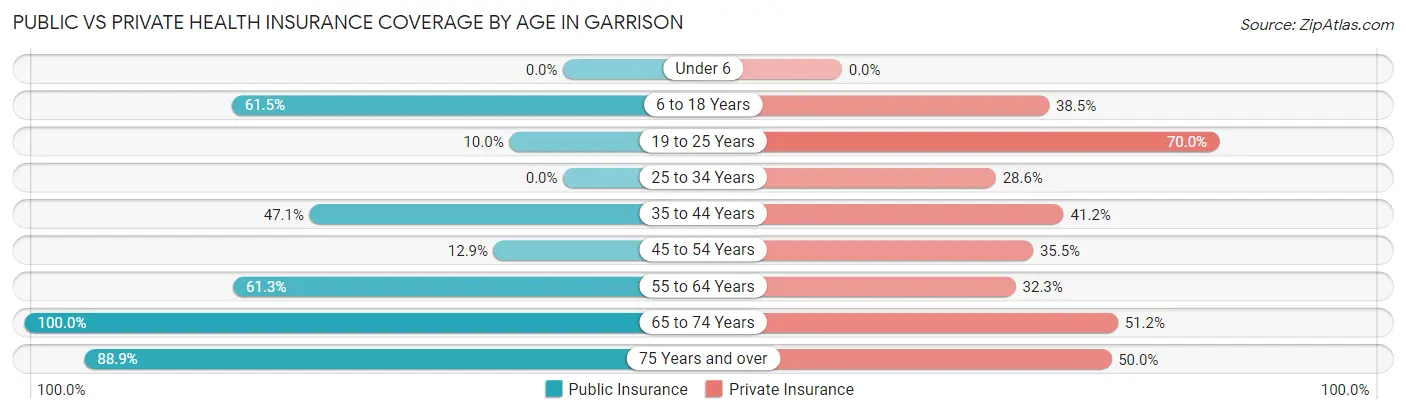
| Age Bracket | Public Insurance | Private Insurance |
| Under 6 | 0 (0.0%) | 0 (0.0%) |
| 6 to 18 Years | 8 (61.5%) | 5 (38.5%) |
| 19 to 25 Years | 1 (10.0%) | 7 (70.0%) |
| 25 to 34 Years | 0 (0.0%) | 2 (28.6%) |
| 35 to 44 Years | 8 (47.1%) | 7 (41.2%) |
| 45 to 54 Years | 4 (12.9%) | 11 (35.5%) |
| 55 to 64 Years | 19 (61.3%) | 10 (32.3%) |
| 65 to 74 Years | 41 (100.0%) | 21 (51.2%) |
| 75 Years and over | 16 (88.9%) | 9 (50.0%) |
| Total | 97 (57.7%) | 72 (42.9%) |
Disability Status by Sex by Age in Garrison
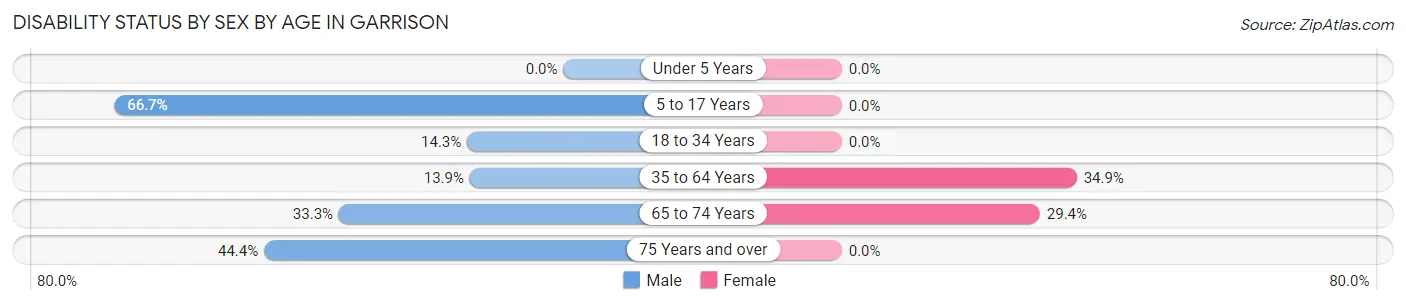
| Age Bracket | Male | Female |
| Under 5 Years | 0 (0.0%) | 0 (0.0%) |
| 5 to 17 Years | 4 (66.7%) | 0 (0.0%) |
| 18 to 34 Years | 1 (14.3%) | 0 (0.0%) |
| 35 to 64 Years | 5 (13.9%) | 15 (34.9%) |
| 65 to 74 Years | 8 (33.3%) | 5 (29.4%) |
| 75 Years and over | 4 (44.4%) | 0 (0.0%) |
Disability Class by Sex by Age in Garrison
Disability Class: Hearing Difficulty
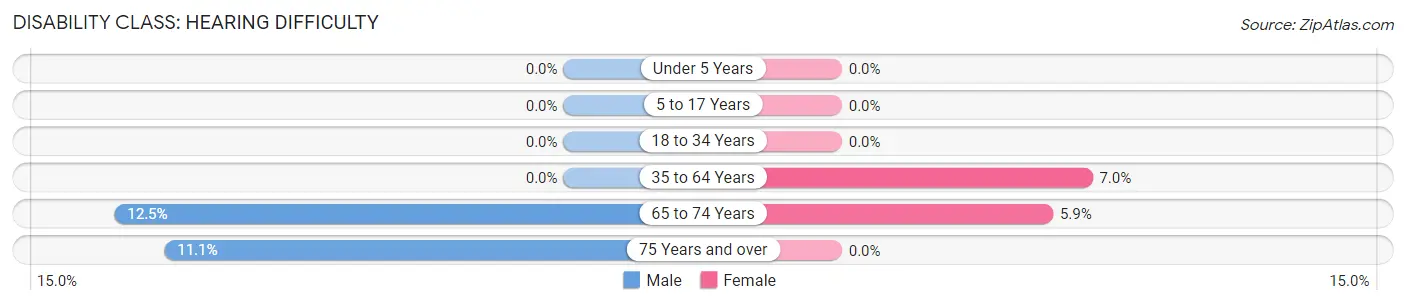
| Age Bracket | Male | Female |
| Under 5 Years | 0 (0.0%) | 0 (0.0%) |
| 5 to 17 Years | 0 (0.0%) | 0 (0.0%) |
| 18 to 34 Years | 0 (0.0%) | 0 (0.0%) |
| 35 to 64 Years | 0 (0.0%) | 3 (7.0%) |
| 65 to 74 Years | 3 (12.5%) | 1 (5.9%) |
| 75 Years and over | 1 (11.1%) | 0 (0.0%) |
Disability Class: Vision Difficulty
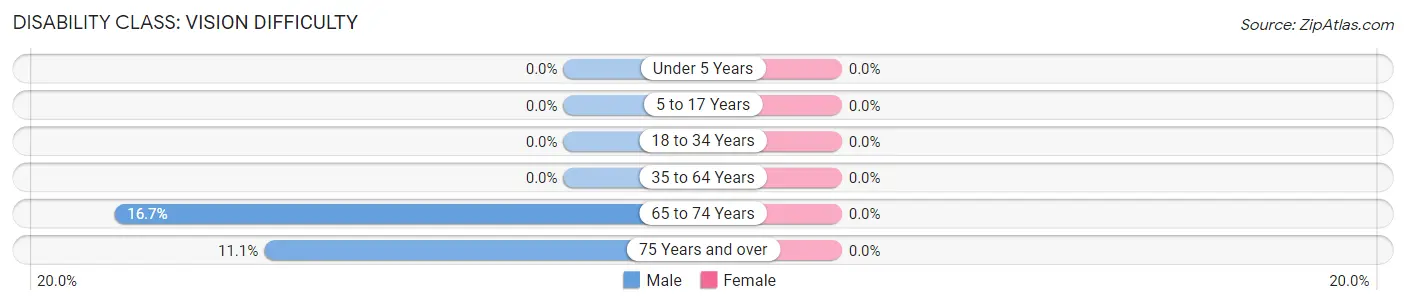
| Age Bracket | Male | Female |
| Under 5 Years | 0 (0.0%) | 0 (0.0%) |
| 5 to 17 Years | 0 (0.0%) | 0 (0.0%) |
| 18 to 34 Years | 0 (0.0%) | 0 (0.0%) |
| 35 to 64 Years | 0 (0.0%) | 0 (0.0%) |
| 65 to 74 Years | 4 (16.7%) | 0 (0.0%) |
| 75 Years and over | 1 (11.1%) | 0 (0.0%) |
Disability Class: Cognitive Difficulty
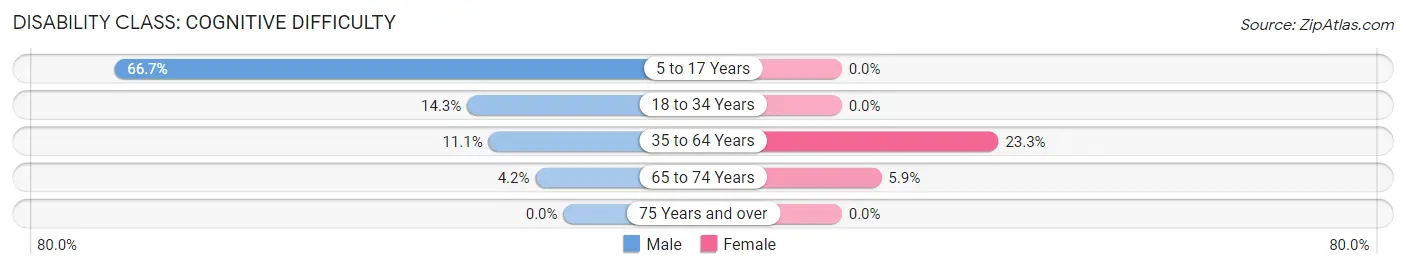
| Age Bracket | Male | Female |
| 5 to 17 Years | 4 (66.7%) | 0 (0.0%) |
| 18 to 34 Years | 1 (14.3%) | 0 (0.0%) |
| 35 to 64 Years | 4 (11.1%) | 10 (23.3%) |
| 65 to 74 Years | 1 (4.2%) | 1 (5.9%) |
| 75 Years and over | 0 (0.0%) | 0 (0.0%) |
Disability Class: Ambulatory Difficulty
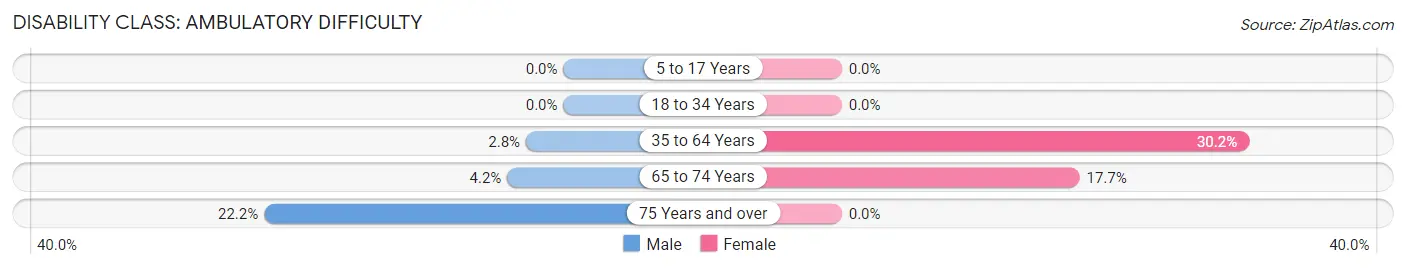
| Age Bracket | Male | Female |
| 5 to 17 Years | 0 (0.0%) | 0 (0.0%) |
| 18 to 34 Years | 0 (0.0%) | 0 (0.0%) |
| 35 to 64 Years | 1 (2.8%) | 13 (30.2%) |
| 65 to 74 Years | 1 (4.2%) | 3 (17.6%) |
| 75 Years and over | 2 (22.2%) | 0 (0.0%) |
Disability Class: Self-Care Difficulty
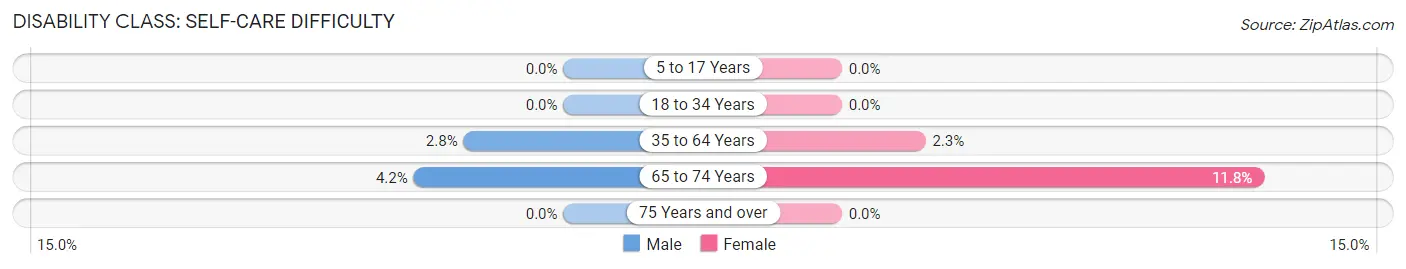
| Age Bracket | Male | Female |
| 5 to 17 Years | 0 (0.0%) | 0 (0.0%) |
| 18 to 34 Years | 0 (0.0%) | 0 (0.0%) |
| 35 to 64 Years | 1 (2.8%) | 1 (2.3%) |
| 65 to 74 Years | 1 (4.2%) | 2 (11.8%) |
| 75 Years and over | 0 (0.0%) | 0 (0.0%) |
Technology Access in Garrison
Computing Device Access in Garrison
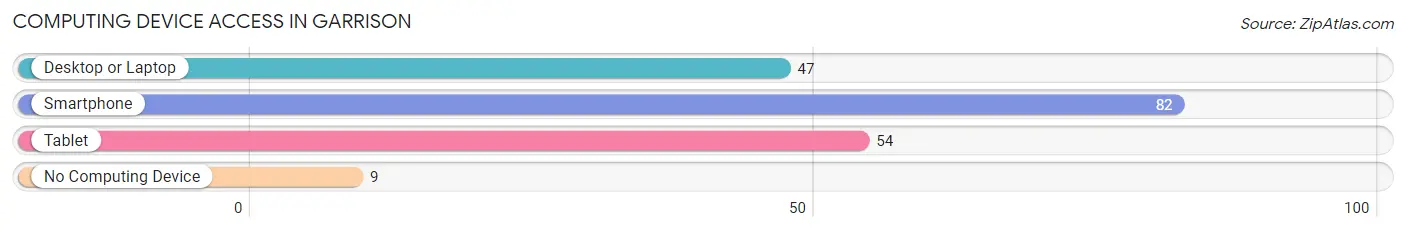
| Device Type | # Households | % Households |
| Desktop or Laptop | 47 | 47.0% |
| Smartphone | 82 | 82.0% |
| Tablet | 54 | 54.0% |
| No Computing Device | 9 | 9.0% |
| Total | 100 | 100.0% |
Internet Access in Garrison
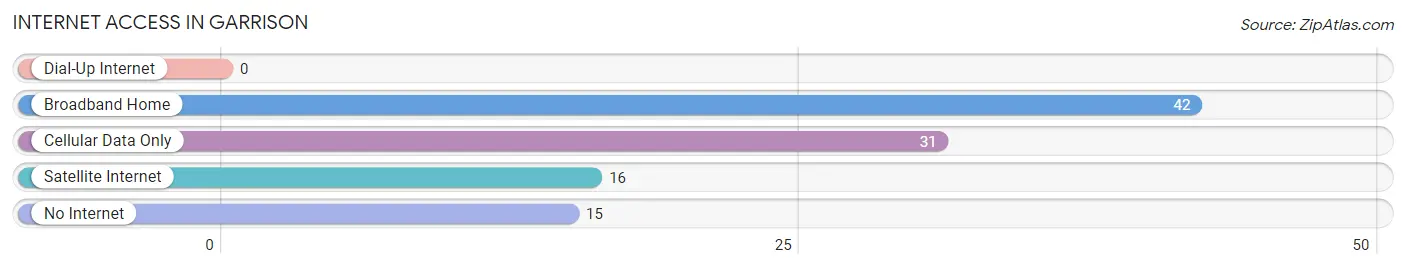
| Internet Type | # Households | % Households |
| Dial-Up Internet | 0 | 0.0% |
| Broadband Home | 42 | 42.0% |
| Cellular Data Only | 31 | 31.0% |
| Satellite Internet | 16 | 16.0% |
| No Internet | 15 | 15.0% |
| Total | 100 | 100.0% |
Garrison Summary
Garrison, Minnesota is a small city located in Crow Wing County, in the north-central part of the state. It is situated on the south shore of Mille Lacs Lake, one of the largest lakes in Minnesota. The city has a population of approximately 1,400 people and is part of the Brainerd Micropolitan Statistical Area.
History
Garrison was founded in 1881 by a group of settlers from Wisconsin. The city was named after a Civil War veteran, Colonel William Garrison. The first settlers were mostly farmers and loggers, and the city quickly grew as a trading center for the surrounding area. In 1883, the first post office was established, and the city was incorporated in 1887.
In the early 1900s, Garrison became a popular tourist destination, with many people coming to the area to fish and hunt. The city was also home to several resorts, including the Grand View Resort, which was built in 1906.
In the 1950s, Garrison began to experience a decline in population as people moved away from rural areas to larger cities. However, the city has seen a resurgence in recent years, with many people moving to the area to take advantage of the city’s natural beauty and recreational opportunities.
Geography
Garrison is located in the north-central part of Minnesota, in Crow Wing County. The city is situated on the south shore of Mille Lacs Lake, one of the largest lakes in the state. The city is surrounded by forests and lakes, and is home to several parks and recreational areas.
The city has a total area of 1.3 square miles, all of which is land. The city is located at an elevation of 1,072 feet above sea level.
Economy
Garrison’s economy is largely based on tourism and recreation. The city is home to several resorts, including the Grand View Resort, which was built in 1906. The city is also home to several marinas, which offer boat rentals and other services.
In addition, the city is home to several businesses, including restaurants, retail stores, and other services. The city is also home to several manufacturing companies, including a paper mill and a wood products company.
Demographics
As of the 2010 census, the population of Garrison was 1,400 people. The racial makeup of the city was 97.3% White, 0.6% African American, 0.3% Native American, 0.3% Asian, 0.1% Pacific Islander, 0.3% from other races, and 1.3% from two or more races. Hispanic or Latino of any race were 1.3% of the population.
The median household income in Garrison was $41,250, and the median family income was $48,750. The per capita income for the city was $20,945. About 8.3% of families and 11.3% of the population were below the poverty line, including 16.7% of those under age 18 and 8.3% of those age 65 or over.
Common Questions
What is Per Capita Income in Garrison?
Per Capita income in Garrison is $36,877.
What is the Median Family Income in Garrison?
Median Family Income in Garrison is $54,583.
What is the Median Household income in Garrison?
Median Household Income in Garrison is $55,000.
What is Income or Wage Gap in Garrison?
Income or Wage Gap in Garrison is 55.4%.
Women in Garrison earn 44.6 cents for every dollar earned by a man.
What is Inequality or Gini Index in Garrison?
Inequality or Gini Index in Garrison is 0.33.
What is the Total Population of Garrison?
Total Population of Garrison is 168.
What is the Total Male Population of Garrison?
Total Male Population of Garrison is 82.
What is the Total Female Population of Garrison?
Total Female Population of Garrison is 86.
What is the Ratio of Males per 100 Females in Garrison?
There are 95.35 Males per 100 Females in Garrison.
What is the Ratio of Females per 100 Males in Garrison?
There are 104.88 Females per 100 Males in Garrison.
What is the Median Population Age in Garrison?
Median Population Age in Garrison is 57.0 Years.
What is the Average Family Size in Garrison
Average Family Size in Garrison is 2.4 People.
What is the Average Household Size in Garrison
Average Household Size in Garrison is 1.7 People.
How Large is the Labor Force in Garrison?
There are 84 People in the Labor Forcein in Garrison.
What is the Percentage of People in the Labor Force in Garrison?
53.5% of People are in the Labor Force in Garrison.