Frontenac, MN Map & Demographics
Frontenac Map
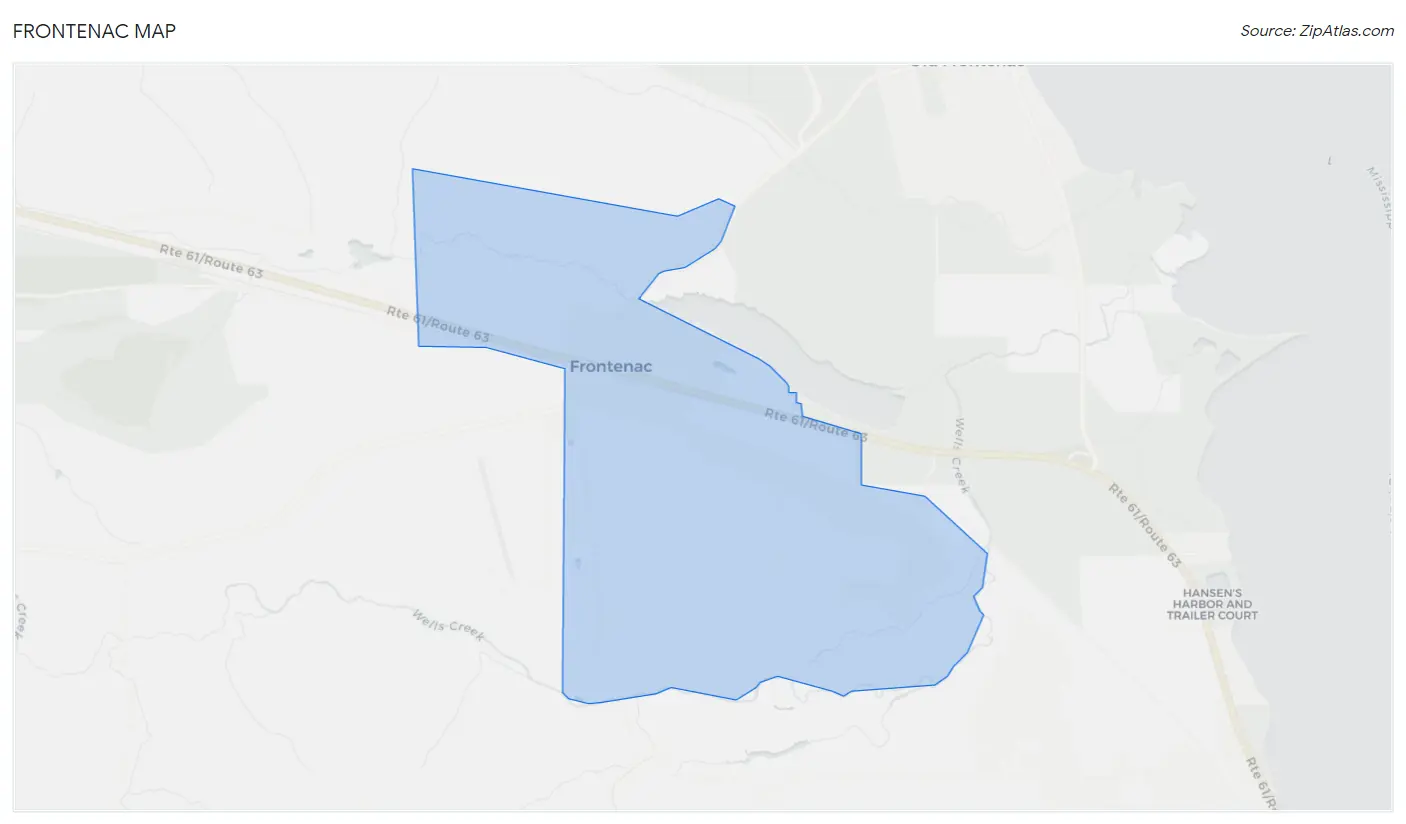
Frontenac Overview
$45,964
PER CAPITA INCOME
$124,688
AVG FAMILY INCOME
$107,917
AVG HOUSEHOLD INCOME
0.37
INEQUALITY / GINI INDEX
214
TOTAL POPULATION
122
MALE POPULATION
92
FEMALE POPULATION
132.61
MALES / 100 FEMALES
75.41
FEMALES / 100 MALES
47.5
MEDIAN AGE
3.5
AVG FAMILY SIZE
2.9
AVG HOUSEHOLD SIZE
142
LABOR FORCE [ PEOPLE ]
76.3%
PERCENT IN LABOR FORCE
Frontenac Zip Codes
Frontenac Area Codes
Income in Frontenac
Income Overview in Frontenac
Per Capita Income in Frontenac is $45,964, while median incomes of families and households are $124,688 and $107,917 respectively.
| Characteristic | Number | Measure |
| Per Capita Income | 214 | $45,964 |
| Median Family Income | 53 | $124,688 |
| Mean Family Income | 53 | $147,609 |
| Median Household Income | 75 | $107,917 |
| Mean Household Income | 75 | $119,491 |
| Income Deficit | 53 | $0 |
| Wage / Income Gap (%) | 214 | 0.00% |
| Wage / Income Gap ($) | 214 | 100.00¢ per $1 |
| Gini / Inequality Index | 214 | 0.37 |
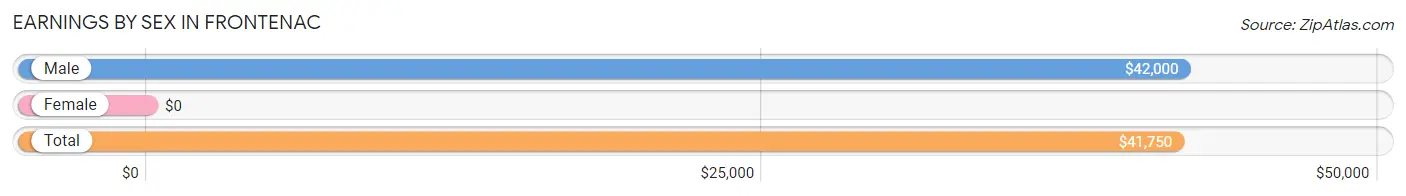
Earnings by Sex in Frontenac
| Sex | Number | Average Earnings |
| Male | 90 (60.4%) | $42,000 |
| Female | 59 (39.6%) | $0 |
| Total | 149 (100.0%) | $41,750 |
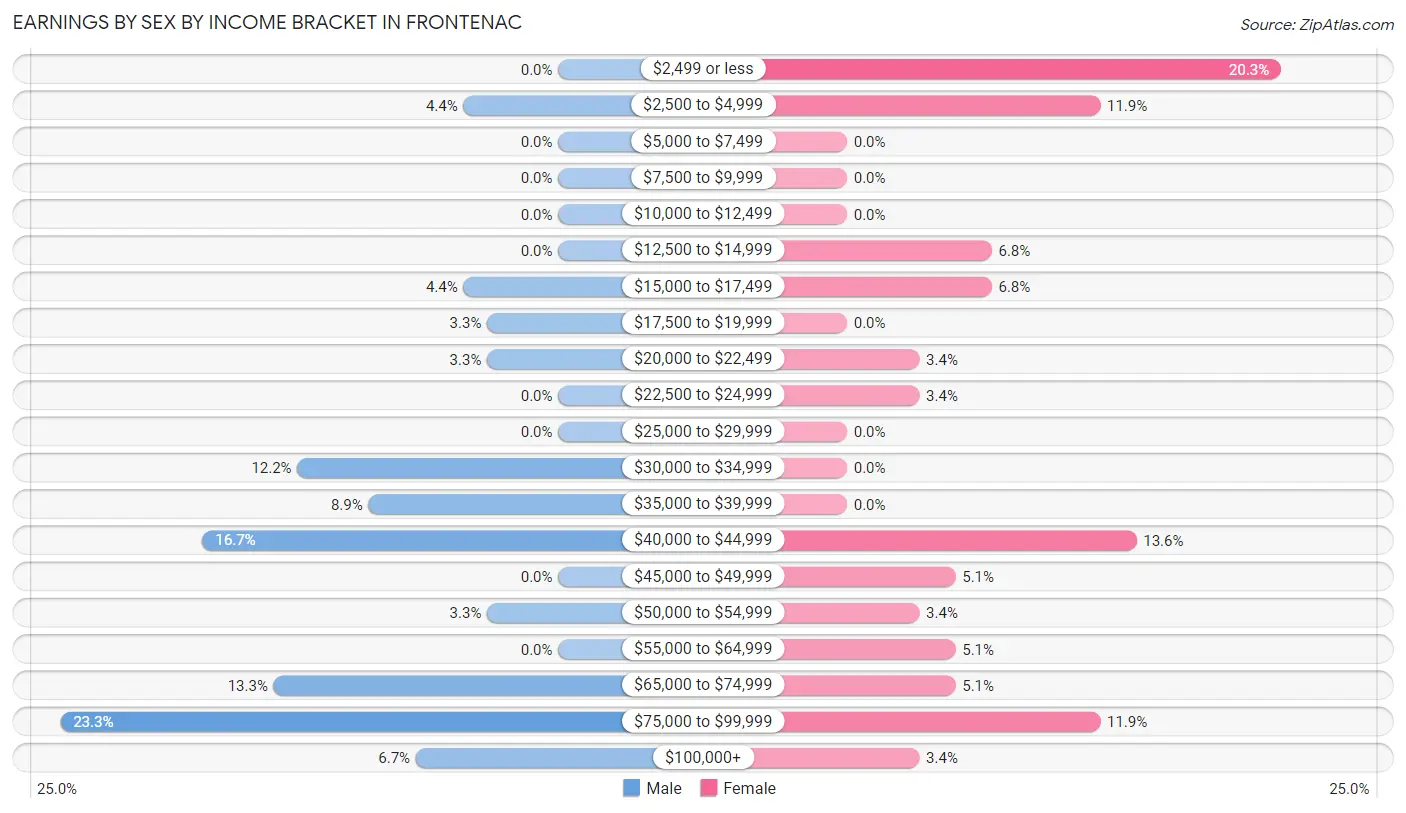
Earnings by Sex by Income Bracket in Frontenac
The most common earnings brackets in Frontenac are $75,000 to $99,999 for men (21 | 23.3%) and $2,499 or less for women (12 | 20.3%).
| Income | Male | Female |
| $2,499 or less | 0 (0.0%) | 12 (20.3%) |
| $2,500 to $4,999 | 4 (4.4%) | 7 (11.9%) |
| $5,000 to $7,499 | 0 (0.0%) | 0 (0.0%) |
| $7,500 to $9,999 | 0 (0.0%) | 0 (0.0%) |
| $10,000 to $12,499 | 0 (0.0%) | 0 (0.0%) |
| $12,500 to $14,999 | 0 (0.0%) | 4 (6.8%) |
| $15,000 to $17,499 | 4 (4.4%) | 4 (6.8%) |
| $17,500 to $19,999 | 3 (3.3%) | 0 (0.0%) |
| $20,000 to $22,499 | 3 (3.3%) | 2 (3.4%) |
| $22,500 to $24,999 | 0 (0.0%) | 2 (3.4%) |
| $25,000 to $29,999 | 0 (0.0%) | 0 (0.0%) |
| $30,000 to $34,999 | 11 (12.2%) | 0 (0.0%) |
| $35,000 to $39,999 | 8 (8.9%) | 0 (0.0%) |
| $40,000 to $44,999 | 15 (16.7%) | 8 (13.6%) |
| $45,000 to $49,999 | 0 (0.0%) | 3 (5.1%) |
| $50,000 to $54,999 | 3 (3.3%) | 2 (3.4%) |
| $55,000 to $64,999 | 0 (0.0%) | 3 (5.1%) |
| $65,000 to $74,999 | 12 (13.3%) | 3 (5.1%) |
| $75,000 to $99,999 | 21 (23.3%) | 7 (11.9%) |
| $100,000+ | 6 (6.7%) | 2 (3.4%) |
| Total | 90 (100.0%) | 59 (100.0%) |
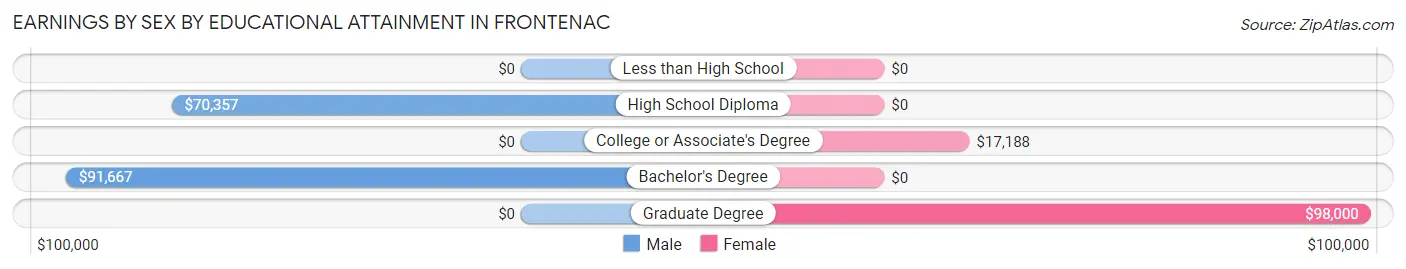
Earnings by Sex by Educational Attainment in Frontenac
Average earnings in Frontenac are $71,528 for men and $44,219 for women, a difference of 38.2%. Men with an educational attainment of bachelor's degree enjoy the highest average annual earnings of $91,667, while those with high school diploma education earn the least with $70,357. Women with an educational attainment of graduate degree earn the most with the average annual earnings of $98,000, while those with college or associate's degree education have the smallest earnings of $17,188.
| Educational Attainment | Male Income | Female Income |
| Less than High School | - | - |
| High School Diploma | $70,357 | $0 |
| College or Associate's Degree | - | - |
| Bachelor's Degree | $91,667 | $0 |
| Graduate Degree | - | - |
| Total | $71,528 | $44,219 |
Family Income in Frontenac
Family Income Brackets in Frontenac
According to the Frontenac family income data, there are 17 families falling into the $150,000 to $199,999 income range, which is the most common income bracket and makes up 32.1% of all families.
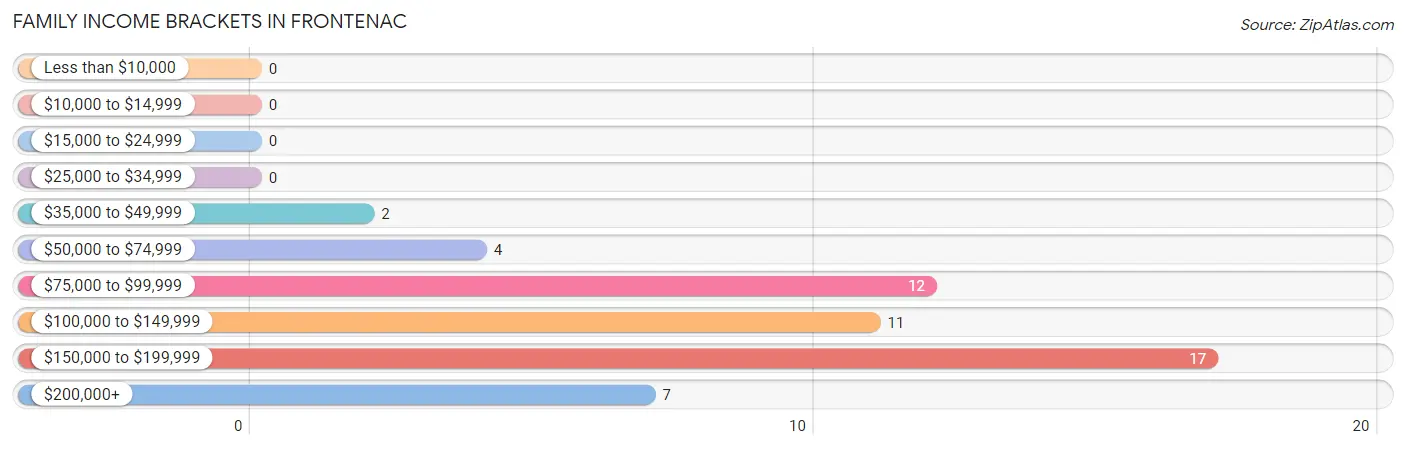
| Income Bracket | # Families | % Families |
| Less than $10,000 | 0 | 0.0% |
| $10,000 to $14,999 | 0 | 0.0% |
| $15,000 to $24,999 | 0 | 0.0% |
| $25,000 to $34,999 | 0 | 0.0% |
| $35,000 to $49,999 | 2 | 3.8% |
| $50,000 to $74,999 | 4 | 7.5% |
| $75,000 to $99,999 | 12 | 22.6% |
| $100,000 to $149,999 | 11 | 20.8% |
| $150,000 to $199,999 | 17 | 32.1% |
| $200,000+ | 7 | 13.2% |
Family Income by Famaliy Size in Frontenac
4-person families (7 | 13.2%) account for the highest median family income in Frontenac with $250,001 per family, while 4-person families (7 | 13.2%) have the highest median income of $62,500 per family member.
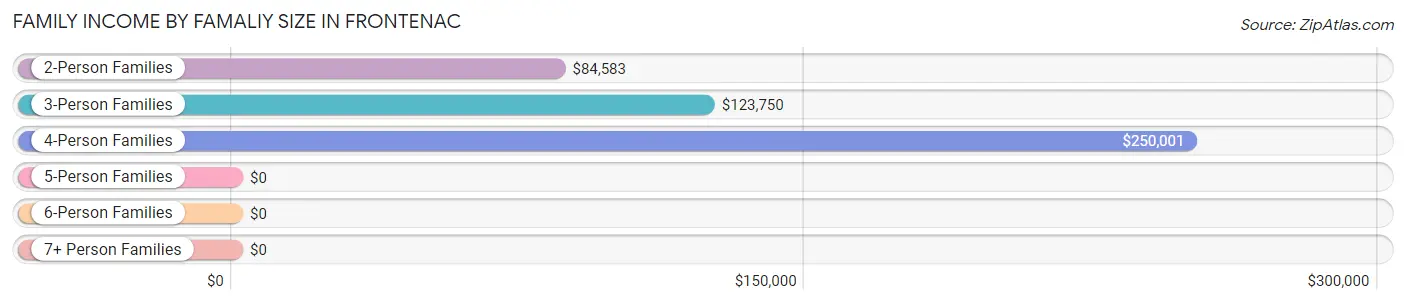
| Income Bracket | # Families | Median Income |
| 2-Person Families | 17 (32.1%) | $84,583 |
| 3-Person Families | 22 (41.5%) | $123,750 |
| 4-Person Families | 7 (13.2%) | $250,001 |
| 5-Person Families | 7 (13.2%) | $0 |
| 6-Person Families | 0 (0.0%) | $0 |
| 7+ Person Families | 0 (0.0%) | $0 |
| Total | 53 (100.0%) | $124,688 |
Family Income by Number of Earners in Frontenac
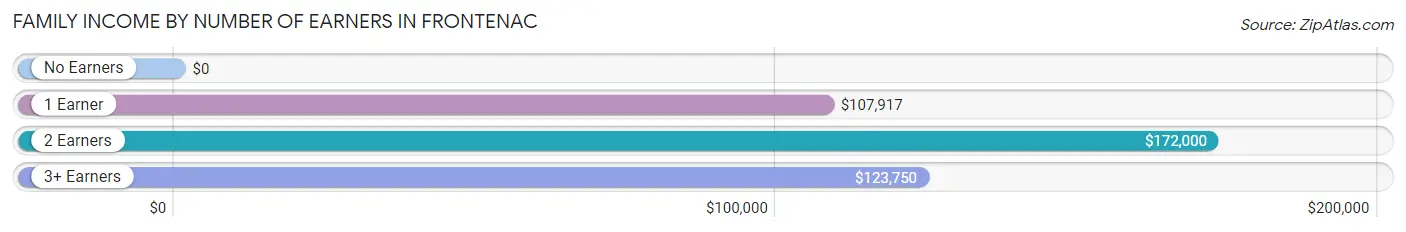
| Number of Earners | # Families | Median Income |
| No Earners | 4 (7.5%) | $0 |
| 1 Earner | 11 (20.7%) | $107,917 |
| 2 Earners | 16 (30.2%) | $172,000 |
| 3+ Earners | 22 (41.5%) | $123,750 |
| Total | 53 (100.0%) | $124,688 |
Household Income in Frontenac
Household Income Brackets in Frontenac
With 17 households falling in the category, the $150,000 to $199,999 income range is the most frequent in Frontenac, accounting for 22.7% of all households.
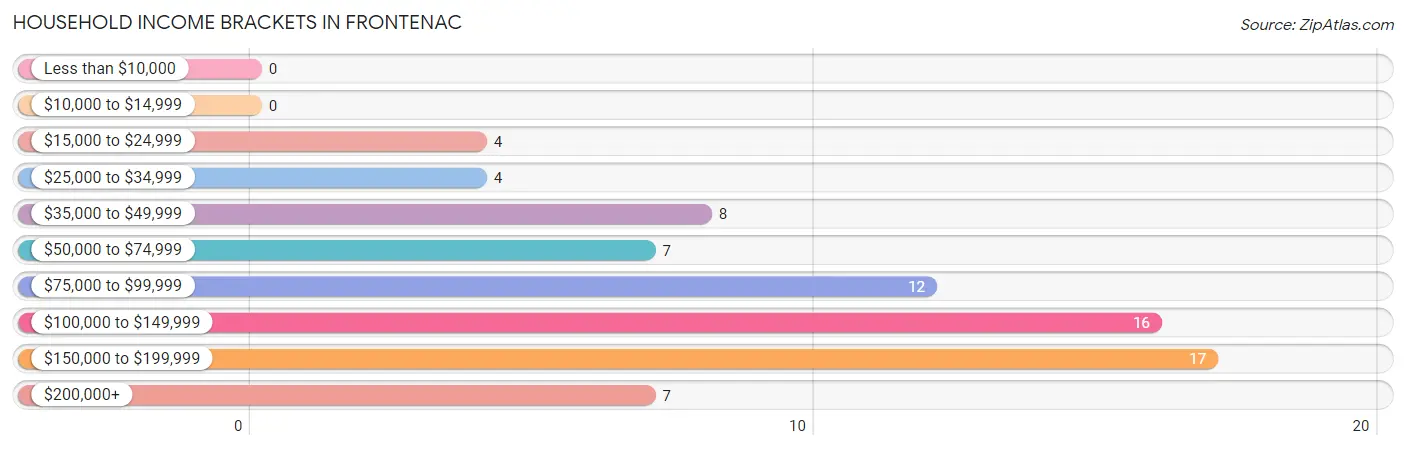
| Income Bracket | # Households | % Households |
| Less than $10,000 | 0 | 0.0% |
| $10,000 to $14,999 | 0 | 0.0% |
| $15,000 to $24,999 | 4 | 5.3% |
| $25,000 to $34,999 | 4 | 5.3% |
| $35,000 to $49,999 | 8 | 10.7% |
| $50,000 to $74,999 | 7 | 9.3% |
| $75,000 to $99,999 | 12 | 16.0% |
| $100,000 to $149,999 | 16 | 21.3% |
| $150,000 to $199,999 | 17 | 22.7% |
| $200,000+ | 7 | 9.3% |
Household Income by Householder Age in Frontenac
The median household income in Frontenac is $107,917, with the highest median household income of $171,250 found in the 25 to 44 years age bracket for the primary householder. A total of 15 households (20.0%) fall into this category.
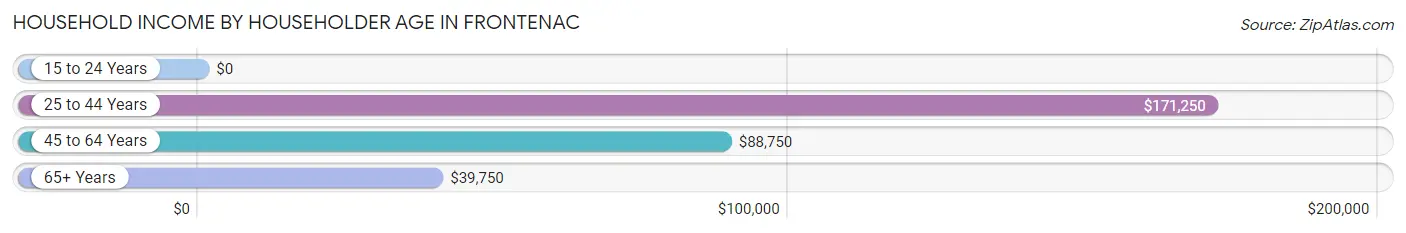
| Income Bracket | # Households | Median Income |
| 15 to 24 Years | 0 (0.0%) | $0 |
| 25 to 44 Years | 15 (20.0%) | $171,250 |
| 45 to 64 Years | 43 (57.3%) | $88,750 |
| 65+ Years | 17 (22.7%) | $39,750 |
| Total | 75 (100.0%) | $107,917 |
Poverty in Frontenac
Income Below Poverty by Sex and Age in Frontenac
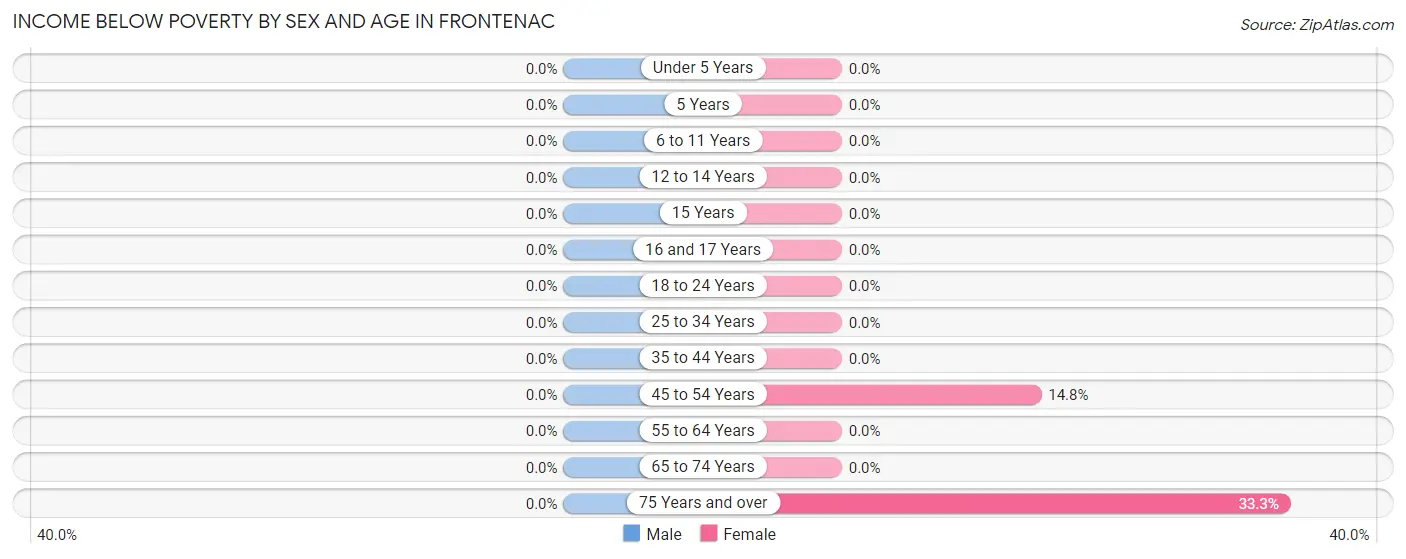
| Age Bracket | Male | Female |
| Under 5 Years | 0 (0.0%) | 0 (0.0%) |
| 5 Years | 0 (0.0%) | 0 (0.0%) |
| 6 to 11 Years | 0 (0.0%) | 0 (0.0%) |
| 12 to 14 Years | 0 (0.0%) | 0 (0.0%) |
| 15 Years | 0 (0.0%) | 0 (0.0%) |
| 16 and 17 Years | 0 (0.0%) | 0 (0.0%) |
| 18 to 24 Years | 0 (0.0%) | 0 (0.0%) |
| 25 to 34 Years | 0 (0.0%) | 0 (0.0%) |
| 35 to 44 Years | 0 (0.0%) | 0 (0.0%) |
| 45 to 54 Years | 0 (0.0%) | 4 (14.8%) |
| 55 to 64 Years | 0 (0.0%) | 0 (0.0%) |
| 65 to 74 Years | 0 (0.0%) | 0 (0.0%) |
| 75 Years and over | 0 (0.0%) | 1 (33.3%) |
| Total | 0 (0.0%) | 5 (5.4%) |
Income Above Poverty by Sex and Age in Frontenac
According to the poverty statistics in Frontenac, males aged under 5 years and females aged under 5 years are the age groups that are most secure financially, with 100.0% of males and 100.0% of females in these age groups living above the poverty line.
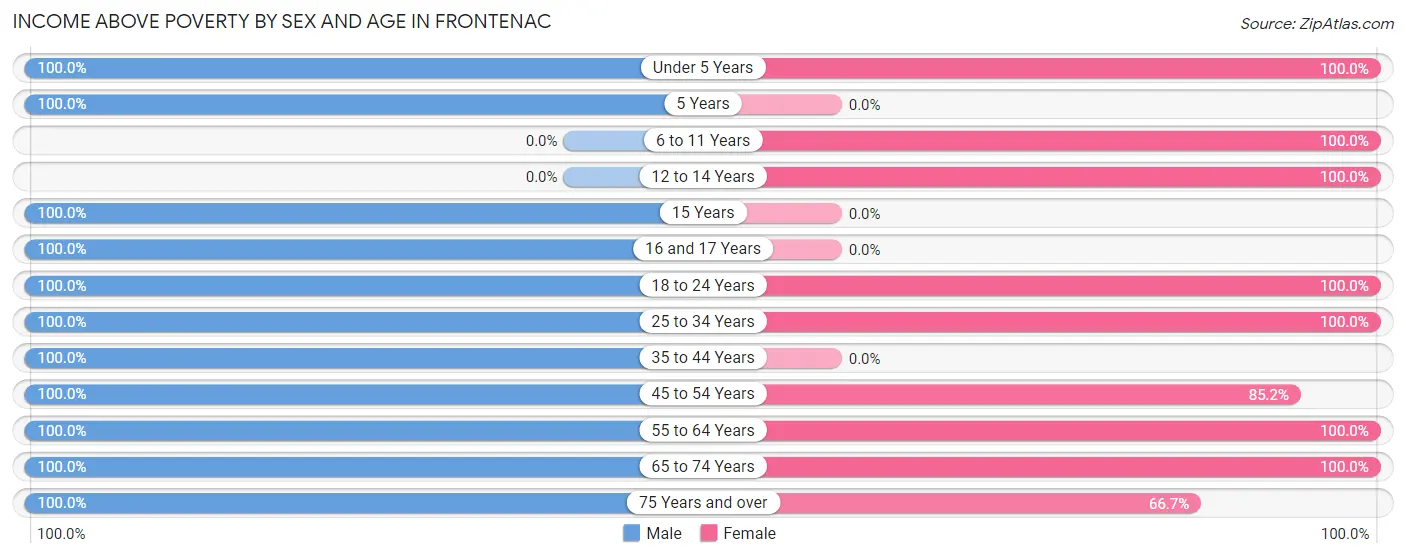
| Age Bracket | Male | Female |
| Under 5 Years | 5 (100.0%) | 7 (100.0%) |
| 5 Years | 2 (100.0%) | 0 (0.0%) |
| 6 to 11 Years | 0 (0.0%) | 9 (100.0%) |
| 12 to 14 Years | 0 (0.0%) | 2 (100.0%) |
| 15 Years | 3 (100.0%) | 0 (0.0%) |
| 16 and 17 Years | 4 (100.0%) | 0 (0.0%) |
| 18 to 24 Years | 21 (100.0%) | 14 (100.0%) |
| 25 to 34 Years | 20 (100.0%) | 13 (100.0%) |
| 35 to 44 Years | 5 (100.0%) | 0 (0.0%) |
| 45 to 54 Years | 22 (100.0%) | 23 (85.2%) |
| 55 to 64 Years | 20 (100.0%) | 15 (100.0%) |
| 65 to 74 Years | 11 (100.0%) | 2 (100.0%) |
| 75 Years and over | 9 (100.0%) | 2 (66.7%) |
| Total | 122 (100.0%) | 87 (94.6%) |
Income Below Poverty Among Married-Couple Families in Frontenac
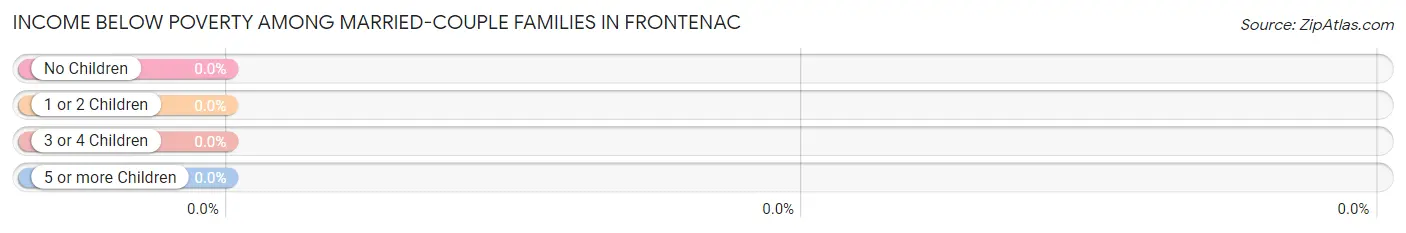
| Children | Above Poverty | Below Poverty |
| No Children | 38 (100.0%) | 0 (0.0%) |
| 1 or 2 Children | 5 (100.0%) | 0 (0.0%) |
| 3 or 4 Children | 7 (100.0%) | 0 (0.0%) |
| 5 or more Children | 0 (0.0%) | 0 (0.0%) |
| Total | 50 (100.0%) | 0 (0.0%) |
Income Below Poverty Among Single-Parent Households in Frontenac
| Children | Single Father | Single Mother |
| No Children | 0 (0.0%) | 0 (0.0%) |
| 1 or 2 Children | 0 (0.0%) | 0 (0.0%) |
| 3 or 4 Children | 0 (0.0%) | 0 (0.0%) |
| 5 or more Children | 0 (0.0%) | 0 (0.0%) |
| Total | 0 (0.0%) | 0 (0.0%) |
Income Below Poverty Among Married-Couple vs Single-Parent Households in Frontenac
| Children | Married-Couple Families | Single-Parent Households |
| No Children | 0 (0.0%) | 0 (0.0%) |
| 1 or 2 Children | 0 (0.0%) | 0 (0.0%) |
| 3 or 4 Children | 0 (0.0%) | 0 (0.0%) |
| 5 or more Children | 0 (0.0%) | 0 (0.0%) |
| Total | 0 (0.0%) | 0 (0.0%) |
Race in Frontenac
The most populous races in Frontenac are White / Caucasian (198 | 92.5%), Hispanic or Latino (30 | 14.0%), and Native / Alaskan (10 | 4.7%).
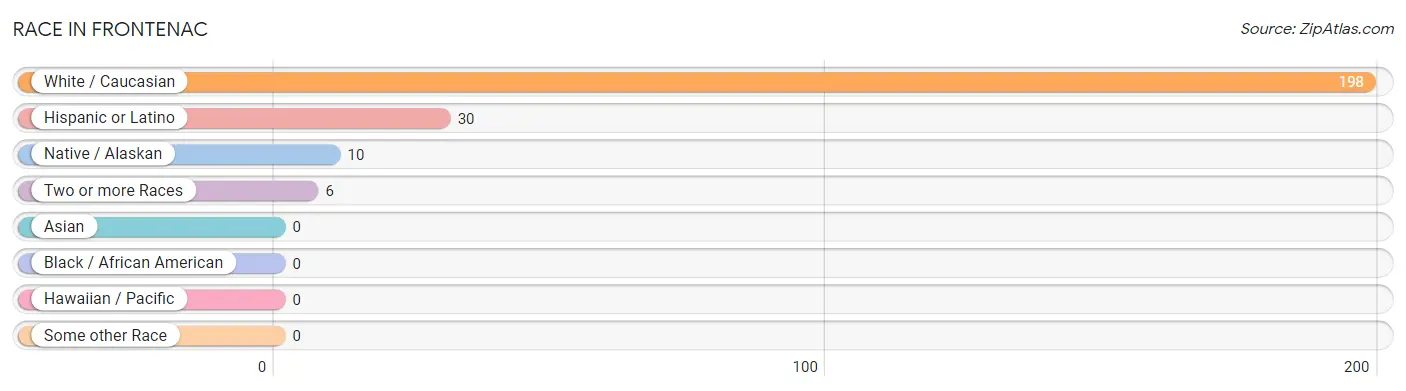
| Race | # Population | % Population |
| Asian | 0 | 0.0% |
| Black / African American | 0 | 0.0% |
| Hawaiian / Pacific | 0 | 0.0% |
| Hispanic or Latino | 30 | 14.0% |
| Native / Alaskan | 10 | 4.7% |
| White / Caucasian | 198 | 92.5% |
| Two or more Races | 6 | 2.8% |
| Some other Race | 0 | 0.0% |
| Total | 214 | 100.0% |
Ancestry in Frontenac
The most populous ancestries reported in Frontenac are German (72 | 33.6%), Irish (35 | 16.4%), Mexican (30 | 14.0%), Norwegian (23 | 10.7%), and English (19 | 8.9%), together accounting for 83.7% of all Frontenac residents.
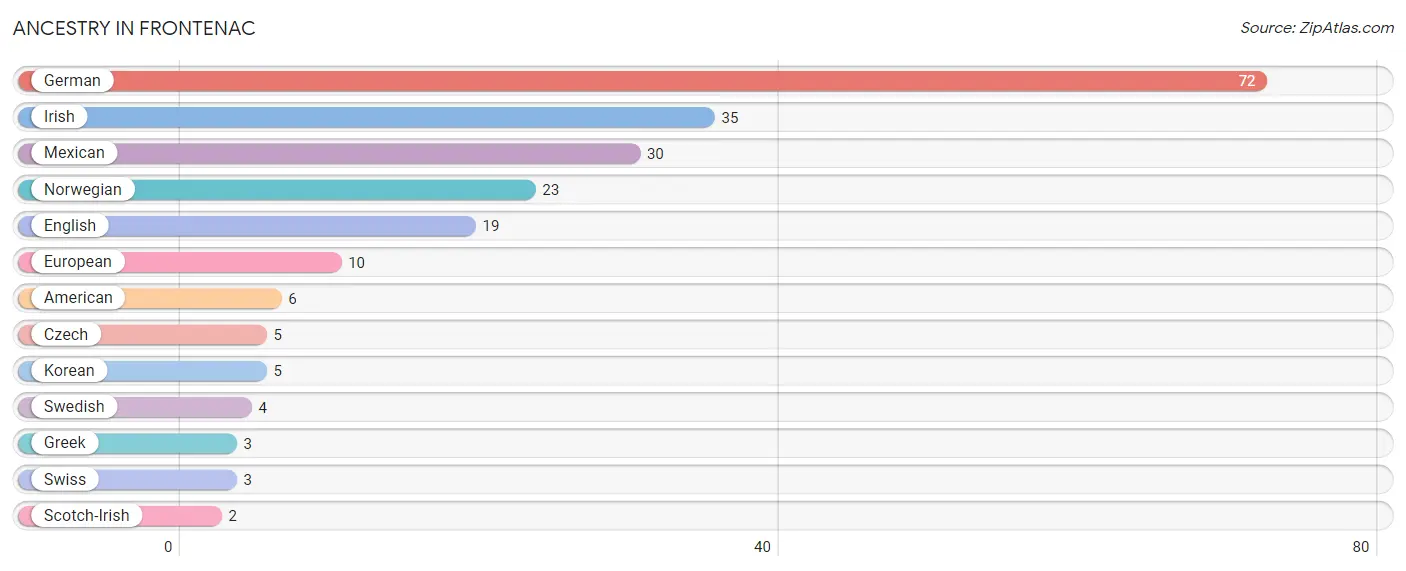
| Ancestry | # Population | % Population |
| American | 6 | 2.8% |
| Czech | 5 | 2.3% |
| English | 19 | 8.9% |
| European | 10 | 4.7% |
| German | 72 | 33.6% |
| Greek | 3 | 1.4% |
| Irish | 35 | 16.4% |
| Korean | 5 | 2.3% |
| Mexican | 30 | 14.0% |
| Norwegian | 23 | 10.7% |
| Scotch-Irish | 2 | 0.9% |
| Swedish | 4 | 1.9% |
| Swiss | 3 | 1.4% | View All 13 Rows |
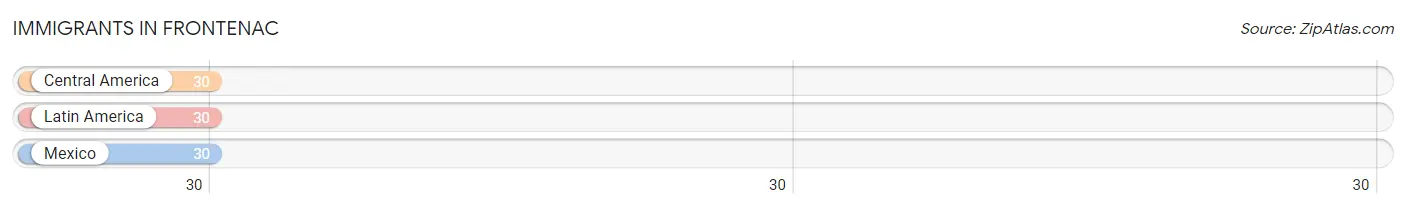
Immigrants in Frontenac
The most numerous immigrant groups reported in Frontenac came from Central America (30 | 14.0%), Latin America (30 | 14.0%), and Mexico (30 | 14.0%), together accounting for 42.1% of all Frontenac residents.
| Immigration Origin | # Population | % Population |
| Central America | 30 | 14.0% |
| Latin America | 30 | 14.0% |
| Mexico | 30 | 14.0% | View All 3 Rows |
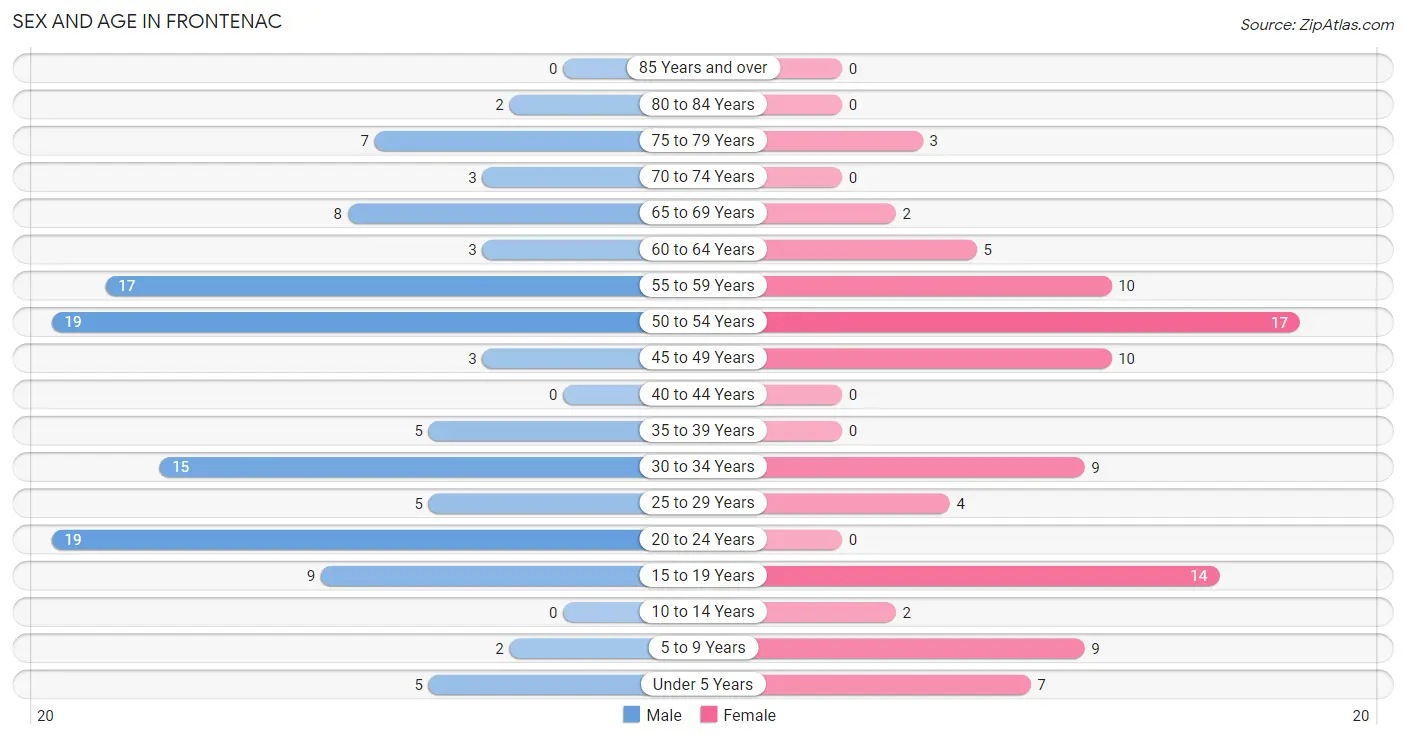
Sex and Age in Frontenac
Sex and Age in Frontenac
The most populous age groups in Frontenac are 20 to 24 Years (19 | 15.6%) for men and 50 to 54 Years (17 | 18.5%) for women.
| Age Bracket | Male | Female |
| Under 5 Years | 5 (4.1%) | 7 (7.6%) |
| 5 to 9 Years | 2 (1.6%) | 9 (9.8%) |
| 10 to 14 Years | 0 (0.0%) | 2 (2.2%) |
| 15 to 19 Years | 9 (7.4%) | 14 (15.2%) |
| 20 to 24 Years | 19 (15.6%) | 0 (0.0%) |
| 25 to 29 Years | 5 (4.1%) | 4 (4.3%) |
| 30 to 34 Years | 15 (12.3%) | 9 (9.8%) |
| 35 to 39 Years | 5 (4.1%) | 0 (0.0%) |
| 40 to 44 Years | 0 (0.0%) | 0 (0.0%) |
| 45 to 49 Years | 3 (2.5%) | 10 (10.9%) |
| 50 to 54 Years | 19 (15.6%) | 17 (18.5%) |
| 55 to 59 Years | 17 (13.9%) | 10 (10.9%) |
| 60 to 64 Years | 3 (2.5%) | 5 (5.4%) |
| 65 to 69 Years | 8 (6.6%) | 2 (2.2%) |
| 70 to 74 Years | 3 (2.5%) | 0 (0.0%) |
| 75 to 79 Years | 7 (5.7%) | 3 (3.3%) |
| 80 to 84 Years | 2 (1.6%) | 0 (0.0%) |
| 85 Years and over | 0 (0.0%) | 0 (0.0%) |
| Total | 122 (100.0%) | 92 (100.0%) |
Families and Households in Frontenac
Median Family Size in Frontenac
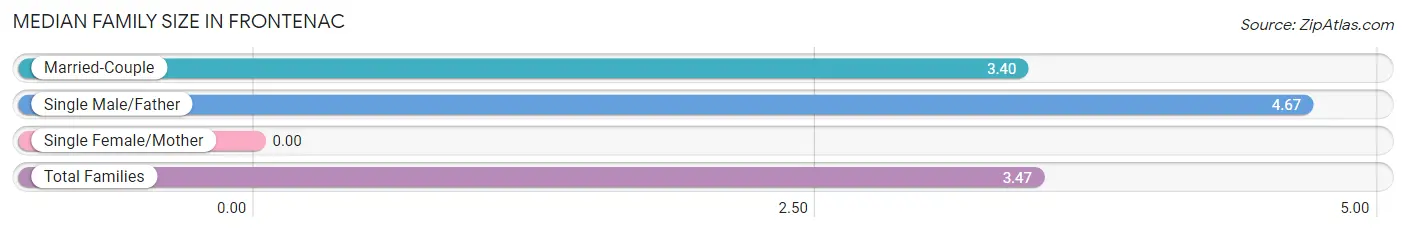
| Family Type | # Families | Family Size |
| Married-Couple | 50 (94.3%) | 3.40 |
| Single Male/Father | 3 (5.7%) | 4.67 |
| Single Female/Mother | 0 (0.0%) | - |
| Total Families | 53 (100.0%) | 3.47 |
Median Household Size in Frontenac
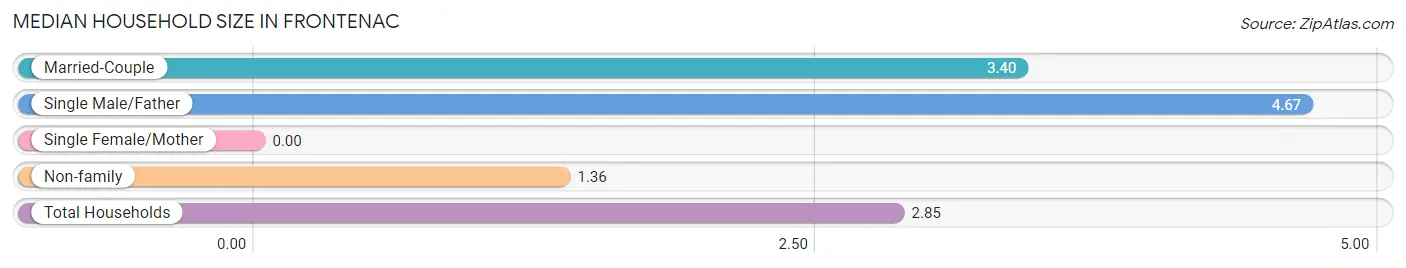
| Household Type | # Households | Household Size |
| Married-Couple | 50 (66.7%) | 3.40 |
| Single Male/Father | 3 (4.0%) | 4.67 |
| Single Female/Mother | 0 (0.0%) | - |
| Non-family | 22 (29.3%) | 1.36 |
| Total Households | 75 (100.0%) | 2.85 |
Household Size by Marriage Status in Frontenac
Out of a total of 75 households in Frontenac, 53 (70.7%) are family households, while 22 (29.3%) are nonfamily households. The most numerous type of family households are 3-person households, comprising 22, and the most common type of nonfamily households are 1-person households, comprising 12.
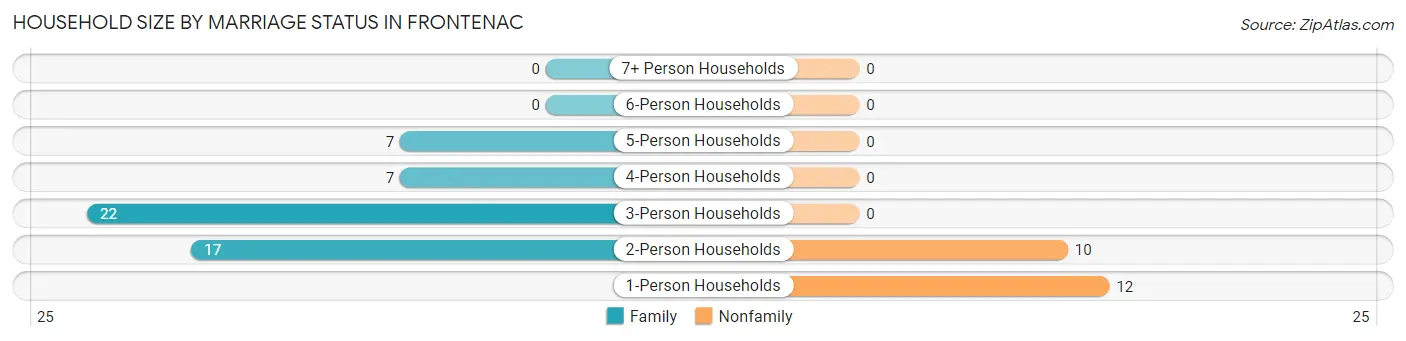
| Household Size | Family Households | Nonfamily Households |
| 1-Person Households | - | 12 (16.0%) |
| 2-Person Households | 17 (22.7%) | 10 (13.3%) |
| 3-Person Households | 22 (29.3%) | 0 (0.0%) |
| 4-Person Households | 7 (9.3%) | 0 (0.0%) |
| 5-Person Households | 7 (9.3%) | 0 (0.0%) |
| 6-Person Households | 0 (0.0%) | 0 (0.0%) |
| 7+ Person Households | 0 (0.0%) | 0 (0.0%) |
| Total | 53 (70.7%) | 22 (29.3%) |
Female Fertility in Frontenac
Fertility by Age in Frontenac
| Age Bracket | Women with Births | Births / 1,000 Women |
| 15 to 19 years | 0 (0.0%) | 0.0 |
| 20 to 34 years | 0 (0.0%) | 0.0 |
| 35 to 50 years | 0 (0.0%) | 0.0 |
| Total | 0 (0.0%) | 0.0 |
Fertility by Age by Marriage Status in Frontenac
| Age Bracket | Married | Unmarried |
| 15 to 19 years | 0 (0.0%) | 0 (0.0%) |
| 20 to 34 years | 0 (0.0%) | 0 (0.0%) |
| 35 to 50 years | 0 (0.0%) | 0 (0.0%) |
| Total | 0 (0.0%) | 0 (0.0%) |
Fertility by Education in Frontenac
| Educational Attainment | Women with Births | Births / 1,000 Women |
| Less than High School | 0 (0.0%) | 0.0 |
| High School Diploma | 0 (0.0%) | 0.0 |
| College or Associate's Degree | 0 (0.0%) | 0.0 |
| Bachelor's Degree | 0 (0.0%) | 0.0 |
| Graduate Degree | 0 (0.0%) | 0.0 |
| Total | 0 (0.0%) | 0.0 |
Fertility by Education by Marriage Status in Frontenac
| Educational Attainment | Married | Unmarried |
| Less than High School | 0 (0.0%) | 0 (0.0%) |
| High School Diploma | 0 (0.0%) | 0 (0.0%) |
| College or Associate's Degree | 0 (0.0%) | 0 (0.0%) |
| Bachelor's Degree | 0 (0.0%) | 0 (0.0%) |
| Graduate Degree | 0 (0.0%) | 0 (0.0%) |
| Total | 0 (0.0%) | 0 (0.0%) |
Employment Characteristics in Frontenac
Employment by Class of Employer in Frontenac
Among the 142 employed individuals in Frontenac, private company employees (112 | 78.9%), not-for-profit organizations (21 | 14.8%), and local government employees (6 | 4.2%) make up the most common classes of employment.
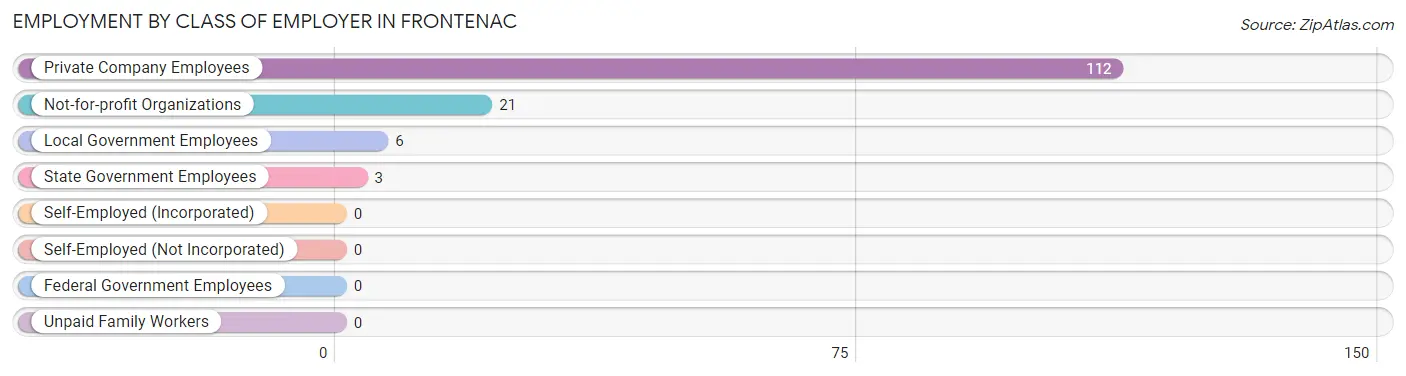
| Employer Class | # Employees | % Employees |
| Private Company Employees | 112 | 78.9% |
| Self-Employed (Incorporated) | 0 | 0.0% |
| Self-Employed (Not Incorporated) | 0 | 0.0% |
| Not-for-profit Organizations | 21 | 14.8% |
| Local Government Employees | 6 | 4.2% |
| State Government Employees | 3 | 2.1% |
| Federal Government Employees | 0 | 0.0% |
| Unpaid Family Workers | 0 | 0.0% |
| Total | 142 | 100.0% |
Employment Status by Age in Frontenac
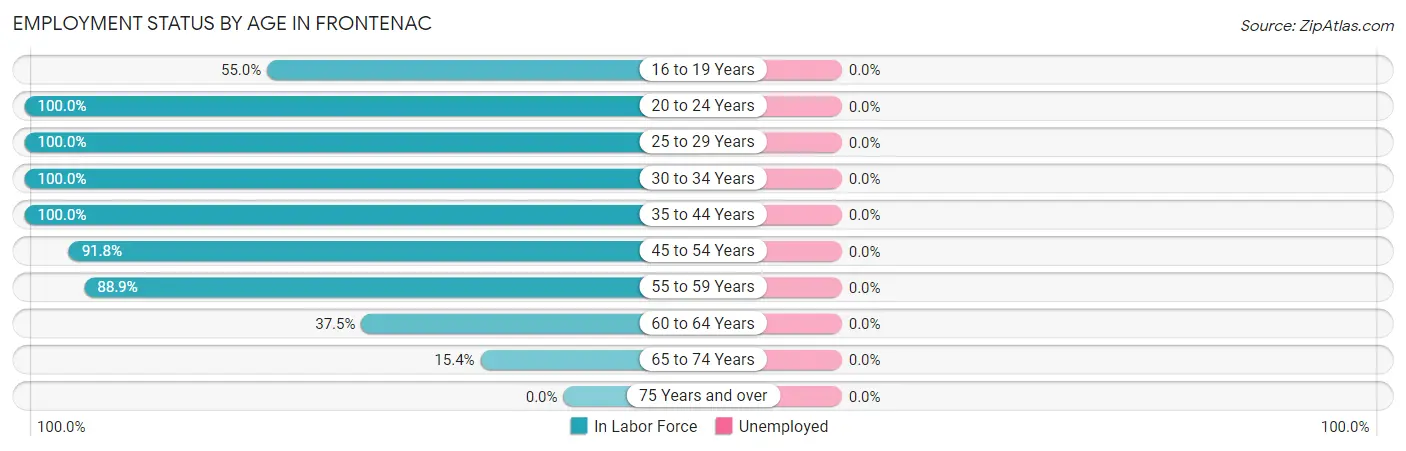
| Age Bracket | In Labor Force | Unemployed |
| 16 to 19 Years | 11 (55.0%) | 0 (0.0%) |
| 20 to 24 Years | 19 (100.0%) | 0 (0.0%) |
| 25 to 29 Years | 9 (100.0%) | 0 (0.0%) |
| 30 to 34 Years | 24 (100.0%) | 0 (0.0%) |
| 35 to 44 Years | 5 (100.0%) | 0 (0.0%) |
| 45 to 54 Years | 45 (91.8%) | 0 (0.0%) |
| 55 to 59 Years | 24 (88.9%) | 0 (0.0%) |
| 60 to 64 Years | 3 (37.5%) | 0 (0.0%) |
| 65 to 74 Years | 2 (15.4%) | 0 (0.0%) |
| 75 Years and over | 0 (0.0%) | 0 (0.0%) |
| Total | 142 (76.3%) | 0 (0.0%) |
Employment Status by Educational Attainment in Frontenac
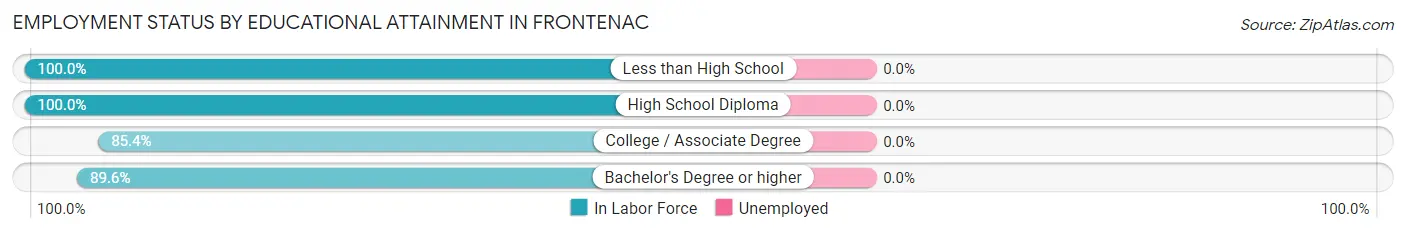
| Educational Attainment | In Labor Force | Unemployed |
| Less than High School | 3 (100.0%) | 0 (0.0%) |
| High School Diploma | 23 (100.0%) | 0 (0.0%) |
| College / Associate Degree | 41 (85.4%) | 0 (0.0%) |
| Bachelor's Degree or higher | 43 (89.6%) | 0 (0.0%) |
| Total | 110 (90.2%) | 0 (0.0%) |
Employment Occupations by Sex in Frontenac
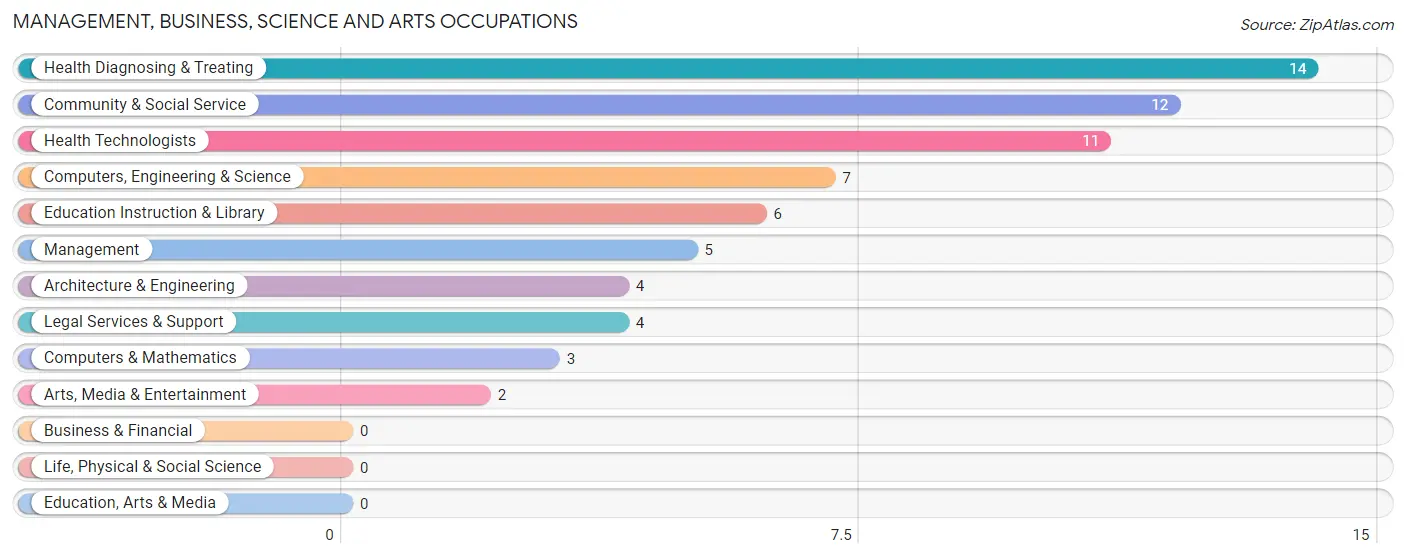
Management, Business, Science and Arts Occupations
The most common Management, Business, Science and Arts occupations in Frontenac are Health Diagnosing & Treating (14 | 9.9%), Community & Social Service (12 | 8.5%), Health Technologists (11 | 7.7%), Computers, Engineering & Science (7 | 4.9%), and Education Instruction & Library (6 | 4.2%).
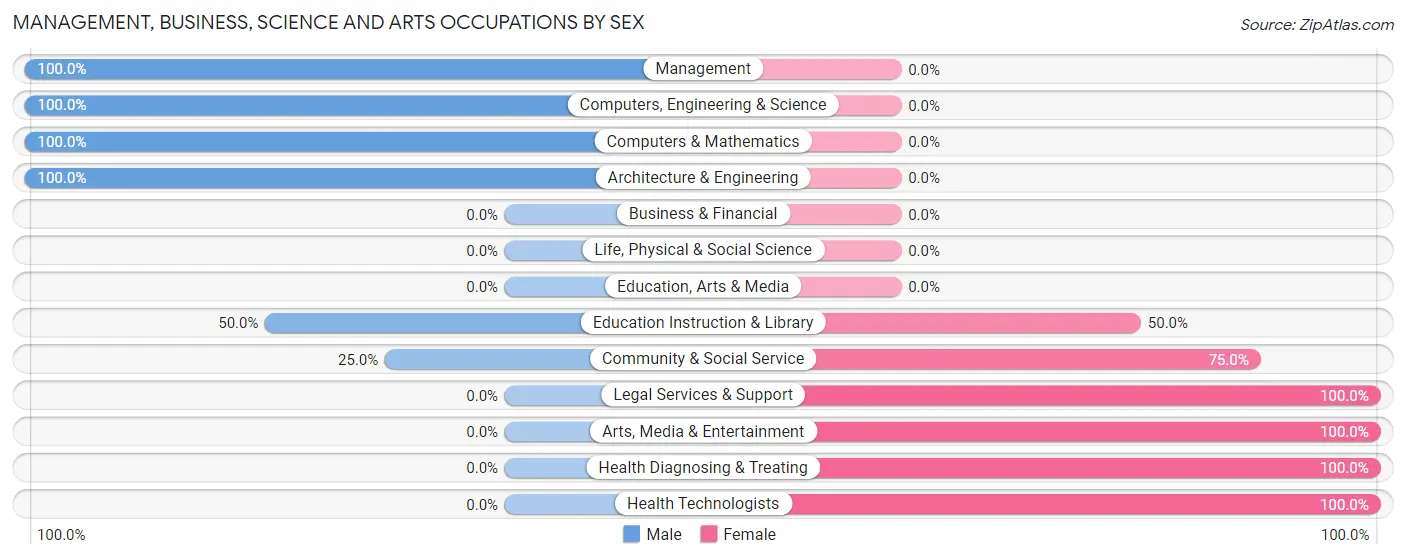
Management, Business, Science and Arts Occupations by Sex
Within the Management, Business, Science and Arts occupations in Frontenac, the most male-oriented occupations are Management (100.0%), Computers, Engineering & Science (100.0%), and Computers & Mathematics (100.0%), while the most female-oriented occupations are Legal Services & Support (100.0%), Arts, Media & Entertainment (100.0%), and Health Diagnosing & Treating (100.0%).
| Occupation | Male | Female |
| Management | 5 (100.0%) | 0 (0.0%) |
| Business & Financial | 0 (0.0%) | 0 (0.0%) |
| Computers, Engineering & Science | 7 (100.0%) | 0 (0.0%) |
| Computers & Mathematics | 3 (100.0%) | 0 (0.0%) |
| Architecture & Engineering | 4 (100.0%) | 0 (0.0%) |
| Life, Physical & Social Science | 0 (0.0%) | 0 (0.0%) |
| Community & Social Service | 3 (25.0%) | 9 (75.0%) |
| Education, Arts & Media | 0 (0.0%) | 0 (0.0%) |
| Legal Services & Support | 0 (0.0%) | 4 (100.0%) |
| Education Instruction & Library | 3 (50.0%) | 3 (50.0%) |
| Arts, Media & Entertainment | 0 (0.0%) | 2 (100.0%) |
| Health Diagnosing & Treating | 0 (0.0%) | 14 (100.0%) |
| Health Technologists | 0 (0.0%) | 11 (100.0%) |
| Total (Category) | 15 (39.5%) | 23 (60.5%) |
| Total (Overall) | 90 (63.4%) | 52 (36.6%) |
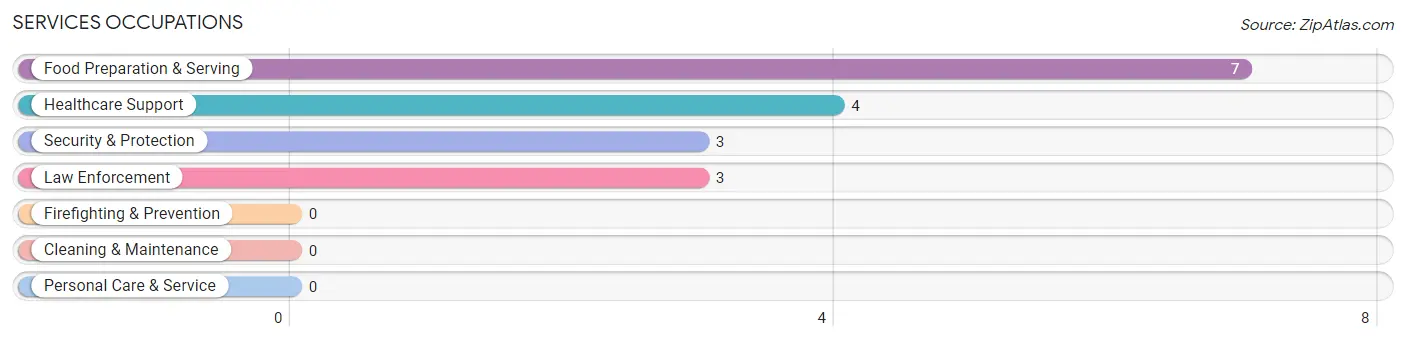
Services Occupations
The most common Services occupations in Frontenac are Food Preparation & Serving (7 | 4.9%), Healthcare Support (4 | 2.8%), Security & Protection (3 | 2.1%), and Law Enforcement (3 | 2.1%).
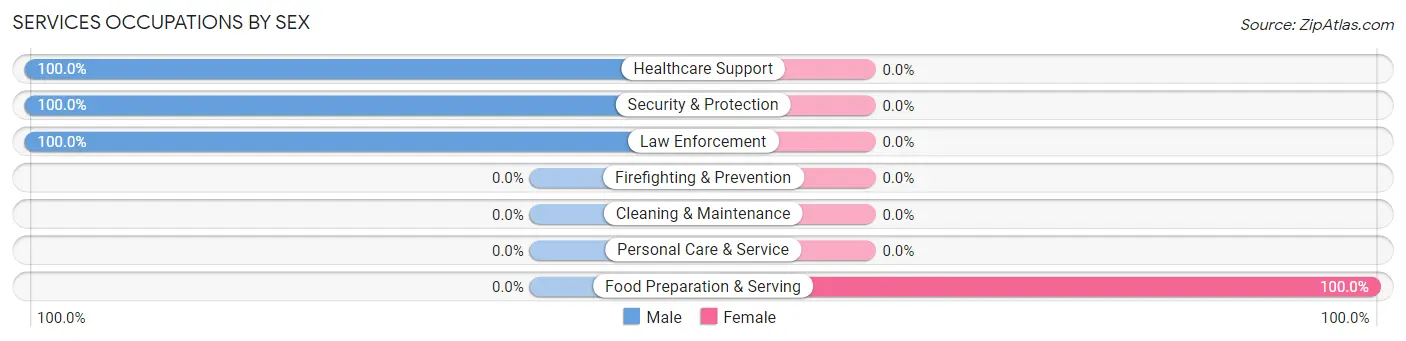
Services Occupations by Sex
| Occupation | Male | Female |
| Healthcare Support | 4 (100.0%) | 0 (0.0%) |
| Security & Protection | 3 (100.0%) | 0 (0.0%) |
| Firefighting & Prevention | 0 (0.0%) | 0 (0.0%) |
| Law Enforcement | 3 (100.0%) | 0 (0.0%) |
| Food Preparation & Serving | 0 (0.0%) | 7 (100.0%) |
| Cleaning & Maintenance | 0 (0.0%) | 0 (0.0%) |
| Personal Care & Service | 0 (0.0%) | 0 (0.0%) |
| Total (Category) | 7 (50.0%) | 7 (50.0%) |
| Total (Overall) | 90 (63.4%) | 52 (36.6%) |
Sales and Office Occupations
The most common Sales and Office occupations in Frontenac are Office & Administration (8 | 5.6%), and Sales & Related (4 | 2.8%).
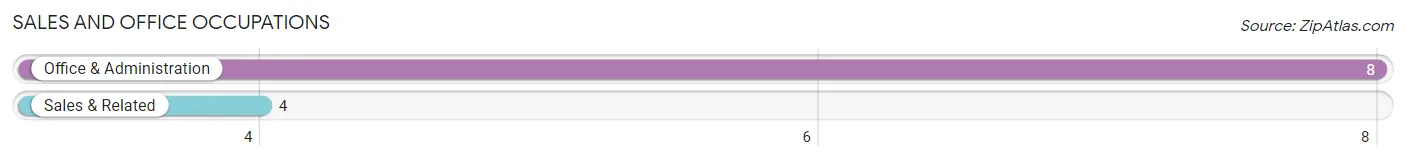
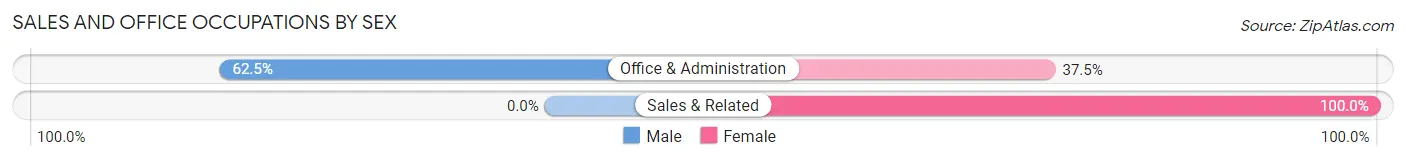
Sales and Office Occupations by Sex
| Occupation | Male | Female |
| Sales & Related | 0 (0.0%) | 4 (100.0%) |
| Office & Administration | 5 (62.5%) | 3 (37.5%) |
| Total (Category) | 5 (41.7%) | 7 (58.3%) |
| Total (Overall) | 90 (63.4%) | 52 (36.6%) |
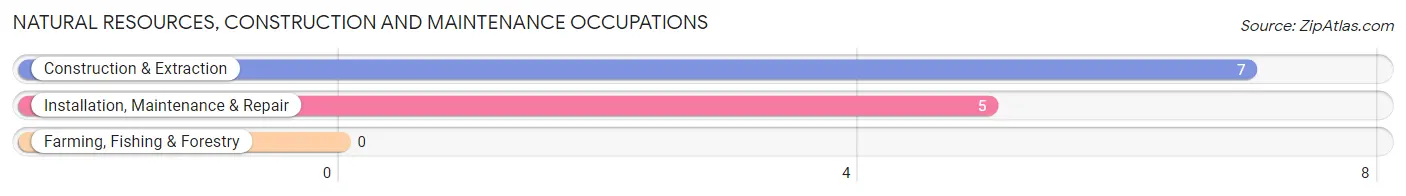
Natural Resources, Construction and Maintenance Occupations
The most common Natural Resources, Construction and Maintenance occupations in Frontenac are Construction & Extraction (7 | 4.9%), and Installation, Maintenance & Repair (5 | 3.5%).
Natural Resources, Construction and Maintenance Occupations by Sex
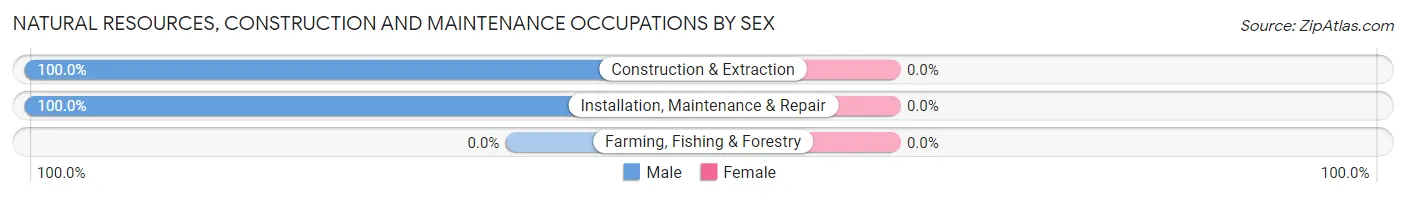
| Occupation | Male | Female |
| Farming, Fishing & Forestry | 0 (0.0%) | 0 (0.0%) |
| Construction & Extraction | 7 (100.0%) | 0 (0.0%) |
| Installation, Maintenance & Repair | 5 (100.0%) | 0 (0.0%) |
| Total (Category) | 12 (100.0%) | 0 (0.0%) |
| Total (Overall) | 90 (63.4%) | 52 (36.6%) |
Production, Transportation and Moving Occupations
The most common Production, Transportation and Moving occupations in Frontenac are Production (38 | 26.8%), Material Moving (16 | 11.3%), and Transportation (12 | 8.5%).
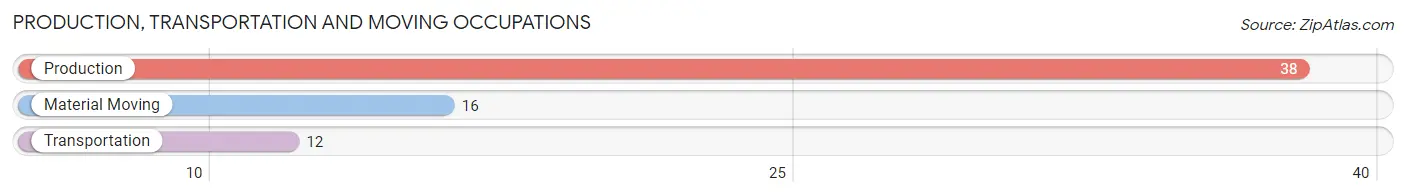
Production, Transportation and Moving Occupations by Sex
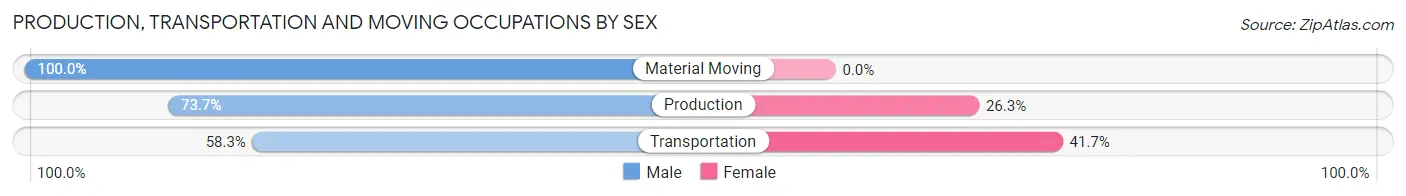
| Occupation | Male | Female |
| Production | 28 (73.7%) | 10 (26.3%) |
| Transportation | 7 (58.3%) | 5 (41.7%) |
| Material Moving | 16 (100.0%) | 0 (0.0%) |
| Total (Category) | 51 (77.3%) | 15 (22.7%) |
| Total (Overall) | 90 (63.4%) | 52 (36.6%) |
Employment Industries by Sex in Frontenac
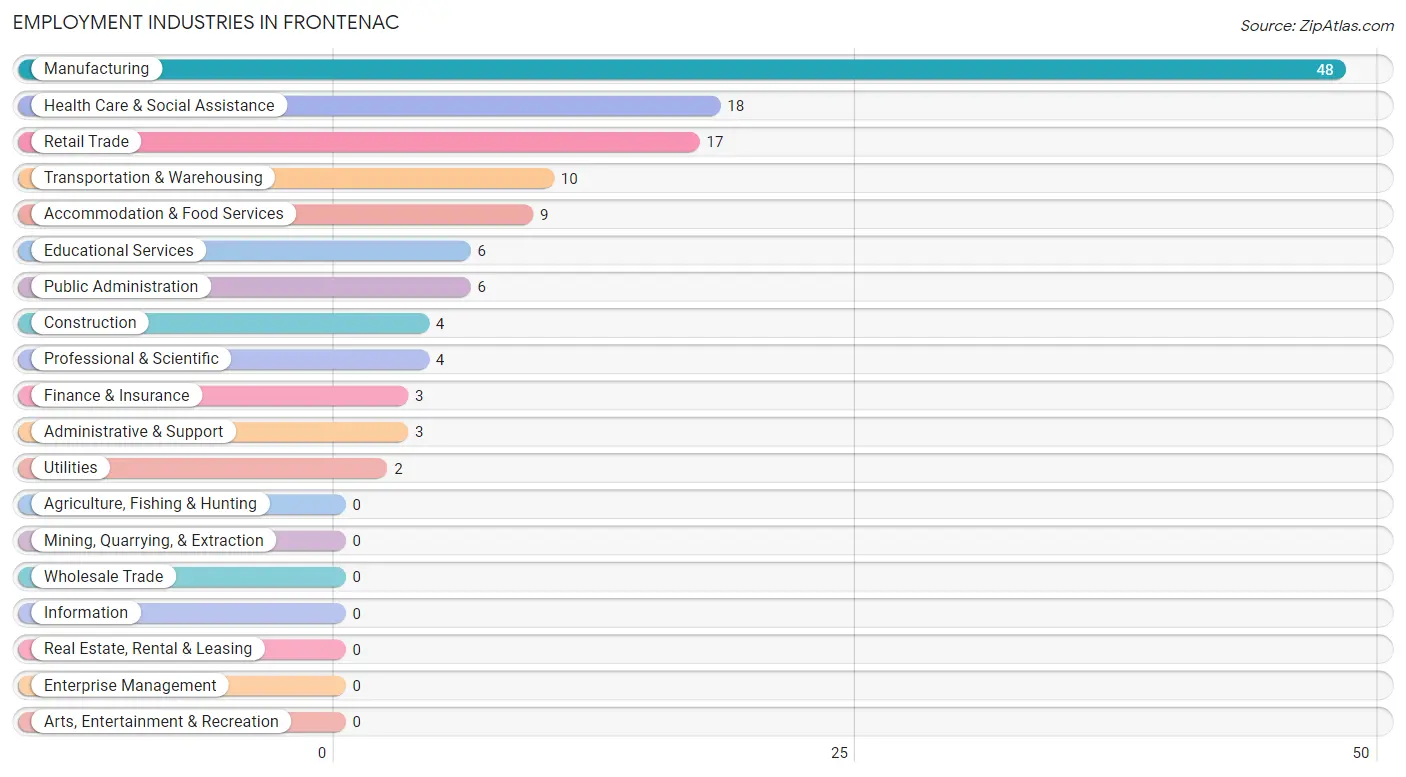
Employment Industries in Frontenac
The major employment industries in Frontenac include Manufacturing (48 | 33.8%), Health Care & Social Assistance (18 | 12.7%), Retail Trade (17 | 12.0%), Transportation & Warehousing (10 | 7.0%), and Accommodation & Food Services (9 | 6.3%).
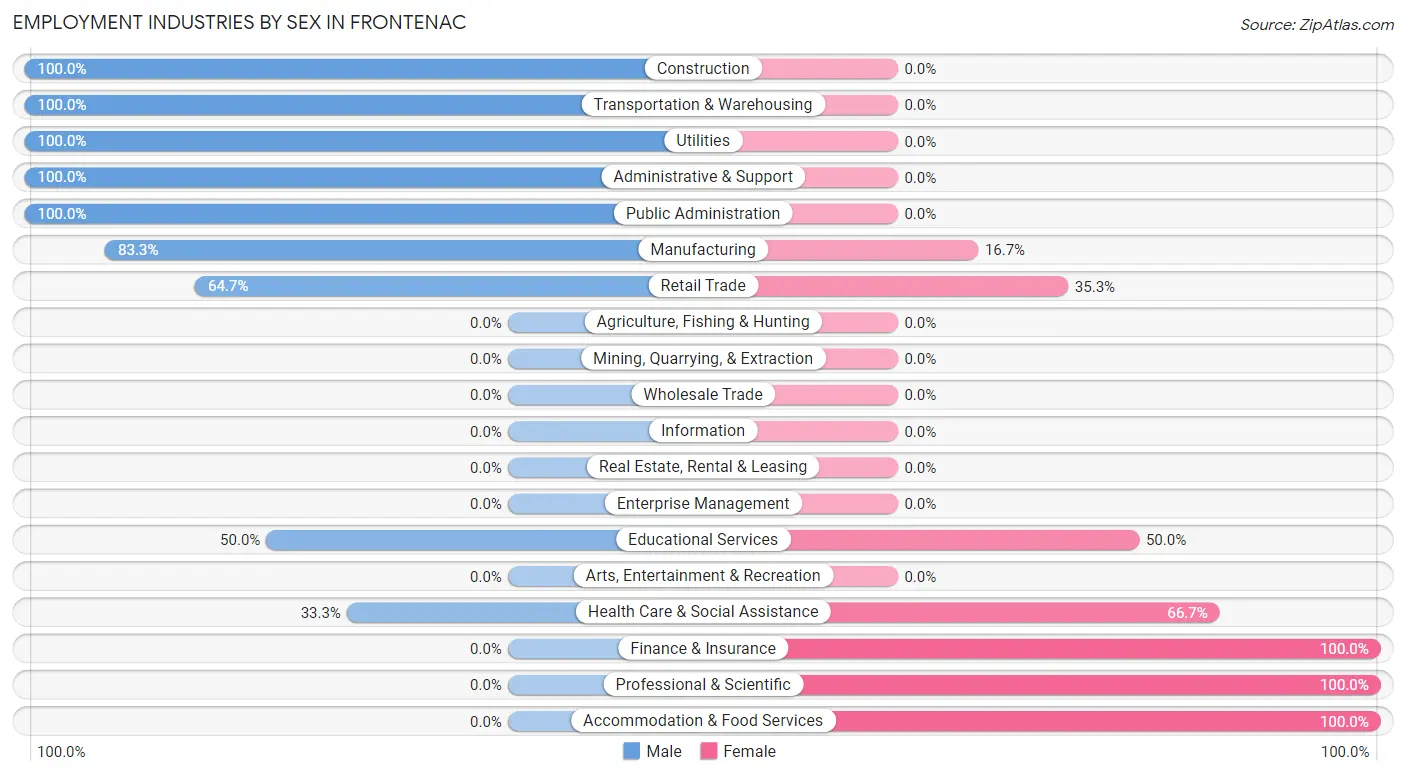
Employment Industries by Sex in Frontenac
The Frontenac industries that see more men than women are Construction (100.0%), Transportation & Warehousing (100.0%), and Utilities (100.0%), whereas the industries that tend to have a higher number of women are Finance & Insurance (100.0%), Professional & Scientific (100.0%), and Accommodation & Food Services (100.0%).
| Industry | Male | Female |
| Agriculture, Fishing & Hunting | 0 (0.0%) | 0 (0.0%) |
| Mining, Quarrying, & Extraction | 0 (0.0%) | 0 (0.0%) |
| Construction | 4 (100.0%) | 0 (0.0%) |
| Manufacturing | 40 (83.3%) | 8 (16.7%) |
| Wholesale Trade | 0 (0.0%) | 0 (0.0%) |
| Retail Trade | 11 (64.7%) | 6 (35.3%) |
| Transportation & Warehousing | 10 (100.0%) | 0 (0.0%) |
| Utilities | 2 (100.0%) | 0 (0.0%) |
| Information | 0 (0.0%) | 0 (0.0%) |
| Finance & Insurance | 0 (0.0%) | 3 (100.0%) |
| Real Estate, Rental & Leasing | 0 (0.0%) | 0 (0.0%) |
| Professional & Scientific | 0 (0.0%) | 4 (100.0%) |
| Enterprise Management | 0 (0.0%) | 0 (0.0%) |
| Administrative & Support | 3 (100.0%) | 0 (0.0%) |
| Educational Services | 3 (50.0%) | 3 (50.0%) |
| Health Care & Social Assistance | 6 (33.3%) | 12 (66.7%) |
| Arts, Entertainment & Recreation | 0 (0.0%) | 0 (0.0%) |
| Accommodation & Food Services | 0 (0.0%) | 9 (100.0%) |
| Public Administration | 6 (100.0%) | 0 (0.0%) |
| Total | 90 (63.4%) | 52 (36.6%) |
Education in Frontenac
School Enrollment in Frontenac
The most common levels of schooling among the 49 students in Frontenac are college / undergraduate (17 | 34.7%), high school (16 | 32.7%), and elementary school (7 | 14.3%).
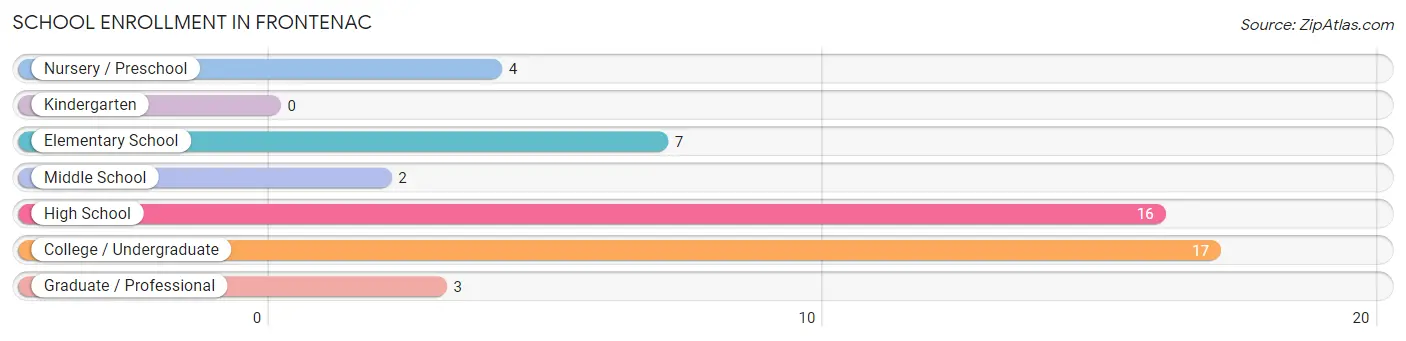
| School Level | # Students | % Students |
| Nursery / Preschool | 4 | 8.2% |
| Kindergarten | 0 | 0.0% |
| Elementary School | 7 | 14.3% |
| Middle School | 2 | 4.1% |
| High School | 16 | 32.7% |
| College / Undergraduate | 17 | 34.7% |
| Graduate / Professional | 3 | 6.1% |
| Total | 49 | 100.0% |
School Enrollment by Age by Funding Source in Frontenac
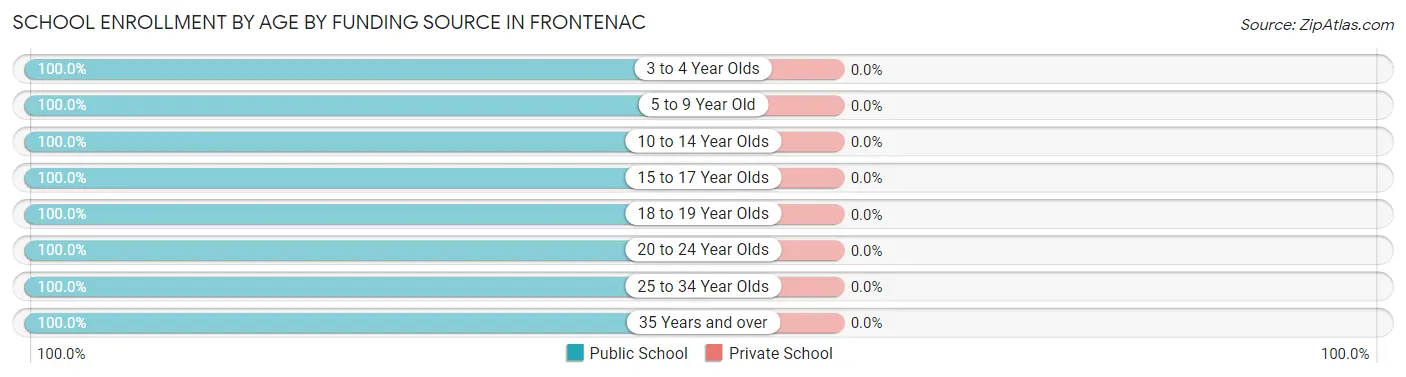
| Age Bracket | Public School | Private School |
| 3 to 4 Year Olds | 4 (100.0%) | 0 (0.0%) |
| 5 to 9 Year Old | 7 (100.0%) | 0 (0.0%) |
| 10 to 14 Year Olds | 2 (100.0%) | 0 (0.0%) |
| 15 to 17 Year Olds | 7 (100.0%) | 0 (0.0%) |
| 18 to 19 Year Olds | 16 (100.0%) | 0 (0.0%) |
| 20 to 24 Year Olds | 4 (100.0%) | 0 (0.0%) |
| 25 to 34 Year Olds | 6 (100.0%) | 0 (0.0%) |
| 35 Years and over | 3 (100.0%) | 0 (0.0%) |
| Total | 49 (100.0%) | 0 (0.0%) |
Educational Attainment by Field of Study in Frontenac
Business (14 | 24.6%), science & technology (12 | 21.0%), education (8 | 14.0%), arts & humanities (6 | 10.5%), and bio, nature & agricultural (5 | 8.8%) are the most common fields of study among 57 individuals in Frontenac who have obtained a bachelor's degree or higher.
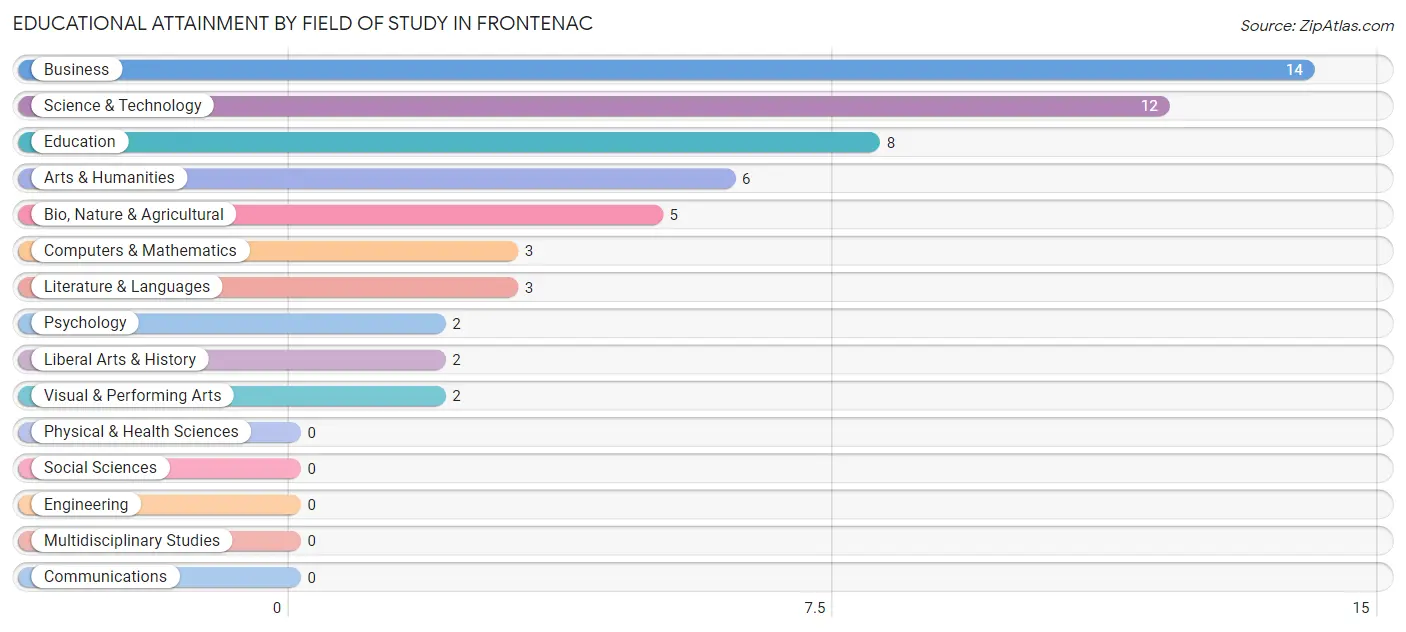
| Field of Study | # Graduates | % Graduates |
| Computers & Mathematics | 3 | 5.3% |
| Bio, Nature & Agricultural | 5 | 8.8% |
| Physical & Health Sciences | 0 | 0.0% |
| Psychology | 2 | 3.5% |
| Social Sciences | 0 | 0.0% |
| Engineering | 0 | 0.0% |
| Multidisciplinary Studies | 0 | 0.0% |
| Science & Technology | 12 | 21.0% |
| Business | 14 | 24.6% |
| Education | 8 | 14.0% |
| Literature & Languages | 3 | 5.3% |
| Liberal Arts & History | 2 | 3.5% |
| Visual & Performing Arts | 2 | 3.5% |
| Communications | 0 | 0.0% |
| Arts & Humanities | 6 | 10.5% |
| Total | 57 | 100.0% |
Transportation & Commute in Frontenac
Vehicle Availability by Sex in Frontenac
The most prevalent vehicle ownership categories in Frontenac are males with 4 vehicles (31, accounting for 34.4%) and females with 4 vehicles (21, making up 59.6%).
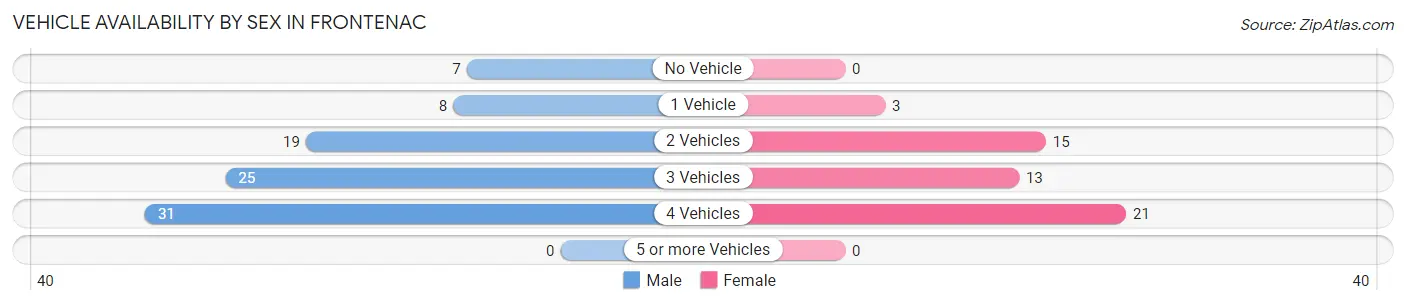
| Vehicles Available | Male | Female |
| No Vehicle | 7 (7.8%) | 0 (0.0%) |
| 1 Vehicle | 8 (8.9%) | 3 (5.8%) |
| 2 Vehicles | 19 (21.1%) | 15 (28.8%) |
| 3 Vehicles | 25 (27.8%) | 13 (25.0%) |
| 4 Vehicles | 31 (34.4%) | 21 (40.4%) |
| 5 or more Vehicles | 0 (0.0%) | 0 (0.0%) |
| Total | 90 (100.0%) | 52 (100.0%) |
Commute Time in Frontenac
The most frequently occuring commute durations in Frontenac are 20 to 24 minutes (40 commuters, 29.2%), 30 to 34 minutes (24 commuters, 17.5%), and 10 to 14 minutes (23 commuters, 16.8%).
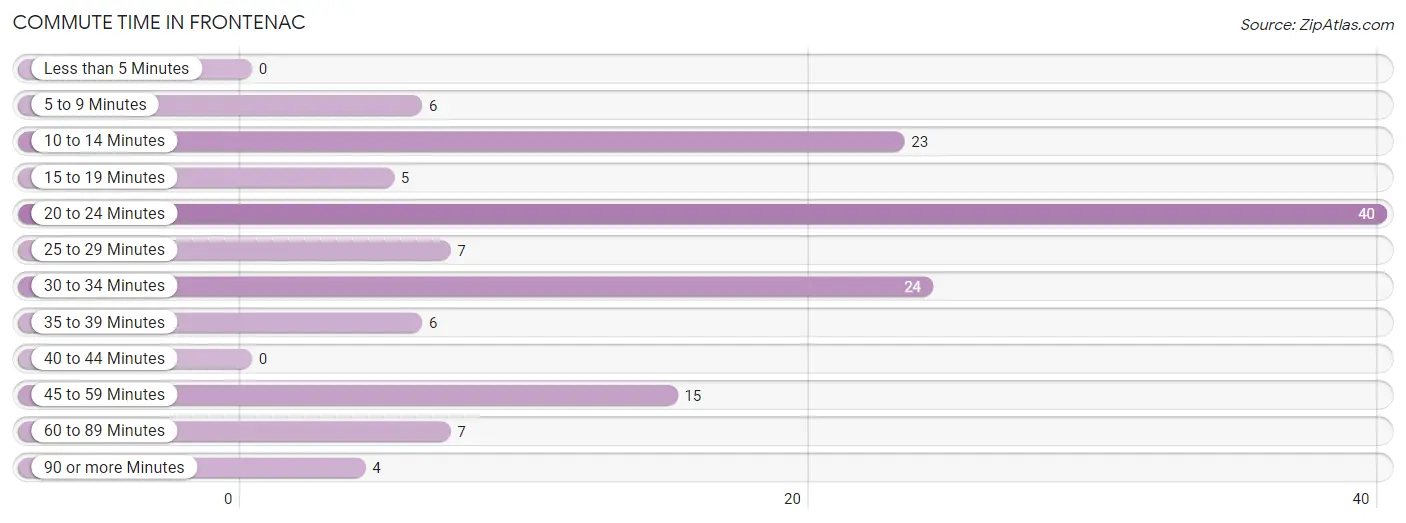
| Commute Time | # Commuters | % Commuters |
| Less than 5 Minutes | 0 | 0.0% |
| 5 to 9 Minutes | 6 | 4.4% |
| 10 to 14 Minutes | 23 | 16.8% |
| 15 to 19 Minutes | 5 | 3.6% |
| 20 to 24 Minutes | 40 | 29.2% |
| 25 to 29 Minutes | 7 | 5.1% |
| 30 to 34 Minutes | 24 | 17.5% |
| 35 to 39 Minutes | 6 | 4.4% |
| 40 to 44 Minutes | 0 | 0.0% |
| 45 to 59 Minutes | 15 | 11.0% |
| 60 to 89 Minutes | 7 | 5.1% |
| 90 or more Minutes | 4 | 2.9% |
Commute Time by Sex in Frontenac
The most common commute times in Frontenac are 20 to 24 minutes (26 commuters, 30.6%) for males and 20 to 24 minutes (14 commuters, 26.9%) for females.
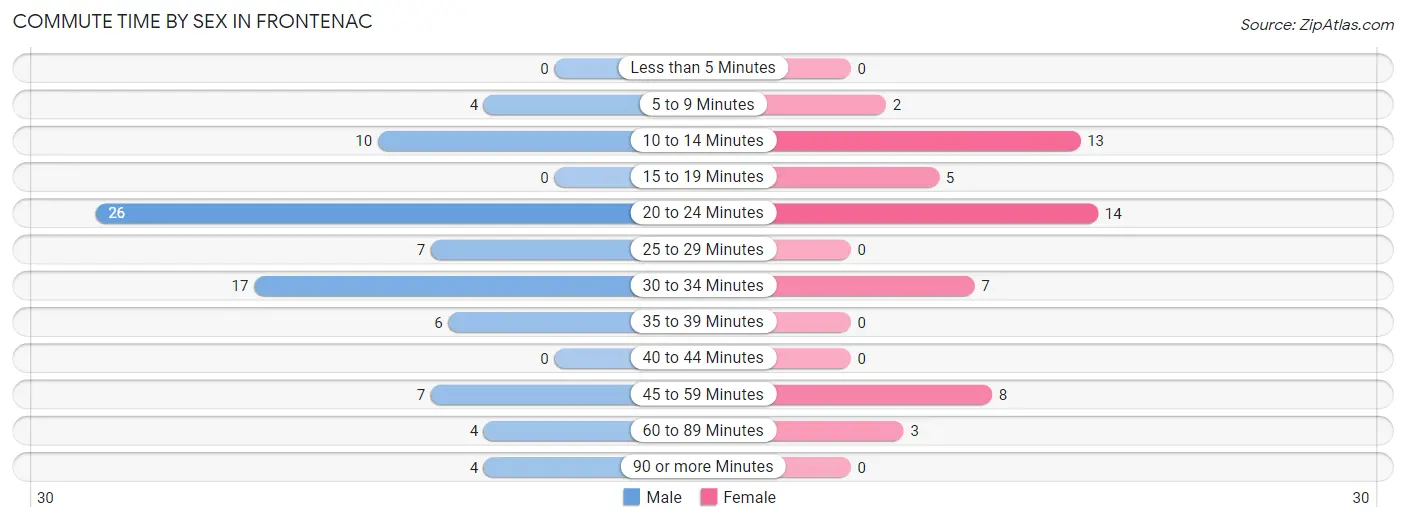
| Commute Time | Male | Female |
| Less than 5 Minutes | 0 (0.0%) | 0 (0.0%) |
| 5 to 9 Minutes | 4 (4.7%) | 2 (3.8%) |
| 10 to 14 Minutes | 10 (11.8%) | 13 (25.0%) |
| 15 to 19 Minutes | 0 (0.0%) | 5 (9.6%) |
| 20 to 24 Minutes | 26 (30.6%) | 14 (26.9%) |
| 25 to 29 Minutes | 7 (8.2%) | 0 (0.0%) |
| 30 to 34 Minutes | 17 (20.0%) | 7 (13.5%) |
| 35 to 39 Minutes | 6 (7.1%) | 0 (0.0%) |
| 40 to 44 Minutes | 0 (0.0%) | 0 (0.0%) |
| 45 to 59 Minutes | 7 (8.2%) | 8 (15.4%) |
| 60 to 89 Minutes | 4 (4.7%) | 3 (5.8%) |
| 90 or more Minutes | 4 (4.7%) | 0 (0.0%) |
Time of Departure to Work by Sex in Frontenac
The most frequent times of departure to work in Frontenac are 5:30 AM to 5:59 AM (21, 24.7%) for males and 5:30 AM to 5:59 AM (8, 15.4%) for females.
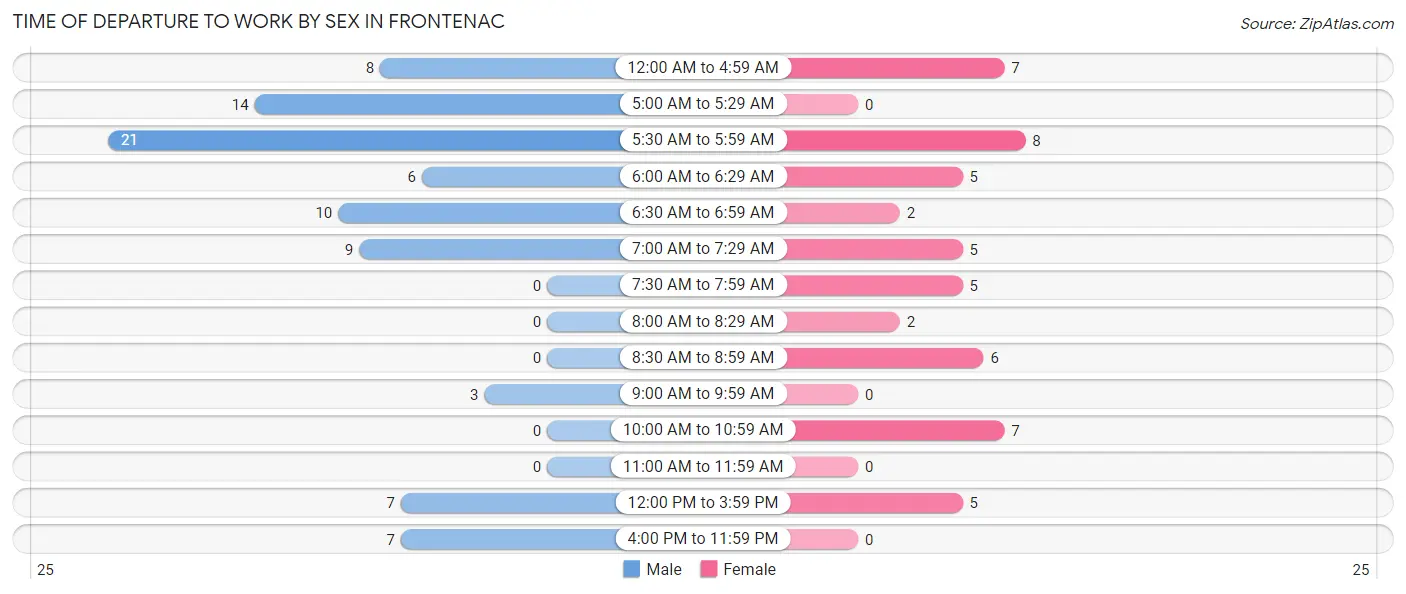
| Time of Departure | Male | Female |
| 12:00 AM to 4:59 AM | 8 (9.4%) | 7 (13.5%) |
| 5:00 AM to 5:29 AM | 14 (16.5%) | 0 (0.0%) |
| 5:30 AM to 5:59 AM | 21 (24.7%) | 8 (15.4%) |
| 6:00 AM to 6:29 AM | 6 (7.1%) | 5 (9.6%) |
| 6:30 AM to 6:59 AM | 10 (11.8%) | 2 (3.8%) |
| 7:00 AM to 7:29 AM | 9 (10.6%) | 5 (9.6%) |
| 7:30 AM to 7:59 AM | 0 (0.0%) | 5 (9.6%) |
| 8:00 AM to 8:29 AM | 0 (0.0%) | 2 (3.8%) |
| 8:30 AM to 8:59 AM | 0 (0.0%) | 6 (11.5%) |
| 9:00 AM to 9:59 AM | 3 (3.5%) | 0 (0.0%) |
| 10:00 AM to 10:59 AM | 0 (0.0%) | 7 (13.5%) |
| 11:00 AM to 11:59 AM | 0 (0.0%) | 0 (0.0%) |
| 12:00 PM to 3:59 PM | 7 (8.2%) | 5 (9.6%) |
| 4:00 PM to 11:59 PM | 7 (8.2%) | 0 (0.0%) |
| Total | 85 (100.0%) | 52 (100.0%) |
Housing Occupancy in Frontenac
Occupancy by Ownership in Frontenac
Of the total 75 dwellings in Frontenac, owner-occupied units account for 64 (85.3%), while renter-occupied units make up 11 (14.7%).
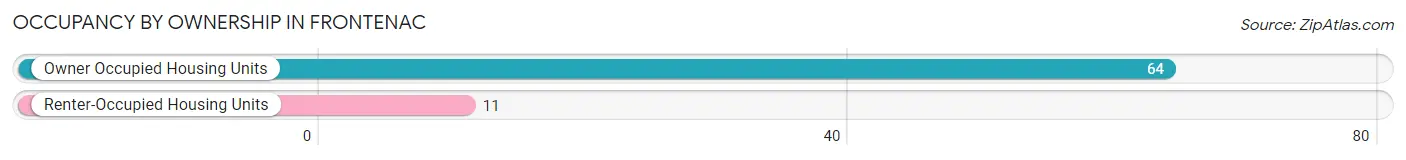
| Occupancy | # Housing Units | % Housing Units |
| Owner Occupied Housing Units | 64 | 85.3% |
| Renter-Occupied Housing Units | 11 | 14.7% |
| Total Occupied Housing Units | 75 | 100.0% |
Occupancy by Household Size in Frontenac
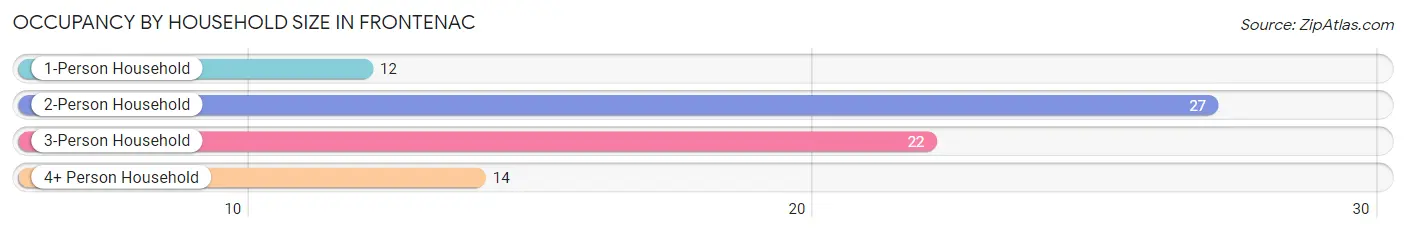
| Household Size | # Housing Units | % Housing Units |
| 1-Person Household | 12 | 16.0% |
| 2-Person Household | 27 | 36.0% |
| 3-Person Household | 22 | 29.3% |
| 4+ Person Household | 14 | 18.7% |
| Total Housing Units | 75 | 100.0% |
Occupancy by Ownership by Household Size in Frontenac
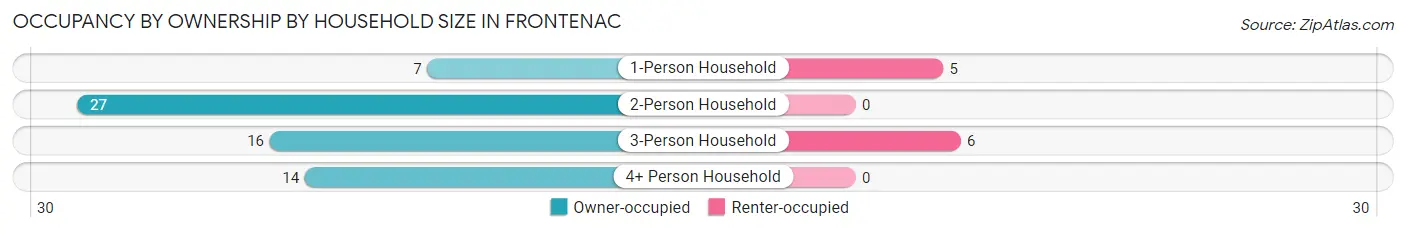
| Household Size | Owner-occupied | Renter-occupied |
| 1-Person Household | 7 (58.3%) | 5 (41.7%) |
| 2-Person Household | 27 (100.0%) | 0 (0.0%) |
| 3-Person Household | 16 (72.7%) | 6 (27.3%) |
| 4+ Person Household | 14 (100.0%) | 0 (0.0%) |
| Total Housing Units | 64 (85.3%) | 11 (14.7%) |
Occupancy by Educational Attainment in Frontenac
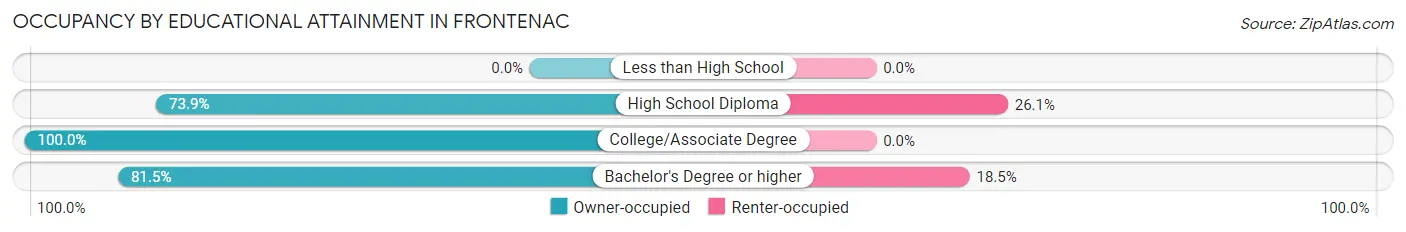
| Household Size | Owner-occupied | Renter-occupied |
| Less than High School | 0 (0.0%) | 0 (0.0%) |
| High School Diploma | 17 (73.9%) | 6 (26.1%) |
| College/Associate Degree | 25 (100.0%) | 0 (0.0%) |
| Bachelor's Degree or higher | 22 (81.5%) | 5 (18.5%) |
Occupancy by Age of Householder in Frontenac
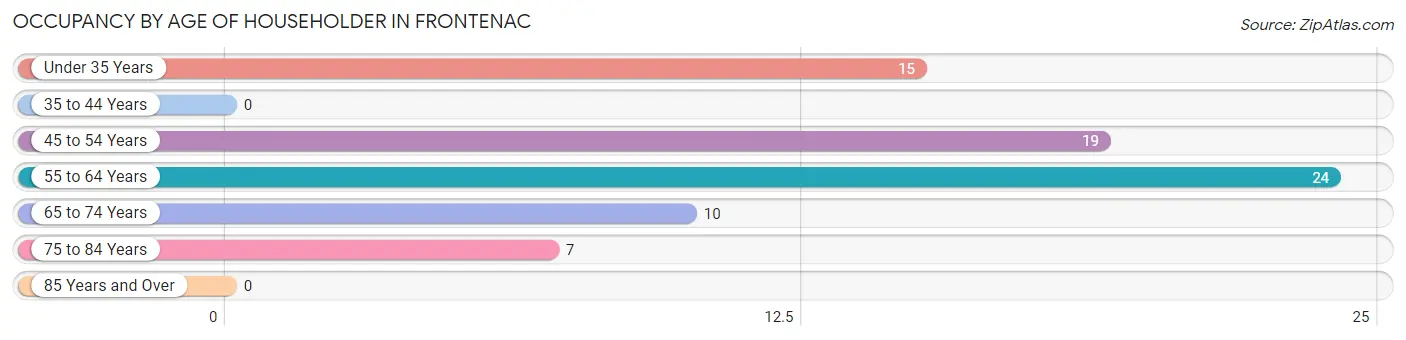
| Age Bracket | # Households | % Households |
| Under 35 Years | 15 | 20.0% |
| 35 to 44 Years | 0 | 0.0% |
| 45 to 54 Years | 19 | 25.3% |
| 55 to 64 Years | 24 | 32.0% |
| 65 to 74 Years | 10 | 13.3% |
| 75 to 84 Years | 7 | 9.3% |
| 85 Years and Over | 0 | 0.0% |
| Total | 75 | 100.0% |
Housing Finances in Frontenac
Median Income by Occupancy in Frontenac
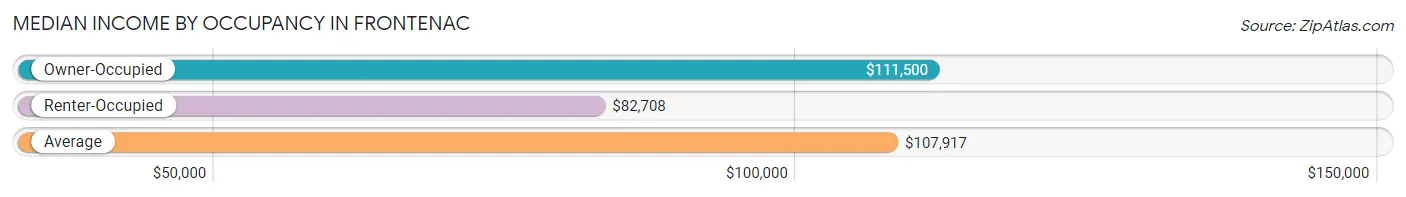
| Occupancy Type | # Households | Median Income |
| Owner-Occupied | 64 (85.3%) | $111,500 |
| Renter-Occupied | 11 (14.7%) | $82,708 |
| Average | 75 (100.0%) | $107,917 |
Occupancy by Householder Income Bracket in Frontenac
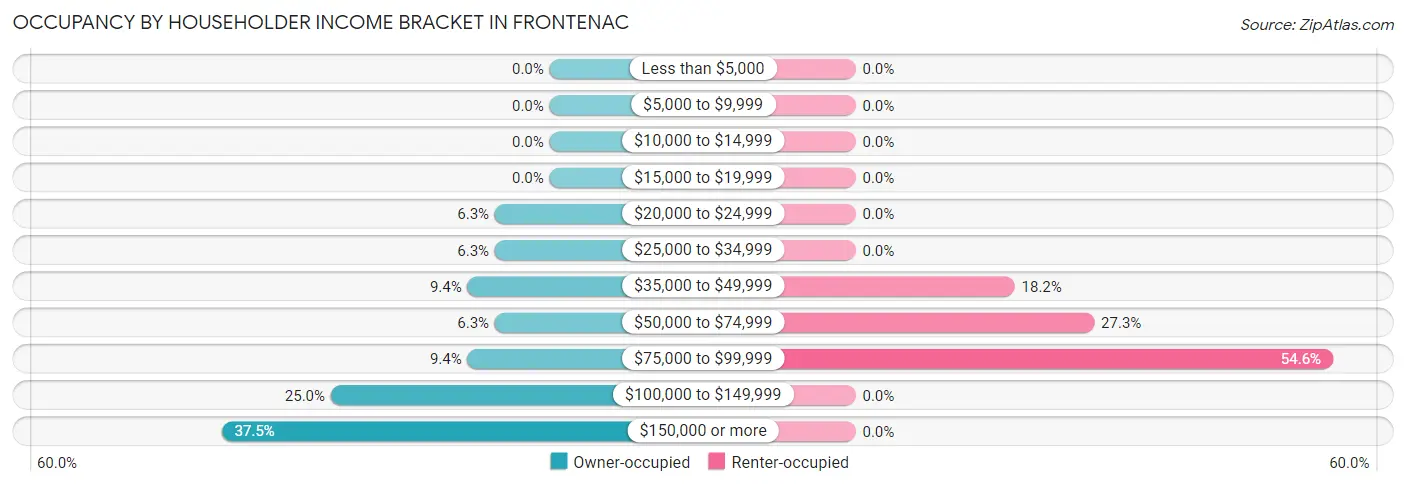
| Income Bracket | Owner-occupied | Renter-occupied |
| Less than $5,000 | 0 (0.0%) | 0 (0.0%) |
| $5,000 to $9,999 | 0 (0.0%) | 0 (0.0%) |
| $10,000 to $14,999 | 0 (0.0%) | 0 (0.0%) |
| $15,000 to $19,999 | 0 (0.0%) | 0 (0.0%) |
| $20,000 to $24,999 | 4 (6.2%) | 0 (0.0%) |
| $25,000 to $34,999 | 4 (6.2%) | 0 (0.0%) |
| $35,000 to $49,999 | 6 (9.4%) | 2 (18.2%) |
| $50,000 to $74,999 | 4 (6.2%) | 3 (27.3%) |
| $75,000 to $99,999 | 6 (9.4%) | 6 (54.5%) |
| $100,000 to $149,999 | 16 (25.0%) | 0 (0.0%) |
| $150,000 or more | 24 (37.5%) | 0 (0.0%) |
| Total | 64 (100.0%) | 11 (100.0%) |
Monthly Housing Cost Tiers in Frontenac
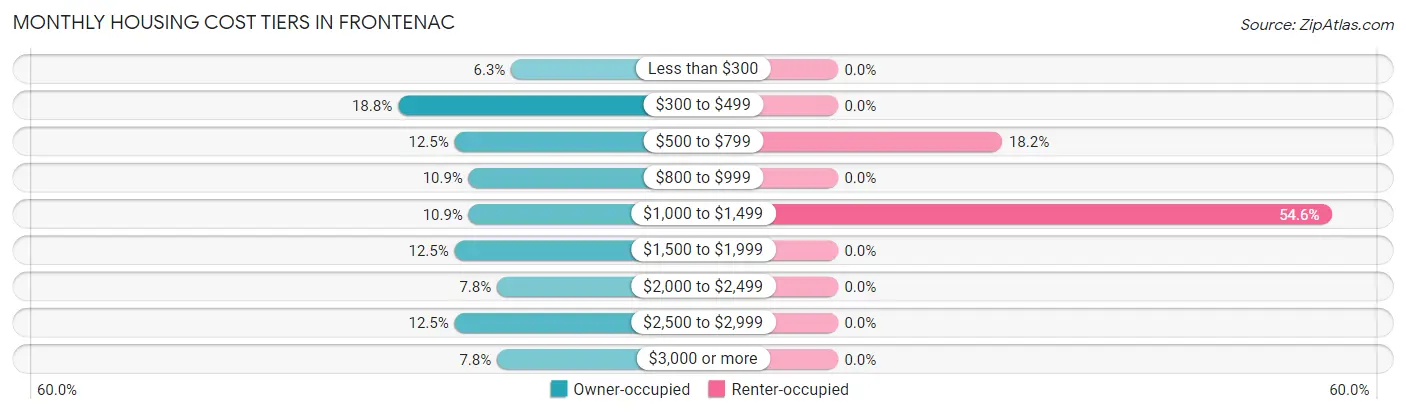
| Monthly Cost | Owner-occupied | Renter-occupied |
| Less than $300 | 4 (6.2%) | 0 (0.0%) |
| $300 to $499 | 12 (18.8%) | 0 (0.0%) |
| $500 to $799 | 8 (12.5%) | 2 (18.2%) |
| $800 to $999 | 7 (10.9%) | 0 (0.0%) |
| $1,000 to $1,499 | 7 (10.9%) | 6 (54.5%) |
| $1,500 to $1,999 | 8 (12.5%) | 0 (0.0%) |
| $2,000 to $2,499 | 5 (7.8%) | 0 (0.0%) |
| $2,500 to $2,999 | 8 (12.5%) | 0 (0.0%) |
| $3,000 or more | 5 (7.8%) | 0 (0.0%) |
| Total | 64 (100.0%) | 11 (100.0%) |
Physical Housing Characteristics in Frontenac
Housing Structures in Frontenac
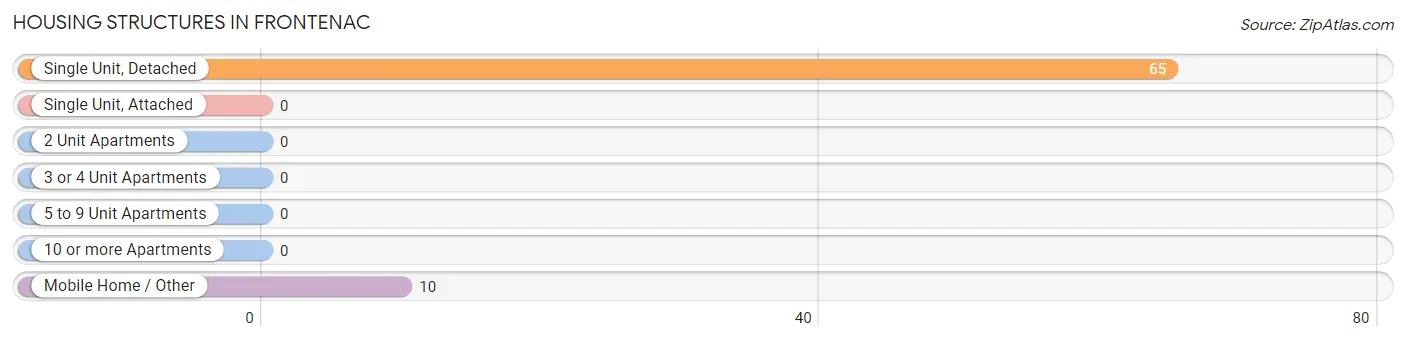
| Structure Type | # Housing Units | % Housing Units |
| Single Unit, Detached | 65 | 86.7% |
| Single Unit, Attached | 0 | 0.0% |
| 2 Unit Apartments | 0 | 0.0% |
| 3 or 4 Unit Apartments | 0 | 0.0% |
| 5 to 9 Unit Apartments | 0 | 0.0% |
| 10 or more Apartments | 0 | 0.0% |
| Mobile Home / Other | 10 | 13.3% |
| Total | 75 | 100.0% |
Housing Structures by Occupancy in Frontenac
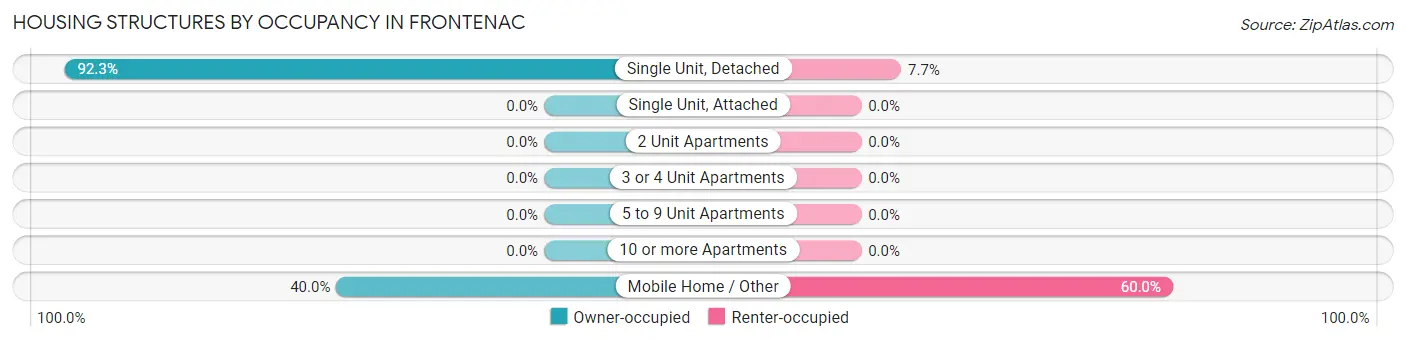
| Structure Type | Owner-occupied | Renter-occupied |
| Single Unit, Detached | 60 (92.3%) | 5 (7.7%) |
| Single Unit, Attached | 0 (0.0%) | 0 (0.0%) |
| 2 Unit Apartments | 0 (0.0%) | 0 (0.0%) |
| 3 or 4 Unit Apartments | 0 (0.0%) | 0 (0.0%) |
| 5 to 9 Unit Apartments | 0 (0.0%) | 0 (0.0%) |
| 10 or more Apartments | 0 (0.0%) | 0 (0.0%) |
| Mobile Home / Other | 4 (40.0%) | 6 (60.0%) |
| Total | 64 (85.3%) | 11 (14.7%) |
Housing Structures by Number of Rooms in Frontenac
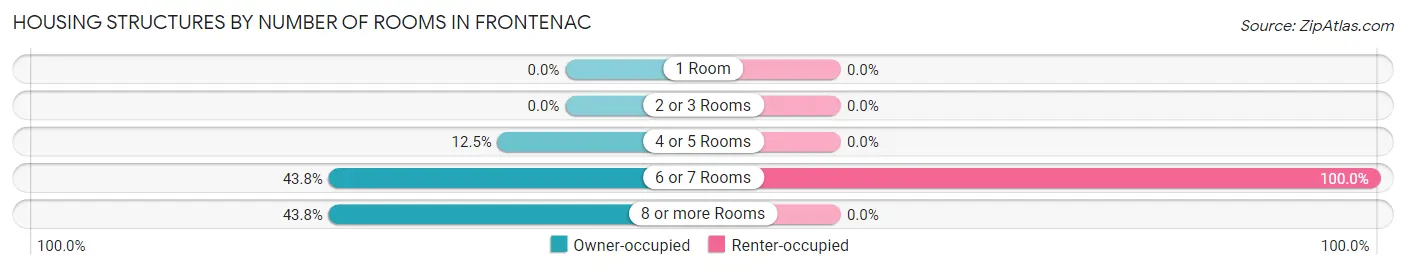
| Number of Rooms | Owner-occupied | Renter-occupied |
| 1 Room | 0 (0.0%) | 0 (0.0%) |
| 2 or 3 Rooms | 0 (0.0%) | 0 (0.0%) |
| 4 or 5 Rooms | 8 (12.5%) | 0 (0.0%) |
| 6 or 7 Rooms | 28 (43.8%) | 11 (100.0%) |
| 8 or more Rooms | 28 (43.8%) | 0 (0.0%) |
| Total | 64 (100.0%) | 11 (100.0%) |
Housing Structure by Heating Type in Frontenac
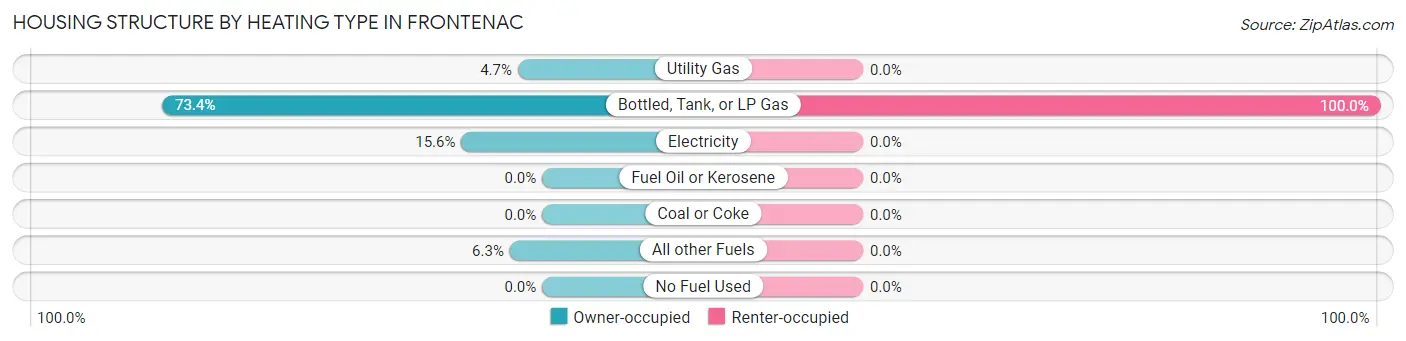
| Heating Type | Owner-occupied | Renter-occupied |
| Utility Gas | 3 (4.7%) | 0 (0.0%) |
| Bottled, Tank, or LP Gas | 47 (73.4%) | 11 (100.0%) |
| Electricity | 10 (15.6%) | 0 (0.0%) |
| Fuel Oil or Kerosene | 0 (0.0%) | 0 (0.0%) |
| Coal or Coke | 0 (0.0%) | 0 (0.0%) |
| All other Fuels | 4 (6.2%) | 0 (0.0%) |
| No Fuel Used | 0 (0.0%) | 0 (0.0%) |
| Total | 64 (100.0%) | 11 (100.0%) |
Household Vehicle Usage in Frontenac
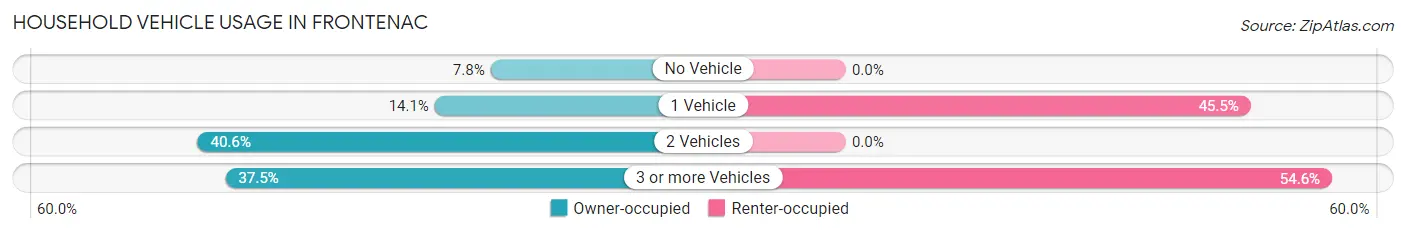
| Vehicles per Household | Owner-occupied | Renter-occupied |
| No Vehicle | 5 (7.8%) | 0 (0.0%) |
| 1 Vehicle | 9 (14.1%) | 5 (45.5%) |
| 2 Vehicles | 26 (40.6%) | 0 (0.0%) |
| 3 or more Vehicles | 24 (37.5%) | 6 (54.5%) |
| Total | 64 (100.0%) | 11 (100.0%) |
Real Estate & Mortgages in Frontenac
Real Estate and Mortgage Overview in Frontenac
| Characteristic | Without Mortgage | With Mortgage |
| Housing Units | 30 | 34 |
| Median Property Value | $164,300 | $340,000 |
| Median Household Income | $88,750 | $12 |
| Monthly Housing Costs | $491 | $5 |
| Real Estate Taxes | $1,929 | $0 |
Property Value by Mortgage Status in Frontenac
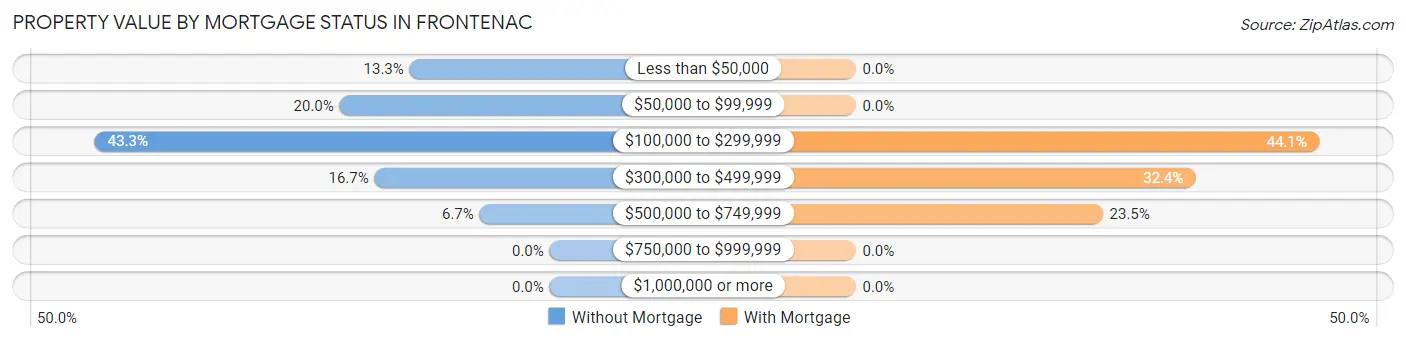
| Property Value | Without Mortgage | With Mortgage |
| Less than $50,000 | 4 (13.3%) | 0 (0.0%) |
| $50,000 to $99,999 | 6 (20.0%) | 0 (0.0%) |
| $100,000 to $299,999 | 13 (43.3%) | 15 (44.1%) |
| $300,000 to $499,999 | 5 (16.7%) | 11 (32.4%) |
| $500,000 to $749,999 | 2 (6.7%) | 8 (23.5%) |
| $750,000 to $999,999 | 0 (0.0%) | 0 (0.0%) |
| $1,000,000 or more | 0 (0.0%) | 0 (0.0%) |
| Total | 30 (100.0%) | 34 (100.0%) |
Household Income by Mortgage Status in Frontenac
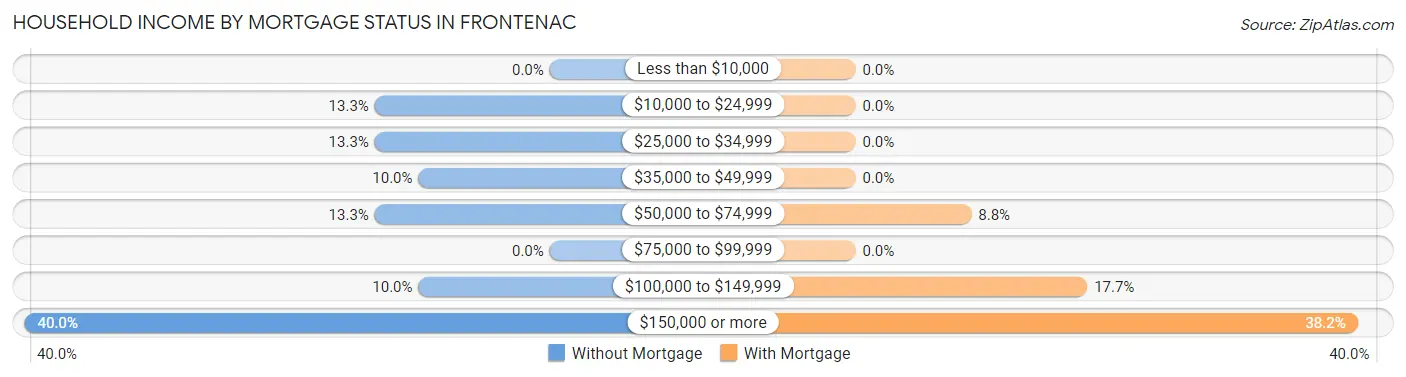
| Household Income | Without Mortgage | With Mortgage |
| Less than $10,000 | 0 (0.0%) | 0 (0.0%) |
| $10,000 to $24,999 | 4 (13.3%) | 0 (0.0%) |
| $25,000 to $34,999 | 4 (13.3%) | 0 (0.0%) |
| $35,000 to $49,999 | 3 (10.0%) | 0 (0.0%) |
| $50,000 to $74,999 | 4 (13.3%) | 3 (8.8%) |
| $75,000 to $99,999 | 0 (0.0%) | 0 (0.0%) |
| $100,000 to $149,999 | 3 (10.0%) | 6 (17.6%) |
| $150,000 or more | 12 (40.0%) | 13 (38.2%) |
| Total | 30 (100.0%) | 34 (100.0%) |
Property Value to Household Income Ratio in Frontenac
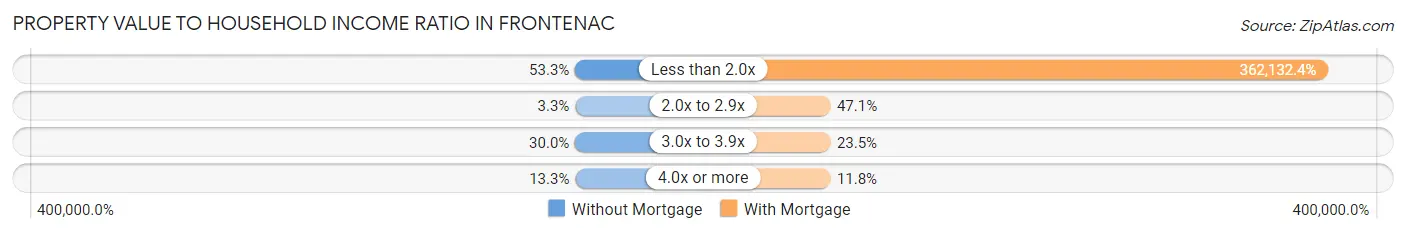
| Value-to-Income Ratio | Without Mortgage | With Mortgage |
| Less than 2.0x | 16 (53.3%) | 123,125 (362,132.3%) |
| 2.0x to 2.9x | 1 (3.3%) | 16 (47.1%) |
| 3.0x to 3.9x | 9 (30.0%) | 8 (23.5%) |
| 4.0x or more | 4 (13.3%) | 4 (11.8%) |
| Total | 30 (100.0%) | 34 (100.0%) |
Real Estate Taxes by Mortgage Status in Frontenac
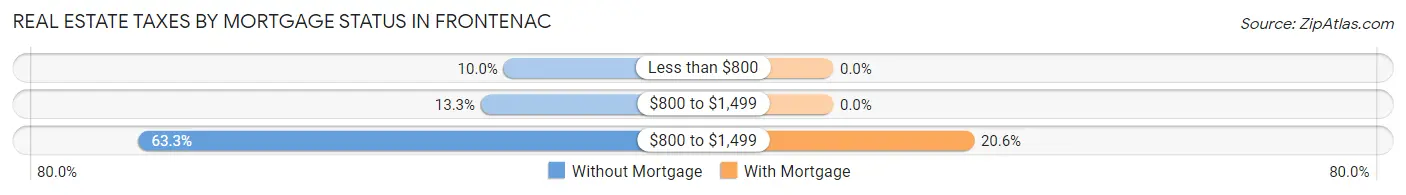
| Property Taxes | Without Mortgage | With Mortgage |
| Less than $800 | 3 (10.0%) | 0 (0.0%) |
| $800 to $1,499 | 4 (13.3%) | 0 (0.0%) |
| $800 to $1,499 | 19 (63.3%) | 7 (20.6%) |
| Total | 30 (100.0%) | 34 (100.0%) |
Health & Disability in Frontenac
Health Insurance Coverage by Age in Frontenac
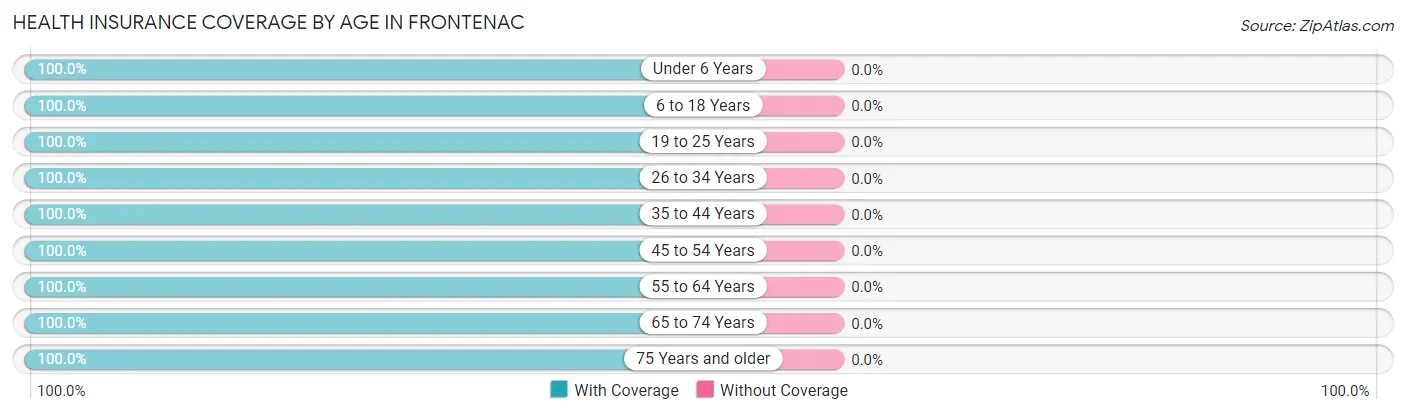
| Age Bracket | With Coverage | Without Coverage |
| Under 6 Years | 14 (100.0%) | 0 (0.0%) |
| 6 to 18 Years | 27 (100.0%) | 0 (0.0%) |
| 19 to 25 Years | 35 (100.0%) | 0 (0.0%) |
| 26 to 34 Years | 24 (100.0%) | 0 (0.0%) |
| 35 to 44 Years | 5 (100.0%) | 0 (0.0%) |
| 45 to 54 Years | 49 (100.0%) | 0 (0.0%) |
| 55 to 64 Years | 35 (100.0%) | 0 (0.0%) |
| 65 to 74 Years | 13 (100.0%) | 0 (0.0%) |
| 75 Years and older | 12 (100.0%) | 0 (0.0%) |
| Total | 214 (100.0%) | 0 (0.0%) |
Health Insurance Coverage by Citizenship Status in Frontenac
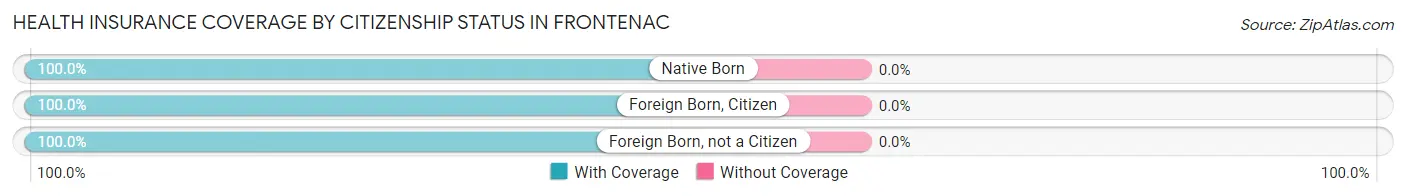
| Citizenship Status | With Coverage | Without Coverage |
| Native Born | 14 (100.0%) | 0 (0.0%) |
| Foreign Born, Citizen | 27 (100.0%) | 0 (0.0%) |
| Foreign Born, not a Citizen | 35 (100.0%) | 0 (0.0%) |
Health Insurance Coverage by Household Income in Frontenac
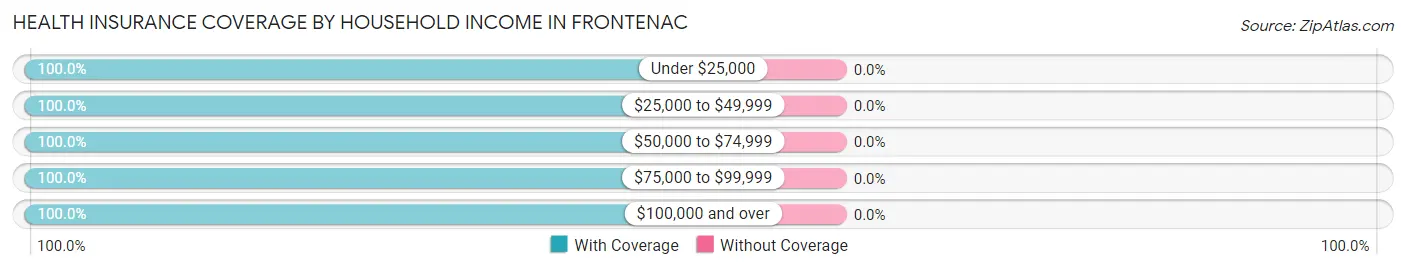
| Household Income | With Coverage | Without Coverage |
| Under $25,000 | 7 (100.0%) | 0 (0.0%) |
| $25,000 to $49,999 | 16 (100.0%) | 0 (0.0%) |
| $50,000 to $74,999 | 11 (100.0%) | 0 (0.0%) |
| $75,000 to $99,999 | 35 (100.0%) | 0 (0.0%) |
| $100,000 and over | 145 (100.0%) | 0 (0.0%) |
Public vs Private Health Insurance Coverage by Age in Frontenac
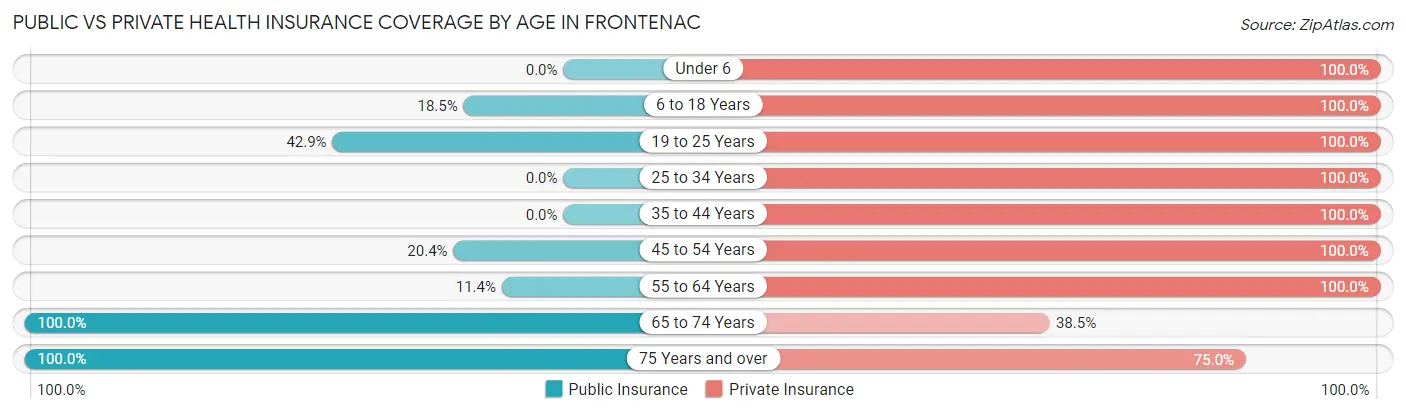
| Age Bracket | Public Insurance | Private Insurance |
| Under 6 | 0 (0.0%) | 14 (100.0%) |
| 6 to 18 Years | 5 (18.5%) | 27 (100.0%) |
| 19 to 25 Years | 15 (42.9%) | 35 (100.0%) |
| 25 to 34 Years | 0 (0.0%) | 24 (100.0%) |
| 35 to 44 Years | 0 (0.0%) | 5 (100.0%) |
| 45 to 54 Years | 10 (20.4%) | 49 (100.0%) |
| 55 to 64 Years | 4 (11.4%) | 35 (100.0%) |
| 65 to 74 Years | 13 (100.0%) | 5 (38.5%) |
| 75 Years and over | 12 (100.0%) | 9 (75.0%) |
| Total | 59 (27.6%) | 203 (94.9%) |
Disability Status by Sex by Age in Frontenac
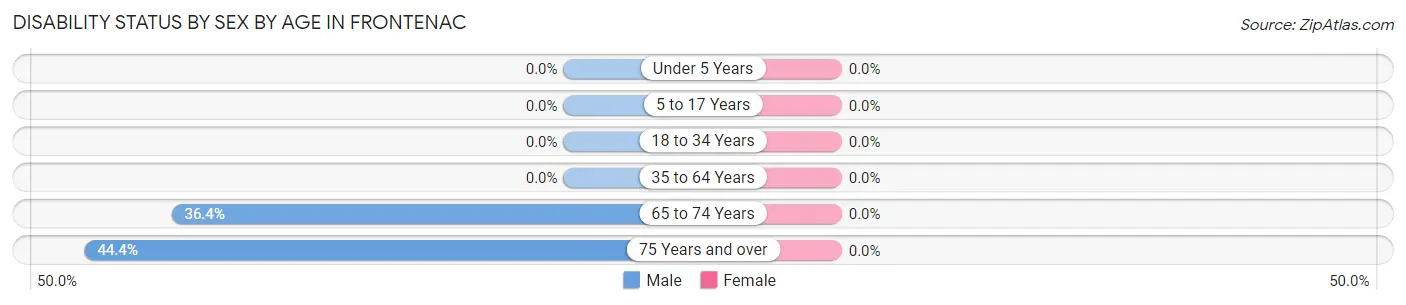
| Age Bracket | Male | Female |
| Under 5 Years | 0 (0.0%) | 0 (0.0%) |
| 5 to 17 Years | 0 (0.0%) | 0 (0.0%) |
| 18 to 34 Years | 0 (0.0%) | 0 (0.0%) |
| 35 to 64 Years | 0 (0.0%) | 0 (0.0%) |
| 65 to 74 Years | 4 (36.4%) | 0 (0.0%) |
| 75 Years and over | 4 (44.4%) | 0 (0.0%) |
Disability Class by Sex by Age in Frontenac
Disability Class: Hearing Difficulty
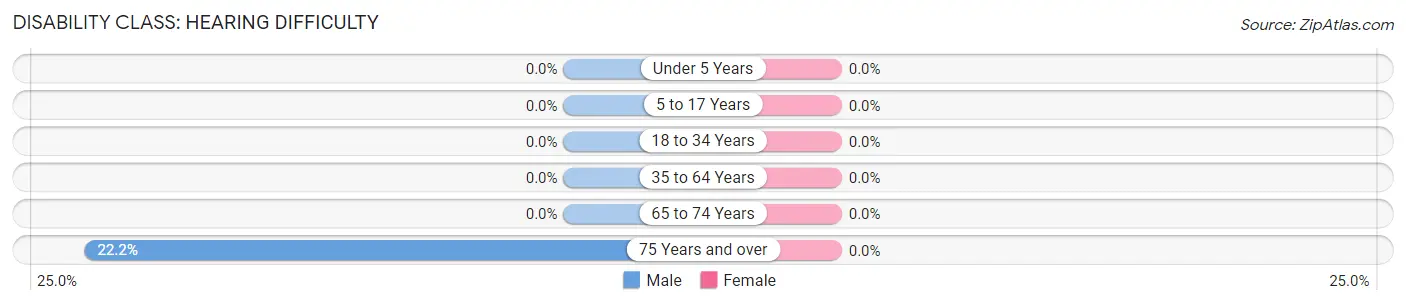
| Age Bracket | Male | Female |
| Under 5 Years | 0 (0.0%) | 0 (0.0%) |
| 5 to 17 Years | 0 (0.0%) | 0 (0.0%) |
| 18 to 34 Years | 0 (0.0%) | 0 (0.0%) |
| 35 to 64 Years | 0 (0.0%) | 0 (0.0%) |
| 65 to 74 Years | 0 (0.0%) | 0 (0.0%) |
| 75 Years and over | 2 (22.2%) | 0 (0.0%) |
Disability Class: Vision Difficulty
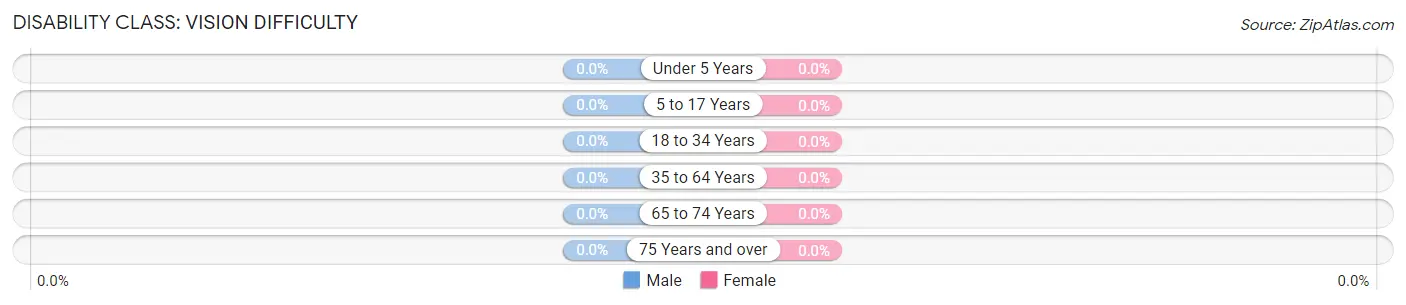
| Age Bracket | Male | Female |
| Under 5 Years | 0 (0.0%) | 0 (0.0%) |
| 5 to 17 Years | 0 (0.0%) | 0 (0.0%) |
| 18 to 34 Years | 0 (0.0%) | 0 (0.0%) |
| 35 to 64 Years | 0 (0.0%) | 0 (0.0%) |
| 65 to 74 Years | 0 (0.0%) | 0 (0.0%) |
| 75 Years and over | 0 (0.0%) | 0 (0.0%) |
Disability Class: Cognitive Difficulty
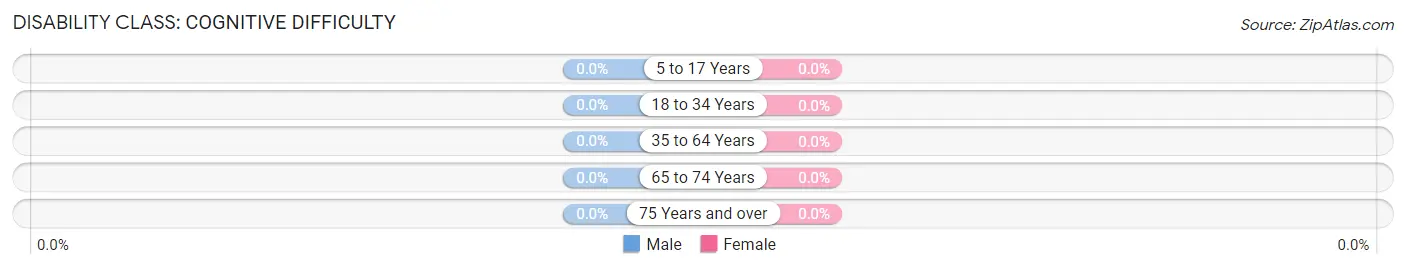
| Age Bracket | Male | Female |
| 5 to 17 Years | 0 (0.0%) | 0 (0.0%) |
| 18 to 34 Years | 0 (0.0%) | 0 (0.0%) |
| 35 to 64 Years | 0 (0.0%) | 0 (0.0%) |
| 65 to 74 Years | 0 (0.0%) | 0 (0.0%) |
| 75 Years and over | 0 (0.0%) | 0 (0.0%) |
Disability Class: Ambulatory Difficulty
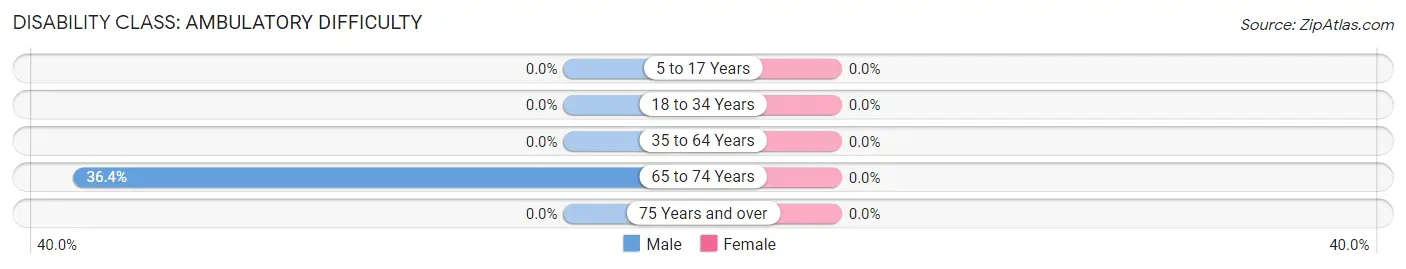
| Age Bracket | Male | Female |
| 5 to 17 Years | 0 (0.0%) | 0 (0.0%) |
| 18 to 34 Years | 0 (0.0%) | 0 (0.0%) |
| 35 to 64 Years | 0 (0.0%) | 0 (0.0%) |
| 65 to 74 Years | 4 (36.4%) | 0 (0.0%) |
| 75 Years and over | 0 (0.0%) | 0 (0.0%) |
Disability Class: Self-Care Difficulty
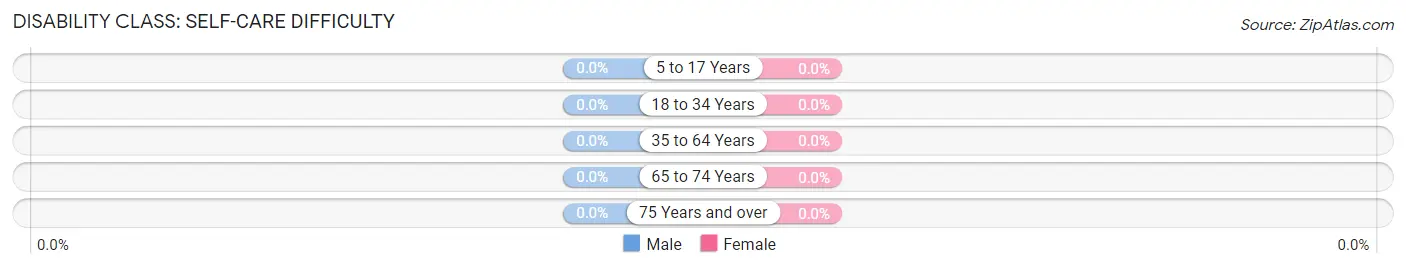
| Age Bracket | Male | Female |
| 5 to 17 Years | 0 (0.0%) | 0 (0.0%) |
| 18 to 34 Years | 0 (0.0%) | 0 (0.0%) |
| 35 to 64 Years | 0 (0.0%) | 0 (0.0%) |
| 65 to 74 Years | 0 (0.0%) | 0 (0.0%) |
| 75 Years and over | 0 (0.0%) | 0 (0.0%) |
Technology Access in Frontenac
Computing Device Access in Frontenac
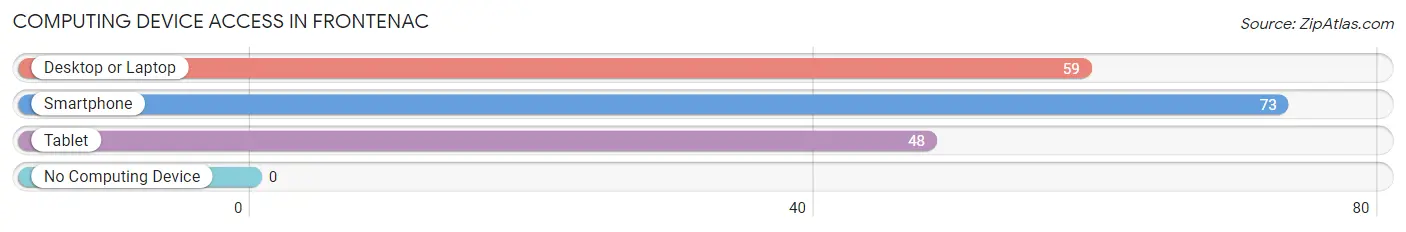
| Device Type | # Households | % Households |
| Desktop or Laptop | 59 | 78.7% |
| Smartphone | 73 | 97.3% |
| Tablet | 48 | 64.0% |
| No Computing Device | 0 | 0.0% |
| Total | 75 | 100.0% |
Internet Access in Frontenac
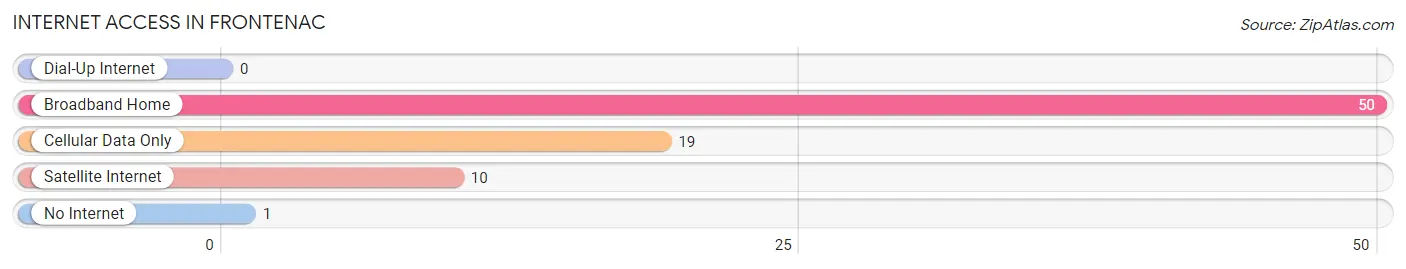
| Internet Type | # Households | % Households |
| Dial-Up Internet | 0 | 0.0% |
| Broadband Home | 50 | 66.7% |
| Cellular Data Only | 19 | 25.3% |
| Satellite Internet | 10 | 13.3% |
| No Internet | 1 | 1.3% |
| Total | 75 | 100.0% |
Frontenac Summary
Frontenac, Minnesota is a small city located in the southeastern corner of the state, in Goodhue County. It is situated on the banks of the Mississippi River, just south of Red Wing. The city has a population of approximately 2,000 people, and is part of the Twin Cities metropolitan area.
History
Frontenac was founded in 1854 by a group of settlers from the East Coast. The city was named after the French explorer, Louis de Frontenac, who explored the area in the late 1600s. The city was originally a trading post and a stop on the stagecoach line between St. Paul and Red Wing.
In the late 1800s, Frontenac became a popular tourist destination. The city was known for its beautiful scenery, and was a popular spot for fishing and hunting. The city also had a number of resorts and hotels, which attracted visitors from all over the country.
In the early 1900s, Frontenac began to experience a decline in tourism. The city was hit hard by the Great Depression, and many of the resorts and hotels closed. The city also experienced a decline in population, as many of the residents moved away in search of better economic opportunities.
Geography
Frontenac is located in the southeastern corner of Minnesota, in Goodhue County. The city is situated on the banks of the Mississippi River, just south of Red Wing. The city is surrounded by rolling hills and farmland, and is located in a rural area.
The climate in Frontenac is typical of the Midwest, with hot summers and cold winters. The average temperature in the summer is around 75 degrees Fahrenheit, and the average temperature in the winter is around 20 degrees Fahrenheit.
Economy
Frontenac’s economy is largely based on agriculture and tourism. The city is home to a number of farms, which produce a variety of crops, including corn, soybeans, and wheat. The city is also home to a number of wineries, which produce a variety of wines.
Tourism is also an important part of the economy in Frontenac. The city is home to a number of resorts and hotels, which attract visitors from all over the country. The city is also home to a number of restaurants, bars, and shops, which cater to tourists.
Demographics
As of the 2010 census, Frontenac had a population of 2,000 people. The racial makeup of the city was 97.5% White, 0.5% African American, 0.5% Native American, 0.5% Asian, and 1.0% from other races. The median household income in Frontenac was $45,000, and the median home value was $150,000.
Frontenac is a small city with a close-knit community. The city is home to a number of churches, schools, and other organizations, which help to create a sense of community. The city is also home to a number of parks and recreational areas, which provide residents with a variety of activities.
Common Questions
What is Per Capita Income in Frontenac?
Per Capita income in Frontenac is $45,964.
What is the Median Family Income in Frontenac?
Median Family Income in Frontenac is $124,688.
What is the Median Household income in Frontenac?
Median Household Income in Frontenac is $107,917.
What is Inequality or Gini Index in Frontenac?
Inequality or Gini Index in Frontenac is 0.37.
What is the Total Population of Frontenac?
Total Population of Frontenac is 214.
What is the Total Male Population of Frontenac?
Total Male Population of Frontenac is 122.
What is the Total Female Population of Frontenac?
Total Female Population of Frontenac is 92.
What is the Ratio of Males per 100 Females in Frontenac?
There are 132.61 Males per 100 Females in Frontenac.
What is the Ratio of Females per 100 Males in Frontenac?
There are 75.41 Females per 100 Males in Frontenac.
What is the Median Population Age in Frontenac?
Median Population Age in Frontenac is 47.5 Years.
What is the Average Family Size in Frontenac
Average Family Size in Frontenac is 3.5 People.
What is the Average Household Size in Frontenac
Average Household Size in Frontenac is 2.9 People.
How Large is the Labor Force in Frontenac?
There are 142 People in the Labor Forcein in Frontenac.
What is the Percentage of People in the Labor Force in Frontenac?
76.3% of People are in the Labor Force in Frontenac.