Freeport, MN Map & Demographics
Freeport Map
Freeport Overview
$54,675
PER CAPITA INCOME
$119,688
AVG FAMILY INCOME
$91,250
AVG HOUSEHOLD INCOME
19.8%
WAGE / INCOME GAP [ % ]
80.2¢/ $1
WAGE / INCOME GAP [ $ ]
0.54
INEQUALITY / GINI INDEX
822
TOTAL POPULATION
460
MALE POPULATION
362
FEMALE POPULATION
127.07
MALES / 100 FEMALES
78.70
FEMALES / 100 MALES
29.9
MEDIAN AGE
3.5
AVG FAMILY SIZE
2.9
AVG HOUSEHOLD SIZE
441
LABOR FORCE [ PEOPLE ]
79.3%
PERCENT IN LABOR FORCE
1.6%
UNEMPLOYMENT RATE
Freeport Zip Codes
Freeport Area Codes
Income in Freeport
Income Overview in Freeport
Per Capita Income in Freeport is $54,675, while median incomes of families and households are $119,688 and $91,250 respectively.
| Characteristic | Number | Measure |
| Per Capita Income | 822 | $54,675 |
| Median Family Income | 200 | $119,688 |
| Mean Family Income | 200 | $201,447 |
| Median Household Income | 288 | $91,250 |
| Mean Household Income | 288 | $155,806 |
| Income Deficit | 200 | $0 |
| Wage / Income Gap (%) | 822 | 19.77% |
| Wage / Income Gap ($) | 822 | 80.23¢ per $1 |
| Gini / Inequality Index | 822 | 0.54 |
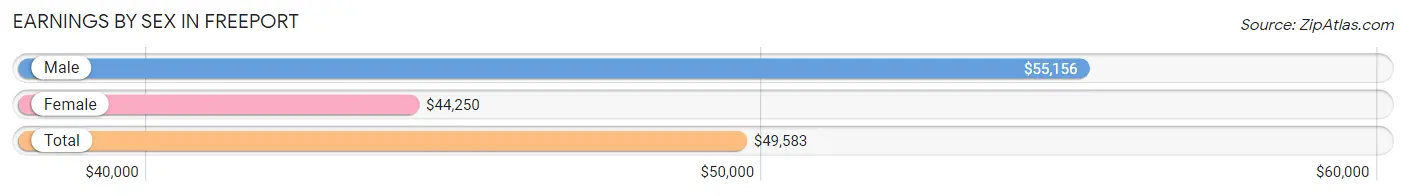
Earnings by Sex in Freeport
Average Earnings in Freeport are $49,583, $55,156 for men and $44,250 for women, a difference of 19.8%.
| Sex | Number | Average Earnings |
| Male | 246 (54.3%) | $55,156 |
| Female | 207 (45.7%) | $44,250 |
| Total | 453 (100.0%) | $49,583 |
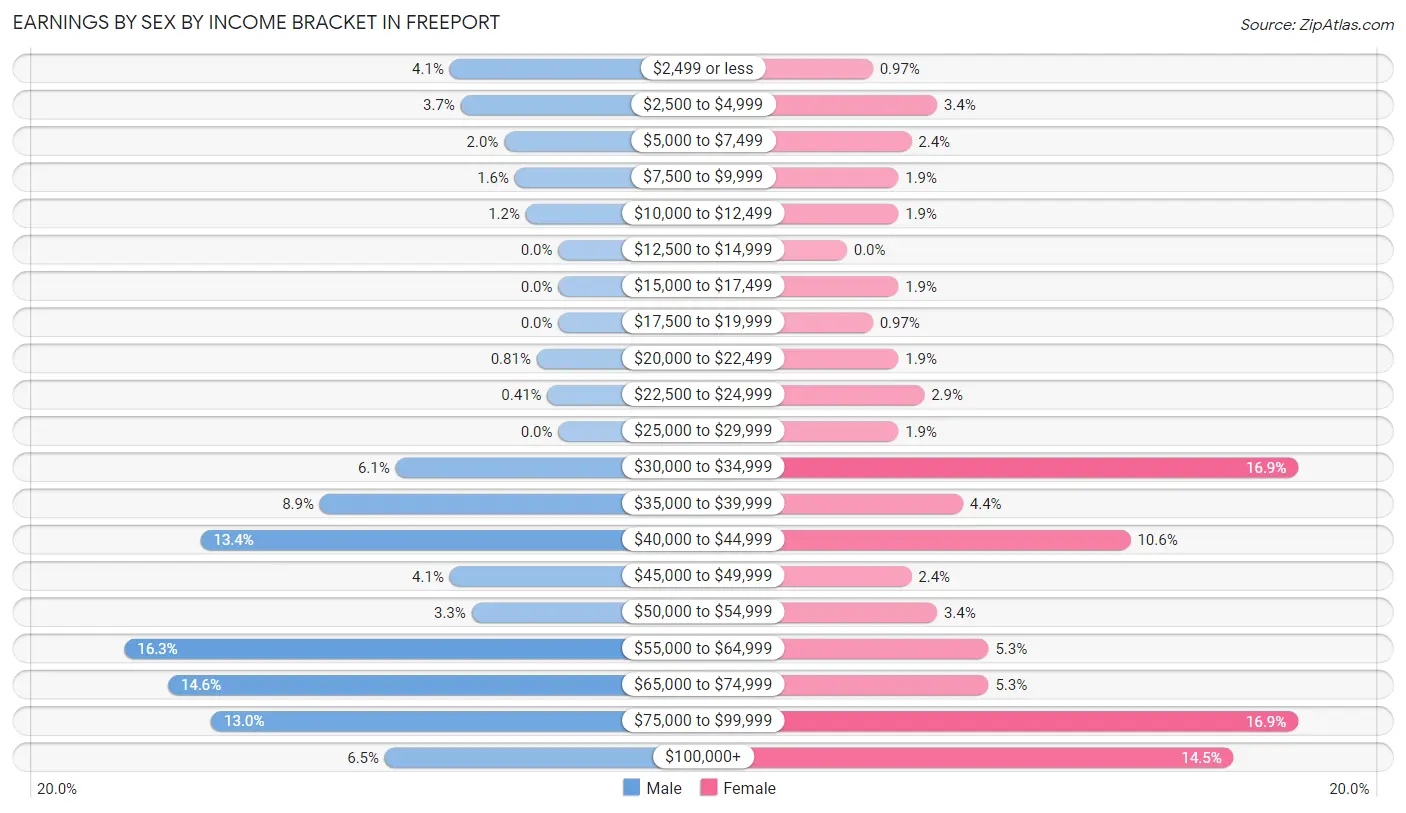
Earnings by Sex by Income Bracket in Freeport
The most common earnings brackets in Freeport are $55,000 to $64,999 for men (40 | 16.3%) and $30,000 to $34,999 for women (35 | 16.9%).
| Income | Male | Female |
| $2,499 or less | 10 (4.1%) | 2 (1.0%) |
| $2,500 to $4,999 | 9 (3.7%) | 7 (3.4%) |
| $5,000 to $7,499 | 5 (2.0%) | 5 (2.4%) |
| $7,500 to $9,999 | 4 (1.6%) | 4 (1.9%) |
| $10,000 to $12,499 | 3 (1.2%) | 4 (1.9%) |
| $12,500 to $14,999 | 0 (0.0%) | 0 (0.0%) |
| $15,000 to $17,499 | 0 (0.0%) | 4 (1.9%) |
| $17,500 to $19,999 | 0 (0.0%) | 2 (1.0%) |
| $20,000 to $22,499 | 2 (0.8%) | 4 (1.9%) |
| $22,500 to $24,999 | 1 (0.4%) | 6 (2.9%) |
| $25,000 to $29,999 | 0 (0.0%) | 4 (1.9%) |
| $30,000 to $34,999 | 15 (6.1%) | 35 (16.9%) |
| $35,000 to $39,999 | 22 (8.9%) | 9 (4.3%) |
| $40,000 to $44,999 | 33 (13.4%) | 22 (10.6%) |
| $45,000 to $49,999 | 10 (4.1%) | 5 (2.4%) |
| $50,000 to $54,999 | 8 (3.3%) | 7 (3.4%) |
| $55,000 to $64,999 | 40 (16.3%) | 11 (5.3%) |
| $65,000 to $74,999 | 36 (14.6%) | 11 (5.3%) |
| $75,000 to $99,999 | 32 (13.0%) | 35 (16.9%) |
| $100,000+ | 16 (6.5%) | 30 (14.5%) |
| Total | 246 (100.0%) | 207 (100.0%) |
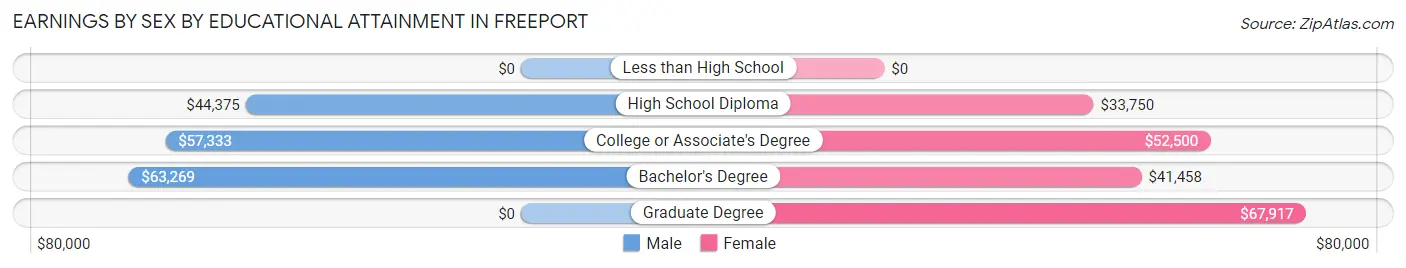
Earnings by Sex by Educational Attainment in Freeport
Average earnings in Freeport are $61,250 for men and $48,333 for women, a difference of 21.1%. Men with an educational attainment of bachelor's degree enjoy the highest average annual earnings of $63,269, while those with high school diploma education earn the least with $44,375. Women with an educational attainment of graduate degree earn the most with the average annual earnings of $67,917, while those with high school diploma education have the smallest earnings of $33,750.
| Educational Attainment | Male Income | Female Income |
| Less than High School | - | - |
| High School Diploma | $44,375 | $33,750 |
| College or Associate's Degree | $57,333 | $52,500 |
| Bachelor's Degree | $63,269 | $41,458 |
| Graduate Degree | - | - |
| Total | $61,250 | $48,333 |
Family Income in Freeport
Family Income Brackets in Freeport
According to the Freeport family income data, there are 76 families falling into the $100,000 to $149,999 income range, which is the most common income bracket and makes up 38.0% of all families.
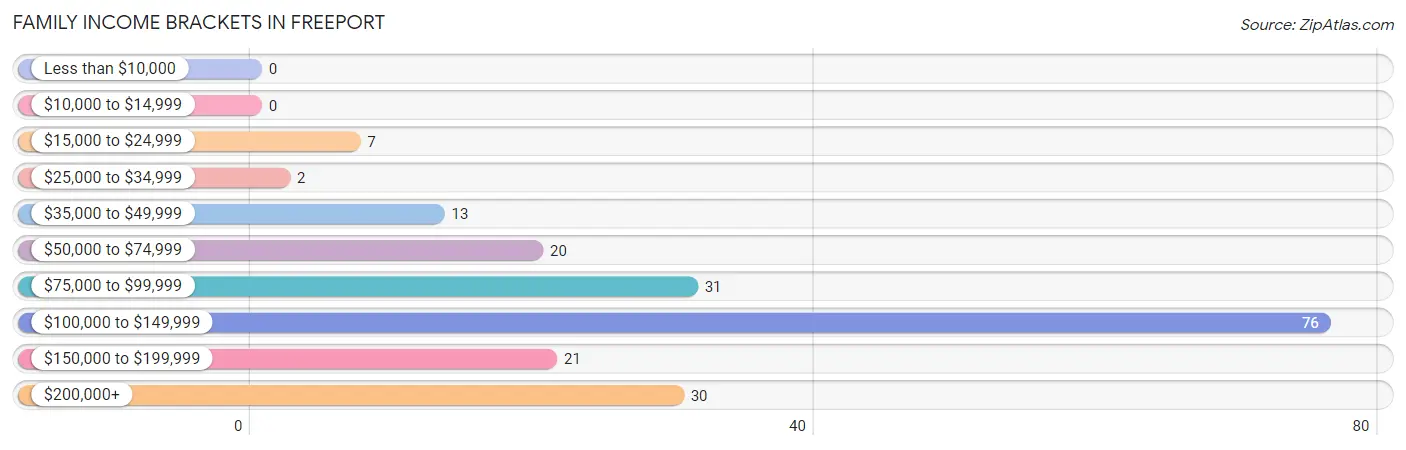
| Income Bracket | # Families | % Families |
| Less than $10,000 | 0 | 0.0% |
| $10,000 to $14,999 | 0 | 0.0% |
| $15,000 to $24,999 | 7 | 3.5% |
| $25,000 to $34,999 | 2 | 1.0% |
| $35,000 to $49,999 | 13 | 6.5% |
| $50,000 to $74,999 | 20 | 10.0% |
| $75,000 to $99,999 | 31 | 15.5% |
| $100,000 to $149,999 | 76 | 38.0% |
| $150,000 to $199,999 | 21 | 10.5% |
| $200,000+ | 30 | 15.0% |
Family Income by Famaliy Size in Freeport
3-person families (40 | 20.0%) account for the highest median family income in Freeport with $130,833 per family, while 2-person families (66 | 33.0%) have the highest median income of $52,500 per family member.
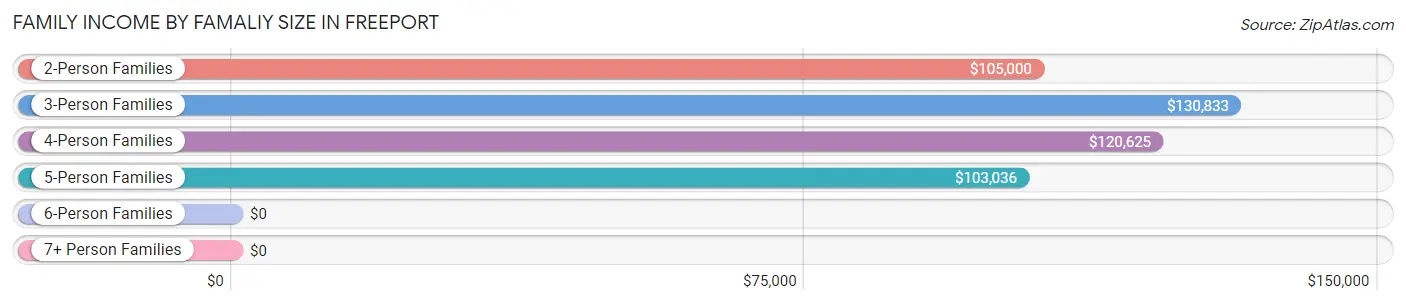
| Income Bracket | # Families | Median Income |
| 2-Person Families | 66 (33.0%) | $105,000 |
| 3-Person Families | 40 (20.0%) | $130,833 |
| 4-Person Families | 69 (34.5%) | $120,625 |
| 5-Person Families | 15 (7.5%) | $103,036 |
| 6-Person Families | 0 (0.0%) | $0 |
| 7+ Person Families | 10 (5.0%) | $0 |
| Total | 200 (100.0%) | $119,688 |
Family Income by Number of Earners in Freeport
The median family income in Freeport is $119,688, with families comprising 3+ earners (29) having the highest median family income of $139,375, while families with no earners (18) have the lowest median family income of $45,000, accounting for 14.5% and 9.0% of families, respectively.
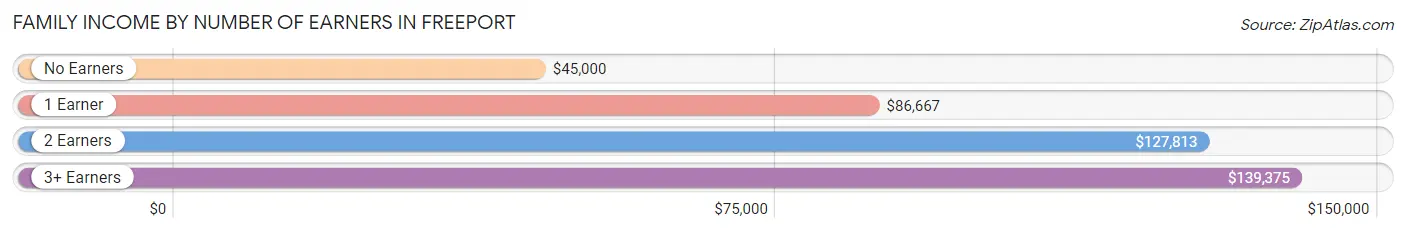
| Number of Earners | # Families | Median Income |
| No Earners | 18 (9.0%) | $45,000 |
| 1 Earner | 34 (17.0%) | $86,667 |
| 2 Earners | 119 (59.5%) | $127,813 |
| 3+ Earners | 29 (14.5%) | $139,375 |
| Total | 200 (100.0%) | $119,688 |
Household Income in Freeport
Household Income Brackets in Freeport
With 84 households falling in the category, the $100,000 to $149,999 income range is the most frequent in Freeport, accounting for 29.2% of all households. In contrast, only 6 households (2.1%) fall into the less than $10,000 income bracket, making it the least populous group.
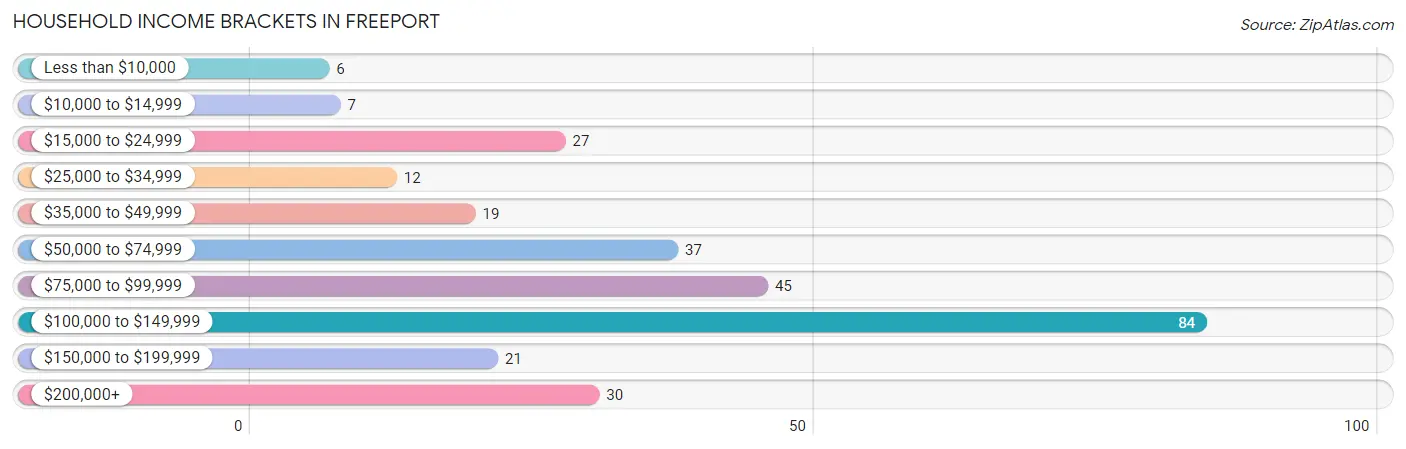
| Income Bracket | # Households | % Households |
| Less than $10,000 | 6 | 2.1% |
| $10,000 to $14,999 | 7 | 2.4% |
| $15,000 to $24,999 | 27 | 9.4% |
| $25,000 to $34,999 | 12 | 4.2% |
| $35,000 to $49,999 | 19 | 6.6% |
| $50,000 to $74,999 | 37 | 12.8% |
| $75,000 to $99,999 | 45 | 15.6% |
| $100,000 to $149,999 | 84 | 29.2% |
| $150,000 to $199,999 | 21 | 7.3% |
| $200,000+ | 30 | 10.4% |
Household Income by Householder Age in Freeport
The median household income in Freeport is $91,250, with the highest median household income of $114,375 found in the 45 to 64 years age bracket for the primary householder. A total of 65 households (22.6%) fall into this category. Meanwhile, the 65+ years age bracket for the primary householder has the lowest median household income of $32,500, with 82 households (28.5%) in this group.
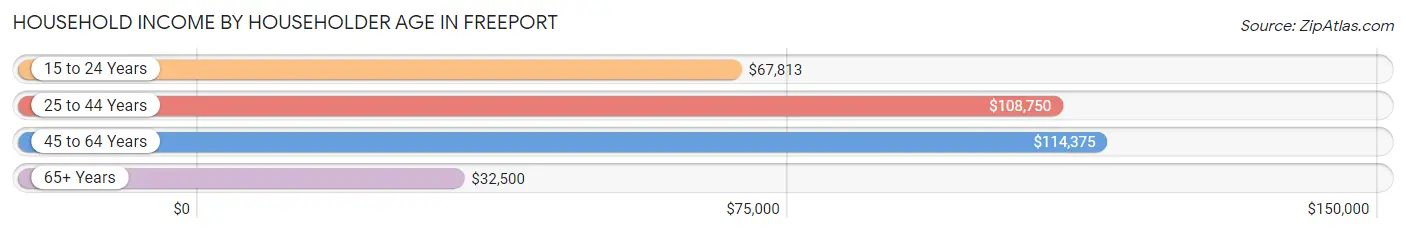
| Income Bracket | # Households | Median Income |
| 15 to 24 Years | 11 (3.8%) | $67,813 |
| 25 to 44 Years | 130 (45.1%) | $108,750 |
| 45 to 64 Years | 65 (22.6%) | $114,375 |
| 65+ Years | 82 (28.5%) | $32,500 |
| Total | 288 (100.0%) | $91,250 |
Poverty in Freeport
Income Below Poverty by Sex and Age in Freeport
With 1.5% poverty level for males and 4.7% for females among the residents of Freeport, 45 to 54 year old males and 18 to 24 year old females are the most vulnerable to poverty, with 2 males (6.9%) and 4 females (22.2%) in their respective age groups living below the poverty level.
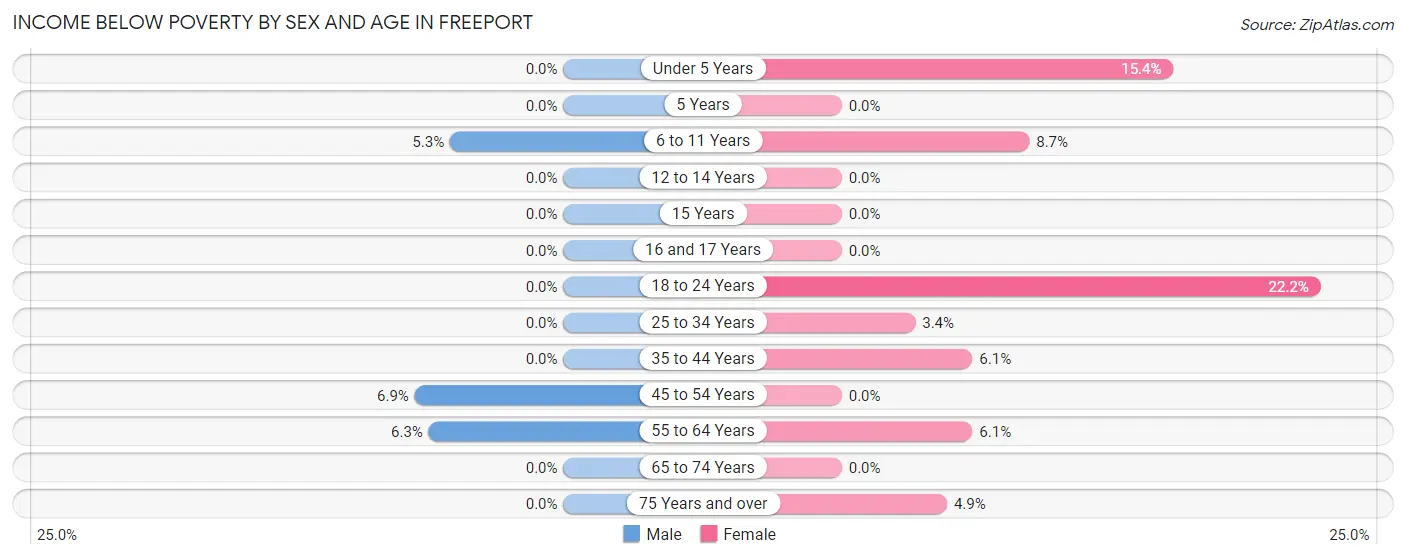
| Age Bracket | Male | Female |
| Under 5 Years | 0 (0.0%) | 2 (15.4%) |
| 5 Years | 0 (0.0%) | 0 (0.0%) |
| 6 to 11 Years | 3 (5.3%) | 2 (8.7%) |
| 12 to 14 Years | 0 (0.0%) | 0 (0.0%) |
| 15 Years | 0 (0.0%) | 0 (0.0%) |
| 16 and 17 Years | 0 (0.0%) | 0 (0.0%) |
| 18 to 24 Years | 0 (0.0%) | 4 (22.2%) |
| 25 to 34 Years | 0 (0.0%) | 3 (3.4%) |
| 35 to 44 Years | 0 (0.0%) | 2 (6.1%) |
| 45 to 54 Years | 2 (6.9%) | 0 (0.0%) |
| 55 to 64 Years | 2 (6.2%) | 2 (6.1%) |
| 65 to 74 Years | 0 (0.0%) | 0 (0.0%) |
| 75 Years and over | 0 (0.0%) | 2 (4.9%) |
| Total | 7 (1.5%) | 17 (4.7%) |
Income Above Poverty by Sex and Age in Freeport
According to the poverty statistics in Freeport, males aged under 5 years and females aged 5 years are the age groups that are most secure financially, with 100.0% of males and 100.0% of females in these age groups living above the poverty line.
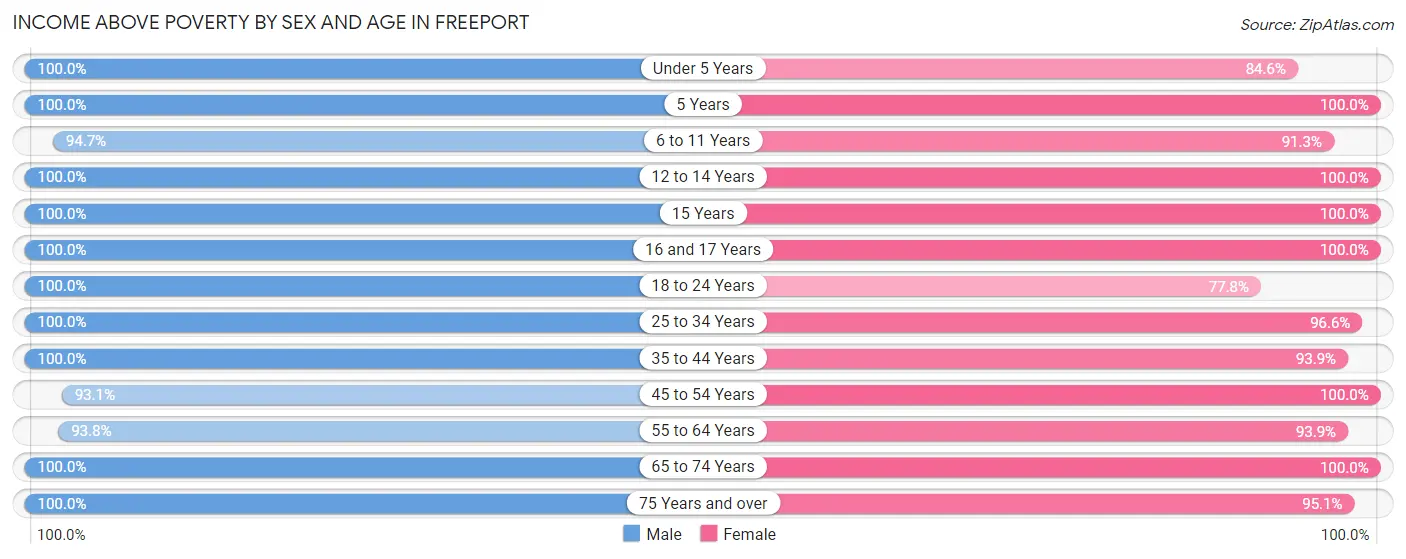
| Age Bracket | Male | Female |
| Under 5 Years | 108 (100.0%) | 11 (84.6%) |
| 5 Years | 2 (100.0%) | 32 (100.0%) |
| 6 to 11 Years | 54 (94.7%) | 21 (91.3%) |
| 12 to 14 Years | 7 (100.0%) | 16 (100.0%) |
| 15 Years | 2 (100.0%) | 6 (100.0%) |
| 16 and 17 Years | 10 (100.0%) | 4 (100.0%) |
| 18 to 24 Years | 31 (100.0%) | 14 (77.8%) |
| 25 to 34 Years | 103 (100.0%) | 85 (96.6%) |
| 35 to 44 Years | 29 (100.0%) | 31 (93.9%) |
| 45 to 54 Years | 27 (93.1%) | 29 (100.0%) |
| 55 to 64 Years | 30 (93.8%) | 31 (93.9%) |
| 65 to 74 Years | 30 (100.0%) | 26 (100.0%) |
| 75 Years and over | 20 (100.0%) | 39 (95.1%) |
| Total | 453 (98.5%) | 345 (95.3%) |
Income Below Poverty Among Married-Couple Families in Freeport
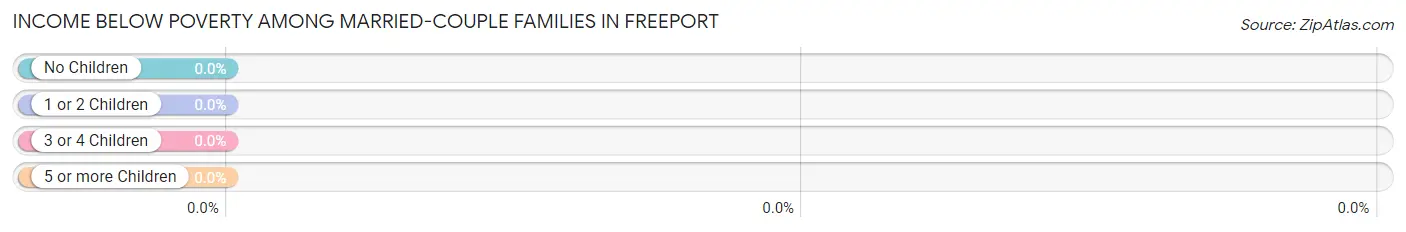
| Children | Above Poverty | Below Poverty |
| No Children | 70 (100.0%) | 0 (0.0%) |
| 1 or 2 Children | 79 (100.0%) | 0 (0.0%) |
| 3 or 4 Children | 21 (100.0%) | 0 (0.0%) |
| 5 or more Children | 2 (100.0%) | 0 (0.0%) |
| Total | 172 (100.0%) | 0 (0.0%) |
Income Below Poverty Among Single-Parent Households in Freeport
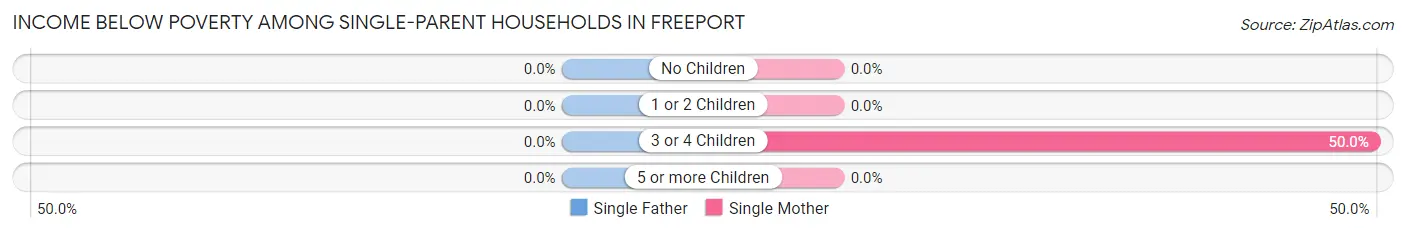
| Children | Single Father | Single Mother |
| No Children | 0 (0.0%) | 0 (0.0%) |
| 1 or 2 Children | 0 (0.0%) | 0 (0.0%) |
| 3 or 4 Children | 0 (0.0%) | 2 (50.0%) |
| 5 or more Children | 0 (0.0%) | 0 (0.0%) |
| Total | 0 (0.0%) | 2 (13.3%) |
Income Below Poverty Among Married-Couple vs Single-Parent Households in Freeport
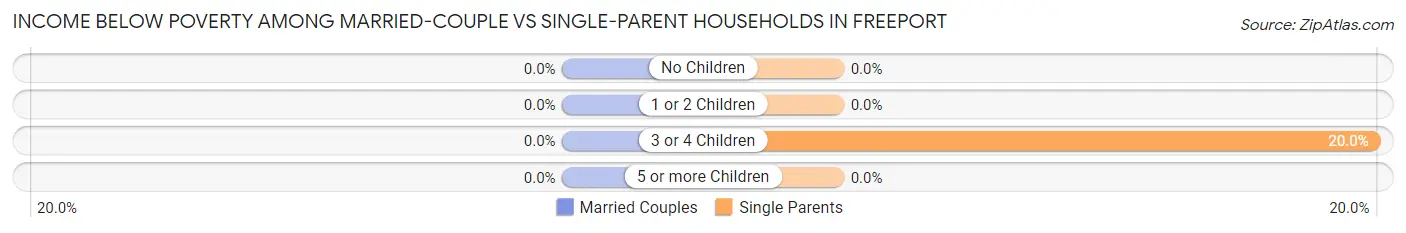
| Children | Married-Couple Families | Single-Parent Households |
| No Children | 0 (0.0%) | 0 (0.0%) |
| 1 or 2 Children | 0 (0.0%) | 0 (0.0%) |
| 3 or 4 Children | 0 (0.0%) | 2 (20.0%) |
| 5 or more Children | 0 (0.0%) | 0 (0.0%) |
| Total | 0 (0.0%) | 2 (7.1%) |
Race in Freeport
The most populous races in Freeport are White / Caucasian (717 | 87.2%), Hispanic or Latino (80 | 9.7%), and Some other Race (65 | 7.9%).
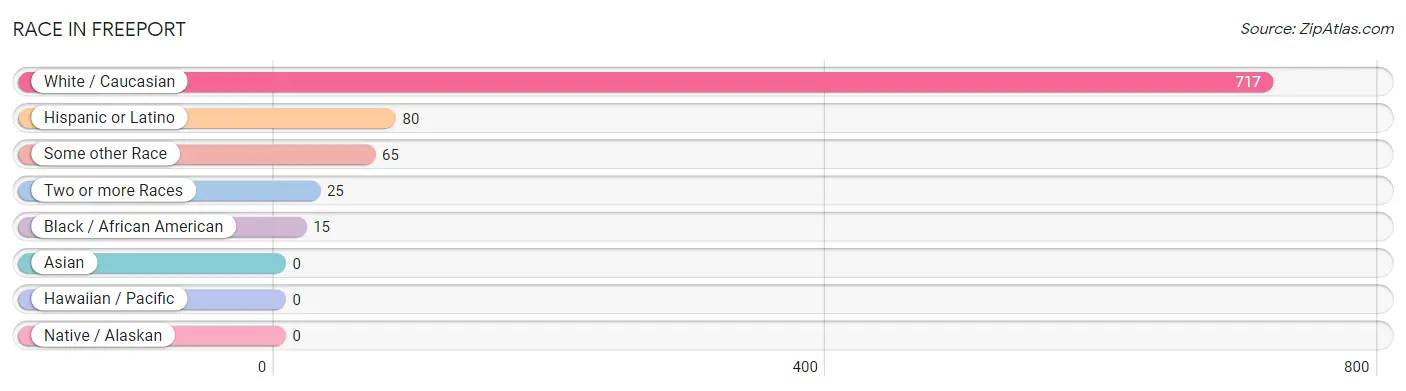
| Race | # Population | % Population |
| Asian | 0 | 0.0% |
| Black / African American | 15 | 1.8% |
| Hawaiian / Pacific | 0 | 0.0% |
| Hispanic or Latino | 80 | 9.7% |
| Native / Alaskan | 0 | 0.0% |
| White / Caucasian | 717 | 87.2% |
| Two or more Races | 25 | 3.0% |
| Some other Race | 65 | 7.9% |
| Total | 822 | 100.0% |
Ancestry in Freeport
The most populous ancestries reported in Freeport are German (540 | 65.7%), Polish (122 | 14.8%), Irish (77 | 9.4%), Central American (65 | 7.9%), and Nicaraguan (65 | 7.9%), together accounting for 105.7% of all Freeport residents.
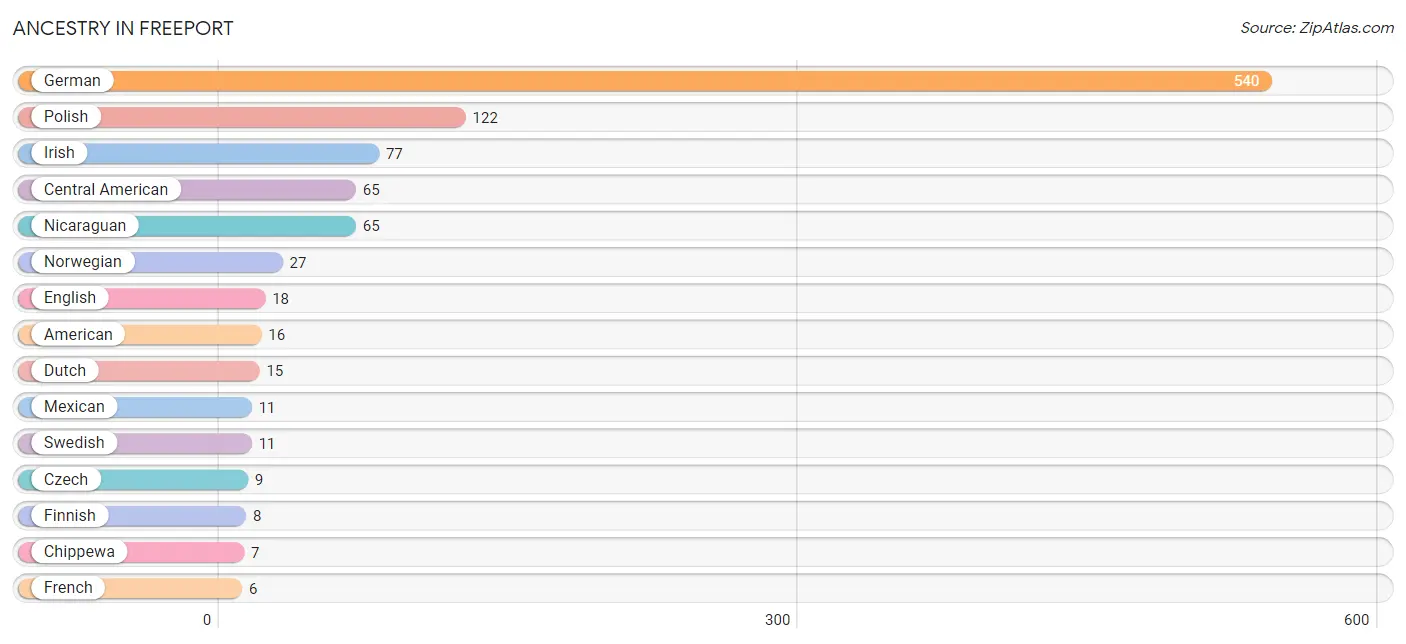
| Ancestry | # Population | % Population |
| American | 16 | 1.9% |
| Canadian | 2 | 0.2% |
| Central American | 65 | 7.9% |
| Chippewa | 7 | 0.9% |
| Czech | 9 | 1.1% |
| Czechoslovakian | 1 | 0.1% |
| Dutch | 15 | 1.8% |
| English | 18 | 2.2% |
| Finnish | 8 | 1.0% |
| French | 6 | 0.7% |
| German | 540 | 65.7% |
| Irish | 77 | 9.4% |
| Mexican | 11 | 1.3% |
| Nicaraguan | 65 | 7.9% |
| Northern European | 1 | 0.1% |
| Norwegian | 27 | 3.3% |
| Polish | 122 | 14.8% |
| Puerto Rican | 4 | 0.5% |
| Scottish | 3 | 0.4% |
| Swedish | 11 | 1.3% |
| Tlingit-Haida | 1 | 0.1% | View All 21 Rows |
Immigrants in Freeport
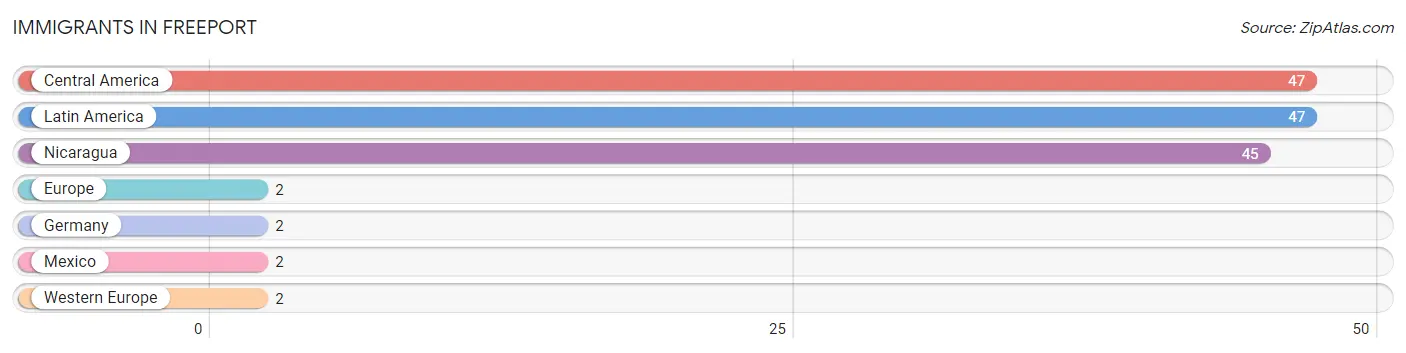
The most numerous immigrant groups reported in Freeport came from Central America (47 | 5.7%), Latin America (47 | 5.7%), Nicaragua (45 | 5.5%), Europe (2 | 0.2%), and Germany (2 | 0.2%), together accounting for 17.4% of all Freeport residents.
| Immigration Origin | # Population | % Population |
| Central America | 47 | 5.7% |
| Europe | 2 | 0.2% |
| Germany | 2 | 0.2% |
| Latin America | 47 | 5.7% |
| Mexico | 2 | 0.2% |
| Nicaragua | 45 | 5.5% |
| Western Europe | 2 | 0.2% | View All 7 Rows |
Sex and Age in Freeport
Sex and Age in Freeport
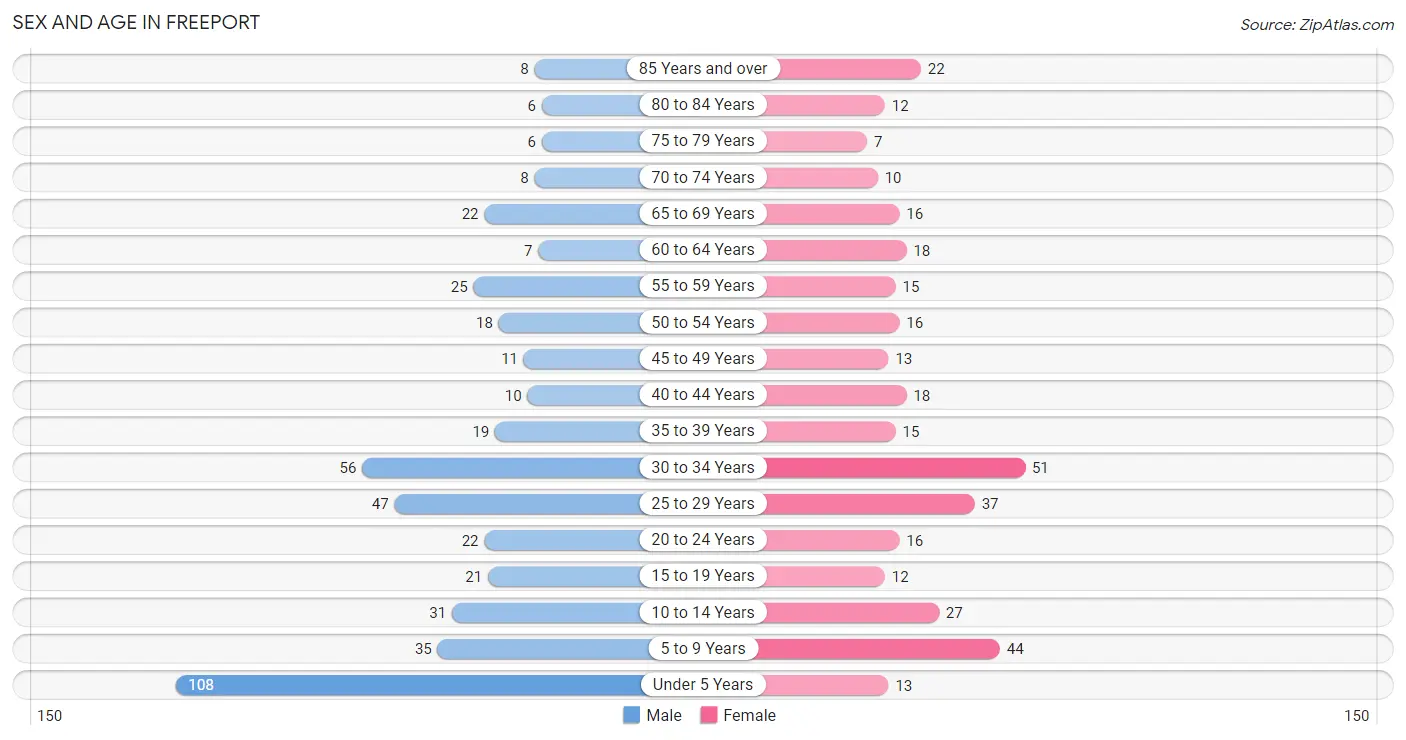
The most populous age groups in Freeport are Under 5 Years (108 | 23.5%) for men and 30 to 34 Years (51 | 14.1%) for women.
| Age Bracket | Male | Female |
| Under 5 Years | 108 (23.5%) | 13 (3.6%) |
| 5 to 9 Years | 35 (7.6%) | 44 (12.1%) |
| 10 to 14 Years | 31 (6.7%) | 27 (7.5%) |
| 15 to 19 Years | 21 (4.6%) | 12 (3.3%) |
| 20 to 24 Years | 22 (4.8%) | 16 (4.4%) |
| 25 to 29 Years | 47 (10.2%) | 37 (10.2%) |
| 30 to 34 Years | 56 (12.2%) | 51 (14.1%) |
| 35 to 39 Years | 19 (4.1%) | 15 (4.1%) |
| 40 to 44 Years | 10 (2.2%) | 18 (5.0%) |
| 45 to 49 Years | 11 (2.4%) | 13 (3.6%) |
| 50 to 54 Years | 18 (3.9%) | 16 (4.4%) |
| 55 to 59 Years | 25 (5.4%) | 15 (4.1%) |
| 60 to 64 Years | 7 (1.5%) | 18 (5.0%) |
| 65 to 69 Years | 22 (4.8%) | 16 (4.4%) |
| 70 to 74 Years | 8 (1.7%) | 10 (2.8%) |
| 75 to 79 Years | 6 (1.3%) | 7 (1.9%) |
| 80 to 84 Years | 6 (1.3%) | 12 (3.3%) |
| 85 Years and over | 8 (1.7%) | 22 (6.1%) |
| Total | 460 (100.0%) | 362 (100.0%) |
Families and Households in Freeport
Median Family Size in Freeport
The median family size in Freeport is 3.51 persons per family, with single male/father families (13 | 6.5%) accounting for the largest median family size of 3.62 persons per family. On the other hand, single female/mother families (15 | 7.5%) represent the smallest median family size with 3.07 persons per family.
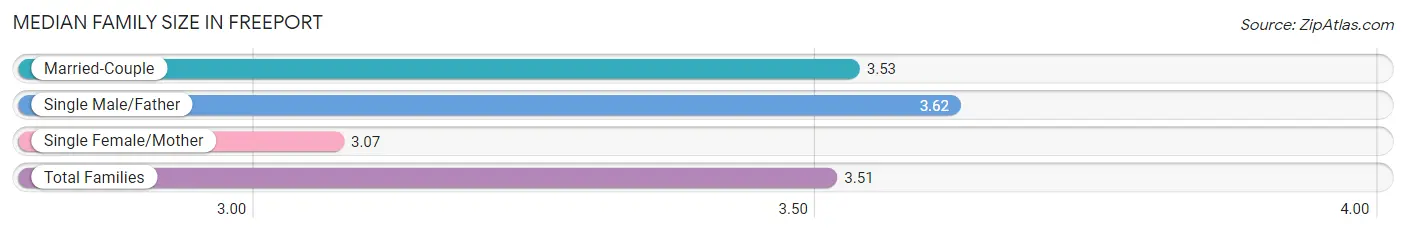
| Family Type | # Families | Family Size |
| Married-Couple | 172 (86.0%) | 3.53 |
| Single Male/Father | 13 (6.5%) | 3.62 |
| Single Female/Mother | 15 (7.5%) | 3.07 |
| Total Families | 200 (100.0%) | 3.51 |
Median Household Size in Freeport
The median household size in Freeport is 2.85 persons per household, with single male/father households (13 | 4.5%) accounting for the largest median household size of 4.31 persons per household. non-family households (88 | 30.6%) represent the smallest median household size with 1.25 persons per household.
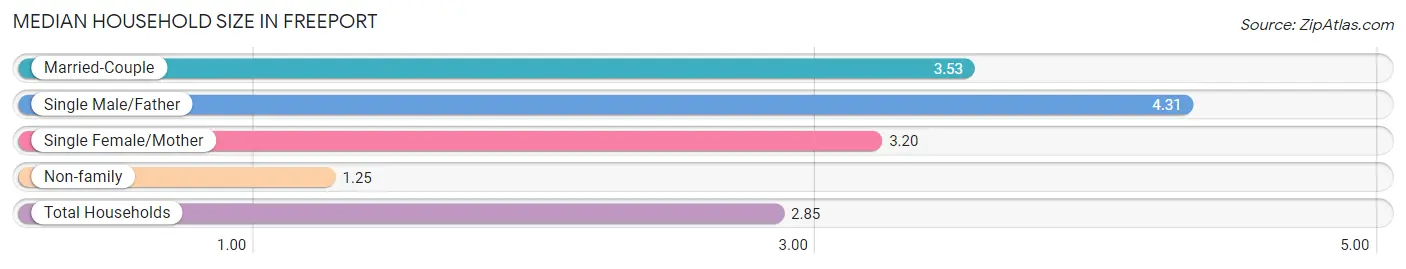
| Household Type | # Households | Household Size |
| Married-Couple | 172 (59.7%) | 3.53 |
| Single Male/Father | 13 (4.5%) | 4.31 |
| Single Female/Mother | 15 (5.2%) | 3.20 |
| Non-family | 88 (30.6%) | 1.25 |
| Total Households | 288 (100.0%) | 2.85 |
Household Size by Marriage Status in Freeport
Out of a total of 288 households in Freeport, 200 (69.4%) are family households, while 88 (30.6%) are nonfamily households. The most numerous type of family households are 2-person households, comprising 65, and the most common type of nonfamily households are 1-person households, comprising 66.
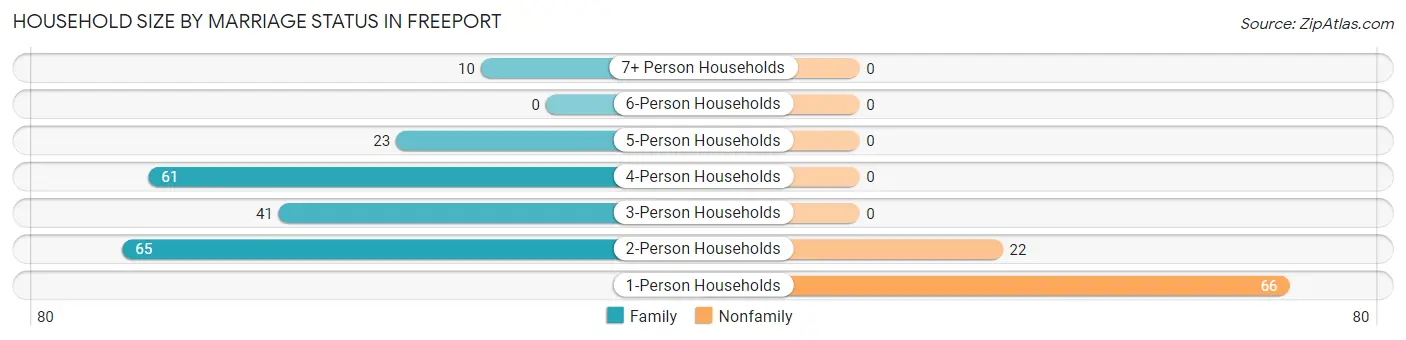
| Household Size | Family Households | Nonfamily Households |
| 1-Person Households | - | 66 (22.9%) |
| 2-Person Households | 65 (22.6%) | 22 (7.6%) |
| 3-Person Households | 41 (14.2%) | 0 (0.0%) |
| 4-Person Households | 61 (21.2%) | 0 (0.0%) |
| 5-Person Households | 23 (8.0%) | 0 (0.0%) |
| 6-Person Households | 0 (0.0%) | 0 (0.0%) |
| 7+ Person Households | 10 (3.5%) | 0 (0.0%) |
| Total | 200 (69.4%) | 88 (30.6%) |
Female Fertility in Freeport
Fertility by Age in Freeport
Average fertility rate in Freeport is 157.0 births per 1,000 women. Women in the age bracket of 20 to 34 years have the highest fertility rate with 250.0 births per 1,000 women. Women in the age bracket of 20 to 34 years acount for 100.0% of all women with births.
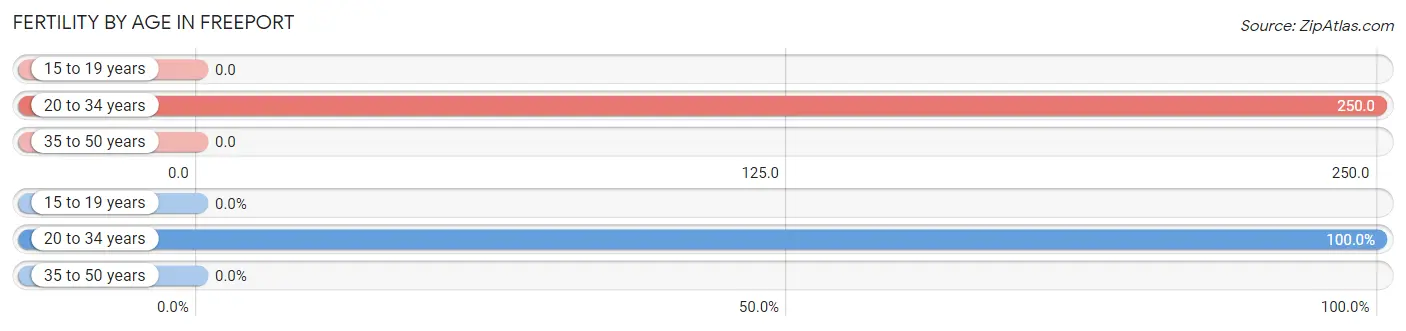
| Age Bracket | Women with Births | Births / 1,000 Women |
| 15 to 19 years | 0 (0.0%) | 0.0 |
| 20 to 34 years | 26 (100.0%) | 250.0 |
| 35 to 50 years | 0 (0.0%) | 0.0 |
| Total | 26 (100.0%) | 157.0 |
Fertility by Age by Marriage Status in Freeport
57.7% of women with births (26) in Freeport are married. The highest percentage of unmarried women with births falls into 20 to 34 years age bracket with 42.3% of them unmarried at the time of birth, while the lowest percentage of unmarried women with births belong to 20 to 34 years age bracket with 42.3% of them unmarried.
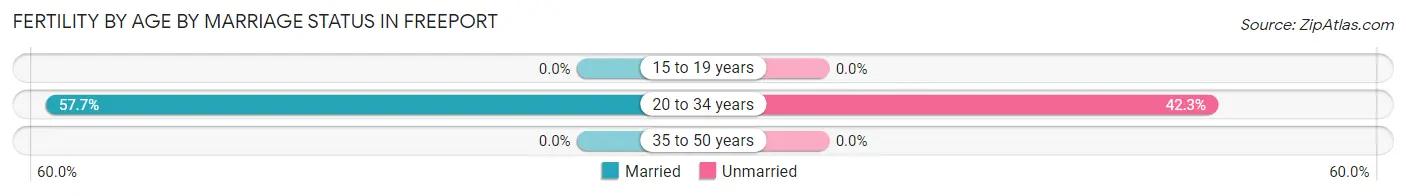
| Age Bracket | Married | Unmarried |
| 15 to 19 years | 0 (0.0%) | 0 (0.0%) |
| 20 to 34 years | 15 (57.7%) | 11 (42.3%) |
| 35 to 50 years | 0 (0.0%) | 0 (0.0%) |
| Total | 15 (57.7%) | 11 (42.3%) |
Fertility by Education in Freeport
Average fertility rate in Freeport is 157.0 births per 1,000 women. Women with the education attainment of bachelor's degree have the highest fertility rate of 341.0 births per 1,000 women, while women with the education attainment of college or associate's degree have the lowest fertility at 15.0 births per 1,000 women. Women with the education attainment of bachelor's degree represent 53.8% of all women with births.
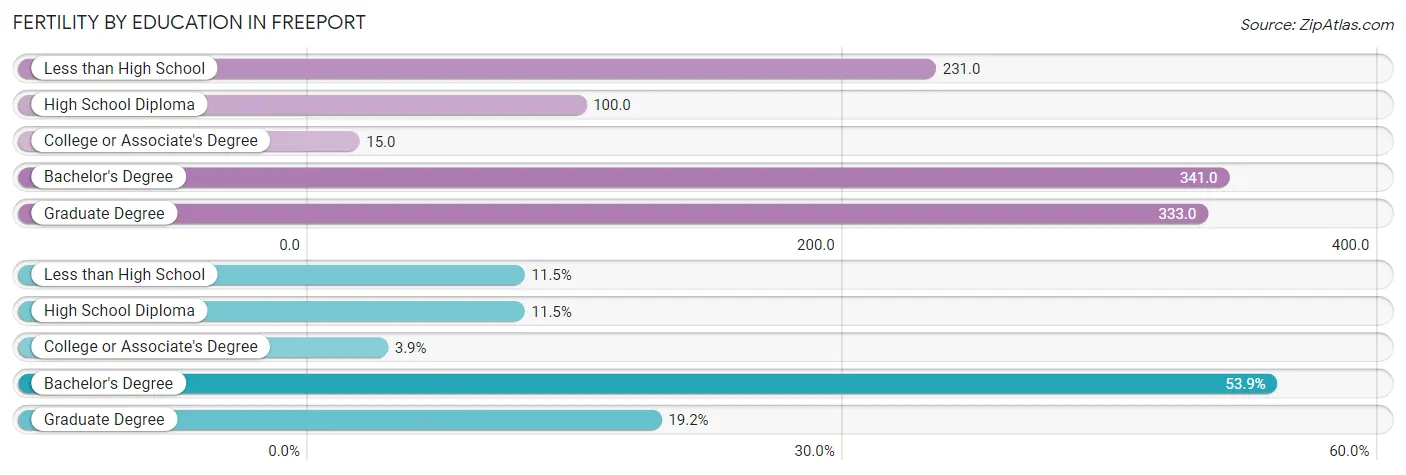
| Educational Attainment | Women with Births | Births / 1,000 Women |
| Less than High School | 3 (11.5%) | 231.0 |
| High School Diploma | 3 (11.5%) | 100.0 |
| College or Associate's Degree | 1 (3.8%) | 15.0 |
| Bachelor's Degree | 14 (53.8%) | 341.0 |
| Graduate Degree | 5 (19.2%) | 333.0 |
| Total | 26 (100.0%) | 157.0 |
Fertility by Education by Marriage Status in Freeport
42.3% of women with births in Freeport are unmarried. Women with the educational attainment of high school diploma are most likely to be married with 100.0% of them married at childbirth, while women with the educational attainment of less than high school are least likely to be married with 100.0% of them unmarried at childbirth.
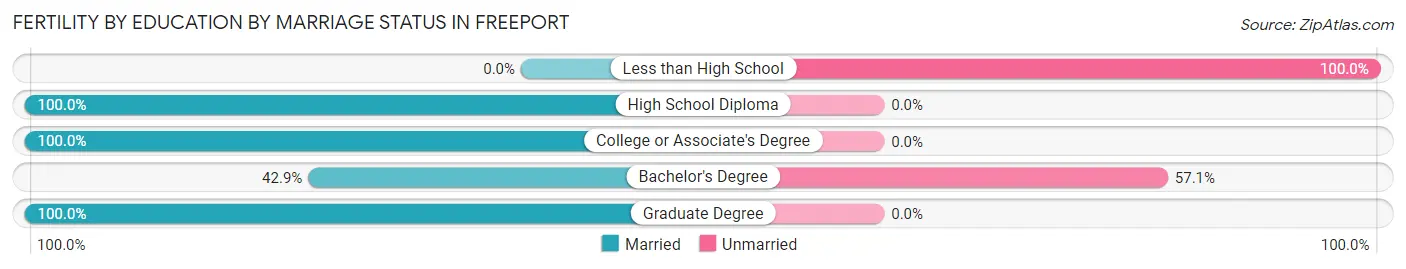
| Educational Attainment | Married | Unmarried |
| Less than High School | 0 (0.0%) | 3 (100.0%) |
| High School Diploma | 3 (100.0%) | 0 (0.0%) |
| College or Associate's Degree | 1 (100.0%) | 0 (0.0%) |
| Bachelor's Degree | 6 (42.9%) | 8 (57.1%) |
| Graduate Degree | 5 (100.0%) | 0 (0.0%) |
| Total | 15 (57.7%) | 11 (42.3%) |
Employment Characteristics in Freeport
Employment by Class of Employer in Freeport
Among the 432 employed individuals in Freeport, private company employees (324 | 75.0%), self-employed (not incorporated) (37 | 8.6%), and not-for-profit organizations (25 | 5.8%) make up the most common classes of employment.
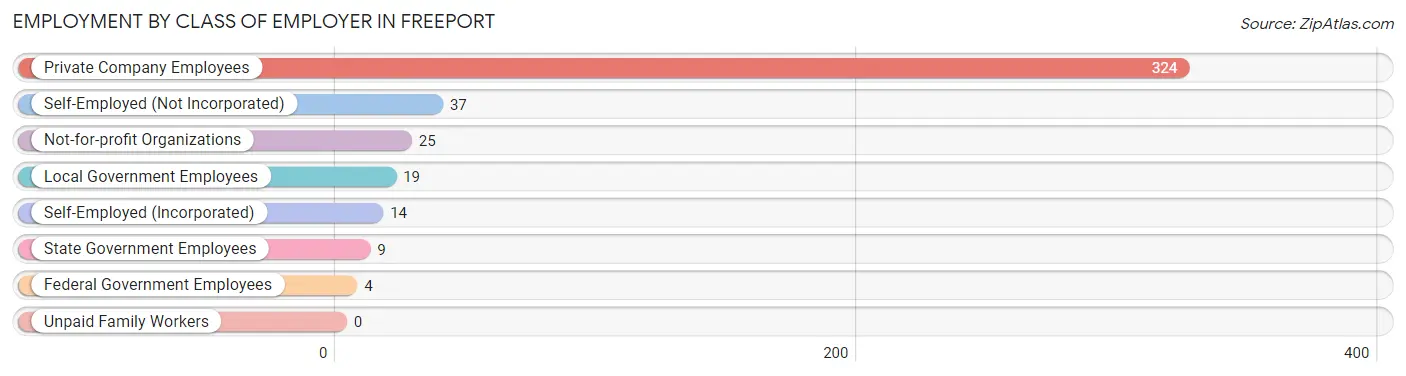
| Employer Class | # Employees | % Employees |
| Private Company Employees | 324 | 75.0% |
| Self-Employed (Incorporated) | 14 | 3.2% |
| Self-Employed (Not Incorporated) | 37 | 8.6% |
| Not-for-profit Organizations | 25 | 5.8% |
| Local Government Employees | 19 | 4.4% |
| State Government Employees | 9 | 2.1% |
| Federal Government Employees | 4 | 0.9% |
| Unpaid Family Workers | 0 | 0.0% |
| Total | 432 | 100.0% |
Employment Status by Age in Freeport
According to the labor force statistics for Freeport, out of the total population over 16 years of age (556), 79.3% or 441 individuals are in the labor force, with 1.6% or 7 of them unemployed. The age group with the highest labor force participation rate is 20 to 24 years, with 100.0% or 38 individuals in the labor force. Within the labor force, the 16 to 19 years age range has the highest percentage of unemployed individuals, with 21.1% or 4 of them being unemployed.
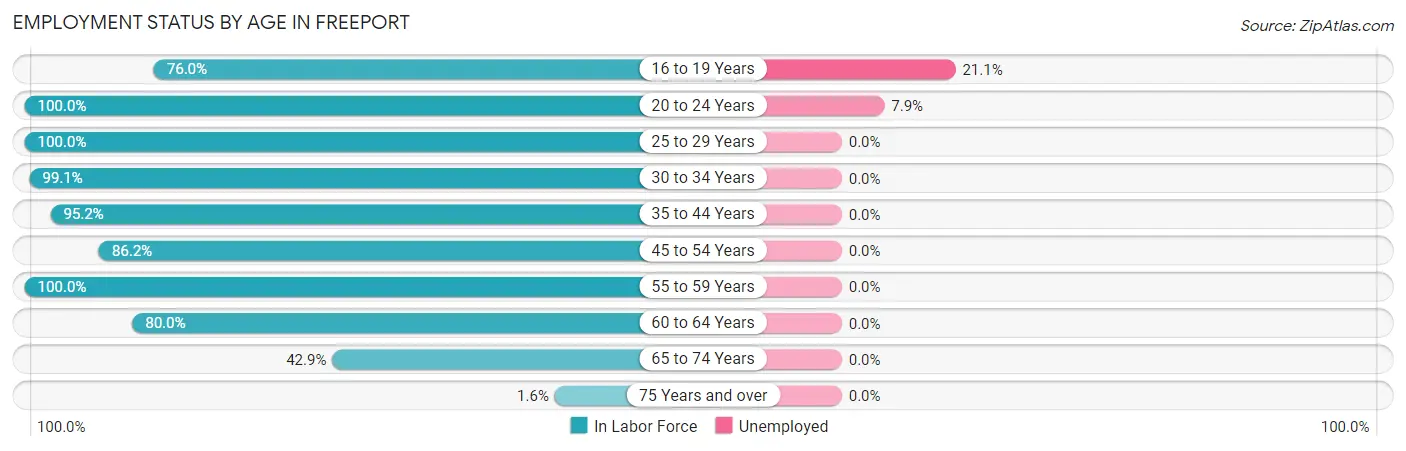
| Age Bracket | In Labor Force | Unemployed |
| 16 to 19 Years | 19 (76.0%) | 4 (21.1%) |
| 20 to 24 Years | 38 (100.0%) | 3 (7.9%) |
| 25 to 29 Years | 84 (100.0%) | 0 (0.0%) |
| 30 to 34 Years | 106 (99.1%) | 0 (0.0%) |
| 35 to 44 Years | 59 (95.2%) | 0 (0.0%) |
| 45 to 54 Years | 50 (86.2%) | 0 (0.0%) |
| 55 to 59 Years | 40 (100.0%) | 0 (0.0%) |
| 60 to 64 Years | 20 (80.0%) | 0 (0.0%) |
| 65 to 74 Years | 24 (42.9%) | 0 (0.0%) |
| 75 Years and over | 1 (1.6%) | 0 (0.0%) |
| Total | 441 (79.3%) | 7 (1.6%) |
Employment Status by Educational Attainment in Freeport
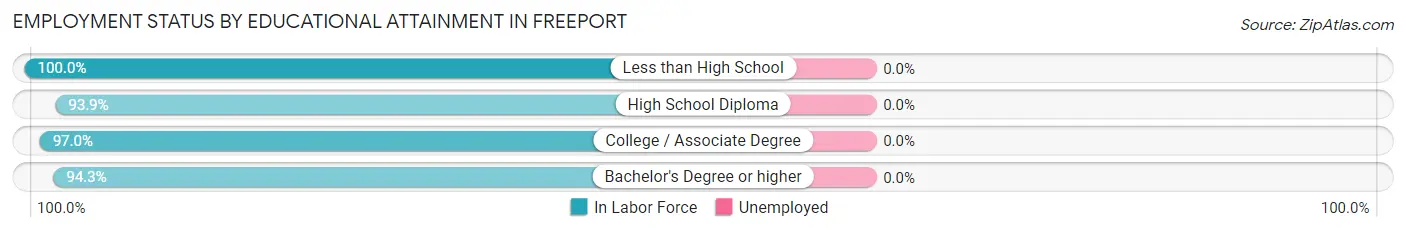
| Educational Attainment | In Labor Force | Unemployed |
| Less than High School | 5 (100.0%) | 0 (0.0%) |
| High School Diploma | 92 (93.9%) | 0 (0.0%) |
| College / Associate Degree | 163 (97.0%) | 0 (0.0%) |
| Bachelor's Degree or higher | 99 (94.3%) | 0 (0.0%) |
| Total | 359 (95.5%) | 0 (0.0%) |
Employment Occupations by Sex in Freeport
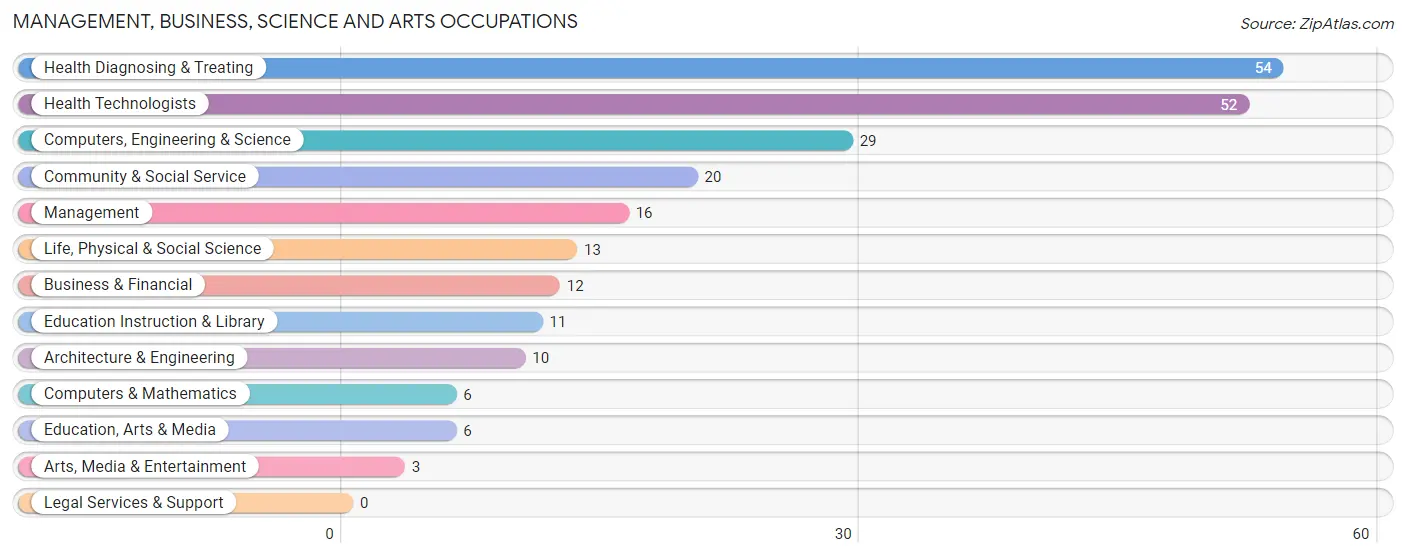
Management, Business, Science and Arts Occupations
The most common Management, Business, Science and Arts occupations in Freeport are Health Diagnosing & Treating (54 | 12.4%), Health Technologists (52 | 12.0%), Computers, Engineering & Science (29 | 6.7%), Community & Social Service (20 | 4.6%), and Management (16 | 3.7%).
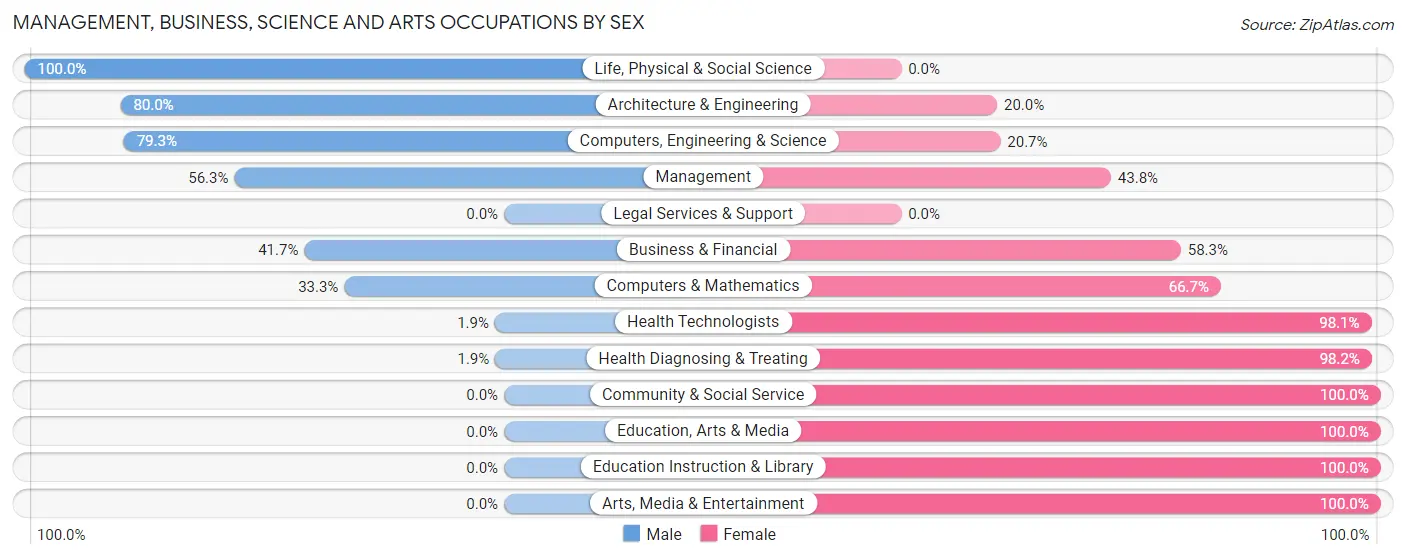
Management, Business, Science and Arts Occupations by Sex
Within the Management, Business, Science and Arts occupations in Freeport, the most male-oriented occupations are Life, Physical & Social Science (100.0%), Architecture & Engineering (80.0%), and Computers, Engineering & Science (79.3%), while the most female-oriented occupations are Community & Social Service (100.0%), Education, Arts & Media (100.0%), and Education Instruction & Library (100.0%).
| Occupation | Male | Female |
| Management | 9 (56.2%) | 7 (43.8%) |
| Business & Financial | 5 (41.7%) | 7 (58.3%) |
| Computers, Engineering & Science | 23 (79.3%) | 6 (20.7%) |
| Computers & Mathematics | 2 (33.3%) | 4 (66.7%) |
| Architecture & Engineering | 8 (80.0%) | 2 (20.0%) |
| Life, Physical & Social Science | 13 (100.0%) | 0 (0.0%) |
| Community & Social Service | 0 (0.0%) | 20 (100.0%) |
| Education, Arts & Media | 0 (0.0%) | 6 (100.0%) |
| Legal Services & Support | 0 (0.0%) | 0 (0.0%) |
| Education Instruction & Library | 0 (0.0%) | 11 (100.0%) |
| Arts, Media & Entertainment | 0 (0.0%) | 3 (100.0%) |
| Health Diagnosing & Treating | 1 (1.8%) | 53 (98.2%) |
| Health Technologists | 1 (1.9%) | 51 (98.1%) |
| Total (Category) | 38 (29.0%) | 93 (71.0%) |
| Total (Overall) | 237 (54.6%) | 197 (45.4%) |
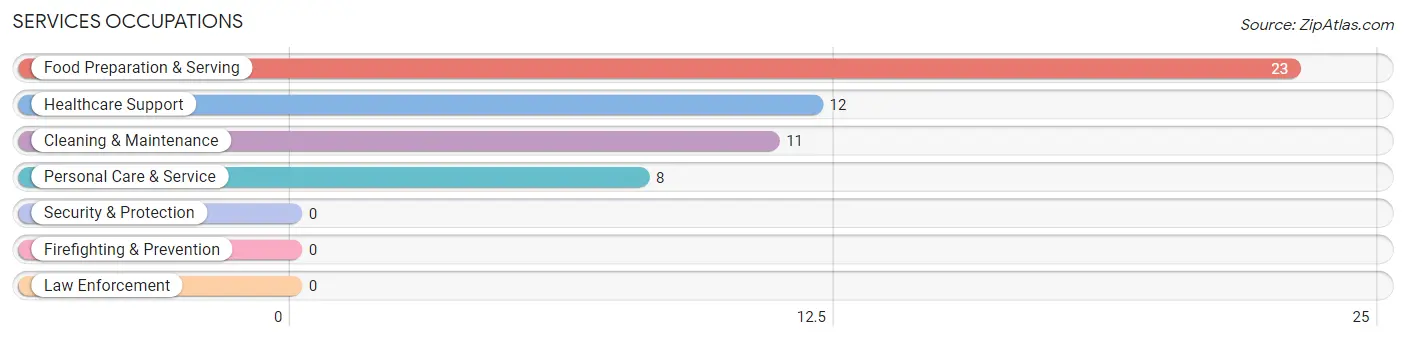
Services Occupations
The most common Services occupations in Freeport are Food Preparation & Serving (23 | 5.3%), Healthcare Support (12 | 2.8%), Cleaning & Maintenance (11 | 2.5%), and Personal Care & Service (8 | 1.8%).
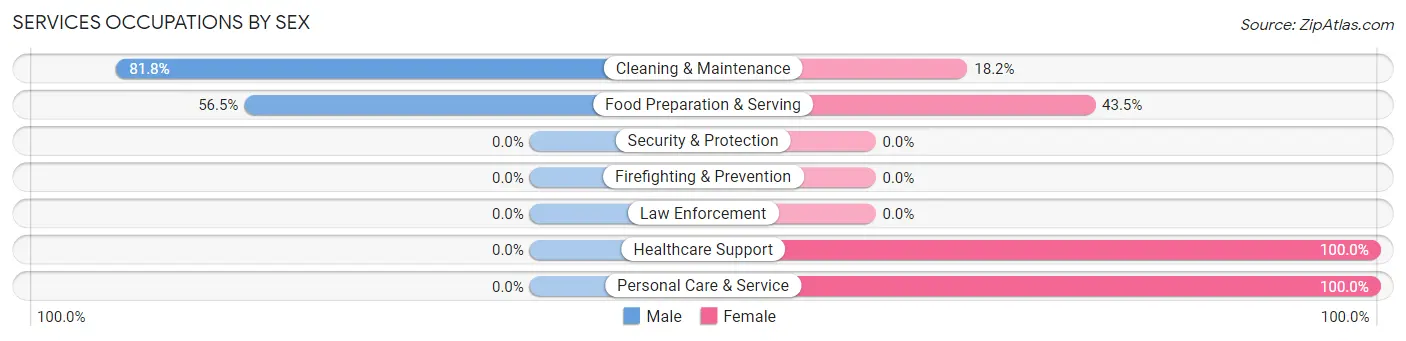
Services Occupations by Sex
Within the Services occupations in Freeport, the most male-oriented occupations are Cleaning & Maintenance (81.8%), and Food Preparation & Serving (56.5%), while the most female-oriented occupations are Healthcare Support (100.0%), Personal Care & Service (100.0%), and Food Preparation & Serving (43.5%).
| Occupation | Male | Female |
| Healthcare Support | 0 (0.0%) | 12 (100.0%) |
| Security & Protection | 0 (0.0%) | 0 (0.0%) |
| Firefighting & Prevention | 0 (0.0%) | 0 (0.0%) |
| Law Enforcement | 0 (0.0%) | 0 (0.0%) |
| Food Preparation & Serving | 13 (56.5%) | 10 (43.5%) |
| Cleaning & Maintenance | 9 (81.8%) | 2 (18.2%) |
| Personal Care & Service | 0 (0.0%) | 8 (100.0%) |
| Total (Category) | 22 (40.7%) | 32 (59.3%) |
| Total (Overall) | 237 (54.6%) | 197 (45.4%) |
Sales and Office Occupations
The most common Sales and Office occupations in Freeport are Sales & Related (47 | 10.8%), and Office & Administration (46 | 10.6%).
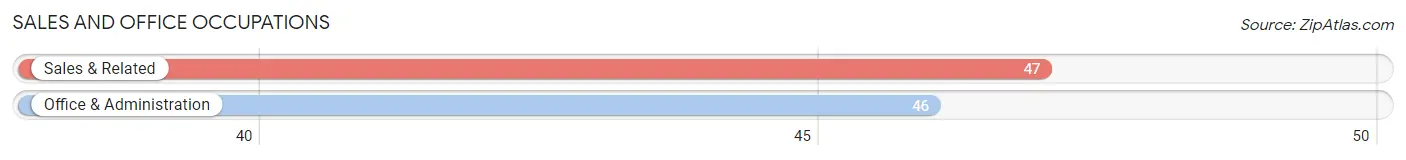
Sales and Office Occupations by Sex
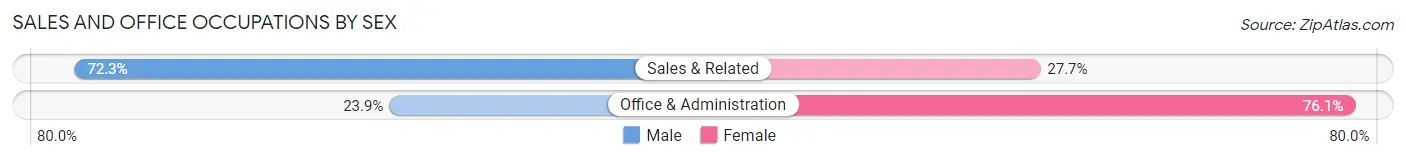
| Occupation | Male | Female |
| Sales & Related | 34 (72.3%) | 13 (27.7%) |
| Office & Administration | 11 (23.9%) | 35 (76.1%) |
| Total (Category) | 45 (48.4%) | 48 (51.6%) |
| Total (Overall) | 237 (54.6%) | 197 (45.4%) |
Natural Resources, Construction and Maintenance Occupations
The most common Natural Resources, Construction and Maintenance occupations in Freeport are Construction & Extraction (49 | 11.3%), Installation, Maintenance & Repair (20 | 4.6%), and Farming, Fishing & Forestry (18 | 4.2%).
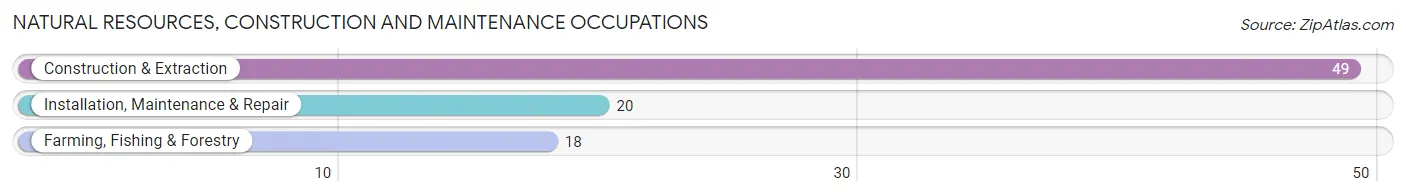
Natural Resources, Construction and Maintenance Occupations by Sex
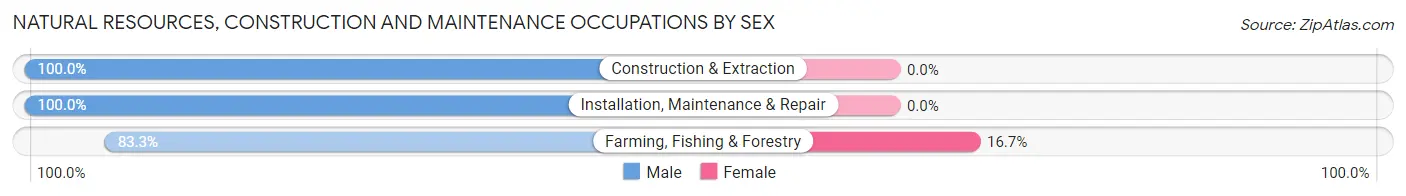
| Occupation | Male | Female |
| Farming, Fishing & Forestry | 15 (83.3%) | 3 (16.7%) |
| Construction & Extraction | 49 (100.0%) | 0 (0.0%) |
| Installation, Maintenance & Repair | 20 (100.0%) | 0 (0.0%) |
| Total (Category) | 84 (96.6%) | 3 (3.5%) |
| Total (Overall) | 237 (54.6%) | 197 (45.4%) |
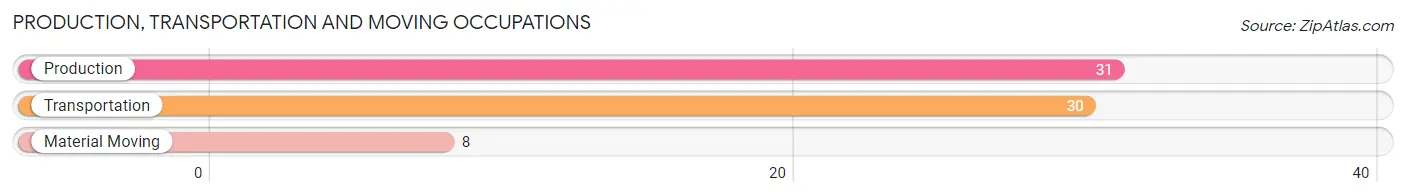
Production, Transportation and Moving Occupations
The most common Production, Transportation and Moving occupations in Freeport are Production (31 | 7.1%), Transportation (30 | 6.9%), and Material Moving (8 | 1.8%).
Production, Transportation and Moving Occupations by Sex
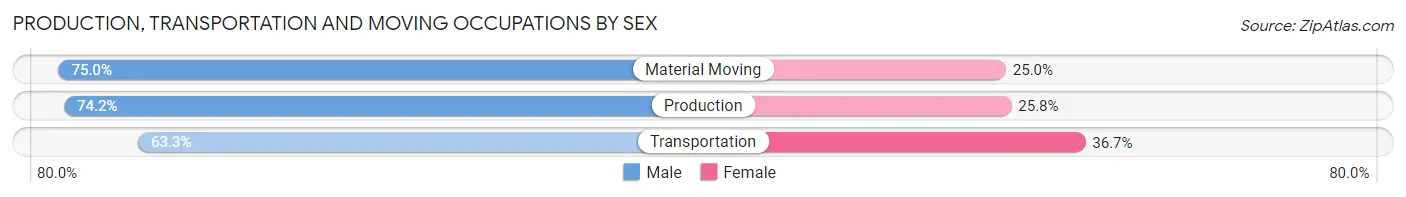
| Occupation | Male | Female |
| Production | 23 (74.2%) | 8 (25.8%) |
| Transportation | 19 (63.3%) | 11 (36.7%) |
| Material Moving | 6 (75.0%) | 2 (25.0%) |
| Total (Category) | 48 (69.6%) | 21 (30.4%) |
| Total (Overall) | 237 (54.6%) | 197 (45.4%) |
Employment Industries by Sex in Freeport
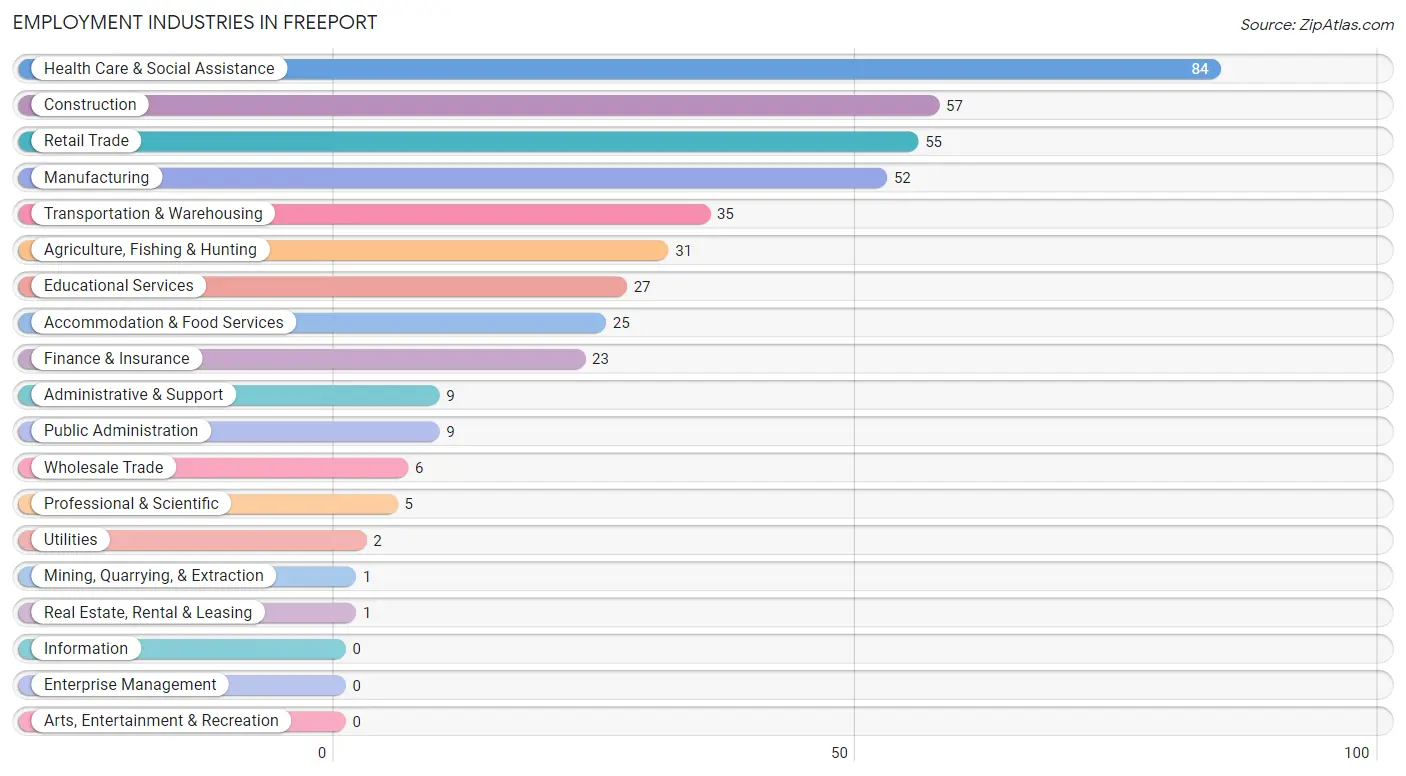
Employment Industries in Freeport
The major employment industries in Freeport include Health Care & Social Assistance (84 | 19.4%), Construction (57 | 13.1%), Retail Trade (55 | 12.7%), Manufacturing (52 | 12.0%), and Transportation & Warehousing (35 | 8.1%).
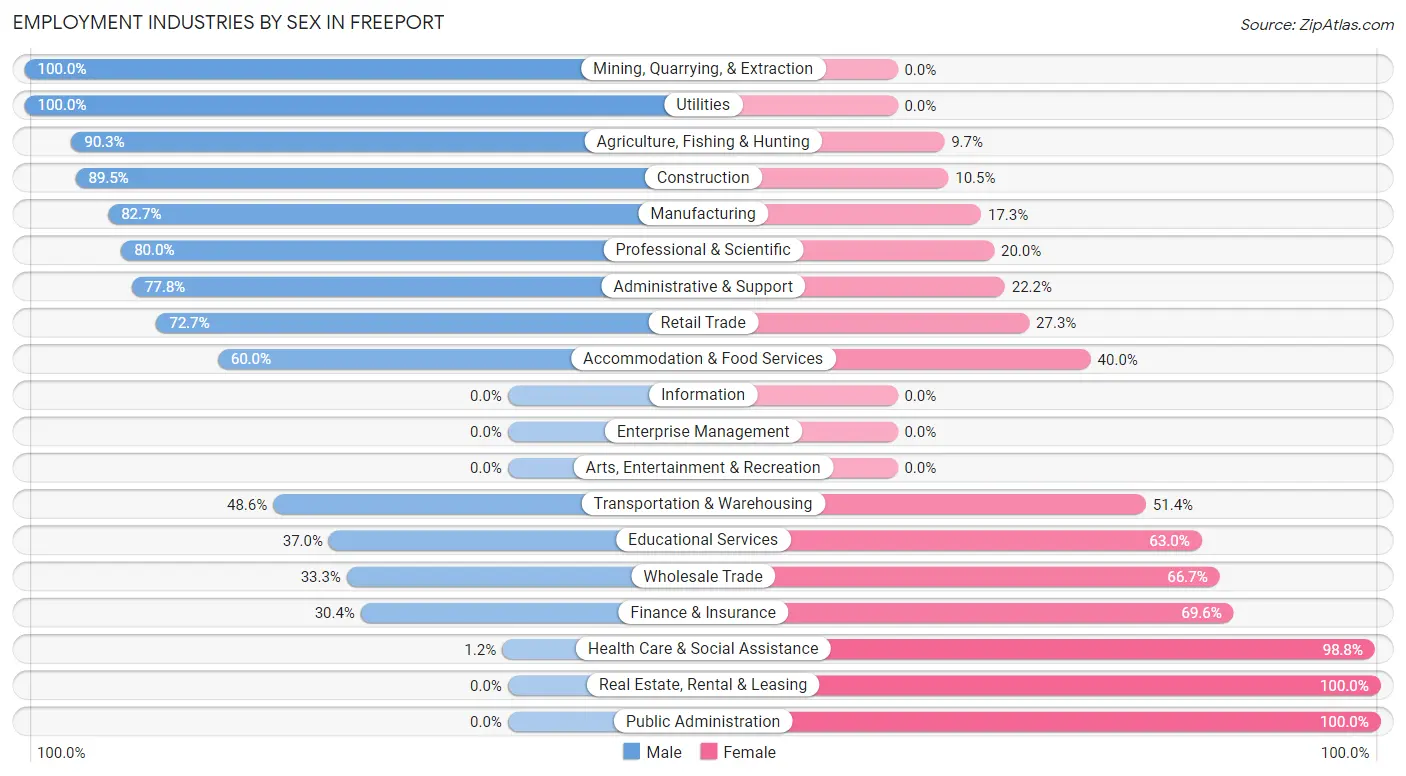
Employment Industries by Sex in Freeport
The Freeport industries that see more men than women are Mining, Quarrying, & Extraction (100.0%), Utilities (100.0%), and Agriculture, Fishing & Hunting (90.3%), whereas the industries that tend to have a higher number of women are Real Estate, Rental & Leasing (100.0%), Public Administration (100.0%), and Health Care & Social Assistance (98.8%).
| Industry | Male | Female |
| Agriculture, Fishing & Hunting | 28 (90.3%) | 3 (9.7%) |
| Mining, Quarrying, & Extraction | 1 (100.0%) | 0 (0.0%) |
| Construction | 51 (89.5%) | 6 (10.5%) |
| Manufacturing | 43 (82.7%) | 9 (17.3%) |
| Wholesale Trade | 2 (33.3%) | 4 (66.7%) |
| Retail Trade | 40 (72.7%) | 15 (27.3%) |
| Transportation & Warehousing | 17 (48.6%) | 18 (51.4%) |
| Utilities | 2 (100.0%) | 0 (0.0%) |
| Information | 0 (0.0%) | 0 (0.0%) |
| Finance & Insurance | 7 (30.4%) | 16 (69.6%) |
| Real Estate, Rental & Leasing | 0 (0.0%) | 1 (100.0%) |
| Professional & Scientific | 4 (80.0%) | 1 (20.0%) |
| Enterprise Management | 0 (0.0%) | 0 (0.0%) |
| Administrative & Support | 7 (77.8%) | 2 (22.2%) |
| Educational Services | 10 (37.0%) | 17 (63.0%) |
| Health Care & Social Assistance | 1 (1.2%) | 83 (98.8%) |
| Arts, Entertainment & Recreation | 0 (0.0%) | 0 (0.0%) |
| Accommodation & Food Services | 15 (60.0%) | 10 (40.0%) |
| Public Administration | 0 (0.0%) | 9 (100.0%) |
| Total | 237 (54.6%) | 197 (45.4%) |
Education in Freeport
School Enrollment in Freeport
The most common levels of schooling among the 170 students in Freeport are middle school (47 | 27.7%), elementary school (30 | 17.6%), and nursery / preschool (27 | 15.9%).
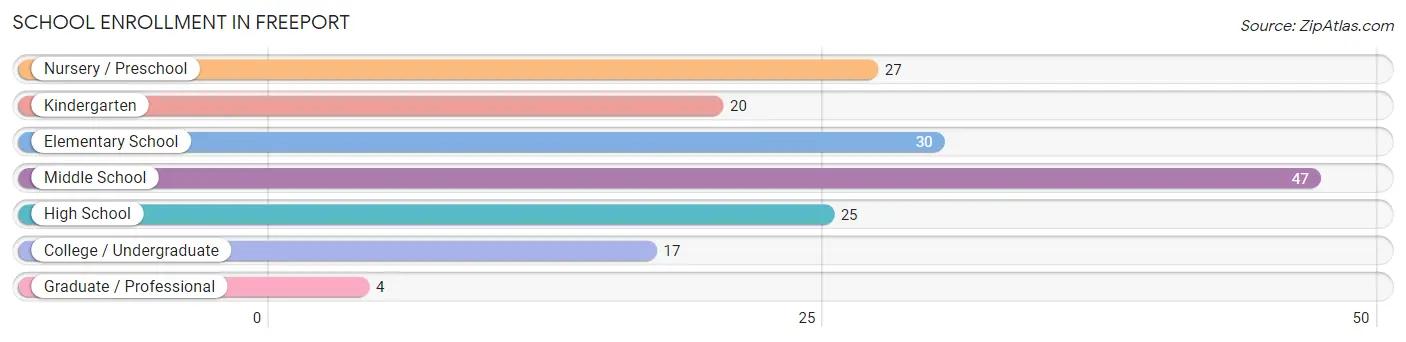
| School Level | # Students | % Students |
| Nursery / Preschool | 27 | 15.9% |
| Kindergarten | 20 | 11.8% |
| Elementary School | 30 | 17.6% |
| Middle School | 47 | 27.7% |
| High School | 25 | 14.7% |
| College / Undergraduate | 17 | 10.0% |
| Graduate / Professional | 4 | 2.4% |
| Total | 170 | 100.0% |
School Enrollment by Age by Funding Source in Freeport
Out of a total of 170 students who are enrolled in schools in Freeport, 19 (11.2%) attend a private institution, while the remaining 151 (88.8%) are enrolled in public schools. The age group of 3 to 4 year olds has the highest likelihood of being enrolled in private schools, with 1 (100.0% in the age bracket) enrolled. Conversely, the age group of 15 to 17 year olds has the lowest likelihood of being enrolled in a private school, with 20 (100.0% in the age bracket) attending a public institution.
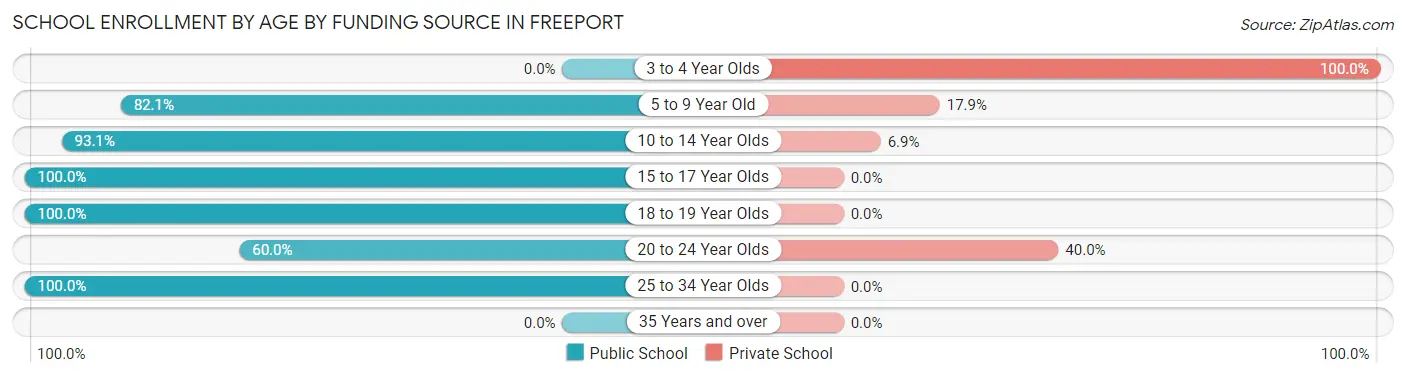
| Age Bracket | Public School | Private School |
| 3 to 4 Year Olds | 0 (0.0%) | 1 (100.0%) |
| 5 to 9 Year Old | 55 (82.1%) | 12 (17.9%) |
| 10 to 14 Year Olds | 54 (93.1%) | 4 (6.9%) |
| 15 to 17 Year Olds | 20 (100.0%) | 0 (0.0%) |
| 18 to 19 Year Olds | 3 (100.0%) | 0 (0.0%) |
| 20 to 24 Year Olds | 3 (60.0%) | 2 (40.0%) |
| 25 to 34 Year Olds | 16 (100.0%) | 0 (0.0%) |
| 35 Years and over | 0 (0.0%) | 0 (0.0%) |
| Total | 151 (88.8%) | 19 (11.2%) |
Educational Attainment by Field of Study in Freeport
Science & technology (23 | 19.0%), business (23 | 19.0%), education (16 | 13.2%), arts & humanities (14 | 11.6%), and social sciences (12 | 9.9%) are the most common fields of study among 121 individuals in Freeport who have obtained a bachelor's degree or higher.
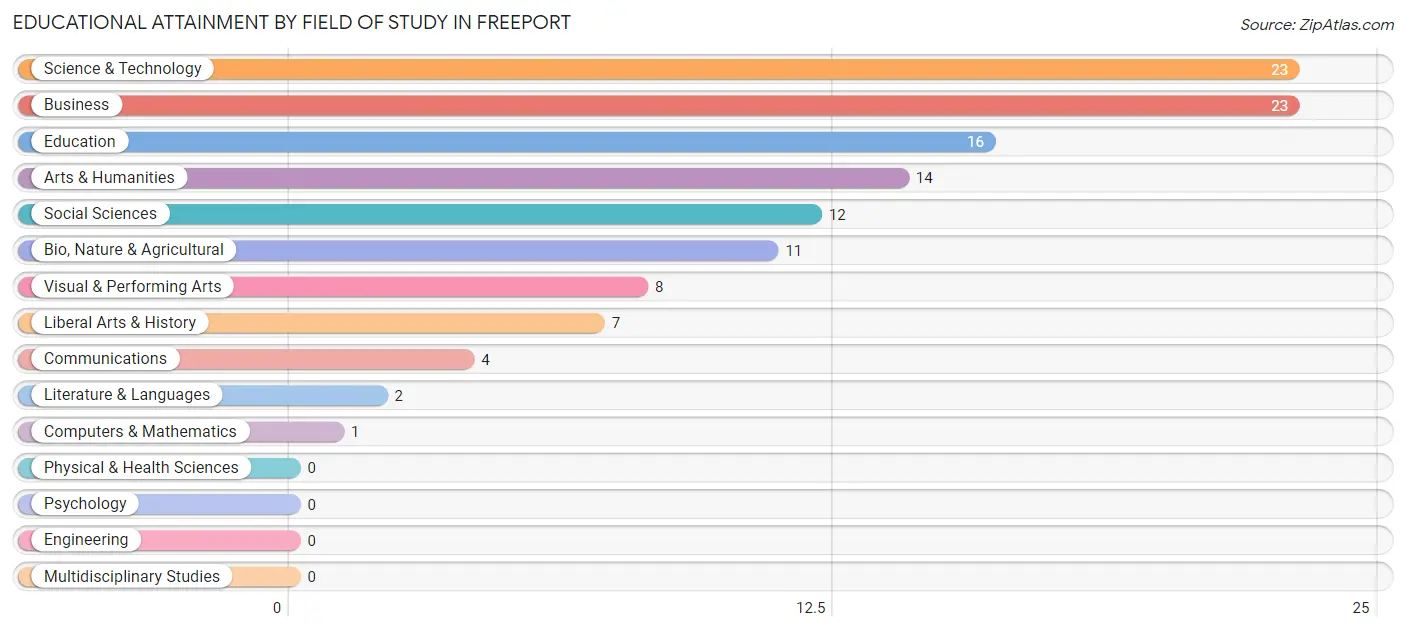
| Field of Study | # Graduates | % Graduates |
| Computers & Mathematics | 1 | 0.8% |
| Bio, Nature & Agricultural | 11 | 9.1% |
| Physical & Health Sciences | 0 | 0.0% |
| Psychology | 0 | 0.0% |
| Social Sciences | 12 | 9.9% |
| Engineering | 0 | 0.0% |
| Multidisciplinary Studies | 0 | 0.0% |
| Science & Technology | 23 | 19.0% |
| Business | 23 | 19.0% |
| Education | 16 | 13.2% |
| Literature & Languages | 2 | 1.7% |
| Liberal Arts & History | 7 | 5.8% |
| Visual & Performing Arts | 8 | 6.6% |
| Communications | 4 | 3.3% |
| Arts & Humanities | 14 | 11.6% |
| Total | 121 | 100.0% |
Transportation & Commute in Freeport
Vehicle Availability by Sex in Freeport
The most prevalent vehicle ownership categories in Freeport are males with 2 vehicles (118, accounting for 49.8%) and females with 2 vehicles (111, making up 60.5%).
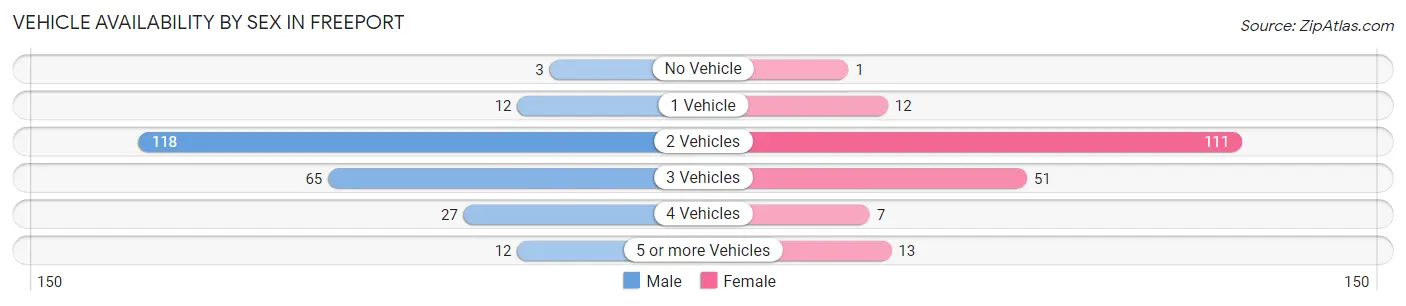
| Vehicles Available | Male | Female |
| No Vehicle | 3 (1.3%) | 1 (0.5%) |
| 1 Vehicle | 12 (5.1%) | 12 (6.1%) |
| 2 Vehicles | 118 (49.8%) | 111 (56.9%) |
| 3 Vehicles | 65 (27.4%) | 51 (26.2%) |
| 4 Vehicles | 27 (11.4%) | 7 (3.6%) |
| 5 or more Vehicles | 12 (5.1%) | 13 (6.7%) |
| Total | 237 (100.0%) | 195 (100.0%) |
Commute Time in Freeport
The most frequently occuring commute durations in Freeport are 10 to 14 minutes (60 commuters, 15.1%), 30 to 34 minutes (60 commuters, 15.1%), and 35 to 39 minutes (55 commuters, 13.9%).
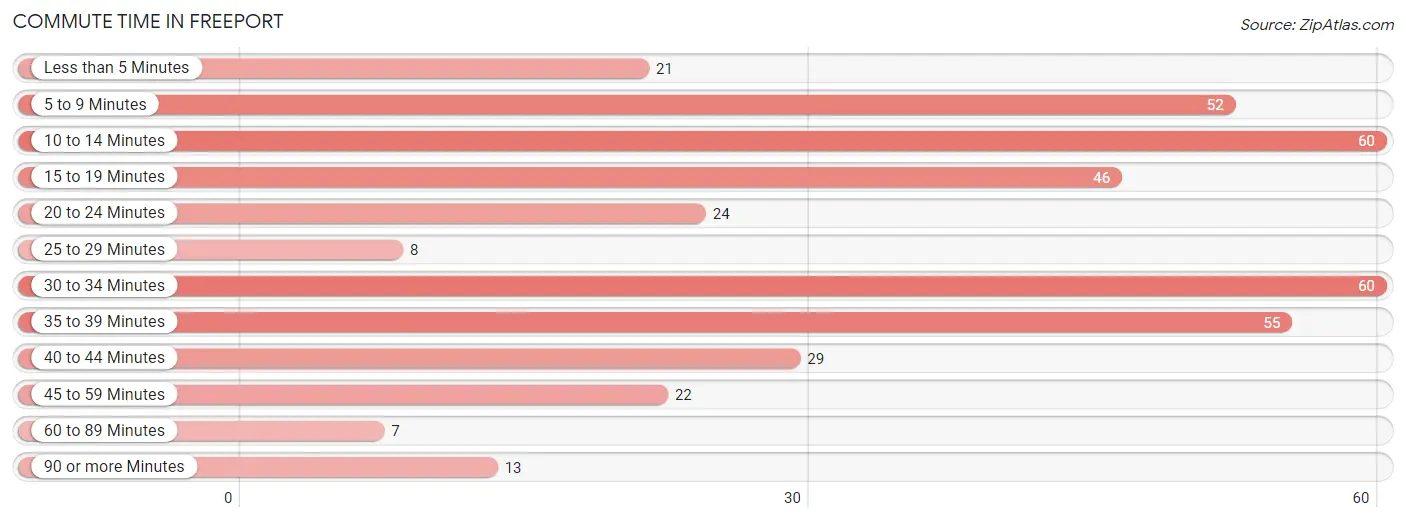
| Commute Time | # Commuters | % Commuters |
| Less than 5 Minutes | 21 | 5.3% |
| 5 to 9 Minutes | 52 | 13.1% |
| 10 to 14 Minutes | 60 | 15.1% |
| 15 to 19 Minutes | 46 | 11.6% |
| 20 to 24 Minutes | 24 | 6.0% |
| 25 to 29 Minutes | 8 | 2.0% |
| 30 to 34 Minutes | 60 | 15.1% |
| 35 to 39 Minutes | 55 | 13.9% |
| 40 to 44 Minutes | 29 | 7.3% |
| 45 to 59 Minutes | 22 | 5.5% |
| 60 to 89 Minutes | 7 | 1.8% |
| 90 or more Minutes | 13 | 3.3% |
Commute Time by Sex in Freeport
The most common commute times in Freeport are 30 to 34 minutes (48 commuters, 20.6%) for males and 35 to 39 minutes (40 commuters, 24.4%) for females.
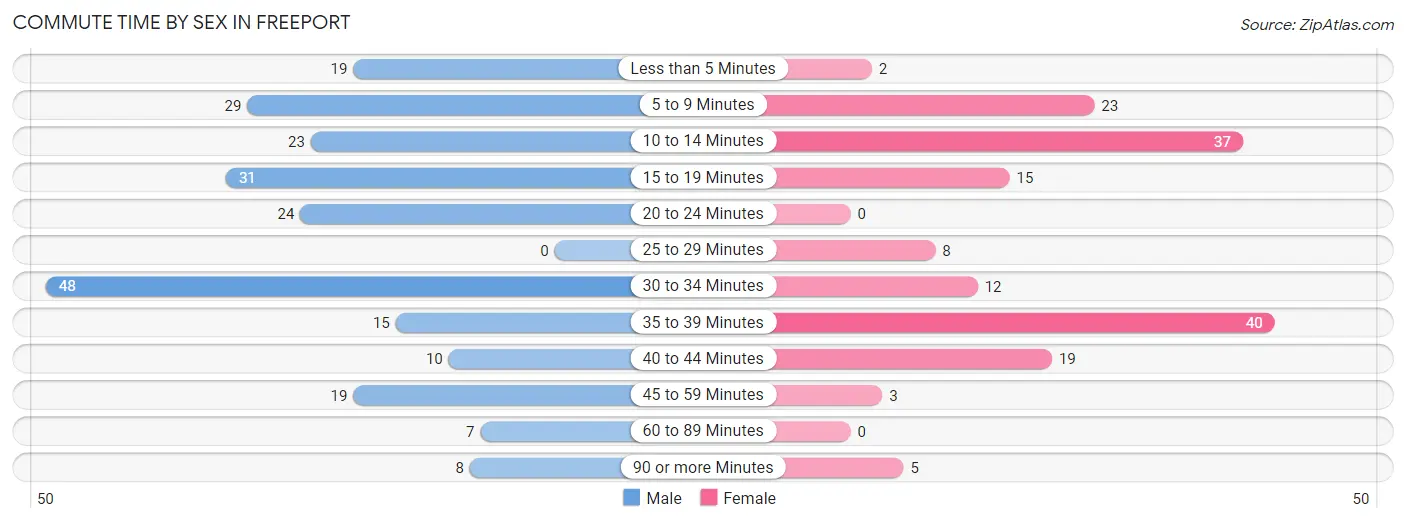
| Commute Time | Male | Female |
| Less than 5 Minutes | 19 (8.2%) | 2 (1.2%) |
| 5 to 9 Minutes | 29 (12.4%) | 23 (14.0%) |
| 10 to 14 Minutes | 23 (9.9%) | 37 (22.6%) |
| 15 to 19 Minutes | 31 (13.3%) | 15 (9.1%) |
| 20 to 24 Minutes | 24 (10.3%) | 0 (0.0%) |
| 25 to 29 Minutes | 0 (0.0%) | 8 (4.9%) |
| 30 to 34 Minutes | 48 (20.6%) | 12 (7.3%) |
| 35 to 39 Minutes | 15 (6.4%) | 40 (24.4%) |
| 40 to 44 Minutes | 10 (4.3%) | 19 (11.6%) |
| 45 to 59 Minutes | 19 (8.2%) | 3 (1.8%) |
| 60 to 89 Minutes | 7 (3.0%) | 0 (0.0%) |
| 90 or more Minutes | 8 (3.4%) | 5 (3.0%) |
Time of Departure to Work by Sex in Freeport
The most frequent times of departure to work in Freeport are 6:00 AM to 6:29 AM (37, 15.9%) for males and 7:30 AM to 7:59 AM (51, 31.1%) for females.
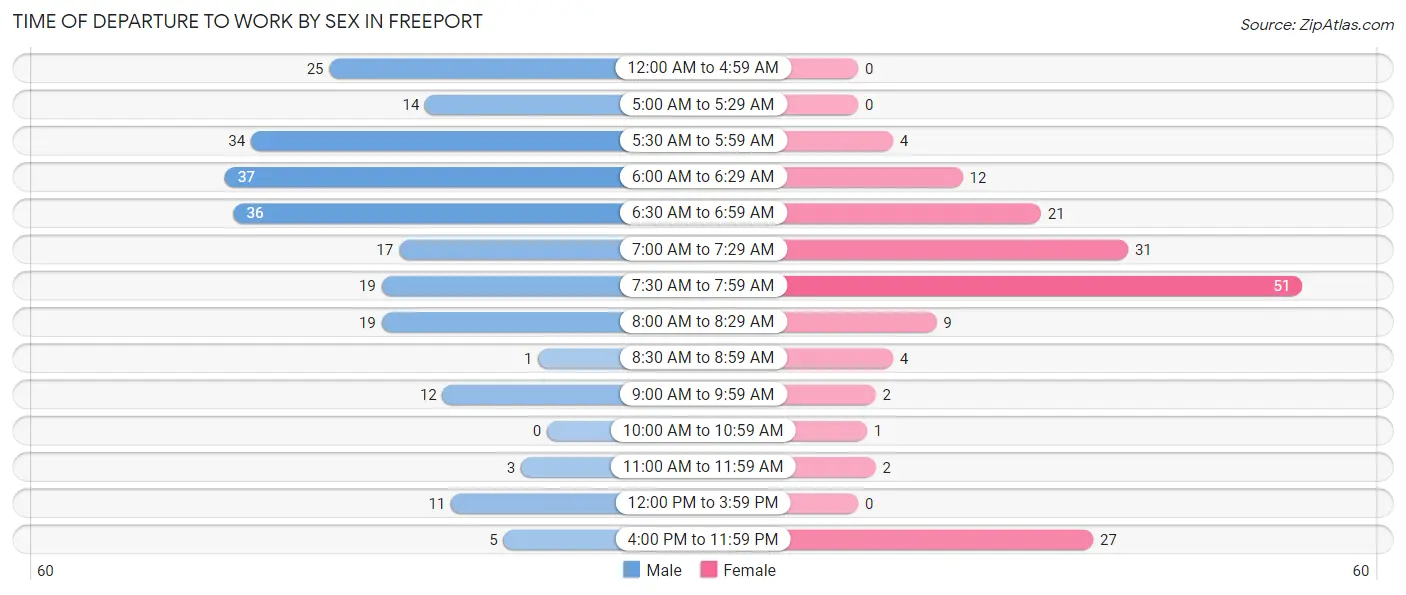
| Time of Departure | Male | Female |
| 12:00 AM to 4:59 AM | 25 (10.7%) | 0 (0.0%) |
| 5:00 AM to 5:29 AM | 14 (6.0%) | 0 (0.0%) |
| 5:30 AM to 5:59 AM | 34 (14.6%) | 4 (2.4%) |
| 6:00 AM to 6:29 AM | 37 (15.9%) | 12 (7.3%) |
| 6:30 AM to 6:59 AM | 36 (15.4%) | 21 (12.8%) |
| 7:00 AM to 7:29 AM | 17 (7.3%) | 31 (18.9%) |
| 7:30 AM to 7:59 AM | 19 (8.2%) | 51 (31.1%) |
| 8:00 AM to 8:29 AM | 19 (8.2%) | 9 (5.5%) |
| 8:30 AM to 8:59 AM | 1 (0.4%) | 4 (2.4%) |
| 9:00 AM to 9:59 AM | 12 (5.1%) | 2 (1.2%) |
| 10:00 AM to 10:59 AM | 0 (0.0%) | 1 (0.6%) |
| 11:00 AM to 11:59 AM | 3 (1.3%) | 2 (1.2%) |
| 12:00 PM to 3:59 PM | 11 (4.7%) | 0 (0.0%) |
| 4:00 PM to 11:59 PM | 5 (2.1%) | 27 (16.5%) |
| Total | 233 (100.0%) | 164 (100.0%) |
Housing Occupancy in Freeport
Occupancy by Ownership in Freeport
Of the total 288 dwellings in Freeport, owner-occupied units account for 251 (87.2%), while renter-occupied units make up 37 (12.9%).
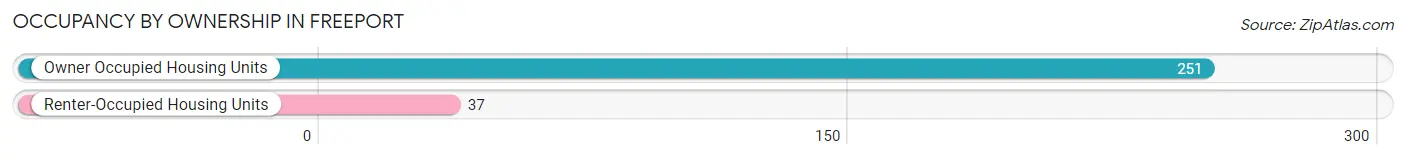
| Occupancy | # Housing Units | % Housing Units |
| Owner Occupied Housing Units | 251 | 87.2% |
| Renter-Occupied Housing Units | 37 | 12.9% |
| Total Occupied Housing Units | 288 | 100.0% |
Occupancy by Household Size in Freeport
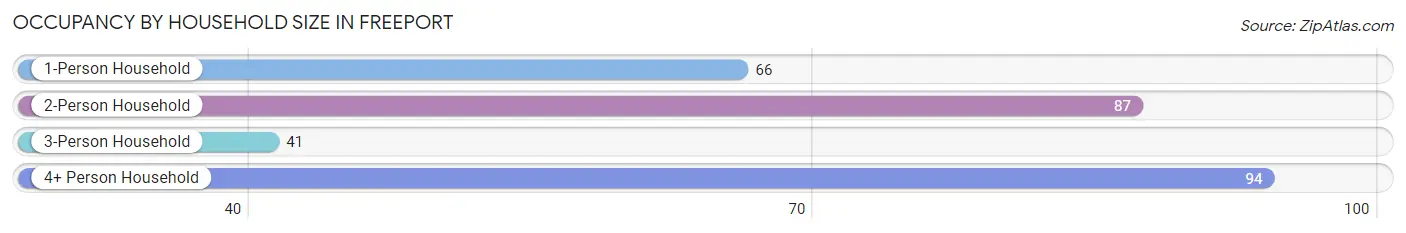
| Household Size | # Housing Units | % Housing Units |
| 1-Person Household | 66 | 22.9% |
| 2-Person Household | 87 | 30.2% |
| 3-Person Household | 41 | 14.2% |
| 4+ Person Household | 94 | 32.6% |
| Total Housing Units | 288 | 100.0% |
Occupancy by Ownership by Household Size in Freeport
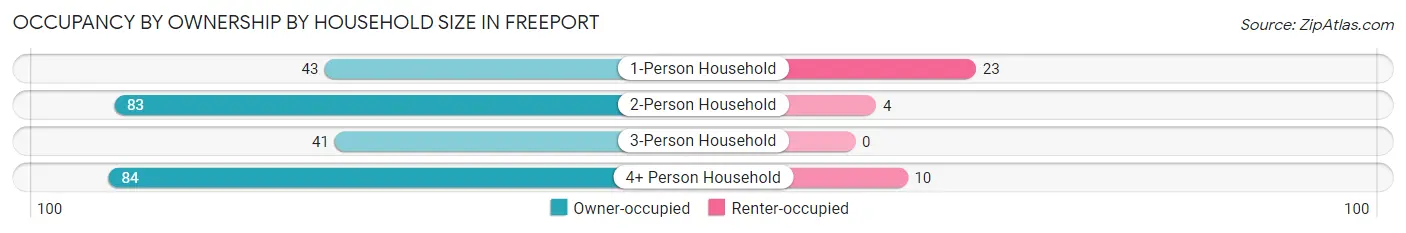
| Household Size | Owner-occupied | Renter-occupied |
| 1-Person Household | 43 (65.1%) | 23 (34.8%) |
| 2-Person Household | 83 (95.4%) | 4 (4.6%) |
| 3-Person Household | 41 (100.0%) | 0 (0.0%) |
| 4+ Person Household | 84 (89.4%) | 10 (10.6%) |
| Total Housing Units | 251 (87.2%) | 37 (12.9%) |
Occupancy by Educational Attainment in Freeport
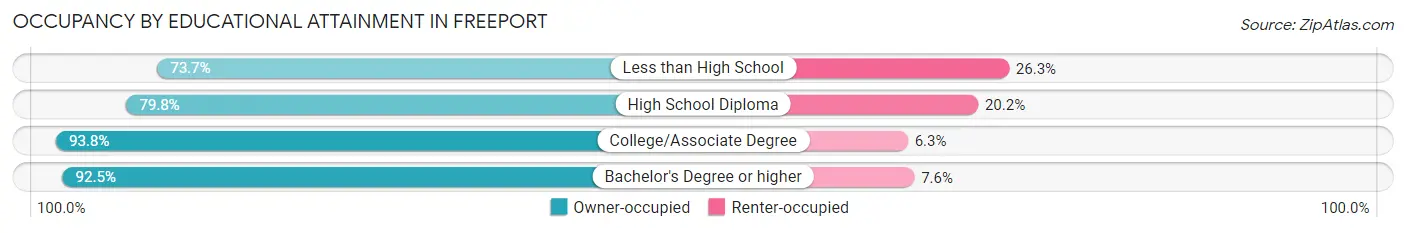
| Household Size | Owner-occupied | Renter-occupied |
| Less than High School | 14 (73.7%) | 5 (26.3%) |
| High School Diploma | 83 (79.8%) | 21 (20.2%) |
| College/Associate Degree | 105 (93.8%) | 7 (6.2%) |
| Bachelor's Degree or higher | 49 (92.4%) | 4 (7.5%) |
Occupancy by Age of Householder in Freeport
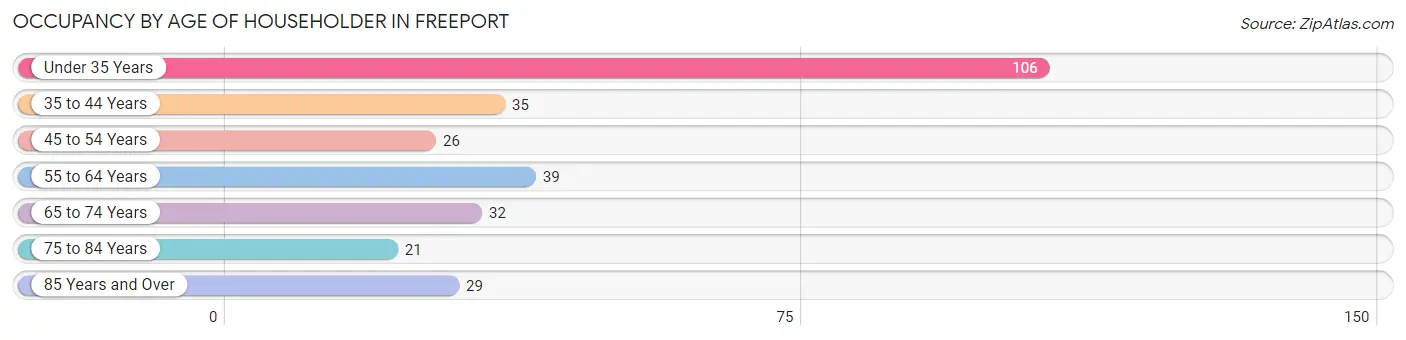
| Age Bracket | # Households | % Households |
| Under 35 Years | 106 | 36.8% |
| 35 to 44 Years | 35 | 12.1% |
| 45 to 54 Years | 26 | 9.0% |
| 55 to 64 Years | 39 | 13.5% |
| 65 to 74 Years | 32 | 11.1% |
| 75 to 84 Years | 21 | 7.3% |
| 85 Years and Over | 29 | 10.1% |
| Total | 288 | 100.0% |
Housing Finances in Freeport
Median Income by Occupancy in Freeport
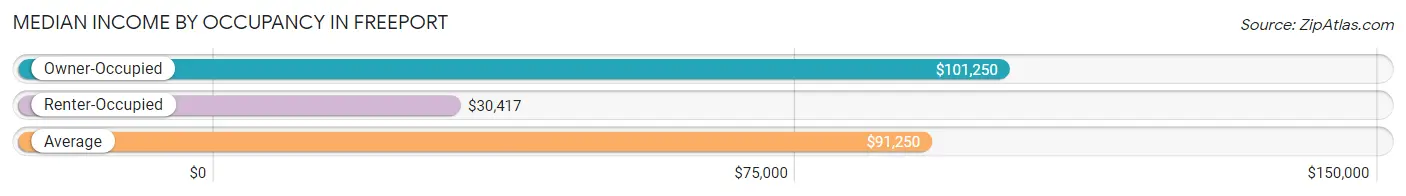
| Occupancy Type | # Households | Median Income |
| Owner-Occupied | 251 (87.2%) | $101,250 |
| Renter-Occupied | 37 (12.9%) | $30,417 |
| Average | 288 (100.0%) | $91,250 |
Occupancy by Householder Income Bracket in Freeport
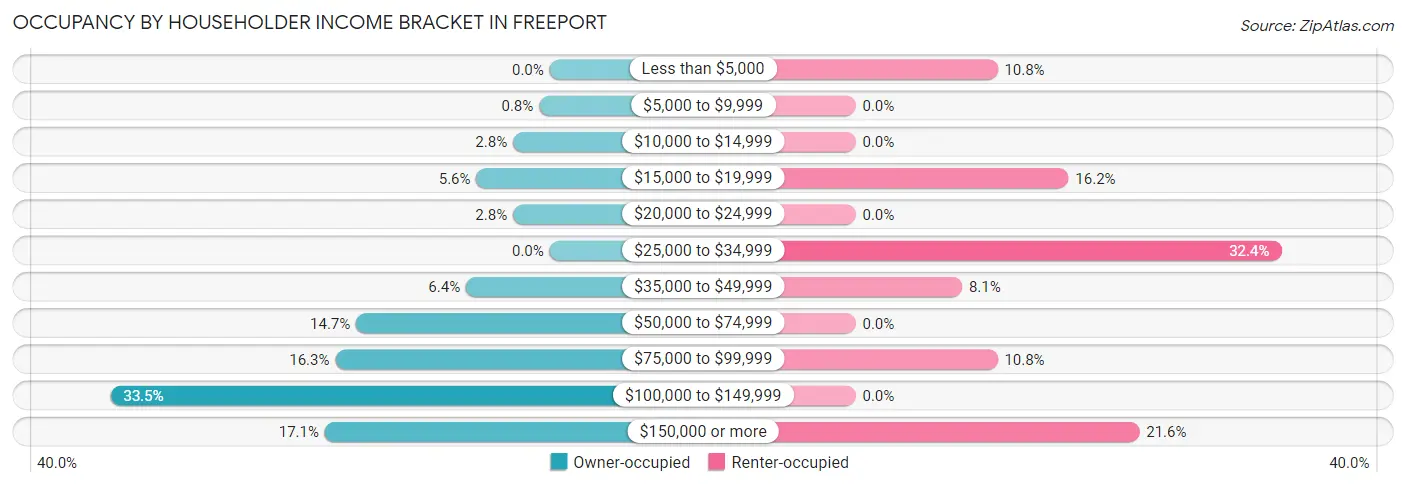
| Income Bracket | Owner-occupied | Renter-occupied |
| Less than $5,000 | 0 (0.0%) | 4 (10.8%) |
| $5,000 to $9,999 | 2 (0.8%) | 0 (0.0%) |
| $10,000 to $14,999 | 7 (2.8%) | 0 (0.0%) |
| $15,000 to $19,999 | 14 (5.6%) | 6 (16.2%) |
| $20,000 to $24,999 | 7 (2.8%) | 0 (0.0%) |
| $25,000 to $34,999 | 0 (0.0%) | 12 (32.4%) |
| $35,000 to $49,999 | 16 (6.4%) | 3 (8.1%) |
| $50,000 to $74,999 | 37 (14.7%) | 0 (0.0%) |
| $75,000 to $99,999 | 41 (16.3%) | 4 (10.8%) |
| $100,000 to $149,999 | 84 (33.5%) | 0 (0.0%) |
| $150,000 or more | 43 (17.1%) | 8 (21.6%) |
| Total | 251 (100.0%) | 37 (100.0%) |
Monthly Housing Cost Tiers in Freeport
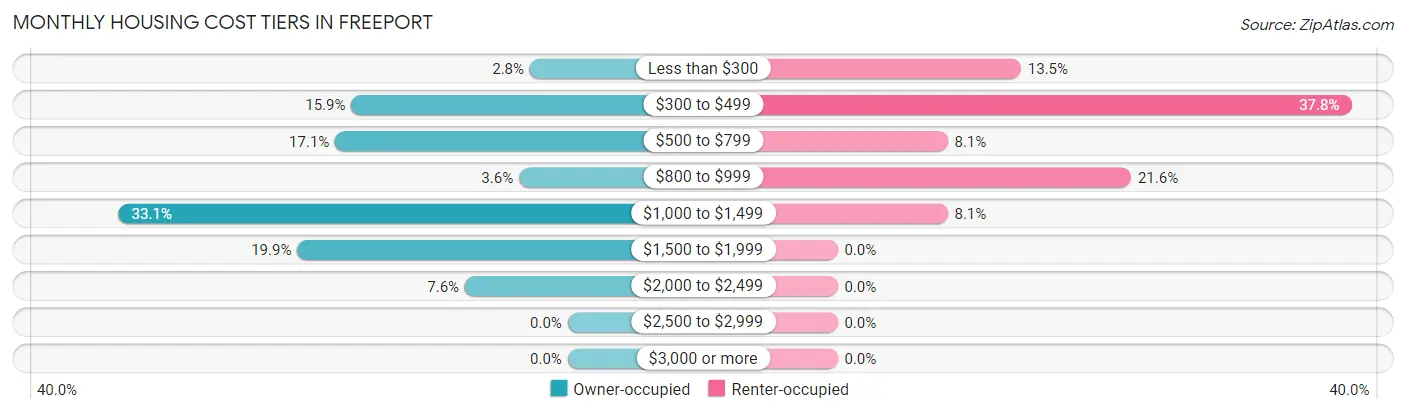
| Monthly Cost | Owner-occupied | Renter-occupied |
| Less than $300 | 7 (2.8%) | 5 (13.5%) |
| $300 to $499 | 40 (15.9%) | 14 (37.8%) |
| $500 to $799 | 43 (17.1%) | 3 (8.1%) |
| $800 to $999 | 9 (3.6%) | 8 (21.6%) |
| $1,000 to $1,499 | 83 (33.1%) | 3 (8.1%) |
| $1,500 to $1,999 | 50 (19.9%) | 0 (0.0%) |
| $2,000 to $2,499 | 19 (7.6%) | 0 (0.0%) |
| $2,500 to $2,999 | 0 (0.0%) | 0 (0.0%) |
| $3,000 or more | 0 (0.0%) | 0 (0.0%) |
| Total | 251 (100.0%) | 37 (100.0%) |
Physical Housing Characteristics in Freeport
Housing Structures in Freeport
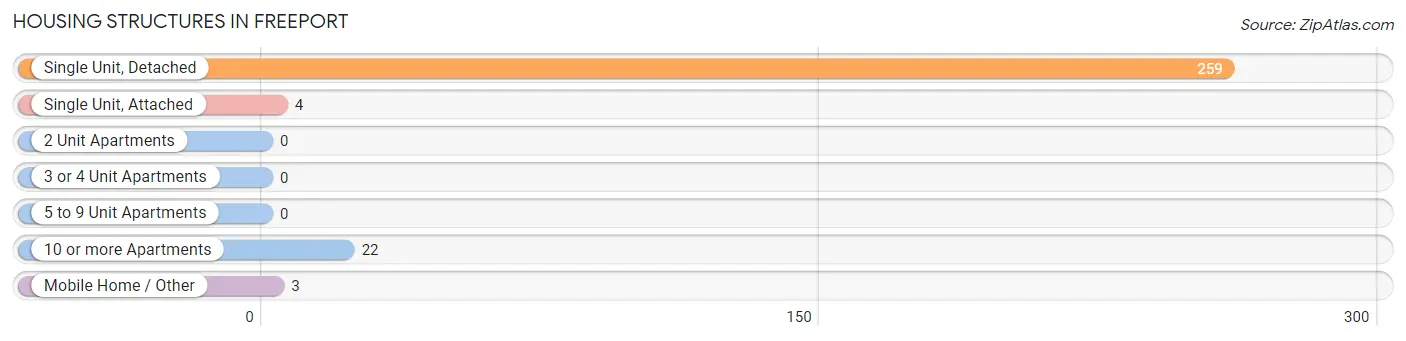
| Structure Type | # Housing Units | % Housing Units |
| Single Unit, Detached | 259 | 89.9% |
| Single Unit, Attached | 4 | 1.4% |
| 2 Unit Apartments | 0 | 0.0% |
| 3 or 4 Unit Apartments | 0 | 0.0% |
| 5 to 9 Unit Apartments | 0 | 0.0% |
| 10 or more Apartments | 22 | 7.6% |
| Mobile Home / Other | 3 | 1.0% |
| Total | 288 | 100.0% |
Housing Structures by Occupancy in Freeport
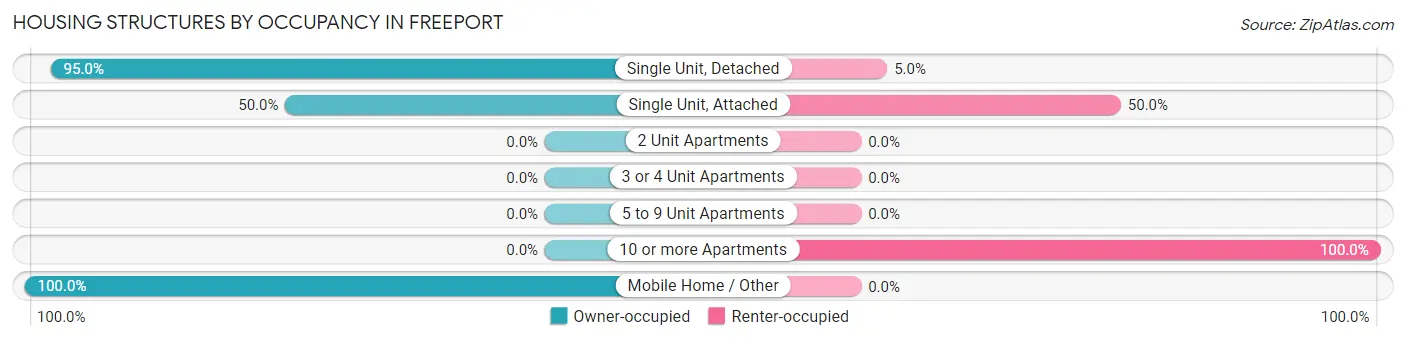
| Structure Type | Owner-occupied | Renter-occupied |
| Single Unit, Detached | 246 (95.0%) | 13 (5.0%) |
| Single Unit, Attached | 2 (50.0%) | 2 (50.0%) |
| 2 Unit Apartments | 0 (0.0%) | 0 (0.0%) |
| 3 or 4 Unit Apartments | 0 (0.0%) | 0 (0.0%) |
| 5 to 9 Unit Apartments | 0 (0.0%) | 0 (0.0%) |
| 10 or more Apartments | 0 (0.0%) | 22 (100.0%) |
| Mobile Home / Other | 3 (100.0%) | 0 (0.0%) |
| Total | 251 (87.2%) | 37 (12.9%) |
Housing Structures by Number of Rooms in Freeport
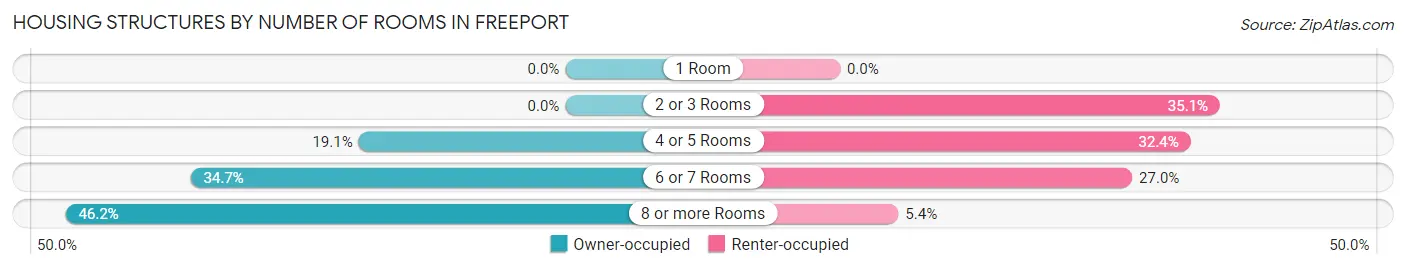
| Number of Rooms | Owner-occupied | Renter-occupied |
| 1 Room | 0 (0.0%) | 0 (0.0%) |
| 2 or 3 Rooms | 0 (0.0%) | 13 (35.1%) |
| 4 or 5 Rooms | 48 (19.1%) | 12 (32.4%) |
| 6 or 7 Rooms | 87 (34.7%) | 10 (27.0%) |
| 8 or more Rooms | 116 (46.2%) | 2 (5.4%) |
| Total | 251 (100.0%) | 37 (100.0%) |
Housing Structure by Heating Type in Freeport
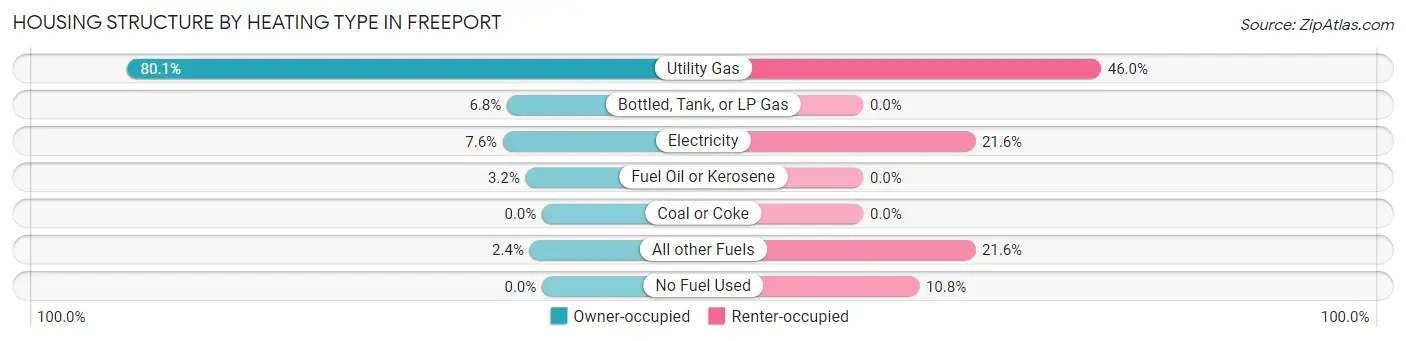
| Heating Type | Owner-occupied | Renter-occupied |
| Utility Gas | 201 (80.1%) | 17 (46.0%) |
| Bottled, Tank, or LP Gas | 17 (6.8%) | 0 (0.0%) |
| Electricity | 19 (7.6%) | 8 (21.6%) |
| Fuel Oil or Kerosene | 8 (3.2%) | 0 (0.0%) |
| Coal or Coke | 0 (0.0%) | 0 (0.0%) |
| All other Fuels | 6 (2.4%) | 8 (21.6%) |
| No Fuel Used | 0 (0.0%) | 4 (10.8%) |
| Total | 251 (100.0%) | 37 (100.0%) |
Household Vehicle Usage in Freeport
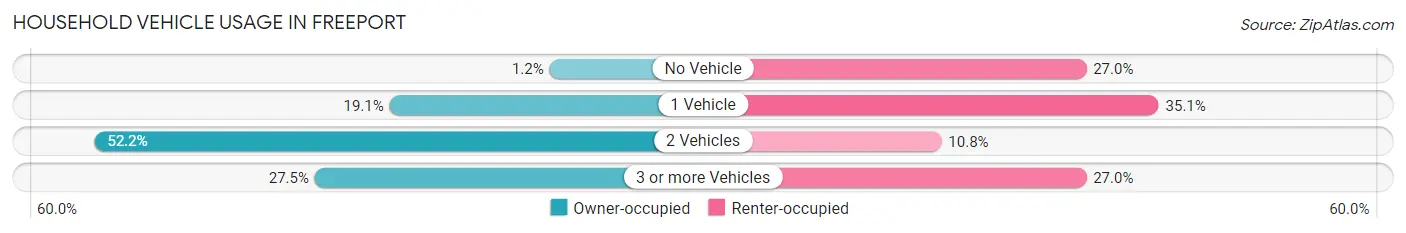
| Vehicles per Household | Owner-occupied | Renter-occupied |
| No Vehicle | 3 (1.2%) | 10 (27.0%) |
| 1 Vehicle | 48 (19.1%) | 13 (35.1%) |
| 2 Vehicles | 131 (52.2%) | 4 (10.8%) |
| 3 or more Vehicles | 69 (27.5%) | 10 (27.0%) |
| Total | 251 (100.0%) | 37 (100.0%) |
Real Estate & Mortgages in Freeport
Real Estate and Mortgage Overview in Freeport
| Characteristic | Without Mortgage | With Mortgage |
| Housing Units | 84 | 167 |
| Median Property Value | $184,100 | $208,500 |
| Median Household Income | $53,333 | $35 |
| Monthly Housing Costs | $500 | $0 |
| Real Estate Taxes | $1,840 | $0 |
Property Value by Mortgage Status in Freeport
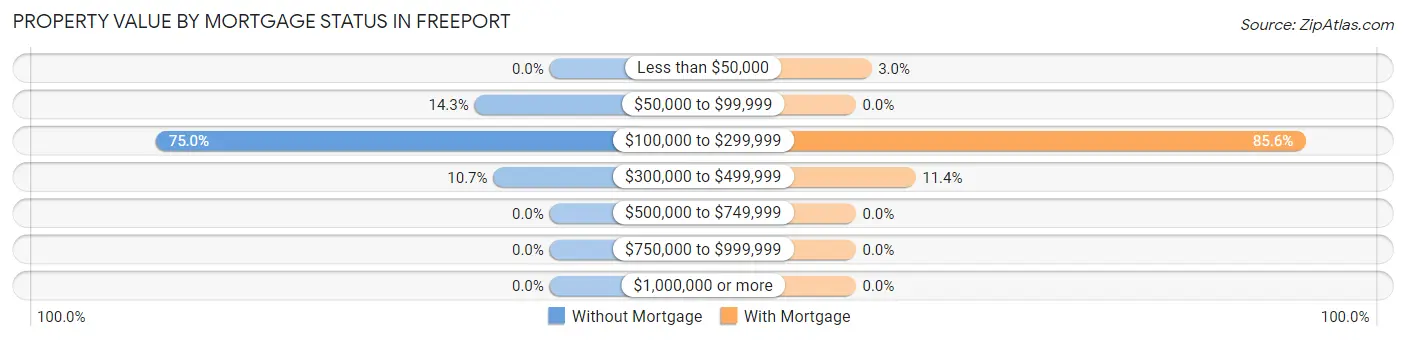
| Property Value | Without Mortgage | With Mortgage |
| Less than $50,000 | 0 (0.0%) | 5 (3.0%) |
| $50,000 to $99,999 | 12 (14.3%) | 0 (0.0%) |
| $100,000 to $299,999 | 63 (75.0%) | 143 (85.6%) |
| $300,000 to $499,999 | 9 (10.7%) | 19 (11.4%) |
| $500,000 to $749,999 | 0 (0.0%) | 0 (0.0%) |
| $750,000 to $999,999 | 0 (0.0%) | 0 (0.0%) |
| $1,000,000 or more | 0 (0.0%) | 0 (0.0%) |
| Total | 84 (100.0%) | 167 (100.0%) |
Household Income by Mortgage Status in Freeport
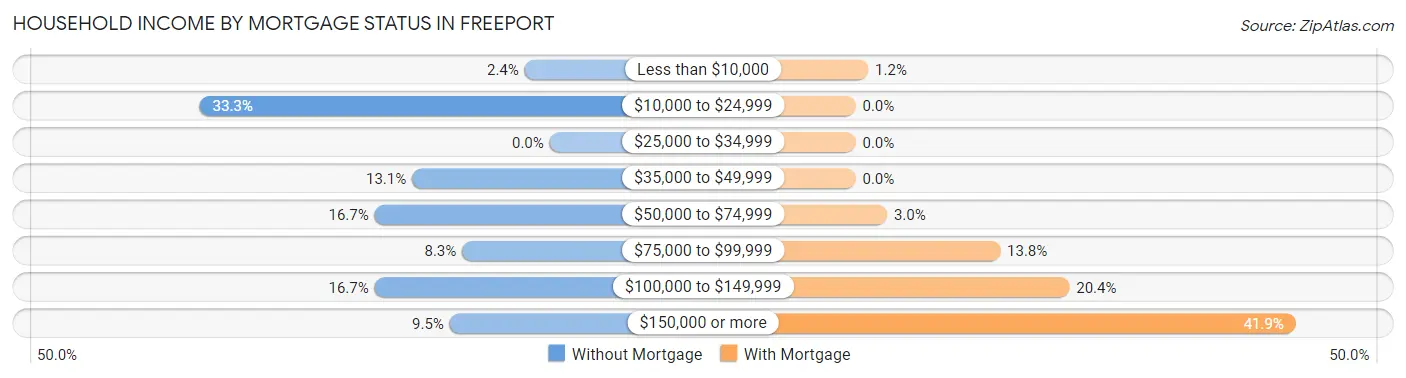
| Household Income | Without Mortgage | With Mortgage |
| Less than $10,000 | 2 (2.4%) | 2 (1.2%) |
| $10,000 to $24,999 | 28 (33.3%) | 0 (0.0%) |
| $25,000 to $34,999 | 0 (0.0%) | 0 (0.0%) |
| $35,000 to $49,999 | 11 (13.1%) | 0 (0.0%) |
| $50,000 to $74,999 | 14 (16.7%) | 5 (3.0%) |
| $75,000 to $99,999 | 7 (8.3%) | 23 (13.8%) |
| $100,000 to $149,999 | 14 (16.7%) | 34 (20.4%) |
| $150,000 or more | 8 (9.5%) | 70 (41.9%) |
| Total | 84 (100.0%) | 167 (100.0%) |
Property Value to Household Income Ratio in Freeport
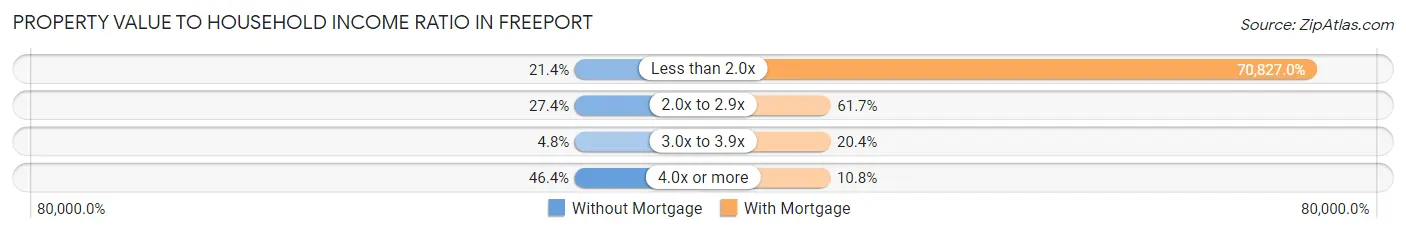
| Value-to-Income Ratio | Without Mortgage | With Mortgage |
| Less than 2.0x | 18 (21.4%) | 118,281 (70,826.9%) |
| 2.0x to 2.9x | 23 (27.4%) | 103 (61.7%) |
| 3.0x to 3.9x | 4 (4.8%) | 34 (20.4%) |
| 4.0x or more | 39 (46.4%) | 18 (10.8%) |
| Total | 84 (100.0%) | 167 (100.0%) |
Real Estate Taxes by Mortgage Status in Freeport
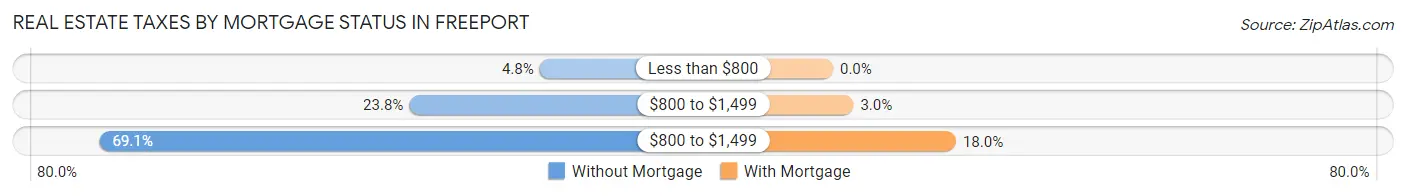
| Property Taxes | Without Mortgage | With Mortgage |
| Less than $800 | 4 (4.8%) | 0 (0.0%) |
| $800 to $1,499 | 20 (23.8%) | 5 (3.0%) |
| $800 to $1,499 | 58 (69.1%) | 30 (18.0%) |
| Total | 84 (100.0%) | 167 (100.0%) |
Health & Disability in Freeport
Health Insurance Coverage by Age in Freeport
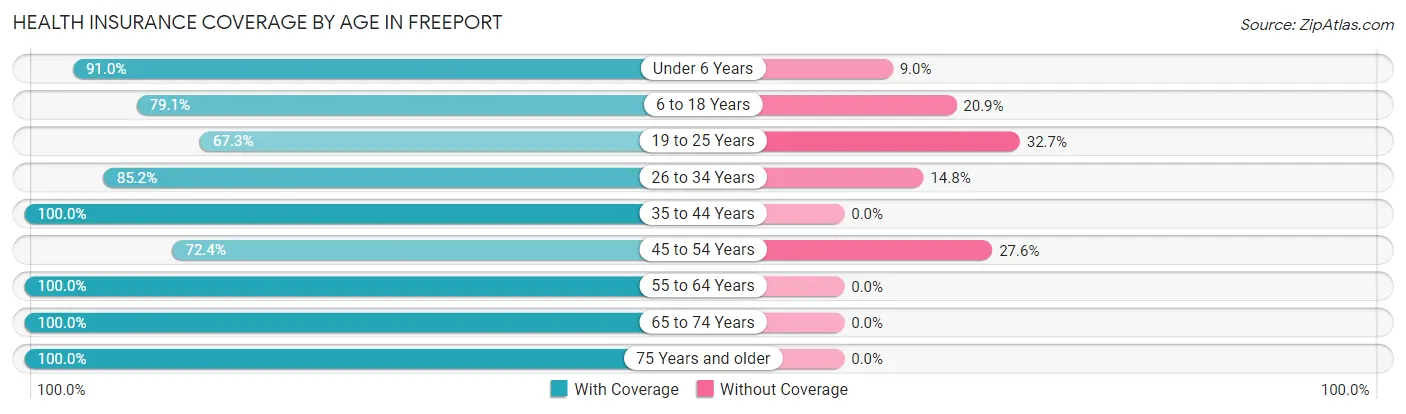
| Age Bracket | With Coverage | Without Coverage |
| Under 6 Years | 141 (91.0%) | 14 (9.0%) |
| 6 to 18 Years | 106 (79.1%) | 28 (20.9%) |
| 19 to 25 Years | 37 (67.3%) | 18 (32.7%) |
| 26 to 34 Years | 150 (85.2%) | 26 (14.8%) |
| 35 to 44 Years | 62 (100.0%) | 0 (0.0%) |
| 45 to 54 Years | 42 (72.4%) | 16 (27.6%) |
| 55 to 64 Years | 65 (100.0%) | 0 (0.0%) |
| 65 to 74 Years | 56 (100.0%) | 0 (0.0%) |
| 75 Years and older | 61 (100.0%) | 0 (0.0%) |
| Total | 720 (87.6%) | 102 (12.4%) |
Health Insurance Coverage by Citizenship Status in Freeport
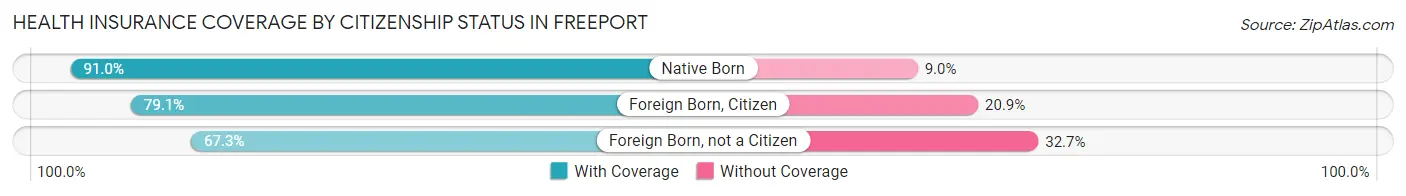
| Citizenship Status | With Coverage | Without Coverage |
| Native Born | 141 (91.0%) | 14 (9.0%) |
| Foreign Born, Citizen | 106 (79.1%) | 28 (20.9%) |
| Foreign Born, not a Citizen | 37 (67.3%) | 18 (32.7%) |
Health Insurance Coverage by Household Income in Freeport
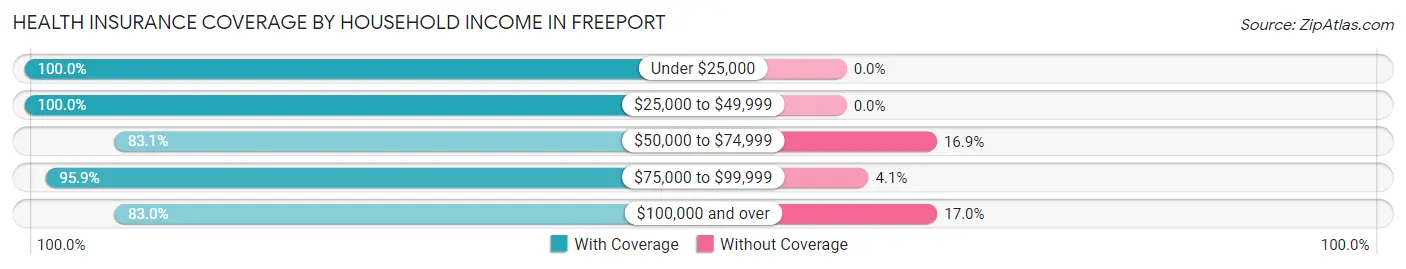
| Household Income | With Coverage | Without Coverage |
| Under $25,000 | 48 (100.0%) | 0 (0.0%) |
| $25,000 to $49,999 | 61 (100.0%) | 0 (0.0%) |
| $50,000 to $74,999 | 59 (83.1%) | 12 (16.9%) |
| $75,000 to $99,999 | 141 (95.9%) | 6 (4.1%) |
| $100,000 and over | 411 (83.0%) | 84 (17.0%) |
Public vs Private Health Insurance Coverage by Age in Freeport
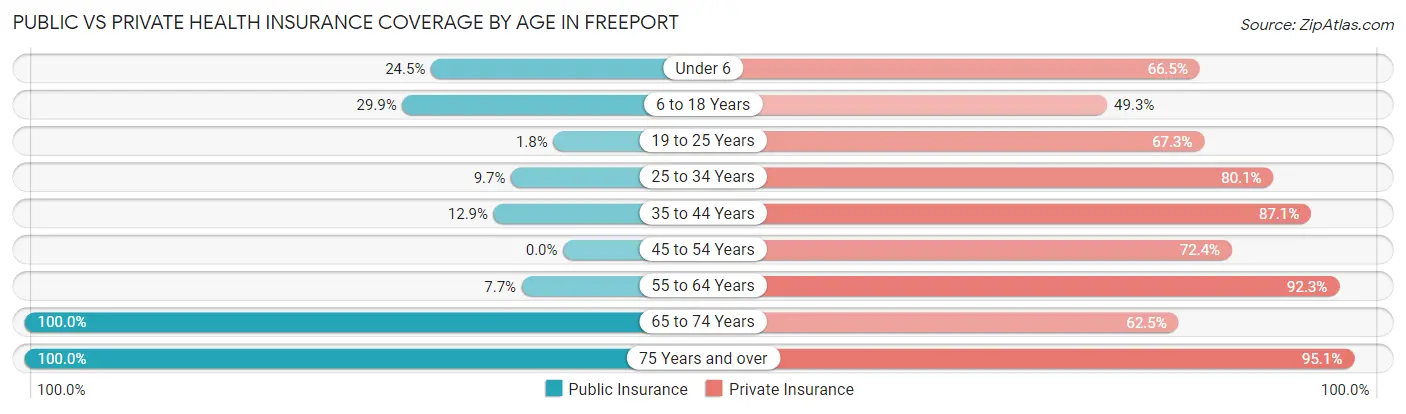
| Age Bracket | Public Insurance | Private Insurance |
| Under 6 | 38 (24.5%) | 103 (66.4%) |
| 6 to 18 Years | 40 (29.8%) | 66 (49.2%) |
| 19 to 25 Years | 1 (1.8%) | 37 (67.3%) |
| 25 to 34 Years | 17 (9.7%) | 141 (80.1%) |
| 35 to 44 Years | 8 (12.9%) | 54 (87.1%) |
| 45 to 54 Years | 0 (0.0%) | 42 (72.4%) |
| 55 to 64 Years | 5 (7.7%) | 60 (92.3%) |
| 65 to 74 Years | 56 (100.0%) | 35 (62.5%) |
| 75 Years and over | 61 (100.0%) | 58 (95.1%) |
| Total | 226 (27.5%) | 596 (72.5%) |
Disability Status by Sex by Age in Freeport
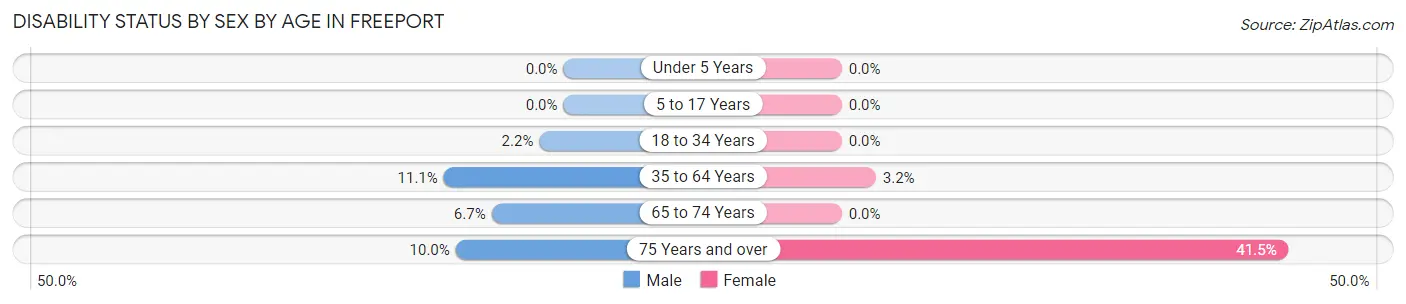
| Age Bracket | Male | Female |
| Under 5 Years | 0 (0.0%) | 0 (0.0%) |
| 5 to 17 Years | 0 (0.0%) | 0 (0.0%) |
| 18 to 34 Years | 3 (2.2%) | 0 (0.0%) |
| 35 to 64 Years | 10 (11.1%) | 3 (3.2%) |
| 65 to 74 Years | 2 (6.7%) | 0 (0.0%) |
| 75 Years and over | 2 (10.0%) | 17 (41.5%) |
Disability Class by Sex by Age in Freeport
Disability Class: Hearing Difficulty
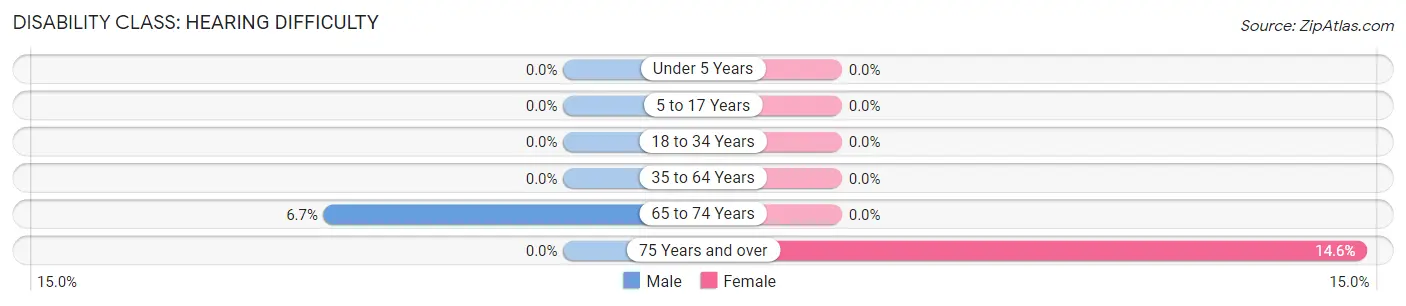
| Age Bracket | Male | Female |
| Under 5 Years | 0 (0.0%) | 0 (0.0%) |
| 5 to 17 Years | 0 (0.0%) | 0 (0.0%) |
| 18 to 34 Years | 0 (0.0%) | 0 (0.0%) |
| 35 to 64 Years | 0 (0.0%) | 0 (0.0%) |
| 65 to 74 Years | 2 (6.7%) | 0 (0.0%) |
| 75 Years and over | 0 (0.0%) | 6 (14.6%) |
Disability Class: Vision Difficulty
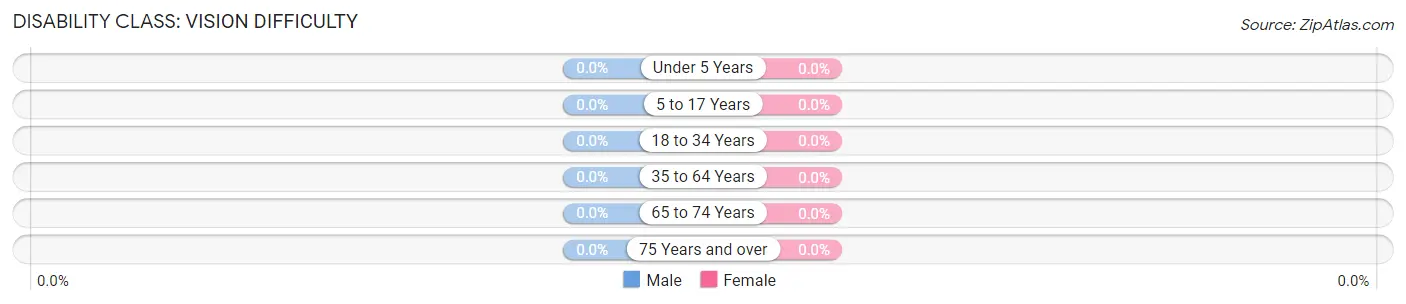
| Age Bracket | Male | Female |
| Under 5 Years | 0 (0.0%) | 0 (0.0%) |
| 5 to 17 Years | 0 (0.0%) | 0 (0.0%) |
| 18 to 34 Years | 0 (0.0%) | 0 (0.0%) |
| 35 to 64 Years | 0 (0.0%) | 0 (0.0%) |
| 65 to 74 Years | 0 (0.0%) | 0 (0.0%) |
| 75 Years and over | 0 (0.0%) | 0 (0.0%) |
Disability Class: Cognitive Difficulty
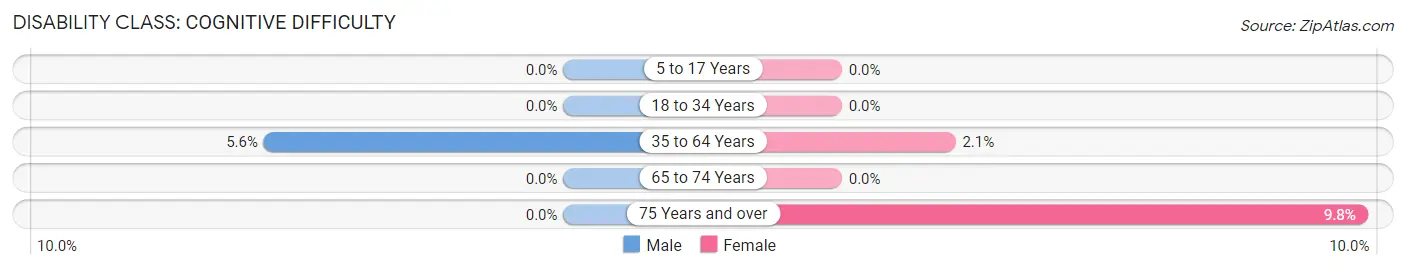
| Age Bracket | Male | Female |
| 5 to 17 Years | 0 (0.0%) | 0 (0.0%) |
| 18 to 34 Years | 0 (0.0%) | 0 (0.0%) |
| 35 to 64 Years | 5 (5.6%) | 2 (2.1%) |
| 65 to 74 Years | 0 (0.0%) | 0 (0.0%) |
| 75 Years and over | 0 (0.0%) | 4 (9.8%) |
Disability Class: Ambulatory Difficulty
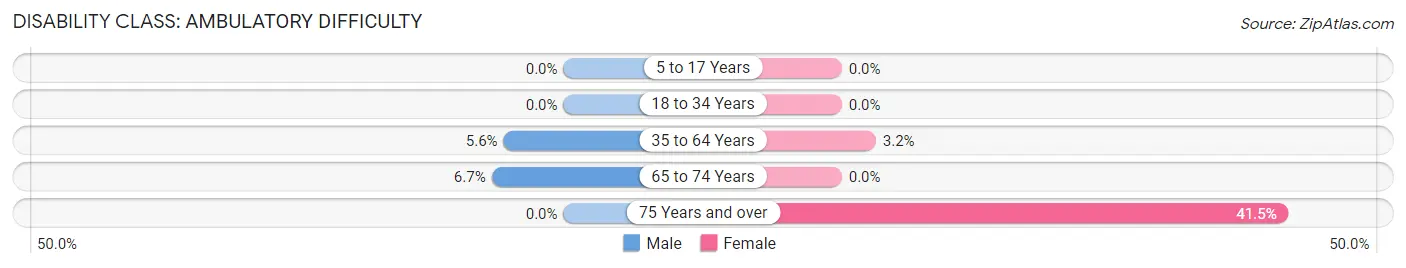
| Age Bracket | Male | Female |
| 5 to 17 Years | 0 (0.0%) | 0 (0.0%) |
| 18 to 34 Years | 0 (0.0%) | 0 (0.0%) |
| 35 to 64 Years | 5 (5.6%) | 3 (3.2%) |
| 65 to 74 Years | 2 (6.7%) | 0 (0.0%) |
| 75 Years and over | 0 (0.0%) | 17 (41.5%) |
Disability Class: Self-Care Difficulty
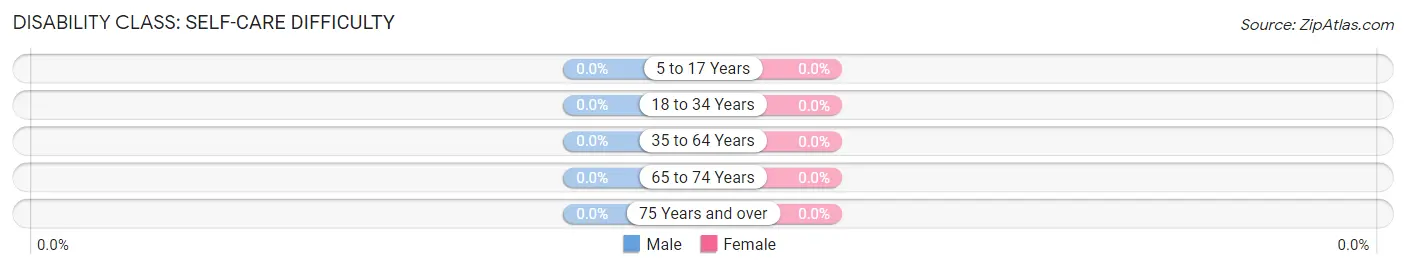
| Age Bracket | Male | Female |
| 5 to 17 Years | 0 (0.0%) | 0 (0.0%) |
| 18 to 34 Years | 0 (0.0%) | 0 (0.0%) |
| 35 to 64 Years | 0 (0.0%) | 0 (0.0%) |
| 65 to 74 Years | 0 (0.0%) | 0 (0.0%) |
| 75 Years and over | 0 (0.0%) | 0 (0.0%) |
Technology Access in Freeport
Computing Device Access in Freeport
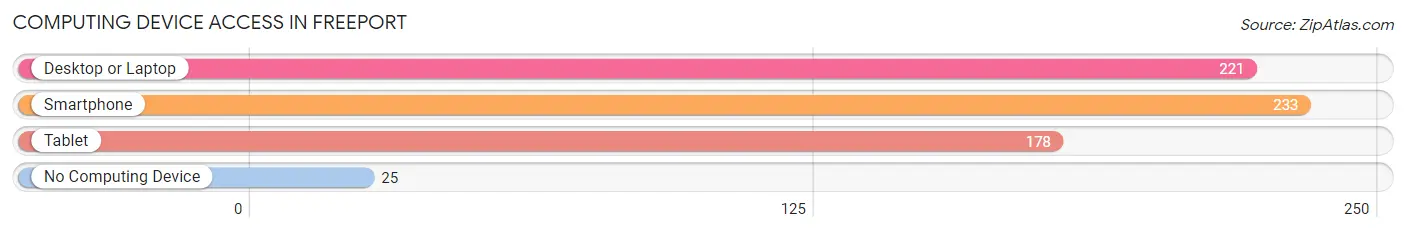
| Device Type | # Households | % Households |
| Desktop or Laptop | 221 | 76.7% |
| Smartphone | 233 | 80.9% |
| Tablet | 178 | 61.8% |
| No Computing Device | 25 | 8.7% |
| Total | 288 | 100.0% |
Internet Access in Freeport
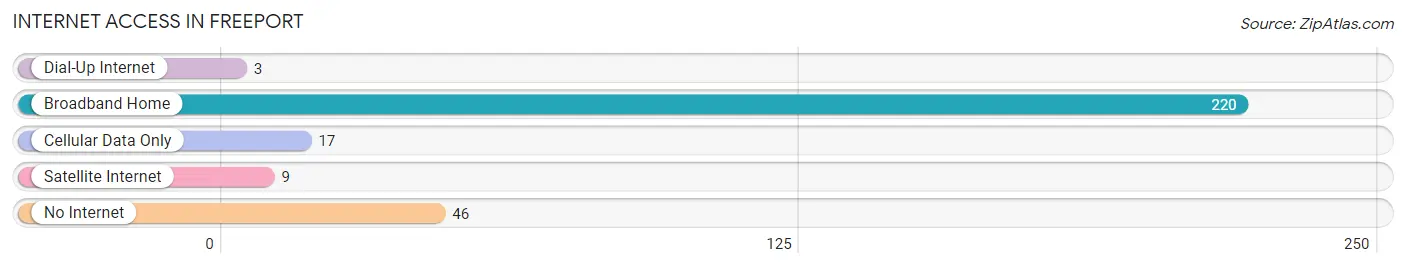
| Internet Type | # Households | % Households |
| Dial-Up Internet | 3 | 1.0% |
| Broadband Home | 220 | 76.4% |
| Cellular Data Only | 17 | 5.9% |
| Satellite Internet | 9 | 3.1% |
| No Internet | 46 | 16.0% |
| Total | 288 | 100.0% |
Freeport Summary
Freeport, Minnesota is a small city located in Stearns County, Minnesota, United States. It is situated on the banks of the Sauk River, approximately 20 miles northwest of St. Cloud. The city has a population of 1,845 as of the 2010 census.
History
The area that is now Freeport was first settled in 1856 by German immigrants. The city was originally known as Sauk Centre, but was renamed Freeport in 1872. The name was chosen to honor the town’s founder, John Freeport, who had purchased the land from the government.
The city was incorporated in 1887 and has since grown to become a thriving community. The city has a rich history of industry, with the first sawmill being built in 1872. The city also had a thriving brickyard, which produced bricks for many of the buildings in the area.
Geography
Freeport is located in Stearns County, Minnesota, approximately 20 miles northwest of St. Cloud. The city is situated on the banks of the Sauk River, which flows through the city. The city is surrounded by rolling hills and farmland, and is located in the heart of Minnesota’s lake country.
The city has a total area of 1.2 square miles, all of which is land. The city has a humid continental climate, with cold winters and warm summers.
Economy
Freeport’s economy is largely based on agriculture and tourism. The city is home to several farms, which produce a variety of crops, including corn, soybeans, and wheat. The city is also home to several small businesses, including restaurants, retail stores, and service providers.
The city is also a popular tourist destination, with many visitors coming to enjoy the city’s natural beauty and outdoor activities. The city is home to several parks, including the Sauk River Park, which offers camping, fishing, and hiking.
Demographics
As of the 2010 census, Freeport had a population of 1,845. The city has a median age of 39.7 years, with 51.2% of the population being male and 48.8% being female. The city has a median household income of $45,945, and a poverty rate of 11.3%.
The city is predominantly white, with 91.2% of the population being white. The city also has a small Hispanic population, with 4.2% of the population being Hispanic or Latino. The city also has a small African American population, with 1.2% of the population being African American.
Conclusion
Freeport, Minnesota is a small city located in Stearns County, Minnesota, United States. It is situated on the banks of the Sauk River, approximately 20 miles northwest of St. Cloud. The city has a population of 1,845 as of the 2010 census. The city has a rich history of industry, with the first sawmill being built in 1872. The city’s economy is largely based on agriculture and tourism, and the city is a popular tourist destination. The city is predominantly white, with 91.2% of the population being white. The city also has a small Hispanic population, with 4.2% of the population being Hispanic or Latino. The city also has a small African American population, with 1.2% of the population being African American.
Common Questions
What is Per Capita Income in Freeport?
Per Capita income in Freeport is $54,675.
What is the Median Family Income in Freeport?
Median Family Income in Freeport is $119,688.
What is the Median Household income in Freeport?
Median Household Income in Freeport is $91,250.
What is Income or Wage Gap in Freeport?
Income or Wage Gap in Freeport is 19.8%.
Women in Freeport earn 80.2 cents for every dollar earned by a man.
What is Inequality or Gini Index in Freeport?
Inequality or Gini Index in Freeport is 0.54.
What is the Total Population of Freeport?
Total Population of Freeport is 822.
What is the Total Male Population of Freeport?
Total Male Population of Freeport is 460.
What is the Total Female Population of Freeport?
Total Female Population of Freeport is 362.
What is the Ratio of Males per 100 Females in Freeport?
There are 127.07 Males per 100 Females in Freeport.
What is the Ratio of Females per 100 Males in Freeport?
There are 78.70 Females per 100 Males in Freeport.
What is the Median Population Age in Freeport?
Median Population Age in Freeport is 29.9 Years.
What is the Average Family Size in Freeport
Average Family Size in Freeport is 3.5 People.
What is the Average Household Size in Freeport
Average Household Size in Freeport is 2.9 People.
How Large is the Labor Force in Freeport?
There are 441 People in the Labor Forcein in Freeport.
What is the Percentage of People in the Labor Force in Freeport?
79.3% of People are in the Labor Force in Freeport.
What is the Unemployment Rate in Freeport?
Unemployment Rate in Freeport is 1.6%.