Foxhome, MN Map & Demographics
Foxhome Map
Foxhome Overview
$20,801
PER CAPITA INCOME
$39,375
AVG FAMILY INCOME
$57,188
AVG HOUSEHOLD INCOME
0.37
INEQUALITY / GINI INDEX
113
TOTAL POPULATION
47
MALE POPULATION
66
FEMALE POPULATION
71.21
MALES / 100 FEMALES
140.43
FEMALES / 100 MALES
31.6
MEDIAN AGE
3.1
AVG FAMILY SIZE
3.0
AVG HOUSEHOLD SIZE
62
LABOR FORCE [ PEOPLE ]
73.8%
PERCENT IN LABOR FORCE
5.0%
UNEMPLOYMENT RATE
Foxhome Zip Codes
Foxhome Area Codes
Income in Foxhome
Income Overview in Foxhome
Per Capita Income in Foxhome is $20,801, while median incomes of families and households are $39,375 and $57,188 respectively.
| Characteristic | Number | Measure |
| Per Capita Income | 113 | $20,801 |
| Median Family Income | 29 | $39,375 |
| Mean Family Income | 29 | $58,379 |
| Median Household Income | 37 | $57,188 |
| Mean Household Income | 37 | $68,105 |
| Income Deficit | 29 | $0 |
| Wage / Income Gap (%) | 113 | 0.00% |
| Wage / Income Gap ($) | 113 | 100.00¢ per $1 |
| Gini / Inequality Index | 113 | 0.37 |
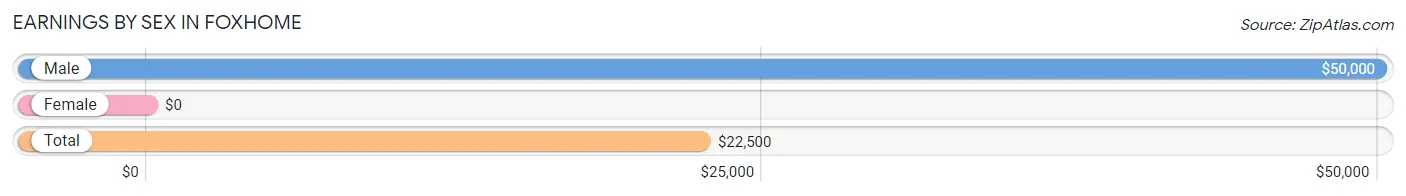
Earnings by Sex in Foxhome
| Sex | Number | Average Earnings |
| Male | 26 (43.3%) | $50,000 |
| Female | 34 (56.7%) | $0 |
| Total | 60 (100.0%) | $22,500 |
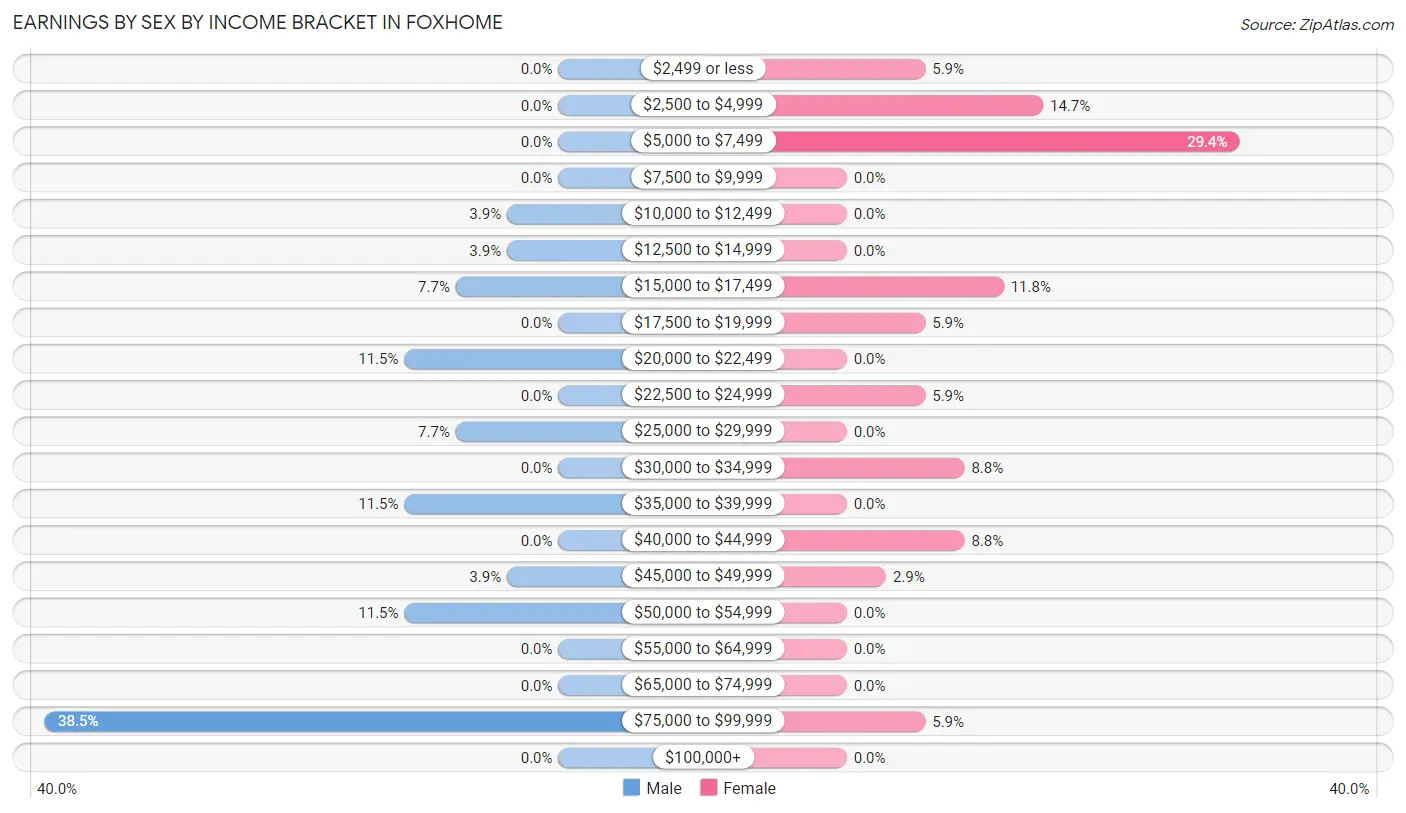
Earnings by Sex by Income Bracket in Foxhome
The most common earnings brackets in Foxhome are $75,000 to $99,999 for men (10 | 38.5%) and $5,000 to $7,499 for women (10 | 29.4%).
| Income | Male | Female |
| $2,499 or less | 0 (0.0%) | 2 (5.9%) |
| $2,500 to $4,999 | 0 (0.0%) | 5 (14.7%) |
| $5,000 to $7,499 | 0 (0.0%) | 10 (29.4%) |
| $7,500 to $9,999 | 0 (0.0%) | 0 (0.0%) |
| $10,000 to $12,499 | 1 (3.8%) | 0 (0.0%) |
| $12,500 to $14,999 | 1 (3.8%) | 0 (0.0%) |
| $15,000 to $17,499 | 2 (7.7%) | 4 (11.8%) |
| $17,500 to $19,999 | 0 (0.0%) | 2 (5.9%) |
| $20,000 to $22,499 | 3 (11.5%) | 0 (0.0%) |
| $22,500 to $24,999 | 0 (0.0%) | 2 (5.9%) |
| $25,000 to $29,999 | 2 (7.7%) | 0 (0.0%) |
| $30,000 to $34,999 | 0 (0.0%) | 3 (8.8%) |
| $35,000 to $39,999 | 3 (11.5%) | 0 (0.0%) |
| $40,000 to $44,999 | 0 (0.0%) | 3 (8.8%) |
| $45,000 to $49,999 | 1 (3.8%) | 1 (2.9%) |
| $50,000 to $54,999 | 3 (11.5%) | 0 (0.0%) |
| $55,000 to $64,999 | 0 (0.0%) | 0 (0.0%) |
| $65,000 to $74,999 | 0 (0.0%) | 0 (0.0%) |
| $75,000 to $99,999 | 10 (38.5%) | 2 (5.9%) |
| $100,000+ | 0 (0.0%) | 0 (0.0%) |
| Total | 26 (100.0%) | 34 (100.0%) |
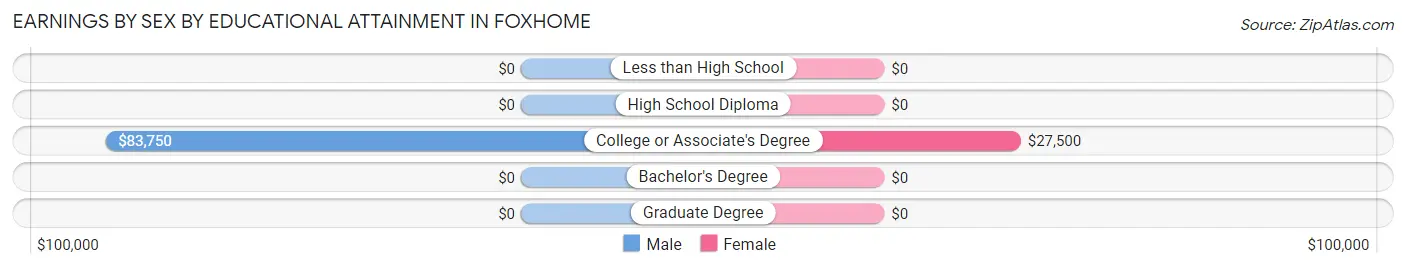
Earnings by Sex by Educational Attainment in Foxhome
Average earnings in Foxhome are $52,917 for men and $16,563 for women, a difference of 68.7%. Men with an educational attainment of college or associate's degree enjoy the highest average annual earnings of $83,750, while those with college or associate's degree education earn the least with $83,750. Women with an educational attainment of college or associate's degree earn the most with the average annual earnings of $27,500, while those with college or associate's degree education have the smallest earnings of $27,500.
| Educational Attainment | Male Income | Female Income |
| Less than High School | - | - |
| High School Diploma | - | - |
| College or Associate's Degree | $83,750 | $27,500 |
| Bachelor's Degree | - | - |
| Graduate Degree | - | - |
| Total | $52,917 | $16,563 |
Family Income in Foxhome
Family Income Brackets in Foxhome
According to the Foxhome family income data, there are 7 families falling into the less than $10,000 income range, which is the most common income bracket and makes up 24.1% of all families.
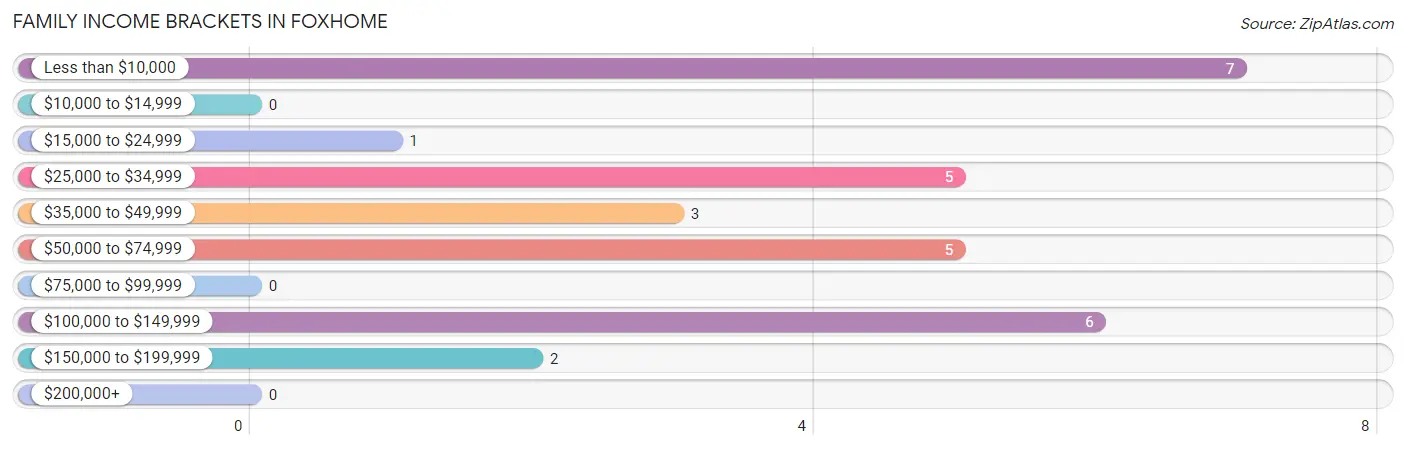
| Income Bracket | # Families | % Families |
| Less than $10,000 | 7 | 24.1% |
| $10,000 to $14,999 | 0 | 0.0% |
| $15,000 to $24,999 | 1 | 3.4% |
| $25,000 to $34,999 | 5 | 17.2% |
| $35,000 to $49,999 | 3 | 10.3% |
| $50,000 to $74,999 | 5 | 17.2% |
| $75,000 to $99,999 | 0 | 0.0% |
| $100,000 to $149,999 | 6 | 20.7% |
| $150,000 to $199,999 | 2 | 6.9% |
| $200,000+ | 0 | 0.0% |
Family Income by Famaliy Size in Foxhome
| Income Bracket | # Families | Median Income |
| 2-Person Families | 6 (20.7%) | $0 |
| 3-Person Families | 14 (48.3%) | $0 |
| 4-Person Families | 3 (10.3%) | $0 |
| 5-Person Families | 4 (13.8%) | $0 |
| 6-Person Families | 2 (6.9%) | $0 |
| 7+ Person Families | 0 (0.0%) | $0 |
| Total | 29 (100.0%) | $39,375 |
Family Income by Number of Earners in Foxhome
| Number of Earners | # Families | Median Income |
| No Earners | 2 (6.9%) | $0 |
| 1 Earner | 9 (31.0%) | $0 |
| 2 Earners | 16 (55.2%) | $0 |
| 3+ Earners | 2 (6.9%) | $0 |
| Total | 29 (100.0%) | $39,375 |
Household Income in Foxhome
Household Income Brackets in Foxhome
With 12 households falling in the category, the $50,000 to $74,999 income range is the most frequent in Foxhome, accounting for 32.4% of all households.
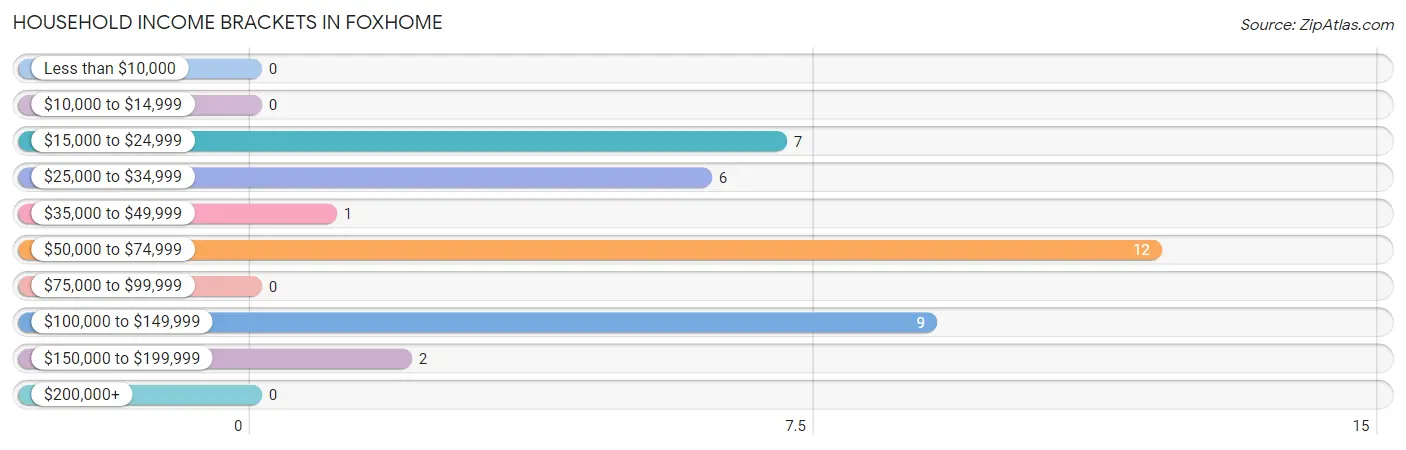
| Income Bracket | # Households | % Households |
| Less than $10,000 | 0 | 0.0% |
| $10,000 to $14,999 | 0 | 0.0% |
| $15,000 to $24,999 | 7 | 18.9% |
| $25,000 to $34,999 | 6 | 16.2% |
| $35,000 to $49,999 | 1 | 2.7% |
| $50,000 to $74,999 | 12 | 32.4% |
| $75,000 to $99,999 | 0 | 0.0% |
| $100,000 to $149,999 | 9 | 24.3% |
| $150,000 to $199,999 | 2 | 5.4% |
| $200,000+ | 0 | 0.0% |
Household Income by Householder Age in Foxhome
The median household income in Foxhome is $57,188, with the highest median household income of $60,625 found in the 65+ years age bracket for the primary householder. A total of 7 households (18.9%) fall into this category.
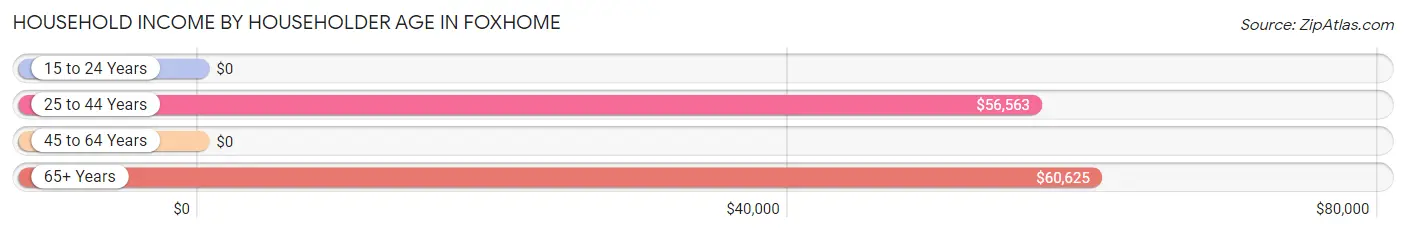
| Income Bracket | # Households | Median Income |
| 15 to 24 Years | 0 (0.0%) | $0 |
| 25 to 44 Years | 19 (51.3%) | $56,563 |
| 45 to 64 Years | 11 (29.7%) | $0 |
| 65+ Years | 7 (18.9%) | $60,625 |
| Total | 37 (100.0%) | $57,188 |
Poverty in Foxhome
Income Below Poverty by Sex and Age in Foxhome
With 10.6% poverty level for males and 33.3% for females among the residents of Foxhome, under 5 year old males and 25 to 34 year old females are the most vulnerable to poverty, with 1 males (50.0%) and 10 females (71.4%) in their respective age groups living below the poverty level.
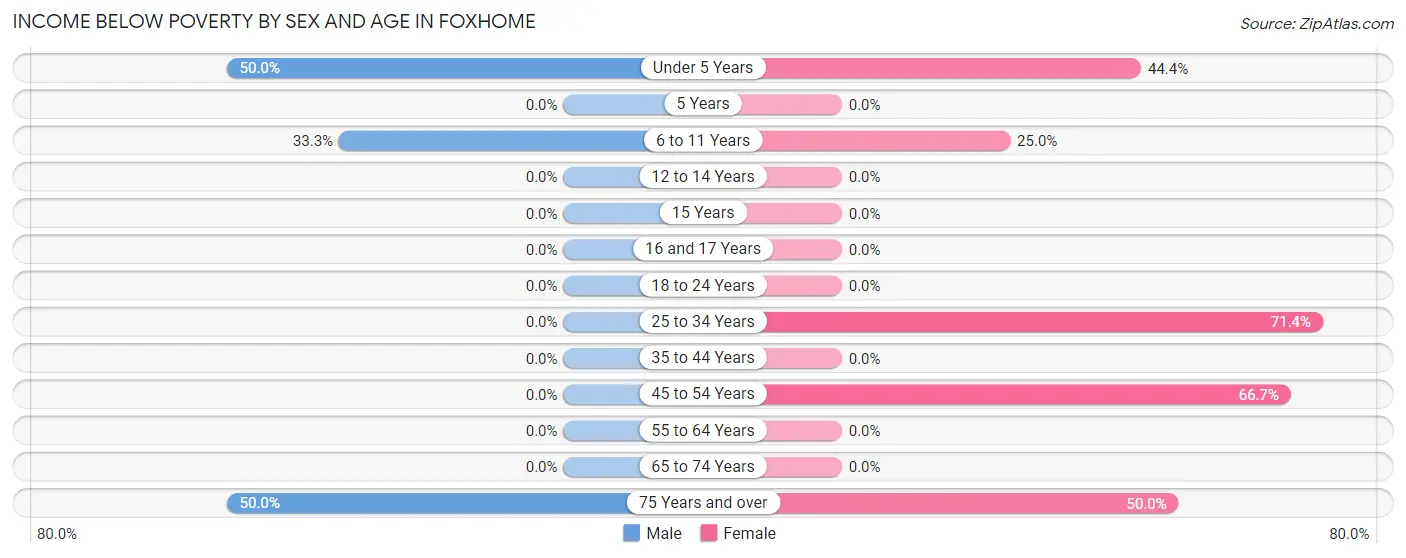
| Age Bracket | Male | Female |
| Under 5 Years | 1 (50.0%) | 4 (44.4%) |
| 5 Years | 0 (0.0%) | 0 (0.0%) |
| 6 to 11 Years | 3 (33.3%) | 1 (25.0%) |
| 12 to 14 Years | 0 (0.0%) | 0 (0.0%) |
| 15 Years | 0 (0.0%) | 0 (0.0%) |
| 16 and 17 Years | 0 (0.0%) | 0 (0.0%) |
| 18 to 24 Years | 0 (0.0%) | 0 (0.0%) |
| 25 to 34 Years | 0 (0.0%) | 10 (71.4%) |
| 35 to 44 Years | 0 (0.0%) | 0 (0.0%) |
| 45 to 54 Years | 0 (0.0%) | 6 (66.7%) |
| 55 to 64 Years | 0 (0.0%) | 0 (0.0%) |
| 65 to 74 Years | 0 (0.0%) | 0 (0.0%) |
| 75 Years and over | 1 (50.0%) | 1 (50.0%) |
| Total | 5 (10.6%) | 22 (33.3%) |
Income Above Poverty by Sex and Age in Foxhome
According to the poverty statistics in Foxhome, males aged 12 to 14 years and females aged 12 to 14 years are the age groups that are most secure financially, with 100.0% of males and 100.0% of females in these age groups living above the poverty line.
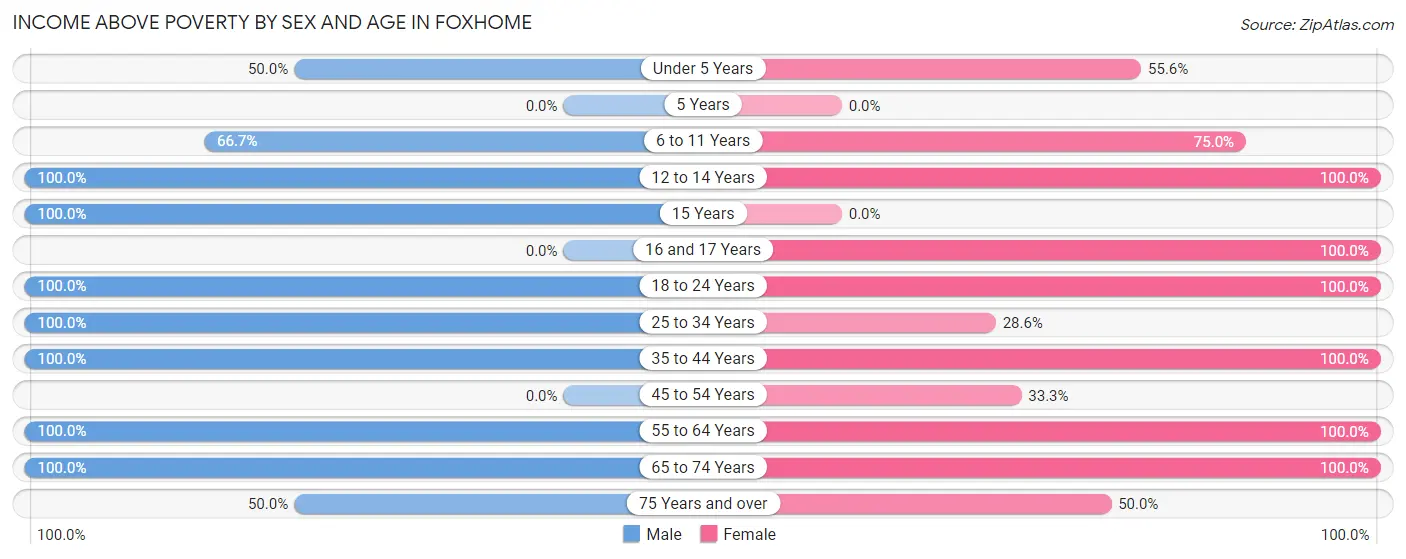
| Age Bracket | Male | Female |
| Under 5 Years | 1 (50.0%) | 5 (55.6%) |
| 5 Years | 0 (0.0%) | 0 (0.0%) |
| 6 to 11 Years | 6 (66.7%) | 3 (75.0%) |
| 12 to 14 Years | 1 (100.0%) | 3 (100.0%) |
| 15 Years | 1 (100.0%) | 0 (0.0%) |
| 16 and 17 Years | 0 (0.0%) | 5 (100.0%) |
| 18 to 24 Years | 1 (100.0%) | 5 (100.0%) |
| 25 to 34 Years | 15 (100.0%) | 4 (28.6%) |
| 35 to 44 Years | 3 (100.0%) | 7 (100.0%) |
| 45 to 54 Years | 0 (0.0%) | 3 (33.3%) |
| 55 to 64 Years | 10 (100.0%) | 5 (100.0%) |
| 65 to 74 Years | 3 (100.0%) | 3 (100.0%) |
| 75 Years and over | 1 (50.0%) | 1 (50.0%) |
| Total | 42 (89.4%) | 44 (66.7%) |
Income Below Poverty Among Married-Couple Families in Foxhome
The poverty statistics for married-couple families in Foxhome show that 5.6% or 1 of the total 18 families live below the poverty line. Families with no children have the highest poverty rate of 10.0%, comprising of 1 families. On the other hand, families with 1 or 2 children have the lowest poverty rate of 0.0%, which includes 0 families.
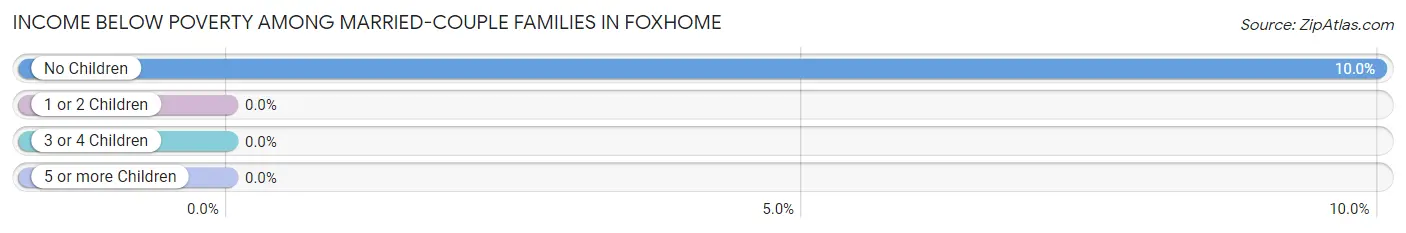
| Children | Above Poverty | Below Poverty |
| No Children | 9 (90.0%) | 1 (10.0%) |
| 1 or 2 Children | 4 (100.0%) | 0 (0.0%) |
| 3 or 4 Children | 4 (100.0%) | 0 (0.0%) |
| 5 or more Children | 0 (0.0%) | 0 (0.0%) |
| Total | 17 (94.4%) | 1 (5.6%) |
Income Below Poverty Among Single-Parent Households in Foxhome
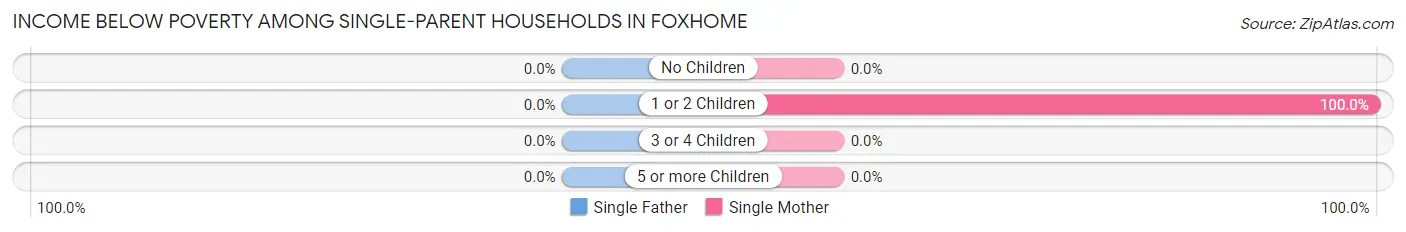
| Children | Single Father | Single Mother |
| No Children | 0 (0.0%) | 0 (0.0%) |
| 1 or 2 Children | 0 (0.0%) | 7 (100.0%) |
| 3 or 4 Children | 0 (0.0%) | 0 (0.0%) |
| 5 or more Children | 0 (0.0%) | 0 (0.0%) |
| Total | 0 (0.0%) | 7 (77.8%) |
Income Below Poverty Among Married-Couple vs Single-Parent Households in Foxhome
The poverty data for Foxhome shows that 1 of the married-couple family households (5.6%) and 7 of the single-parent households (63.6%) are living below the poverty level. Within the married-couple family households, those with no children have the highest poverty rate, with 1 households (10.0%) falling below the poverty line. Among the single-parent households, those with 1 or 2 children have the highest poverty rate, with 7 household (77.8%) living below poverty.
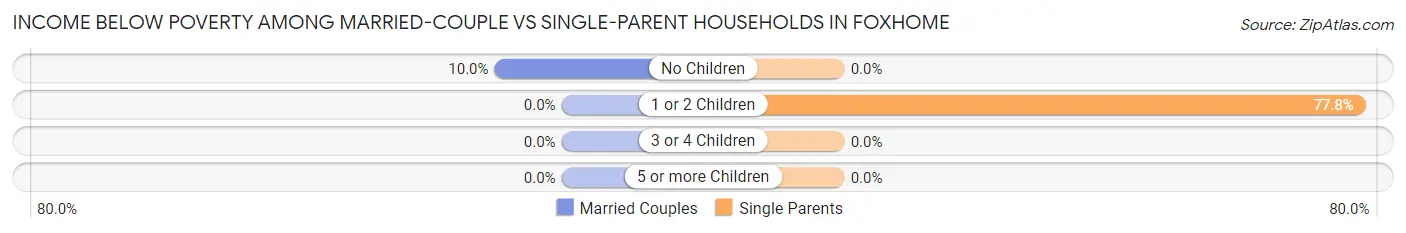
| Children | Married-Couple Families | Single-Parent Households |
| No Children | 1 (10.0%) | 0 (0.0%) |
| 1 or 2 Children | 0 (0.0%) | 7 (77.8%) |
| 3 or 4 Children | 0 (0.0%) | 0 (0.0%) |
| 5 or more Children | 0 (0.0%) | 0 (0.0%) |
| Total | 1 (5.6%) | 7 (63.6%) |
Race in Foxhome
The most populous races in Foxhome are White / Caucasian (108 | 95.6%), and Two or more Races (5 | 4.4%).
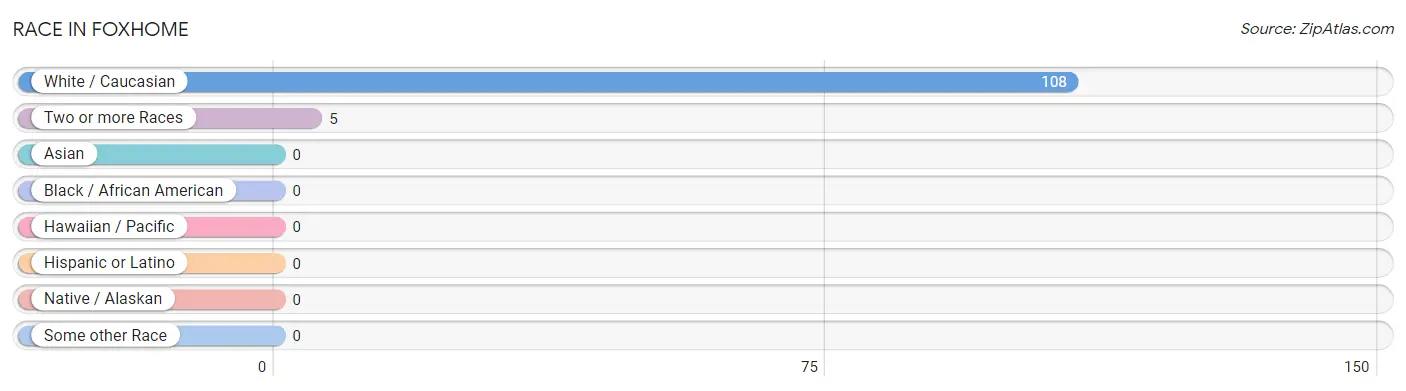
| Race | # Population | % Population |
| Asian | 0 | 0.0% |
| Black / African American | 0 | 0.0% |
| Hawaiian / Pacific | 0 | 0.0% |
| Hispanic or Latino | 0 | 0.0% |
| Native / Alaskan | 0 | 0.0% |
| White / Caucasian | 108 | 95.6% |
| Two or more Races | 5 | 4.4% |
| Some other Race | 0 | 0.0% |
| Total | 113 | 100.0% |
Ancestry in Foxhome
The most populous ancestries reported in Foxhome are German (56 | 49.6%), Norwegian (49 | 43.4%), French (10 | 8.8%), American (6 | 5.3%), and Polish (6 | 5.3%), together accounting for 112.4% of all Foxhome residents.
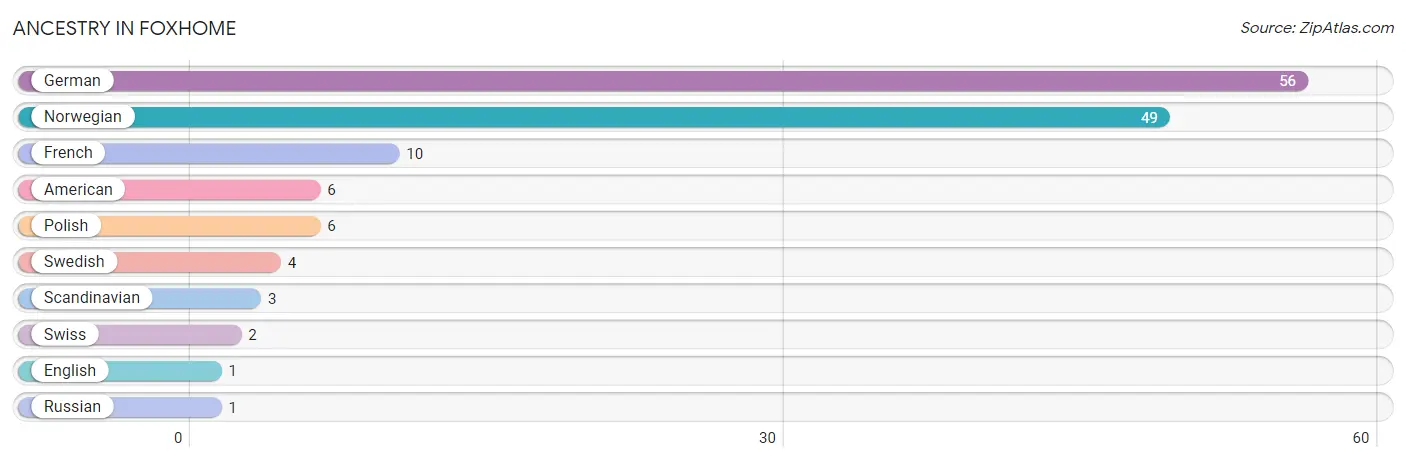
| Ancestry | # Population | % Population |
| American | 6 | 5.3% |
| English | 1 | 0.9% |
| French | 10 | 8.8% |
| German | 56 | 49.6% |
| Norwegian | 49 | 43.4% |
| Polish | 6 | 5.3% |
| Russian | 1 | 0.9% |
| Scandinavian | 3 | 2.6% |
| Swedish | 4 | 3.5% |
| Swiss | 2 | 1.8% | View All 10 Rows |
Immigrants in Foxhome

| Immigration Origin | # Population | % Population | View All 0 Rows |
Sex and Age in Foxhome
Sex and Age in Foxhome
The most populous age groups in Foxhome are 30 to 34 Years (13 | 27.7%) for men and Under 5 Years (9 | 13.6%) for women.
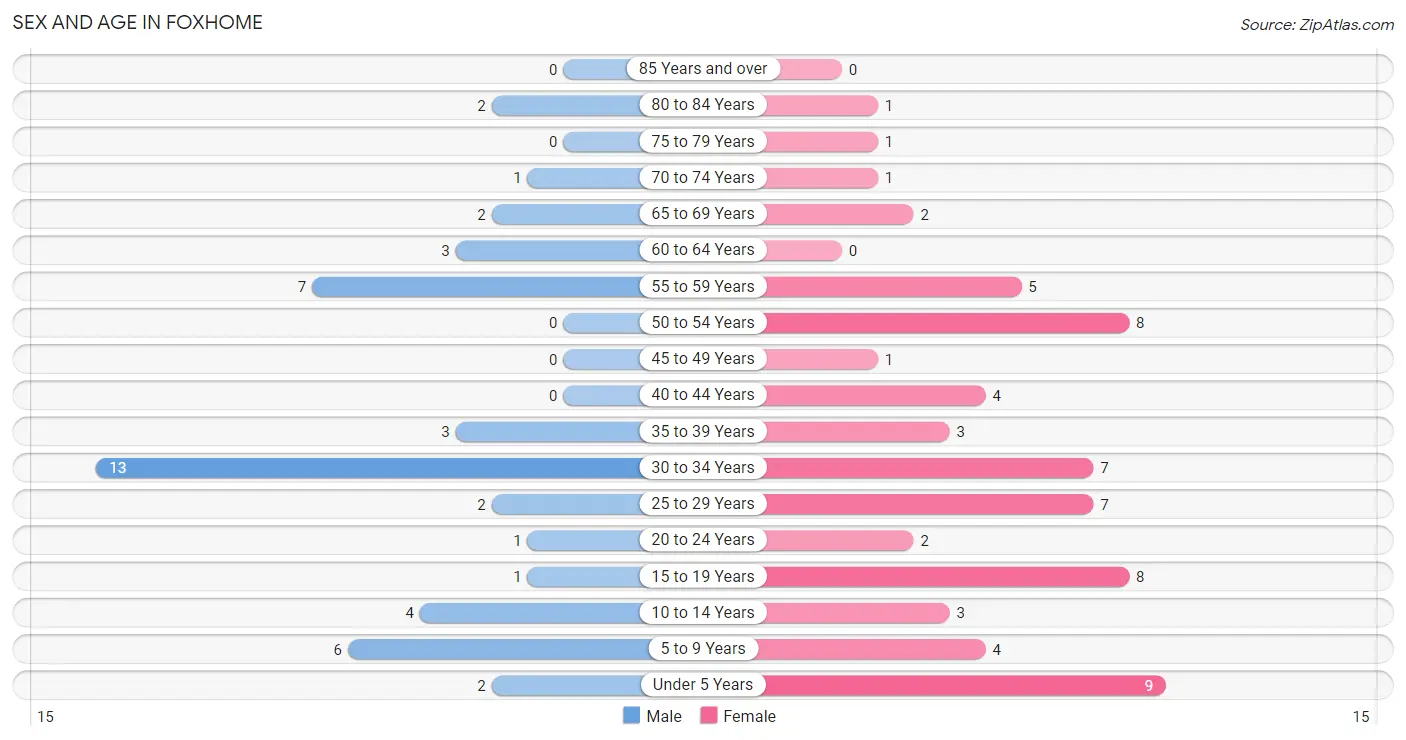
| Age Bracket | Male | Female |
| Under 5 Years | 2 (4.3%) | 9 (13.6%) |
| 5 to 9 Years | 6 (12.8%) | 4 (6.1%) |
| 10 to 14 Years | 4 (8.5%) | 3 (4.5%) |
| 15 to 19 Years | 1 (2.1%) | 8 (12.1%) |
| 20 to 24 Years | 1 (2.1%) | 2 (3.0%) |
| 25 to 29 Years | 2 (4.3%) | 7 (10.6%) |
| 30 to 34 Years | 13 (27.7%) | 7 (10.6%) |
| 35 to 39 Years | 3 (6.4%) | 3 (4.5%) |
| 40 to 44 Years | 0 (0.0%) | 4 (6.1%) |
| 45 to 49 Years | 0 (0.0%) | 1 (1.5%) |
| 50 to 54 Years | 0 (0.0%) | 8 (12.1%) |
| 55 to 59 Years | 7 (14.9%) | 5 (7.6%) |
| 60 to 64 Years | 3 (6.4%) | 0 (0.0%) |
| 65 to 69 Years | 2 (4.3%) | 2 (3.0%) |
| 70 to 74 Years | 1 (2.1%) | 1 (1.5%) |
| 75 to 79 Years | 0 (0.0%) | 1 (1.5%) |
| 80 to 84 Years | 2 (4.3%) | 1 (1.5%) |
| 85 Years and over | 0 (0.0%) | 0 (0.0%) |
| Total | 47 (100.0%) | 66 (100.0%) |
Families and Households in Foxhome
Median Family Size in Foxhome
The median family size in Foxhome is 3.07 persons per family, with married-couple families (18 | 62.1%) accounting for the largest median family size of 3.17 persons per family. On the other hand, single male/father families (2 | 6.9%) represent the smallest median family size with 2.50 persons per family.
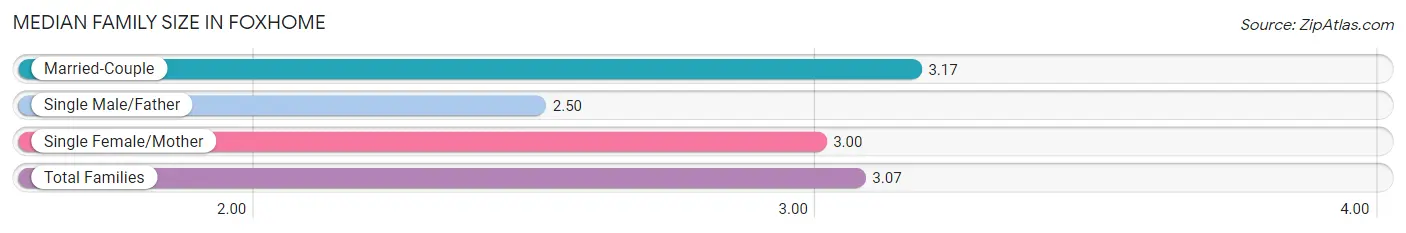
| Family Type | # Families | Family Size |
| Married-Couple | 18 (62.1%) | 3.17 |
| Single Male/Father | 2 (6.9%) | 2.50 |
| Single Female/Mother | 9 (31.0%) | 3.00 |
| Total Families | 29 (100.0%) | 3.07 |
Median Household Size in Foxhome
The median household size in Foxhome is 3.05 persons per household, with single male/father households (2 | 5.4%) accounting for the largest median household size of 4 persons per household. non-family households (8 | 21.6%) represent the smallest median household size with 1.75 persons per household.
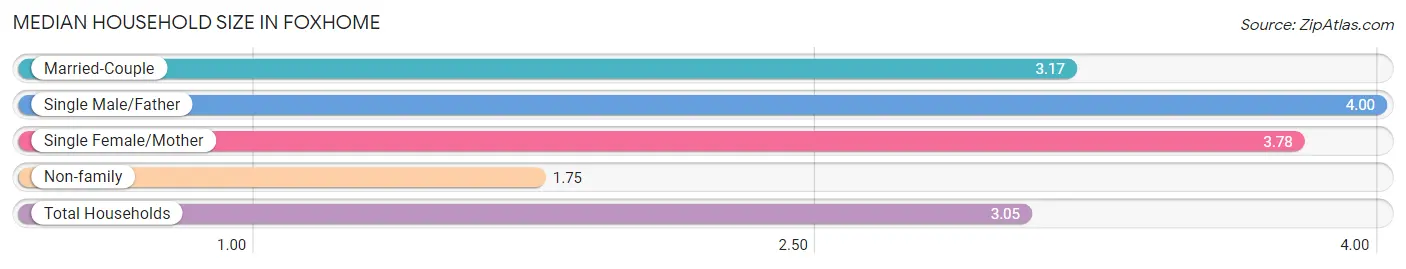
| Household Type | # Households | Household Size |
| Married-Couple | 18 (48.6%) | 3.17 |
| Single Male/Father | 2 (5.4%) | 4.00 |
| Single Female/Mother | 9 (24.3%) | 3.78 |
| Non-family | 8 (21.6%) | 1.75 |
| Total Households | 37 (100.0%) | 3.05 |
Household Size by Marriage Status in Foxhome
Out of a total of 37 households in Foxhome, 29 (78.4%) are family households, while 8 (21.6%) are nonfamily households. The most numerous type of family households are 4-person households, comprising 12, and the most common type of nonfamily households are 1-person households, comprising 5.
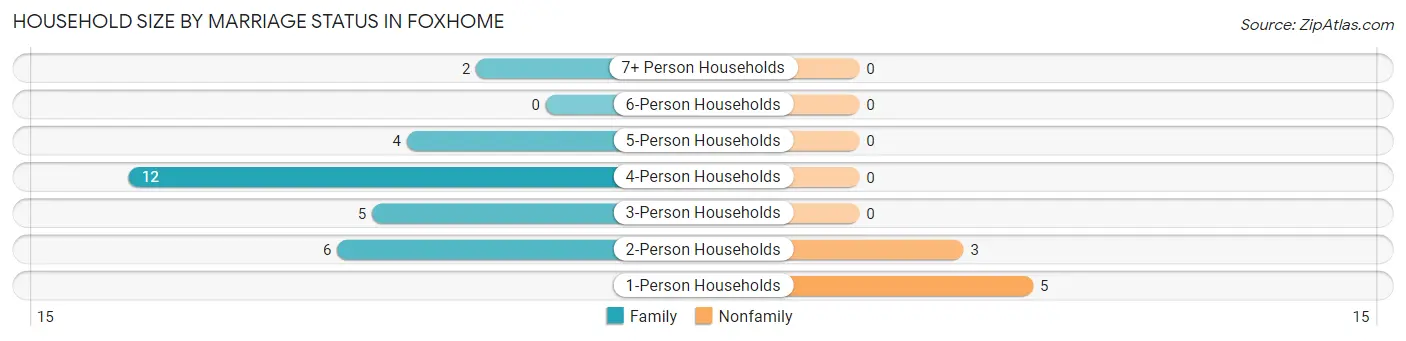
| Household Size | Family Households | Nonfamily Households |
| 1-Person Households | - | 5 (13.5%) |
| 2-Person Households | 6 (16.2%) | 3 (8.1%) |
| 3-Person Households | 5 (13.5%) | 0 (0.0%) |
| 4-Person Households | 12 (32.4%) | 0 (0.0%) |
| 5-Person Households | 4 (10.8%) | 0 (0.0%) |
| 6-Person Households | 0 (0.0%) | 0 (0.0%) |
| 7+ Person Households | 2 (5.4%) | 0 (0.0%) |
| Total | 29 (78.4%) | 8 (21.6%) |
Female Fertility in Foxhome
Fertility by Age in Foxhome
Average fertility rate in Foxhome is 61.0 births per 1,000 women. Women in the age bracket of 35 to 50 years have the highest fertility rate with 222.0 births per 1,000 women. Women in the age bracket of 35 to 50 years acount for 100.0% of all women with births.
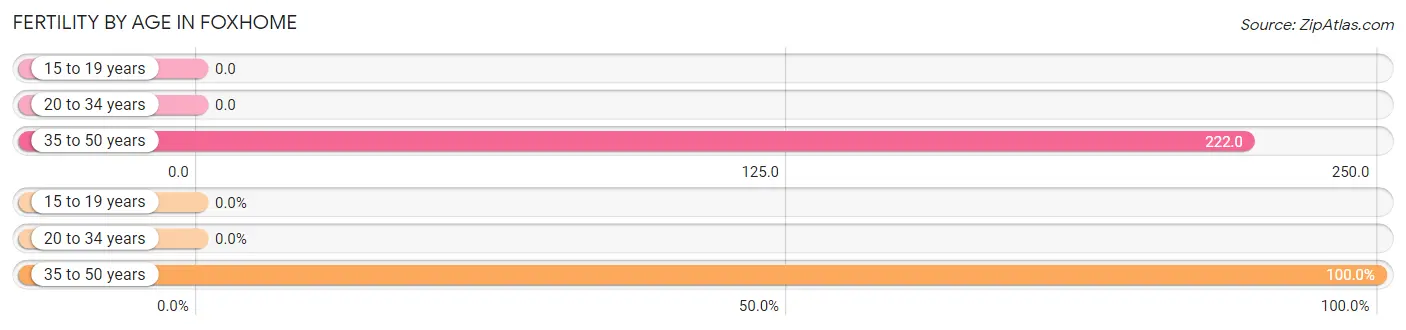
| Age Bracket | Women with Births | Births / 1,000 Women |
| 15 to 19 years | 0 (0.0%) | 0.0 |
| 20 to 34 years | 0 (0.0%) | 0.0 |
| 35 to 50 years | 2 (100.0%) | 222.0 |
| Total | 2 (100.0%) | 61.0 |
Fertility by Age by Marriage Status in Foxhome
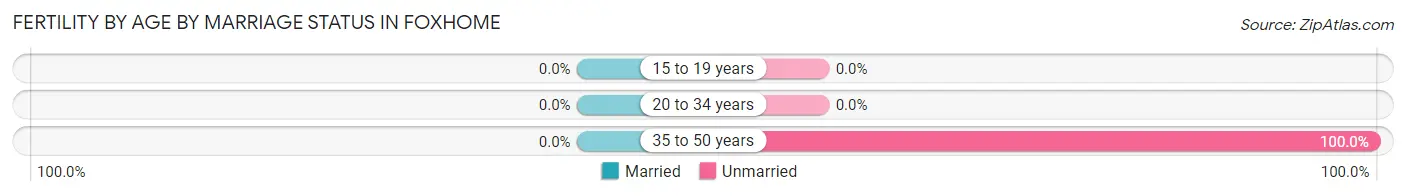
| Age Bracket | Married | Unmarried |
| 15 to 19 years | 0 (0.0%) | 0 (0.0%) |
| 20 to 34 years | 0 (0.0%) | 0 (0.0%) |
| 35 to 50 years | 0 (0.0%) | 2 (100.0%) |
| Total | 0 (0.0%) | 2 (100.0%) |
Fertility by Education in Foxhome
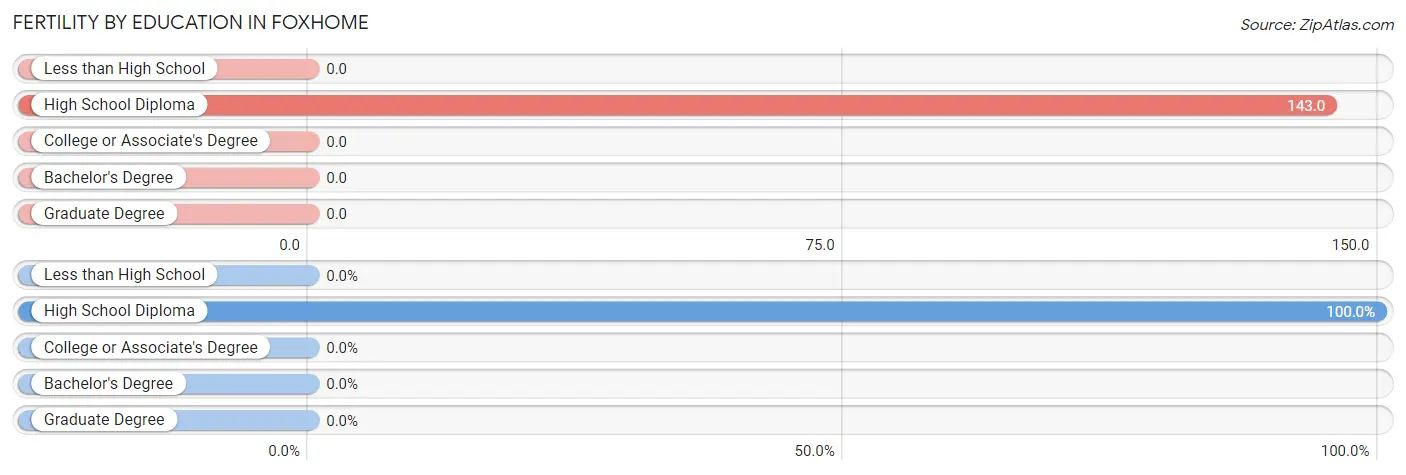
| Educational Attainment | Women with Births | Births / 1,000 Women |
| Less than High School | 0 (0.0%) | 0.0 |
| High School Diploma | 2 (100.0%) | 143.0 |
| College or Associate's Degree | 0 (0.0%) | 0.0 |
| Bachelor's Degree | 0 (0.0%) | 0.0 |
| Graduate Degree | 0 (0.0%) | 0.0 |
| Total | 2 (100.0%) | 61.0 |
Fertility by Education by Marriage Status in Foxhome
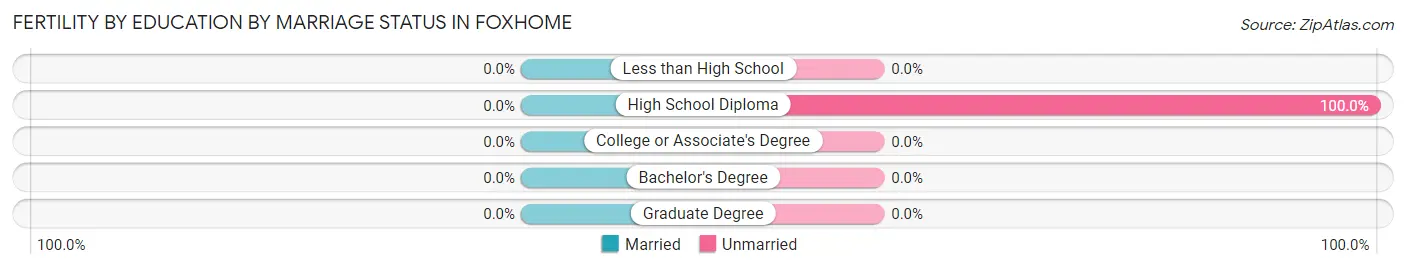
| Educational Attainment | Married | Unmarried |
| Less than High School | 0 (0.0%) | 0 (0.0%) |
| High School Diploma | 0 (0.0%) | 2 (100.0%) |
| College or Associate's Degree | 0 (0.0%) | 0 (0.0%) |
| Bachelor's Degree | 0 (0.0%) | 0 (0.0%) |
| Graduate Degree | 0 (0.0%) | 0 (0.0%) |
| Total | 0 (0.0%) | 2 (100.0%) |
Employment Characteristics in Foxhome
Employment by Class of Employer in Foxhome
Among the 57 employed individuals in Foxhome, private company employees (50 | 87.7%), local government employees (5 | 8.8%), and federal government employees (2 | 3.5%) make up the most common classes of employment.
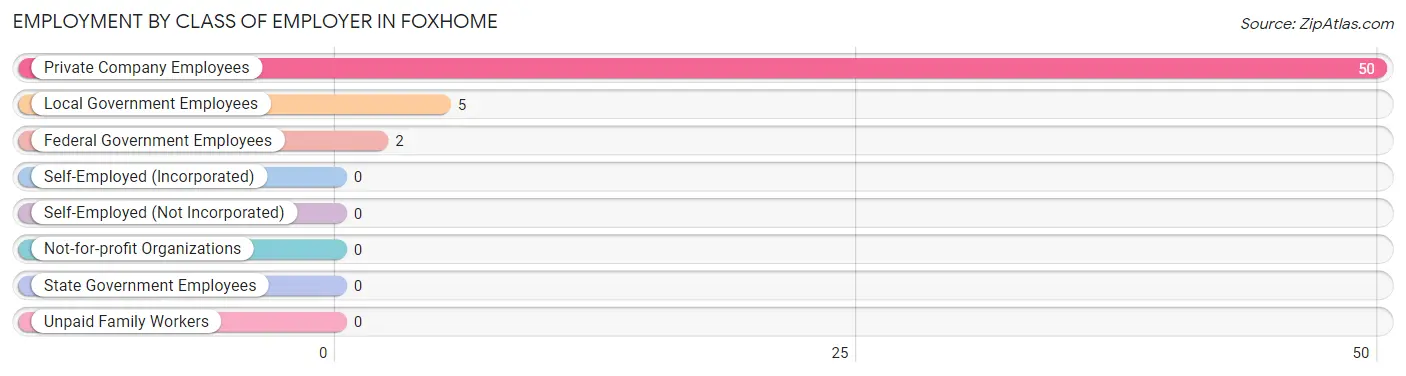
| Employer Class | # Employees | % Employees |
| Private Company Employees | 50 | 87.7% |
| Self-Employed (Incorporated) | 0 | 0.0% |
| Self-Employed (Not Incorporated) | 0 | 0.0% |
| Not-for-profit Organizations | 0 | 0.0% |
| Local Government Employees | 5 | 8.8% |
| State Government Employees | 0 | 0.0% |
| Federal Government Employees | 2 | 3.5% |
| Unpaid Family Workers | 0 | 0.0% |
| Total | 57 | 100.0% |
Employment Status by Age in Foxhome
According to the labor force statistics for Foxhome, out of the total population over 16 years of age (84), 73.8% or 62 individuals are in the labor force, with 5.0% or 3 of them unemployed. The age group with the highest labor force participation rate is 20 to 24 years, with 100.0% or 3 individuals in the labor force. Within the labor force, the 60 to 64 years age range has the highest percentage of unemployed individuals, with 100.0% or 3 of them being unemployed.
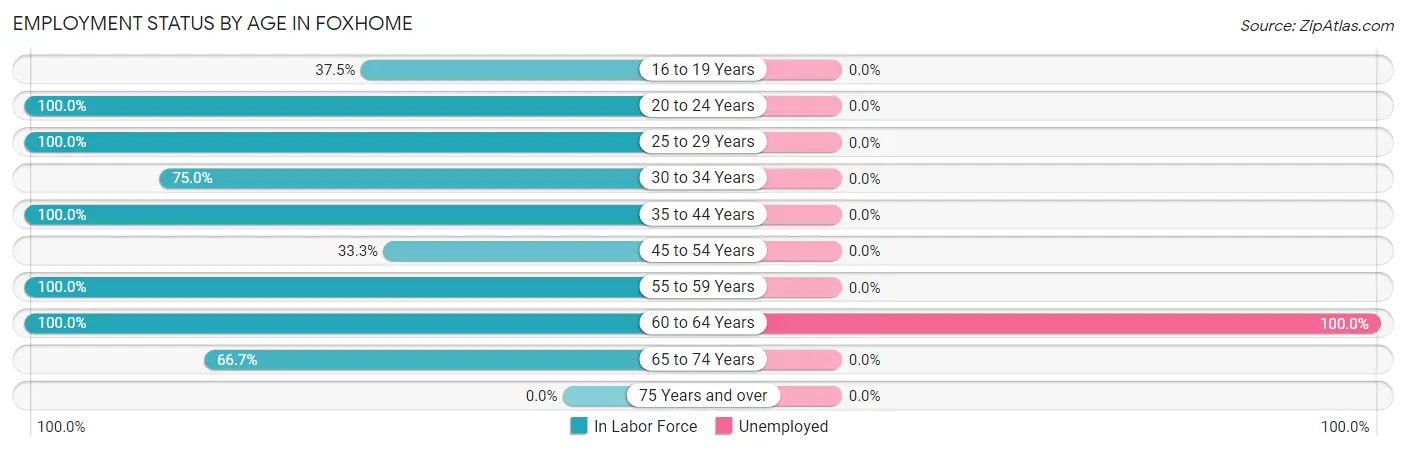
| Age Bracket | In Labor Force | Unemployed |
| 16 to 19 Years | 3 (37.5%) | 0 (0.0%) |
| 20 to 24 Years | 3 (100.0%) | 0 (0.0%) |
| 25 to 29 Years | 9 (100.0%) | 0 (0.0%) |
| 30 to 34 Years | 15 (75.0%) | 0 (0.0%) |
| 35 to 44 Years | 10 (100.0%) | 0 (0.0%) |
| 45 to 54 Years | 3 (33.3%) | 0 (0.0%) |
| 55 to 59 Years | 12 (100.0%) | 0 (0.0%) |
| 60 to 64 Years | 3 (100.0%) | 3 (100.0%) |
| 65 to 74 Years | 4 (66.7%) | 0 (0.0%) |
| 75 Years and over | 0 (0.0%) | 0 (0.0%) |
| Total | 62 (73.8%) | 3 (5.0%) |
Employment Status by Educational Attainment in Foxhome
According to labor force statistics for Foxhome, 82.5% of individuals (52) out of the total population between 25 and 64 years of age (63) are in the labor force, with 6.0% or 3 of them being unemployed. The group with the highest labor force participation rate are those with the educational attainment of less than high school, with 100.0% or 9 individuals in the labor force. Within the labor force, individuals with high school diploma education have the highest percentage of unemployment, with 16.7% or 3 of them being unemployed.
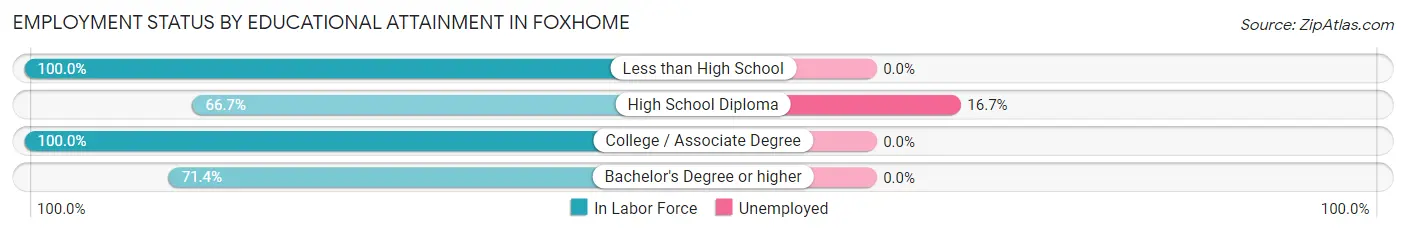
| Educational Attainment | In Labor Force | Unemployed |
| Less than High School | 9 (100.0%) | 0 (0.0%) |
| High School Diploma | 18 (66.7%) | 5 (16.7%) |
| College / Associate Degree | 20 (100.0%) | 0 (0.0%) |
| Bachelor's Degree or higher | 5 (71.4%) | 0 (0.0%) |
| Total | 52 (82.5%) | 4 (6.0%) |
Employment Occupations by Sex in Foxhome
Management, Business, Science and Arts Occupations
The most common Management, Business, Science and Arts occupations in Foxhome are Computers, Engineering & Science (3 | 5.3%), Computers & Mathematics (2 | 3.5%), and Life, Physical & Social Science (1 | 1.8%).
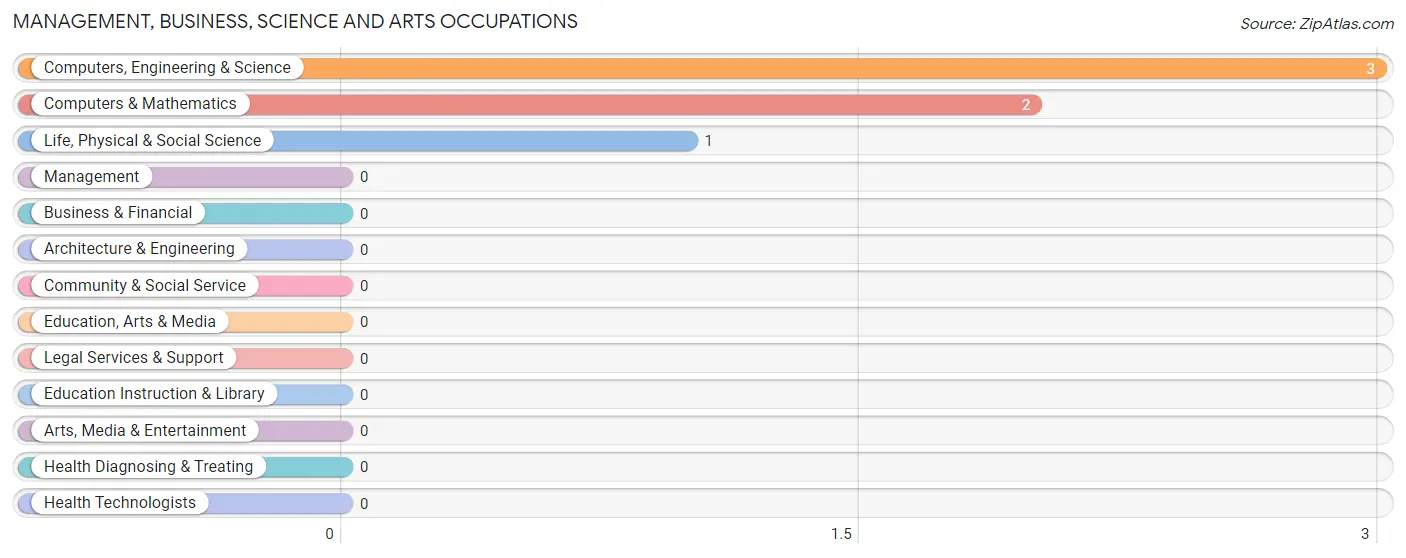
Management, Business, Science and Arts Occupations by Sex
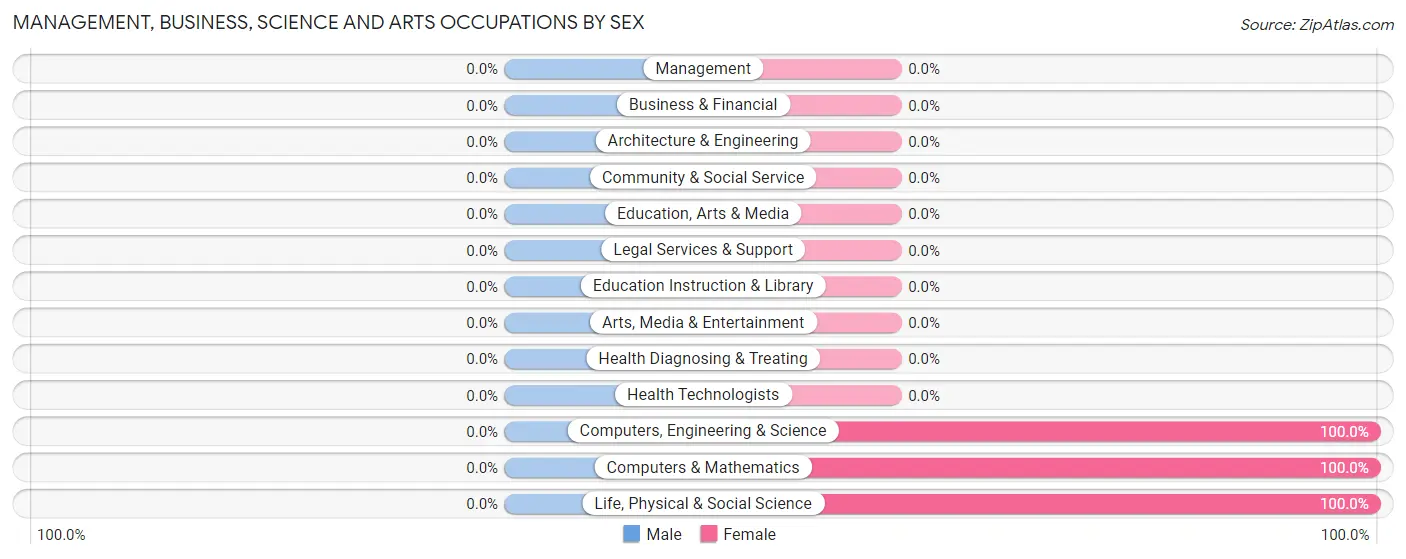
| Occupation | Male | Female |
| Management | 0 (0.0%) | 0 (0.0%) |
| Business & Financial | 0 (0.0%) | 0 (0.0%) |
| Computers, Engineering & Science | 0 (0.0%) | 3 (100.0%) |
| Computers & Mathematics | 0 (0.0%) | 2 (100.0%) |
| Architecture & Engineering | 0 (0.0%) | 0 (0.0%) |
| Life, Physical & Social Science | 0 (0.0%) | 1 (100.0%) |
| Community & Social Service | 0 (0.0%) | 0 (0.0%) |
| Education, Arts & Media | 0 (0.0%) | 0 (0.0%) |
| Legal Services & Support | 0 (0.0%) | 0 (0.0%) |
| Education Instruction & Library | 0 (0.0%) | 0 (0.0%) |
| Arts, Media & Entertainment | 0 (0.0%) | 0 (0.0%) |
| Health Diagnosing & Treating | 0 (0.0%) | 0 (0.0%) |
| Health Technologists | 0 (0.0%) | 0 (0.0%) |
| Total (Category) | 0 (0.0%) | 3 (100.0%) |
| Total (Overall) | 23 (40.4%) | 34 (59.7%) |
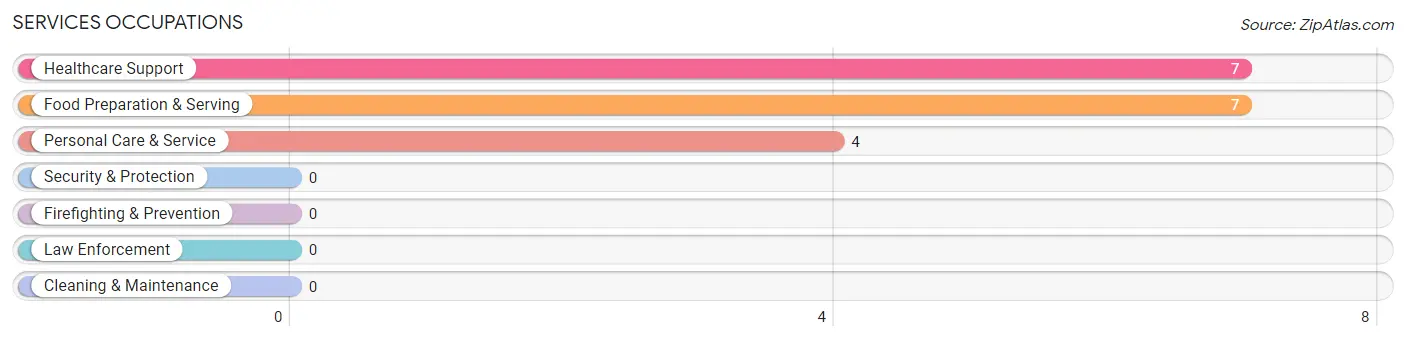
Services Occupations
The most common Services occupations in Foxhome are Healthcare Support (7 | 12.3%), Food Preparation & Serving (7 | 12.3%), and Personal Care & Service (4 | 7.0%).
Services Occupations by Sex
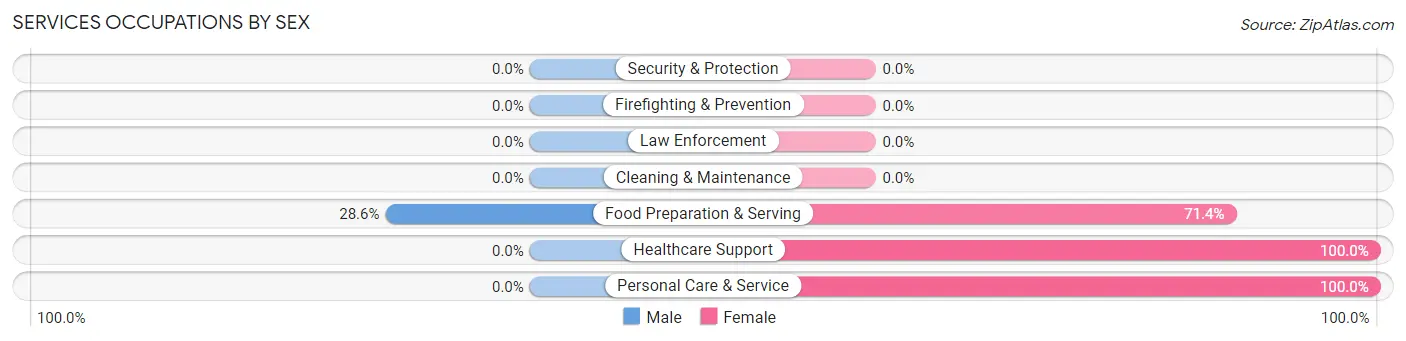
| Occupation | Male | Female |
| Healthcare Support | 0 (0.0%) | 7 (100.0%) |
| Security & Protection | 0 (0.0%) | 0 (0.0%) |
| Firefighting & Prevention | 0 (0.0%) | 0 (0.0%) |
| Law Enforcement | 0 (0.0%) | 0 (0.0%) |
| Food Preparation & Serving | 2 (28.6%) | 5 (71.4%) |
| Cleaning & Maintenance | 0 (0.0%) | 0 (0.0%) |
| Personal Care & Service | 0 (0.0%) | 4 (100.0%) |
| Total (Category) | 2 (11.1%) | 16 (88.9%) |
| Total (Overall) | 23 (40.4%) | 34 (59.7%) |
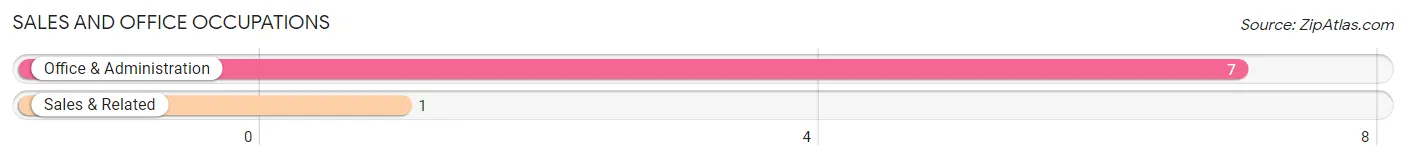
Sales and Office Occupations
The most common Sales and Office occupations in Foxhome are Office & Administration (7 | 12.3%), and Sales & Related (1 | 1.8%).
Sales and Office Occupations by Sex
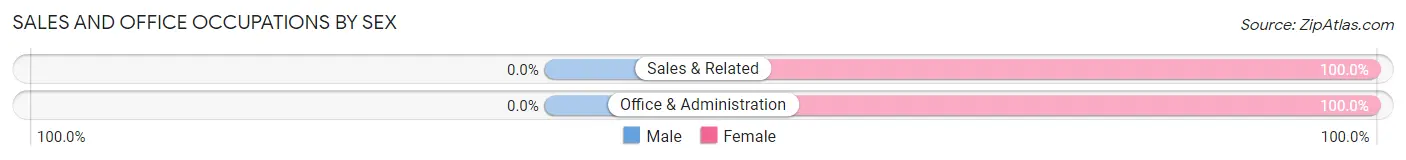
| Occupation | Male | Female |
| Sales & Related | 0 (0.0%) | 1 (100.0%) |
| Office & Administration | 0 (0.0%) | 7 (100.0%) |
| Total (Category) | 0 (0.0%) | 8 (100.0%) |
| Total (Overall) | 23 (40.4%) | 34 (59.7%) |
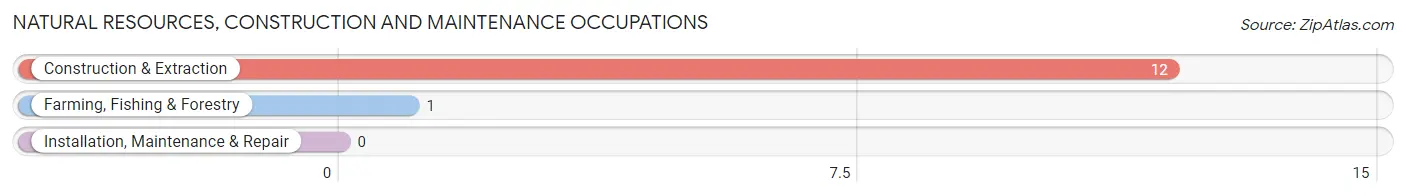
Natural Resources, Construction and Maintenance Occupations
The most common Natural Resources, Construction and Maintenance occupations in Foxhome are Construction & Extraction (12 | 21.0%), and Farming, Fishing & Forestry (1 | 1.8%).
Natural Resources, Construction and Maintenance Occupations by Sex
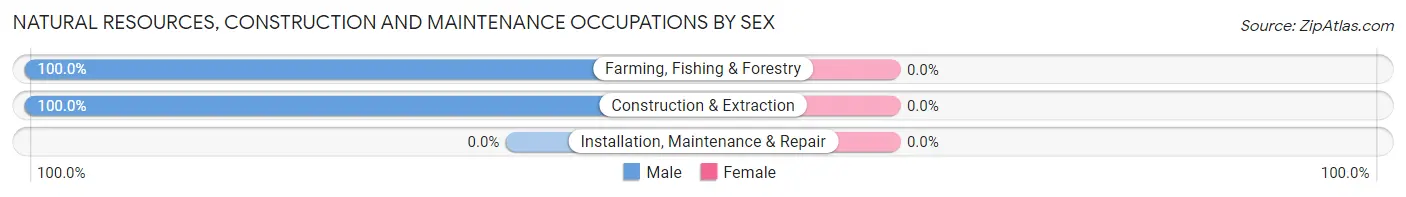
| Occupation | Male | Female |
| Farming, Fishing & Forestry | 1 (100.0%) | 0 (0.0%) |
| Construction & Extraction | 12 (100.0%) | 0 (0.0%) |
| Installation, Maintenance & Repair | 0 (0.0%) | 0 (0.0%) |
| Total (Category) | 13 (100.0%) | 0 (0.0%) |
| Total (Overall) | 23 (40.4%) | 34 (59.7%) |
Production, Transportation and Moving Occupations
The most common Production, Transportation and Moving occupations in Foxhome are Production (12 | 21.0%), Transportation (2 | 3.5%), and Material Moving (1 | 1.8%).
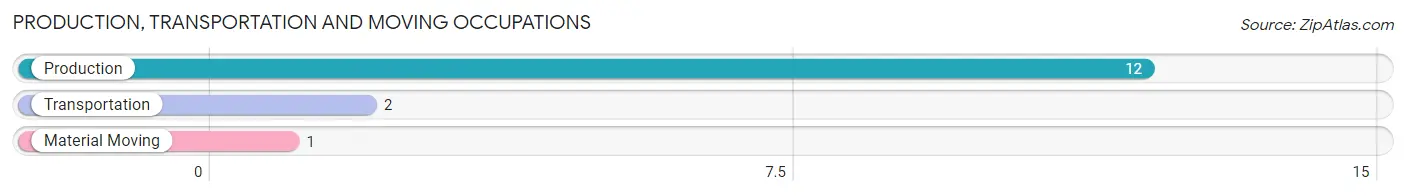
Production, Transportation and Moving Occupations by Sex
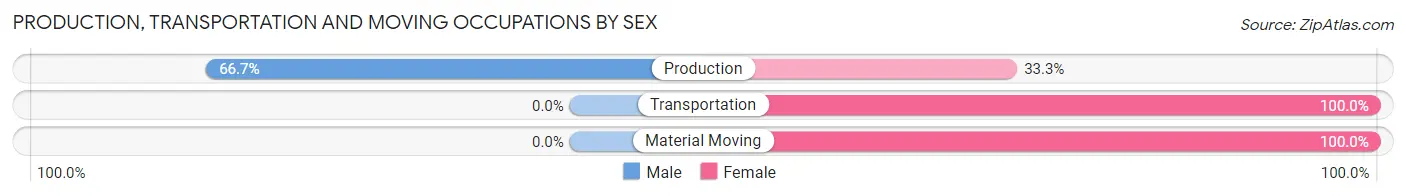
| Occupation | Male | Female |
| Production | 8 (66.7%) | 4 (33.3%) |
| Transportation | 0 (0.0%) | 2 (100.0%) |
| Material Moving | 0 (0.0%) | 1 (100.0%) |
| Total (Category) | 8 (53.3%) | 7 (46.7%) |
| Total (Overall) | 23 (40.4%) | 34 (59.7%) |
Employment Industries by Sex in Foxhome
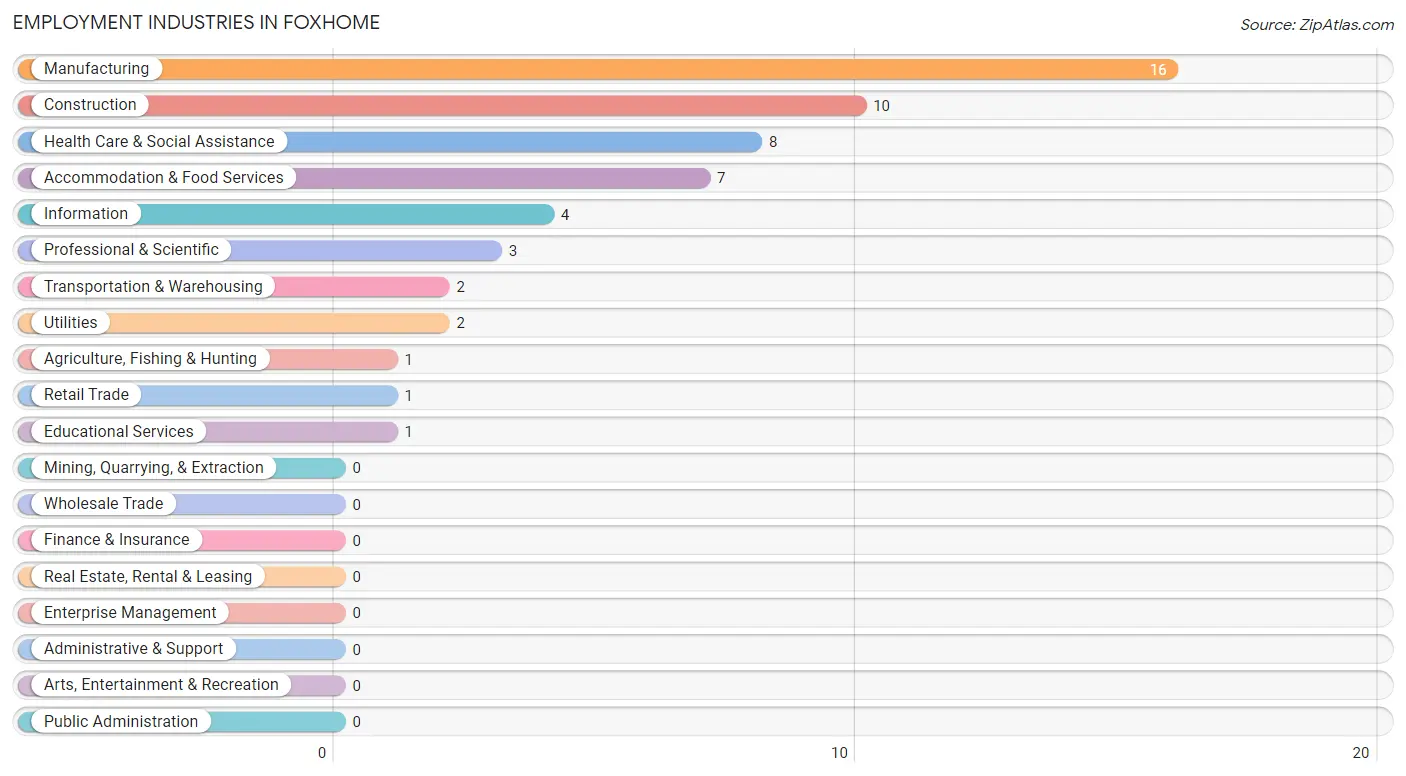
Employment Industries in Foxhome
The major employment industries in Foxhome include Manufacturing (16 | 28.1%), Construction (10 | 17.5%), Health Care & Social Assistance (8 | 14.0%), Accommodation & Food Services (7 | 12.3%), and Information (4 | 7.0%).
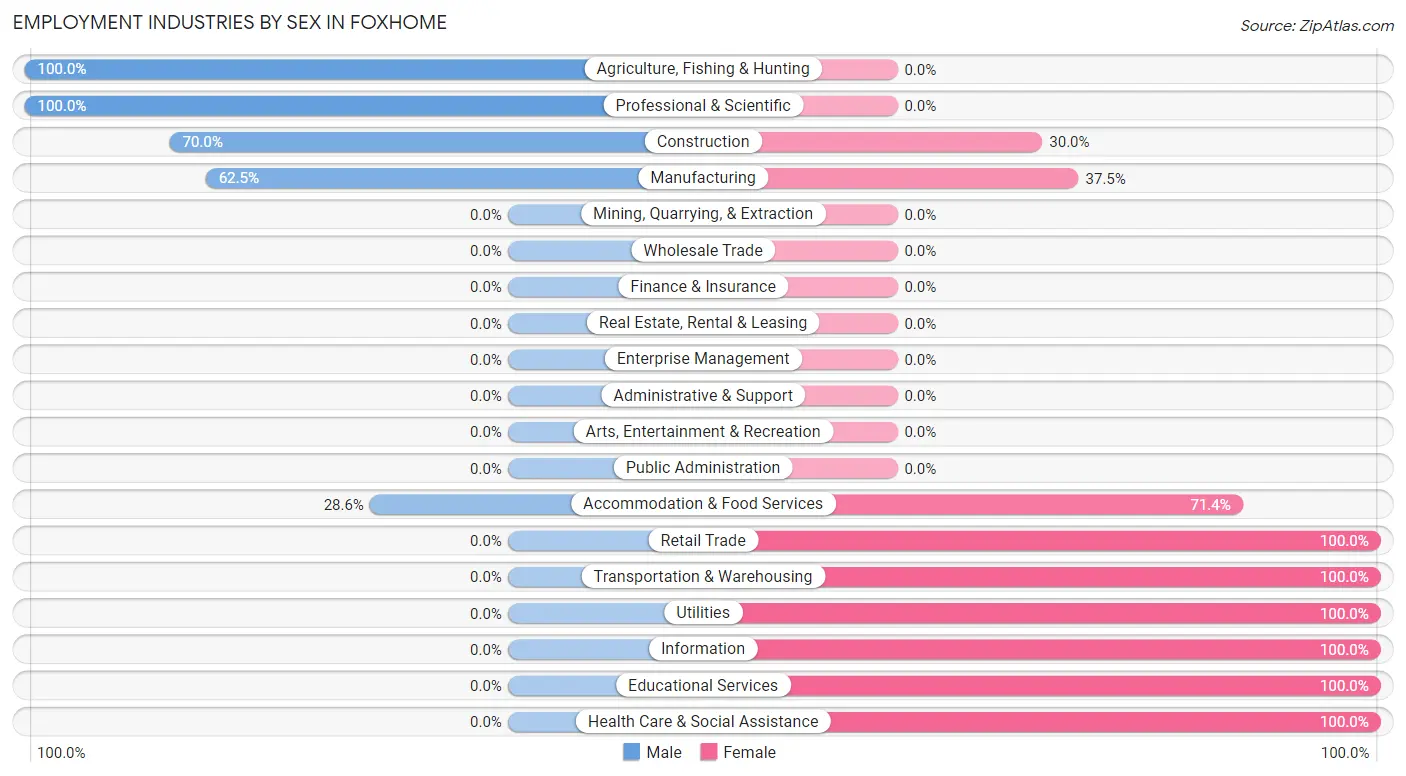
Employment Industries by Sex in Foxhome
The Foxhome industries that see more men than women are Agriculture, Fishing & Hunting (100.0%), Professional & Scientific (100.0%), and Construction (70.0%), whereas the industries that tend to have a higher number of women are Retail Trade (100.0%), Transportation & Warehousing (100.0%), and Utilities (100.0%).
| Industry | Male | Female |
| Agriculture, Fishing & Hunting | 1 (100.0%) | 0 (0.0%) |
| Mining, Quarrying, & Extraction | 0 (0.0%) | 0 (0.0%) |
| Construction | 7 (70.0%) | 3 (30.0%) |
| Manufacturing | 10 (62.5%) | 6 (37.5%) |
| Wholesale Trade | 0 (0.0%) | 0 (0.0%) |
| Retail Trade | 0 (0.0%) | 1 (100.0%) |
| Transportation & Warehousing | 0 (0.0%) | 2 (100.0%) |
| Utilities | 0 (0.0%) | 2 (100.0%) |
| Information | 0 (0.0%) | 4 (100.0%) |
| Finance & Insurance | 0 (0.0%) | 0 (0.0%) |
| Real Estate, Rental & Leasing | 0 (0.0%) | 0 (0.0%) |
| Professional & Scientific | 3 (100.0%) | 0 (0.0%) |
| Enterprise Management | 0 (0.0%) | 0 (0.0%) |
| Administrative & Support | 0 (0.0%) | 0 (0.0%) |
| Educational Services | 0 (0.0%) | 1 (100.0%) |
| Health Care & Social Assistance | 0 (0.0%) | 8 (100.0%) |
| Arts, Entertainment & Recreation | 0 (0.0%) | 0 (0.0%) |
| Accommodation & Food Services | 2 (28.6%) | 5 (71.4%) |
| Public Administration | 0 (0.0%) | 0 (0.0%) |
| Total | 23 (40.4%) | 34 (59.7%) |
Education in Foxhome
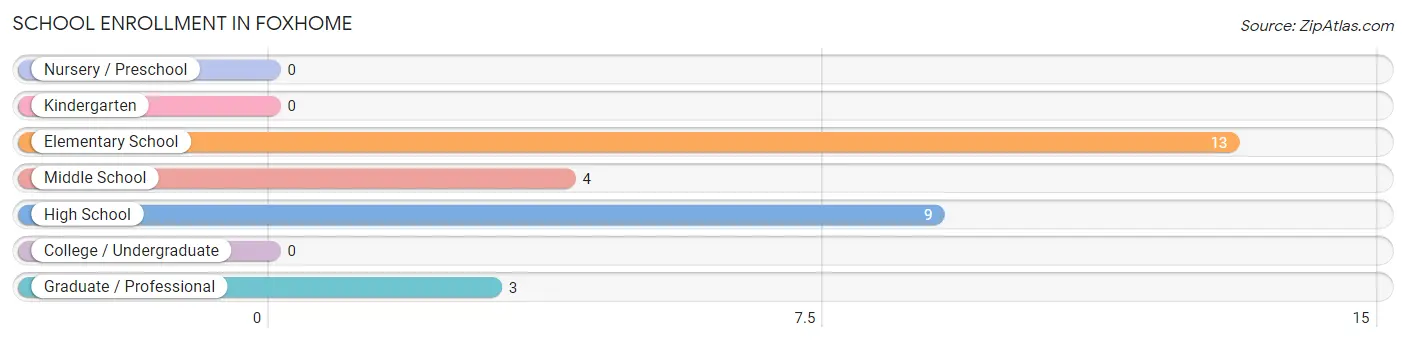
School Enrollment in Foxhome
The most common levels of schooling among the 29 students in Foxhome are elementary school (13 | 44.8%), high school (9 | 31.0%), and middle school (4 | 13.8%).
| School Level | # Students | % Students |
| Nursery / Preschool | 0 | 0.0% |
| Kindergarten | 0 | 0.0% |
| Elementary School | 13 | 44.8% |
| Middle School | 4 | 13.8% |
| High School | 9 | 31.0% |
| College / Undergraduate | 0 | 0.0% |
| Graduate / Professional | 3 | 10.3% |
| Total | 29 | 100.0% |
School Enrollment by Age by Funding Source in Foxhome
Out of a total of 29 students who are enrolled in schools in Foxhome, 6 (20.7%) attend a private institution, while the remaining 23 (79.3%) are enrolled in public schools. The age group of 25 to 34 year olds has the highest likelihood of being enrolled in private schools, with 3 (100.0% in the age bracket) enrolled. Conversely, the age group of 10 to 14 year olds has the lowest likelihood of being enrolled in a private school, with 7 (100.0% in the age bracket) attending a public institution.
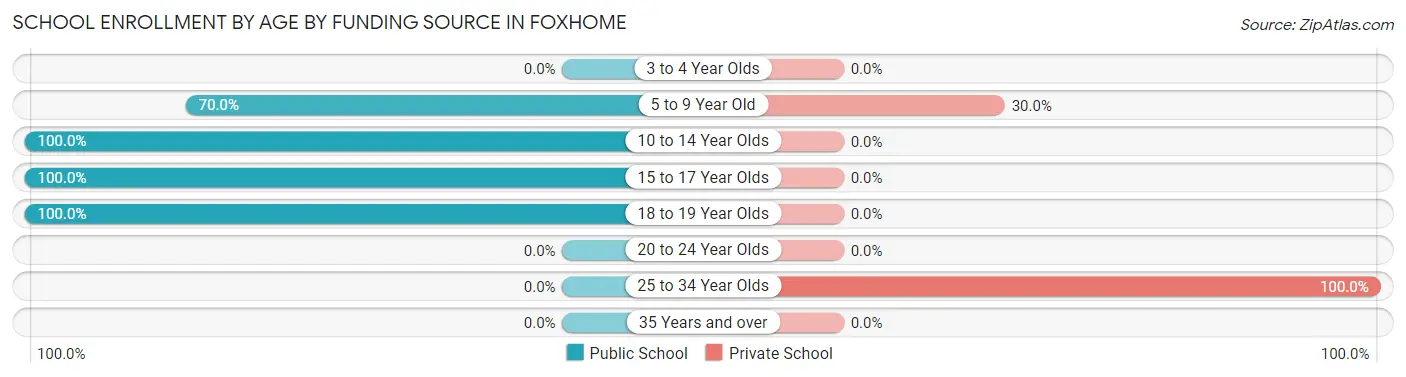
| Age Bracket | Public School | Private School |
| 3 to 4 Year Olds | 0 (0.0%) | 0 (0.0%) |
| 5 to 9 Year Old | 7 (70.0%) | 3 (30.0%) |
| 10 to 14 Year Olds | 7 (100.0%) | 0 (0.0%) |
| 15 to 17 Year Olds | 6 (100.0%) | 0 (0.0%) |
| 18 to 19 Year Olds | 3 (100.0%) | 0 (0.0%) |
| 20 to 24 Year Olds | 0 (0.0%) | 0 (0.0%) |
| 25 to 34 Year Olds | 0 (0.0%) | 3 (100.0%) |
| 35 Years and over | 0 (0.0%) | 0 (0.0%) |
| Total | 23 (79.3%) | 6 (20.7%) |
Educational Attainment by Field of Study in Foxhome
Social sciences (3 | 42.9%), physical & health sciences (2 | 28.6%), and business (2 | 28.6%) are the most common fields of study among 7 individuals in Foxhome who have obtained a bachelor's degree or higher.
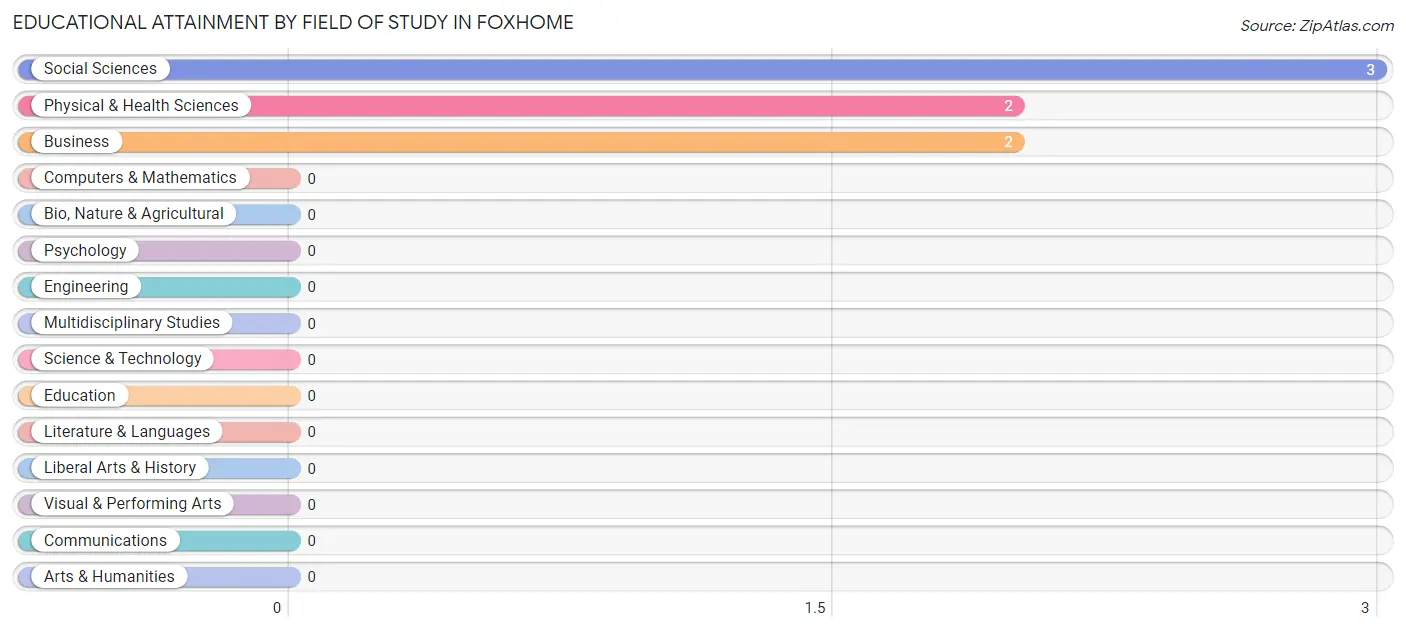
| Field of Study | # Graduates | % Graduates |
| Computers & Mathematics | 0 | 0.0% |
| Bio, Nature & Agricultural | 0 | 0.0% |
| Physical & Health Sciences | 2 | 28.6% |
| Psychology | 0 | 0.0% |
| Social Sciences | 3 | 42.9% |
| Engineering | 0 | 0.0% |
| Multidisciplinary Studies | 0 | 0.0% |
| Science & Technology | 0 | 0.0% |
| Business | 2 | 28.6% |
| Education | 0 | 0.0% |
| Literature & Languages | 0 | 0.0% |
| Liberal Arts & History | 0 | 0.0% |
| Visual & Performing Arts | 0 | 0.0% |
| Communications | 0 | 0.0% |
| Arts & Humanities | 0 | 0.0% |
| Total | 7 | 100.0% |
Transportation & Commute in Foxhome
Vehicle Availability by Sex in Foxhome
The most prevalent vehicle ownership categories in Foxhome are males with 3 vehicles (13, accounting for 52.0%) and females with 3 vehicles (18, making up 40.6%).
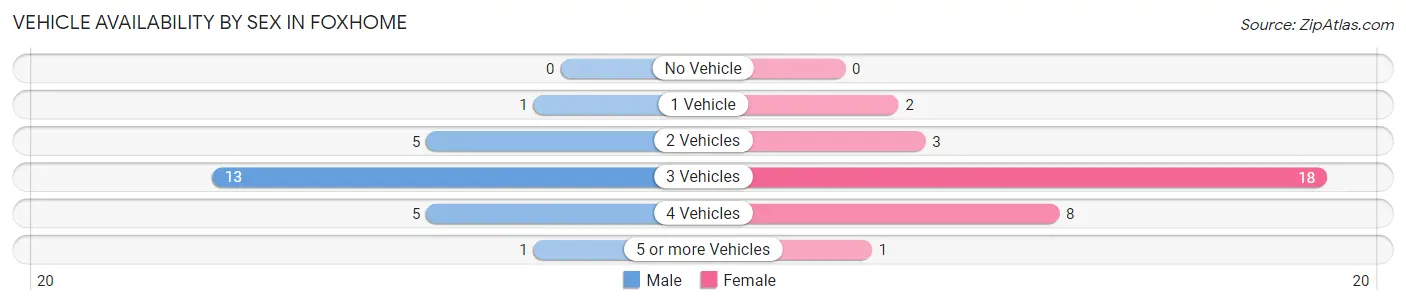
| Vehicles Available | Male | Female |
| No Vehicle | 0 (0.0%) | 0 (0.0%) |
| 1 Vehicle | 1 (4.0%) | 2 (6.2%) |
| 2 Vehicles | 5 (20.0%) | 3 (9.4%) |
| 3 Vehicles | 13 (52.0%) | 18 (56.2%) |
| 4 Vehicles | 5 (20.0%) | 8 (25.0%) |
| 5 or more Vehicles | 1 (4.0%) | 1 (3.1%) |
| Total | 25 (100.0%) | 32 (100.0%) |
Commute Time in Foxhome
The most frequently occuring commute durations in Foxhome are 20 to 24 minutes (26 commuters, 45.6%), 30 to 34 minutes (6 commuters, 10.5%), and 25 to 29 minutes (5 commuters, 8.8%).
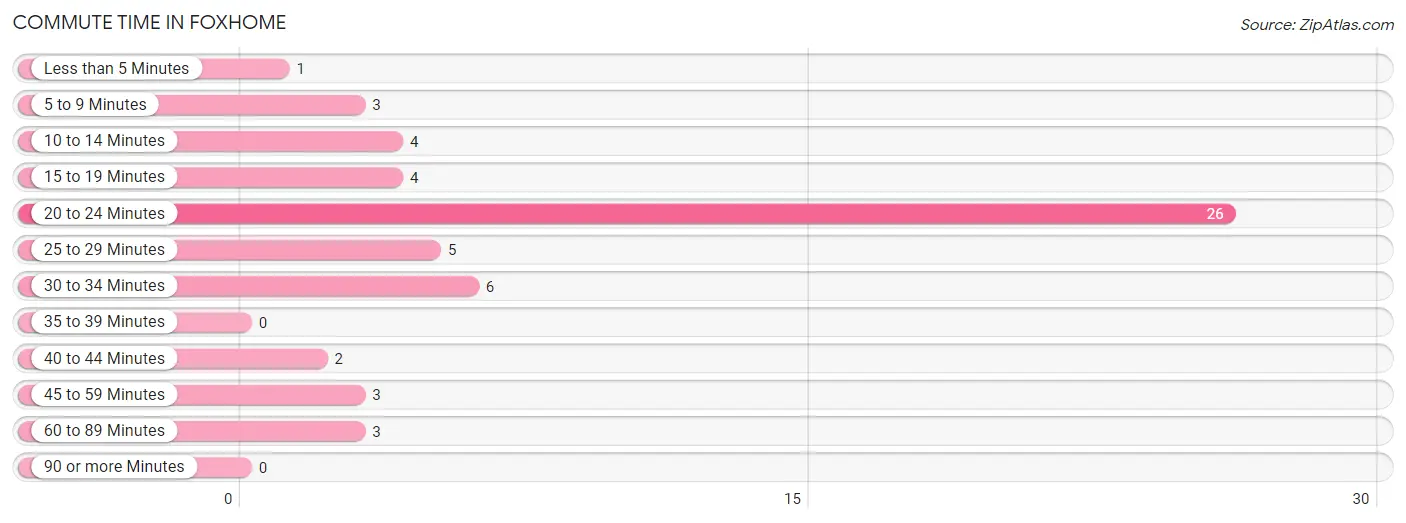
| Commute Time | # Commuters | % Commuters |
| Less than 5 Minutes | 1 | 1.8% |
| 5 to 9 Minutes | 3 | 5.3% |
| 10 to 14 Minutes | 4 | 7.0% |
| 15 to 19 Minutes | 4 | 7.0% |
| 20 to 24 Minutes | 26 | 45.6% |
| 25 to 29 Minutes | 5 | 8.8% |
| 30 to 34 Minutes | 6 | 10.5% |
| 35 to 39 Minutes | 0 | 0.0% |
| 40 to 44 Minutes | 2 | 3.5% |
| 45 to 59 Minutes | 3 | 5.3% |
| 60 to 89 Minutes | 3 | 5.3% |
| 90 or more Minutes | 0 | 0.0% |
Commute Time by Sex in Foxhome
The most common commute times in Foxhome are 20 to 24 minutes (5 commuters, 20.0%) for males and 20 to 24 minutes (21 commuters, 65.6%) for females.
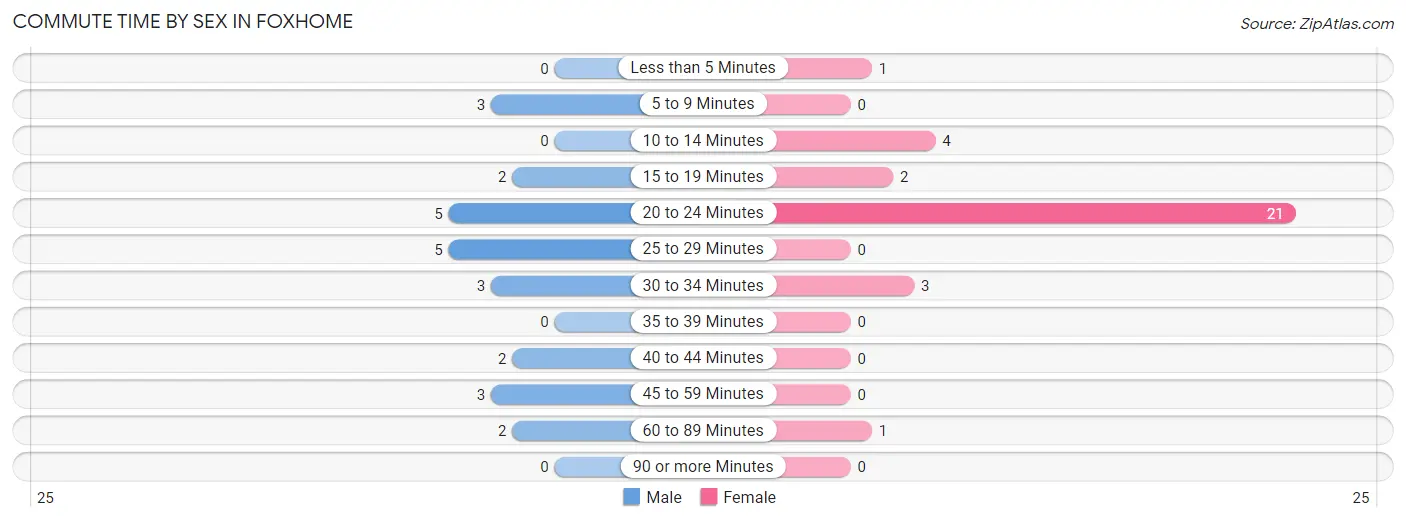
| Commute Time | Male | Female |
| Less than 5 Minutes | 0 (0.0%) | 1 (3.1%) |
| 5 to 9 Minutes | 3 (12.0%) | 0 (0.0%) |
| 10 to 14 Minutes | 0 (0.0%) | 4 (12.5%) |
| 15 to 19 Minutes | 2 (8.0%) | 2 (6.2%) |
| 20 to 24 Minutes | 5 (20.0%) | 21 (65.6%) |
| 25 to 29 Minutes | 5 (20.0%) | 0 (0.0%) |
| 30 to 34 Minutes | 3 (12.0%) | 3 (9.4%) |
| 35 to 39 Minutes | 0 (0.0%) | 0 (0.0%) |
| 40 to 44 Minutes | 2 (8.0%) | 0 (0.0%) |
| 45 to 59 Minutes | 3 (12.0%) | 0 (0.0%) |
| 60 to 89 Minutes | 2 (8.0%) | 1 (3.1%) |
| 90 or more Minutes | 0 (0.0%) | 0 (0.0%) |
Time of Departure to Work by Sex in Foxhome
The most frequent times of departure to work in Foxhome are 8:00 AM to 8:29 AM (6, 24.0%) for males and 7:00 AM to 7:29 AM (13, 40.6%) for females.
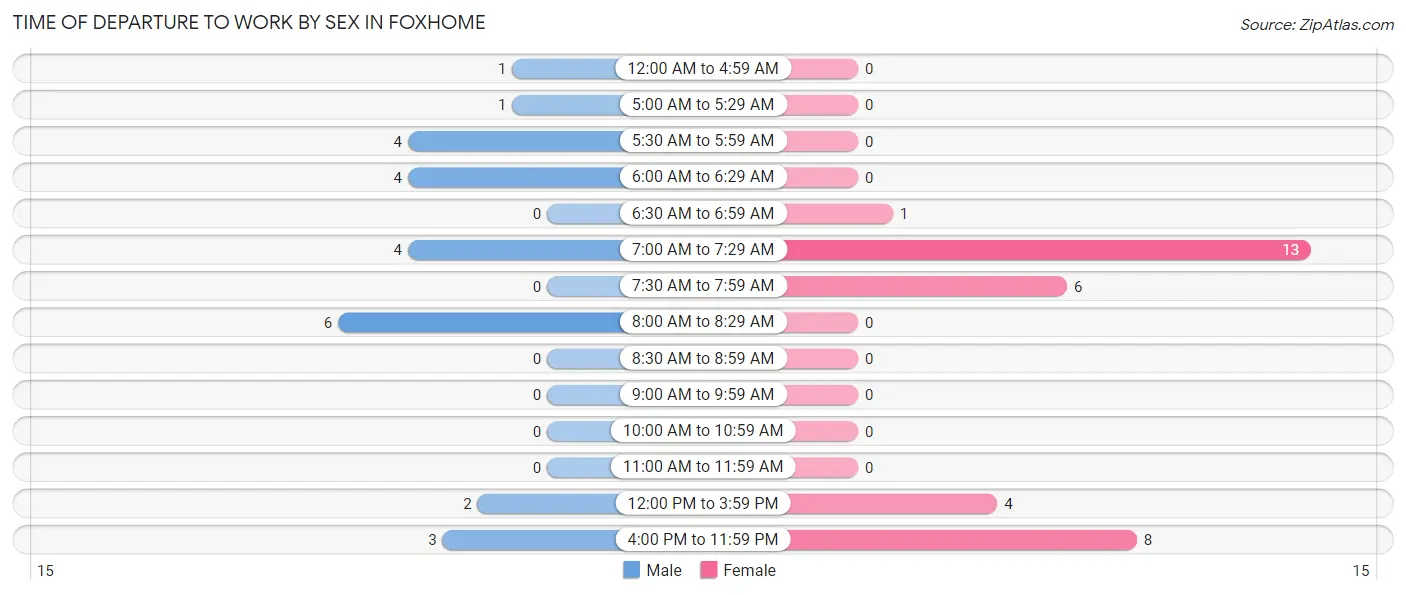
| Time of Departure | Male | Female |
| 12:00 AM to 4:59 AM | 1 (4.0%) | 0 (0.0%) |
| 5:00 AM to 5:29 AM | 1 (4.0%) | 0 (0.0%) |
| 5:30 AM to 5:59 AM | 4 (16.0%) | 0 (0.0%) |
| 6:00 AM to 6:29 AM | 4 (16.0%) | 0 (0.0%) |
| 6:30 AM to 6:59 AM | 0 (0.0%) | 1 (3.1%) |
| 7:00 AM to 7:29 AM | 4 (16.0%) | 13 (40.6%) |
| 7:30 AM to 7:59 AM | 0 (0.0%) | 6 (18.8%) |
| 8:00 AM to 8:29 AM | 6 (24.0%) | 0 (0.0%) |
| 8:30 AM to 8:59 AM | 0 (0.0%) | 0 (0.0%) |
| 9:00 AM to 9:59 AM | 0 (0.0%) | 0 (0.0%) |
| 10:00 AM to 10:59 AM | 0 (0.0%) | 0 (0.0%) |
| 11:00 AM to 11:59 AM | 0 (0.0%) | 0 (0.0%) |
| 12:00 PM to 3:59 PM | 2 (8.0%) | 4 (12.5%) |
| 4:00 PM to 11:59 PM | 3 (12.0%) | 8 (25.0%) |
| Total | 25 (100.0%) | 32 (100.0%) |
Housing Occupancy in Foxhome
Occupancy by Ownership in Foxhome
Of the total 37 dwellings in Foxhome, owner-occupied units account for 35 (94.6%), while renter-occupied units make up 2 (5.4%).
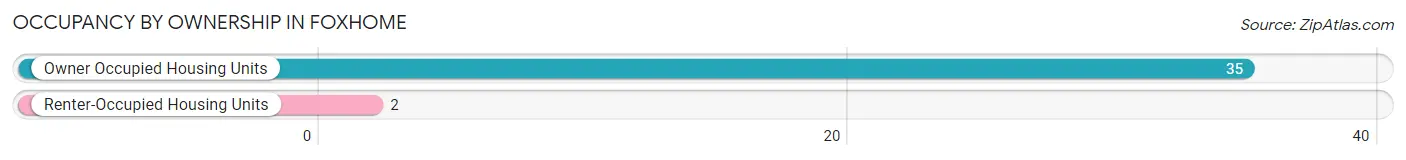
| Occupancy | # Housing Units | % Housing Units |
| Owner Occupied Housing Units | 35 | 94.6% |
| Renter-Occupied Housing Units | 2 | 5.4% |
| Total Occupied Housing Units | 37 | 100.0% |
Occupancy by Household Size in Foxhome
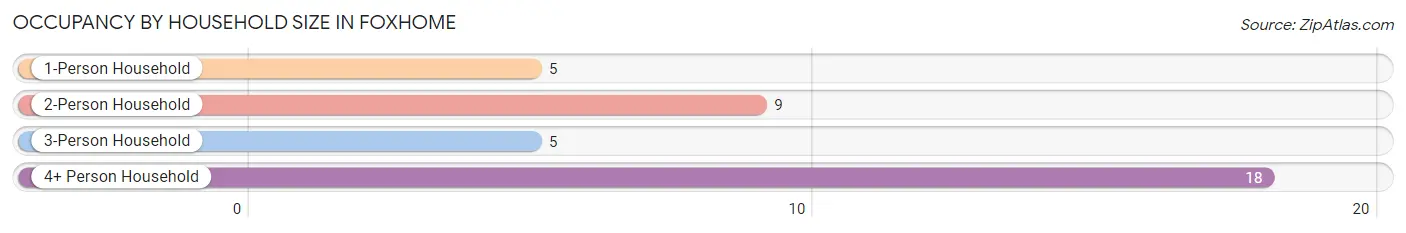
| Household Size | # Housing Units | % Housing Units |
| 1-Person Household | 5 | 13.5% |
| 2-Person Household | 9 | 24.3% |
| 3-Person Household | 5 | 13.5% |
| 4+ Person Household | 18 | 48.6% |
| Total Housing Units | 37 | 100.0% |
Occupancy by Ownership by Household Size in Foxhome
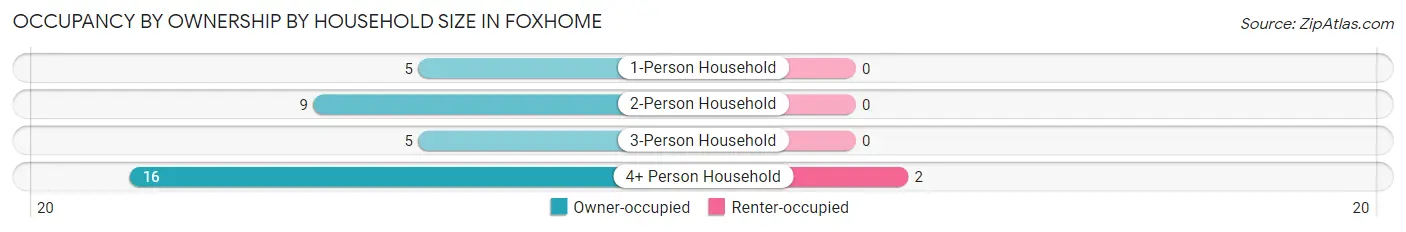
| Household Size | Owner-occupied | Renter-occupied |
| 1-Person Household | 5 (100.0%) | 0 (0.0%) |
| 2-Person Household | 9 (100.0%) | 0 (0.0%) |
| 3-Person Household | 5 (100.0%) | 0 (0.0%) |
| 4+ Person Household | 16 (88.9%) | 2 (11.1%) |
| Total Housing Units | 35 (94.6%) | 2 (5.4%) |
Occupancy by Educational Attainment in Foxhome
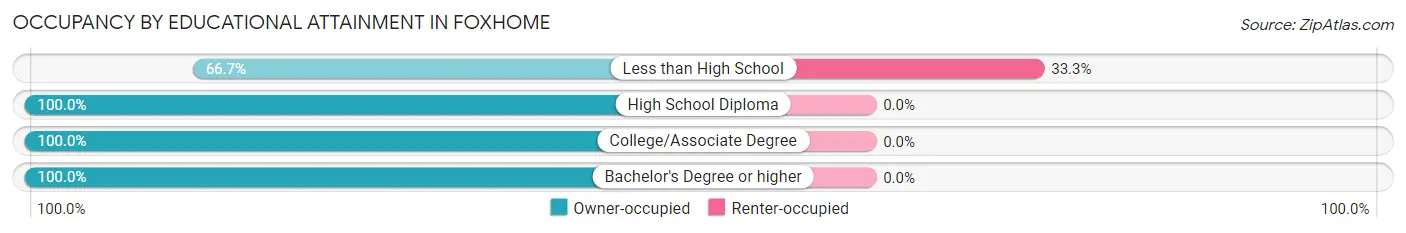
| Household Size | Owner-occupied | Renter-occupied |
| Less than High School | 4 (66.7%) | 2 (33.3%) |
| High School Diploma | 19 (100.0%) | 0 (0.0%) |
| College/Associate Degree | 7 (100.0%) | 0 (0.0%) |
| Bachelor's Degree or higher | 5 (100.0%) | 0 (0.0%) |
Occupancy by Age of Householder in Foxhome
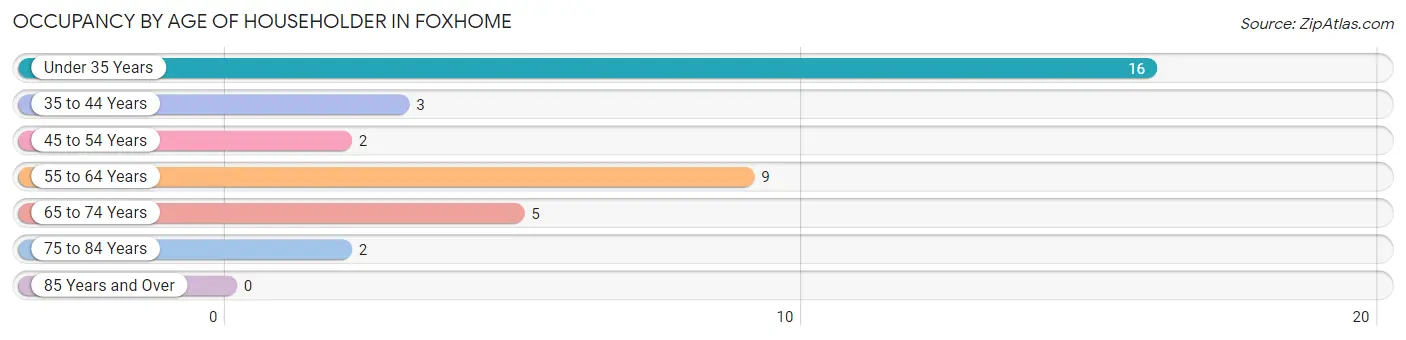
| Age Bracket | # Households | % Households |
| Under 35 Years | 16 | 43.2% |
| 35 to 44 Years | 3 | 8.1% |
| 45 to 54 Years | 2 | 5.4% |
| 55 to 64 Years | 9 | 24.3% |
| 65 to 74 Years | 5 | 13.5% |
| 75 to 84 Years | 2 | 5.4% |
| 85 Years and Over | 0 | 0.0% |
| Total | 37 | 100.0% |
Housing Finances in Foxhome
Median Income by Occupancy in Foxhome
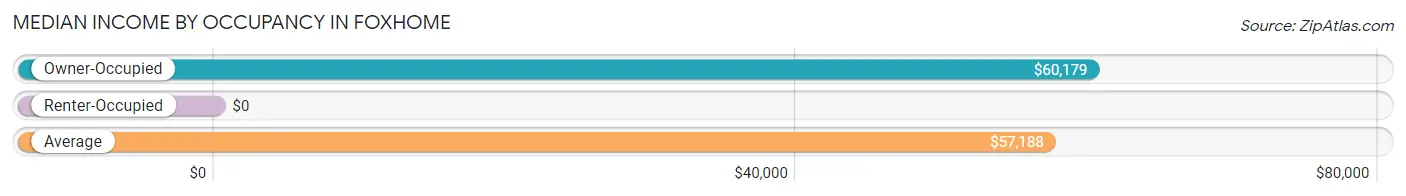
| Occupancy Type | # Households | Median Income |
| Owner-Occupied | 35 (94.6%) | $60,179 |
| Renter-Occupied | 2 (5.4%) | $0 |
| Average | 37 (100.0%) | $57,188 |
Occupancy by Householder Income Bracket in Foxhome
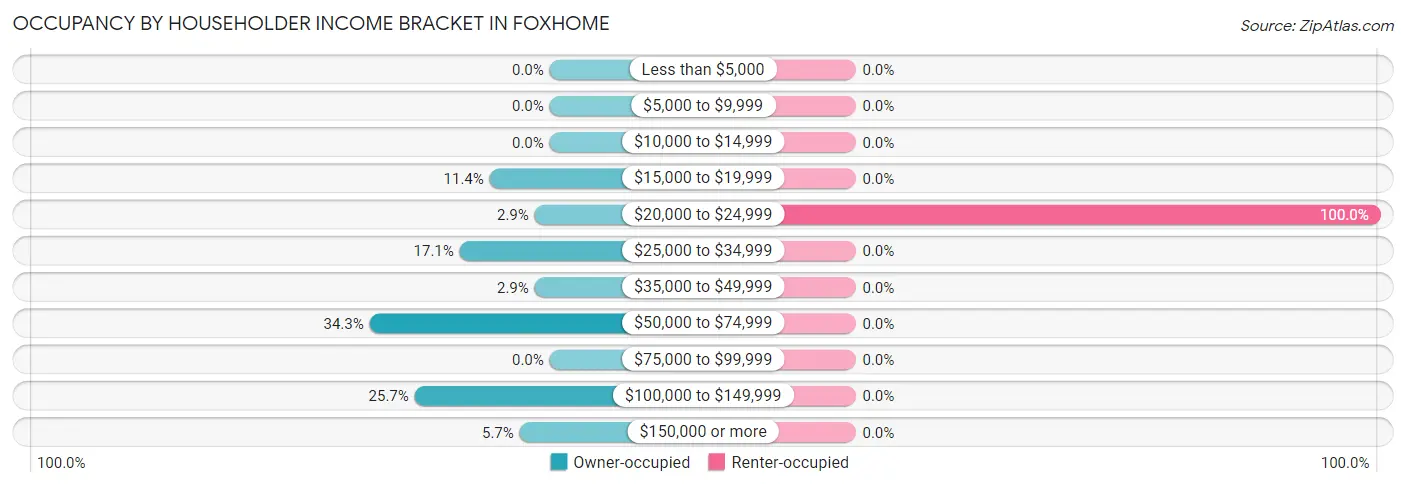
| Income Bracket | Owner-occupied | Renter-occupied |
| Less than $5,000 | 0 (0.0%) | 0 (0.0%) |
| $5,000 to $9,999 | 0 (0.0%) | 0 (0.0%) |
| $10,000 to $14,999 | 0 (0.0%) | 0 (0.0%) |
| $15,000 to $19,999 | 4 (11.4%) | 0 (0.0%) |
| $20,000 to $24,999 | 1 (2.9%) | 2 (100.0%) |
| $25,000 to $34,999 | 6 (17.1%) | 0 (0.0%) |
| $35,000 to $49,999 | 1 (2.9%) | 0 (0.0%) |
| $50,000 to $74,999 | 12 (34.3%) | 0 (0.0%) |
| $75,000 to $99,999 | 0 (0.0%) | 0 (0.0%) |
| $100,000 to $149,999 | 9 (25.7%) | 0 (0.0%) |
| $150,000 or more | 2 (5.7%) | 0 (0.0%) |
| Total | 35 (100.0%) | 2 (100.0%) |
Monthly Housing Cost Tiers in Foxhome
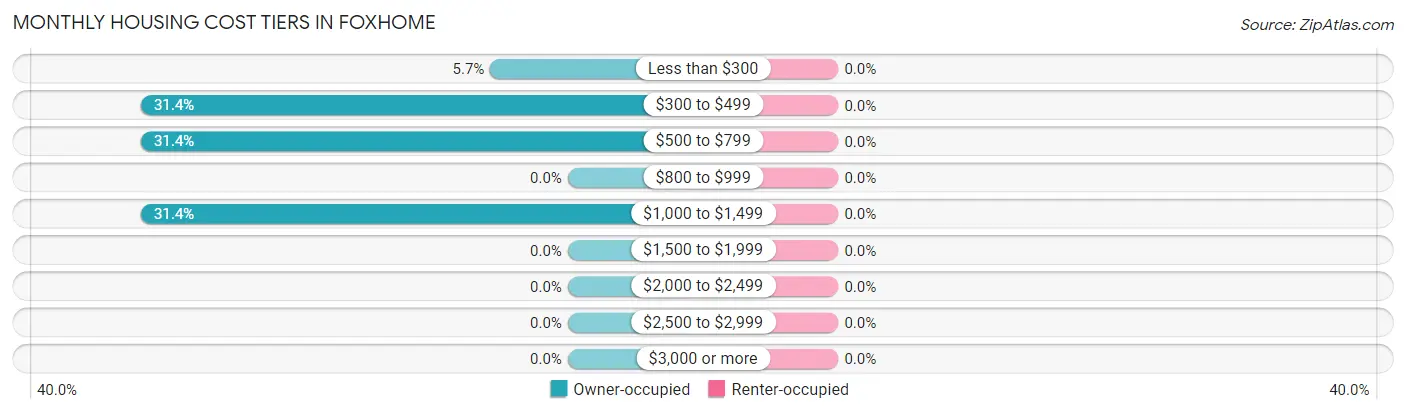
| Monthly Cost | Owner-occupied | Renter-occupied |
| Less than $300 | 2 (5.7%) | 0 (0.0%) |
| $300 to $499 | 11 (31.4%) | 0 (0.0%) |
| $500 to $799 | 11 (31.4%) | 0 (0.0%) |
| $800 to $999 | 0 (0.0%) | 0 (0.0%) |
| $1,000 to $1,499 | 11 (31.4%) | 0 (0.0%) |
| $1,500 to $1,999 | 0 (0.0%) | 0 (0.0%) |
| $2,000 to $2,499 | 0 (0.0%) | 0 (0.0%) |
| $2,500 to $2,999 | 0 (0.0%) | 0 (0.0%) |
| $3,000 or more | 0 (0.0%) | 0 (0.0%) |
| Total | 35 (100.0%) | 2 (100.0%) |
Physical Housing Characteristics in Foxhome
Housing Structures in Foxhome
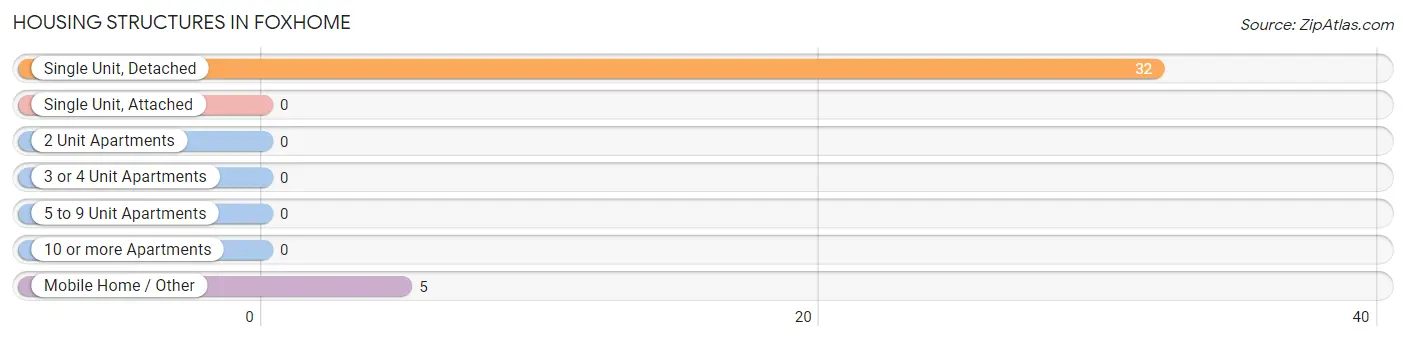
| Structure Type | # Housing Units | % Housing Units |
| Single Unit, Detached | 32 | 86.5% |
| Single Unit, Attached | 0 | 0.0% |
| 2 Unit Apartments | 0 | 0.0% |
| 3 or 4 Unit Apartments | 0 | 0.0% |
| 5 to 9 Unit Apartments | 0 | 0.0% |
| 10 or more Apartments | 0 | 0.0% |
| Mobile Home / Other | 5 | 13.5% |
| Total | 37 | 100.0% |
Housing Structures by Occupancy in Foxhome
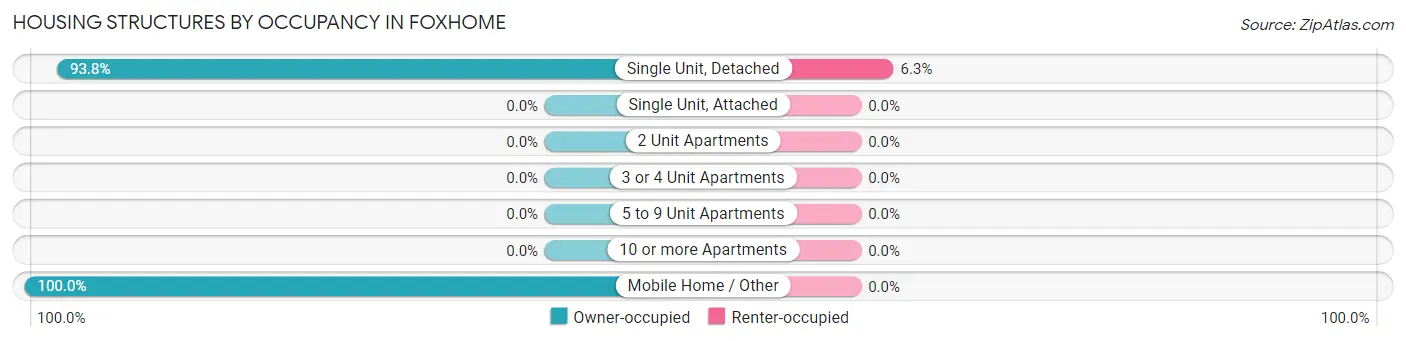
| Structure Type | Owner-occupied | Renter-occupied |
| Single Unit, Detached | 30 (93.8%) | 2 (6.2%) |
| Single Unit, Attached | 0 (0.0%) | 0 (0.0%) |
| 2 Unit Apartments | 0 (0.0%) | 0 (0.0%) |
| 3 or 4 Unit Apartments | 0 (0.0%) | 0 (0.0%) |
| 5 to 9 Unit Apartments | 0 (0.0%) | 0 (0.0%) |
| 10 or more Apartments | 0 (0.0%) | 0 (0.0%) |
| Mobile Home / Other | 5 (100.0%) | 0 (0.0%) |
| Total | 35 (94.6%) | 2 (5.4%) |
Housing Structures by Number of Rooms in Foxhome
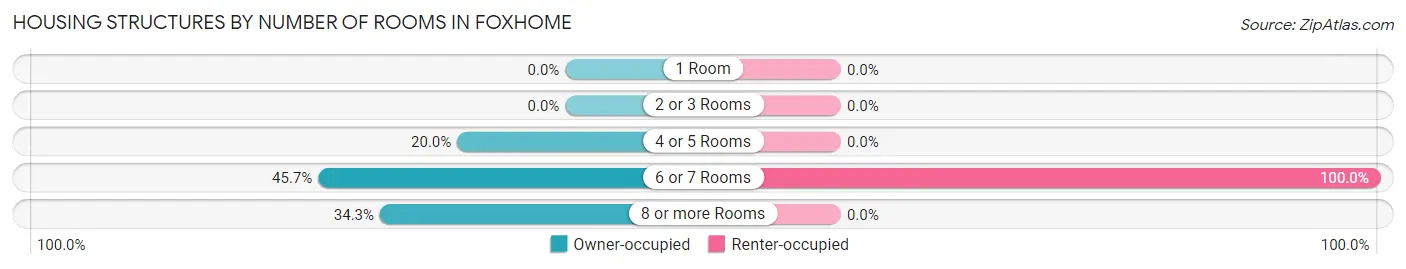
| Number of Rooms | Owner-occupied | Renter-occupied |
| 1 Room | 0 (0.0%) | 0 (0.0%) |
| 2 or 3 Rooms | 0 (0.0%) | 0 (0.0%) |
| 4 or 5 Rooms | 7 (20.0%) | 0 (0.0%) |
| 6 or 7 Rooms | 16 (45.7%) | 2 (100.0%) |
| 8 or more Rooms | 12 (34.3%) | 0 (0.0%) |
| Total | 35 (100.0%) | 2 (100.0%) |
Housing Structure by Heating Type in Foxhome
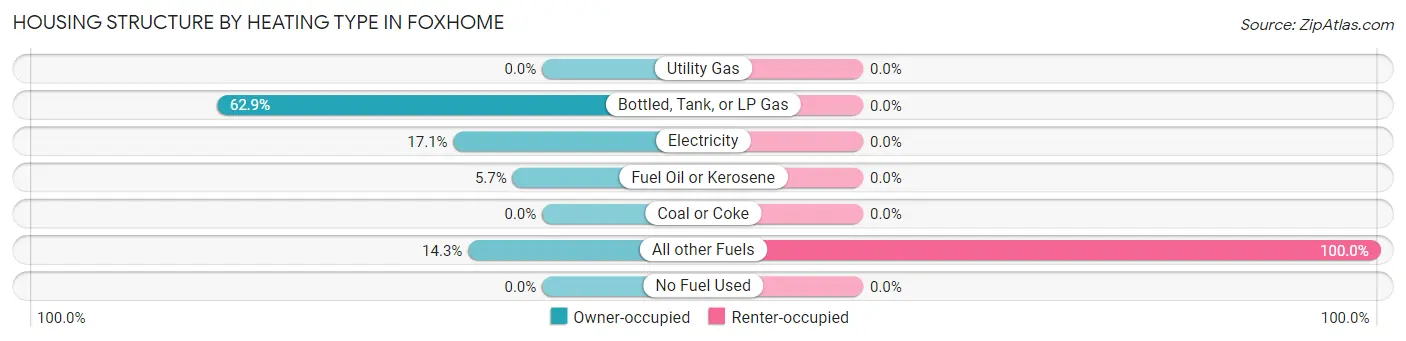
| Heating Type | Owner-occupied | Renter-occupied |
| Utility Gas | 0 (0.0%) | 0 (0.0%) |
| Bottled, Tank, or LP Gas | 22 (62.9%) | 0 (0.0%) |
| Electricity | 6 (17.1%) | 0 (0.0%) |
| Fuel Oil or Kerosene | 2 (5.7%) | 0 (0.0%) |
| Coal or Coke | 0 (0.0%) | 0 (0.0%) |
| All other Fuels | 5 (14.3%) | 2 (100.0%) |
| No Fuel Used | 0 (0.0%) | 0 (0.0%) |
| Total | 35 (100.0%) | 2 (100.0%) |
Household Vehicle Usage in Foxhome
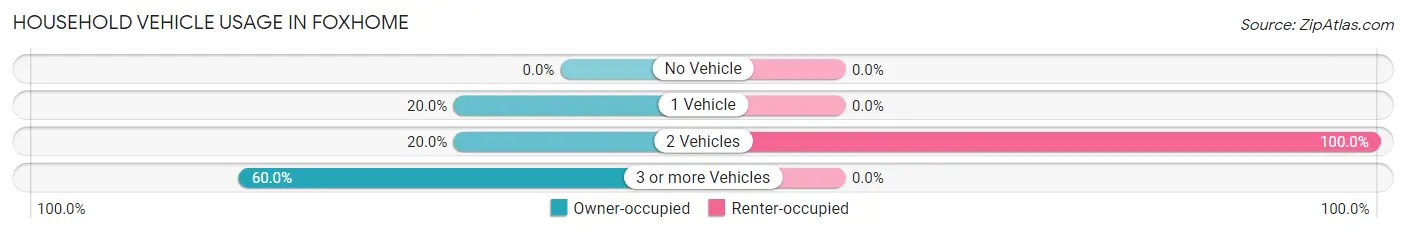
| Vehicles per Household | Owner-occupied | Renter-occupied |
| No Vehicle | 0 (0.0%) | 0 (0.0%) |
| 1 Vehicle | 7 (20.0%) | 0 (0.0%) |
| 2 Vehicles | 7 (20.0%) | 2 (100.0%) |
| 3 or more Vehicles | 21 (60.0%) | 0 (0.0%) |
| Total | 35 (100.0%) | 2 (100.0%) |
Real Estate & Mortgages in Foxhome
Real Estate and Mortgage Overview in Foxhome
| Characteristic | Without Mortgage | With Mortgage |
| Housing Units | 18 | 17 |
| Median Property Value | $92,000 | $81,300 |
| Median Household Income | $60,714 | $0 |
| Monthly Housing Costs | $460 | $0 |
| Real Estate Taxes | $675 | $1 |
Property Value by Mortgage Status in Foxhome
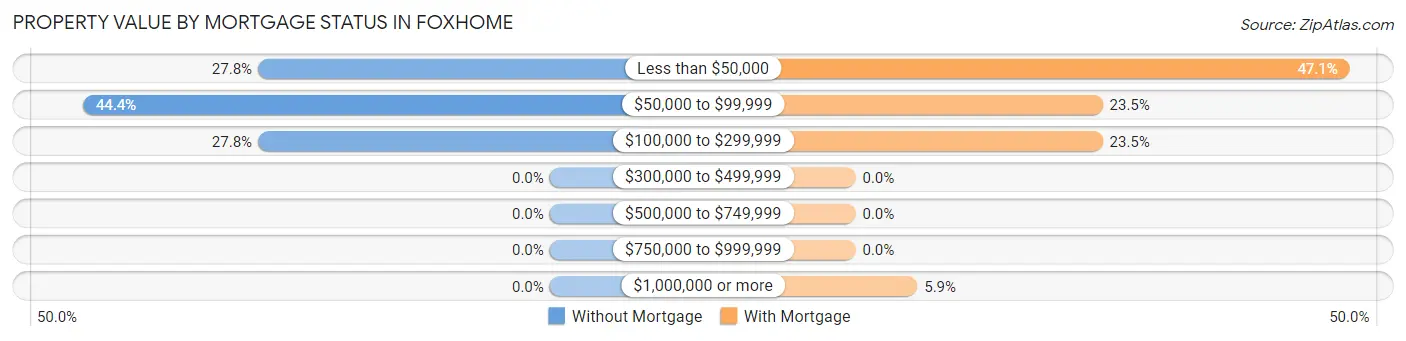
| Property Value | Without Mortgage | With Mortgage |
| Less than $50,000 | 5 (27.8%) | 8 (47.1%) |
| $50,000 to $99,999 | 8 (44.4%) | 4 (23.5%) |
| $100,000 to $299,999 | 5 (27.8%) | 4 (23.5%) |
| $300,000 to $499,999 | 0 (0.0%) | 0 (0.0%) |
| $500,000 to $749,999 | 0 (0.0%) | 0 (0.0%) |
| $750,000 to $999,999 | 0 (0.0%) | 0 (0.0%) |
| $1,000,000 or more | 0 (0.0%) | 1 (5.9%) |
| Total | 18 (100.0%) | 17 (100.0%) |
Household Income by Mortgage Status in Foxhome
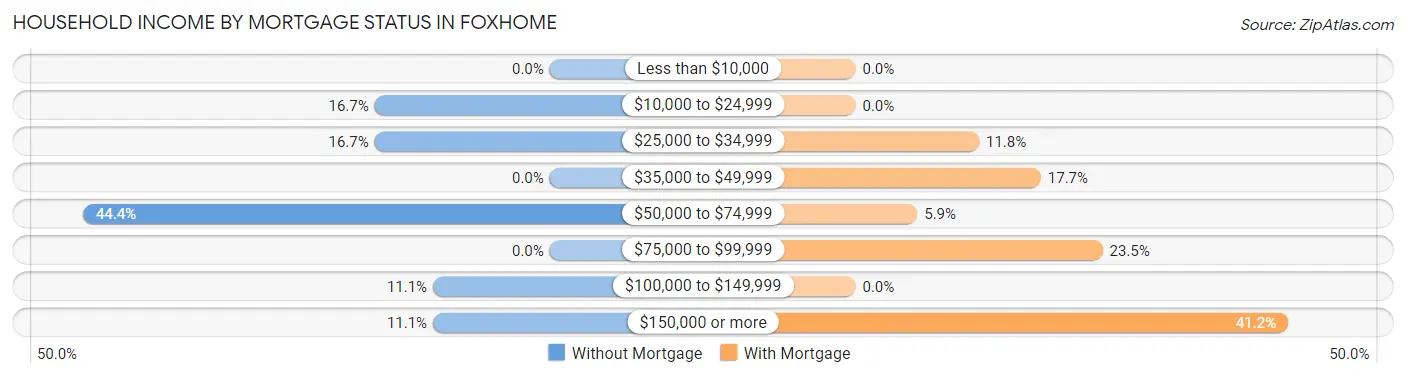
| Household Income | Without Mortgage | With Mortgage |
| Less than $10,000 | 0 (0.0%) | 0 (0.0%) |
| $10,000 to $24,999 | 3 (16.7%) | 0 (0.0%) |
| $25,000 to $34,999 | 3 (16.7%) | 2 (11.8%) |
| $35,000 to $49,999 | 0 (0.0%) | 3 (17.6%) |
| $50,000 to $74,999 | 8 (44.4%) | 1 (5.9%) |
| $75,000 to $99,999 | 0 (0.0%) | 4 (23.5%) |
| $100,000 to $149,999 | 2 (11.1%) | 0 (0.0%) |
| $150,000 or more | 2 (11.1%) | 7 (41.2%) |
| Total | 18 (100.0%) | 17 (100.0%) |
Property Value to Household Income Ratio in Foxhome
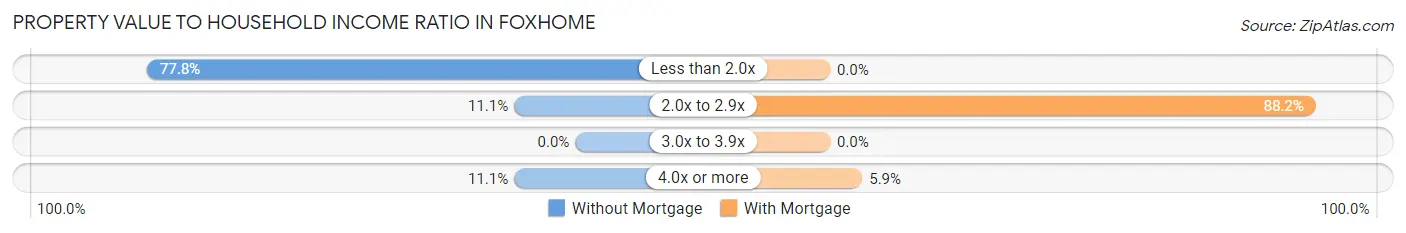
| Value-to-Income Ratio | Without Mortgage | With Mortgage |
| Less than 2.0x | 14 (77.8%) | 0 (0.0%) |
| 2.0x to 2.9x | 2 (11.1%) | 15 (88.2%) |
| 3.0x to 3.9x | 0 (0.0%) | 0 (0.0%) |
| 4.0x or more | 2 (11.1%) | 1 (5.9%) |
| Total | 18 (100.0%) | 17 (100.0%) |
Real Estate Taxes by Mortgage Status in Foxhome
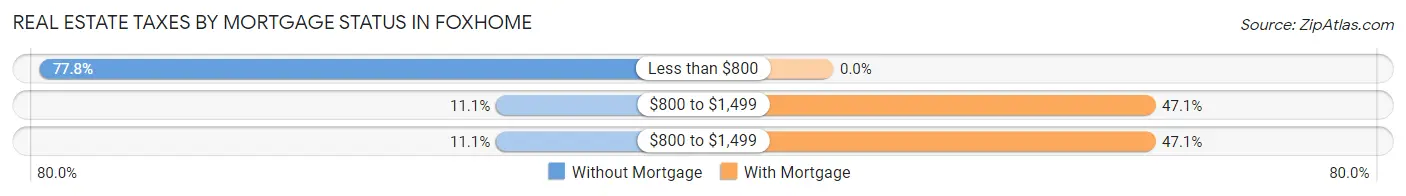
| Property Taxes | Without Mortgage | With Mortgage |
| Less than $800 | 14 (77.8%) | 0 (0.0%) |
| $800 to $1,499 | 2 (11.1%) | 8 (47.1%) |
| $800 to $1,499 | 2 (11.1%) | 8 (47.1%) |
| Total | 18 (100.0%) | 17 (100.0%) |
Health & Disability in Foxhome
Health Insurance Coverage by Age in Foxhome
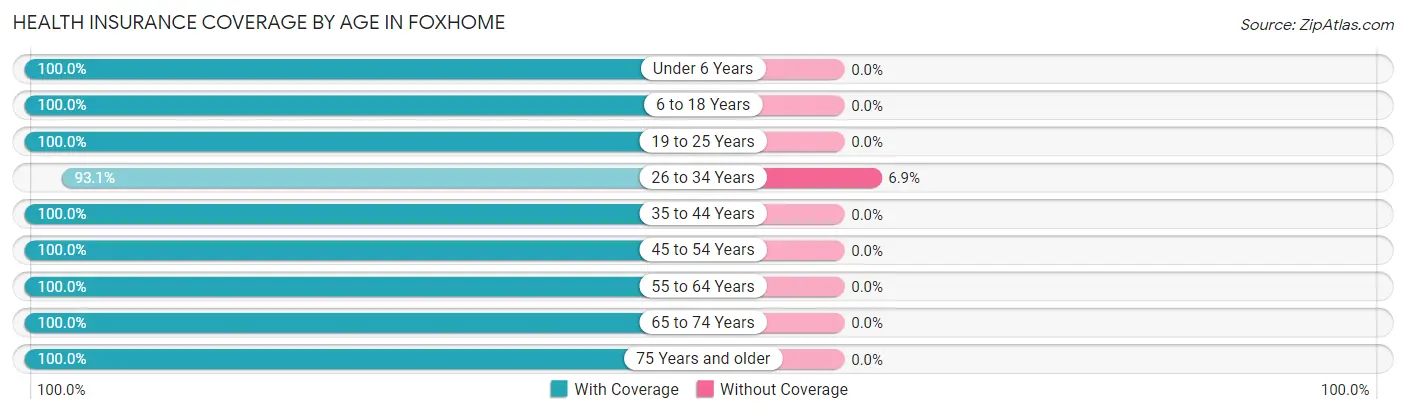
| Age Bracket | With Coverage | Without Coverage |
| Under 6 Years | 11 (100.0%) | 0 (0.0%) |
| 6 to 18 Years | 26 (100.0%) | 0 (0.0%) |
| 19 to 25 Years | 3 (100.0%) | 0 (0.0%) |
| 26 to 34 Years | 27 (93.1%) | 2 (6.9%) |
| 35 to 44 Years | 10 (100.0%) | 0 (0.0%) |
| 45 to 54 Years | 9 (100.0%) | 0 (0.0%) |
| 55 to 64 Years | 13 (100.0%) | 0 (0.0%) |
| 65 to 74 Years | 6 (100.0%) | 0 (0.0%) |
| 75 Years and older | 4 (100.0%) | 0 (0.0%) |
| Total | 109 (98.2%) | 2 (1.8%) |
Health Insurance Coverage by Citizenship Status in Foxhome
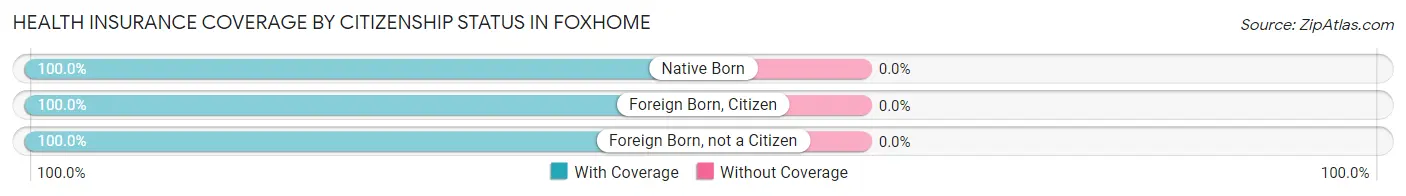
| Citizenship Status | With Coverage | Without Coverage |
| Native Born | 11 (100.0%) | 0 (0.0%) |
| Foreign Born, Citizen | 26 (100.0%) | 0 (0.0%) |
| Foreign Born, not a Citizen | 3 (100.0%) | 0 (0.0%) |
Health Insurance Coverage by Household Income in Foxhome
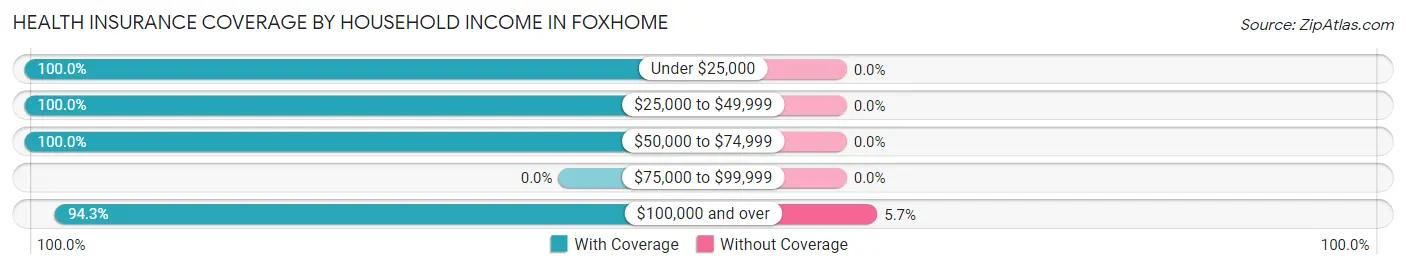
| Household Income | With Coverage | Without Coverage |
| Under $25,000 | 18 (100.0%) | 0 (0.0%) |
| $25,000 to $49,999 | 21 (100.0%) | 0 (0.0%) |
| $50,000 to $74,999 | 37 (100.0%) | 0 (0.0%) |
| $75,000 to $99,999 | 0 (0.0%) | 0 (0.0%) |
| $100,000 and over | 33 (94.3%) | 2 (5.7%) |
Public vs Private Health Insurance Coverage by Age in Foxhome
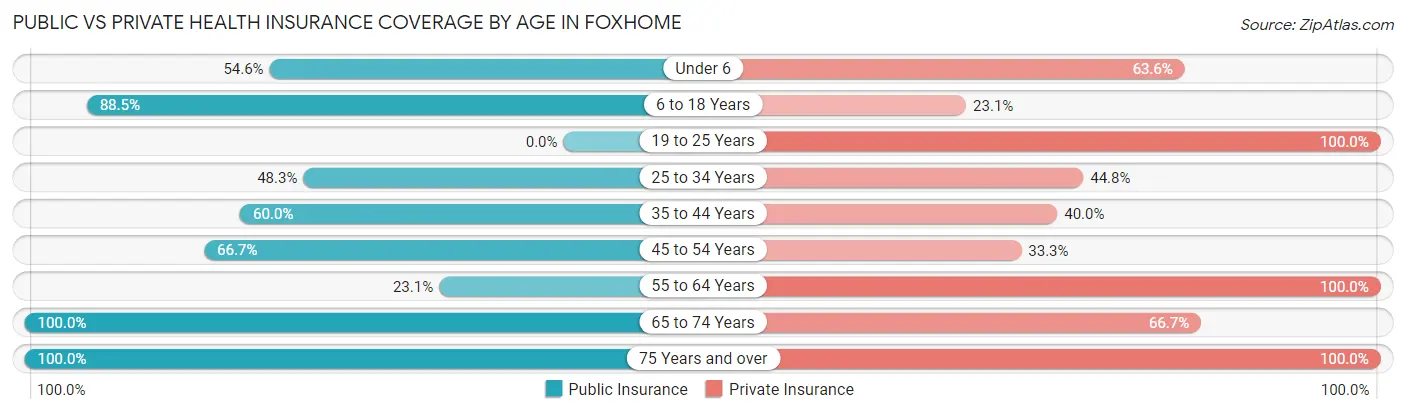
| Age Bracket | Public Insurance | Private Insurance |
| Under 6 | 6 (54.5%) | 7 (63.6%) |
| 6 to 18 Years | 23 (88.5%) | 6 (23.1%) |
| 19 to 25 Years | 0 (0.0%) | 3 (100.0%) |
| 25 to 34 Years | 14 (48.3%) | 13 (44.8%) |
| 35 to 44 Years | 6 (60.0%) | 4 (40.0%) |
| 45 to 54 Years | 6 (66.7%) | 3 (33.3%) |
| 55 to 64 Years | 3 (23.1%) | 13 (100.0%) |
| 65 to 74 Years | 6 (100.0%) | 4 (66.7%) |
| 75 Years and over | 4 (100.0%) | 4 (100.0%) |
| Total | 68 (61.3%) | 57 (51.3%) |
Disability Status by Sex by Age in Foxhome
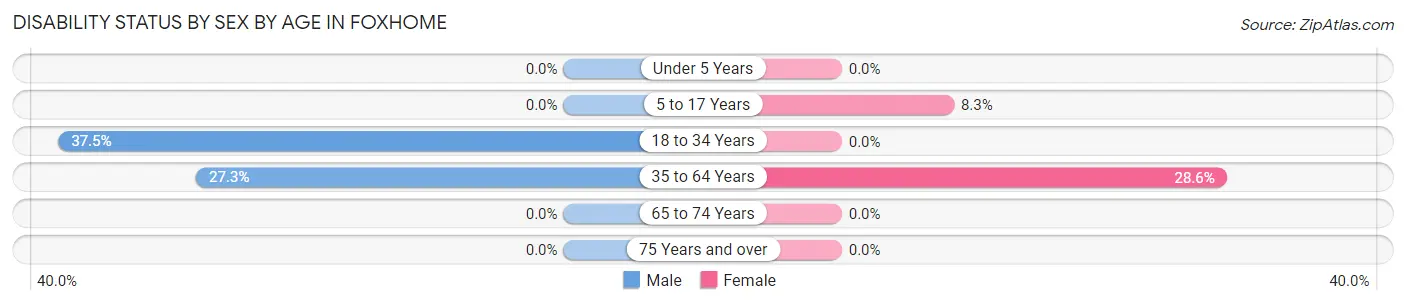
| Age Bracket | Male | Female |
| Under 5 Years | 0 (0.0%) | 0 (0.0%) |
| 5 to 17 Years | 0 (0.0%) | 1 (8.3%) |
| 18 to 34 Years | 6 (37.5%) | 0 (0.0%) |
| 35 to 64 Years | 3 (27.3%) | 6 (28.6%) |
| 65 to 74 Years | 0 (0.0%) | 0 (0.0%) |
| 75 Years and over | 0 (0.0%) | 0 (0.0%) |
Disability Class by Sex by Age in Foxhome
Disability Class: Hearing Difficulty
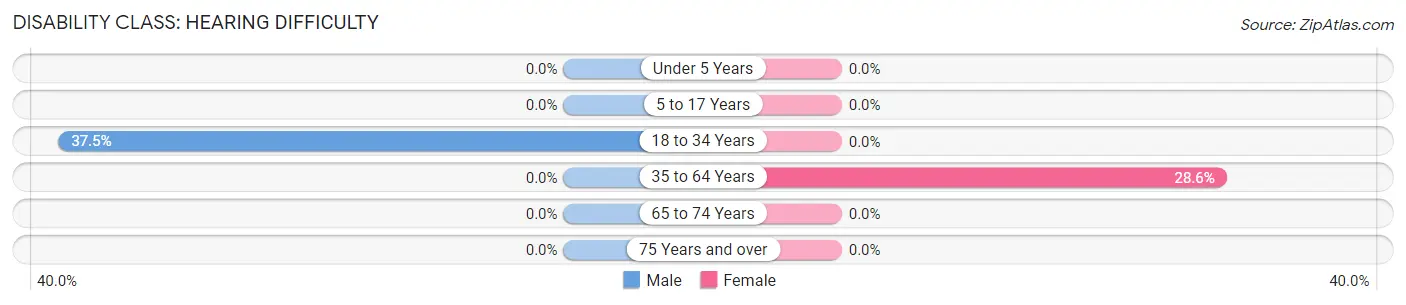
| Age Bracket | Male | Female |
| Under 5 Years | 0 (0.0%) | 0 (0.0%) |
| 5 to 17 Years | 0 (0.0%) | 0 (0.0%) |
| 18 to 34 Years | 6 (37.5%) | 0 (0.0%) |
| 35 to 64 Years | 0 (0.0%) | 6 (28.6%) |
| 65 to 74 Years | 0 (0.0%) | 0 (0.0%) |
| 75 Years and over | 0 (0.0%) | 0 (0.0%) |
Disability Class: Vision Difficulty
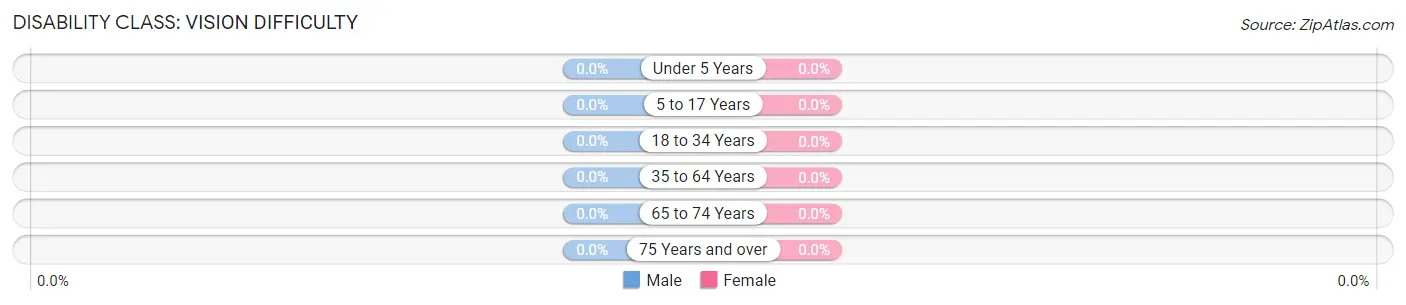
| Age Bracket | Male | Female |
| Under 5 Years | 0 (0.0%) | 0 (0.0%) |
| 5 to 17 Years | 0 (0.0%) | 0 (0.0%) |
| 18 to 34 Years | 0 (0.0%) | 0 (0.0%) |
| 35 to 64 Years | 0 (0.0%) | 0 (0.0%) |
| 65 to 74 Years | 0 (0.0%) | 0 (0.0%) |
| 75 Years and over | 0 (0.0%) | 0 (0.0%) |
Disability Class: Cognitive Difficulty
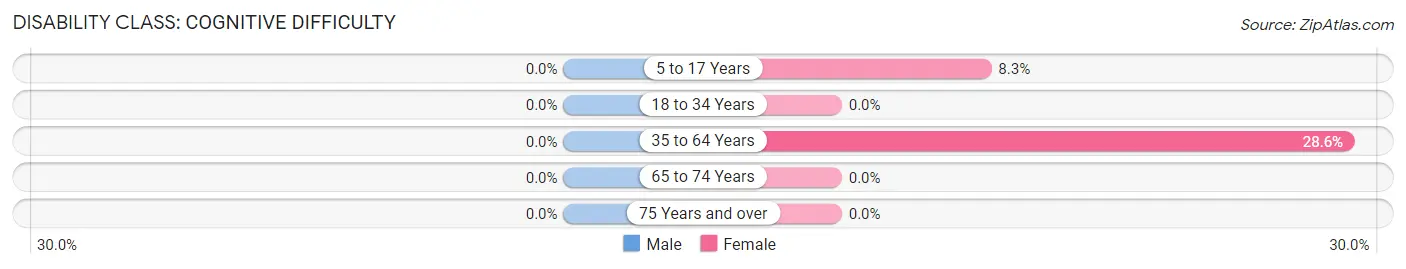
| Age Bracket | Male | Female |
| 5 to 17 Years | 0 (0.0%) | 1 (8.3%) |
| 18 to 34 Years | 0 (0.0%) | 0 (0.0%) |
| 35 to 64 Years | 0 (0.0%) | 6 (28.6%) |
| 65 to 74 Years | 0 (0.0%) | 0 (0.0%) |
| 75 Years and over | 0 (0.0%) | 0 (0.0%) |
Disability Class: Ambulatory Difficulty
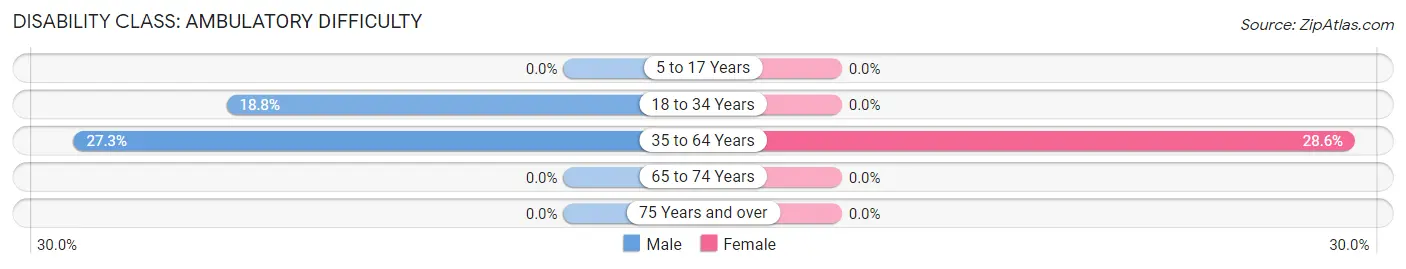
| Age Bracket | Male | Female |
| 5 to 17 Years | 0 (0.0%) | 0 (0.0%) |
| 18 to 34 Years | 3 (18.8%) | 0 (0.0%) |
| 35 to 64 Years | 3 (27.3%) | 6 (28.6%) |
| 65 to 74 Years | 0 (0.0%) | 0 (0.0%) |
| 75 Years and over | 0 (0.0%) | 0 (0.0%) |
Disability Class: Self-Care Difficulty
| Age Bracket | Male | Female |
| 5 to 17 Years | 0 (0.0%) | 0 (0.0%) |
| 18 to 34 Years | 0 (0.0%) | 0 (0.0%) |
| 35 to 64 Years | 0 (0.0%) | 0 (0.0%) |
| 65 to 74 Years | 0 (0.0%) | 0 (0.0%) |
| 75 Years and over | 0 (0.0%) | 0 (0.0%) |
Technology Access in Foxhome
Computing Device Access in Foxhome
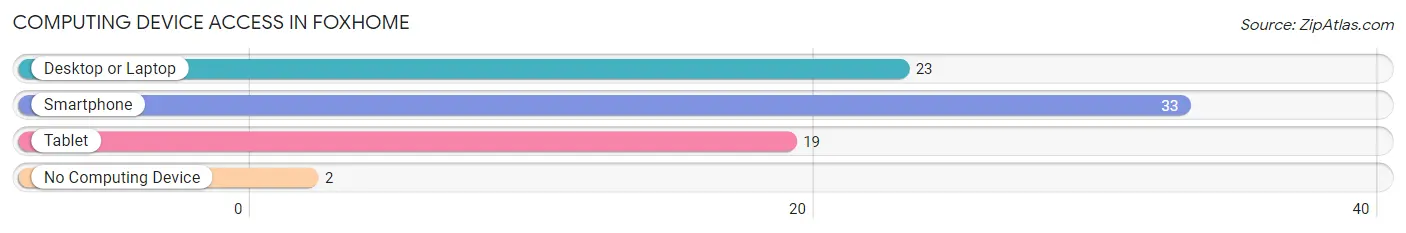
| Device Type | # Households | % Households |
| Desktop or Laptop | 23 | 62.2% |
| Smartphone | 33 | 89.2% |
| Tablet | 19 | 51.3% |
| No Computing Device | 2 | 5.4% |
| Total | 37 | 100.0% |
Internet Access in Foxhome
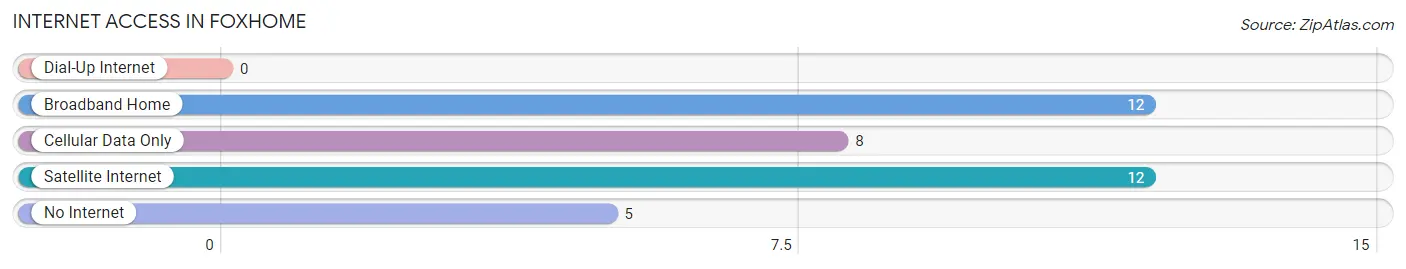
| Internet Type | # Households | % Households |
| Dial-Up Internet | 0 | 0.0% |
| Broadband Home | 12 | 32.4% |
| Cellular Data Only | 8 | 21.6% |
| Satellite Internet | 12 | 32.4% |
| No Internet | 5 | 13.5% |
| Total | 37 | 100.0% |
Foxhome Summary
Home to a population of just over 1,000 people, Foxhome is a small city located in Wilkin County, Minnesota. The city is situated on the banks of the Red River of the North, and is surrounded by rolling hills and farmland. Foxhome is a rural community with a rich history, diverse geography, and a strong economy.
History
The area that is now Foxhome was first settled in the late 1800s by a group of Norwegian immigrants. The settlers named the area “Foxhome” after the foxes that were common in the area. The first post office was established in 1887, and the city was officially incorporated in 1902.
In the early 1900s, Foxhome was a thriving agricultural community. The city was home to several grain elevators, a creamery, and a flour mill. The city also had a thriving lumber industry, with several sawmills located in the area.
In the 1950s, Foxhome began to experience a decline in population as many of the city’s residents moved away in search of better job opportunities. The city’s population continued to decline until the late 1990s, when it began to slowly increase again.
Geography
Foxhome is located in Wilkin County, Minnesota, on the banks of the Red River of the North. The city is situated on the western edge of the Red River Valley, and is surrounded by rolling hills and farmland. The city is located approximately 30 miles south of Fargo, North Dakota, and 90 miles northwest of Minneapolis, Minnesota.
The climate in Foxhome is typical of the Upper Midwest, with cold winters and hot summers. The average annual temperature is around 40 degrees Fahrenheit, and the average annual precipitation is around 28 inches.
Economy
Foxhome’s economy is largely based on agriculture. The city is home to several grain elevators, a creamery, and a flour mill. The city also has a thriving lumber industry, with several sawmills located in the area.
In addition to agriculture, Foxhome is home to several small businesses, including a hardware store, a grocery store, and a restaurant. The city also has a small manufacturing sector, with several small factories located in the area.
Demographics
As of the 2010 census, the population of Foxhome was 1,072. The city has a median age of 44.7 years, and a median household income of $45,938. The city is predominantly white (97.2%), with small percentages of African American (0.9%), Asian (0.4%), and Hispanic (0.3%) residents.
Foxhome is a small, rural community with a rich history, diverse geography, and a strong economy. The city is home to a diverse population, and is a great place to live and work.
Common Questions
What is Per Capita Income in Foxhome?
Per Capita income in Foxhome is $20,801.
What is the Median Family Income in Foxhome?
Median Family Income in Foxhome is $39,375.
What is the Median Household income in Foxhome?
Median Household Income in Foxhome is $57,188.
What is Inequality or Gini Index in Foxhome?
Inequality or Gini Index in Foxhome is 0.37.
What is the Total Population of Foxhome?
Total Population of Foxhome is 113.
What is the Total Male Population of Foxhome?
Total Male Population of Foxhome is 47.
What is the Total Female Population of Foxhome?
Total Female Population of Foxhome is 66.
What is the Ratio of Males per 100 Females in Foxhome?
There are 71.21 Males per 100 Females in Foxhome.
What is the Ratio of Females per 100 Males in Foxhome?
There are 140.43 Females per 100 Males in Foxhome.
What is the Median Population Age in Foxhome?
Median Population Age in Foxhome is 31.6 Years.
What is the Average Family Size in Foxhome
Average Family Size in Foxhome is 3.1 People.
What is the Average Household Size in Foxhome
Average Household Size in Foxhome is 3.0 People.
How Large is the Labor Force in Foxhome?
There are 62 People in the Labor Forcein in Foxhome.
What is the Percentage of People in the Labor Force in Foxhome?
73.8% of People are in the Labor Force in Foxhome.
What is the Unemployment Rate in Foxhome?
Unemployment Rate in Foxhome is 5.0%.