Fort Ripley, MN Map & Demographics
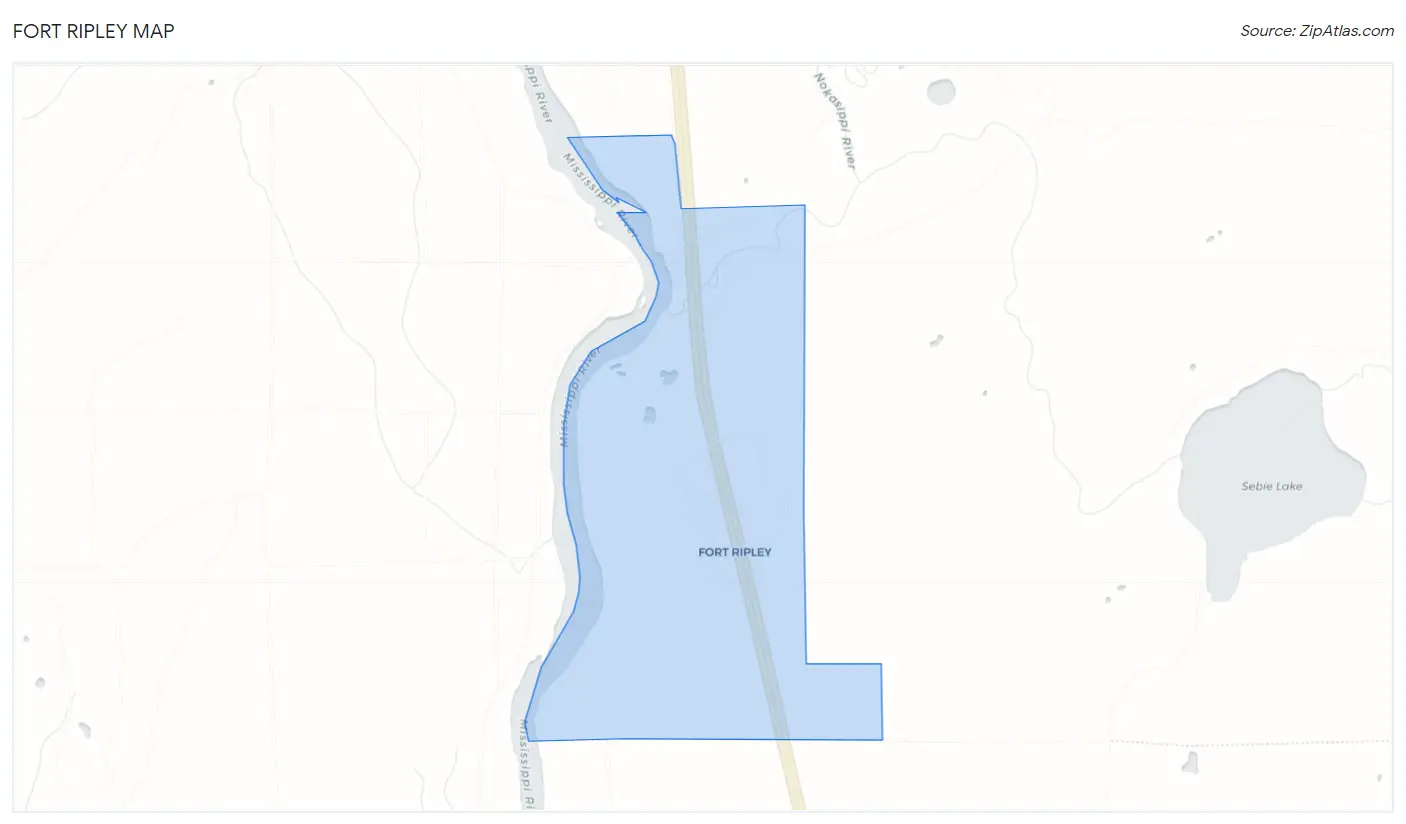
Fort Ripley Map
Fort Ripley Overview
$29,620
PER CAPITA INCOME
$51,042
AVG HOUSEHOLD INCOME
0.43
INEQUALITY / GINI INDEX
86
TOTAL POPULATION
56
MALE POPULATION
30
FEMALE POPULATION
186.67
MALES / 100 FEMALES
53.57
FEMALES / 100 MALES
47.6
MEDIAN AGE
3.2
AVG FAMILY SIZE
2.6
AVG HOUSEHOLD SIZE
39
LABOR FORCE [ PEOPLE ]
59.1%
PERCENT IN LABOR FORCE
17.9%
UNEMPLOYMENT RATE
Fort Ripley Zip Codes
Fort Ripley Area Codes
Income in Fort Ripley
Income Overview in Fort Ripley
| Characteristic | Number | Measure |
| Per Capita Income | 86 | $29,620 |
| Median Family Income | 20 | $0 |
| Mean Family Income | 20 | $89,680 |
| Median Household Income | 33 | $51,042 |
| Mean Household Income | 33 | $67,452 |
| Income Deficit | 20 | $0 |
| Wage / Income Gap (%) | 86 | 0.00% |
| Wage / Income Gap ($) | 86 | 100.00¢ per $1 |
| Gini / Inequality Index | 86 | 0.43 |
Earnings by Sex in Fort Ripley
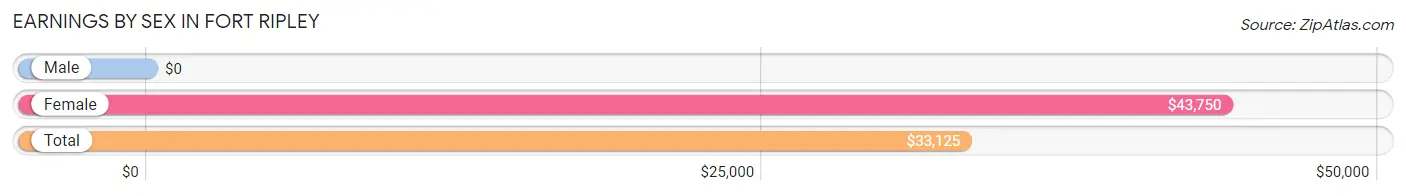
| Sex | Number | Average Earnings |
| Male | 26 (65.0%) | $0 |
| Female | 14 (35.0%) | $43,750 |
| Total | 40 (100.0%) | $33,125 |
Earnings by Sex by Income Bracket in Fort Ripley
The most common earnings brackets in Fort Ripley are $22,500 to $24,999 for men (7 | 26.9%) and $30,000 to $34,999 for women (3 | 21.4%).
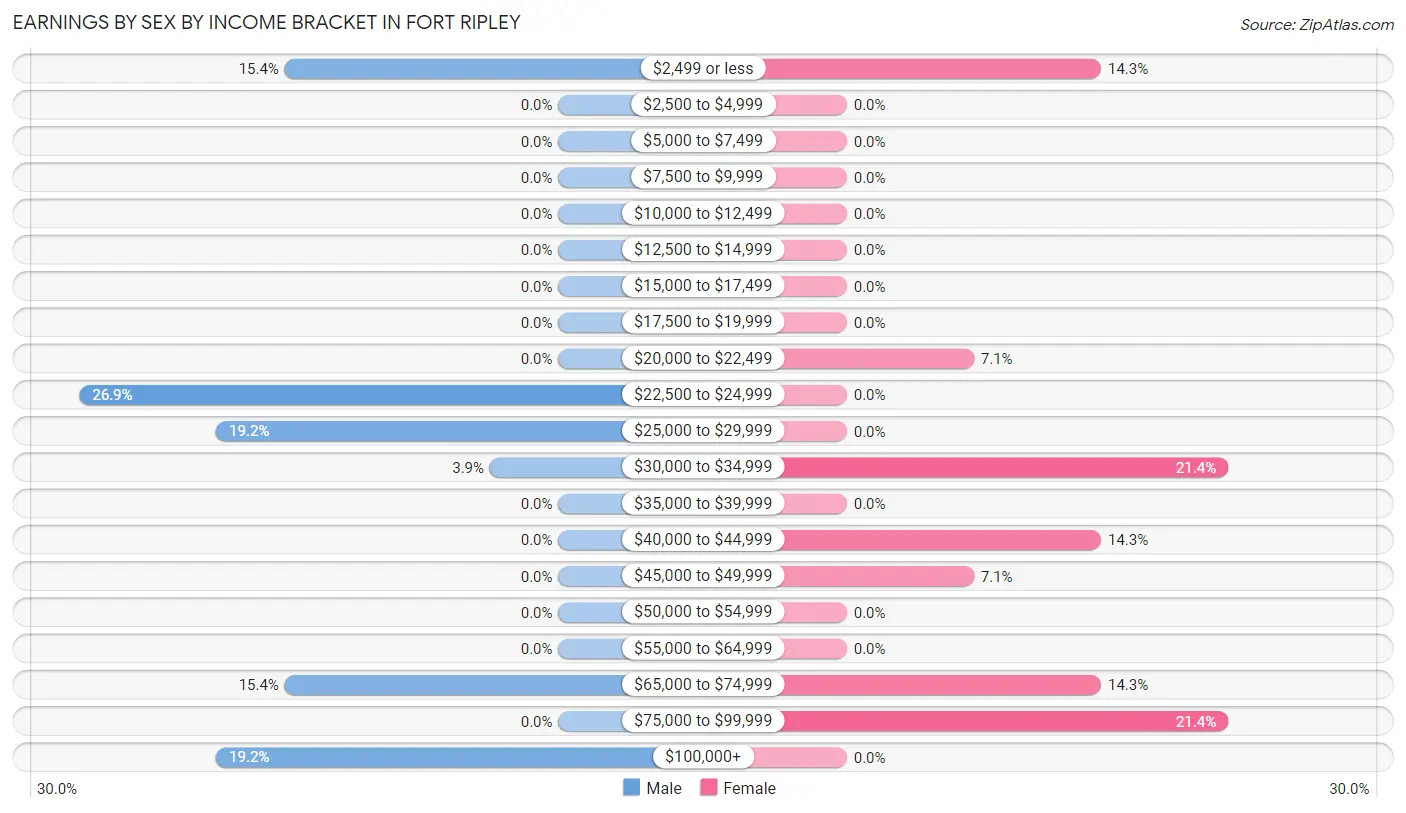
| Income | Male | Female |
| $2,499 or less | 4 (15.4%) | 2 (14.3%) |
| $2,500 to $4,999 | 0 (0.0%) | 0 (0.0%) |
| $5,000 to $7,499 | 0 (0.0%) | 0 (0.0%) |
| $7,500 to $9,999 | 0 (0.0%) | 0 (0.0%) |
| $10,000 to $12,499 | 0 (0.0%) | 0 (0.0%) |
| $12,500 to $14,999 | 0 (0.0%) | 0 (0.0%) |
| $15,000 to $17,499 | 0 (0.0%) | 0 (0.0%) |
| $17,500 to $19,999 | 0 (0.0%) | 0 (0.0%) |
| $20,000 to $22,499 | 0 (0.0%) | 1 (7.1%) |
| $22,500 to $24,999 | 7 (26.9%) | 0 (0.0%) |
| $25,000 to $29,999 | 5 (19.2%) | 0 (0.0%) |
| $30,000 to $34,999 | 1 (3.8%) | 3 (21.4%) |
| $35,000 to $39,999 | 0 (0.0%) | 0 (0.0%) |
| $40,000 to $44,999 | 0 (0.0%) | 2 (14.3%) |
| $45,000 to $49,999 | 0 (0.0%) | 1 (7.1%) |
| $50,000 to $54,999 | 0 (0.0%) | 0 (0.0%) |
| $55,000 to $64,999 | 0 (0.0%) | 0 (0.0%) |
| $65,000 to $74,999 | 4 (15.4%) | 2 (14.3%) |
| $75,000 to $99,999 | 0 (0.0%) | 3 (21.4%) |
| $100,000+ | 5 (19.2%) | 0 (0.0%) |
| Total | 26 (100.0%) | 14 (100.0%) |
Earnings by Sex by Educational Attainment in Fort Ripley
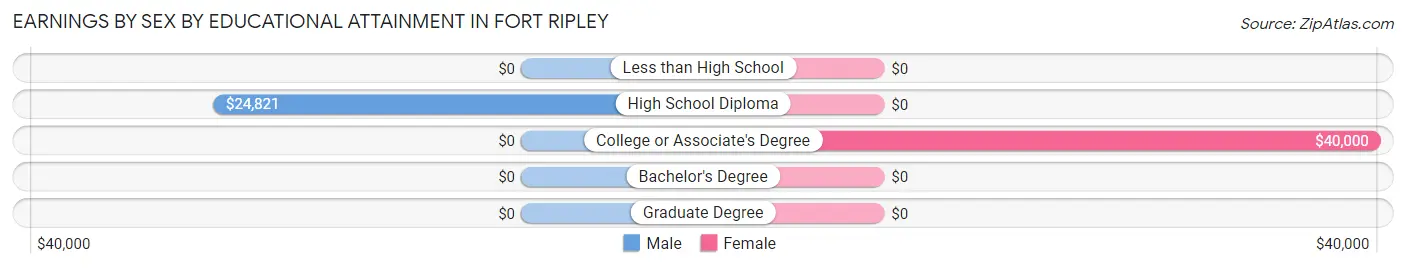
| Educational Attainment | Male Income | Female Income |
| Less than High School | - | - |
| High School Diploma | $24,821 | $0 |
| College or Associate's Degree | - | - |
| Bachelor's Degree | - | - |
| Graduate Degree | - | - |
| Total | - | - |
Family Income in Fort Ripley
Family Income Brackets in Fort Ripley
According to the Fort Ripley family income data, there are 6 families falling into the $50,000 to $74,999 income range, which is the most common income bracket and makes up 30.0% of all families.
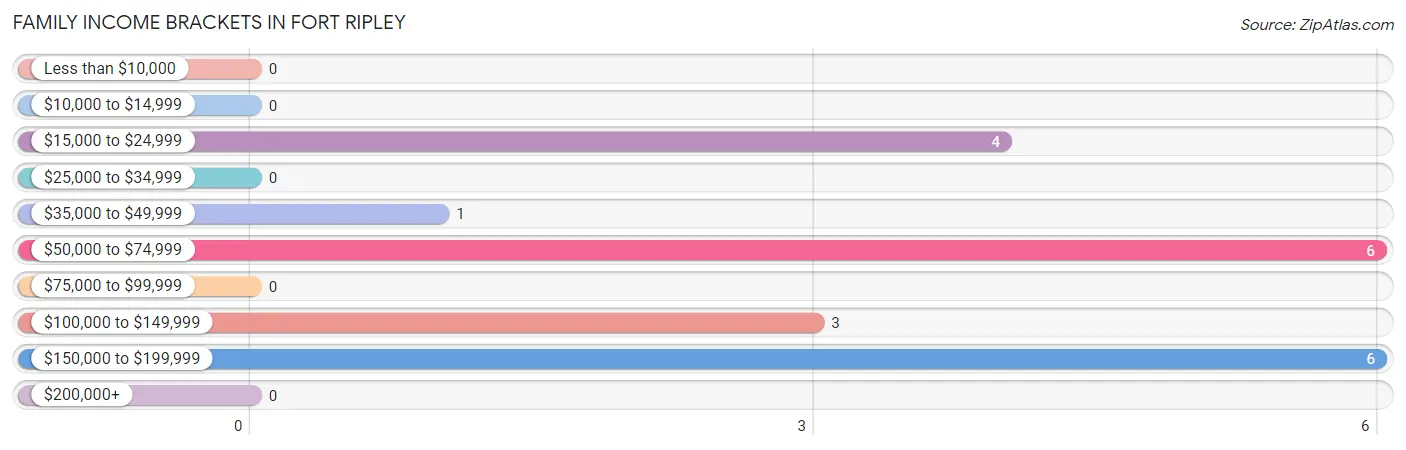
| Income Bracket | # Families | % Families |
| Less than $10,000 | 0 | 0.0% |
| $10,000 to $14,999 | 0 | 0.0% |
| $15,000 to $24,999 | 4 | 20.0% |
| $25,000 to $34,999 | 0 | 0.0% |
| $35,000 to $49,999 | 1 | 5.0% |
| $50,000 to $74,999 | 6 | 30.0% |
| $75,000 to $99,999 | 0 | 0.0% |
| $100,000 to $149,999 | 3 | 15.0% |
| $150,000 to $199,999 | 6 | 30.0% |
| $200,000+ | 0 | 0.0% |
Family Income by Famaliy Size in Fort Ripley
2-person families (14 | 70.0%) account for the highest median family income in Fort Ripley with $51,667 per family, while 2-person families (14 | 70.0%) have the highest median income of $25,834 per family member.
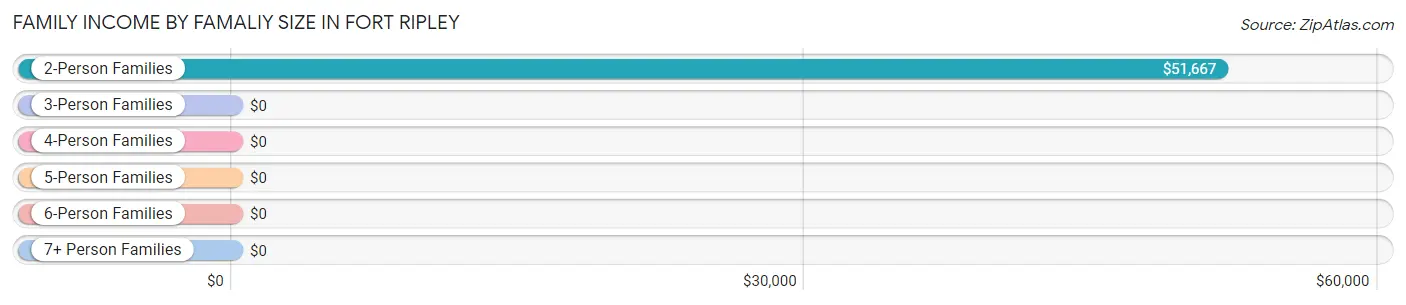
| Income Bracket | # Families | Median Income |
| 2-Person Families | 14 (70.0%) | $51,667 |
| 3-Person Families | 0 (0.0%) | $0 |
| 4-Person Families | 2 (10.0%) | $0 |
| 5-Person Families | 1 (5.0%) | $0 |
| 6-Person Families | 0 (0.0%) | $0 |
| 7+ Person Families | 3 (15.0%) | $0 |
| Total | 20 (100.0%) | $0 |
Family Income by Number of Earners in Fort Ripley
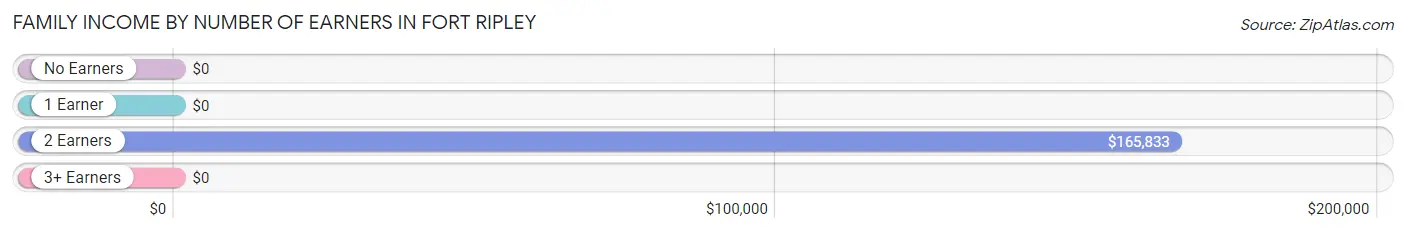
| Number of Earners | # Families | Median Income |
| No Earners | 6 (30.0%) | $0 |
| 1 Earner | 5 (25.0%) | $0 |
| 2 Earners | 8 (40.0%) | $165,833 |
| 3+ Earners | 1 (5.0%) | $0 |
| Total | 20 (100.0%) | $0 |
Household Income in Fort Ripley
Household Income Brackets in Fort Ripley
With 11 households falling in the category, the $15,000 to $24,999 income range is the most frequent in Fort Ripley, accounting for 33.3% of all households.
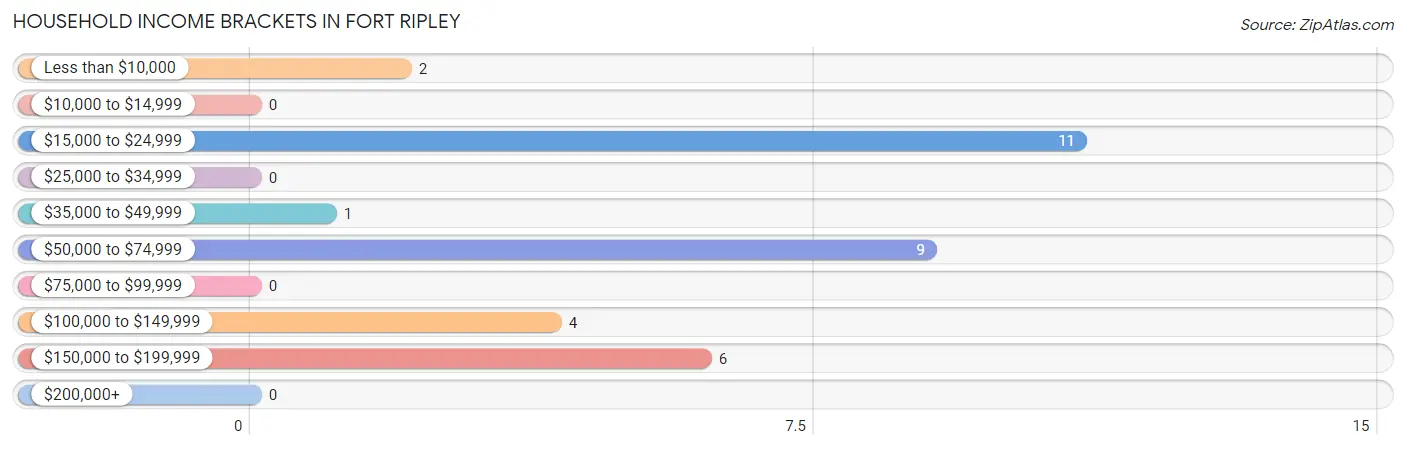
| Income Bracket | # Households | % Households |
| Less than $10,000 | 2 | 6.1% |
| $10,000 to $14,999 | 0 | 0.0% |
| $15,000 to $24,999 | 11 | 33.3% |
| $25,000 to $34,999 | 0 | 0.0% |
| $35,000 to $49,999 | 1 | 3.0% |
| $50,000 to $74,999 | 9 | 27.3% |
| $75,000 to $99,999 | 0 | 0.0% |
| $100,000 to $149,999 | 4 | 12.1% |
| $150,000 to $199,999 | 6 | 18.2% |
| $200,000+ | 0 | 0.0% |
Household Income by Householder Age in Fort Ripley
The median household income in Fort Ripley is $51,042, with the highest median household income of $166,667 found in the 25 to 44 years age bracket for the primary householder. A total of 6 households (18.2%) fall into this category.
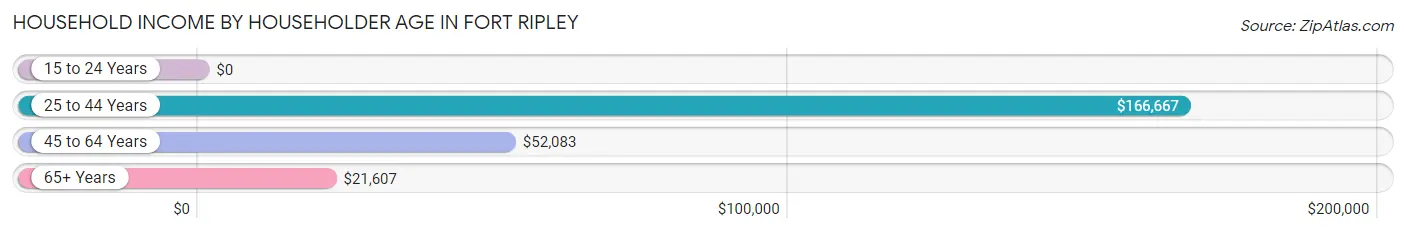
| Income Bracket | # Households | Median Income |
| 15 to 24 Years | 0 (0.0%) | $0 |
| 25 to 44 Years | 6 (18.2%) | $166,667 |
| 45 to 64 Years | 10 (30.3%) | $52,083 |
| 65+ Years | 17 (51.5%) | $21,607 |
| Total | 33 (100.0%) | $51,042 |
Poverty in Fort Ripley
Income Below Poverty by Sex and Age in Fort Ripley
With 5.4% poverty level for males and 10.0% for females among the residents of Fort Ripley, 75 year old and over males and 65 to 74 year old females are the most vulnerable to poverty, with 1 males (50.0%) and 3 females (42.9%) in their respective age groups living below the poverty level.
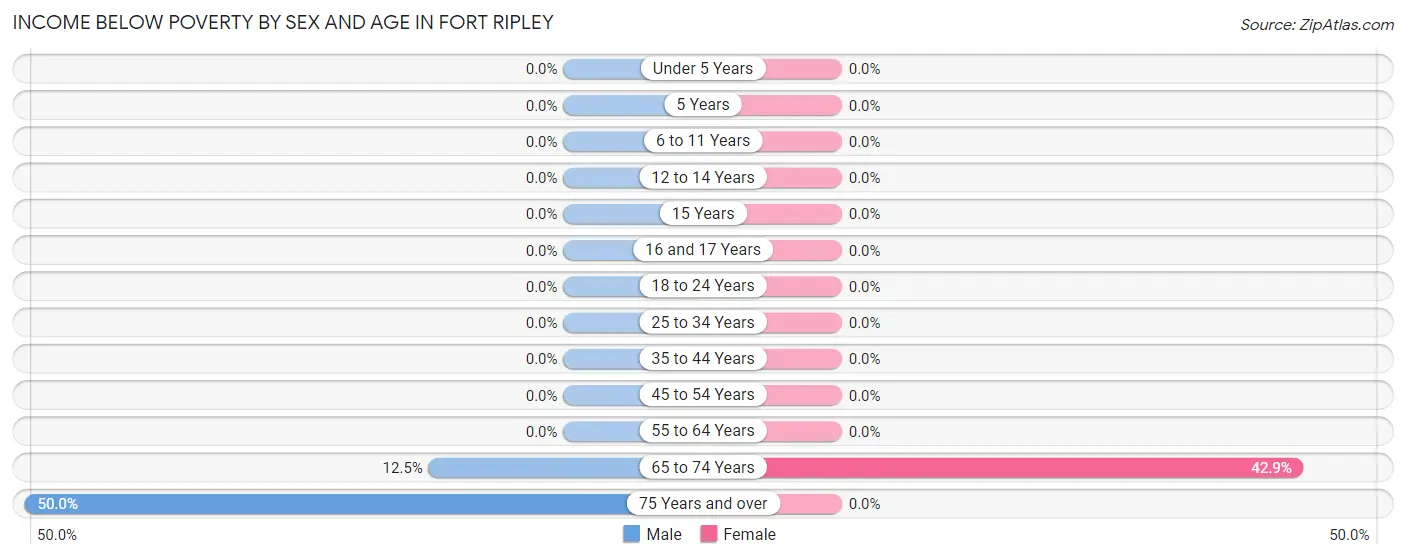
| Age Bracket | Male | Female |
| Under 5 Years | 0 (0.0%) | 0 (0.0%) |
| 5 Years | 0 (0.0%) | 0 (0.0%) |
| 6 to 11 Years | 0 (0.0%) | 0 (0.0%) |
| 12 to 14 Years | 0 (0.0%) | 0 (0.0%) |
| 15 Years | 0 (0.0%) | 0 (0.0%) |
| 16 and 17 Years | 0 (0.0%) | 0 (0.0%) |
| 18 to 24 Years | 0 (0.0%) | 0 (0.0%) |
| 25 to 34 Years | 0 (0.0%) | 0 (0.0%) |
| 35 to 44 Years | 0 (0.0%) | 0 (0.0%) |
| 45 to 54 Years | 0 (0.0%) | 0 (0.0%) |
| 55 to 64 Years | 0 (0.0%) | 0 (0.0%) |
| 65 to 74 Years | 2 (12.5%) | 3 (42.9%) |
| 75 Years and over | 1 (50.0%) | 0 (0.0%) |
| Total | 3 (5.4%) | 3 (10.0%) |
Income Above Poverty by Sex and Age in Fort Ripley
According to the poverty statistics in Fort Ripley, males aged under 5 years and females aged under 5 years are the age groups that are most secure financially, with 100.0% of males and 100.0% of females in these age groups living above the poverty line.
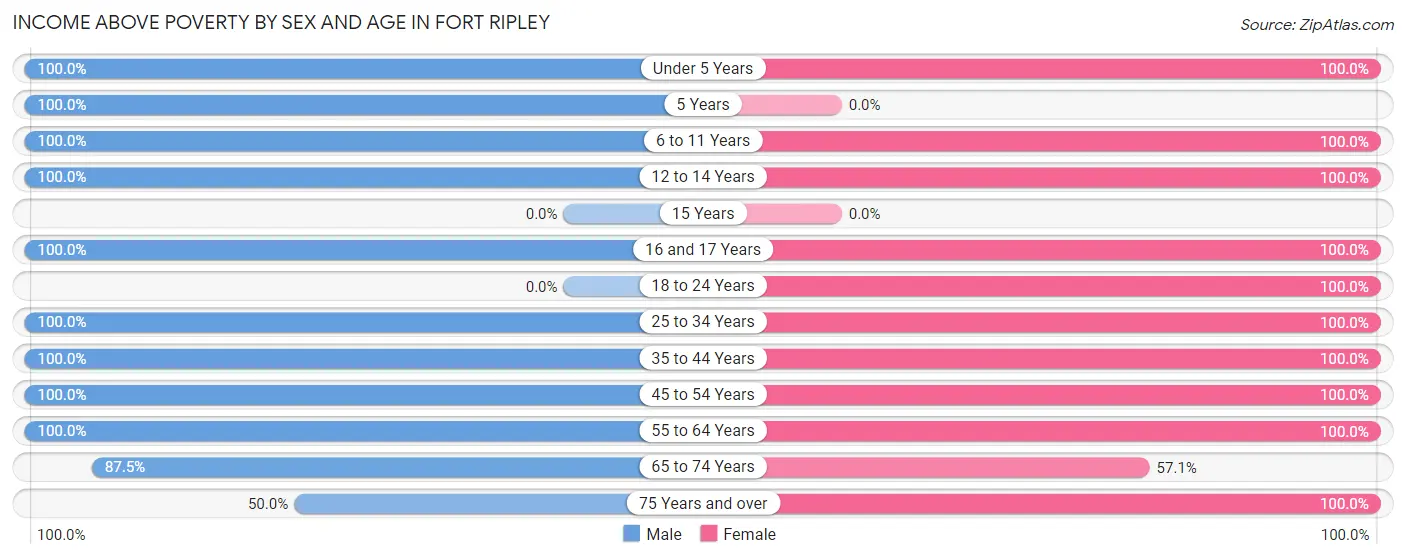
| Age Bracket | Male | Female |
| Under 5 Years | 4 (100.0%) | 4 (100.0%) |
| 5 Years | 3 (100.0%) | 0 (0.0%) |
| 6 to 11 Years | 3 (100.0%) | 3 (100.0%) |
| 12 to 14 Years | 1 (100.0%) | 2 (100.0%) |
| 15 Years | 0 (0.0%) | 0 (0.0%) |
| 16 and 17 Years | 1 (100.0%) | 1 (100.0%) |
| 18 to 24 Years | 0 (0.0%) | 1 (100.0%) |
| 25 to 34 Years | 3 (100.0%) | 3 (100.0%) |
| 35 to 44 Years | 6 (100.0%) | 3 (100.0%) |
| 45 to 54 Years | 8 (100.0%) | 2 (100.0%) |
| 55 to 64 Years | 9 (100.0%) | 2 (100.0%) |
| 65 to 74 Years | 14 (87.5%) | 4 (57.1%) |
| 75 Years and over | 1 (50.0%) | 2 (100.0%) |
| Total | 53 (94.6%) | 27 (90.0%) |
Income Below Poverty Among Married-Couple Families in Fort Ripley
The poverty statistics for married-couple families in Fort Ripley show that 11.8% or 2 of the total 17 families live below the poverty line. Families with no children have the highest poverty rate of 18.2%, comprising of 2 families. On the other hand, families with 1 or 2 children have the lowest poverty rate of 0.0%, which includes 0 families.
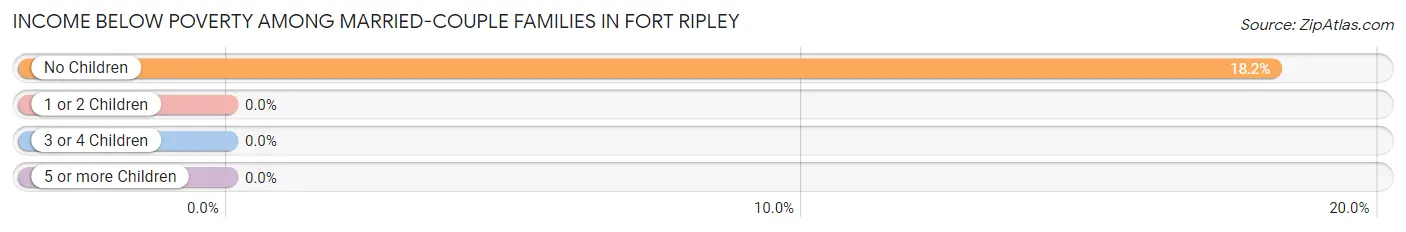
| Children | Above Poverty | Below Poverty |
| No Children | 9 (81.8%) | 2 (18.2%) |
| 1 or 2 Children | 3 (100.0%) | 0 (0.0%) |
| 3 or 4 Children | 0 (0.0%) | 0 (0.0%) |
| 5 or more Children | 3 (100.0%) | 0 (0.0%) |
| Total | 15 (88.2%) | 2 (11.8%) |
Income Below Poverty Among Single-Parent Households in Fort Ripley
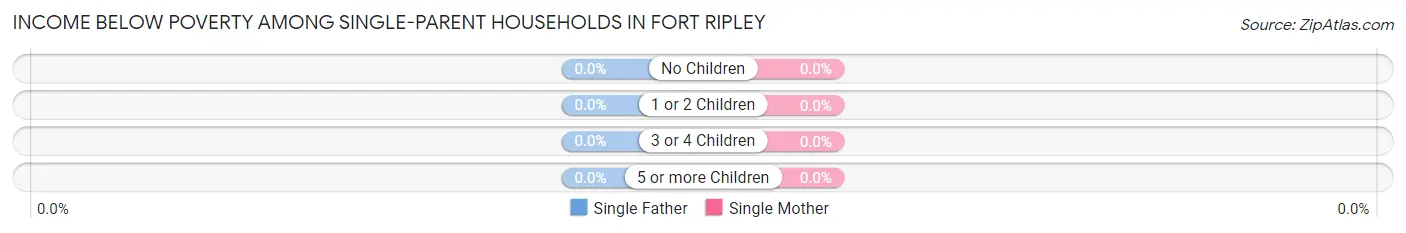
| Children | Single Father | Single Mother |
| No Children | 0 (0.0%) | 0 (0.0%) |
| 1 or 2 Children | 0 (0.0%) | 0 (0.0%) |
| 3 or 4 Children | 0 (0.0%) | 0 (0.0%) |
| 5 or more Children | 0 (0.0%) | 0 (0.0%) |
| Total | 0 (0.0%) | 0 (0.0%) |
Income Below Poverty Among Married-Couple vs Single-Parent Households in Fort Ripley
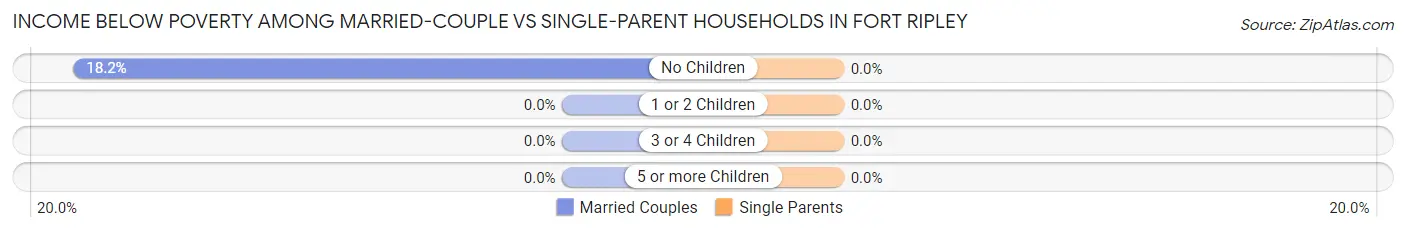
| Children | Married-Couple Families | Single-Parent Households |
| No Children | 2 (18.2%) | 0 (0.0%) |
| 1 or 2 Children | 0 (0.0%) | 0 (0.0%) |
| 3 or 4 Children | 0 (0.0%) | 0 (0.0%) |
| 5 or more Children | 0 (0.0%) | 0 (0.0%) |
| Total | 2 (11.8%) | 0 (0.0%) |
Race in Fort Ripley
The most populous races in Fort Ripley are White / Caucasian (86 | 100.0%), and Hispanic or Latino (4 | 4.6%).
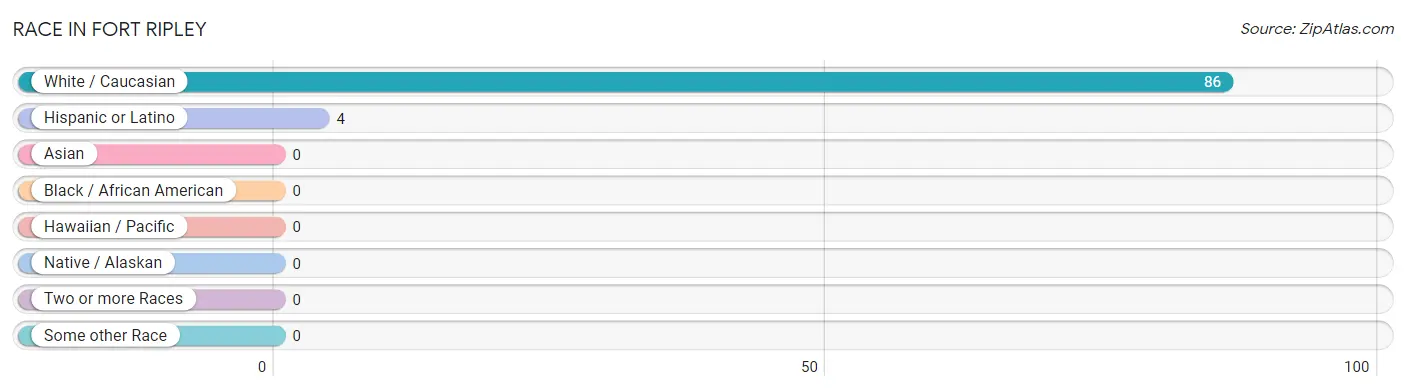
| Race | # Population | % Population |
| Asian | 0 | 0.0% |
| Black / African American | 0 | 0.0% |
| Hawaiian / Pacific | 0 | 0.0% |
| Hispanic or Latino | 4 | 4.6% |
| Native / Alaskan | 0 | 0.0% |
| White / Caucasian | 86 | 100.0% |
| Two or more Races | 0 | 0.0% |
| Some other Race | 0 | 0.0% |
| Total | 86 | 100.0% |
Ancestry in Fort Ripley
The most populous ancestries reported in Fort Ripley are Irish (28 | 32.6%), German (24 | 27.9%), Danish (16 | 18.6%), Norwegian (16 | 18.6%), and American (8 | 9.3%), together accounting for 107.0% of all Fort Ripley residents.
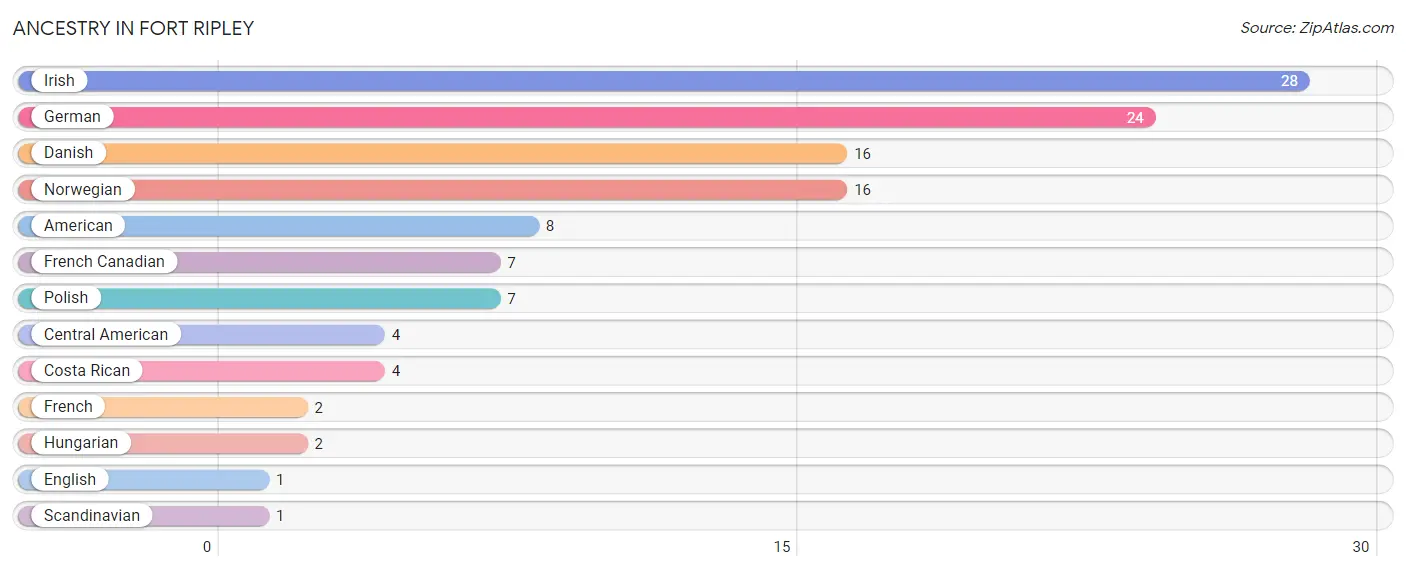
| Ancestry | # Population | % Population |
| American | 8 | 9.3% |
| Central American | 4 | 4.6% |
| Costa Rican | 4 | 4.6% |
| Danish | 16 | 18.6% |
| English | 1 | 1.2% |
| French | 2 | 2.3% |
| French Canadian | 7 | 8.1% |
| German | 24 | 27.9% |
| Hungarian | 2 | 2.3% |
| Irish | 28 | 32.6% |
| Norwegian | 16 | 18.6% |
| Polish | 7 | 8.1% |
| Scandinavian | 1 | 1.2% | View All 13 Rows |
Immigrants in Fort Ripley

| Immigration Origin | # Population | % Population | View All 0 Rows |
Sex and Age in Fort Ripley
Sex and Age in Fort Ripley
The most populous age groups in Fort Ripley are 65 to 69 Years (10 | 17.9%) for men and Under 5 Years (4 | 13.3%) for women.
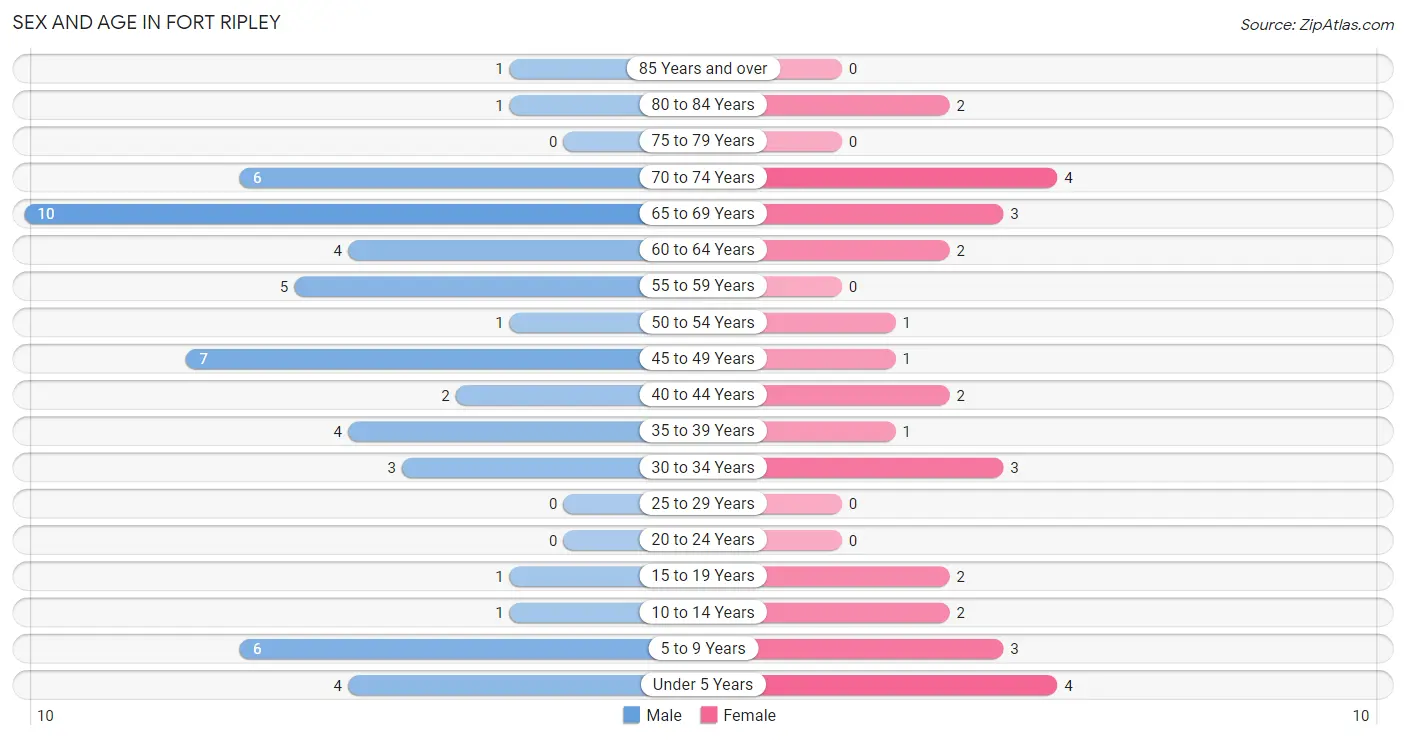
| Age Bracket | Male | Female |
| Under 5 Years | 4 (7.1%) | 4 (13.3%) |
| 5 to 9 Years | 6 (10.7%) | 3 (10.0%) |
| 10 to 14 Years | 1 (1.8%) | 2 (6.7%) |
| 15 to 19 Years | 1 (1.8%) | 2 (6.7%) |
| 20 to 24 Years | 0 (0.0%) | 0 (0.0%) |
| 25 to 29 Years | 0 (0.0%) | 0 (0.0%) |
| 30 to 34 Years | 3 (5.4%) | 3 (10.0%) |
| 35 to 39 Years | 4 (7.1%) | 1 (3.3%) |
| 40 to 44 Years | 2 (3.6%) | 2 (6.7%) |
| 45 to 49 Years | 7 (12.5%) | 1 (3.3%) |
| 50 to 54 Years | 1 (1.8%) | 1 (3.3%) |
| 55 to 59 Years | 5 (8.9%) | 0 (0.0%) |
| 60 to 64 Years | 4 (7.1%) | 2 (6.7%) |
| 65 to 69 Years | 10 (17.9%) | 3 (10.0%) |
| 70 to 74 Years | 6 (10.7%) | 4 (13.3%) |
| 75 to 79 Years | 0 (0.0%) | 0 (0.0%) |
| 80 to 84 Years | 1 (1.8%) | 2 (6.7%) |
| 85 Years and over | 1 (1.8%) | 0 (0.0%) |
| Total | 56 (100.0%) | 30 (100.0%) |
Families and Households in Fort Ripley
Median Family Size in Fort Ripley
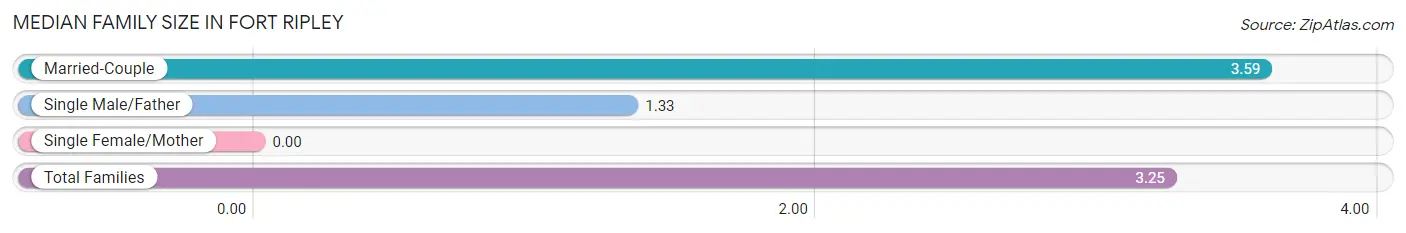
| Family Type | # Families | Family Size |
| Married-Couple | 17 (85.0%) | 3.59 |
| Single Male/Father | 3 (15.0%) | 1.33 |
| Single Female/Mother | 0 (0.0%) | - |
| Total Families | 20 (100.0%) | 3.25 |
Median Household Size in Fort Ripley
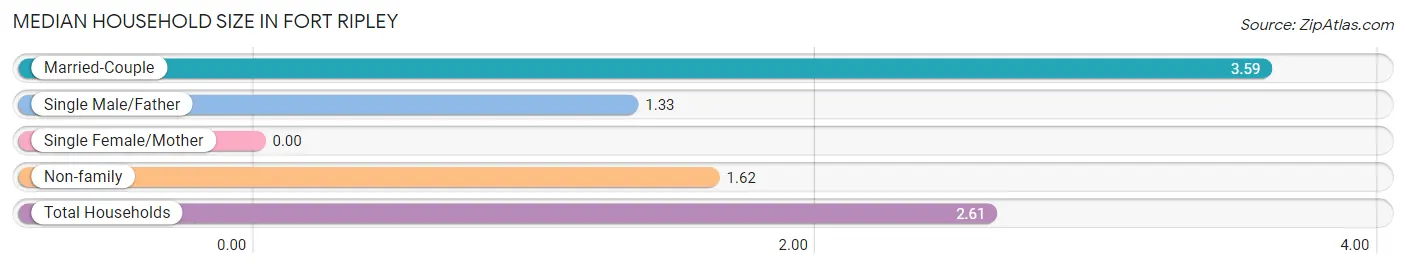
| Household Type | # Households | Household Size |
| Married-Couple | 17 (51.5%) | 3.59 |
| Single Male/Father | 3 (9.1%) | 1.33 |
| Single Female/Mother | 0 (0.0%) | - |
| Non-family | 13 (39.4%) | 1.62 |
| Total Households | 33 (100.0%) | 2.61 |
Household Size by Marriage Status in Fort Ripley
Out of a total of 33 households in Fort Ripley, 20 (60.6%) are family households, while 13 (39.4%) are nonfamily households. The most numerous type of family households are 2-person households, comprising 14, and the most common type of nonfamily households are 1-person households, comprising 9.
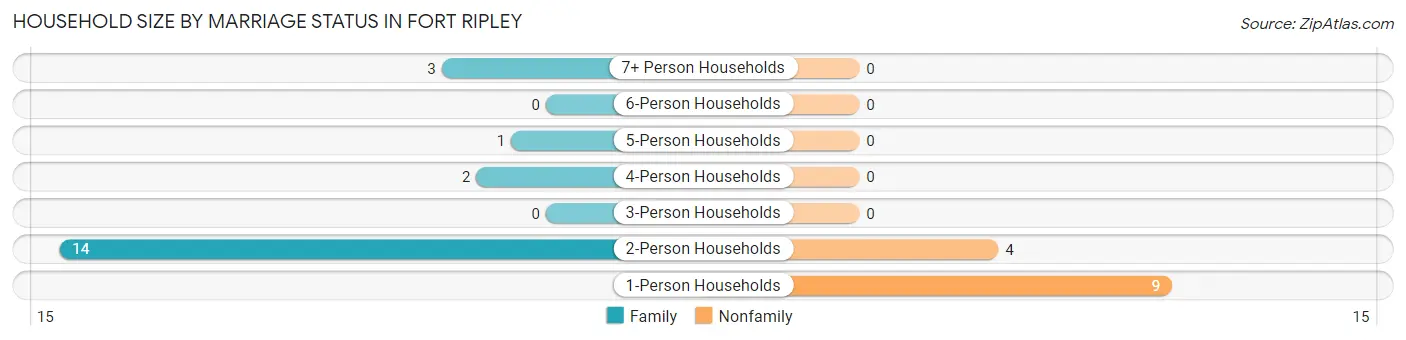
| Household Size | Family Households | Nonfamily Households |
| 1-Person Households | - | 9 (27.3%) |
| 2-Person Households | 14 (42.4%) | 4 (12.1%) |
| 3-Person Households | 0 (0.0%) | 0 (0.0%) |
| 4-Person Households | 2 (6.1%) | 0 (0.0%) |
| 5-Person Households | 1 (3.0%) | 0 (0.0%) |
| 6-Person Households | 0 (0.0%) | 0 (0.0%) |
| 7+ Person Households | 3 (9.1%) | 0 (0.0%) |
| Total | 20 (60.6%) | 13 (39.4%) |
Female Fertility in Fort Ripley
Fertility by Age in Fort Ripley
Average fertility rate in Fort Ripley is 111.0 births per 1,000 women. Women in the age bracket of 35 to 50 years have the highest fertility rate with 250.0 births per 1,000 women. Women in the age bracket of 35 to 50 years acount for 100.0% of all women with births.
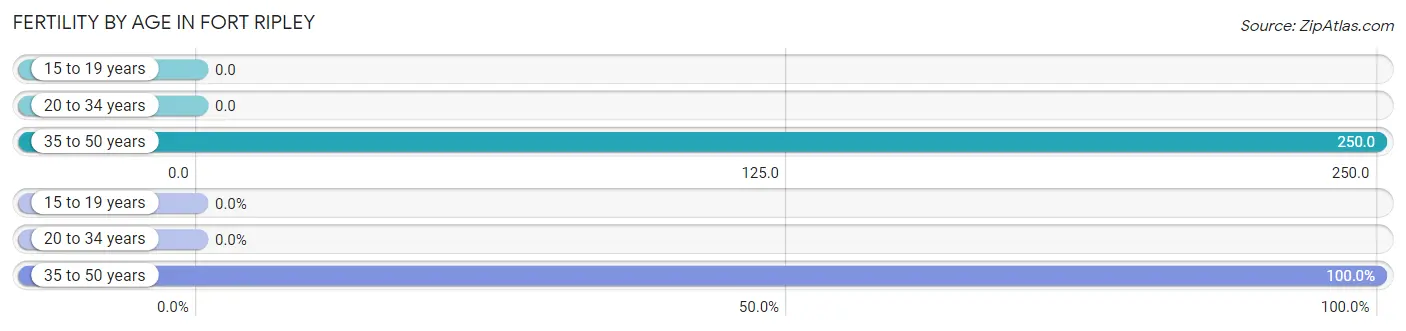
| Age Bracket | Women with Births | Births / 1,000 Women |
| 15 to 19 years | 0 (0.0%) | 0.0 |
| 20 to 34 years | 0 (0.0%) | 0.0 |
| 35 to 50 years | 1 (100.0%) | 250.0 |
| Total | 1 (100.0%) | 111.0 |
Fertility by Age by Marriage Status in Fort Ripley
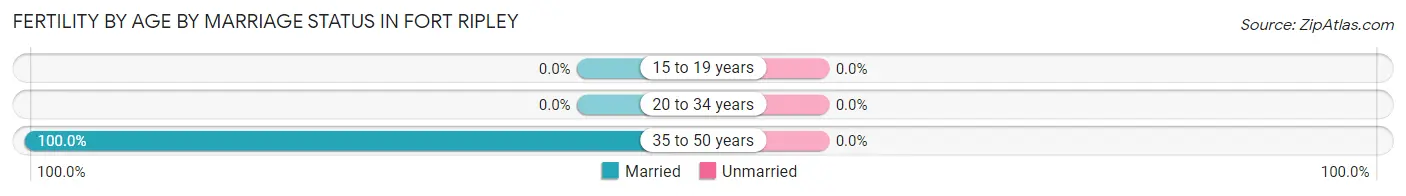
| Age Bracket | Married | Unmarried |
| 15 to 19 years | 0 (0.0%) | 0 (0.0%) |
| 20 to 34 years | 0 (0.0%) | 0 (0.0%) |
| 35 to 50 years | 1 (100.0%) | 0 (0.0%) |
| Total | 1 (100.0%) | 0 (0.0%) |
Fertility by Education in Fort Ripley
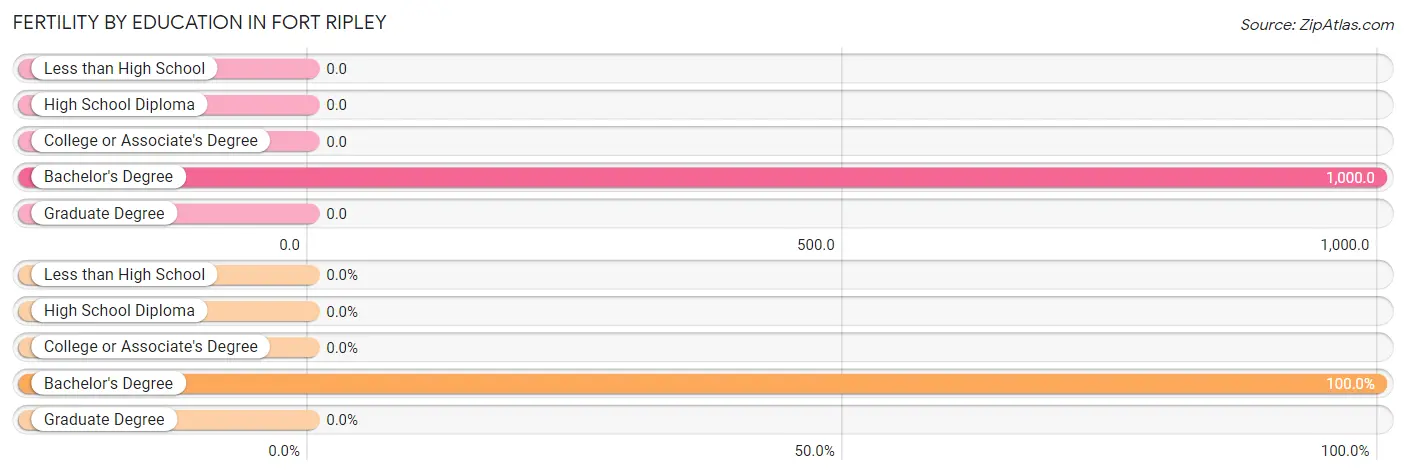
| Educational Attainment | Women with Births | Births / 1,000 Women |
| Less than High School | 0 (0.0%) | 0.0 |
| High School Diploma | 0 (0.0%) | 0.0 |
| College or Associate's Degree | 0 (0.0%) | 0.0 |
| Bachelor's Degree | 1 (100.0%) | 1,000.0 |
| Graduate Degree | 0 (0.0%) | 0.0 |
| Total | 1 (100.0%) | 111.0 |
Fertility by Education by Marriage Status in Fort Ripley
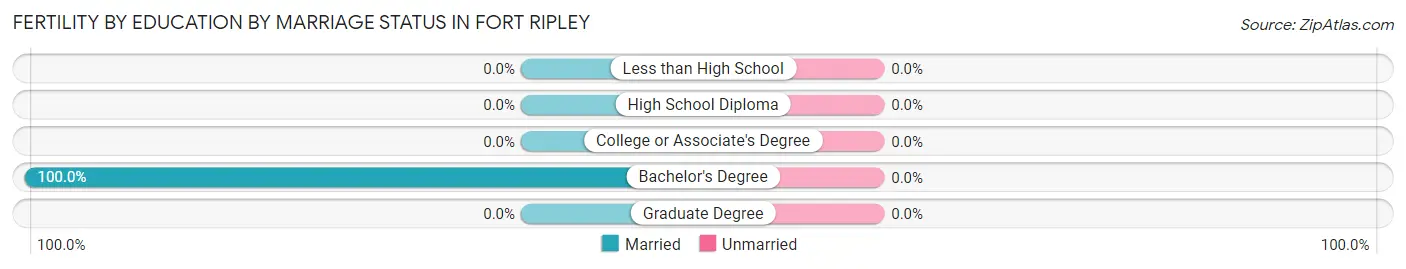
| Educational Attainment | Married | Unmarried |
| Less than High School | 0 (0.0%) | 0 (0.0%) |
| High School Diploma | 0 (0.0%) | 0 (0.0%) |
| College or Associate's Degree | 0 (0.0%) | 0 (0.0%) |
| Bachelor's Degree | 1 (100.0%) | 0 (0.0%) |
| Graduate Degree | 0 (0.0%) | 0 (0.0%) |
| Total | 1 (100.0%) | 0 (0.0%) |
Employment Characteristics in Fort Ripley
Employment by Class of Employer in Fort Ripley
Among the 32 employed individuals in Fort Ripley, private company employees (25 | 78.1%), local government employees (3 | 9.4%), and self-employed (not incorporated) (2 | 6.2%) make up the most common classes of employment.
| Employer Class | # Employees | % Employees |
| Private Company Employees | 25 | 78.1% |
| Self-Employed (Incorporated) | 0 | 0.0% |
| Self-Employed (Not Incorporated) | 2 | 6.2% |
| Not-for-profit Organizations | 2 | 6.2% |
| Local Government Employees | 3 | 9.4% |
| State Government Employees | 0 | 0.0% |
| Federal Government Employees | 0 | 0.0% |
| Unpaid Family Workers | 0 | 0.0% |
| Total | 32 | 100.0% |
Employment Status by Age in Fort Ripley
According to the labor force statistics for Fort Ripley, out of the total population over 16 years of age (66), 59.1% or 39 individuals are in the labor force, with 17.9% or 7 of them unemployed. The age group with the highest labor force participation rate is 30 to 34 years, with 100.0% or 6 individuals in the labor force. Within the labor force, the 45 to 54 years age range has the highest percentage of unemployed individuals, with 70.0% or 7 of them being unemployed.
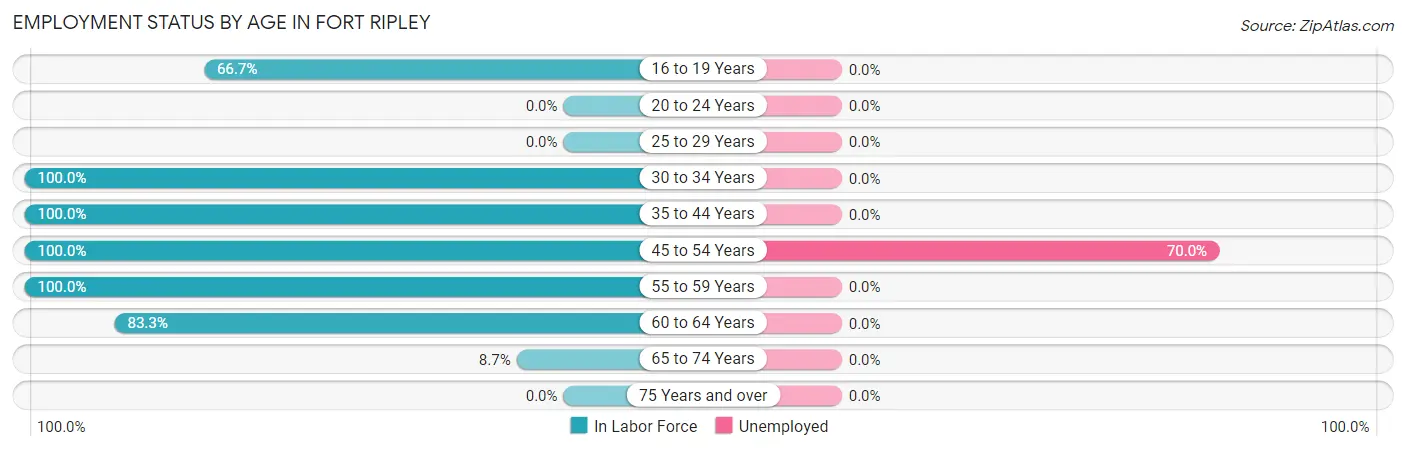
| Age Bracket | In Labor Force | Unemployed |
| 16 to 19 Years | 2 (66.7%) | 0 (0.0%) |
| 20 to 24 Years | 0 (0.0%) | 0 (0.0%) |
| 25 to 29 Years | 0 (0.0%) | 0 (0.0%) |
| 30 to 34 Years | 6 (100.0%) | 0 (0.0%) |
| 35 to 44 Years | 9 (100.0%) | 0 (0.0%) |
| 45 to 54 Years | 10 (100.0%) | 7 (70.0%) |
| 55 to 59 Years | 5 (100.0%) | 0 (0.0%) |
| 60 to 64 Years | 5 (83.3%) | 0 (0.0%) |
| 65 to 74 Years | 2 (8.7%) | 0 (0.0%) |
| 75 Years and over | 0 (0.0%) | 0 (0.0%) |
| Total | 39 (59.1%) | 7 (17.9%) |
Employment Status by Educational Attainment in Fort Ripley
According to labor force statistics for Fort Ripley, 97.2% of individuals (35) out of the total population between 25 and 64 years of age (36) are in the labor force, with 20.0% or 7 of them being unemployed. The group with the highest labor force participation rate are those with the educational attainment of less than high school, with 100.0% or 2 individuals in the labor force. Within the labor force, individuals with high school diploma education have the highest percentage of unemployment, with 53.8% or 7 of them being unemployed.
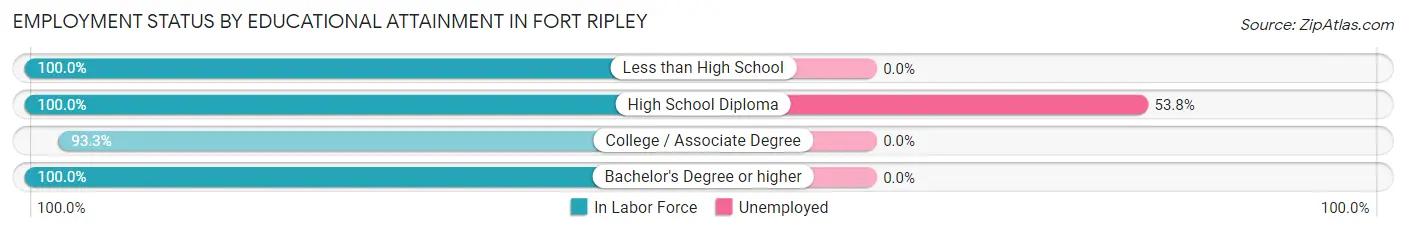
| Educational Attainment | In Labor Force | Unemployed |
| Less than High School | 2 (100.0%) | 0 (0.0%) |
| High School Diploma | 13 (100.0%) | 7 (53.8%) |
| College / Associate Degree | 14 (93.3%) | 0 (0.0%) |
| Bachelor's Degree or higher | 6 (100.0%) | 0 (0.0%) |
| Total | 35 (97.2%) | 7 (20.0%) |
Employment Occupations by Sex in Fort Ripley
Management, Business, Science and Arts Occupations
The most common Management, Business, Science and Arts occupations in Fort Ripley are Community & Social Service (7 | 21.9%), Management (5 | 15.6%), Legal Services & Support (5 | 15.6%), Health Diagnosing & Treating (3 | 9.4%), and Arts, Media & Entertainment (2 | 6.2%).
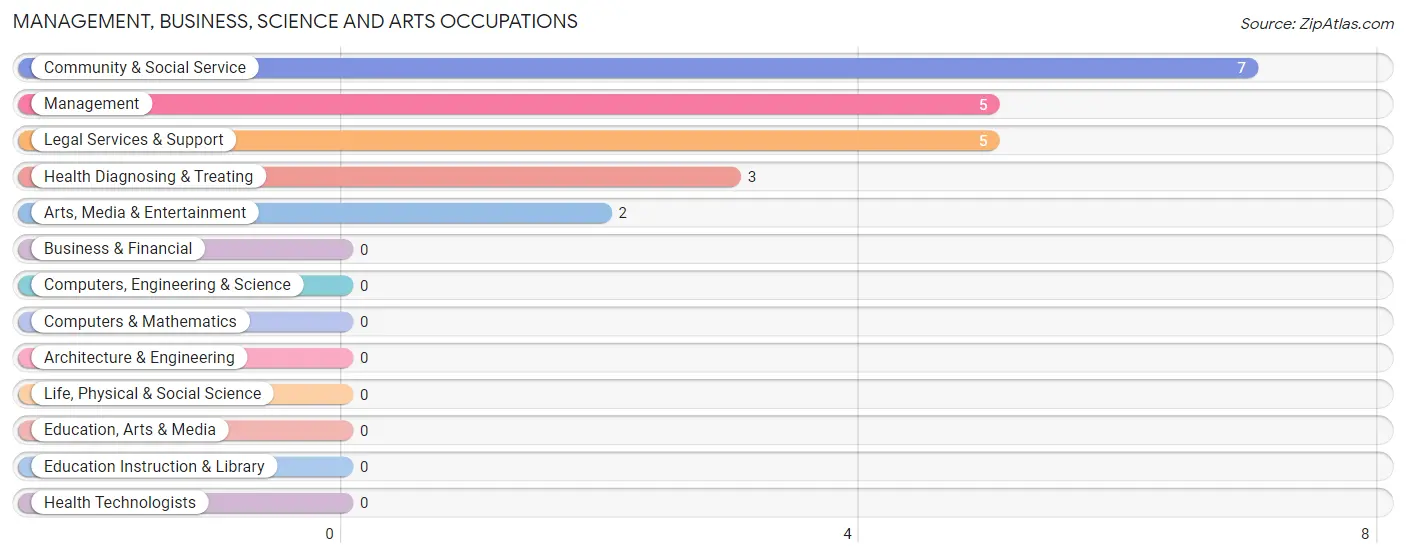
Management, Business, Science and Arts Occupations by Sex
Within the Management, Business, Science and Arts occupations in Fort Ripley, the most male-oriented occupations are Management (100.0%), Legal Services & Support (80.0%), and Community & Social Service (57.1%), while the most female-oriented occupations are Arts, Media & Entertainment (100.0%), Health Diagnosing & Treating (100.0%), and Community & Social Service (42.9%).
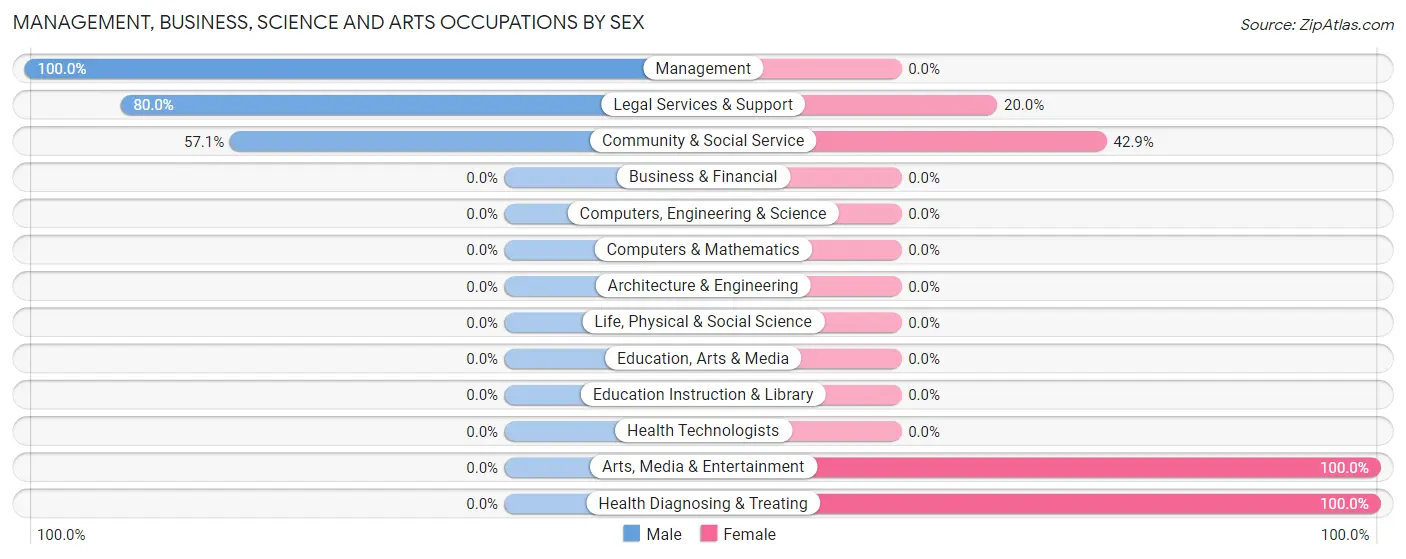
| Occupation | Male | Female |
| Management | 5 (100.0%) | 0 (0.0%) |
| Business & Financial | 0 (0.0%) | 0 (0.0%) |
| Computers, Engineering & Science | 0 (0.0%) | 0 (0.0%) |
| Computers & Mathematics | 0 (0.0%) | 0 (0.0%) |
| Architecture & Engineering | 0 (0.0%) | 0 (0.0%) |
| Life, Physical & Social Science | 0 (0.0%) | 0 (0.0%) |
| Community & Social Service | 4 (57.1%) | 3 (42.9%) |
| Education, Arts & Media | 0 (0.0%) | 0 (0.0%) |
| Legal Services & Support | 4 (80.0%) | 1 (20.0%) |
| Education Instruction & Library | 0 (0.0%) | 0 (0.0%) |
| Arts, Media & Entertainment | 0 (0.0%) | 2 (100.0%) |
| Health Diagnosing & Treating | 0 (0.0%) | 3 (100.0%) |
| Health Technologists | 0 (0.0%) | 0 (0.0%) |
| Total (Category) | 9 (60.0%) | 6 (40.0%) |
| Total (Overall) | 18 (56.2%) | 14 (43.8%) |
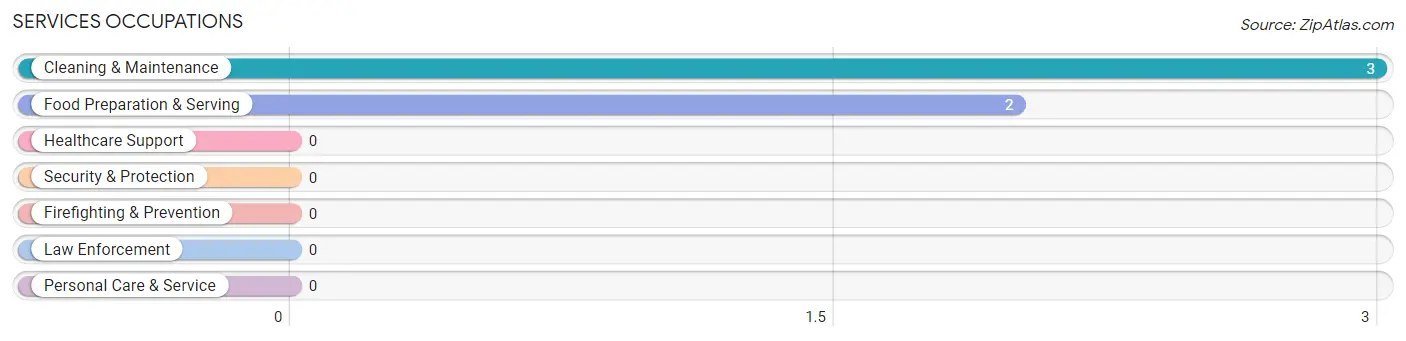
Services Occupations
The most common Services occupations in Fort Ripley are Cleaning & Maintenance (3 | 9.4%), and Food Preparation & Serving (2 | 6.2%).
Services Occupations by Sex
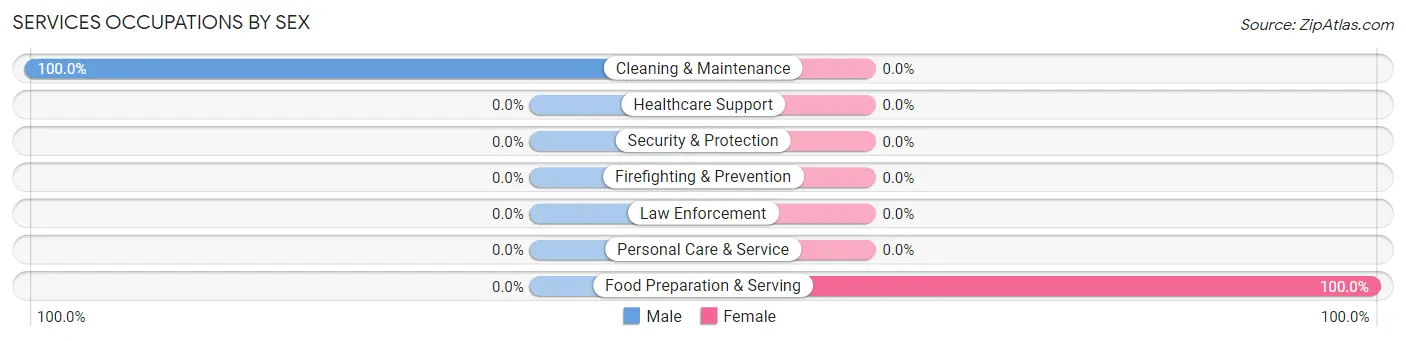
| Occupation | Male | Female |
| Healthcare Support | 0 (0.0%) | 0 (0.0%) |
| Security & Protection | 0 (0.0%) | 0 (0.0%) |
| Firefighting & Prevention | 0 (0.0%) | 0 (0.0%) |
| Law Enforcement | 0 (0.0%) | 0 (0.0%) |
| Food Preparation & Serving | 0 (0.0%) | 2 (100.0%) |
| Cleaning & Maintenance | 3 (100.0%) | 0 (0.0%) |
| Personal Care & Service | 0 (0.0%) | 0 (0.0%) |
| Total (Category) | 3 (60.0%) | 2 (40.0%) |
| Total (Overall) | 18 (56.2%) | 14 (43.8%) |
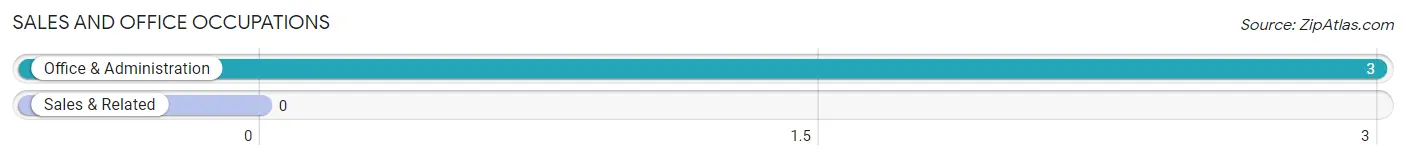
Sales and Office Occupations
The most common Sales and Office occupations in Fort Ripley are , and Office & Administration (3 | 9.4%).
Sales and Office Occupations by Sex
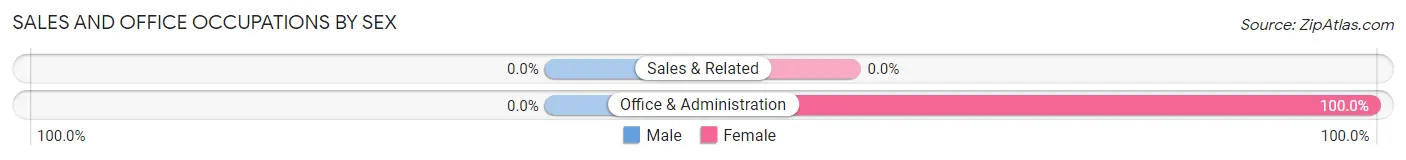
| Occupation | Male | Female |
| Sales & Related | 0 (0.0%) | 0 (0.0%) |
| Office & Administration | 0 (0.0%) | 3 (100.0%) |
| Total (Category) | 0 (0.0%) | 3 (100.0%) |
| Total (Overall) | 18 (56.2%) | 14 (43.8%) |
Natural Resources, Construction and Maintenance Occupations
The most common Natural Resources, Construction and Maintenance occupations in Fort Ripley are , and Installation, Maintenance & Repair (5 | 15.6%).
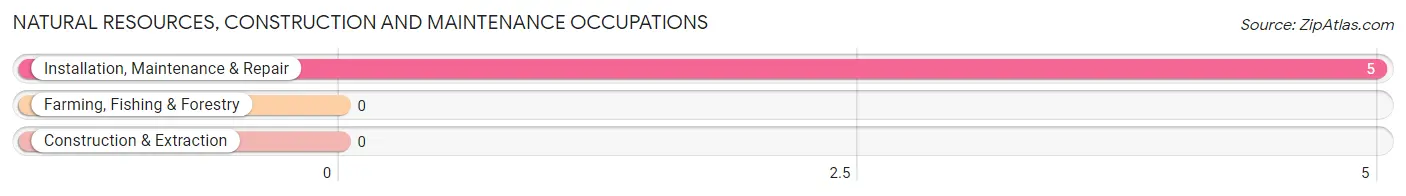
Natural Resources, Construction and Maintenance Occupations by Sex
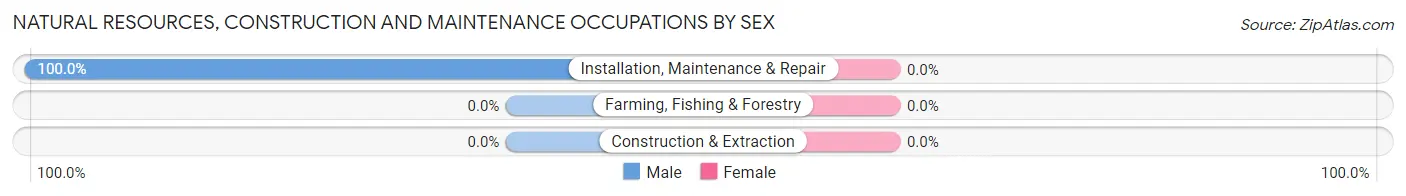
| Occupation | Male | Female |
| Farming, Fishing & Forestry | 0 (0.0%) | 0 (0.0%) |
| Construction & Extraction | 0 (0.0%) | 0 (0.0%) |
| Installation, Maintenance & Repair | 5 (100.0%) | 0 (0.0%) |
| Total (Category) | 5 (100.0%) | 0 (0.0%) |
| Total (Overall) | 18 (56.2%) | 14 (43.8%) |
Production, Transportation and Moving Occupations
The most common Production, Transportation and Moving occupations in Fort Ripley are Production (2 | 6.2%), Transportation (1 | 3.1%), and Material Moving (1 | 3.1%).
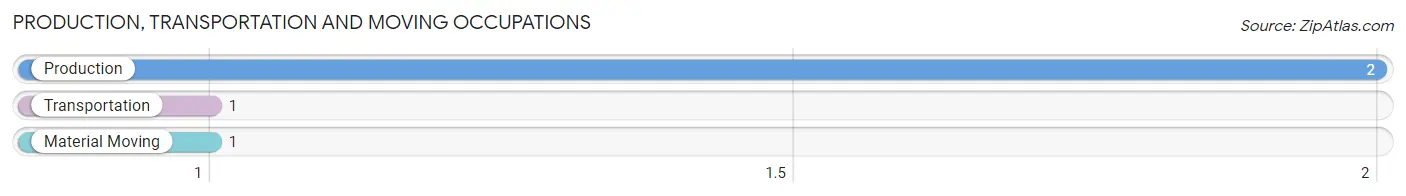
Production, Transportation and Moving Occupations by Sex
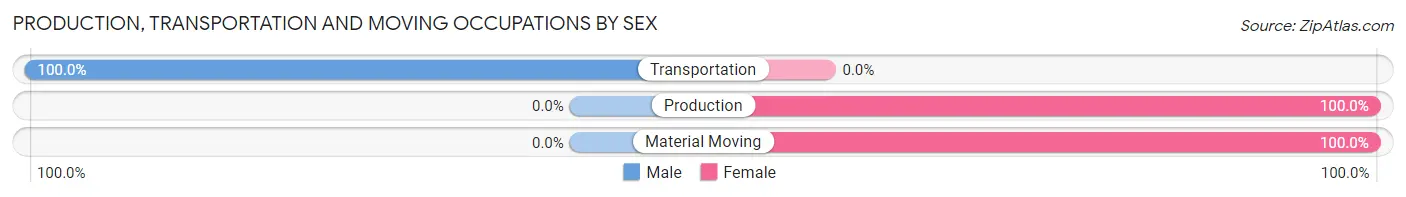
| Occupation | Male | Female |
| Production | 0 (0.0%) | 2 (100.0%) |
| Transportation | 1 (100.0%) | 0 (0.0%) |
| Material Moving | 0 (0.0%) | 1 (100.0%) |
| Total (Category) | 1 (25.0%) | 3 (75.0%) |
| Total (Overall) | 18 (56.2%) | 14 (43.8%) |
Employment Industries by Sex in Fort Ripley
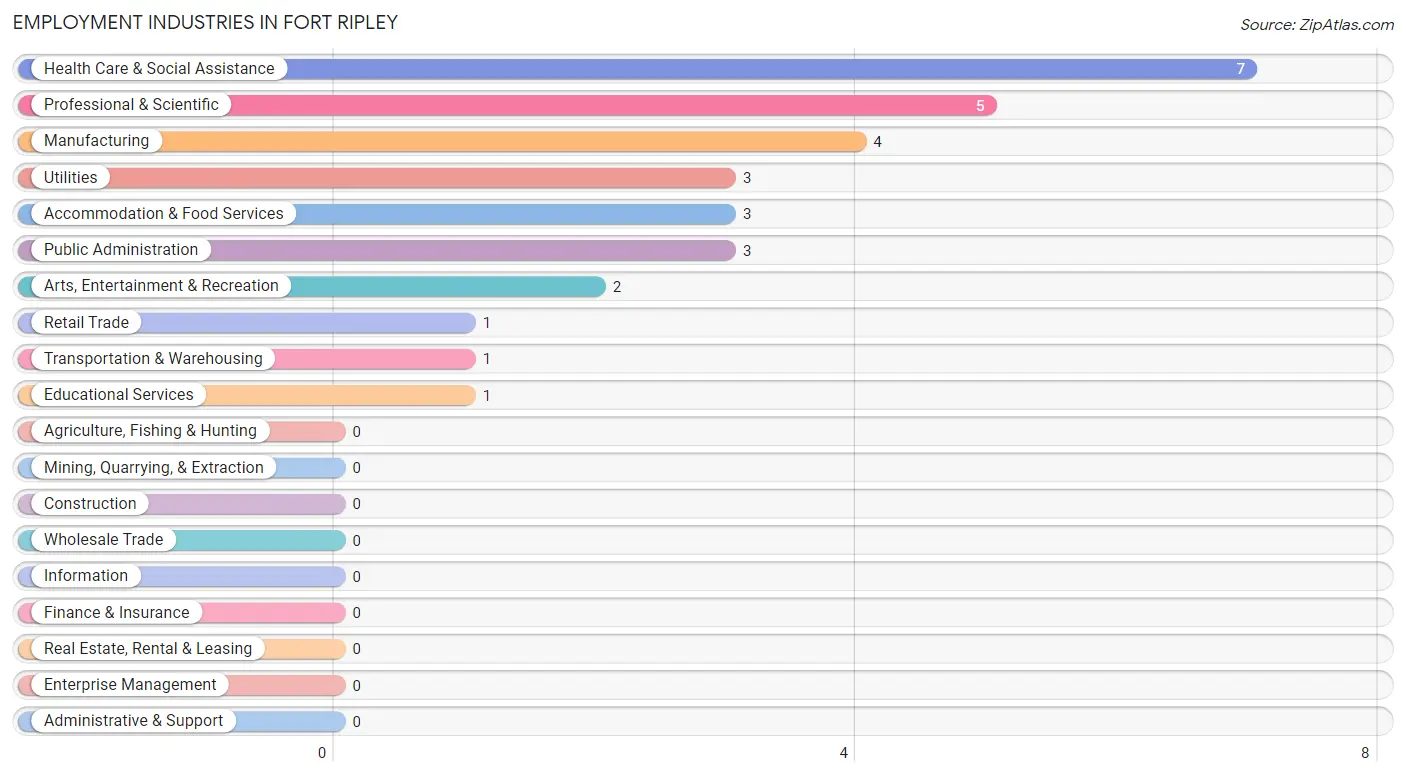
Employment Industries in Fort Ripley
The major employment industries in Fort Ripley include Health Care & Social Assistance (7 | 21.9%), Professional & Scientific (5 | 15.6%), Manufacturing (4 | 12.5%), Utilities (3 | 9.4%), and Accommodation & Food Services (3 | 9.4%).
Employment Industries by Sex in Fort Ripley
The Fort Ripley industries that see more men than women are Transportation & Warehousing (100.0%), Utilities (100.0%), and Accommodation & Food Services (100.0%), whereas the industries that tend to have a higher number of women are Retail Trade (100.0%), Educational Services (100.0%), and Health Care & Social Assistance (100.0%).
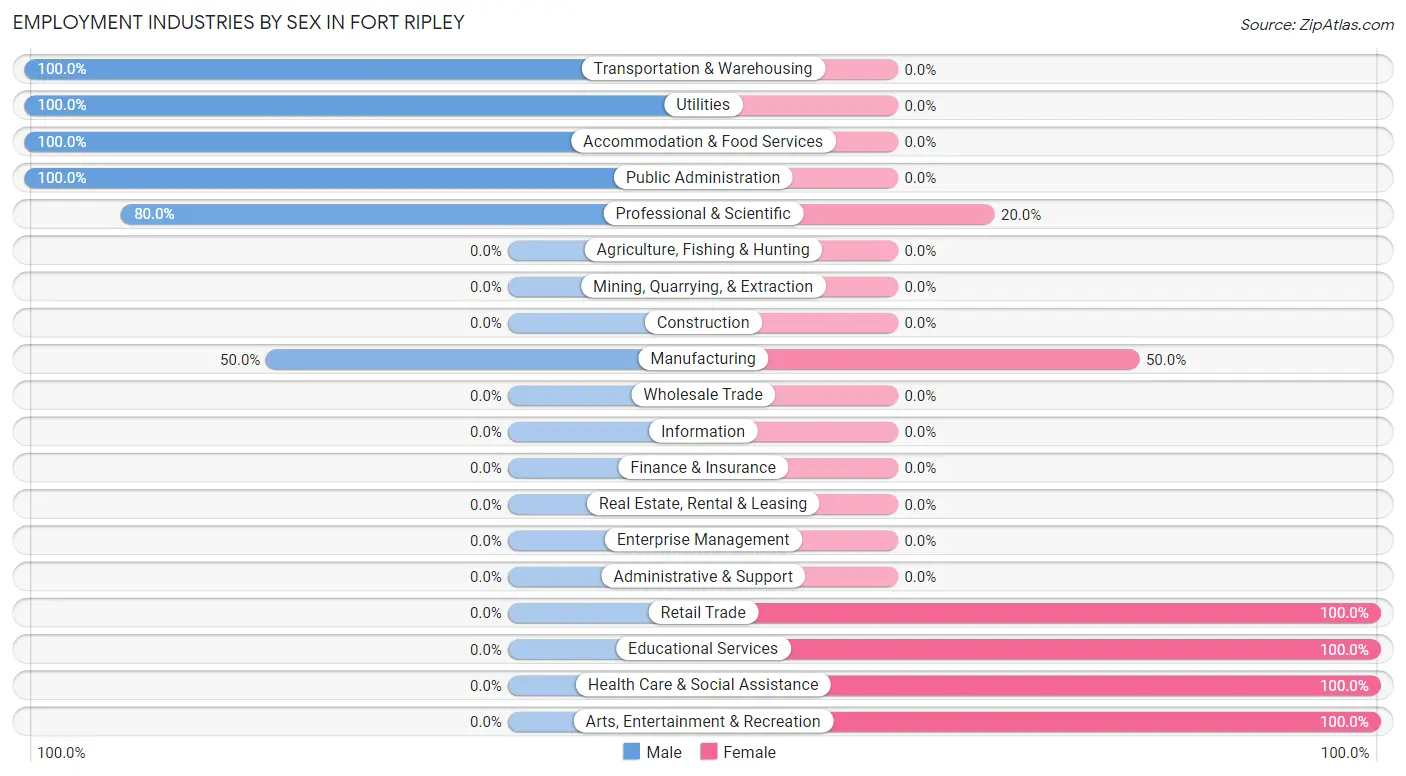
| Industry | Male | Female |
| Agriculture, Fishing & Hunting | 0 (0.0%) | 0 (0.0%) |
| Mining, Quarrying, & Extraction | 0 (0.0%) | 0 (0.0%) |
| Construction | 0 (0.0%) | 0 (0.0%) |
| Manufacturing | 2 (50.0%) | 2 (50.0%) |
| Wholesale Trade | 0 (0.0%) | 0 (0.0%) |
| Retail Trade | 0 (0.0%) | 1 (100.0%) |
| Transportation & Warehousing | 1 (100.0%) | 0 (0.0%) |
| Utilities | 3 (100.0%) | 0 (0.0%) |
| Information | 0 (0.0%) | 0 (0.0%) |
| Finance & Insurance | 0 (0.0%) | 0 (0.0%) |
| Real Estate, Rental & Leasing | 0 (0.0%) | 0 (0.0%) |
| Professional & Scientific | 4 (80.0%) | 1 (20.0%) |
| Enterprise Management | 0 (0.0%) | 0 (0.0%) |
| Administrative & Support | 0 (0.0%) | 0 (0.0%) |
| Educational Services | 0 (0.0%) | 1 (100.0%) |
| Health Care & Social Assistance | 0 (0.0%) | 7 (100.0%) |
| Arts, Entertainment & Recreation | 0 (0.0%) | 2 (100.0%) |
| Accommodation & Food Services | 3 (100.0%) | 0 (0.0%) |
| Public Administration | 3 (100.0%) | 0 (0.0%) |
| Total | 18 (56.2%) | 14 (43.8%) |
Education in Fort Ripley
School Enrollment in Fort Ripley
The most common levels of schooling among the 15 students in Fort Ripley are kindergarten (6 | 40.0%), elementary school (3 | 20.0%), and middle school (3 | 20.0%).
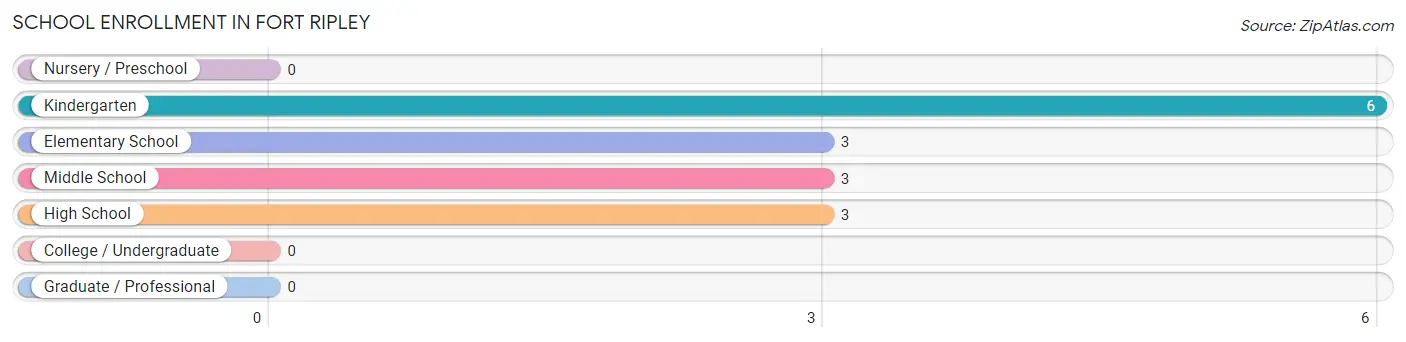
| School Level | # Students | % Students |
| Nursery / Preschool | 0 | 0.0% |
| Kindergarten | 6 | 40.0% |
| Elementary School | 3 | 20.0% |
| Middle School | 3 | 20.0% |
| High School | 3 | 20.0% |
| College / Undergraduate | 0 | 0.0% |
| Graduate / Professional | 0 | 0.0% |
| Total | 15 | 100.0% |
School Enrollment by Age by Funding Source in Fort Ripley
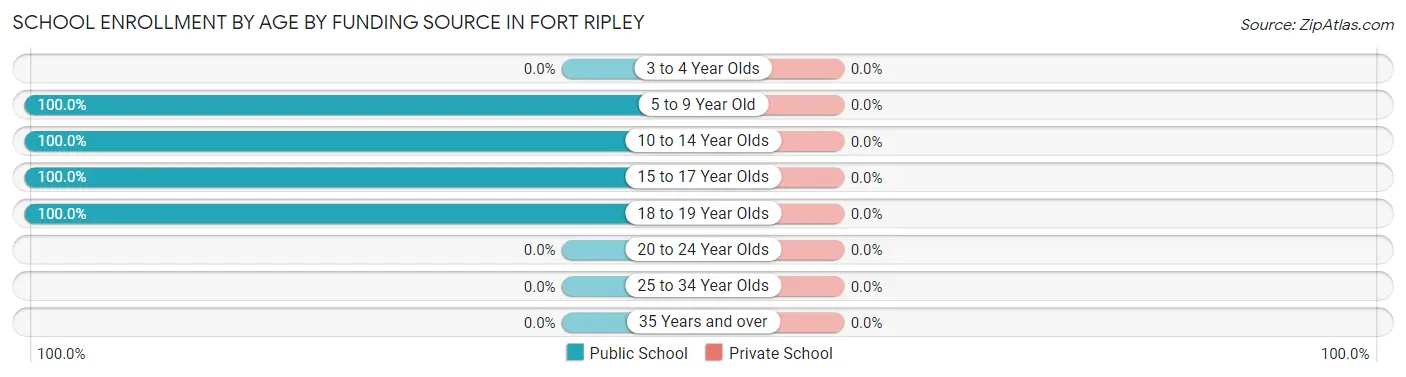
| Age Bracket | Public School | Private School |
| 3 to 4 Year Olds | 0 (0.0%) | 0 (0.0%) |
| 5 to 9 Year Old | 9 (100.0%) | 0 (0.0%) |
| 10 to 14 Year Olds | 3 (100.0%) | 0 (0.0%) |
| 15 to 17 Year Olds | 2 (100.0%) | 0 (0.0%) |
| 18 to 19 Year Olds | 1 (100.0%) | 0 (0.0%) |
| 20 to 24 Year Olds | 0 (0.0%) | 0 (0.0%) |
| 25 to 34 Year Olds | 0 (0.0%) | 0 (0.0%) |
| 35 Years and over | 0 (0.0%) | 0 (0.0%) |
| Total | 15 (100.0%) | 0 (0.0%) |
Educational Attainment by Field of Study in Fort Ripley
Social sciences (4 | 57.1%), business (1 | 14.3%), education (1 | 14.3%), and arts & humanities (1 | 14.3%) are the most common fields of study among 7 individuals in Fort Ripley who have obtained a bachelor's degree or higher.
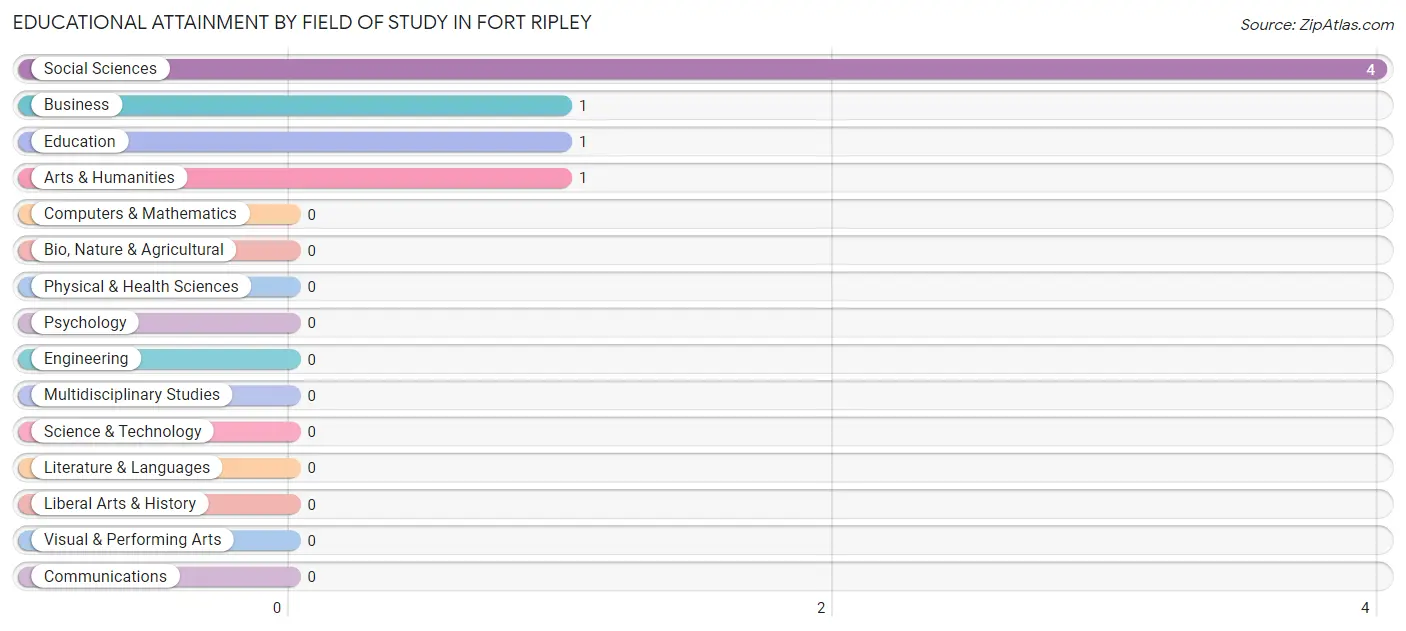
| Field of Study | # Graduates | % Graduates |
| Computers & Mathematics | 0 | 0.0% |
| Bio, Nature & Agricultural | 0 | 0.0% |
| Physical & Health Sciences | 0 | 0.0% |
| Psychology | 0 | 0.0% |
| Social Sciences | 4 | 57.1% |
| Engineering | 0 | 0.0% |
| Multidisciplinary Studies | 0 | 0.0% |
| Science & Technology | 0 | 0.0% |
| Business | 1 | 14.3% |
| Education | 1 | 14.3% |
| Literature & Languages | 0 | 0.0% |
| Liberal Arts & History | 0 | 0.0% |
| Visual & Performing Arts | 0 | 0.0% |
| Communications | 0 | 0.0% |
| Arts & Humanities | 1 | 14.3% |
| Total | 7 | 100.0% |
Transportation & Commute in Fort Ripley
Vehicle Availability by Sex in Fort Ripley
The most prevalent vehicle ownership categories in Fort Ripley are males with 3 vehicles (11, accounting for 61.1%) and females with 3 vehicles (8, making up 78.6%).
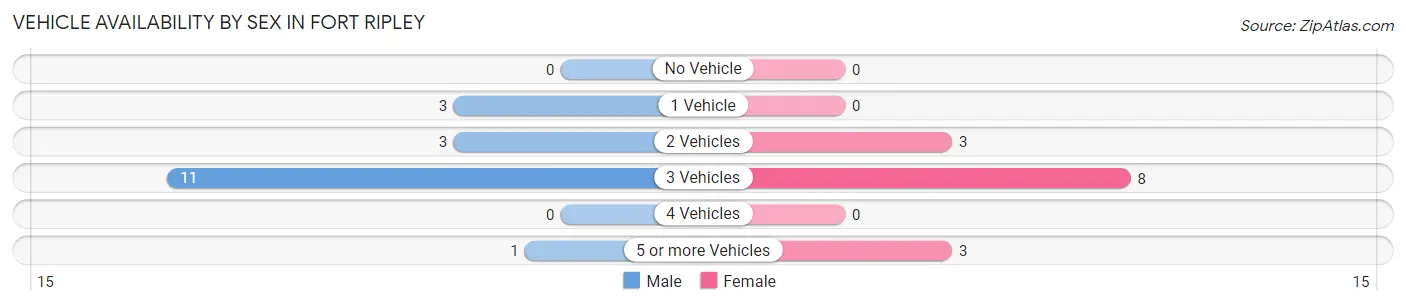
| Vehicles Available | Male | Female |
| No Vehicle | 0 (0.0%) | 0 (0.0%) |
| 1 Vehicle | 3 (16.7%) | 0 (0.0%) |
| 2 Vehicles | 3 (16.7%) | 3 (21.4%) |
| 3 Vehicles | 11 (61.1%) | 8 (57.1%) |
| 4 Vehicles | 0 (0.0%) | 0 (0.0%) |
| 5 or more Vehicles | 1 (5.6%) | 3 (21.4%) |
| Total | 18 (100.0%) | 14 (100.0%) |
Commute Time in Fort Ripley
The most frequently occuring commute durations in Fort Ripley are 15 to 19 minutes (8 commuters, 25.0%), 20 to 24 minutes (7 commuters, 21.9%), and 35 to 39 minutes (4 commuters, 12.5%).
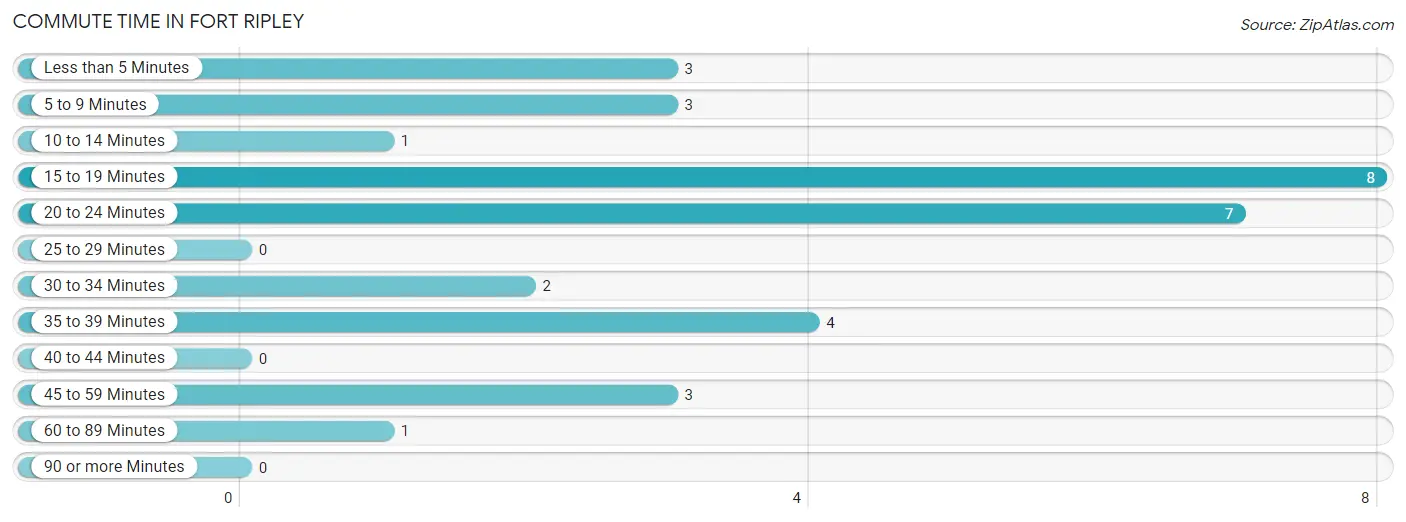
| Commute Time | # Commuters | % Commuters |
| Less than 5 Minutes | 3 | 9.4% |
| 5 to 9 Minutes | 3 | 9.4% |
| 10 to 14 Minutes | 1 | 3.1% |
| 15 to 19 Minutes | 8 | 25.0% |
| 20 to 24 Minutes | 7 | 21.9% |
| 25 to 29 Minutes | 0 | 0.0% |
| 30 to 34 Minutes | 2 | 6.2% |
| 35 to 39 Minutes | 4 | 12.5% |
| 40 to 44 Minutes | 0 | 0.0% |
| 45 to 59 Minutes | 3 | 9.4% |
| 60 to 89 Minutes | 1 | 3.1% |
| 90 or more Minutes | 0 | 0.0% |
Commute Time by Sex in Fort Ripley
The most common commute times in Fort Ripley are 20 to 24 minutes (5 commuters, 27.8%) for males and 15 to 19 minutes (4 commuters, 28.6%) for females.
| Commute Time | Male | Female |
| Less than 5 Minutes | 3 (16.7%) | 0 (0.0%) |
| 5 to 9 Minutes | 3 (16.7%) | 0 (0.0%) |
| 10 to 14 Minutes | 1 (5.6%) | 0 (0.0%) |
| 15 to 19 Minutes | 4 (22.2%) | 4 (28.6%) |
| 20 to 24 Minutes | 5 (27.8%) | 2 (14.3%) |
| 25 to 29 Minutes | 0 (0.0%) | 0 (0.0%) |
| 30 to 34 Minutes | 0 (0.0%) | 2 (14.3%) |
| 35 to 39 Minutes | 2 (11.1%) | 2 (14.3%) |
| 40 to 44 Minutes | 0 (0.0%) | 0 (0.0%) |
| 45 to 59 Minutes | 0 (0.0%) | 3 (21.4%) |
| 60 to 89 Minutes | 0 (0.0%) | 1 (7.1%) |
| 90 or more Minutes | 0 (0.0%) | 0 (0.0%) |
Time of Departure to Work by Sex in Fort Ripley
The most frequent times of departure to work in Fort Ripley are 5:00 AM to 5:29 AM (4, 22.2%) for males and 7:00 AM to 7:29 AM (5, 35.7%) for females.
| Time of Departure | Male | Female |
| 12:00 AM to 4:59 AM | 0 (0.0%) | 2 (14.3%) |
| 5:00 AM to 5:29 AM | 4 (22.2%) | 0 (0.0%) |
| 5:30 AM to 5:59 AM | 0 (0.0%) | 0 (0.0%) |
| 6:00 AM to 6:29 AM | 0 (0.0%) | 0 (0.0%) |
| 6:30 AM to 6:59 AM | 4 (22.2%) | 2 (14.3%) |
| 7:00 AM to 7:29 AM | 0 (0.0%) | 5 (35.7%) |
| 7:30 AM to 7:59 AM | 3 (16.7%) | 5 (35.7%) |
| 8:00 AM to 8:29 AM | 4 (22.2%) | 0 (0.0%) |
| 8:30 AM to 8:59 AM | 0 (0.0%) | 0 (0.0%) |
| 9:00 AM to 9:59 AM | 0 (0.0%) | 0 (0.0%) |
| 10:00 AM to 10:59 AM | 0 (0.0%) | 0 (0.0%) |
| 11:00 AM to 11:59 AM | 0 (0.0%) | 0 (0.0%) |
| 12:00 PM to 3:59 PM | 0 (0.0%) | 0 (0.0%) |
| 4:00 PM to 11:59 PM | 3 (16.7%) | 0 (0.0%) |
| Total | 18 (100.0%) | 14 (100.0%) |
Housing Occupancy in Fort Ripley
Occupancy by Ownership in Fort Ripley
Of the total 33 dwellings in Fort Ripley, owner-occupied units account for 30 (90.9%), while renter-occupied units make up 3 (9.1%).
| Occupancy | # Housing Units | % Housing Units |
| Owner Occupied Housing Units | 30 | 90.9% |
| Renter-Occupied Housing Units | 3 | 9.1% |
| Total Occupied Housing Units | 33 | 100.0% |
Occupancy by Household Size in Fort Ripley
| Household Size | # Housing Units | % Housing Units |
| 1-Person Household | 9 | 27.3% |
| 2-Person Household | 18 | 54.5% |
| 3-Person Household | 0 | 0.0% |
| 4+ Person Household | 6 | 18.2% |
| Total Housing Units | 33 | 100.0% |
Occupancy by Ownership by Household Size in Fort Ripley
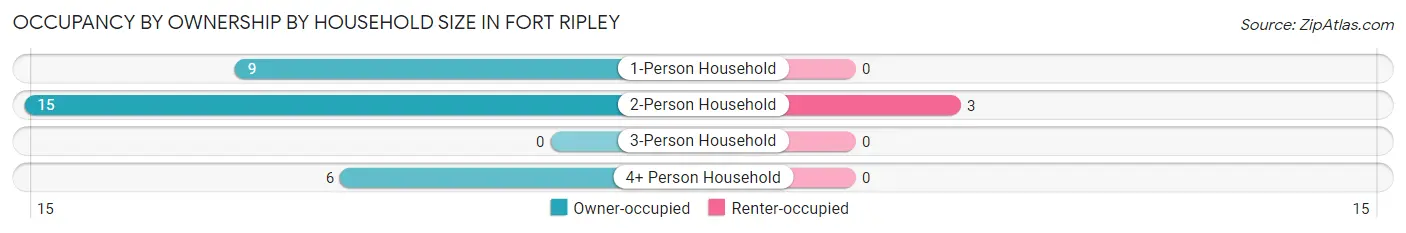
| Household Size | Owner-occupied | Renter-occupied |
| 1-Person Household | 9 (100.0%) | 0 (0.0%) |
| 2-Person Household | 15 (83.3%) | 3 (16.7%) |
| 3-Person Household | 0 (0.0%) | 0 (0.0%) |
| 4+ Person Household | 6 (100.0%) | 0 (0.0%) |
| Total Housing Units | 30 (90.9%) | 3 (9.1%) |
Occupancy by Educational Attainment in Fort Ripley
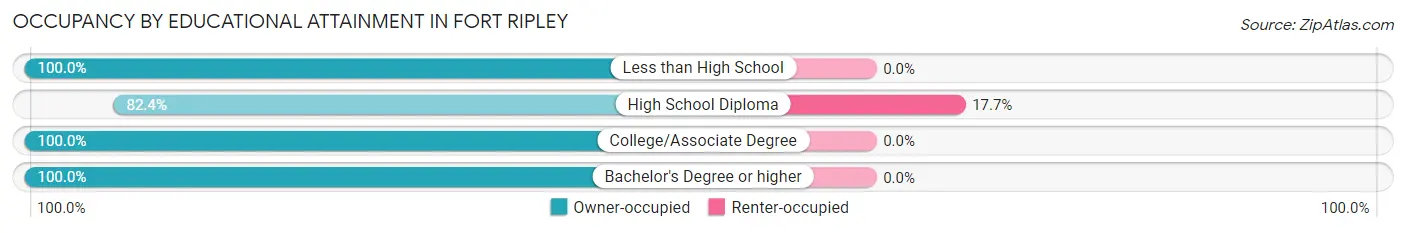
| Household Size | Owner-occupied | Renter-occupied |
| Less than High School | 3 (100.0%) | 0 (0.0%) |
| High School Diploma | 14 (82.4%) | 3 (17.6%) |
| College/Associate Degree | 12 (100.0%) | 0 (0.0%) |
| Bachelor's Degree or higher | 1 (100.0%) | 0 (0.0%) |
Occupancy by Age of Householder in Fort Ripley
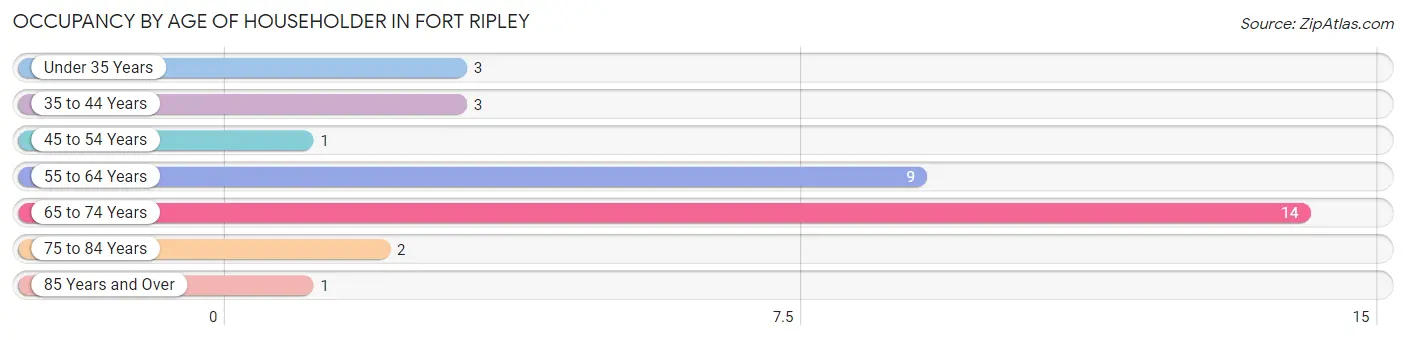
| Age Bracket | # Households | % Households |
| Under 35 Years | 3 | 9.1% |
| 35 to 44 Years | 3 | 9.1% |
| 45 to 54 Years | 1 | 3.0% |
| 55 to 64 Years | 9 | 27.3% |
| 65 to 74 Years | 14 | 42.4% |
| 75 to 84 Years | 2 | 6.1% |
| 85 Years and Over | 1 | 3.0% |
| Total | 33 | 100.0% |
Housing Finances in Fort Ripley
Median Income by Occupancy in Fort Ripley
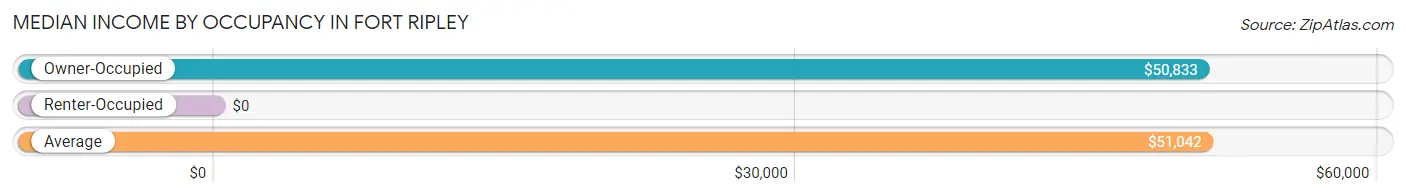
| Occupancy Type | # Households | Median Income |
| Owner-Occupied | 30 (90.9%) | $50,833 |
| Renter-Occupied | 3 (9.1%) | $0 |
| Average | 33 (100.0%) | $51,042 |
Occupancy by Householder Income Bracket in Fort Ripley
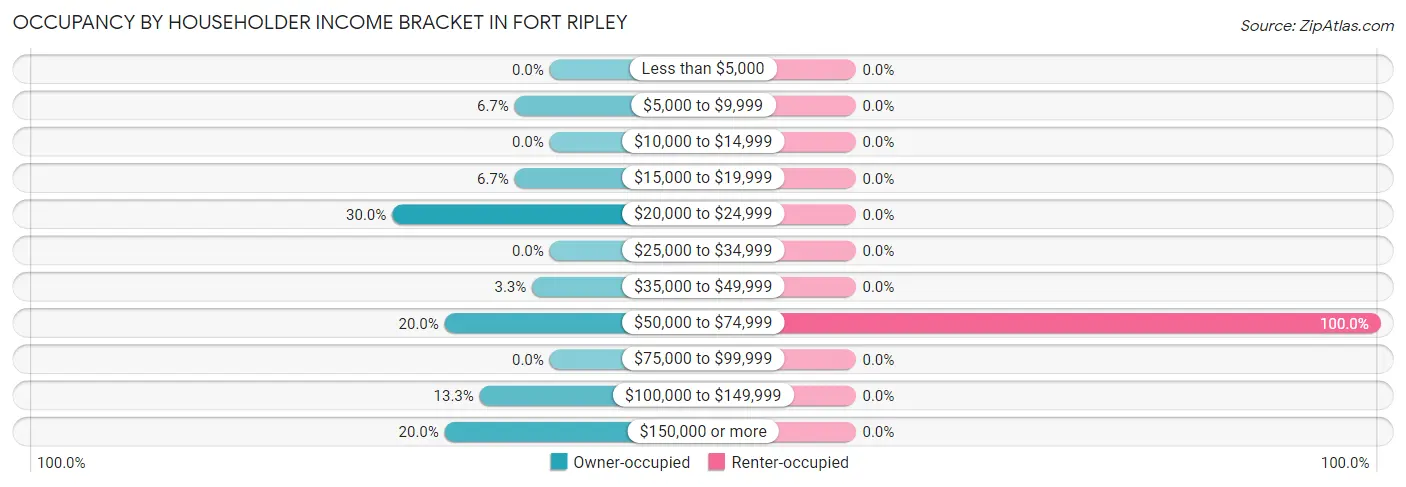
| Income Bracket | Owner-occupied | Renter-occupied |
| Less than $5,000 | 0 (0.0%) | 0 (0.0%) |
| $5,000 to $9,999 | 2 (6.7%) | 0 (0.0%) |
| $10,000 to $14,999 | 0 (0.0%) | 0 (0.0%) |
| $15,000 to $19,999 | 2 (6.7%) | 0 (0.0%) |
| $20,000 to $24,999 | 9 (30.0%) | 0 (0.0%) |
| $25,000 to $34,999 | 0 (0.0%) | 0 (0.0%) |
| $35,000 to $49,999 | 1 (3.3%) | 0 (0.0%) |
| $50,000 to $74,999 | 6 (20.0%) | 3 (100.0%) |
| $75,000 to $99,999 | 0 (0.0%) | 0 (0.0%) |
| $100,000 to $149,999 | 4 (13.3%) | 0 (0.0%) |
| $150,000 or more | 6 (20.0%) | 0 (0.0%) |
| Total | 30 (100.0%) | 3 (100.0%) |
Monthly Housing Cost Tiers in Fort Ripley
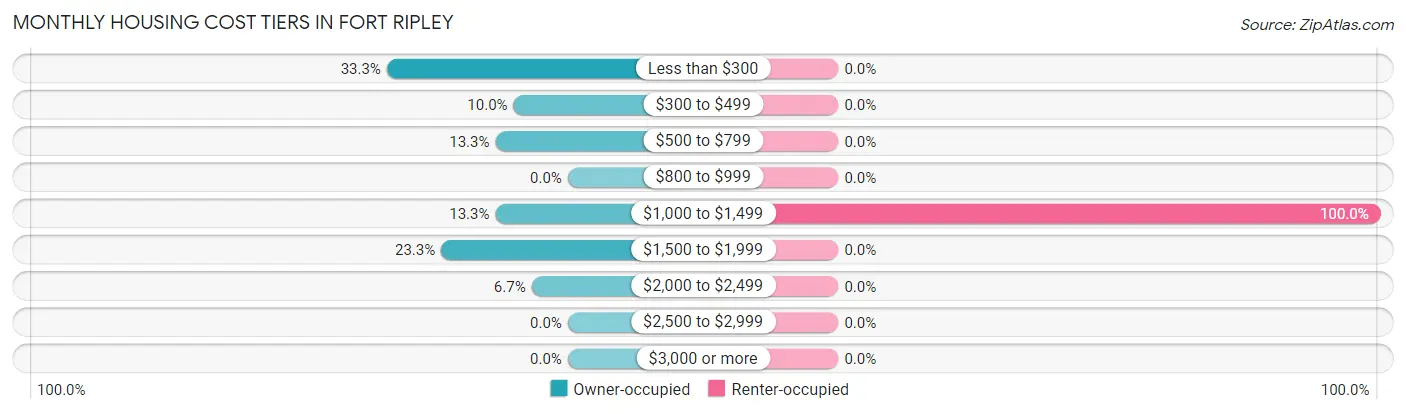
| Monthly Cost | Owner-occupied | Renter-occupied |
| Less than $300 | 10 (33.3%) | 0 (0.0%) |
| $300 to $499 | 3 (10.0%) | 0 (0.0%) |
| $500 to $799 | 4 (13.3%) | 0 (0.0%) |
| $800 to $999 | 0 (0.0%) | 0 (0.0%) |
| $1,000 to $1,499 | 4 (13.3%) | 3 (100.0%) |
| $1,500 to $1,999 | 7 (23.3%) | 0 (0.0%) |
| $2,000 to $2,499 | 2 (6.7%) | 0 (0.0%) |
| $2,500 to $2,999 | 0 (0.0%) | 0 (0.0%) |
| $3,000 or more | 0 (0.0%) | 0 (0.0%) |
| Total | 30 (100.0%) | 3 (100.0%) |
Physical Housing Characteristics in Fort Ripley
Housing Structures in Fort Ripley
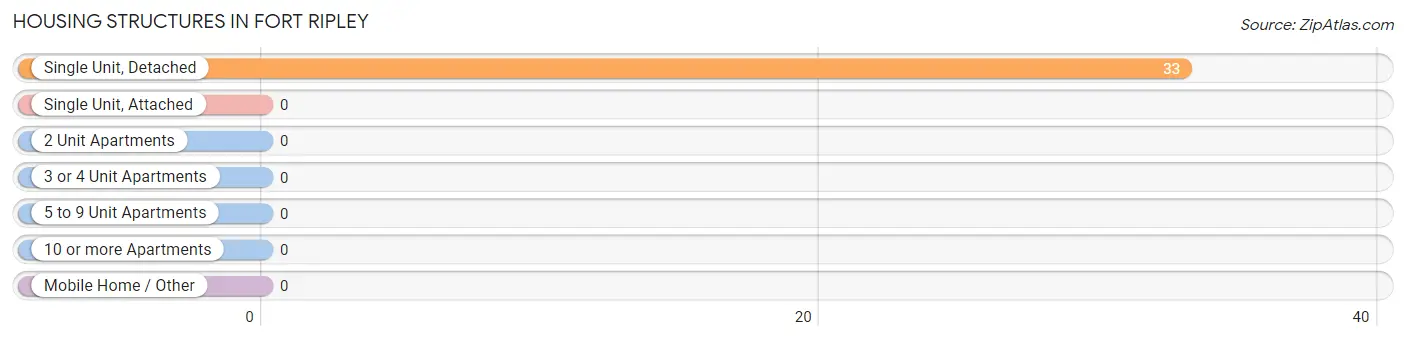
| Structure Type | # Housing Units | % Housing Units |
| Single Unit, Detached | 33 | 100.0% |
| Single Unit, Attached | 0 | 0.0% |
| 2 Unit Apartments | 0 | 0.0% |
| 3 or 4 Unit Apartments | 0 | 0.0% |
| 5 to 9 Unit Apartments | 0 | 0.0% |
| 10 or more Apartments | 0 | 0.0% |
| Mobile Home / Other | 0 | 0.0% |
| Total | 33 | 100.0% |
Housing Structures by Occupancy in Fort Ripley
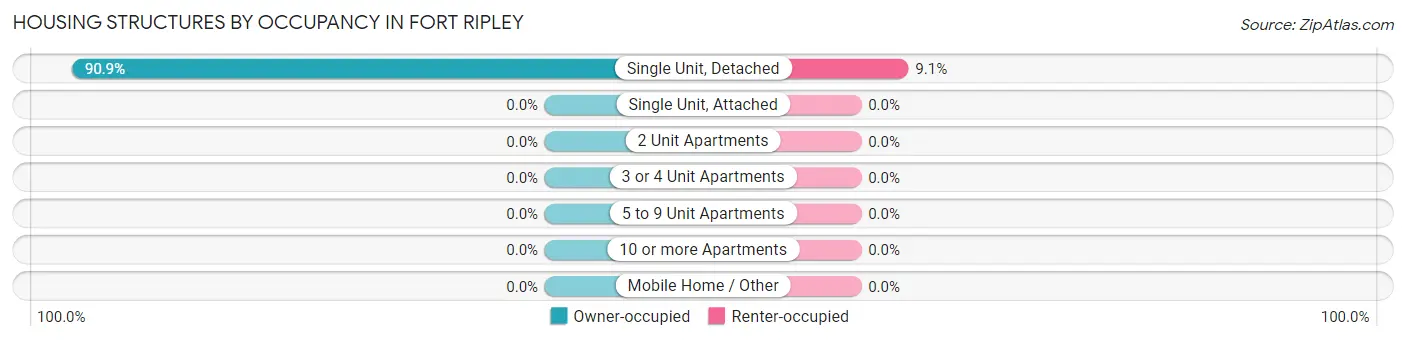
| Structure Type | Owner-occupied | Renter-occupied |
| Single Unit, Detached | 30 (90.9%) | 3 (9.1%) |
| Single Unit, Attached | 0 (0.0%) | 0 (0.0%) |
| 2 Unit Apartments | 0 (0.0%) | 0 (0.0%) |
| 3 or 4 Unit Apartments | 0 (0.0%) | 0 (0.0%) |
| 5 to 9 Unit Apartments | 0 (0.0%) | 0 (0.0%) |
| 10 or more Apartments | 0 (0.0%) | 0 (0.0%) |
| Mobile Home / Other | 0 (0.0%) | 0 (0.0%) |
| Total | 30 (90.9%) | 3 (9.1%) |
Housing Structures by Number of Rooms in Fort Ripley
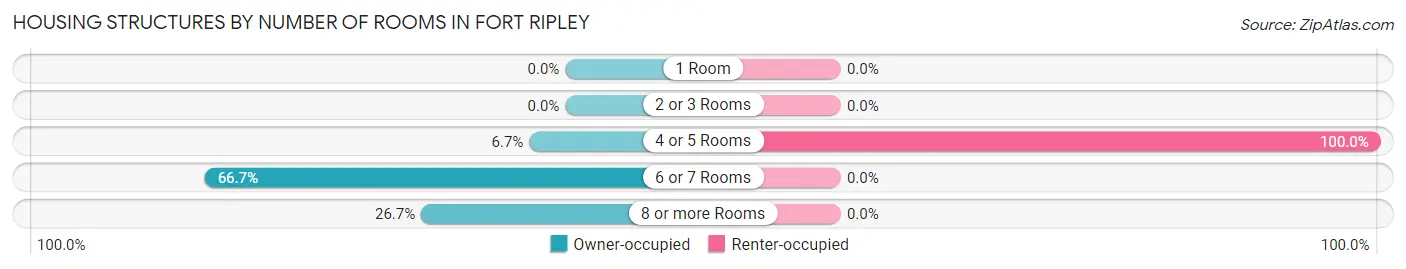
| Number of Rooms | Owner-occupied | Renter-occupied |
| 1 Room | 0 (0.0%) | 0 (0.0%) |
| 2 or 3 Rooms | 0 (0.0%) | 0 (0.0%) |
| 4 or 5 Rooms | 2 (6.7%) | 3 (100.0%) |
| 6 or 7 Rooms | 20 (66.7%) | 0 (0.0%) |
| 8 or more Rooms | 8 (26.7%) | 0 (0.0%) |
| Total | 30 (100.0%) | 3 (100.0%) |
Housing Structure by Heating Type in Fort Ripley
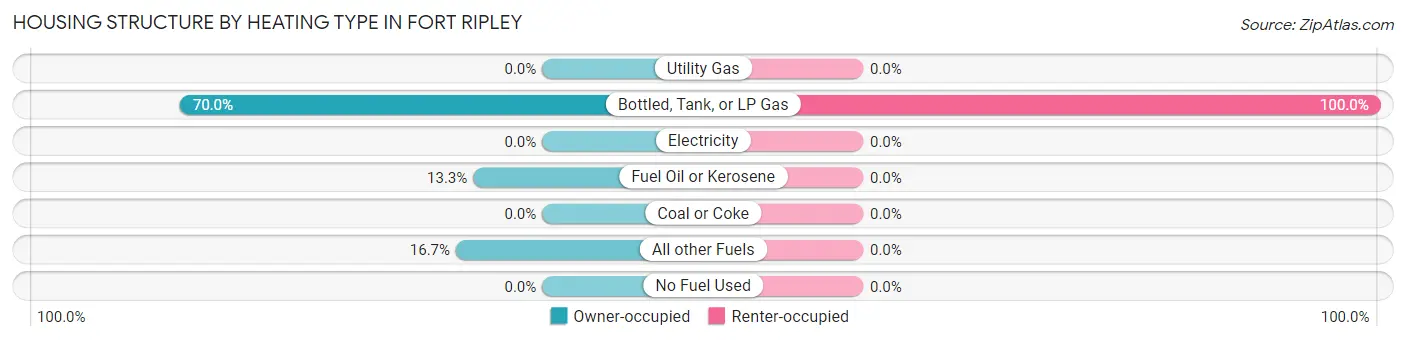
| Heating Type | Owner-occupied | Renter-occupied |
| Utility Gas | 0 (0.0%) | 0 (0.0%) |
| Bottled, Tank, or LP Gas | 21 (70.0%) | 3 (100.0%) |
| Electricity | 0 (0.0%) | 0 (0.0%) |
| Fuel Oil or Kerosene | 4 (13.3%) | 0 (0.0%) |
| Coal or Coke | 0 (0.0%) | 0 (0.0%) |
| All other Fuels | 5 (16.7%) | 0 (0.0%) |
| No Fuel Used | 0 (0.0%) | 0 (0.0%) |
| Total | 30 (100.0%) | 3 (100.0%) |
Household Vehicle Usage in Fort Ripley
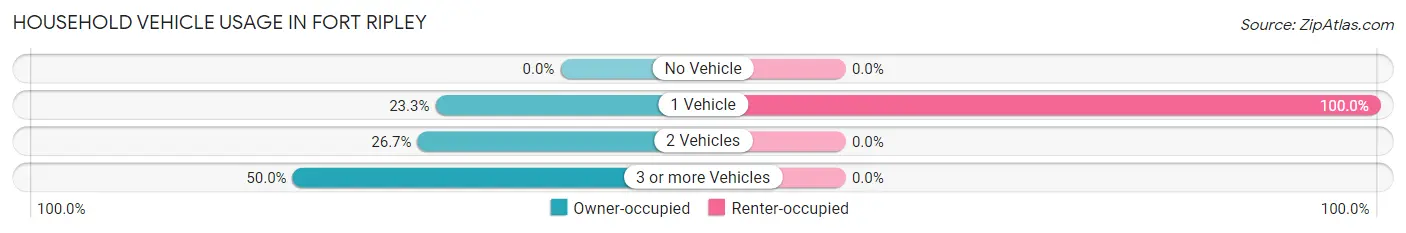
| Vehicles per Household | Owner-occupied | Renter-occupied |
| No Vehicle | 0 (0.0%) | 0 (0.0%) |
| 1 Vehicle | 7 (23.3%) | 3 (100.0%) |
| 2 Vehicles | 8 (26.7%) | 0 (0.0%) |
| 3 or more Vehicles | 15 (50.0%) | 0 (0.0%) |
| Total | 30 (100.0%) | 3 (100.0%) |
Real Estate & Mortgages in Fort Ripley
Real Estate and Mortgage Overview in Fort Ripley
| Characteristic | Without Mortgage | With Mortgage |
| Housing Units | 17 | 13 |
| Median Property Value | $156,300 | $229,200 |
| Median Household Income | $21,607 | $6 |
| Monthly Housing Costs | - | - |
| Real Estate Taxes | - | - |
Property Value by Mortgage Status in Fort Ripley
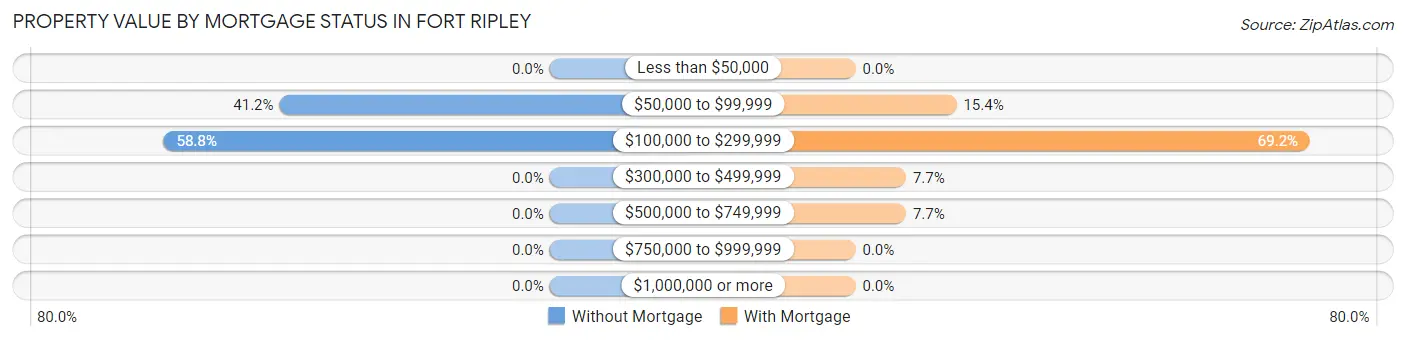
| Property Value | Without Mortgage | With Mortgage |
| Less than $50,000 | 0 (0.0%) | 0 (0.0%) |
| $50,000 to $99,999 | 7 (41.2%) | 2 (15.4%) |
| $100,000 to $299,999 | 10 (58.8%) | 9 (69.2%) |
| $300,000 to $499,999 | 0 (0.0%) | 1 (7.7%) |
| $500,000 to $749,999 | 0 (0.0%) | 1 (7.7%) |
| $750,000 to $999,999 | 0 (0.0%) | 0 (0.0%) |
| $1,000,000 or more | 0 (0.0%) | 0 (0.0%) |
| Total | 17 (100.0%) | 13 (100.0%) |
Household Income by Mortgage Status in Fort Ripley
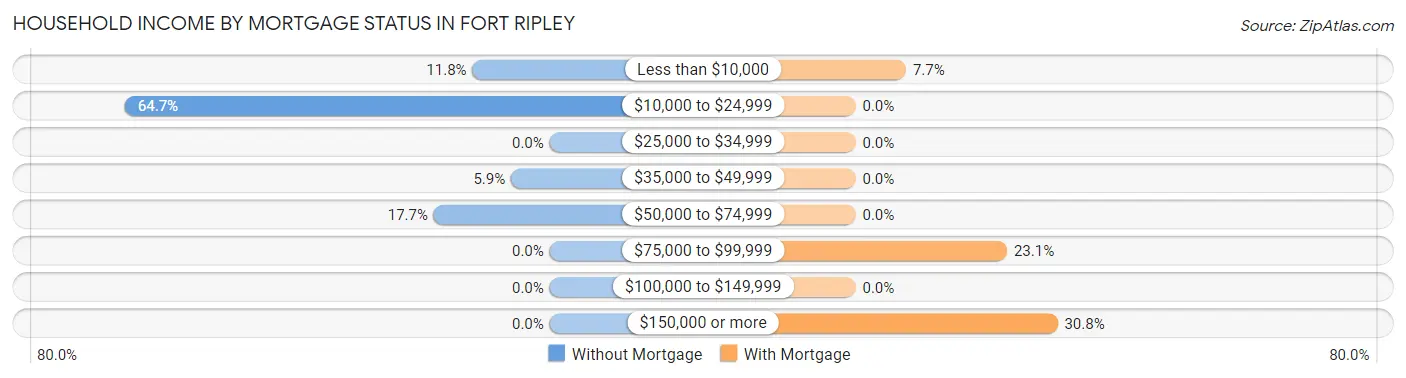
| Household Income | Without Mortgage | With Mortgage |
| Less than $10,000 | 2 (11.8%) | 1 (7.7%) |
| $10,000 to $24,999 | 11 (64.7%) | 0 (0.0%) |
| $25,000 to $34,999 | 0 (0.0%) | 0 (0.0%) |
| $35,000 to $49,999 | 1 (5.9%) | 0 (0.0%) |
| $50,000 to $74,999 | 3 (17.6%) | 0 (0.0%) |
| $75,000 to $99,999 | 0 (0.0%) | 3 (23.1%) |
| $100,000 to $149,999 | 0 (0.0%) | 0 (0.0%) |
| $150,000 or more | 0 (0.0%) | 4 (30.8%) |
| Total | 17 (100.0%) | 13 (100.0%) |
Property Value to Household Income Ratio in Fort Ripley
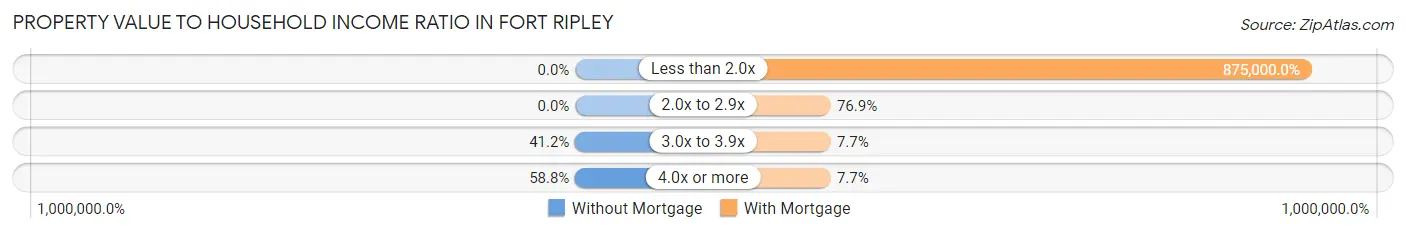
| Value-to-Income Ratio | Without Mortgage | With Mortgage |
| Less than 2.0x | 0 (0.0%) | 113,750 (875,000.0%) |
| 2.0x to 2.9x | 0 (0.0%) | 10 (76.9%) |
| 3.0x to 3.9x | 7 (41.2%) | 1 (7.7%) |
| 4.0x or more | 10 (58.8%) | 1 (7.7%) |
| Total | 17 (100.0%) | 13 (100.0%) |
Real Estate Taxes by Mortgage Status in Fort Ripley
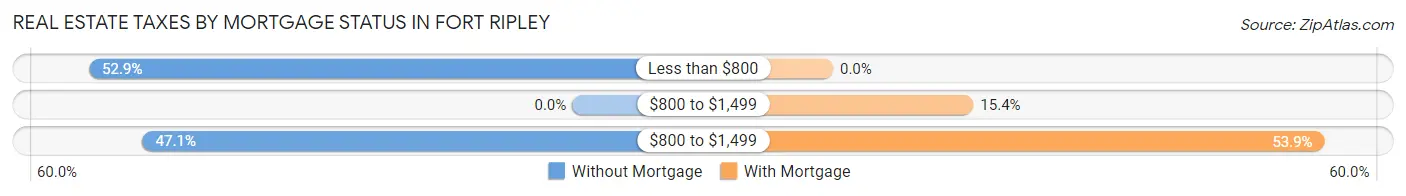
| Property Taxes | Without Mortgage | With Mortgage |
| Less than $800 | 9 (52.9%) | 0 (0.0%) |
| $800 to $1,499 | 0 (0.0%) | 2 (15.4%) |
| $800 to $1,499 | 8 (47.1%) | 7 (53.8%) |
| Total | 17 (100.0%) | 13 (100.0%) |
Health & Disability in Fort Ripley
Health Insurance Coverage by Age in Fort Ripley
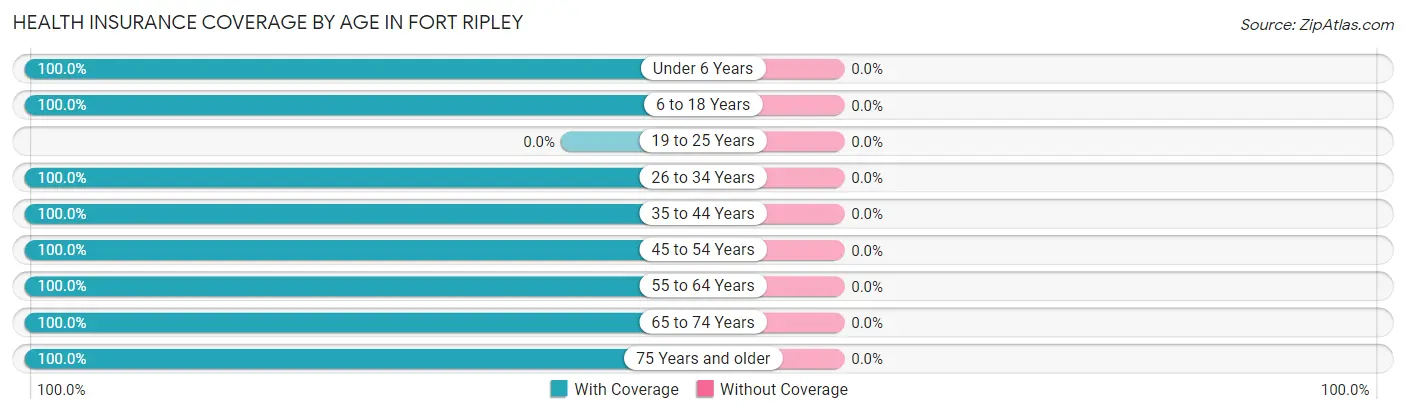
| Age Bracket | With Coverage | Without Coverage |
| Under 6 Years | 11 (100.0%) | 0 (0.0%) |
| 6 to 18 Years | 12 (100.0%) | 0 (0.0%) |
| 19 to 25 Years | 0 (0.0%) | 0 (0.0%) |
| 26 to 34 Years | 6 (100.0%) | 0 (0.0%) |
| 35 to 44 Years | 9 (100.0%) | 0 (0.0%) |
| 45 to 54 Years | 10 (100.0%) | 0 (0.0%) |
| 55 to 64 Years | 11 (100.0%) | 0 (0.0%) |
| 65 to 74 Years | 23 (100.0%) | 0 (0.0%) |
| 75 Years and older | 4 (100.0%) | 0 (0.0%) |
| Total | 86 (100.0%) | 0 (0.0%) |
Health Insurance Coverage by Citizenship Status in Fort Ripley
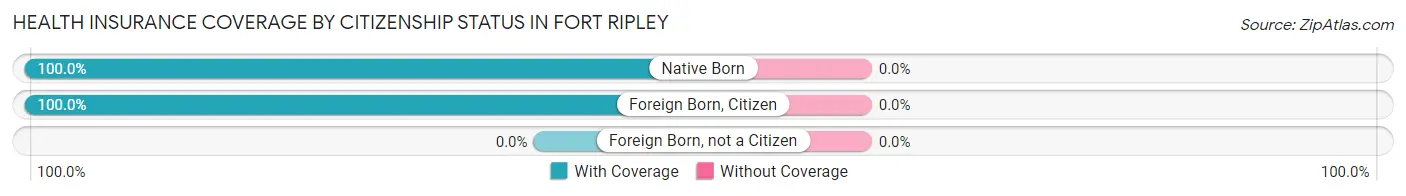
| Citizenship Status | With Coverage | Without Coverage |
| Native Born | 11 (100.0%) | 0 (0.0%) |
| Foreign Born, Citizen | 12 (100.0%) | 0 (0.0%) |
| Foreign Born, not a Citizen | 0 (0.0%) | 0 (0.0%) |
Health Insurance Coverage by Household Income in Fort Ripley
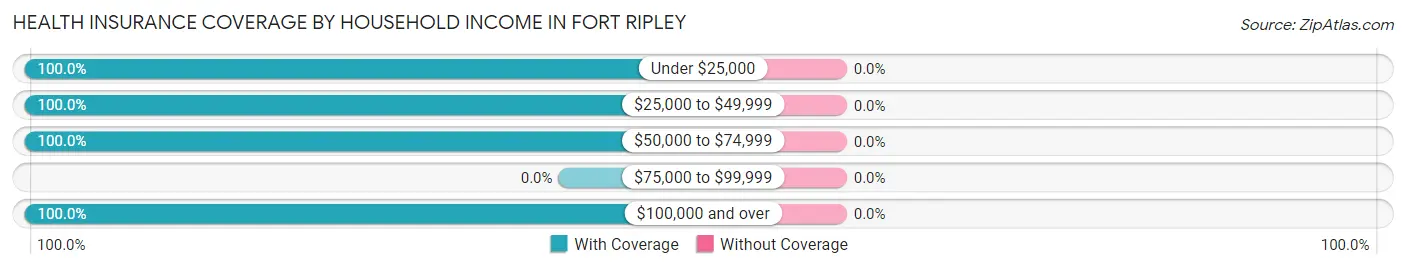
| Household Income | With Coverage | Without Coverage |
| Under $25,000 | 16 (100.0%) | 0 (0.0%) |
| $25,000 to $49,999 | 3 (100.0%) | 0 (0.0%) |
| $50,000 to $74,999 | 23 (100.0%) | 0 (0.0%) |
| $75,000 to $99,999 | 0 (0.0%) | 0 (0.0%) |
| $100,000 and over | 44 (100.0%) | 0 (0.0%) |
Public vs Private Health Insurance Coverage by Age in Fort Ripley
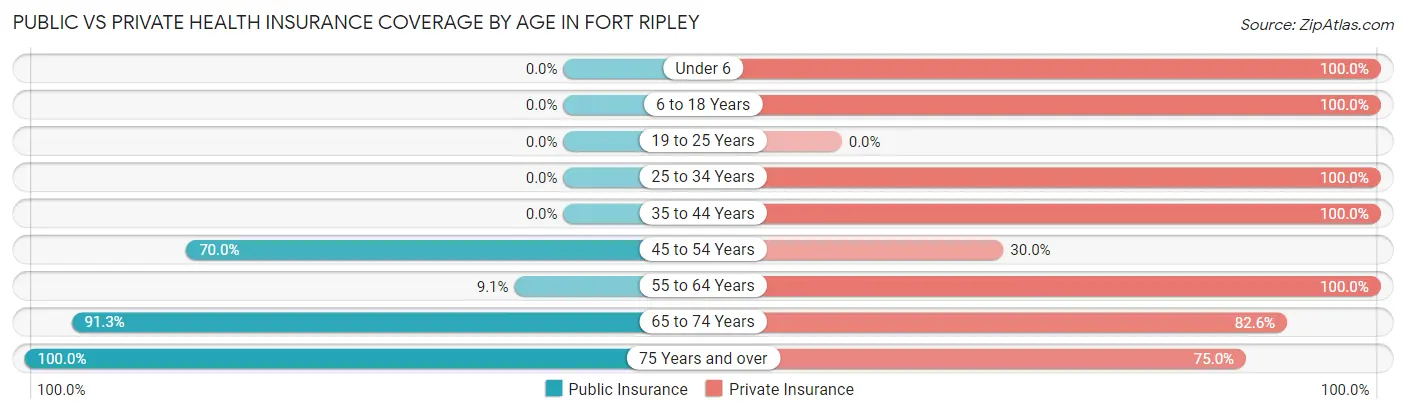
| Age Bracket | Public Insurance | Private Insurance |
| Under 6 | 0 (0.0%) | 11 (100.0%) |
| 6 to 18 Years | 0 (0.0%) | 12 (100.0%) |
| 19 to 25 Years | 0 (0.0%) | 0 (0.0%) |
| 25 to 34 Years | 0 (0.0%) | 6 (100.0%) |
| 35 to 44 Years | 0 (0.0%) | 9 (100.0%) |
| 45 to 54 Years | 7 (70.0%) | 3 (30.0%) |
| 55 to 64 Years | 1 (9.1%) | 11 (100.0%) |
| 65 to 74 Years | 21 (91.3%) | 19 (82.6%) |
| 75 Years and over | 4 (100.0%) | 3 (75.0%) |
| Total | 33 (38.4%) | 74 (86.1%) |
Disability Status by Sex by Age in Fort Ripley
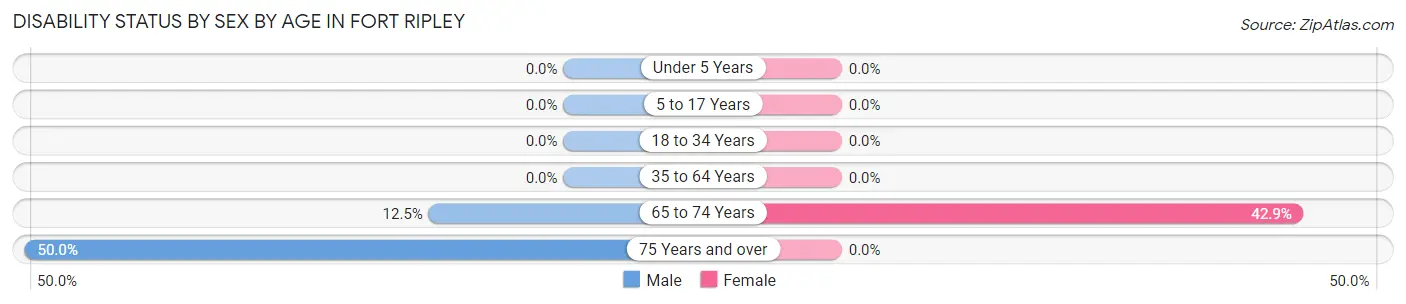
| Age Bracket | Male | Female |
| Under 5 Years | 0 (0.0%) | 0 (0.0%) |
| 5 to 17 Years | 0 (0.0%) | 0 (0.0%) |
| 18 to 34 Years | 0 (0.0%) | 0 (0.0%) |
| 35 to 64 Years | 0 (0.0%) | 0 (0.0%) |
| 65 to 74 Years | 2 (12.5%) | 3 (42.9%) |
| 75 Years and over | 1 (50.0%) | 0 (0.0%) |
Disability Class by Sex by Age in Fort Ripley
Disability Class: Hearing Difficulty
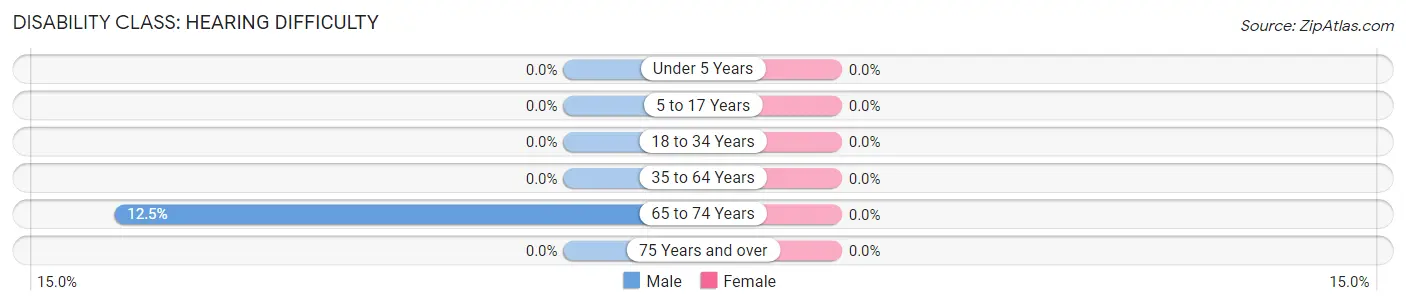
| Age Bracket | Male | Female |
| Under 5 Years | 0 (0.0%) | 0 (0.0%) |
| 5 to 17 Years | 0 (0.0%) | 0 (0.0%) |
| 18 to 34 Years | 0 (0.0%) | 0 (0.0%) |
| 35 to 64 Years | 0 (0.0%) | 0 (0.0%) |
| 65 to 74 Years | 2 (12.5%) | 0 (0.0%) |
| 75 Years and over | 0 (0.0%) | 0 (0.0%) |
Disability Class: Vision Difficulty
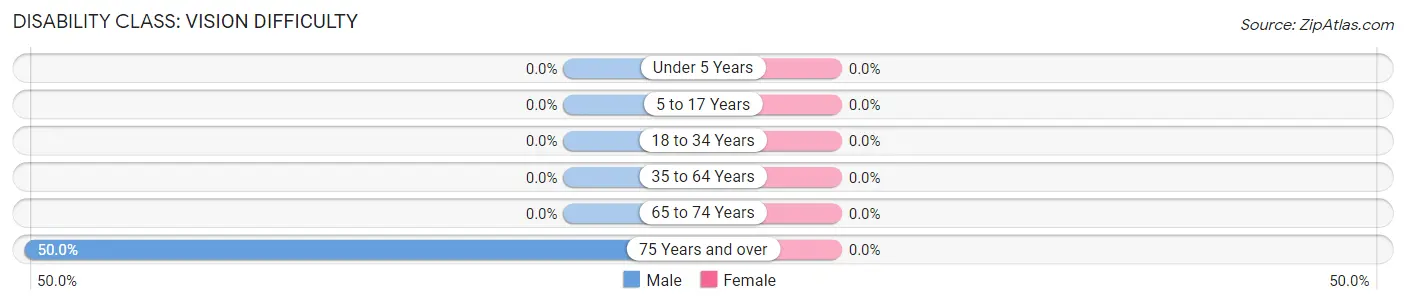
| Age Bracket | Male | Female |
| Under 5 Years | 0 (0.0%) | 0 (0.0%) |
| 5 to 17 Years | 0 (0.0%) | 0 (0.0%) |
| 18 to 34 Years | 0 (0.0%) | 0 (0.0%) |
| 35 to 64 Years | 0 (0.0%) | 0 (0.0%) |
| 65 to 74 Years | 0 (0.0%) | 0 (0.0%) |
| 75 Years and over | 1 (50.0%) | 0 (0.0%) |
Disability Class: Cognitive Difficulty
| Age Bracket | Male | Female |
| 5 to 17 Years | 0 (0.0%) | 0 (0.0%) |
| 18 to 34 Years | 0 (0.0%) | 0 (0.0%) |
| 35 to 64 Years | 0 (0.0%) | 0 (0.0%) |
| 65 to 74 Years | 0 (0.0%) | 0 (0.0%) |
| 75 Years and over | 0 (0.0%) | 0 (0.0%) |
Disability Class: Ambulatory Difficulty
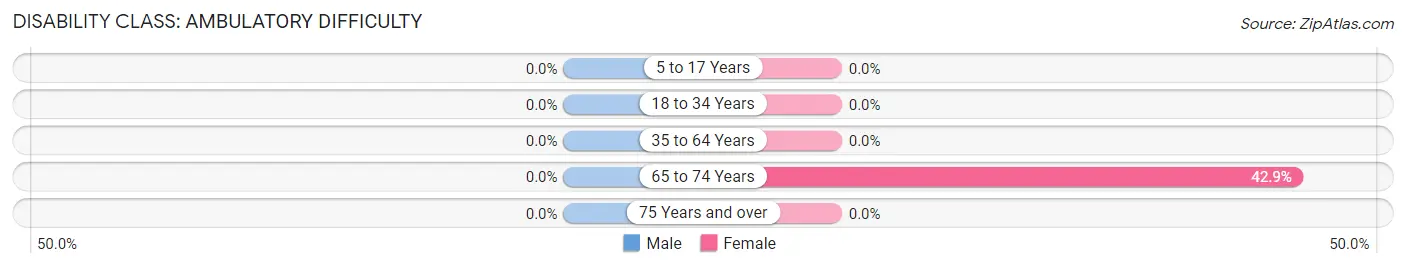
| Age Bracket | Male | Female |
| 5 to 17 Years | 0 (0.0%) | 0 (0.0%) |
| 18 to 34 Years | 0 (0.0%) | 0 (0.0%) |
| 35 to 64 Years | 0 (0.0%) | 0 (0.0%) |
| 65 to 74 Years | 0 (0.0%) | 3 (42.9%) |
| 75 Years and over | 0 (0.0%) | 0 (0.0%) |
Disability Class: Self-Care Difficulty
| Age Bracket | Male | Female |
| 5 to 17 Years | 0 (0.0%) | 0 (0.0%) |
| 18 to 34 Years | 0 (0.0%) | 0 (0.0%) |
| 35 to 64 Years | 0 (0.0%) | 0 (0.0%) |
| 65 to 74 Years | 0 (0.0%) | 0 (0.0%) |
| 75 Years and over | 0 (0.0%) | 0 (0.0%) |
Technology Access in Fort Ripley
Computing Device Access in Fort Ripley
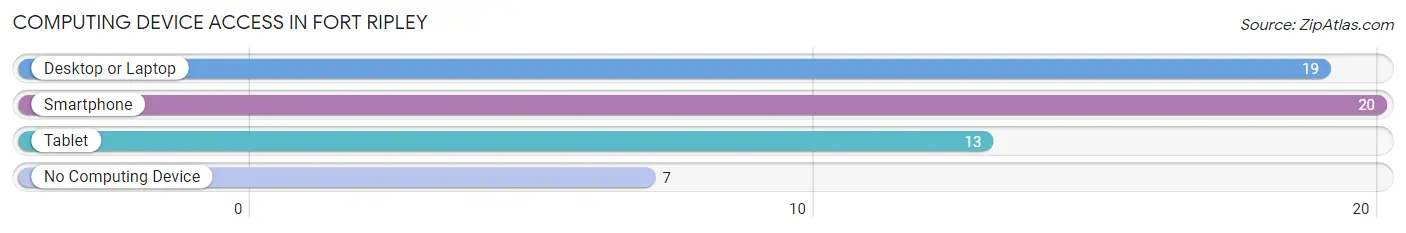
| Device Type | # Households | % Households |
| Desktop or Laptop | 19 | 57.6% |
| Smartphone | 20 | 60.6% |
| Tablet | 13 | 39.4% |
| No Computing Device | 7 | 21.2% |
| Total | 33 | 100.0% |
Internet Access in Fort Ripley
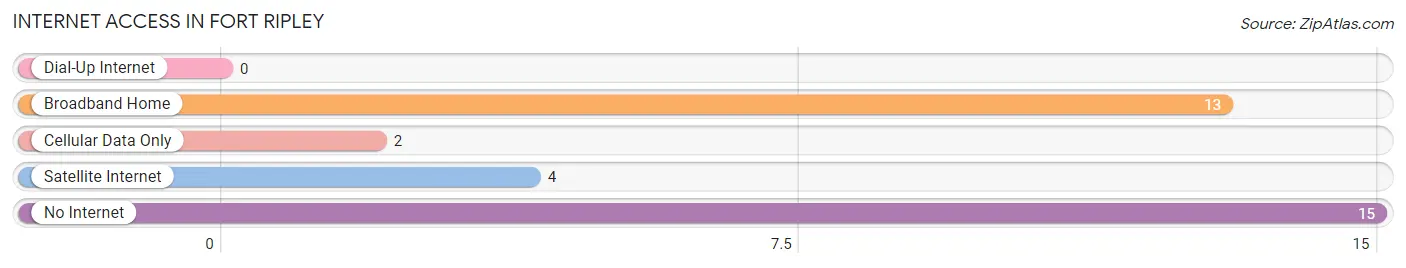
| Internet Type | # Households | % Households |
| Dial-Up Internet | 0 | 0.0% |
| Broadband Home | 13 | 39.4% |
| Cellular Data Only | 2 | 6.1% |
| Satellite Internet | 4 | 12.1% |
| No Internet | 15 | 45.5% |
| Total | 33 | 100.0% |
Fort Ripley Summary
History
Fort Ripley is a small unincorporated community located in Crow Wing County, Minnesota. It is situated on the south shore of the Mississippi River, approximately 10 miles north of Brainerd. The area was first settled in the late 1800s by a group of settlers from Wisconsin. The settlement was originally known as “Ripley’s Landing”, named after the first settler, William Ripley. In 1849, the U.S. Army established a military post in the area, which was named Fort Ripley. The fort was used to protect settlers from Native American attacks and to provide a base for military operations in the region.
The fort was abandoned in 1877, but the settlement continued to grow. In 1881, the town was officially incorporated as the Village of Fort Ripley. The village was home to a variety of businesses, including a sawmill, a grist mill, a blacksmith shop, a general store, and a hotel. The village also had a post office, a school, and a church.
In the early 1900s, the village began to decline. The sawmill and grist mill closed, and the population began to dwindle. By the 1950s, the village had become a ghost town. In the late 1970s, the village was revitalized by the construction of a new dam on the Mississippi River. The dam created a lake, which is now known as Lake Ripley.
Geography
Fort Ripley is located in Crow Wing County, Minnesota. It is situated on the south shore of the Mississippi River, approximately 10 miles north of Brainerd. The village is surrounded by rolling hills and forests. The area is known for its scenic beauty and is a popular destination for outdoor recreation.
The climate in Fort Ripley is typical of the Upper Midwest. Summers are warm and humid, while winters are cold and snowy. The average annual temperature is around 40 degrees Fahrenheit. The average annual precipitation is around 30 inches.
Economy
The economy of Fort Ripley is largely based on tourism. The village is a popular destination for outdoor recreation, such as fishing, boating, and camping. The area is also home to several resorts and lodges, which attract visitors from all over the country.
In addition to tourism, the village is home to several small businesses. These include a general store, a gas station, a restaurant, and a few other small shops. The village also has a post office and a school.
Demographics
As of the 2010 census, the population of Fort Ripley was 545. The racial makeup of the village was 97.3% White, 0.2% African American, 0.4% Native American, 0.2% Asian, 0.2% from other races, and 1.9% from two or more races. Hispanic or Latino of any race were 0.7% of the population.
The median household income in Fort Ripley was $41,250, and the median family income was $45,833. The per capita income was $20,945. About 8.3% of families and 10.2% of the population were below the poverty line, including 14.3% of those under age 18 and 4.2% of those age 65 or over.
Common Questions
What is Per Capita Income in Fort Ripley?
Per Capita income in Fort Ripley is $29,620.
What is the Median Household income in Fort Ripley?
Median Household Income in Fort Ripley is $51,042.
What is Inequality or Gini Index in Fort Ripley?
Inequality or Gini Index in Fort Ripley is 0.43.
What is the Total Population of Fort Ripley?
Total Population of Fort Ripley is 86.
What is the Total Male Population of Fort Ripley?
Total Male Population of Fort Ripley is 56.
What is the Total Female Population of Fort Ripley?
Total Female Population of Fort Ripley is 30.
What is the Ratio of Males per 100 Females in Fort Ripley?
There are 186.67 Males per 100 Females in Fort Ripley.
What is the Ratio of Females per 100 Males in Fort Ripley?
There are 53.57 Females per 100 Males in Fort Ripley.
What is the Median Population Age in Fort Ripley?
Median Population Age in Fort Ripley is 47.6 Years.
What is the Average Family Size in Fort Ripley
Average Family Size in Fort Ripley is 3.2 People.
What is the Average Household Size in Fort Ripley
Average Household Size in Fort Ripley is 2.6 People.
How Large is the Labor Force in Fort Ripley?
There are 39 People in the Labor Forcein in Fort Ripley.
What is the Percentage of People in the Labor Force in Fort Ripley?
59.1% of People are in the Labor Force in Fort Ripley.
What is the Unemployment Rate in Fort Ripley?
Unemployment Rate in Fort Ripley is 17.9%.