Farwell, MN Map & Demographics
Farwell Map
Farwell Overview
$29,531
PER CAPITA INCOME
$56,250
AVG HOUSEHOLD INCOME
0.22
INEQUALITY / GINI INDEX
36
TOTAL POPULATION
20
MALE POPULATION
16
FEMALE POPULATION
125.00
MALES / 100 FEMALES
80.00
FEMALES / 100 MALES
41.4
MEDIAN AGE
2.8
AVG FAMILY SIZE
1.6
AVG HOUSEHOLD SIZE
21
LABOR FORCE [ PEOPLE ]
67.7%
PERCENT IN LABOR FORCE
Farwell Zip Codes
Farwell Area Codes
Income in Farwell
Income Overview in Farwell
| Characteristic | Number | Measure |
| Per Capita Income | 36 | $29,531 |
| Median Family Income | 4 | $0 |
| Mean Family Income | 4 | $19,075 |
| Median Household Income | 23 | $56,250 |
| Mean Household Income | 23 | $49,330 |
| Income Deficit | 4 | $0 |
| Wage / Income Gap (%) | 36 | 0.00% |
| Wage / Income Gap ($) | 36 | 100.00¢ per $1 |
| Gini / Inequality Index | 36 | 0.22 |
Earnings by Sex in Farwell
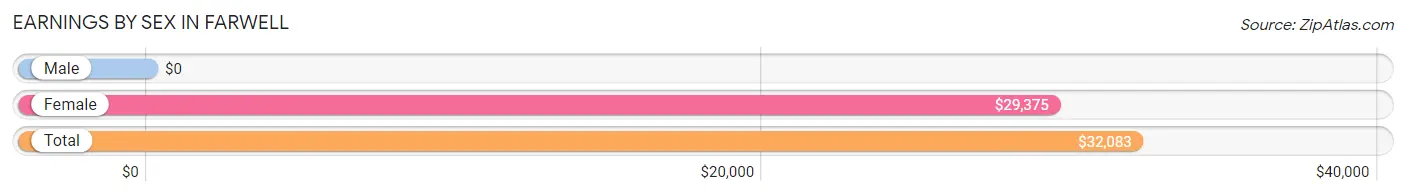
| Sex | Number | Average Earnings |
| Male | 11 (50.0%) | $0 |
| Female | 11 (50.0%) | $29,375 |
| Total | 22 (100.0%) | $32,083 |
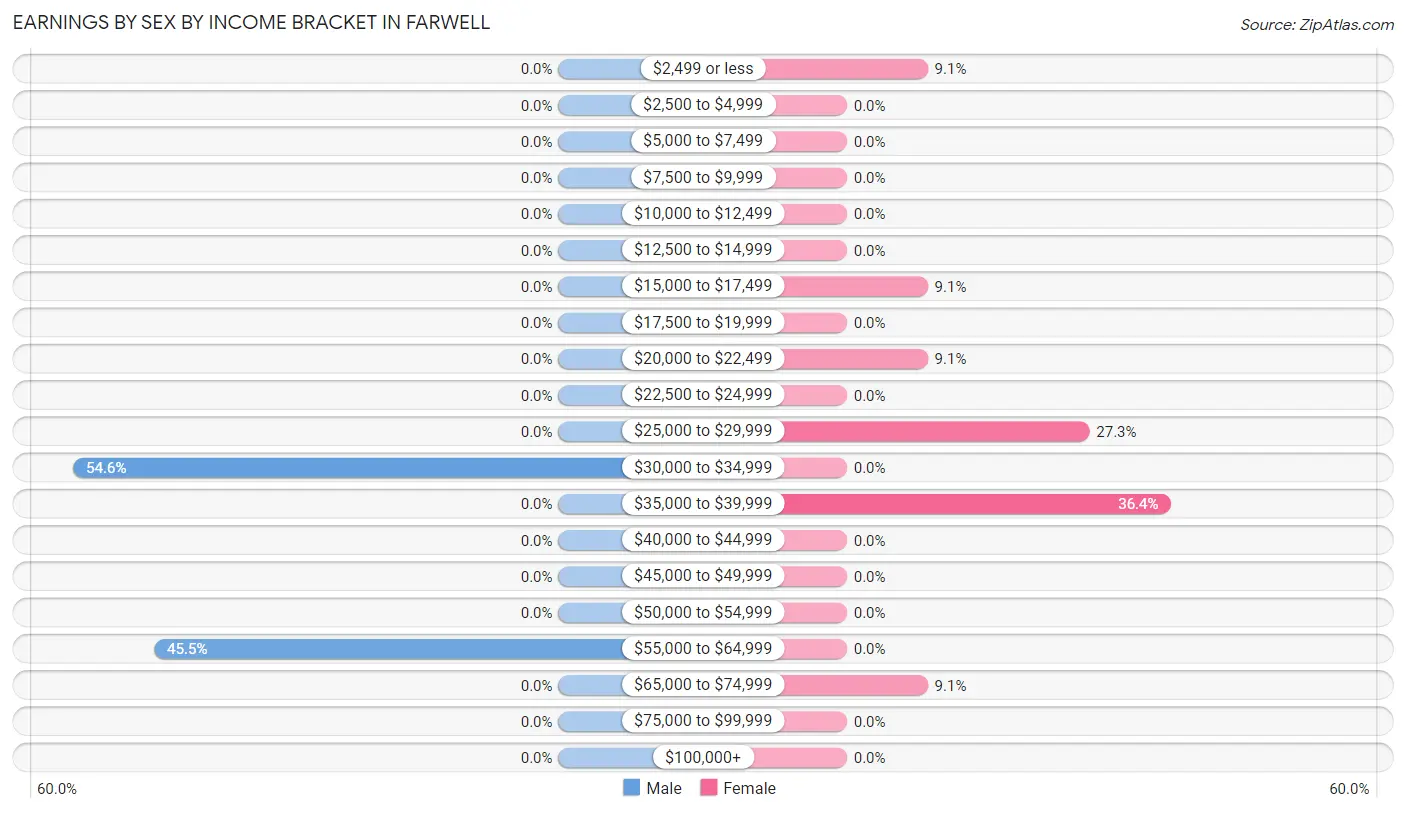
Earnings by Sex by Income Bracket in Farwell
The most common earnings brackets in Farwell are $30,000 to $34,999 for men (6 | 54.5%) and $35,000 to $39,999 for women (4 | 36.4%).
| Income | Male | Female |
| $2,499 or less | 0 (0.0%) | 1 (9.1%) |
| $2,500 to $4,999 | 0 (0.0%) | 0 (0.0%) |
| $5,000 to $7,499 | 0 (0.0%) | 0 (0.0%) |
| $7,500 to $9,999 | 0 (0.0%) | 0 (0.0%) |
| $10,000 to $12,499 | 0 (0.0%) | 0 (0.0%) |
| $12,500 to $14,999 | 0 (0.0%) | 0 (0.0%) |
| $15,000 to $17,499 | 0 (0.0%) | 1 (9.1%) |
| $17,500 to $19,999 | 0 (0.0%) | 0 (0.0%) |
| $20,000 to $22,499 | 0 (0.0%) | 1 (9.1%) |
| $22,500 to $24,999 | 0 (0.0%) | 0 (0.0%) |
| $25,000 to $29,999 | 0 (0.0%) | 3 (27.3%) |
| $30,000 to $34,999 | 6 (54.5%) | 0 (0.0%) |
| $35,000 to $39,999 | 0 (0.0%) | 4 (36.4%) |
| $40,000 to $44,999 | 0 (0.0%) | 0 (0.0%) |
| $45,000 to $49,999 | 0 (0.0%) | 0 (0.0%) |
| $50,000 to $54,999 | 0 (0.0%) | 0 (0.0%) |
| $55,000 to $64,999 | 5 (45.5%) | 0 (0.0%) |
| $65,000 to $74,999 | 0 (0.0%) | 1 (9.1%) |
| $75,000 to $99,999 | 0 (0.0%) | 0 (0.0%) |
| $100,000+ | 0 (0.0%) | 0 (0.0%) |
| Total | 11 (100.0%) | 11 (100.0%) |
Earnings by Sex by Educational Attainment in Farwell
| Educational Attainment | Male Income | Female Income |
| Less than High School | - | - |
| High School Diploma | - | - |
| College or Associate's Degree | - | - |
| Bachelor's Degree | - | - |
| Graduate Degree | - | - |
| Total | - | - |
Family Income in Farwell
Family Income Brackets in Farwell
According to the Farwell family income data, there are 2 families falling into the $25,000 to $34,999 income range, which is the most common income bracket and makes up 50.0% of all families.
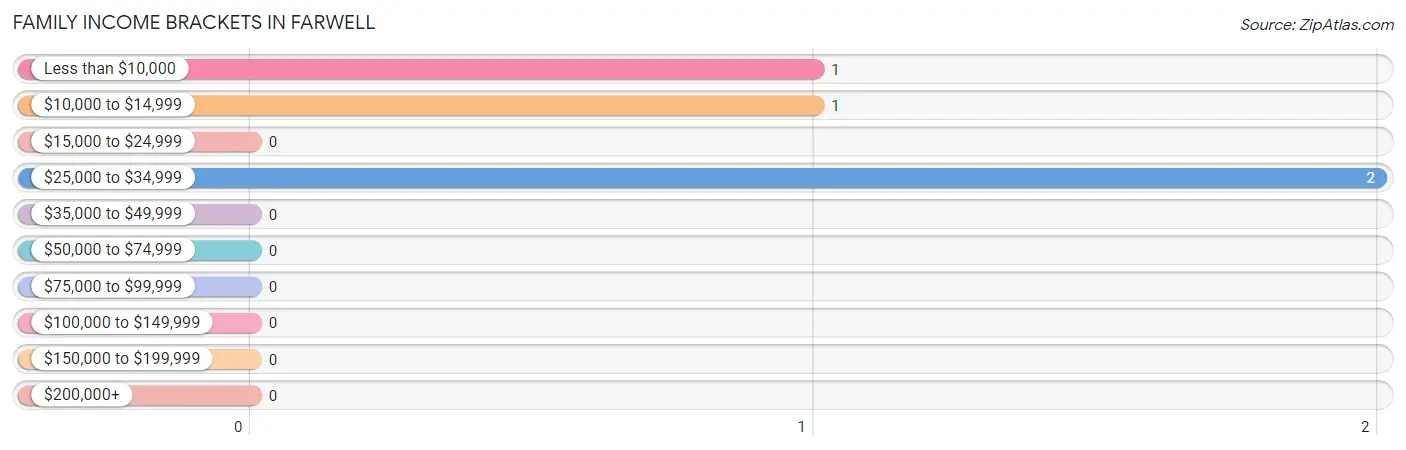
| Income Bracket | # Families | % Families |
| Less than $10,000 | 1 | 25.0% |
| $10,000 to $14,999 | 1 | 25.0% |
| $15,000 to $24,999 | 0 | 0.0% |
| $25,000 to $34,999 | 2 | 50.0% |
| $35,000 to $49,999 | 0 | 0.0% |
| $50,000 to $74,999 | 0 | 0.0% |
| $75,000 to $99,999 | 0 | 0.0% |
| $100,000 to $149,999 | 0 | 0.0% |
| $150,000 to $199,999 | 0 | 0.0% |
| $200,000+ | 0 | 0.0% |
Family Income by Famaliy Size in Farwell
| Income Bracket | # Families | Median Income |
| 2-Person Families | 2 (50.0%) | $0 |
| 3-Person Families | 1 (25.0%) | $0 |
| 4-Person Families | 1 (25.0%) | $0 |
| 5-Person Families | 0 (0.0%) | $0 |
| 6-Person Families | 0 (0.0%) | $0 |
| 7+ Person Families | 0 (0.0%) | $0 |
| Total | 4 (100.0%) | $0 |
Family Income by Number of Earners in Farwell
| Number of Earners | # Families | Median Income |
| No Earners | 3 (75.0%) | $0 |
| 1 Earner | 1 (25.0%) | $0 |
| 2 Earners | 0 (0.0%) | $0 |
| 3+ Earners | 0 (0.0%) | $0 |
| Total | 4 (100.0%) | $0 |
Household Income in Farwell
Household Income Brackets in Farwell
With 14 households falling in the category, the $50,000 to $74,999 income range is the most frequent in Farwell, accounting for 60.9% of all households.
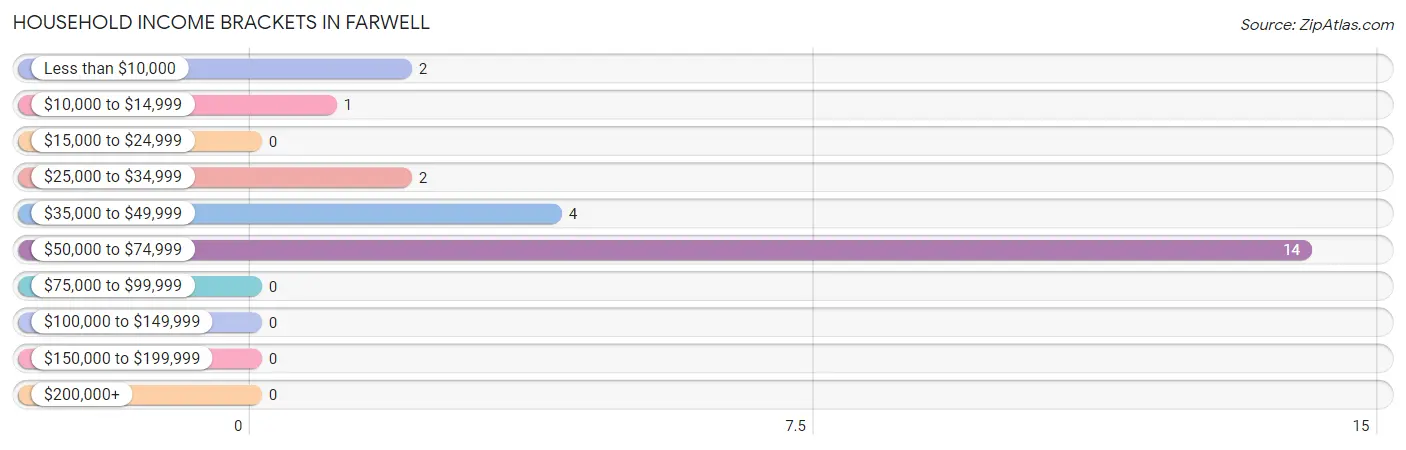
| Income Bracket | # Households | % Households |
| Less than $10,000 | 2 | 8.7% |
| $10,000 to $14,999 | 1 | 4.3% |
| $15,000 to $24,999 | 0 | 0.0% |
| $25,000 to $34,999 | 2 | 8.7% |
| $35,000 to $49,999 | 4 | 17.4% |
| $50,000 to $74,999 | 14 | 60.9% |
| $75,000 to $99,999 | 0 | 0.0% |
| $100,000 to $149,999 | 0 | 0.0% |
| $150,000 to $199,999 | 0 | 0.0% |
| $200,000+ | 0 | 0.0% |
Household Income by Householder Age in Farwell
The median household income in Farwell is $56,250, with the highest median household income of $38,125 found in the 45 to 64 years age bracket for the primary householder. A total of 5 households (21.7%) fall into this category. Meanwhile, the 15 to 24 years age bracket for the primary householder has the lowest median household income of $0, with 6 households (26.1%) in this group.
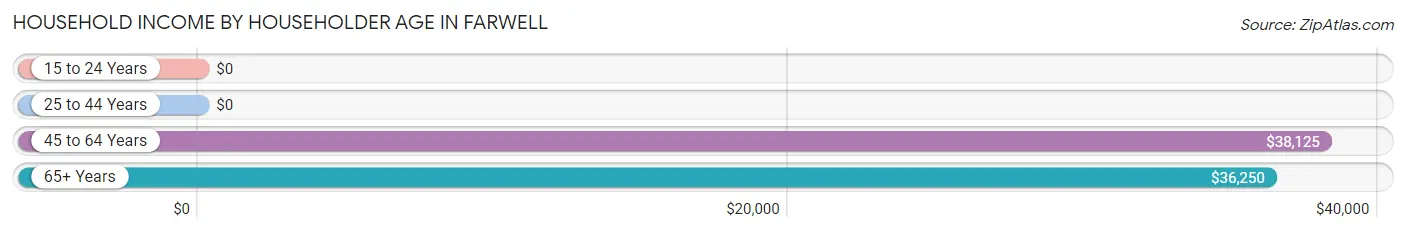
| Income Bracket | # Households | Median Income |
| 15 to 24 Years | 6 (26.1%) | $0 |
| 25 to 44 Years | 5 (21.7%) | $0 |
| 45 to 64 Years | 5 (21.7%) | $38,125 |
| 65+ Years | 7 (30.4%) | $36,250 |
| Total | 23 (100.0%) | $56,250 |
Poverty in Farwell
Income Below Poverty by Sex and Age in Farwell
With 21.0% poverty level for males and 25.0% for females among the residents of Farwell, 6 to 11 year old males and 6 to 11 year old females are the most vulnerable to poverty, with 1 males (100.0%) and 2 females (100.0%) in their respective age groups living below the poverty level.
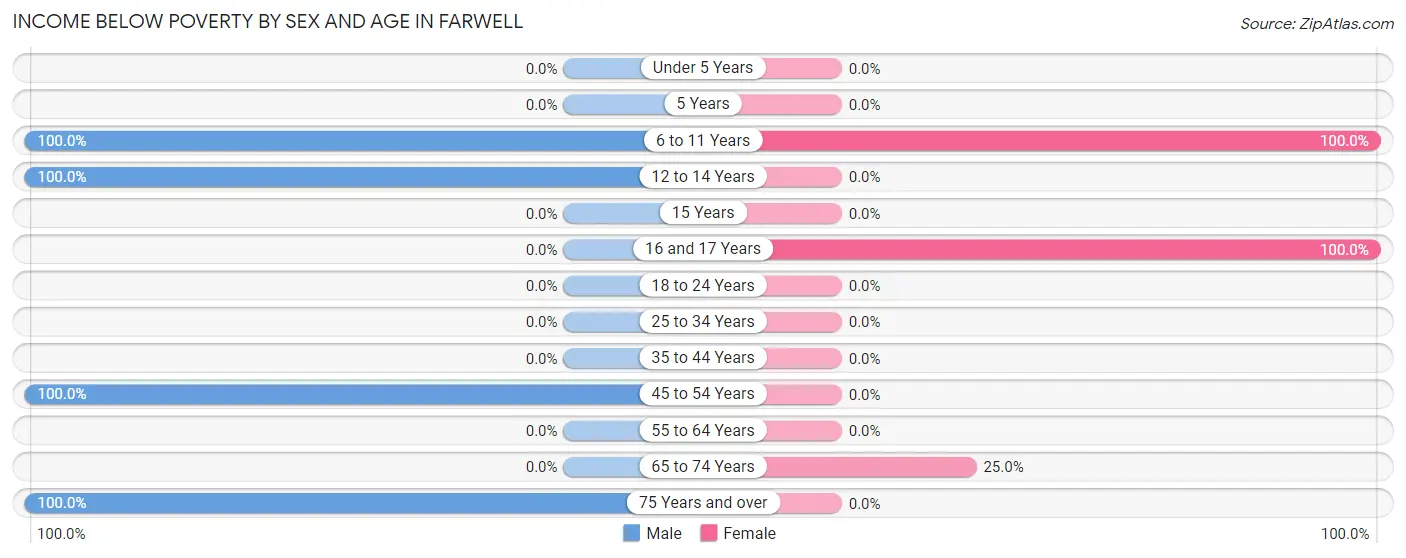
| Age Bracket | Male | Female |
| Under 5 Years | 0 (0.0%) | 0 (0.0%) |
| 5 Years | 0 (0.0%) | 0 (0.0%) |
| 6 to 11 Years | 1 (100.0%) | 2 (100.0%) |
| 12 to 14 Years | 1 (100.0%) | 0 (0.0%) |
| 15 Years | 0 (0.0%) | 0 (0.0%) |
| 16 and 17 Years | 0 (0.0%) | 1 (100.0%) |
| 18 to 24 Years | 0 (0.0%) | 0 (0.0%) |
| 25 to 34 Years | 0 (0.0%) | 0 (0.0%) |
| 35 to 44 Years | 0 (0.0%) | 0 (0.0%) |
| 45 to 54 Years | 1 (100.0%) | 0 (0.0%) |
| 55 to 64 Years | 0 (0.0%) | 0 (0.0%) |
| 65 to 74 Years | 0 (0.0%) | 1 (25.0%) |
| 75 Years and over | 1 (100.0%) | 0 (0.0%) |
| Total | 4 (21.0%) | 4 (25.0%) |
Income Above Poverty by Sex and Age in Farwell
According to the poverty statistics in Farwell, males aged 18 to 24 years and females aged 18 to 24 years are the age groups that are most secure financially, with 100.0% of males and 100.0% of females in these age groups living above the poverty line.
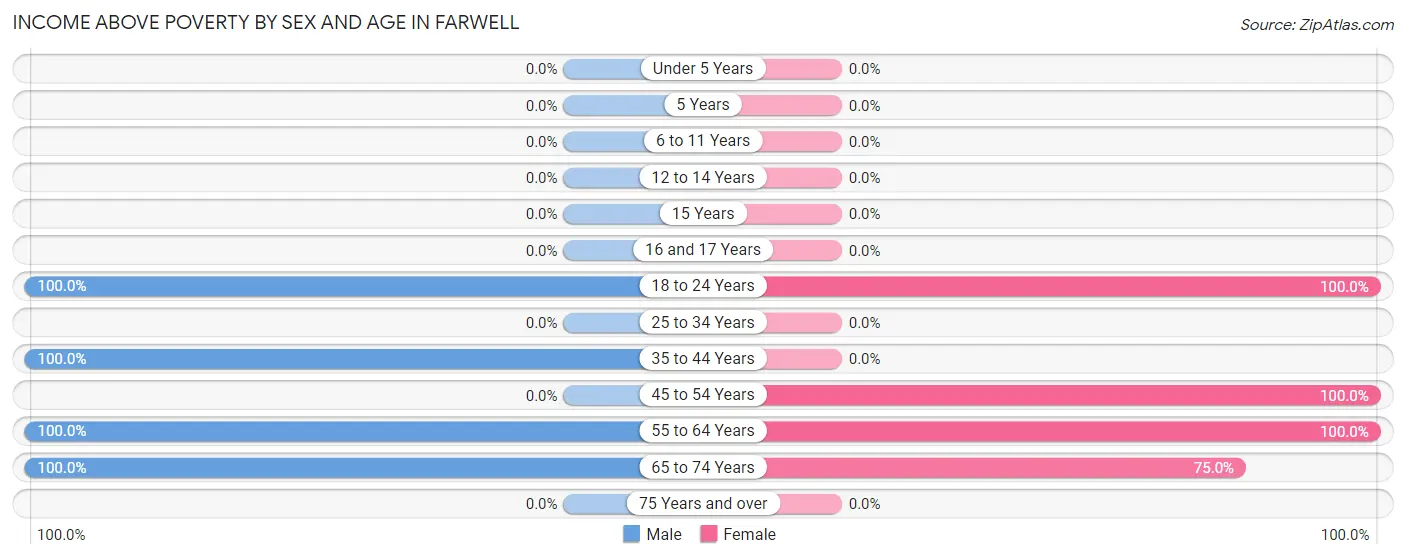
| Age Bracket | Male | Female |
| Under 5 Years | 0 (0.0%) | 0 (0.0%) |
| 5 Years | 0 (0.0%) | 0 (0.0%) |
| 6 to 11 Years | 0 (0.0%) | 0 (0.0%) |
| 12 to 14 Years | 0 (0.0%) | 0 (0.0%) |
| 15 Years | 0 (0.0%) | 0 (0.0%) |
| 16 and 17 Years | 0 (0.0%) | 0 (0.0%) |
| 18 to 24 Years | 6 (100.0%) | 4 (100.0%) |
| 25 to 34 Years | 0 (0.0%) | 0 (0.0%) |
| 35 to 44 Years | 5 (100.0%) | 0 (0.0%) |
| 45 to 54 Years | 0 (0.0%) | 3 (100.0%) |
| 55 to 64 Years | 1 (100.0%) | 2 (100.0%) |
| 65 to 74 Years | 3 (100.0%) | 3 (75.0%) |
| 75 Years and over | 0 (0.0%) | 0 (0.0%) |
| Total | 15 (78.9%) | 12 (75.0%) |
Income Below Poverty Among Married-Couple Families in Farwell
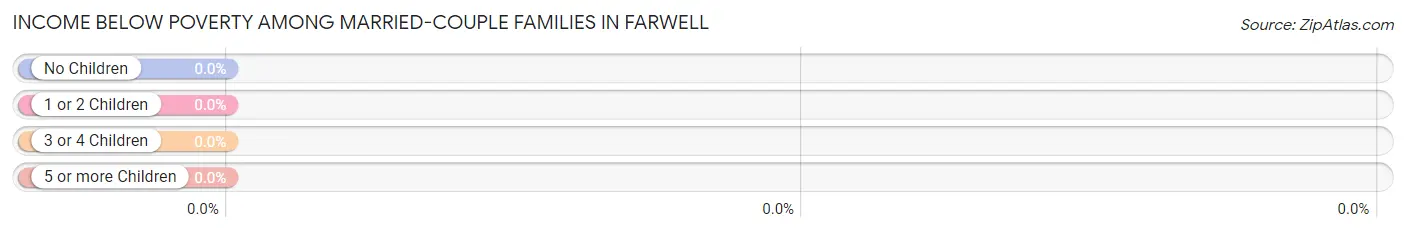
| Children | Above Poverty | Below Poverty |
| No Children | 2 (100.0%) | 0 (0.0%) |
| 1 or 2 Children | 0 (0.0%) | 0 (0.0%) |
| 3 or 4 Children | 0 (0.0%) | 0 (0.0%) |
| 5 or more Children | 0 (0.0%) | 0 (0.0%) |
| Total | 2 (100.0%) | 0 (0.0%) |
Income Below Poverty Among Single-Parent Households in Farwell
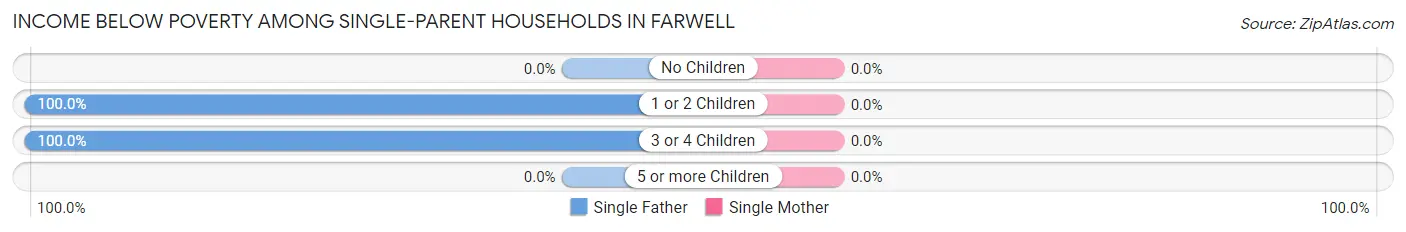
| Children | Single Father | Single Mother |
| No Children | 0 (0.0%) | 0 (0.0%) |
| 1 or 2 Children | 1 (100.0%) | 0 (0.0%) |
| 3 or 4 Children | 1 (100.0%) | 0 (0.0%) |
| 5 or more Children | 0 (0.0%) | 0 (0.0%) |
| Total | 2 (100.0%) | 0 (0.0%) |
Income Below Poverty Among Married-Couple vs Single-Parent Households in Farwell
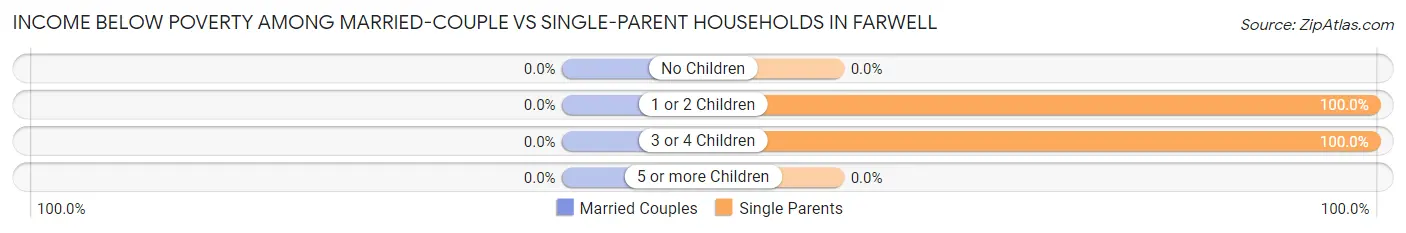
| Children | Married-Couple Families | Single-Parent Households |
| No Children | 0 (0.0%) | 0 (0.0%) |
| 1 or 2 Children | 0 (0.0%) | 1 (100.0%) |
| 3 or 4 Children | 0 (0.0%) | 1 (100.0%) |
| 5 or more Children | 0 (0.0%) | 0 (0.0%) |
| Total | 0 (0.0%) | 2 (100.0%) |
Race in Farwell
The most populous races in Farwell are , and White / Caucasian (36 | 100.0%).
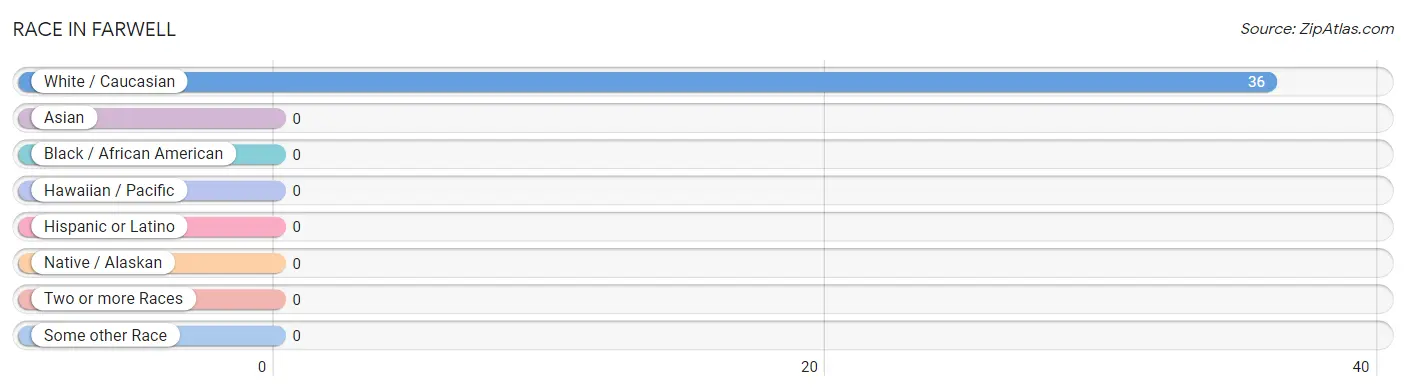
| Race | # Population | % Population |
| Asian | 0 | 0.0% |
| Black / African American | 0 | 0.0% |
| Hawaiian / Pacific | 0 | 0.0% |
| Hispanic or Latino | 0 | 0.0% |
| Native / Alaskan | 0 | 0.0% |
| White / Caucasian | 36 | 100.0% |
| Two or more Races | 0 | 0.0% |
| Some other Race | 0 | 0.0% |
| Total | 36 | 100.0% |
Ancestry in Farwell
The most populous ancestries reported in Farwell are Norwegian (13 | 36.1%), German (12 | 33.3%), Swedish (8 | 22.2%), Irish (6 | 16.7%), and Czech (5 | 13.9%), together accounting for 122.2% of all Farwell residents.
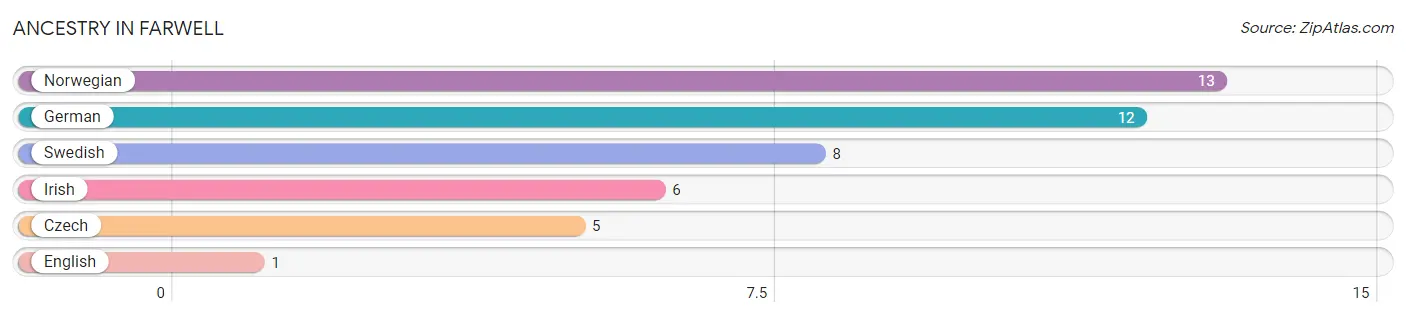
| Ancestry | # Population | % Population |
| Czech | 5 | 13.9% |
| English | 1 | 2.8% |
| German | 12 | 33.3% |
| Irish | 6 | 16.7% |
| Norwegian | 13 | 36.1% |
| Swedish | 8 | 22.2% | View All 6 Rows |
Immigrants in Farwell

| Immigration Origin | # Population | % Population | View All 0 Rows |
Sex and Age in Farwell
Sex and Age in Farwell
The most populous age groups in Farwell are 20 to 24 Years (6 | 30.0%) for men and 20 to 24 Years (4 | 25.0%) for women.
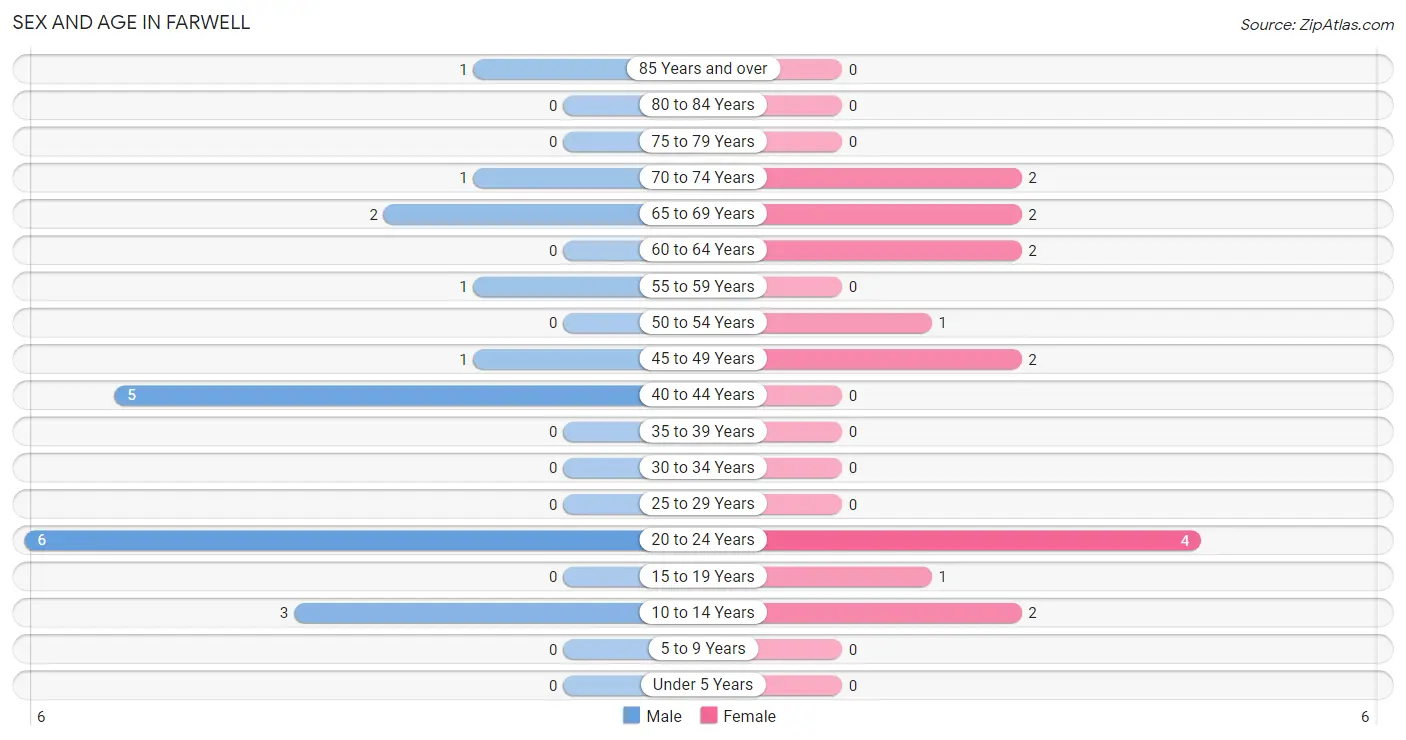
| Age Bracket | Male | Female |
| Under 5 Years | 0 (0.0%) | 0 (0.0%) |
| 5 to 9 Years | 0 (0.0%) | 0 (0.0%) |
| 10 to 14 Years | 3 (15.0%) | 2 (12.5%) |
| 15 to 19 Years | 0 (0.0%) | 1 (6.2%) |
| 20 to 24 Years | 6 (30.0%) | 4 (25.0%) |
| 25 to 29 Years | 0 (0.0%) | 0 (0.0%) |
| 30 to 34 Years | 0 (0.0%) | 0 (0.0%) |
| 35 to 39 Years | 0 (0.0%) | 0 (0.0%) |
| 40 to 44 Years | 5 (25.0%) | 0 (0.0%) |
| 45 to 49 Years | 1 (5.0%) | 2 (12.5%) |
| 50 to 54 Years | 0 (0.0%) | 1 (6.2%) |
| 55 to 59 Years | 1 (5.0%) | 0 (0.0%) |
| 60 to 64 Years | 0 (0.0%) | 2 (12.5%) |
| 65 to 69 Years | 2 (10.0%) | 2 (12.5%) |
| 70 to 74 Years | 1 (5.0%) | 2 (12.5%) |
| 75 to 79 Years | 0 (0.0%) | 0 (0.0%) |
| 80 to 84 Years | 0 (0.0%) | 0 (0.0%) |
| 85 Years and over | 1 (5.0%) | 0 (0.0%) |
| Total | 20 (100.0%) | 16 (100.0%) |
Families and Households in Farwell
Median Family Size in Farwell
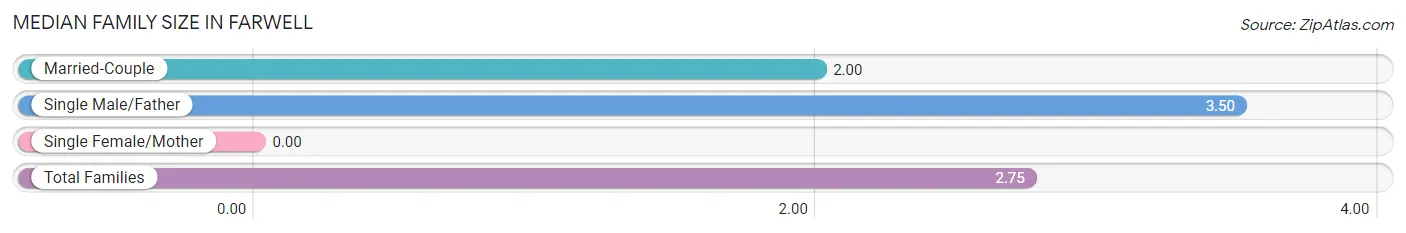
| Family Type | # Families | Family Size |
| Married-Couple | 2 (50.0%) | 2.00 |
| Single Male/Father | 2 (50.0%) | 3.50 |
| Single Female/Mother | 0 (0.0%) | - |
| Total Families | 4 (100.0%) | 2.75 |
Median Household Size in Farwell
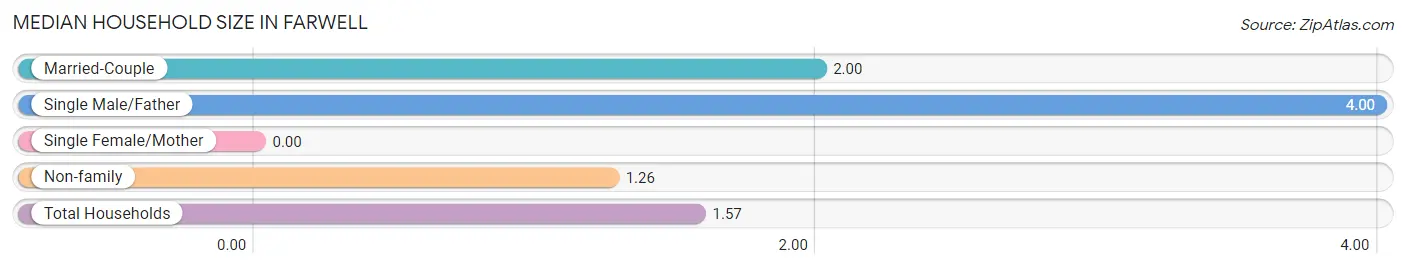
| Household Type | # Households | Household Size |
| Married-Couple | 2 (8.7%) | 2.00 |
| Single Male/Father | 2 (8.7%) | 4.00 |
| Single Female/Mother | 0 (0.0%) | - |
| Non-family | 19 (82.6%) | 1.26 |
| Total Households | 23 (100.0%) | 1.57 |
Household Size by Marriage Status in Farwell
Out of a total of 23 households in Farwell, 4 (17.4%) are family households, while 19 (82.6%) are nonfamily households. The most numerous type of family households are 2-person households, comprising 2, and the most common type of nonfamily households are 1-person households, comprising 12.
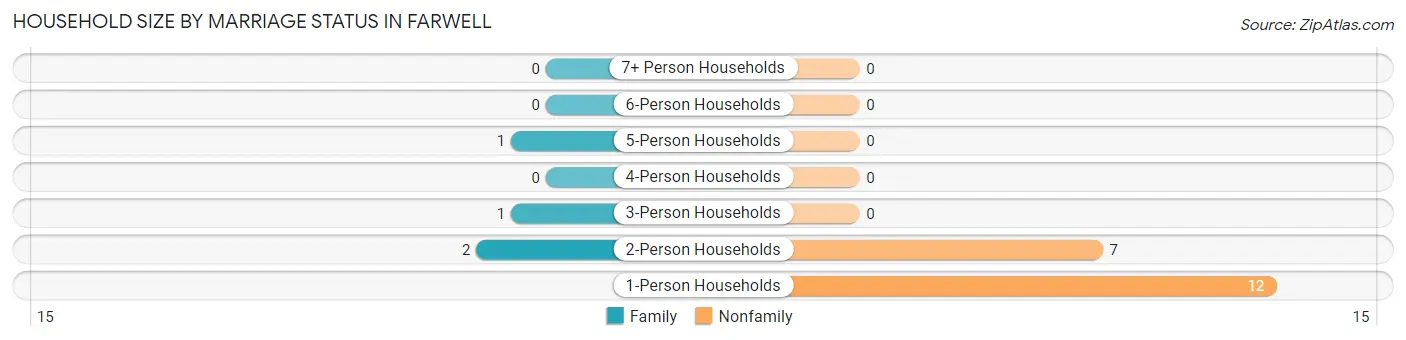
| Household Size | Family Households | Nonfamily Households |
| 1-Person Households | - | 12 (52.2%) |
| 2-Person Households | 2 (8.7%) | 7 (30.4%) |
| 3-Person Households | 1 (4.3%) | 0 (0.0%) |
| 4-Person Households | 0 (0.0%) | 0 (0.0%) |
| 5-Person Households | 1 (4.3%) | 0 (0.0%) |
| 6-Person Households | 0 (0.0%) | 0 (0.0%) |
| 7+ Person Households | 0 (0.0%) | 0 (0.0%) |
| Total | 4 (17.4%) | 19 (82.6%) |
Female Fertility in Farwell
Fertility by Age in Farwell
| Age Bracket | Women with Births | Births / 1,000 Women |
| 15 to 19 years | 0 (0.0%) | 0.0 |
| 20 to 34 years | 0 (0.0%) | 0.0 |
| 35 to 50 years | 0 (0.0%) | 0.0 |
| Total | 0 (0.0%) | 0.0 |
Fertility by Age by Marriage Status in Farwell
| Age Bracket | Married | Unmarried |
| 15 to 19 years | 0 (0.0%) | 0 (0.0%) |
| 20 to 34 years | 0 (0.0%) | 0 (0.0%) |
| 35 to 50 years | 0 (0.0%) | 0 (0.0%) |
| Total | 0 (0.0%) | 0 (0.0%) |
Fertility by Education in Farwell
| Educational Attainment | Women with Births | Births / 1,000 Women |
| Less than High School | 0 (0.0%) | 0.0 |
| High School Diploma | 0 (0.0%) | 0.0 |
| College or Associate's Degree | 0 (0.0%) | 0.0 |
| Bachelor's Degree | 0 (0.0%) | 0.0 |
| Graduate Degree | 0 (0.0%) | 0.0 |
| Total | 0 (0.0%) | 0.0 |
Fertility by Education by Marriage Status in Farwell
| Educational Attainment | Married | Unmarried |
| Less than High School | 0 (0.0%) | 0 (0.0%) |
| High School Diploma | 0 (0.0%) | 0 (0.0%) |
| College or Associate's Degree | 0 (0.0%) | 0 (0.0%) |
| Bachelor's Degree | 0 (0.0%) | 0 (0.0%) |
| Graduate Degree | 0 (0.0%) | 0 (0.0%) |
| Total | 0 (0.0%) | 0 (0.0%) |
Employment Characteristics in Farwell
Employment by Class of Employer in Farwell
Among the 21 employed individuals in Farwell, private company employees (19 | 90.5%), local government employees (1 | 4.8%), and state government employees (1 | 4.8%) make up the most common classes of employment.
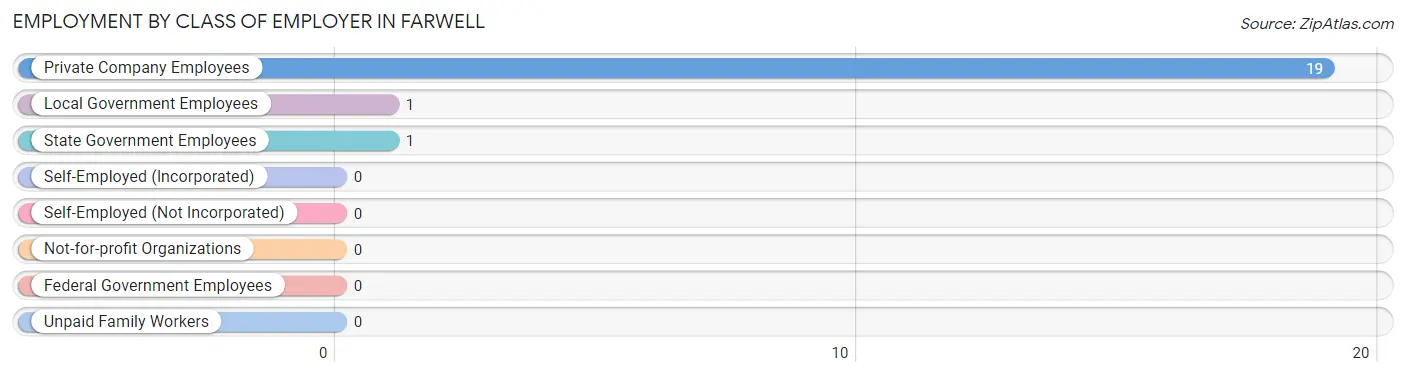
| Employer Class | # Employees | % Employees |
| Private Company Employees | 19 | 90.5% |
| Self-Employed (Incorporated) | 0 | 0.0% |
| Self-Employed (Not Incorporated) | 0 | 0.0% |
| Not-for-profit Organizations | 0 | 0.0% |
| Local Government Employees | 1 | 4.8% |
| State Government Employees | 1 | 4.8% |
| Federal Government Employees | 0 | 0.0% |
| Unpaid Family Workers | 0 | 0.0% |
| Total | 21 | 100.0% |
Employment Status by Age in Farwell
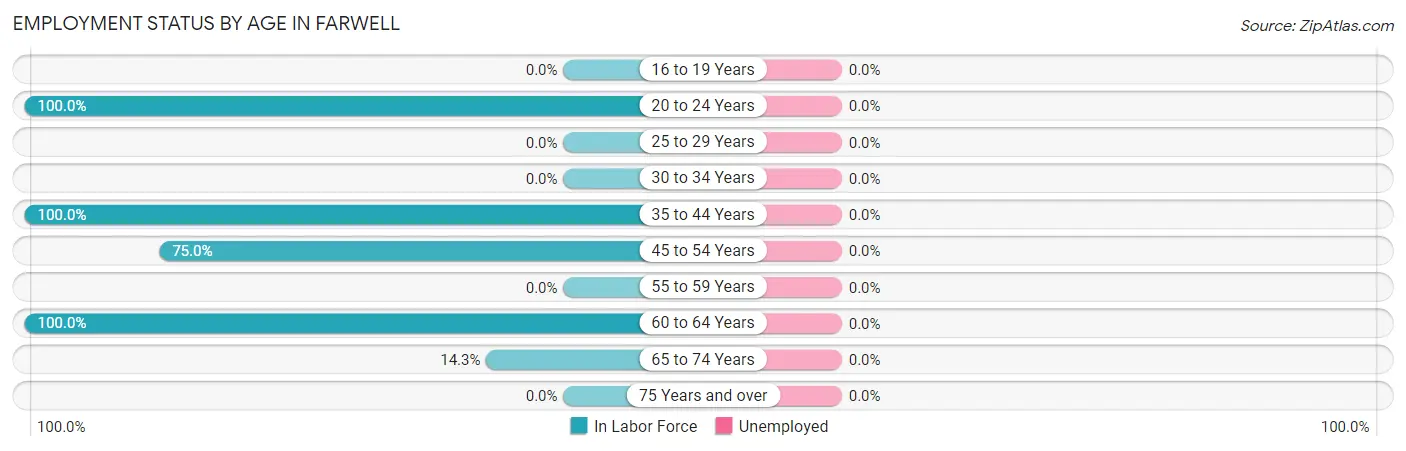
| Age Bracket | In Labor Force | Unemployed |
| 16 to 19 Years | 0 (0.0%) | 0 (0.0%) |
| 20 to 24 Years | 10 (100.0%) | 0 (0.0%) |
| 25 to 29 Years | 0 (0.0%) | 0 (0.0%) |
| 30 to 34 Years | 0 (0.0%) | 0 (0.0%) |
| 35 to 44 Years | 5 (100.0%) | 0 (0.0%) |
| 45 to 54 Years | 3 (75.0%) | 0 (0.0%) |
| 55 to 59 Years | 0 (0.0%) | 0 (0.0%) |
| 60 to 64 Years | 2 (100.0%) | 0 (0.0%) |
| 65 to 74 Years | 1 (14.3%) | 0 (0.0%) |
| 75 Years and over | 0 (0.0%) | 0 (0.0%) |
| Total | 21 (67.7%) | 0 (0.0%) |
Employment Status by Educational Attainment in Farwell
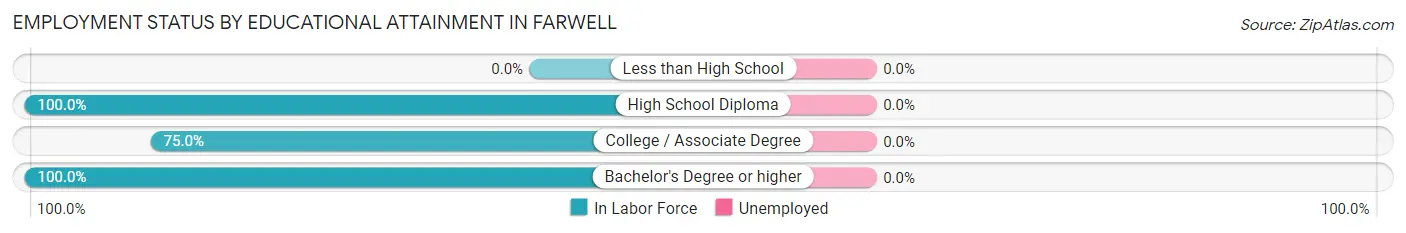
| Educational Attainment | In Labor Force | Unemployed |
| Less than High School | 0 (0.0%) | 0 (0.0%) |
| High School Diploma | 6 (100.0%) | 0 (0.0%) |
| College / Associate Degree | 3 (75.0%) | 0 (0.0%) |
| Bachelor's Degree or higher | 1 (100.0%) | 0 (0.0%) |
| Total | 10 (83.3%) | 0 (0.0%) |
Employment Occupations by Sex in Farwell
Management, Business, Science and Arts Occupations
The most common Management, Business, Science and Arts occupations in Farwell are Health Diagnosing & Treating (2 | 9.5%), Health Technologists (2 | 9.5%), Community & Social Service (1 | 4.8%), and Education Instruction & Library (1 | 4.8%).
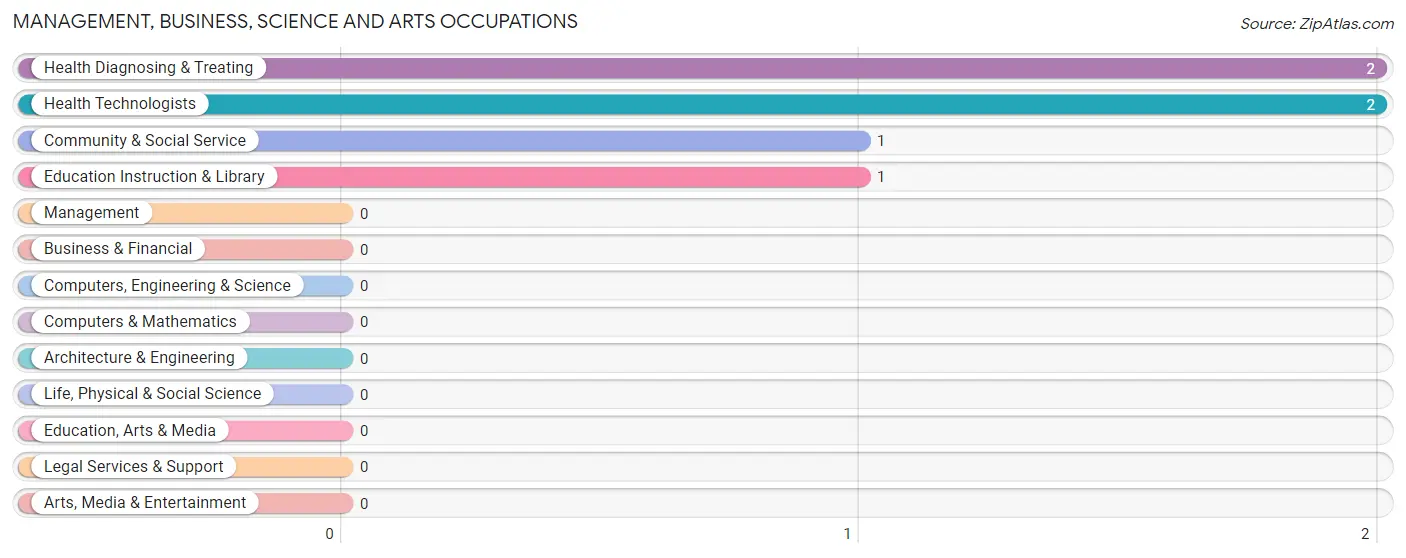
Management, Business, Science and Arts Occupations by Sex
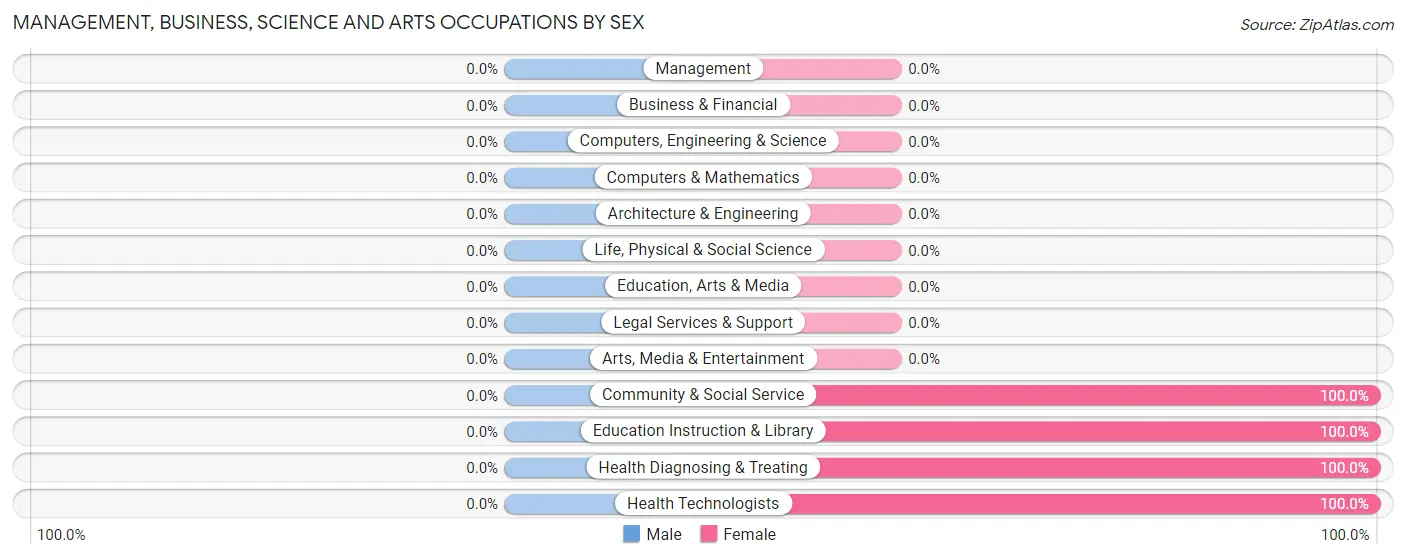
| Occupation | Male | Female |
| Management | 0 (0.0%) | 0 (0.0%) |
| Business & Financial | 0 (0.0%) | 0 (0.0%) |
| Computers, Engineering & Science | 0 (0.0%) | 0 (0.0%) |
| Computers & Mathematics | 0 (0.0%) | 0 (0.0%) |
| Architecture & Engineering | 0 (0.0%) | 0 (0.0%) |
| Life, Physical & Social Science | 0 (0.0%) | 0 (0.0%) |
| Community & Social Service | 0 (0.0%) | 1 (100.0%) |
| Education, Arts & Media | 0 (0.0%) | 0 (0.0%) |
| Legal Services & Support | 0 (0.0%) | 0 (0.0%) |
| Education Instruction & Library | 0 (0.0%) | 1 (100.0%) |
| Arts, Media & Entertainment | 0 (0.0%) | 0 (0.0%) |
| Health Diagnosing & Treating | 0 (0.0%) | 2 (100.0%) |
| Health Technologists | 0 (0.0%) | 2 (100.0%) |
| Total (Category) | 0 (0.0%) | 3 (100.0%) |
| Total (Overall) | 11 (52.4%) | 10 (47.6%) |
Services Occupations
The most common Services occupations in Farwell are Security & Protection (1 | 4.8%), Firefighting & Prevention (1 | 4.8%), and Food Preparation & Serving (1 | 4.8%).
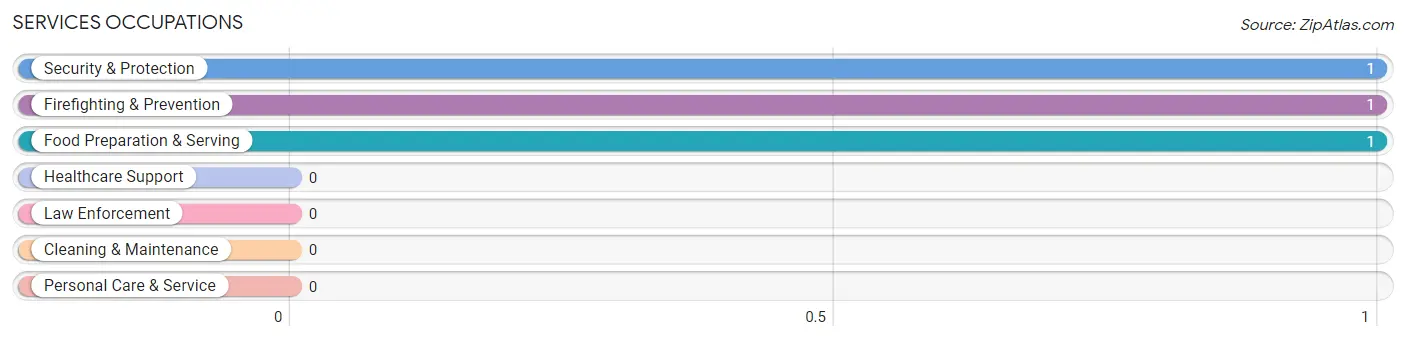
Services Occupations by Sex
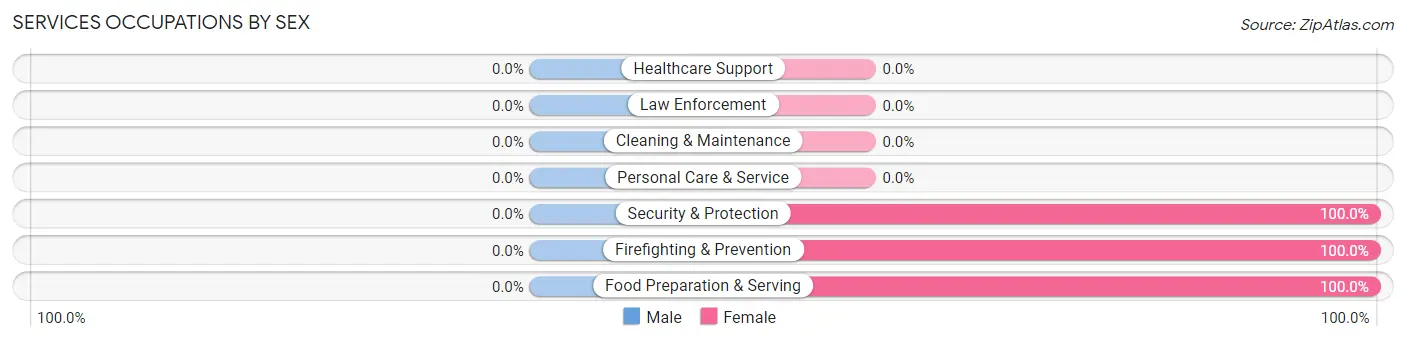
| Occupation | Male | Female |
| Healthcare Support | 0 (0.0%) | 0 (0.0%) |
| Security & Protection | 0 (0.0%) | 1 (100.0%) |
| Firefighting & Prevention | 0 (0.0%) | 1 (100.0%) |
| Law Enforcement | 0 (0.0%) | 0 (0.0%) |
| Food Preparation & Serving | 0 (0.0%) | 1 (100.0%) |
| Cleaning & Maintenance | 0 (0.0%) | 0 (0.0%) |
| Personal Care & Service | 0 (0.0%) | 0 (0.0%) |
| Total (Category) | 0 (0.0%) | 2 (100.0%) |
| Total (Overall) | 11 (52.4%) | 10 (47.6%) |
Sales and Office Occupations
The most common Sales and Office occupations in Farwell are , and Office & Administration (4 | 19.1%).

Sales and Office Occupations by Sex

| Occupation | Male | Female |
| Sales & Related | 0 (0.0%) | 0 (0.0%) |
| Office & Administration | 0 (0.0%) | 4 (100.0%) |
| Total (Category) | 0 (0.0%) | 4 (100.0%) |
| Total (Overall) | 11 (52.4%) | 10 (47.6%) |
Natural Resources, Construction and Maintenance Occupations

Natural Resources, Construction and Maintenance Occupations by Sex
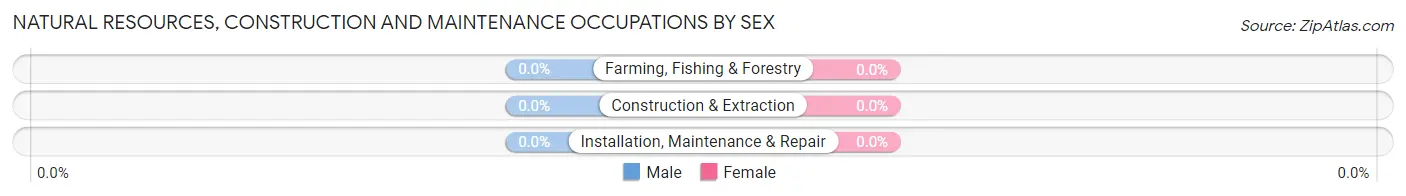
| Occupation | Male | Female |
| Farming, Fishing & Forestry | 0 (0.0%) | 0 (0.0%) |
| Construction & Extraction | 0 (0.0%) | 0 (0.0%) |
| Installation, Maintenance & Repair | 0 (0.0%) | 0 (0.0%) |
| Total (Category) | 0 (0.0%) | 0 (0.0%) |
| Total (Overall) | 11 (52.4%) | 10 (47.6%) |
Production, Transportation and Moving Occupations
The most common Production, Transportation and Moving occupations in Farwell are , and Production (12 | 57.1%).
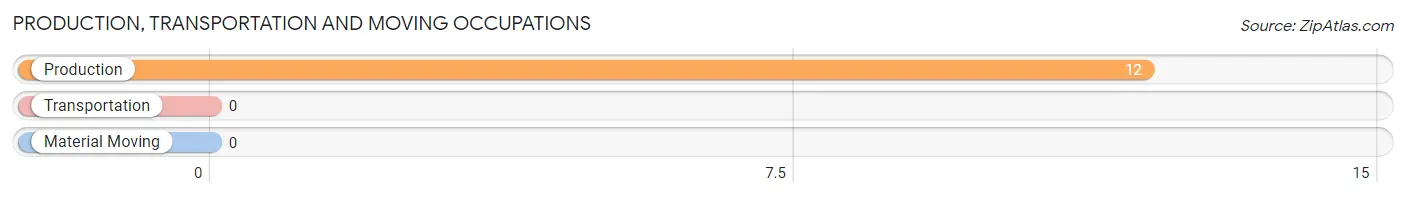
Production, Transportation and Moving Occupations by Sex
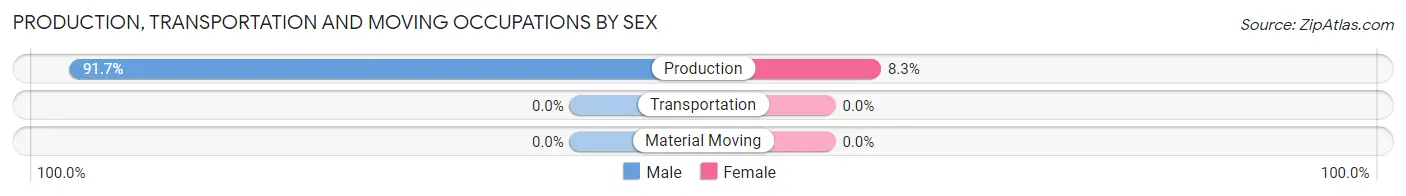
| Occupation | Male | Female |
| Production | 11 (91.7%) | 1 (8.3%) |
| Transportation | 0 (0.0%) | 0 (0.0%) |
| Material Moving | 0 (0.0%) | 0 (0.0%) |
| Total (Category) | 11 (91.7%) | 1 (8.3%) |
| Total (Overall) | 11 (52.4%) | 10 (47.6%) |
Employment Industries by Sex in Farwell
Employment Industries in Farwell
The major employment industries in Farwell include Manufacturing (12 | 57.1%), Finance & Insurance (4 | 19.1%), Health Care & Social Assistance (3 | 14.3%), Educational Services (1 | 4.8%), and Public Administration (1 | 4.8%).
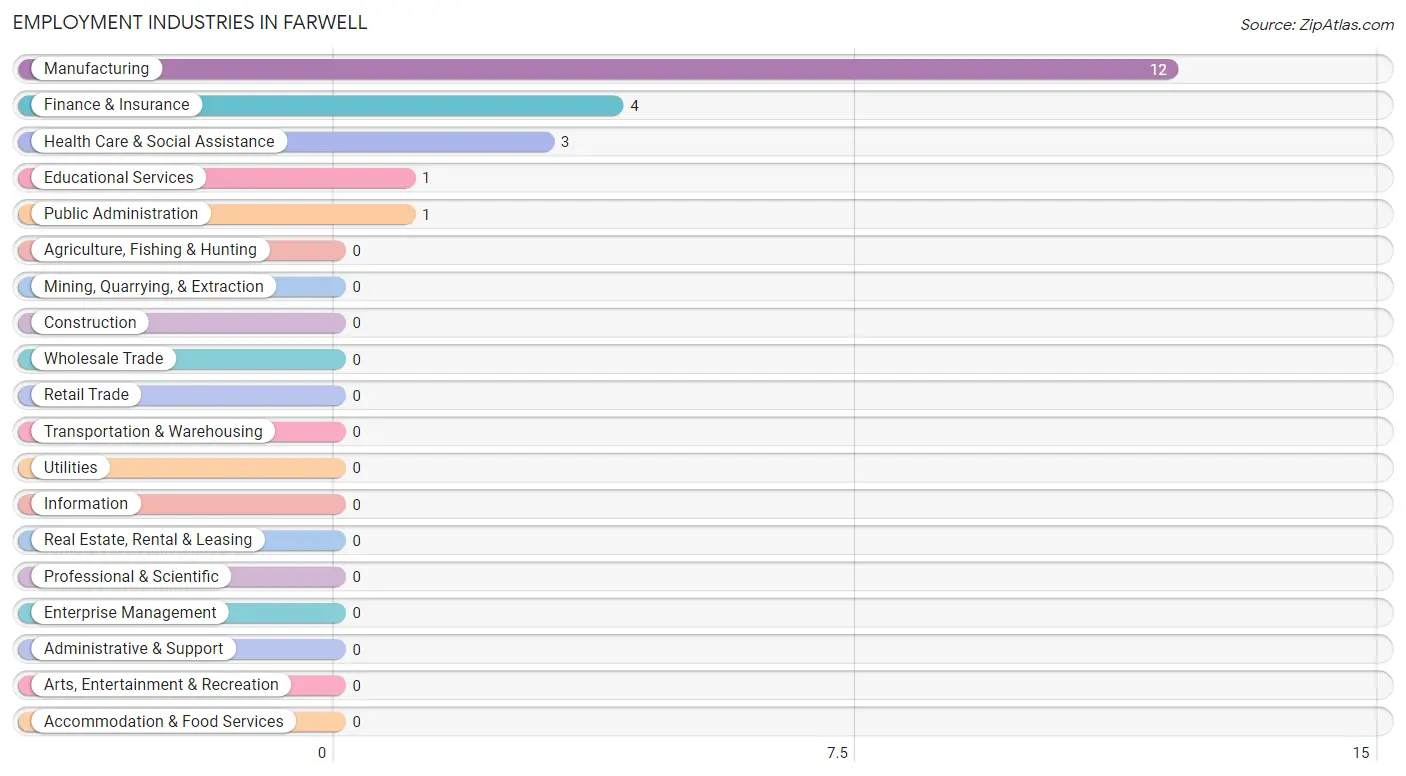
Employment Industries by Sex in Farwell
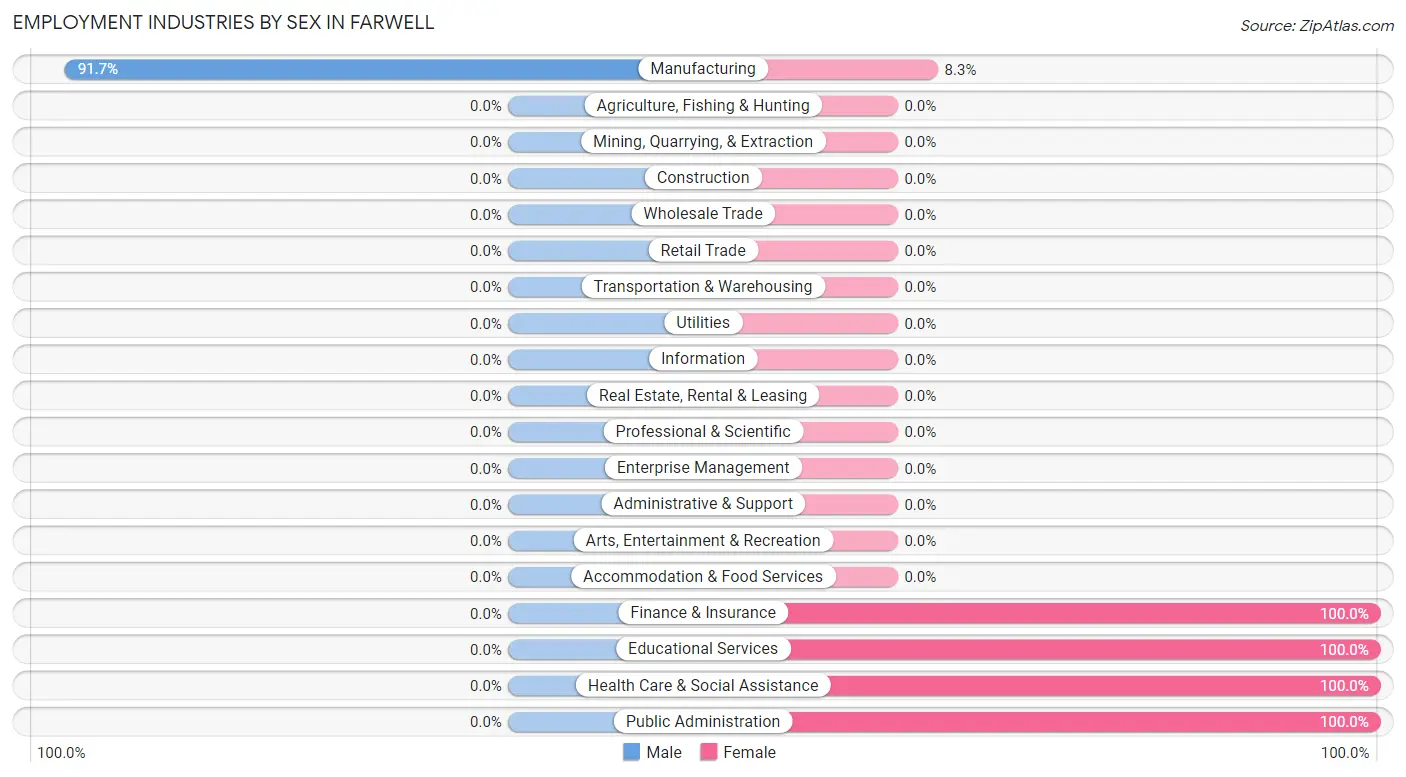
| Industry | Male | Female |
| Agriculture, Fishing & Hunting | 0 (0.0%) | 0 (0.0%) |
| Mining, Quarrying, & Extraction | 0 (0.0%) | 0 (0.0%) |
| Construction | 0 (0.0%) | 0 (0.0%) |
| Manufacturing | 11 (91.7%) | 1 (8.3%) |
| Wholesale Trade | 0 (0.0%) | 0 (0.0%) |
| Retail Trade | 0 (0.0%) | 0 (0.0%) |
| Transportation & Warehousing | 0 (0.0%) | 0 (0.0%) |
| Utilities | 0 (0.0%) | 0 (0.0%) |
| Information | 0 (0.0%) | 0 (0.0%) |
| Finance & Insurance | 0 (0.0%) | 4 (100.0%) |
| Real Estate, Rental & Leasing | 0 (0.0%) | 0 (0.0%) |
| Professional & Scientific | 0 (0.0%) | 0 (0.0%) |
| Enterprise Management | 0 (0.0%) | 0 (0.0%) |
| Administrative & Support | 0 (0.0%) | 0 (0.0%) |
| Educational Services | 0 (0.0%) | 1 (100.0%) |
| Health Care & Social Assistance | 0 (0.0%) | 3 (100.0%) |
| Arts, Entertainment & Recreation | 0 (0.0%) | 0 (0.0%) |
| Accommodation & Food Services | 0 (0.0%) | 0 (0.0%) |
| Public Administration | 0 (0.0%) | 1 (100.0%) |
| Total | 11 (52.4%) | 10 (47.6%) |
Education in Farwell
School Enrollment in Farwell
The most common levels of schooling among the 5 students in Farwell are middle school (3 | 60.0%), and high school (2 | 40.0%).
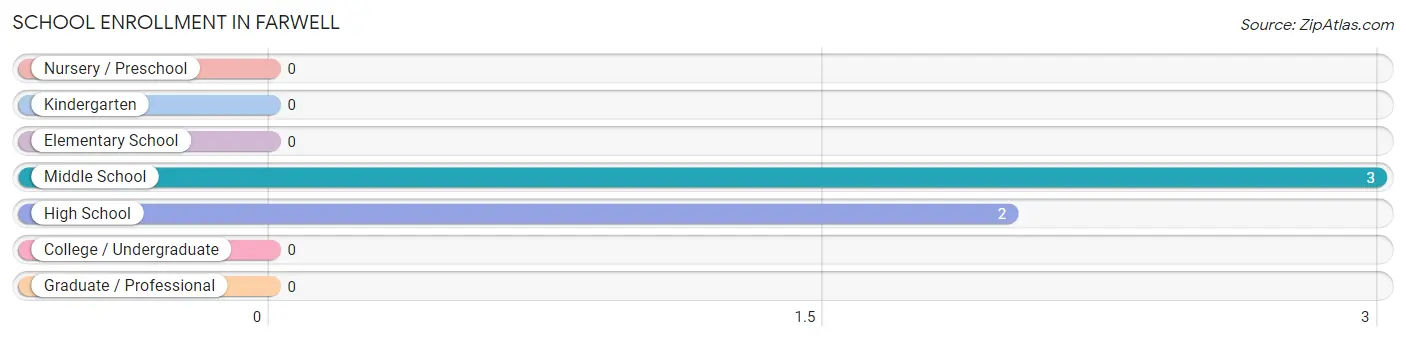
| School Level | # Students | % Students |
| Nursery / Preschool | 0 | 0.0% |
| Kindergarten | 0 | 0.0% |
| Elementary School | 0 | 0.0% |
| Middle School | 3 | 60.0% |
| High School | 2 | 40.0% |
| College / Undergraduate | 0 | 0.0% |
| Graduate / Professional | 0 | 0.0% |
| Total | 5 | 100.0% |
School Enrollment by Age by Funding Source in Farwell
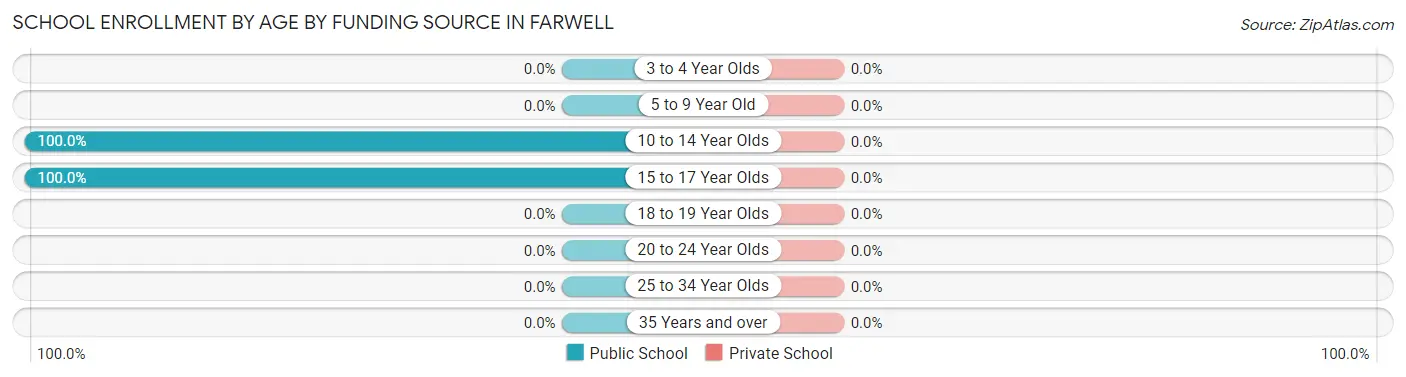
| Age Bracket | Public School | Private School |
| 3 to 4 Year Olds | 0 (0.0%) | 0 (0.0%) |
| 5 to 9 Year Old | 0 (0.0%) | 0 (0.0%) |
| 10 to 14 Year Olds | 4 (100.0%) | 0 (0.0%) |
| 15 to 17 Year Olds | 1 (100.0%) | 0 (0.0%) |
| 18 to 19 Year Olds | 0 (0.0%) | 0 (0.0%) |
| 20 to 24 Year Olds | 0 (0.0%) | 0 (0.0%) |
| 25 to 34 Year Olds | 0 (0.0%) | 0 (0.0%) |
| 35 Years and over | 0 (0.0%) | 0 (0.0%) |
| Total | 5 (100.0%) | 0 (0.0%) |
Educational Attainment by Field of Study in Farwell
Bio, nature & agricultural (1 | 33.3%), physical & health sciences (1 | 33.3%), and science & technology (1 | 33.3%) are the most common fields of study among 3 individuals in Farwell who have obtained a bachelor's degree or higher.
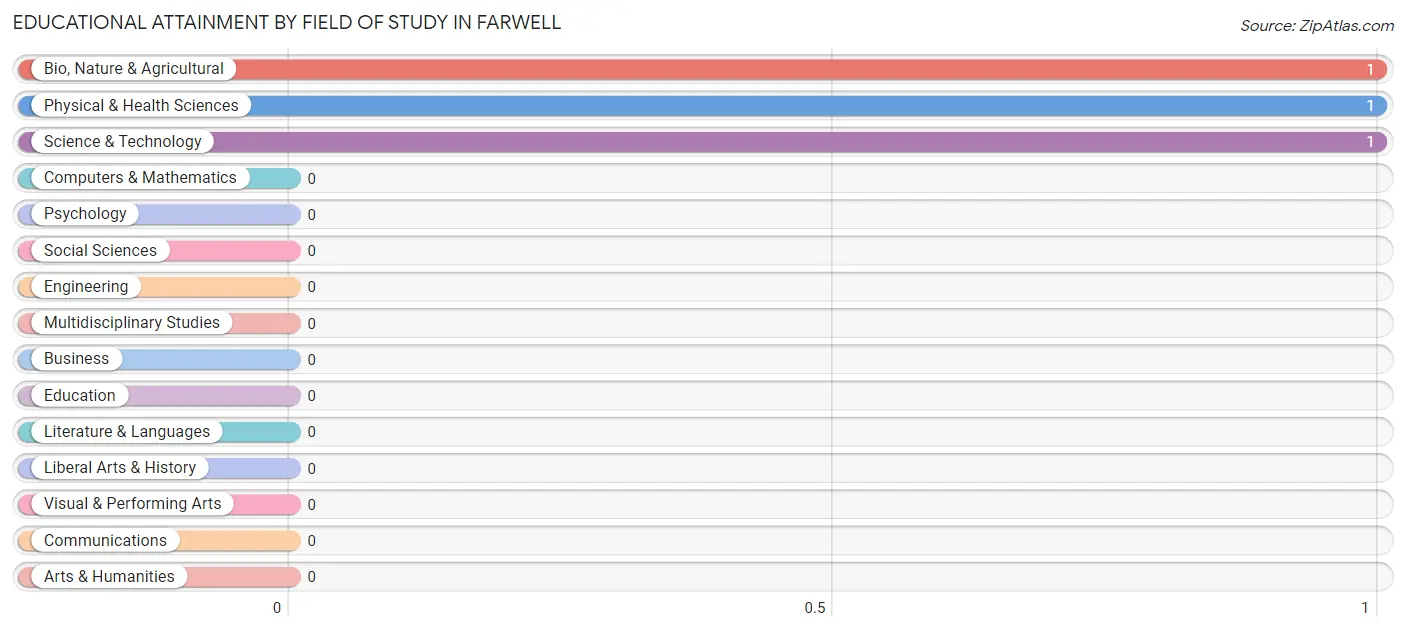
| Field of Study | # Graduates | % Graduates |
| Computers & Mathematics | 0 | 0.0% |
| Bio, Nature & Agricultural | 1 | 33.3% |
| Physical & Health Sciences | 1 | 33.3% |
| Psychology | 0 | 0.0% |
| Social Sciences | 0 | 0.0% |
| Engineering | 0 | 0.0% |
| Multidisciplinary Studies | 0 | 0.0% |
| Science & Technology | 1 | 33.3% |
| Business | 0 | 0.0% |
| Education | 0 | 0.0% |
| Literature & Languages | 0 | 0.0% |
| Liberal Arts & History | 0 | 0.0% |
| Visual & Performing Arts | 0 | 0.0% |
| Communications | 0 | 0.0% |
| Arts & Humanities | 0 | 0.0% |
| Total | 3 | 100.0% |
Transportation & Commute in Farwell
Vehicle Availability by Sex in Farwell
The most prevalent vehicle ownership categories in Farwell are males with 3 vehicles (6, accounting for 54.5%) and females with 3 vehicles (4, making up 60.0%).
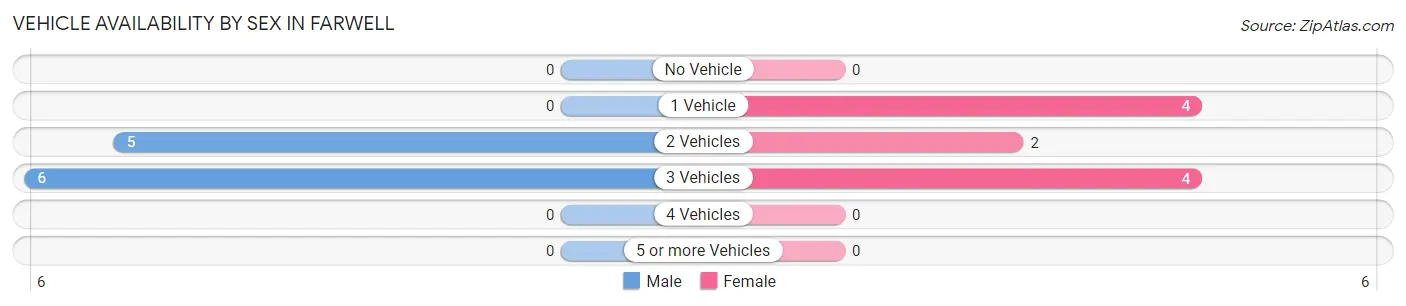
| Vehicles Available | Male | Female |
| No Vehicle | 0 (0.0%) | 0 (0.0%) |
| 1 Vehicle | 0 (0.0%) | 4 (40.0%) |
| 2 Vehicles | 5 (45.5%) | 2 (20.0%) |
| 3 Vehicles | 6 (54.5%) | 4 (40.0%) |
| 4 Vehicles | 0 (0.0%) | 0 (0.0%) |
| 5 or more Vehicles | 0 (0.0%) | 0 (0.0%) |
| Total | 11 (100.0%) | 10 (100.0%) |
Commute Time in Farwell
The most frequently occuring commute durations in Farwell are 25 to 29 minutes (11 commuters, 52.4%), 20 to 24 minutes (5 commuters, 23.8%), and 40 to 44 minutes (2 commuters, 9.5%).
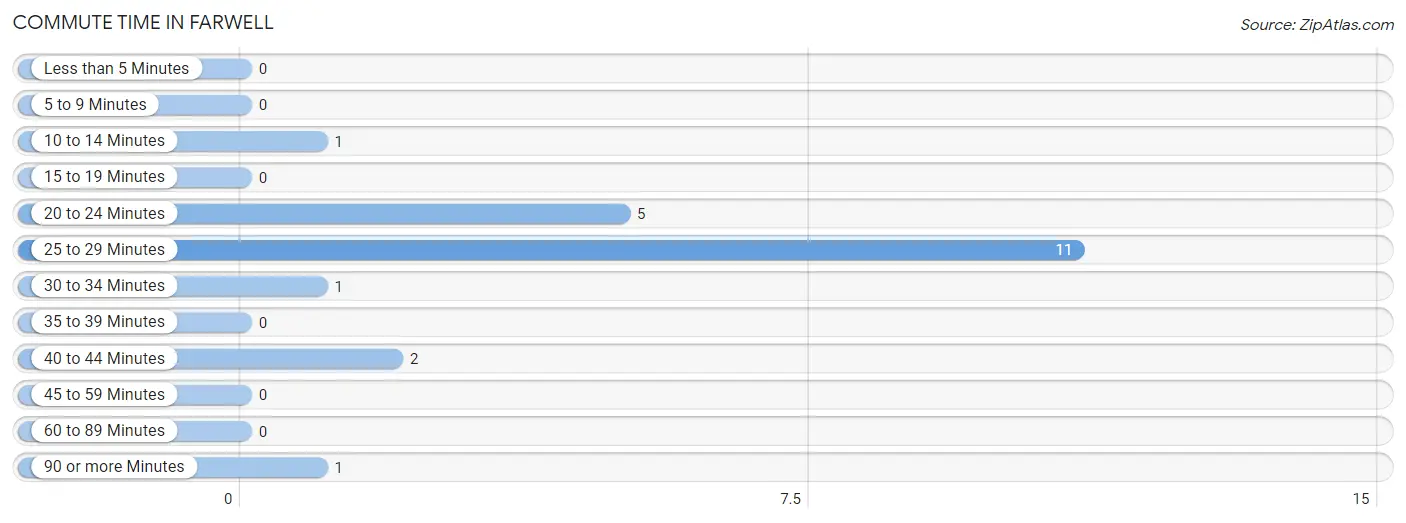
| Commute Time | # Commuters | % Commuters |
| Less than 5 Minutes | 0 | 0.0% |
| 5 to 9 Minutes | 0 | 0.0% |
| 10 to 14 Minutes | 1 | 4.8% |
| 15 to 19 Minutes | 0 | 0.0% |
| 20 to 24 Minutes | 5 | 23.8% |
| 25 to 29 Minutes | 11 | 52.4% |
| 30 to 34 Minutes | 1 | 4.8% |
| 35 to 39 Minutes | 0 | 0.0% |
| 40 to 44 Minutes | 2 | 9.5% |
| 45 to 59 Minutes | 0 | 0.0% |
| 60 to 89 Minutes | 0 | 0.0% |
| 90 or more Minutes | 1 | 4.8% |
Commute Time by Sex in Farwell
The most common commute times in Farwell are 25 to 29 minutes (6 commuters, 54.5%) for males and 25 to 29 minutes (5 commuters, 50.0%) for females.
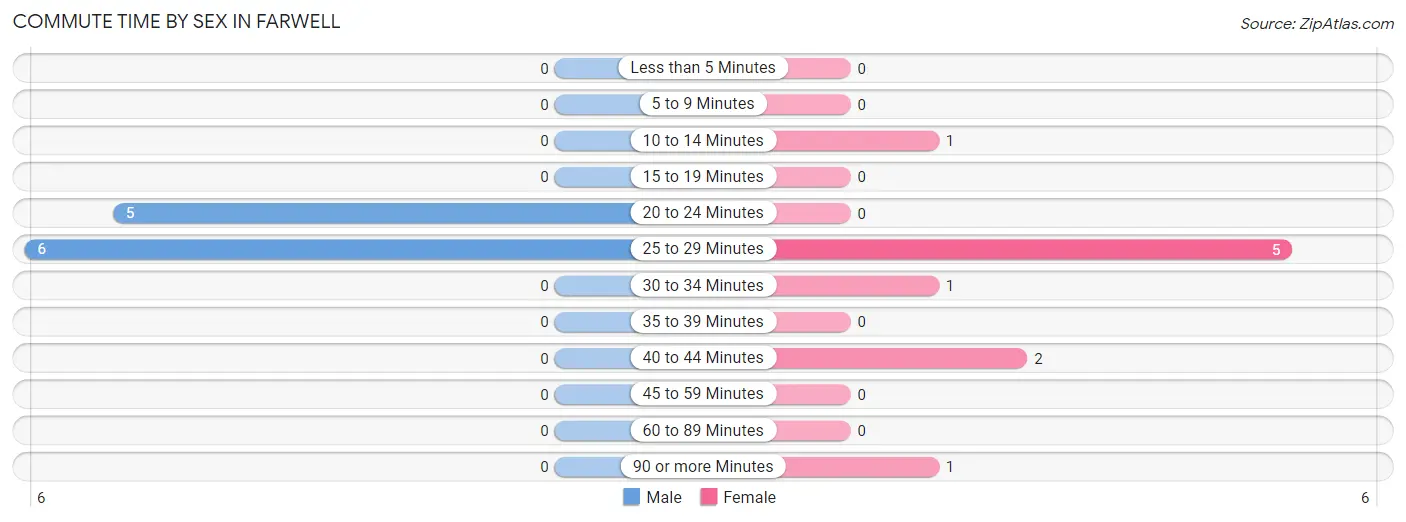
| Commute Time | Male | Female |
| Less than 5 Minutes | 0 (0.0%) | 0 (0.0%) |
| 5 to 9 Minutes | 0 (0.0%) | 0 (0.0%) |
| 10 to 14 Minutes | 0 (0.0%) | 1 (10.0%) |
| 15 to 19 Minutes | 0 (0.0%) | 0 (0.0%) |
| 20 to 24 Minutes | 5 (45.5%) | 0 (0.0%) |
| 25 to 29 Minutes | 6 (54.5%) | 5 (50.0%) |
| 30 to 34 Minutes | 0 (0.0%) | 1 (10.0%) |
| 35 to 39 Minutes | 0 (0.0%) | 0 (0.0%) |
| 40 to 44 Minutes | 0 (0.0%) | 2 (20.0%) |
| 45 to 59 Minutes | 0 (0.0%) | 0 (0.0%) |
| 60 to 89 Minutes | 0 (0.0%) | 0 (0.0%) |
| 90 or more Minutes | 0 (0.0%) | 1 (10.0%) |
Time of Departure to Work by Sex in Farwell
The most frequent times of departure to work in Farwell are 5:00 AM to 5:29 AM (6, 54.5%) for males and 7:30 AM to 7:59 AM (5, 50.0%) for females.
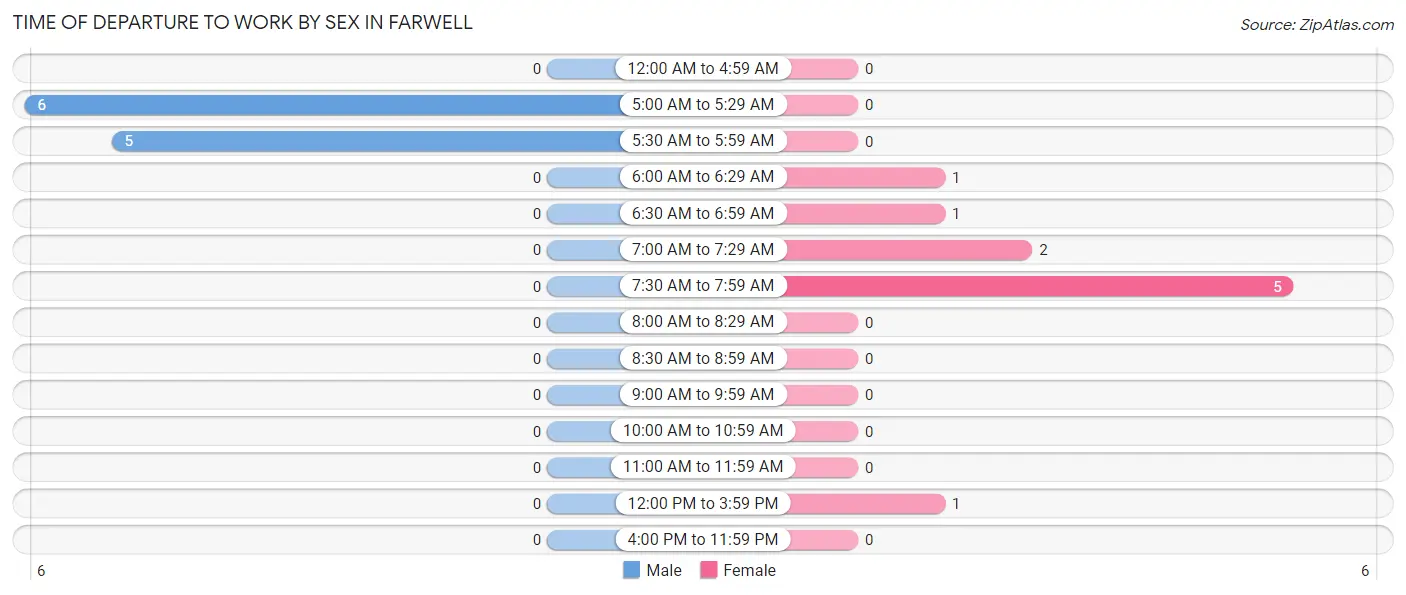
| Time of Departure | Male | Female |
| 12:00 AM to 4:59 AM | 0 (0.0%) | 0 (0.0%) |
| 5:00 AM to 5:29 AM | 6 (54.5%) | 0 (0.0%) |
| 5:30 AM to 5:59 AM | 5 (45.5%) | 0 (0.0%) |
| 6:00 AM to 6:29 AM | 0 (0.0%) | 1 (10.0%) |
| 6:30 AM to 6:59 AM | 0 (0.0%) | 1 (10.0%) |
| 7:00 AM to 7:29 AM | 0 (0.0%) | 2 (20.0%) |
| 7:30 AM to 7:59 AM | 0 (0.0%) | 5 (50.0%) |
| 8:00 AM to 8:29 AM | 0 (0.0%) | 0 (0.0%) |
| 8:30 AM to 8:59 AM | 0 (0.0%) | 0 (0.0%) |
| 9:00 AM to 9:59 AM | 0 (0.0%) | 0 (0.0%) |
| 10:00 AM to 10:59 AM | 0 (0.0%) | 0 (0.0%) |
| 11:00 AM to 11:59 AM | 0 (0.0%) | 0 (0.0%) |
| 12:00 PM to 3:59 PM | 0 (0.0%) | 1 (10.0%) |
| 4:00 PM to 11:59 PM | 0 (0.0%) | 0 (0.0%) |
| Total | 11 (100.0%) | 10 (100.0%) |
Housing Occupancy in Farwell
Occupancy by Ownership in Farwell
Of the total 23 dwellings in Farwell, owner-occupied units account for 21 (91.3%), while renter-occupied units make up 2 (8.7%).
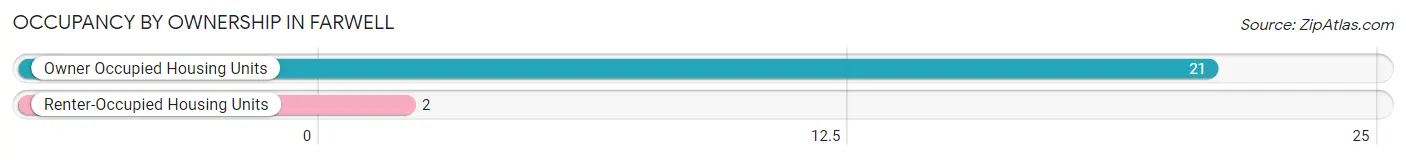
| Occupancy | # Housing Units | % Housing Units |
| Owner Occupied Housing Units | 21 | 91.3% |
| Renter-Occupied Housing Units | 2 | 8.7% |
| Total Occupied Housing Units | 23 | 100.0% |
Occupancy by Household Size in Farwell
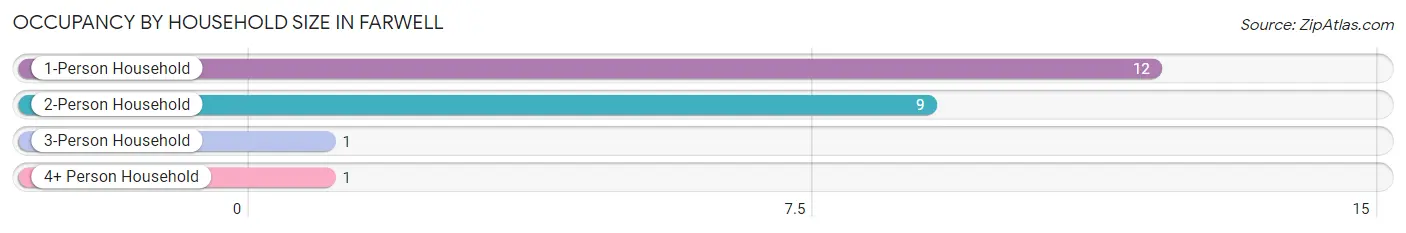
| Household Size | # Housing Units | % Housing Units |
| 1-Person Household | 12 | 52.2% |
| 2-Person Household | 9 | 39.1% |
| 3-Person Household | 1 | 4.3% |
| 4+ Person Household | 1 | 4.3% |
| Total Housing Units | 23 | 100.0% |
Occupancy by Ownership by Household Size in Farwell
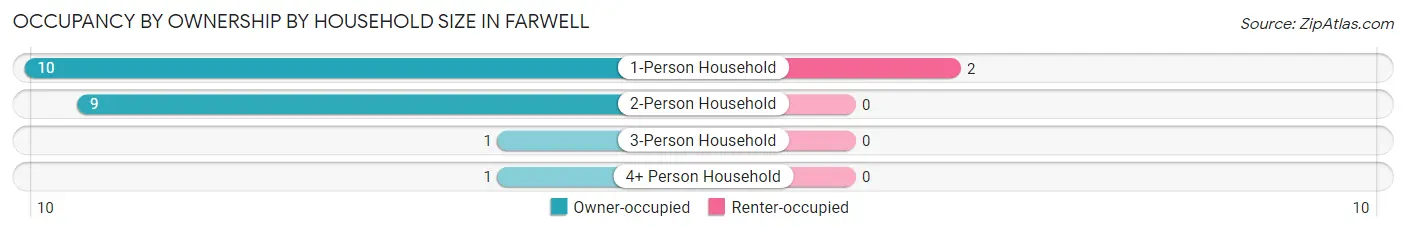
| Household Size | Owner-occupied | Renter-occupied |
| 1-Person Household | 10 (83.3%) | 2 (16.7%) |
| 2-Person Household | 9 (100.0%) | 0 (0.0%) |
| 3-Person Household | 1 (100.0%) | 0 (0.0%) |
| 4+ Person Household | 1 (100.0%) | 0 (0.0%) |
| Total Housing Units | 21 (91.3%) | 2 (8.7%) |
Occupancy by Educational Attainment in Farwell
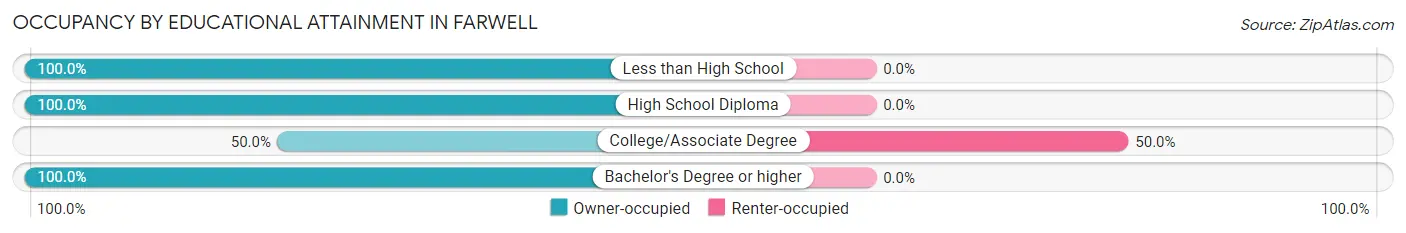
| Household Size | Owner-occupied | Renter-occupied |
| Less than High School | 2 (100.0%) | 0 (0.0%) |
| High School Diploma | 14 (100.0%) | 0 (0.0%) |
| College/Associate Degree | 2 (50.0%) | 2 (50.0%) |
| Bachelor's Degree or higher | 3 (100.0%) | 0 (0.0%) |
Occupancy by Age of Householder in Farwell
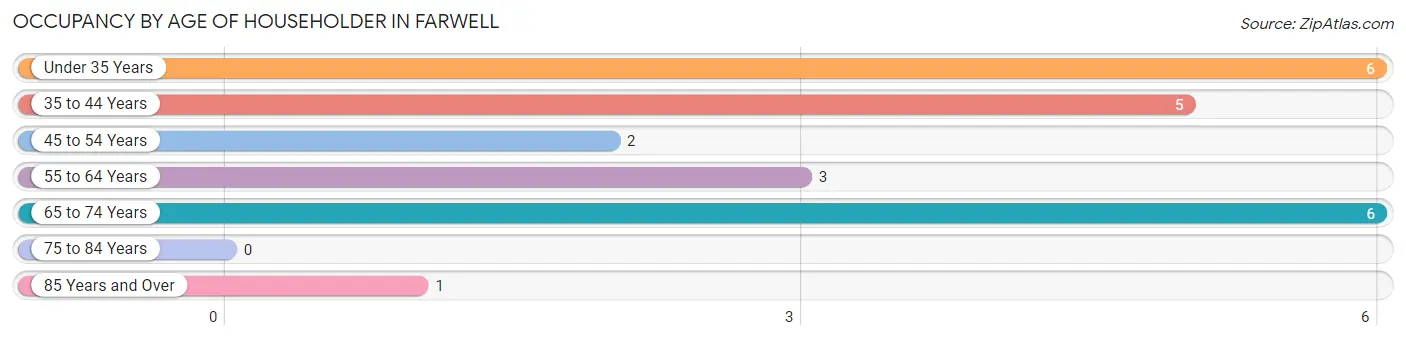
| Age Bracket | # Households | % Households |
| Under 35 Years | 6 | 26.1% |
| 35 to 44 Years | 5 | 21.7% |
| 45 to 54 Years | 2 | 8.7% |
| 55 to 64 Years | 3 | 13.0% |
| 65 to 74 Years | 6 | 26.1% |
| 75 to 84 Years | 0 | 0.0% |
| 85 Years and Over | 1 | 4.3% |
| Total | 23 | 100.0% |
Housing Finances in Farwell
Median Income by Occupancy in Farwell
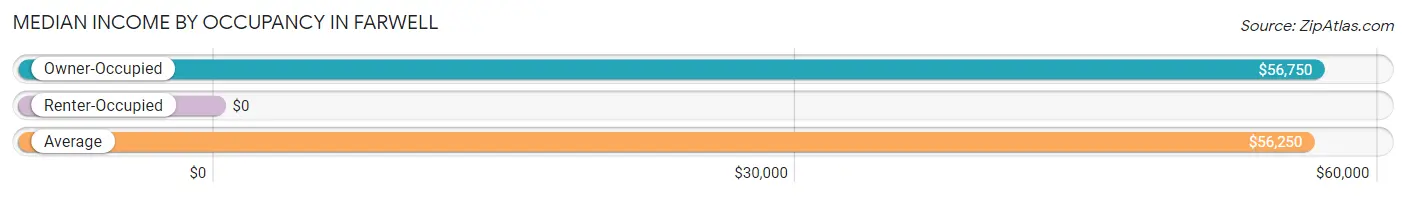
| Occupancy Type | # Households | Median Income |
| Owner-Occupied | 21 (91.3%) | $56,750 |
| Renter-Occupied | 2 (8.7%) | $0 |
| Average | 23 (100.0%) | $56,250 |
Occupancy by Householder Income Bracket in Farwell
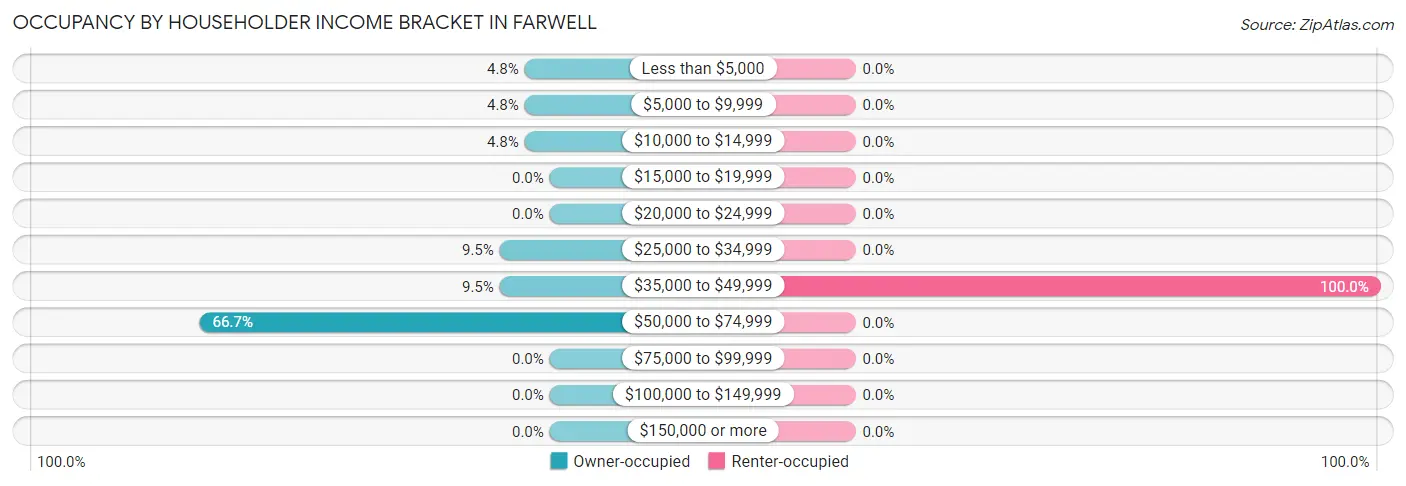
| Income Bracket | Owner-occupied | Renter-occupied |
| Less than $5,000 | 1 (4.8%) | 0 (0.0%) |
| $5,000 to $9,999 | 1 (4.8%) | 0 (0.0%) |
| $10,000 to $14,999 | 1 (4.8%) | 0 (0.0%) |
| $15,000 to $19,999 | 0 (0.0%) | 0 (0.0%) |
| $20,000 to $24,999 | 0 (0.0%) | 0 (0.0%) |
| $25,000 to $34,999 | 2 (9.5%) | 0 (0.0%) |
| $35,000 to $49,999 | 2 (9.5%) | 2 (100.0%) |
| $50,000 to $74,999 | 14 (66.7%) | 0 (0.0%) |
| $75,000 to $99,999 | 0 (0.0%) | 0 (0.0%) |
| $100,000 to $149,999 | 0 (0.0%) | 0 (0.0%) |
| $150,000 or more | 0 (0.0%) | 0 (0.0%) |
| Total | 21 (100.0%) | 2 (100.0%) |
Monthly Housing Cost Tiers in Farwell
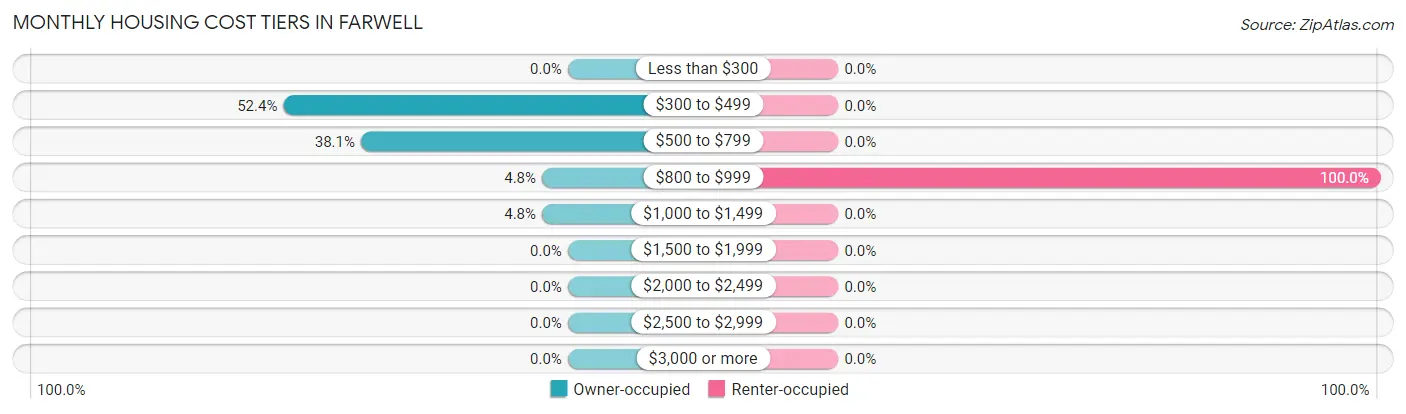
| Monthly Cost | Owner-occupied | Renter-occupied |
| Less than $300 | 0 (0.0%) | 0 (0.0%) |
| $300 to $499 | 11 (52.4%) | 0 (0.0%) |
| $500 to $799 | 8 (38.1%) | 0 (0.0%) |
| $800 to $999 | 1 (4.8%) | 2 (100.0%) |
| $1,000 to $1,499 | 1 (4.8%) | 0 (0.0%) |
| $1,500 to $1,999 | 0 (0.0%) | 0 (0.0%) |
| $2,000 to $2,499 | 0 (0.0%) | 0 (0.0%) |
| $2,500 to $2,999 | 0 (0.0%) | 0 (0.0%) |
| $3,000 or more | 0 (0.0%) | 0 (0.0%) |
| Total | 21 (100.0%) | 2 (100.0%) |
Physical Housing Characteristics in Farwell
Housing Structures in Farwell
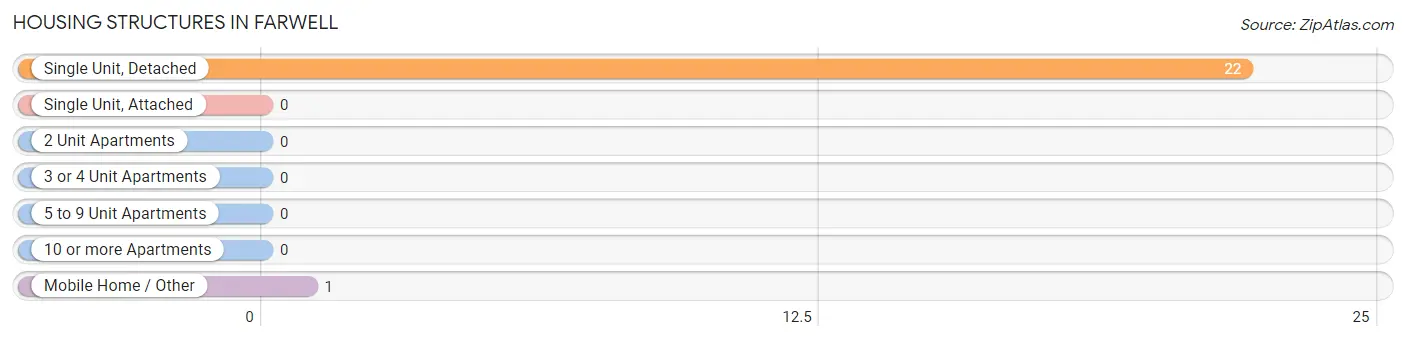
| Structure Type | # Housing Units | % Housing Units |
| Single Unit, Detached | 22 | 95.7% |
| Single Unit, Attached | 0 | 0.0% |
| 2 Unit Apartments | 0 | 0.0% |
| 3 or 4 Unit Apartments | 0 | 0.0% |
| 5 to 9 Unit Apartments | 0 | 0.0% |
| 10 or more Apartments | 0 | 0.0% |
| Mobile Home / Other | 1 | 4.3% |
| Total | 23 | 100.0% |
Housing Structures by Occupancy in Farwell
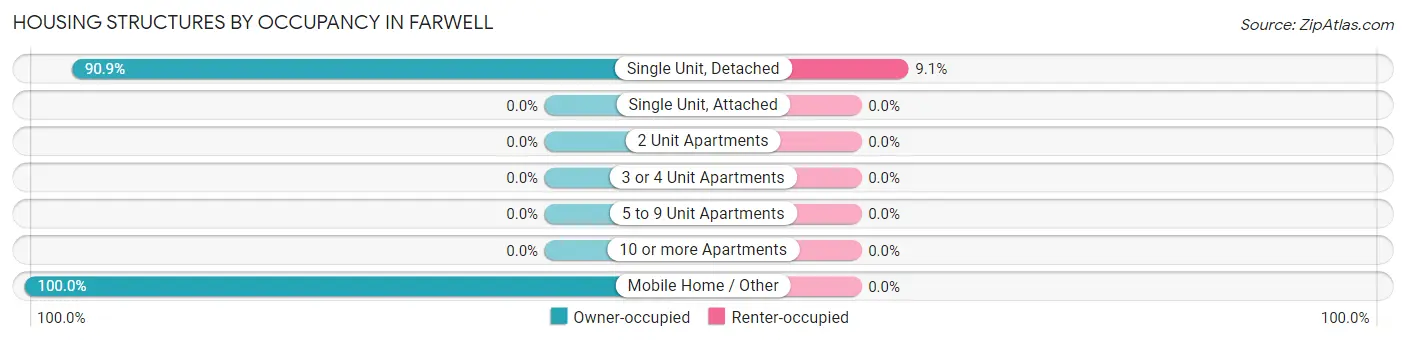
| Structure Type | Owner-occupied | Renter-occupied |
| Single Unit, Detached | 20 (90.9%) | 2 (9.1%) |
| Single Unit, Attached | 0 (0.0%) | 0 (0.0%) |
| 2 Unit Apartments | 0 (0.0%) | 0 (0.0%) |
| 3 or 4 Unit Apartments | 0 (0.0%) | 0 (0.0%) |
| 5 to 9 Unit Apartments | 0 (0.0%) | 0 (0.0%) |
| 10 or more Apartments | 0 (0.0%) | 0 (0.0%) |
| Mobile Home / Other | 1 (100.0%) | 0 (0.0%) |
| Total | 21 (91.3%) | 2 (8.7%) |
Housing Structures by Number of Rooms in Farwell
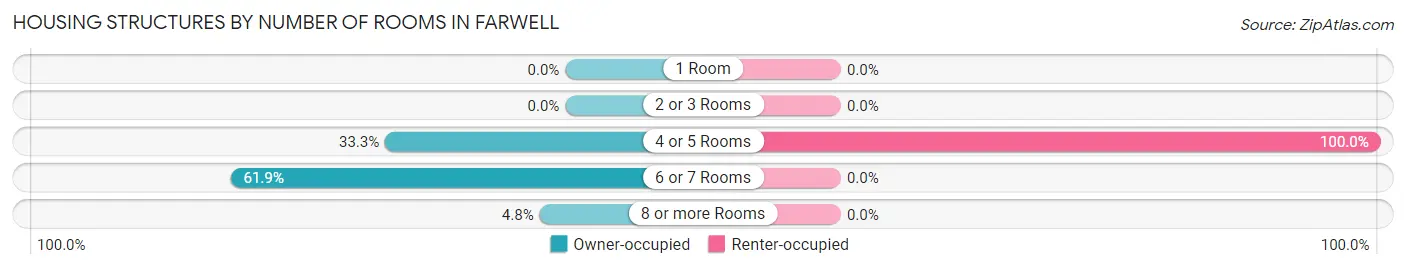
| Number of Rooms | Owner-occupied | Renter-occupied |
| 1 Room | 0 (0.0%) | 0 (0.0%) |
| 2 or 3 Rooms | 0 (0.0%) | 0 (0.0%) |
| 4 or 5 Rooms | 7 (33.3%) | 2 (100.0%) |
| 6 or 7 Rooms | 13 (61.9%) | 0 (0.0%) |
| 8 or more Rooms | 1 (4.8%) | 0 (0.0%) |
| Total | 21 (100.0%) | 2 (100.0%) |
Housing Structure by Heating Type in Farwell
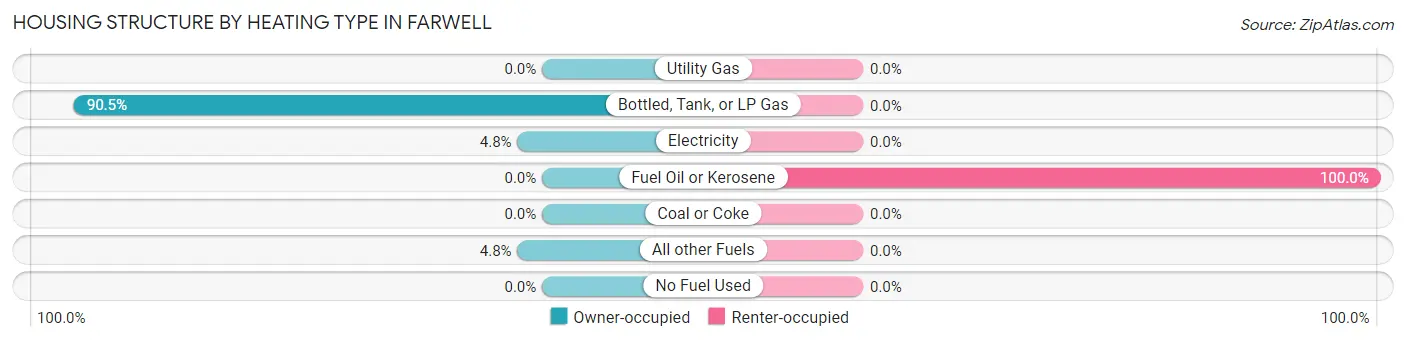
| Heating Type | Owner-occupied | Renter-occupied |
| Utility Gas | 0 (0.0%) | 0 (0.0%) |
| Bottled, Tank, or LP Gas | 19 (90.5%) | 0 (0.0%) |
| Electricity | 1 (4.8%) | 0 (0.0%) |
| Fuel Oil or Kerosene | 0 (0.0%) | 2 (100.0%) |
| Coal or Coke | 0 (0.0%) | 0 (0.0%) |
| All other Fuels | 1 (4.8%) | 0 (0.0%) |
| No Fuel Used | 0 (0.0%) | 0 (0.0%) |
| Total | 21 (100.0%) | 2 (100.0%) |
Household Vehicle Usage in Farwell
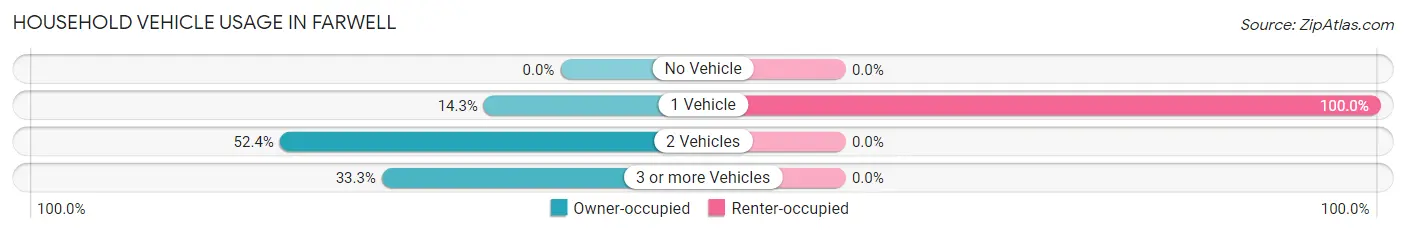
| Vehicles per Household | Owner-occupied | Renter-occupied |
| No Vehicle | 0 (0.0%) | 0 (0.0%) |
| 1 Vehicle | 3 (14.3%) | 2 (100.0%) |
| 2 Vehicles | 11 (52.4%) | 0 (0.0%) |
| 3 or more Vehicles | 7 (33.3%) | 0 (0.0%) |
| Total | 21 (100.0%) | 2 (100.0%) |
Real Estate & Mortgages in Farwell
Real Estate and Mortgage Overview in Farwell
| Characteristic | Without Mortgage | With Mortgage |
| Housing Units | 17 | 4 |
| Median Property Value | - | - |
| Median Household Income | $56,250 | $0 |
| Monthly Housing Costs | $375 | $0 |
| Real Estate Taxes | $1,159 | $0 |
Property Value by Mortgage Status in Farwell
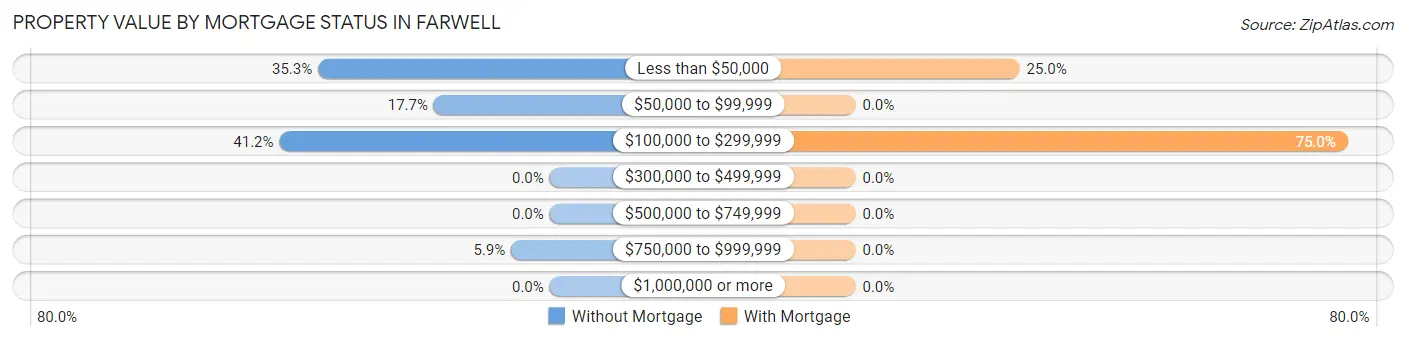
| Property Value | Without Mortgage | With Mortgage |
| Less than $50,000 | 6 (35.3%) | 1 (25.0%) |
| $50,000 to $99,999 | 3 (17.6%) | 0 (0.0%) |
| $100,000 to $299,999 | 7 (41.2%) | 3 (75.0%) |
| $300,000 to $499,999 | 0 (0.0%) | 0 (0.0%) |
| $500,000 to $749,999 | 0 (0.0%) | 0 (0.0%) |
| $750,000 to $999,999 | 1 (5.9%) | 0 (0.0%) |
| $1,000,000 or more | 0 (0.0%) | 0 (0.0%) |
| Total | 17 (100.0%) | 4 (100.0%) |
Household Income by Mortgage Status in Farwell
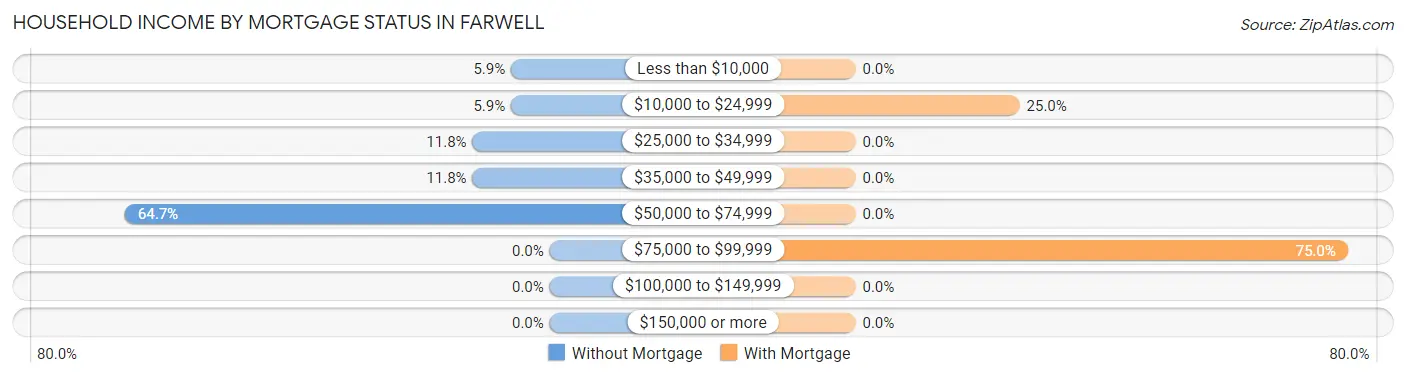
| Household Income | Without Mortgage | With Mortgage |
| Less than $10,000 | 1 (5.9%) | 0 (0.0%) |
| $10,000 to $24,999 | 1 (5.9%) | 1 (25.0%) |
| $25,000 to $34,999 | 2 (11.8%) | 0 (0.0%) |
| $35,000 to $49,999 | 2 (11.8%) | 0 (0.0%) |
| $50,000 to $74,999 | 11 (64.7%) | 0 (0.0%) |
| $75,000 to $99,999 | 0 (0.0%) | 3 (75.0%) |
| $100,000 to $149,999 | 0 (0.0%) | 0 (0.0%) |
| $150,000 or more | 0 (0.0%) | 0 (0.0%) |
| Total | 17 (100.0%) | 4 (100.0%) |
Property Value to Household Income Ratio in Farwell
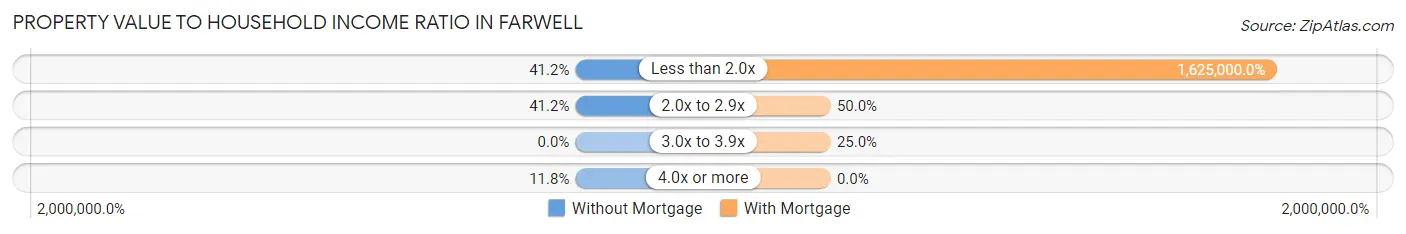
| Value-to-Income Ratio | Without Mortgage | With Mortgage |
| Less than 2.0x | 7 (41.2%) | 65,000 (1,625,000.0%) |
| 2.0x to 2.9x | 7 (41.2%) | 2 (50.0%) |
| 3.0x to 3.9x | 0 (0.0%) | 1 (25.0%) |
| 4.0x or more | 2 (11.8%) | 0 (0.0%) |
| Total | 17 (100.0%) | 4 (100.0%) |
Real Estate Taxes by Mortgage Status in Farwell
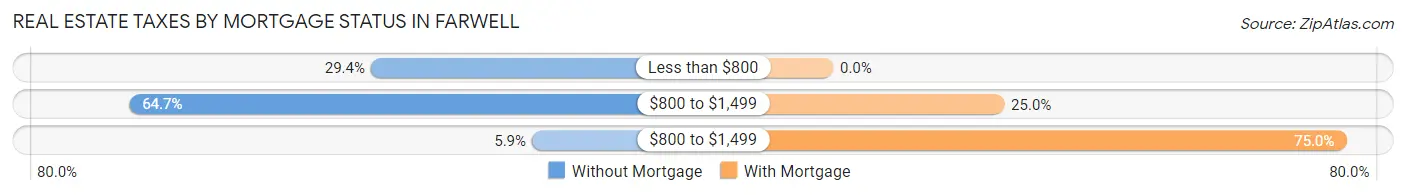
| Property Taxes | Without Mortgage | With Mortgage |
| Less than $800 | 5 (29.4%) | 0 (0.0%) |
| $800 to $1,499 | 11 (64.7%) | 1 (25.0%) |
| $800 to $1,499 | 1 (5.9%) | 3 (75.0%) |
| Total | 17 (100.0%) | 4 (100.0%) |
Health & Disability in Farwell
Health Insurance Coverage by Age in Farwell
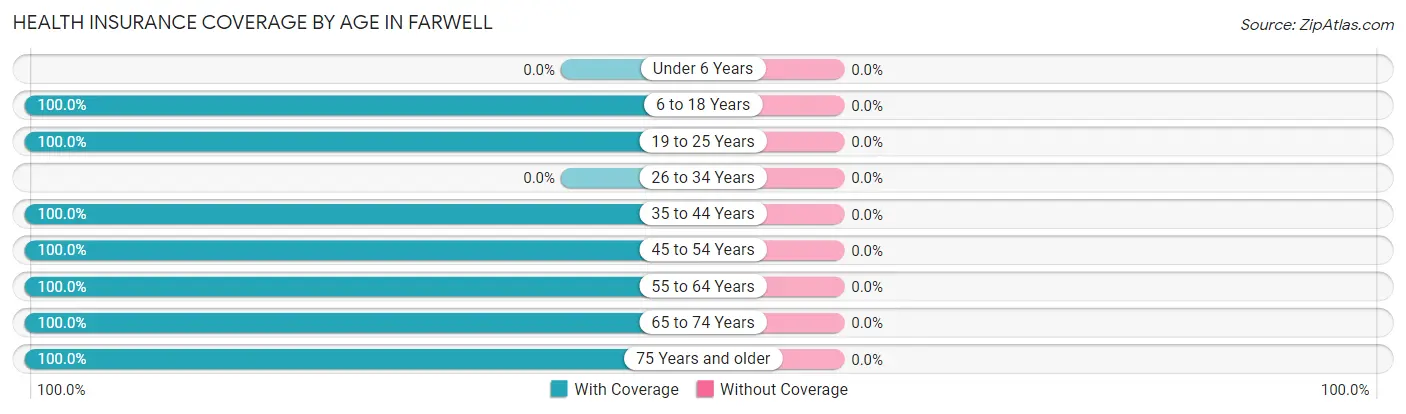
| Age Bracket | With Coverage | Without Coverage |
| Under 6 Years | 0 (0.0%) | 0 (0.0%) |
| 6 to 18 Years | 6 (100.0%) | 0 (0.0%) |
| 19 to 25 Years | 10 (100.0%) | 0 (0.0%) |
| 26 to 34 Years | 0 (0.0%) | 0 (0.0%) |
| 35 to 44 Years | 5 (100.0%) | 0 (0.0%) |
| 45 to 54 Years | 4 (100.0%) | 0 (0.0%) |
| 55 to 64 Years | 3 (100.0%) | 0 (0.0%) |
| 65 to 74 Years | 7 (100.0%) | 0 (0.0%) |
| 75 Years and older | 1 (100.0%) | 0 (0.0%) |
| Total | 36 (100.0%) | 0 (0.0%) |
Health Insurance Coverage by Citizenship Status in Farwell
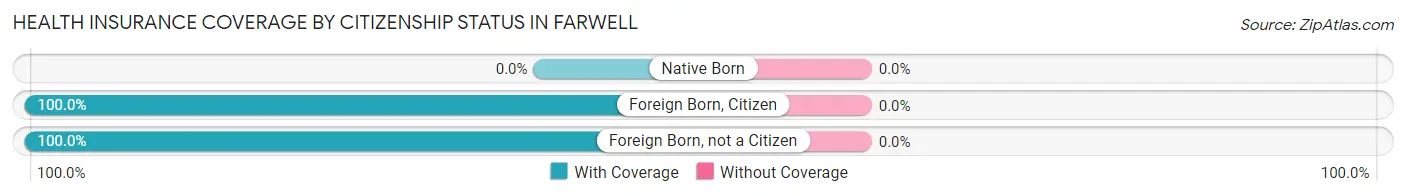
| Citizenship Status | With Coverage | Without Coverage |
| Native Born | 0 (0.0%) | 0 (0.0%) |
| Foreign Born, Citizen | 6 (100.0%) | 0 (0.0%) |
| Foreign Born, not a Citizen | 10 (100.0%) | 0 (0.0%) |
Health Insurance Coverage by Household Income in Farwell
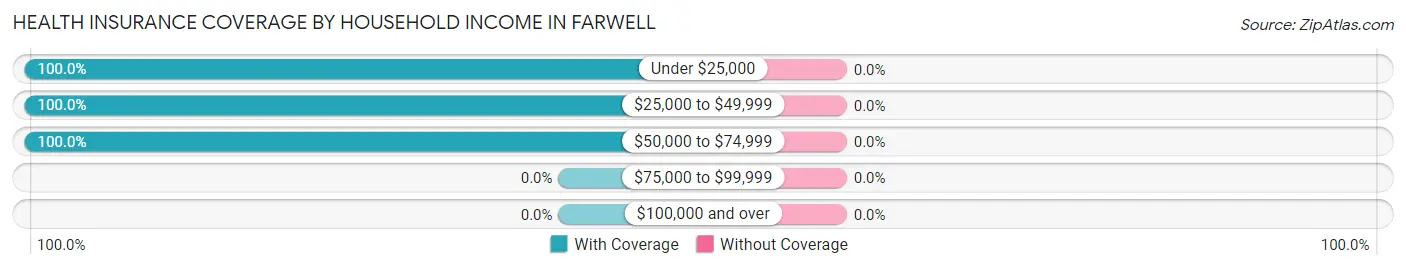
| Household Income | With Coverage | Without Coverage |
| Under $25,000 | 9 (100.0%) | 0 (0.0%) |
| $25,000 to $49,999 | 9 (100.0%) | 0 (0.0%) |
| $50,000 to $74,999 | 18 (100.0%) | 0 (0.0%) |
| $75,000 to $99,999 | 0 (0.0%) | 0 (0.0%) |
| $100,000 and over | 0 (0.0%) | 0 (0.0%) |
Public vs Private Health Insurance Coverage by Age in Farwell
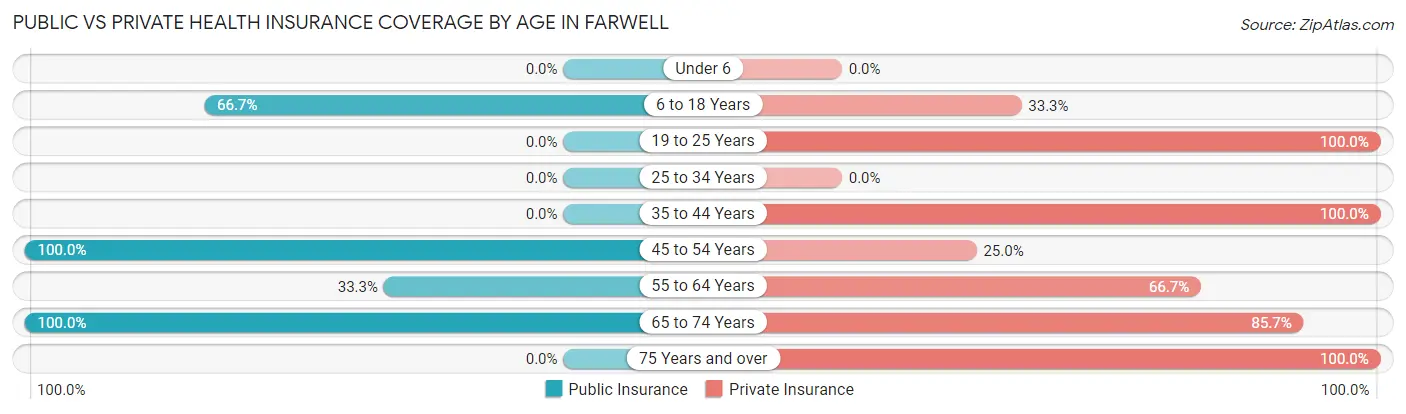
| Age Bracket | Public Insurance | Private Insurance |
| Under 6 | 0 (0.0%) | 0 (0.0%) |
| 6 to 18 Years | 4 (66.7%) | 2 (33.3%) |
| 19 to 25 Years | 0 (0.0%) | 10 (100.0%) |
| 25 to 34 Years | 0 (0.0%) | 0 (0.0%) |
| 35 to 44 Years | 0 (0.0%) | 5 (100.0%) |
| 45 to 54 Years | 4 (100.0%) | 1 (25.0%) |
| 55 to 64 Years | 1 (33.3%) | 2 (66.7%) |
| 65 to 74 Years | 7 (100.0%) | 6 (85.7%) |
| 75 Years and over | 0 (0.0%) | 1 (100.0%) |
| Total | 16 (44.4%) | 27 (75.0%) |
Disability Status by Sex by Age in Farwell
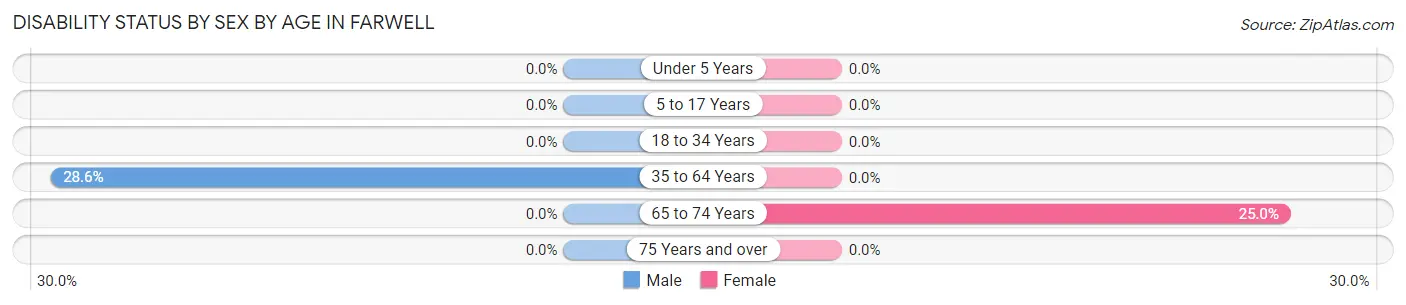
| Age Bracket | Male | Female |
| Under 5 Years | 0 (0.0%) | 0 (0.0%) |
| 5 to 17 Years | 0 (0.0%) | 0 (0.0%) |
| 18 to 34 Years | 0 (0.0%) | 0 (0.0%) |
| 35 to 64 Years | 2 (28.6%) | 0 (0.0%) |
| 65 to 74 Years | 0 (0.0%) | 1 (25.0%) |
| 75 Years and over | 0 (0.0%) | 0 (0.0%) |
Disability Class by Sex by Age in Farwell
Disability Class: Hearing Difficulty
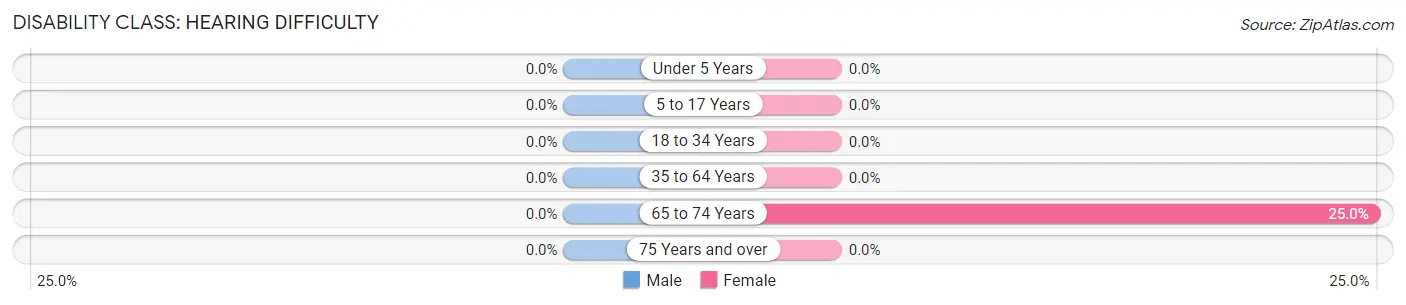
| Age Bracket | Male | Female |
| Under 5 Years | 0 (0.0%) | 0 (0.0%) |
| 5 to 17 Years | 0 (0.0%) | 0 (0.0%) |
| 18 to 34 Years | 0 (0.0%) | 0 (0.0%) |
| 35 to 64 Years | 0 (0.0%) | 0 (0.0%) |
| 65 to 74 Years | 0 (0.0%) | 1 (25.0%) |
| 75 Years and over | 0 (0.0%) | 0 (0.0%) |
Disability Class: Vision Difficulty
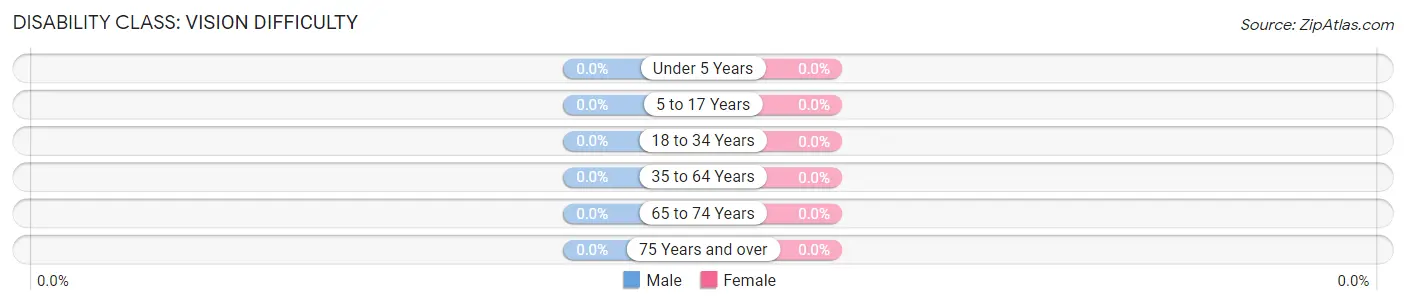
| Age Bracket | Male | Female |
| Under 5 Years | 0 (0.0%) | 0 (0.0%) |
| 5 to 17 Years | 0 (0.0%) | 0 (0.0%) |
| 18 to 34 Years | 0 (0.0%) | 0 (0.0%) |
| 35 to 64 Years | 0 (0.0%) | 0 (0.0%) |
| 65 to 74 Years | 0 (0.0%) | 0 (0.0%) |
| 75 Years and over | 0 (0.0%) | 0 (0.0%) |
Disability Class: Cognitive Difficulty
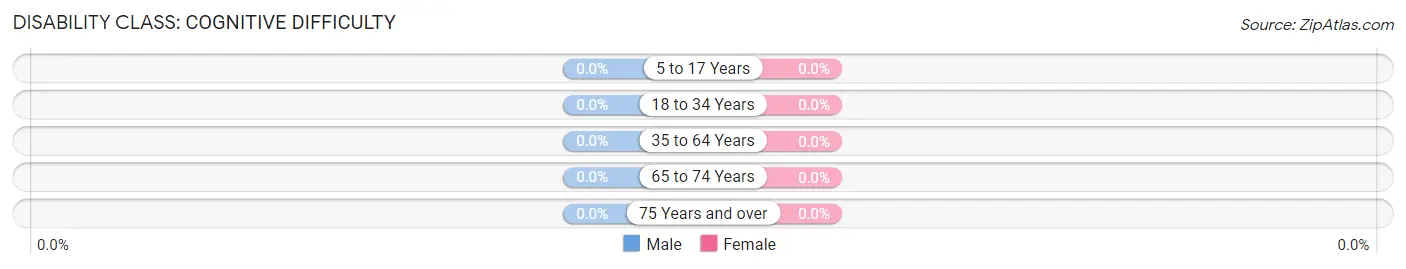
| Age Bracket | Male | Female |
| 5 to 17 Years | 0 (0.0%) | 0 (0.0%) |
| 18 to 34 Years | 0 (0.0%) | 0 (0.0%) |
| 35 to 64 Years | 0 (0.0%) | 0 (0.0%) |
| 65 to 74 Years | 0 (0.0%) | 0 (0.0%) |
| 75 Years and over | 0 (0.0%) | 0 (0.0%) |
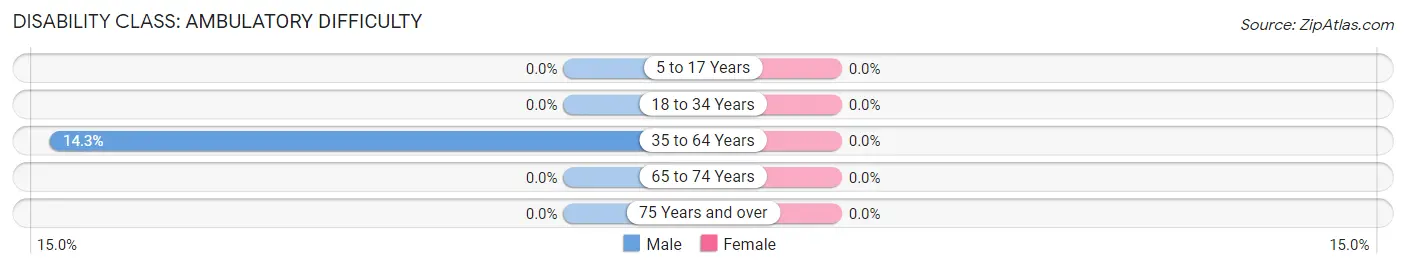
Disability Class: Ambulatory Difficulty
| Age Bracket | Male | Female |
| 5 to 17 Years | 0 (0.0%) | 0 (0.0%) |
| 18 to 34 Years | 0 (0.0%) | 0 (0.0%) |
| 35 to 64 Years | 1 (14.3%) | 0 (0.0%) |
| 65 to 74 Years | 0 (0.0%) | 0 (0.0%) |
| 75 Years and over | 0 (0.0%) | 0 (0.0%) |
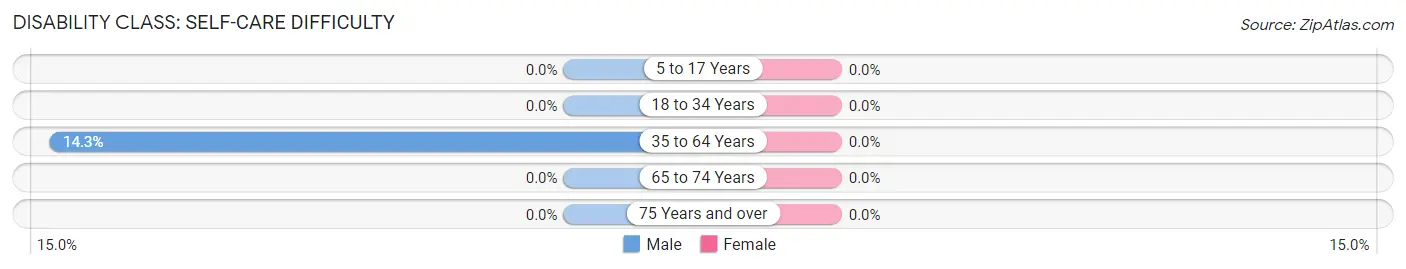
Disability Class: Self-Care Difficulty
| Age Bracket | Male | Female |
| 5 to 17 Years | 0 (0.0%) | 0 (0.0%) |
| 18 to 34 Years | 0 (0.0%) | 0 (0.0%) |
| 35 to 64 Years | 1 (14.3%) | 0 (0.0%) |
| 65 to 74 Years | 0 (0.0%) | 0 (0.0%) |
| 75 Years and over | 0 (0.0%) | 0 (0.0%) |
Technology Access in Farwell
Computing Device Access in Farwell
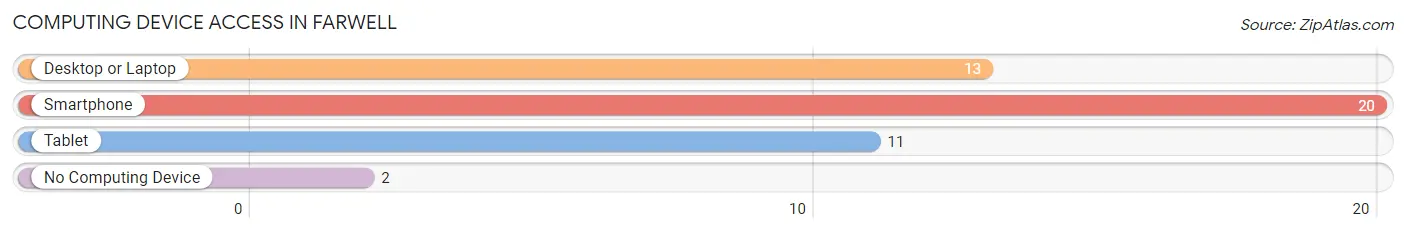
| Device Type | # Households | % Households |
| Desktop or Laptop | 13 | 56.5% |
| Smartphone | 20 | 87.0% |
| Tablet | 11 | 47.8% |
| No Computing Device | 2 | 8.7% |
| Total | 23 | 100.0% |
Internet Access in Farwell
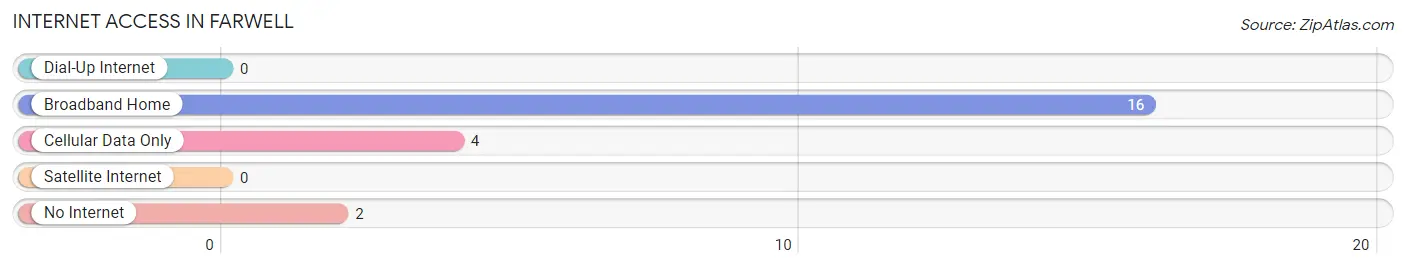
| Internet Type | # Households | % Households |
| Dial-Up Internet | 0 | 0.0% |
| Broadband Home | 16 | 69.6% |
| Cellular Data Only | 4 | 17.4% |
| Satellite Internet | 0 | 0.0% |
| No Internet | 2 | 8.7% |
| Total | 23 | 100.0% |
Farwell Summary
Farwell, Minnesota is a small city located in the northwestern corner of the state, near the border with North Dakota. It is part of the Red River Valley region, and is situated on the banks of the Red River. The city has a population of just over 1,000 people, and is the county seat of Wilkin County.
History
The area that is now Farwell was first settled in the late 1800s by a group of Norwegian immigrants. The town was originally called “Fosse”, after the Norwegian word for “waterfall”, and was later changed to Farwell in honor of a local settler. The town was officially incorporated in 1887.
In the early 1900s, Farwell was a thriving agricultural community, with a variety of crops being grown in the area. The town was also home to a number of businesses, including a flour mill, a creamery, and a lumber mill.
In the 1950s, Farwell began to experience a decline in population as many of its residents moved away in search of better economic opportunities. This trend continued until the late 1970s, when the town began to experience a resurgence in population growth.
Geography
Farwell is located in the northwestern corner of Minnesota, near the border with North Dakota. The city is situated on the banks of the Red River, and is part of the Red River Valley region. The city is surrounded by rolling hills and farmland, and is located approximately 30 miles from the nearest major city, Fargo, North Dakota.
The climate in Farwell is typical of the northern Midwest, with cold winters and hot summers. The average annual temperature is around 40 degrees Fahrenheit, and the average annual precipitation is around 25 inches.
Economy
The economy of Farwell is largely based on agriculture, with a variety of crops being grown in the area. The city is also home to a number of businesses, including a flour mill, a creamery, and a lumber mill.
In recent years, Farwell has seen an increase in tourism, with many visitors coming to the area to take advantage of the city’s natural beauty and outdoor activities. The city is also home to a number of festivals and events throughout the year, including the Farwell Summer Festival and the Farwell Winter Festival.
Demographics
As of the 2010 census, Farwell had a population of 1,072 people. The racial makeup of the city was 97.3% White, 0.7% African American, 0.3% Native American, 0.2% Asian, 0.1% Pacific Islander, and 1.4% from other races. The median household income in Farwell was $41,250, and the median family income was $50,000.
Farwell is a small, rural community with a strong sense of community and a commitment to preserving its history and culture. The city is home to a variety of churches, schools, and other organizations, and is a great place to live for those looking for a quiet, peaceful lifestyle.
Common Questions
What is Per Capita Income in Farwell?
Per Capita income in Farwell is $29,531.
What is the Median Household income in Farwell?
Median Household Income in Farwell is $56,250.
What is Inequality or Gini Index in Farwell?
Inequality or Gini Index in Farwell is 0.22.
What is the Total Population of Farwell?
Total Population of Farwell is 36.
What is the Total Male Population of Farwell?
Total Male Population of Farwell is 20.
What is the Total Female Population of Farwell?
Total Female Population of Farwell is 16.
What is the Ratio of Males per 100 Females in Farwell?
There are 125.00 Males per 100 Females in Farwell.
What is the Ratio of Females per 100 Males in Farwell?
There are 80.00 Females per 100 Males in Farwell.
What is the Median Population Age in Farwell?
Median Population Age in Farwell is 41.4 Years.
What is the Average Family Size in Farwell
Average Family Size in Farwell is 2.8 People.
What is the Average Household Size in Farwell
Average Household Size in Farwell is 1.6 People.
How Large is the Labor Force in Farwell?
There are 21 People in the Labor Forcein in Farwell.
What is the Percentage of People in the Labor Force in Farwell?
67.7% of People are in the Labor Force in Farwell.