Easton, MN Map & Demographics
Easton Map
Easton Overview
$32,737
PER CAPITA INCOME
$107,813
AVG FAMILY INCOME
$66,250
AVG HOUSEHOLD INCOME
42.3%
WAGE / INCOME GAP [ % ]
57.7¢/ $1
WAGE / INCOME GAP [ $ ]
0.35
INEQUALITY / GINI INDEX
172
TOTAL POPULATION
105
MALE POPULATION
67
FEMALE POPULATION
156.72
MALES / 100 FEMALES
63.81
FEMALES / 100 MALES
39.4
MEDIAN AGE
3.1
AVG FAMILY SIZE
2.3
AVG HOUSEHOLD SIZE
84
LABOR FORCE [ PEOPLE ]
67.7%
PERCENT IN LABOR FORCE
2.4%
UNEMPLOYMENT RATE
Easton Zip Codes
Easton Area Codes
Income in Easton
Income Overview in Easton
Per Capita Income in Easton is $32,737, while median incomes of families and households are $107,813 and $66,250 respectively.
| Characteristic | Number | Measure |
| Per Capita Income | 172 | $32,737 |
| Median Family Income | 45 | $107,813 |
| Mean Family Income | 45 | $101,327 |
| Median Household Income | 74 | $66,250 |
| Mean Household Income | 74 | $77,154 |
| Income Deficit | 45 | $0 |
| Wage / Income Gap (%) | 172 | 42.35% |
| Wage / Income Gap ($) | 172 | 57.65¢ per $1 |
| Gini / Inequality Index | 172 | 0.35 |
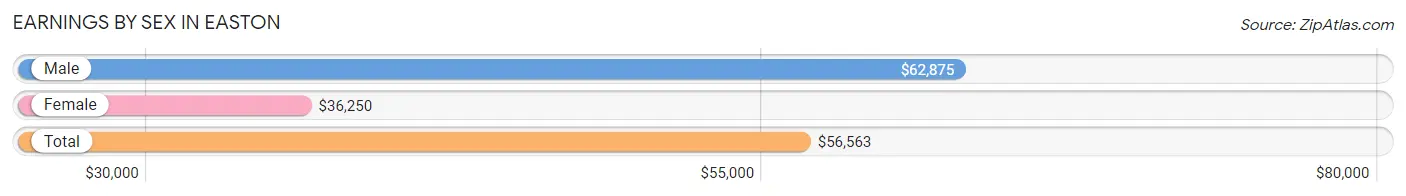
Earnings by Sex in Easton
Average Earnings in Easton are $56,563, $62,875 for men and $36,250 for women, a difference of 42.3%.
| Sex | Number | Average Earnings |
| Male | 49 (53.8%) | $62,875 |
| Female | 42 (46.2%) | $36,250 |
| Total | 91 (100.0%) | $56,563 |
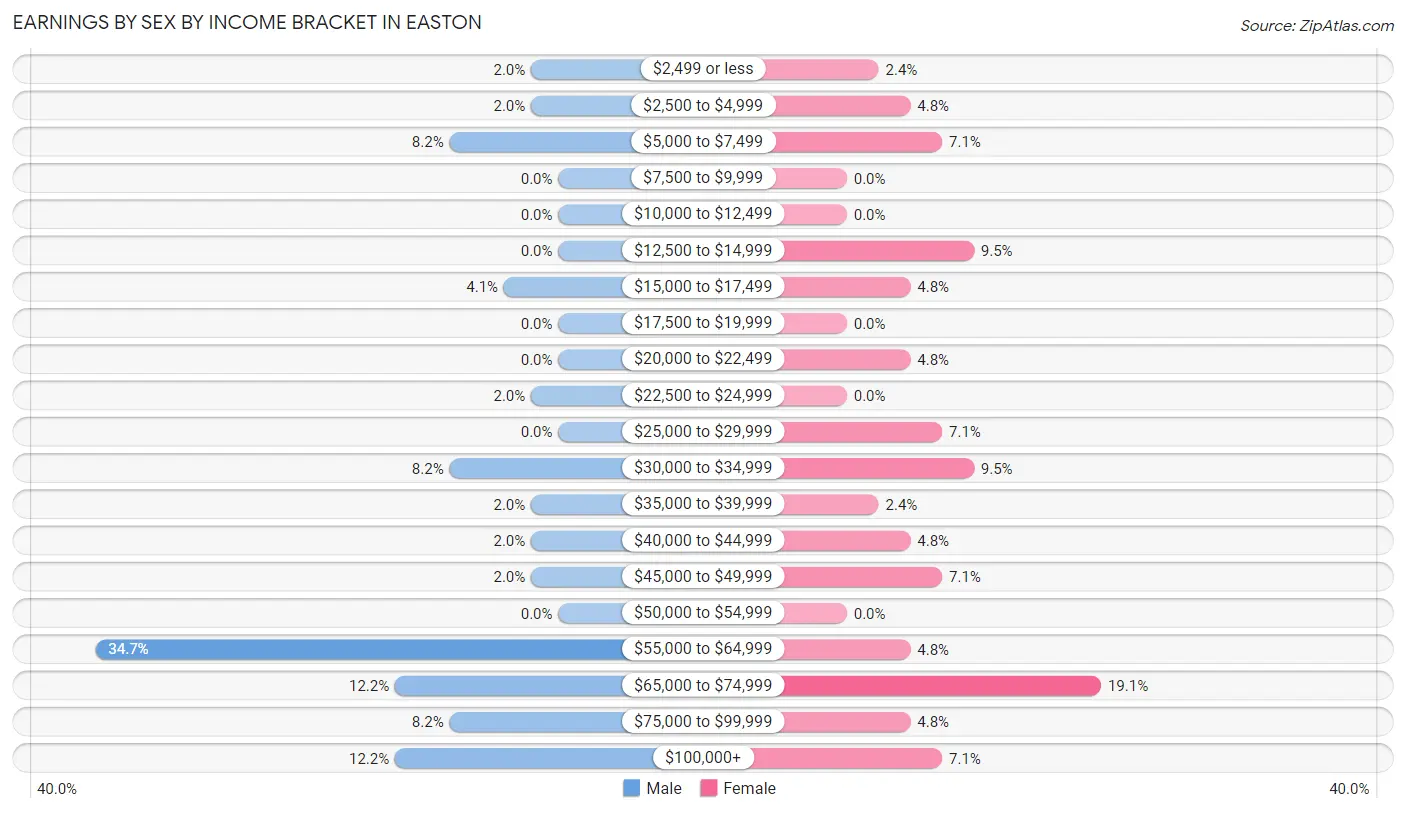
Earnings by Sex by Income Bracket in Easton
The most common earnings brackets in Easton are $55,000 to $64,999 for men (17 | 34.7%) and $65,000 to $74,999 for women (8 | 19.1%).
| Income | Male | Female |
| $2,499 or less | 1 (2.0%) | 1 (2.4%) |
| $2,500 to $4,999 | 1 (2.0%) | 2 (4.8%) |
| $5,000 to $7,499 | 4 (8.2%) | 3 (7.1%) |
| $7,500 to $9,999 | 0 (0.0%) | 0 (0.0%) |
| $10,000 to $12,499 | 0 (0.0%) | 0 (0.0%) |
| $12,500 to $14,999 | 0 (0.0%) | 4 (9.5%) |
| $15,000 to $17,499 | 2 (4.1%) | 2 (4.8%) |
| $17,500 to $19,999 | 0 (0.0%) | 0 (0.0%) |
| $20,000 to $22,499 | 0 (0.0%) | 2 (4.8%) |
| $22,500 to $24,999 | 1 (2.0%) | 0 (0.0%) |
| $25,000 to $29,999 | 0 (0.0%) | 3 (7.1%) |
| $30,000 to $34,999 | 4 (8.2%) | 4 (9.5%) |
| $35,000 to $39,999 | 1 (2.0%) | 1 (2.4%) |
| $40,000 to $44,999 | 1 (2.0%) | 2 (4.8%) |
| $45,000 to $49,999 | 1 (2.0%) | 3 (7.1%) |
| $50,000 to $54,999 | 0 (0.0%) | 0 (0.0%) |
| $55,000 to $64,999 | 17 (34.7%) | 2 (4.8%) |
| $65,000 to $74,999 | 6 (12.2%) | 8 (19.1%) |
| $75,000 to $99,999 | 4 (8.2%) | 2 (4.8%) |
| $100,000+ | 6 (12.2%) | 3 (7.1%) |
| Total | 49 (100.0%) | 42 (100.0%) |
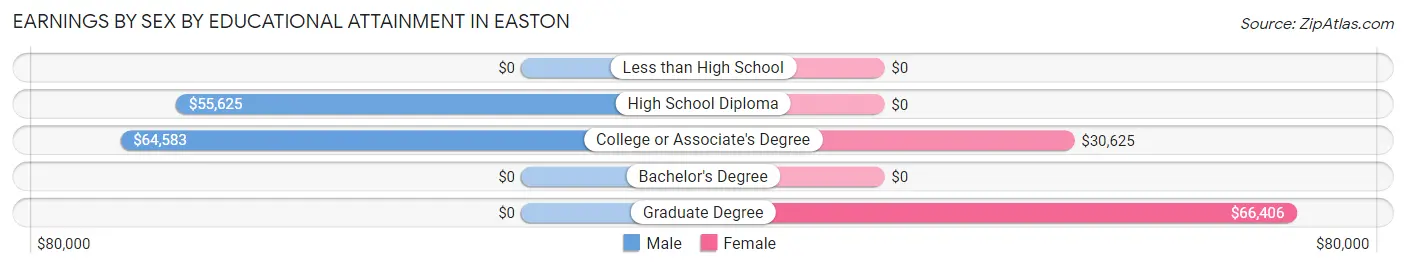
Earnings by Sex by Educational Attainment in Easton
Average earnings in Easton are $63,125 for men and $43,125 for women, a difference of 31.7%. Men with an educational attainment of college or associate's degree enjoy the highest average annual earnings of $64,583, while those with high school diploma education earn the least with $55,625. Women with an educational attainment of graduate degree earn the most with the average annual earnings of $66,406, while those with college or associate's degree education have the smallest earnings of $30,625.
| Educational Attainment | Male Income | Female Income |
| Less than High School | - | - |
| High School Diploma | $55,625 | $0 |
| College or Associate's Degree | $64,583 | $30,625 |
| Bachelor's Degree | - | - |
| Graduate Degree | - | - |
| Total | $63,125 | $43,125 |
Family Income in Easton
Family Income Brackets in Easton
According to the Easton family income data, there are 23 families falling into the $100,000 to $149,999 income range, which is the most common income bracket and makes up 51.1% of all families.
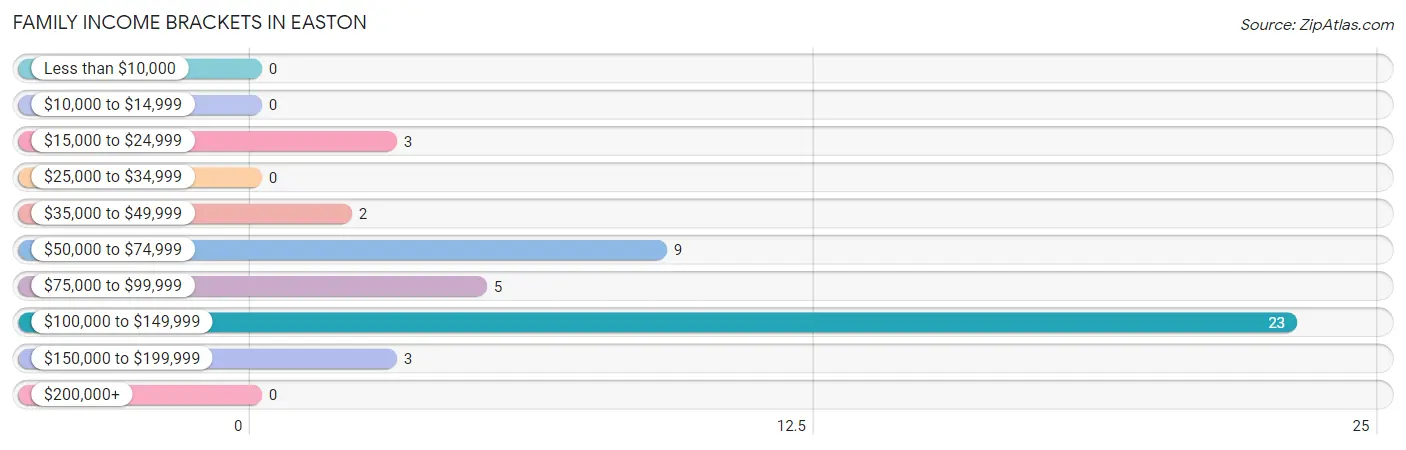
| Income Bracket | # Families | % Families |
| Less than $10,000 | 0 | 0.0% |
| $10,000 to $14,999 | 0 | 0.0% |
| $15,000 to $24,999 | 3 | 6.7% |
| $25,000 to $34,999 | 0 | 0.0% |
| $35,000 to $49,999 | 2 | 4.4% |
| $50,000 to $74,999 | 9 | 20.0% |
| $75,000 to $99,999 | 5 | 11.1% |
| $100,000 to $149,999 | 23 | 51.1% |
| $150,000 to $199,999 | 3 | 6.7% |
| $200,000+ | 0 | 0.0% |
Family Income by Famaliy Size in Easton
5-person families (10 | 22.2%) account for the highest median family income in Easton with $128,750 per family, while 2-person families (25 | 55.6%) have the highest median income of $41,562 per family member.
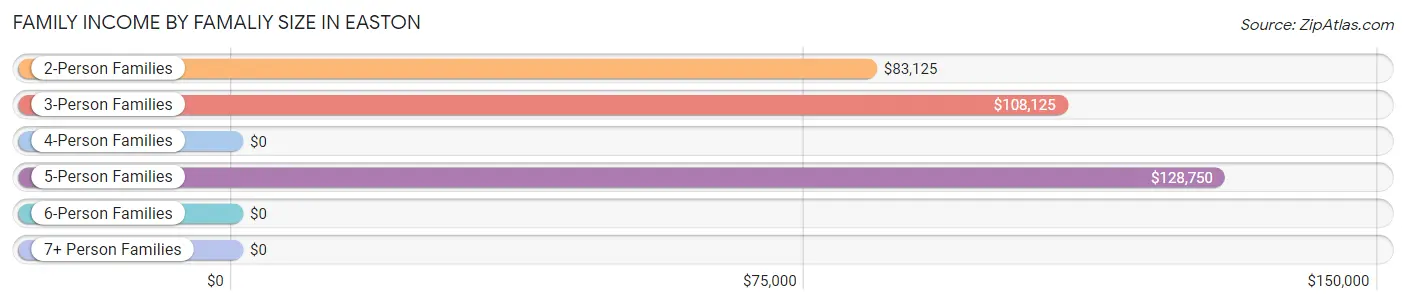
| Income Bracket | # Families | Median Income |
| 2-Person Families | 25 (55.6%) | $83,125 |
| 3-Person Families | 8 (17.8%) | $108,125 |
| 4-Person Families | 2 (4.4%) | $0 |
| 5-Person Families | 10 (22.2%) | $128,750 |
| 6-Person Families | 0 (0.0%) | $0 |
| 7+ Person Families | 0 (0.0%) | $0 |
| Total | 45 (100.0%) | $107,813 |
Family Income by Number of Earners in Easton
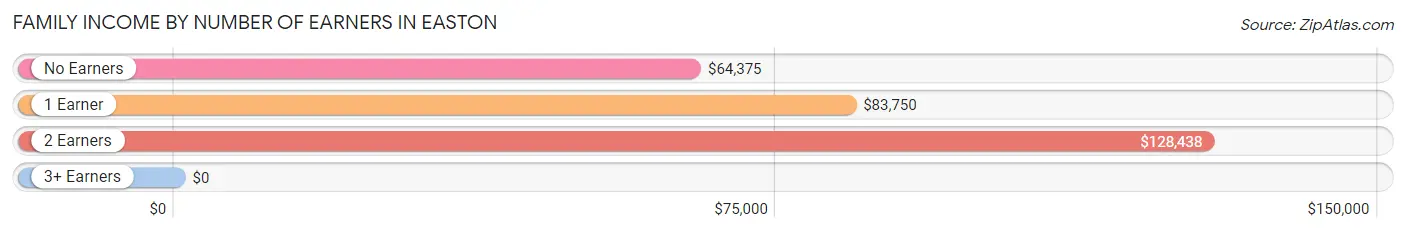
| Number of Earners | # Families | Median Income |
| No Earners | 5 (11.1%) | $64,375 |
| 1 Earner | 14 (31.1%) | $83,750 |
| 2 Earners | 24 (53.3%) | $128,438 |
| 3+ Earners | 2 (4.4%) | $0 |
| Total | 45 (100.0%) | $107,813 |
Household Income in Easton
Household Income Brackets in Easton
With 24 households falling in the category, the $100,000 to $149,999 income range is the most frequent in Easton, accounting for 32.4% of all households.
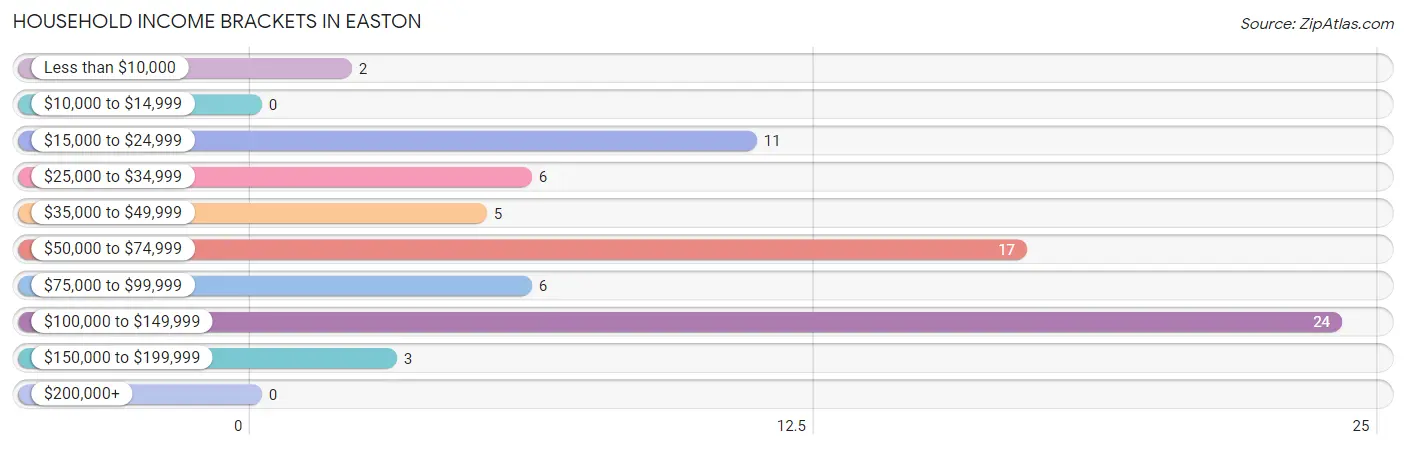
| Income Bracket | # Households | % Households |
| Less than $10,000 | 2 | 2.7% |
| $10,000 to $14,999 | 0 | 0.0% |
| $15,000 to $24,999 | 11 | 14.9% |
| $25,000 to $34,999 | 6 | 8.1% |
| $35,000 to $49,999 | 5 | 6.8% |
| $50,000 to $74,999 | 17 | 23.0% |
| $75,000 to $99,999 | 6 | 8.1% |
| $100,000 to $149,999 | 24 | 32.4% |
| $150,000 to $199,999 | 3 | 4.1% |
| $200,000+ | 0 | 0.0% |
Household Income by Householder Age in Easton
The median household income in Easton is $66,250, with the highest median household income of $108,125 found in the 25 to 44 years age bracket for the primary householder. A total of 26 households (35.1%) fall into this category.
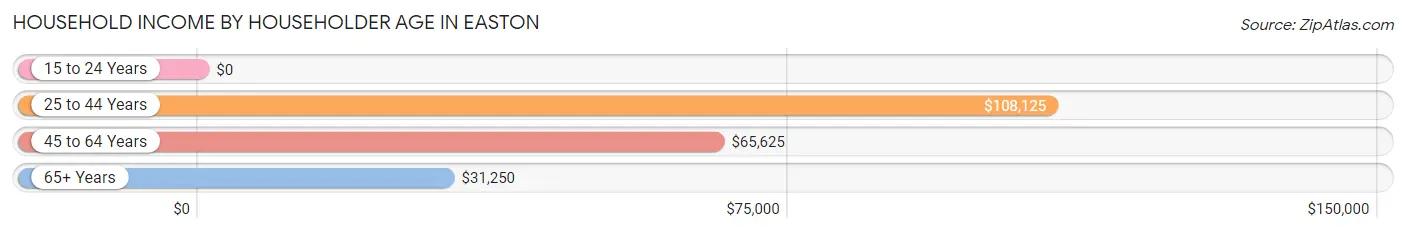
| Income Bracket | # Households | Median Income |
| 15 to 24 Years | 0 (0.0%) | $0 |
| 25 to 44 Years | 26 (35.1%) | $108,125 |
| 45 to 64 Years | 26 (35.1%) | $65,625 |
| 65+ Years | 22 (29.7%) | $31,250 |
| Total | 74 (100.0%) | $66,250 |
Poverty in Easton
Income Below Poverty by Sex and Age in Easton
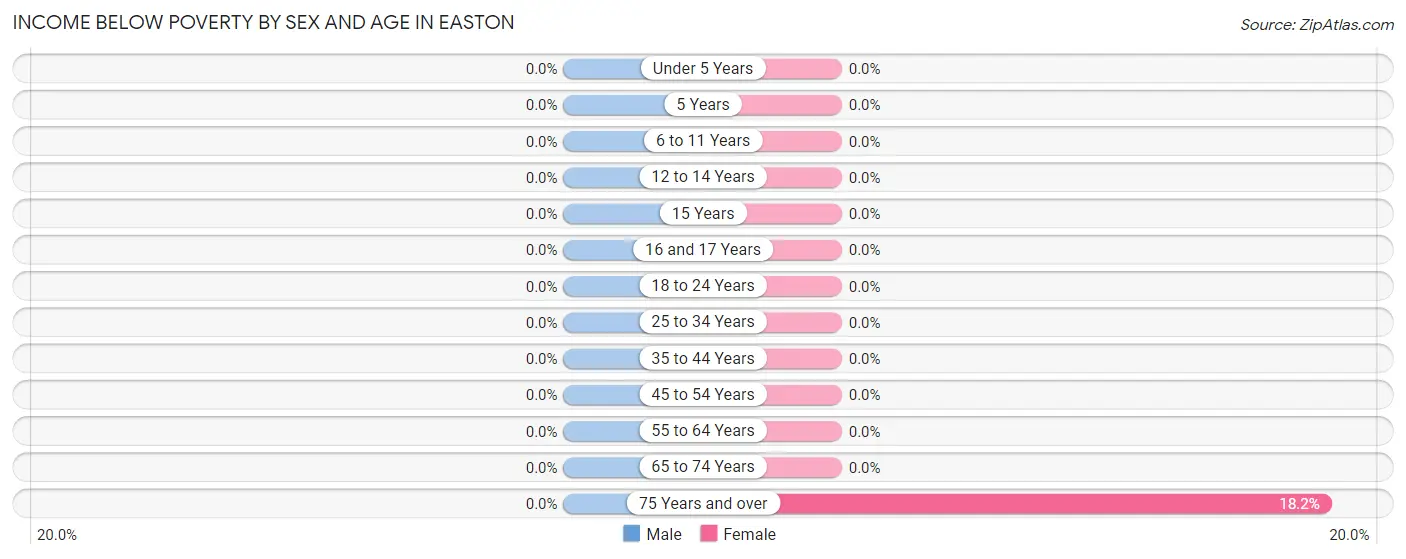
| Age Bracket | Male | Female |
| Under 5 Years | 0 (0.0%) | 0 (0.0%) |
| 5 Years | 0 (0.0%) | 0 (0.0%) |
| 6 to 11 Years | 0 (0.0%) | 0 (0.0%) |
| 12 to 14 Years | 0 (0.0%) | 0 (0.0%) |
| 15 Years | 0 (0.0%) | 0 (0.0%) |
| 16 and 17 Years | 0 (0.0%) | 0 (0.0%) |
| 18 to 24 Years | 0 (0.0%) | 0 (0.0%) |
| 25 to 34 Years | 0 (0.0%) | 0 (0.0%) |
| 35 to 44 Years | 0 (0.0%) | 0 (0.0%) |
| 45 to 54 Years | 0 (0.0%) | 0 (0.0%) |
| 55 to 64 Years | 0 (0.0%) | 0 (0.0%) |
| 65 to 74 Years | 0 (0.0%) | 0 (0.0%) |
| 75 Years and over | 0 (0.0%) | 2 (18.2%) |
| Total | 0 (0.0%) | 2 (3.0%) |
Income Above Poverty by Sex and Age in Easton
According to the poverty statistics in Easton, males aged under 5 years and females aged under 5 years are the age groups that are most secure financially, with 100.0% of males and 100.0% of females in these age groups living above the poverty line.
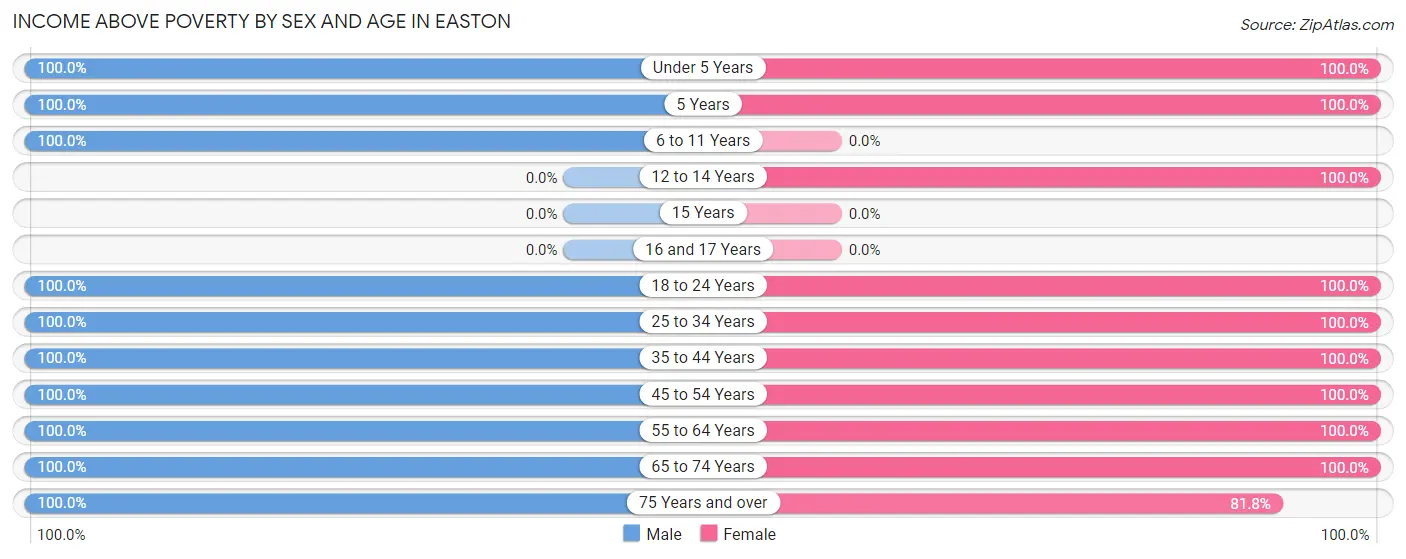
| Age Bracket | Male | Female |
| Under 5 Years | 17 (100.0%) | 1 (100.0%) |
| 5 Years | 5 (100.0%) | 1 (100.0%) |
| 6 to 11 Years | 22 (100.0%) | 0 (0.0%) |
| 12 to 14 Years | 0 (0.0%) | 2 (100.0%) |
| 15 Years | 0 (0.0%) | 0 (0.0%) |
| 16 and 17 Years | 0 (0.0%) | 0 (0.0%) |
| 18 to 24 Years | 2 (100.0%) | 3 (100.0%) |
| 25 to 34 Years | 8 (100.0%) | 10 (100.0%) |
| 35 to 44 Years | 16 (100.0%) | 18 (100.0%) |
| 45 to 54 Years | 9 (100.0%) | 4 (100.0%) |
| 55 to 64 Years | 12 (100.0%) | 12 (100.0%) |
| 65 to 74 Years | 10 (100.0%) | 5 (100.0%) |
| 75 Years and over | 4 (100.0%) | 9 (81.8%) |
| Total | 105 (100.0%) | 65 (97.0%) |
Income Below Poverty Among Married-Couple Families in Easton
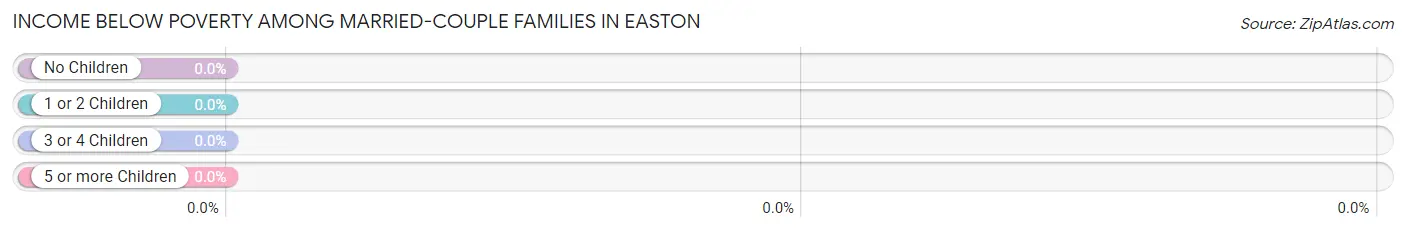
| Children | Above Poverty | Below Poverty |
| No Children | 24 (100.0%) | 0 (0.0%) |
| 1 or 2 Children | 9 (100.0%) | 0 (0.0%) |
| 3 or 4 Children | 10 (100.0%) | 0 (0.0%) |
| 5 or more Children | 0 (0.0%) | 0 (0.0%) |
| Total | 43 (100.0%) | 0 (0.0%) |
Income Below Poverty Among Single-Parent Households in Easton
| Children | Single Father | Single Mother |
| No Children | 0 (0.0%) | 0 (0.0%) |
| 1 or 2 Children | 0 (0.0%) | 0 (0.0%) |
| 3 or 4 Children | 0 (0.0%) | 0 (0.0%) |
| 5 or more Children | 0 (0.0%) | 0 (0.0%) |
| Total | 0 (0.0%) | 0 (0.0%) |
Income Below Poverty Among Married-Couple vs Single-Parent Households in Easton
| Children | Married-Couple Families | Single-Parent Households |
| No Children | 0 (0.0%) | 0 (0.0%) |
| 1 or 2 Children | 0 (0.0%) | 0 (0.0%) |
| 3 or 4 Children | 0 (0.0%) | 0 (0.0%) |
| 5 or more Children | 0 (0.0%) | 0 (0.0%) |
| Total | 0 (0.0%) | 0 (0.0%) |
Race in Easton
The most populous races in Easton are , and White / Caucasian (172 | 100.0%).
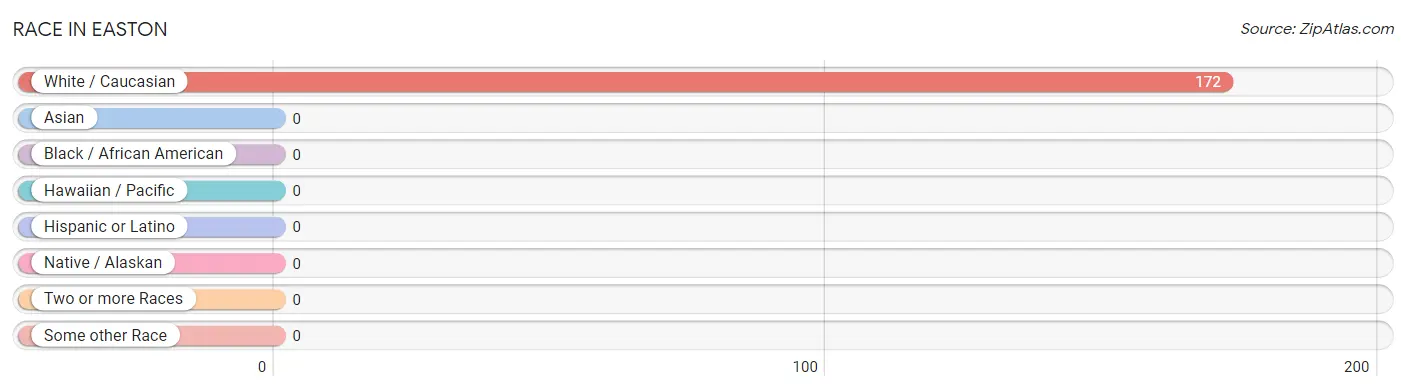
| Race | # Population | % Population |
| Asian | 0 | 0.0% |
| Black / African American | 0 | 0.0% |
| Hawaiian / Pacific | 0 | 0.0% |
| Hispanic or Latino | 0 | 0.0% |
| Native / Alaskan | 0 | 0.0% |
| White / Caucasian | 172 | 100.0% |
| Two or more Races | 0 | 0.0% |
| Some other Race | 0 | 0.0% |
| Total | 172 | 100.0% |
Ancestry in Easton
The most populous ancestries reported in Easton are German (107 | 62.2%), Norwegian (53 | 30.8%), Irish (21 | 12.2%), Polish (10 | 5.8%), and Hungarian (8 | 4.6%), together accounting for 115.7% of all Easton residents.
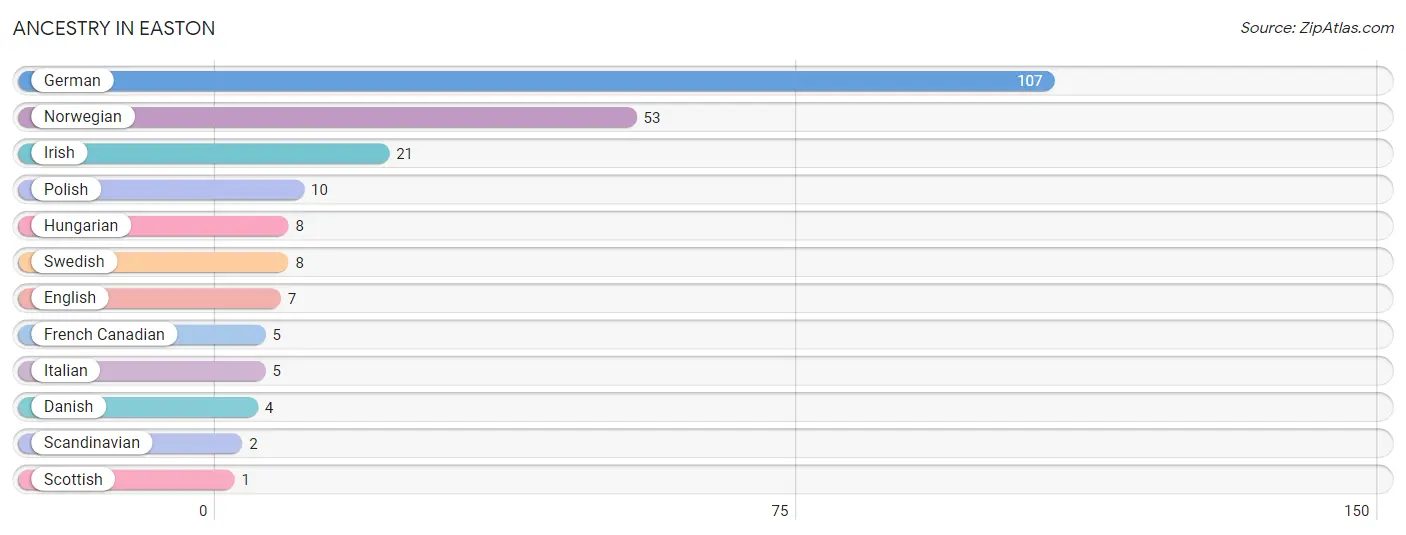
| Ancestry | # Population | % Population |
| Danish | 4 | 2.3% |
| English | 7 | 4.1% |
| French Canadian | 5 | 2.9% |
| German | 107 | 62.2% |
| Hungarian | 8 | 4.6% |
| Irish | 21 | 12.2% |
| Italian | 5 | 2.9% |
| Norwegian | 53 | 30.8% |
| Polish | 10 | 5.8% |
| Scandinavian | 2 | 1.2% |
| Scottish | 1 | 0.6% |
| Swedish | 8 | 4.6% | View All 12 Rows |
Immigrants in Easton

| Immigration Origin | # Population | % Population | View All 0 Rows |
Sex and Age in Easton
Sex and Age in Easton
The most populous age groups in Easton are Under 5 Years (17 | 16.2%) for men and 35 to 39 Years (10 | 14.9%) for women.
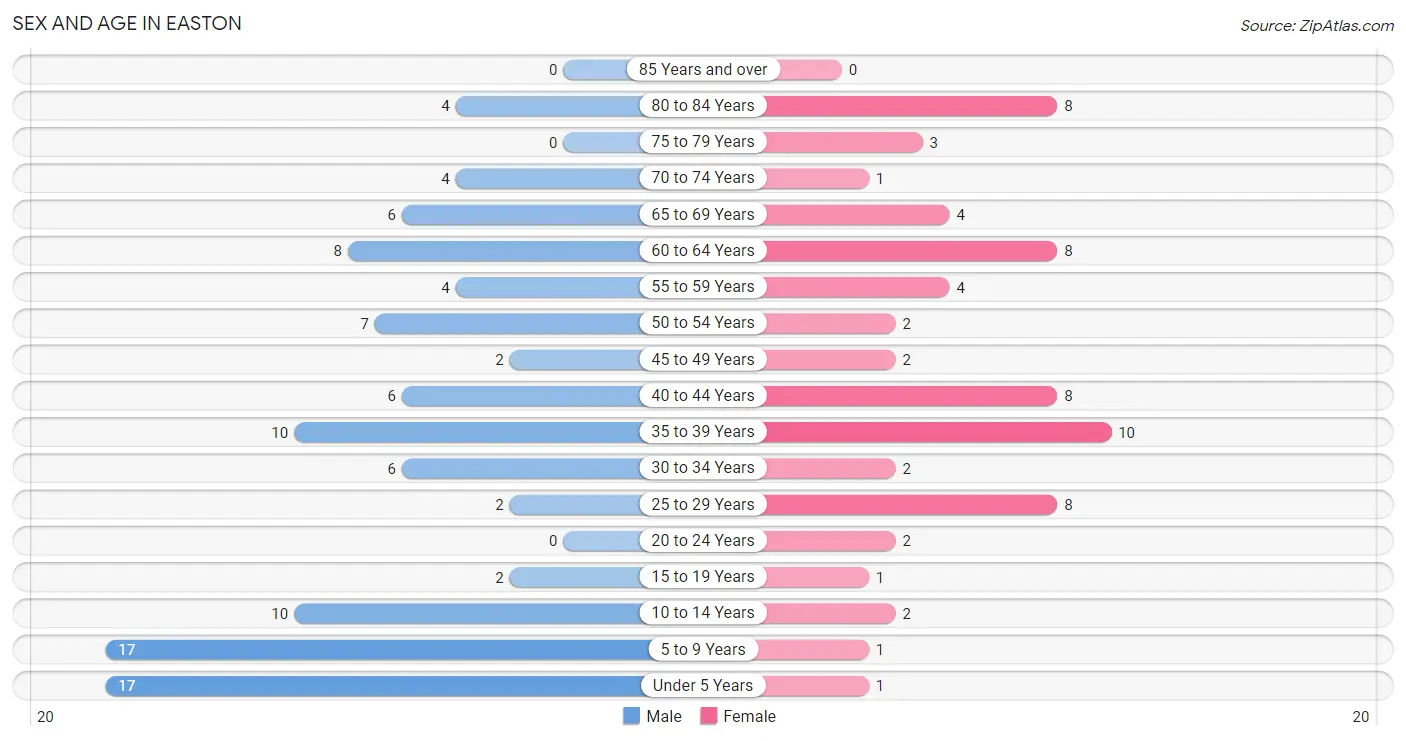
| Age Bracket | Male | Female |
| Under 5 Years | 17 (16.2%) | 1 (1.5%) |
| 5 to 9 Years | 17 (16.2%) | 1 (1.5%) |
| 10 to 14 Years | 10 (9.5%) | 2 (3.0%) |
| 15 to 19 Years | 2 (1.9%) | 1 (1.5%) |
| 20 to 24 Years | 0 (0.0%) | 2 (3.0%) |
| 25 to 29 Years | 2 (1.9%) | 8 (11.9%) |
| 30 to 34 Years | 6 (5.7%) | 2 (3.0%) |
| 35 to 39 Years | 10 (9.5%) | 10 (14.9%) |
| 40 to 44 Years | 6 (5.7%) | 8 (11.9%) |
| 45 to 49 Years | 2 (1.9%) | 2 (3.0%) |
| 50 to 54 Years | 7 (6.7%) | 2 (3.0%) |
| 55 to 59 Years | 4 (3.8%) | 4 (6.0%) |
| 60 to 64 Years | 8 (7.6%) | 8 (11.9%) |
| 65 to 69 Years | 6 (5.7%) | 4 (6.0%) |
| 70 to 74 Years | 4 (3.8%) | 1 (1.5%) |
| 75 to 79 Years | 0 (0.0%) | 3 (4.5%) |
| 80 to 84 Years | 4 (3.8%) | 8 (11.9%) |
| 85 Years and over | 0 (0.0%) | 0 (0.0%) |
| Total | 105 (100.0%) | 67 (100.0%) |
Families and Households in Easton
Median Family Size in Easton
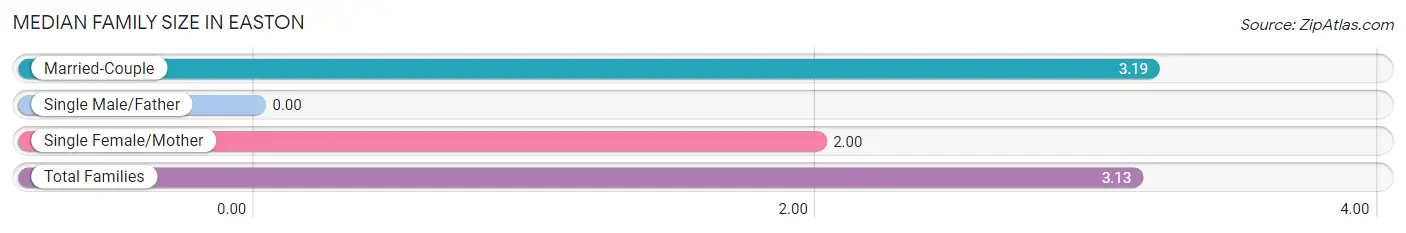
| Family Type | # Families | Family Size |
| Married-Couple | 43 (95.6%) | 3.19 |
| Single Male/Father | 0 (0.0%) | - |
| Single Female/Mother | 2 (4.4%) | 2.00 |
| Total Families | 45 (100.0%) | 3.13 |
Median Household Size in Easton
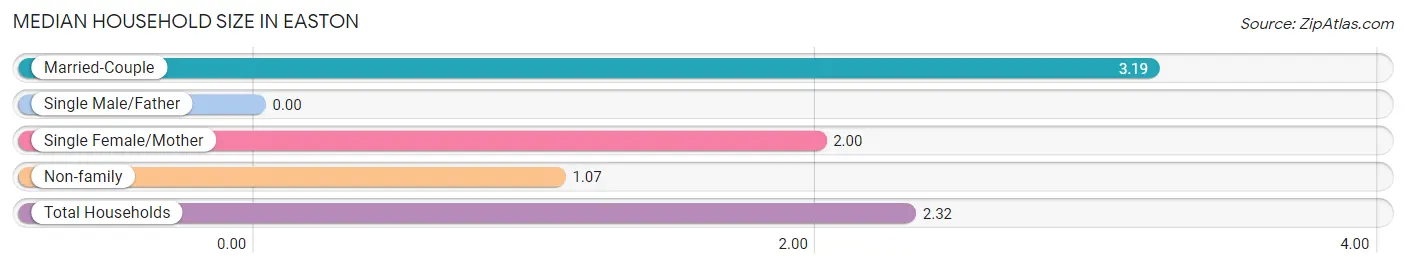
| Household Type | # Households | Household Size |
| Married-Couple | 43 (58.1%) | 3.19 |
| Single Male/Father | 0 (0.0%) | - |
| Single Female/Mother | 2 (2.7%) | 2.00 |
| Non-family | 29 (39.2%) | 1.07 |
| Total Households | 74 (100.0%) | 2.32 |
Household Size by Marriage Status in Easton
Out of a total of 74 households in Easton, 45 (60.8%) are family households, while 29 (39.2%) are nonfamily households. The most numerous type of family households are 2-person households, comprising 25, and the most common type of nonfamily households are 1-person households, comprising 25.
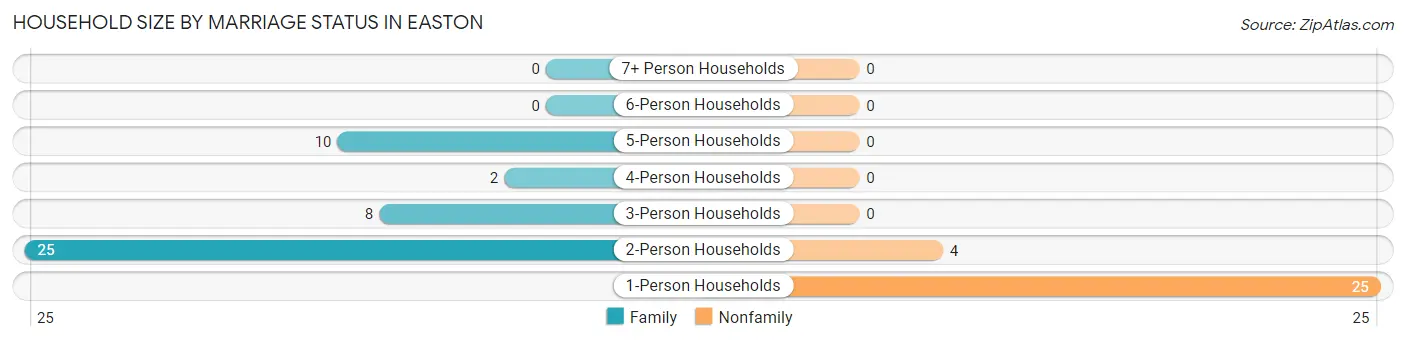
| Household Size | Family Households | Nonfamily Households |
| 1-Person Households | - | 25 (33.8%) |
| 2-Person Households | 25 (33.8%) | 4 (5.4%) |
| 3-Person Households | 8 (10.8%) | 0 (0.0%) |
| 4-Person Households | 2 (2.7%) | 0 (0.0%) |
| 5-Person Households | 10 (13.5%) | 0 (0.0%) |
| 6-Person Households | 0 (0.0%) | 0 (0.0%) |
| 7+ Person Households | 0 (0.0%) | 0 (0.0%) |
| Total | 45 (60.8%) | 29 (39.2%) |
Female Fertility in Easton
Fertility by Age in Easton
Average fertility rate in Easton is 91.0 births per 1,000 women. Women in the age bracket of 20 to 34 years have the highest fertility rate with 250.0 births per 1,000 women. Women in the age bracket of 20 to 34 years acount for 100.0% of all women with births.
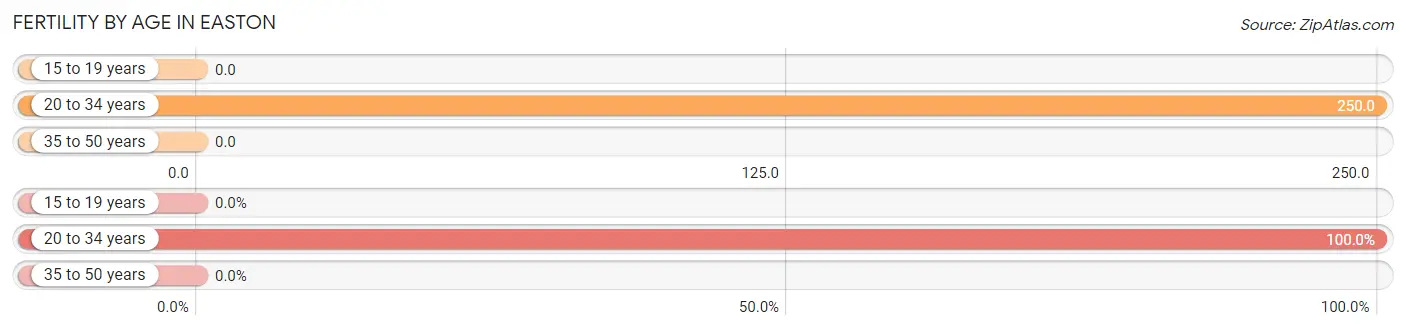
| Age Bracket | Women with Births | Births / 1,000 Women |
| 15 to 19 years | 0 (0.0%) | 0.0 |
| 20 to 34 years | 3 (100.0%) | 250.0 |
| 35 to 50 years | 0 (0.0%) | 0.0 |
| Total | 3 (100.0%) | 91.0 |
Fertility by Age by Marriage Status in Easton
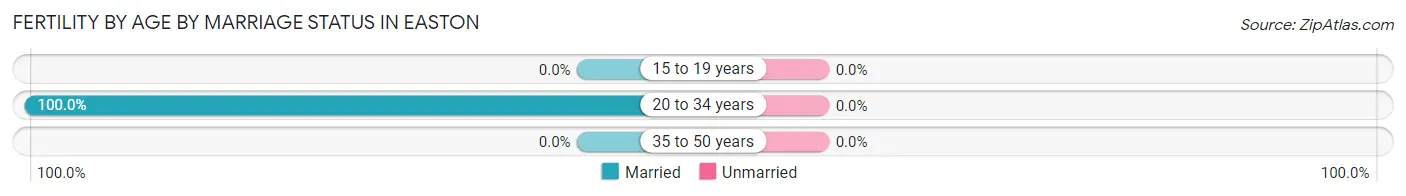
| Age Bracket | Married | Unmarried |
| 15 to 19 years | 0 (0.0%) | 0 (0.0%) |
| 20 to 34 years | 3 (100.0%) | 0 (0.0%) |
| 35 to 50 years | 0 (0.0%) | 0 (0.0%) |
| Total | 3 (100.0%) | 0 (0.0%) |
Fertility by Education in Easton
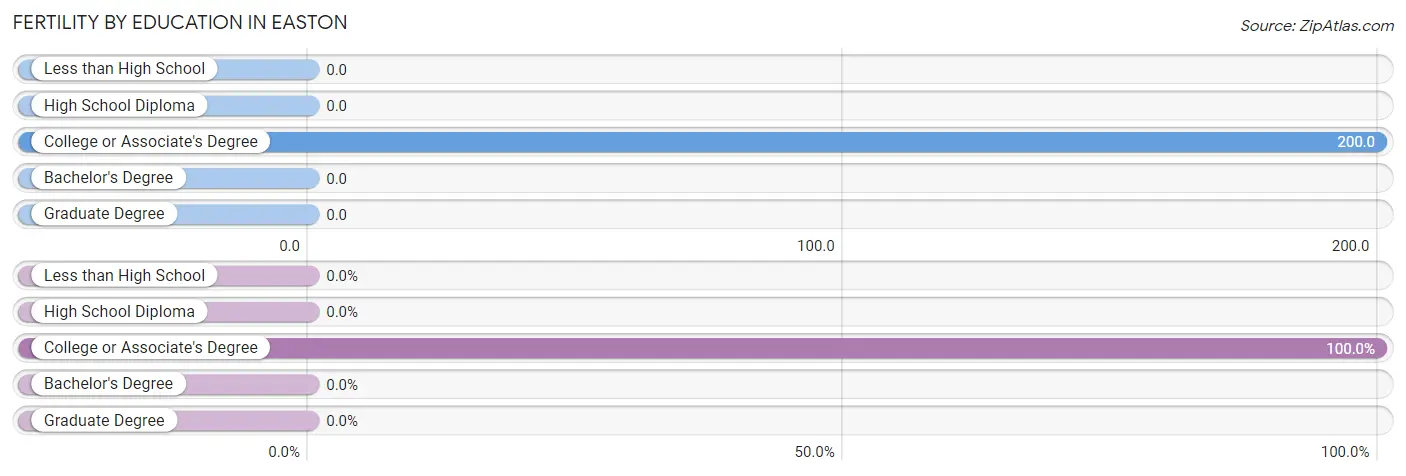
| Educational Attainment | Women with Births | Births / 1,000 Women |
| Less than High School | 0 (0.0%) | 0.0 |
| High School Diploma | 0 (0.0%) | 0.0 |
| College or Associate's Degree | 3 (100.0%) | 200.0 |
| Bachelor's Degree | 0 (0.0%) | 0.0 |
| Graduate Degree | 0 (0.0%) | 0.0 |
| Total | 3 (100.0%) | 91.0 |
Fertility by Education by Marriage Status in Easton
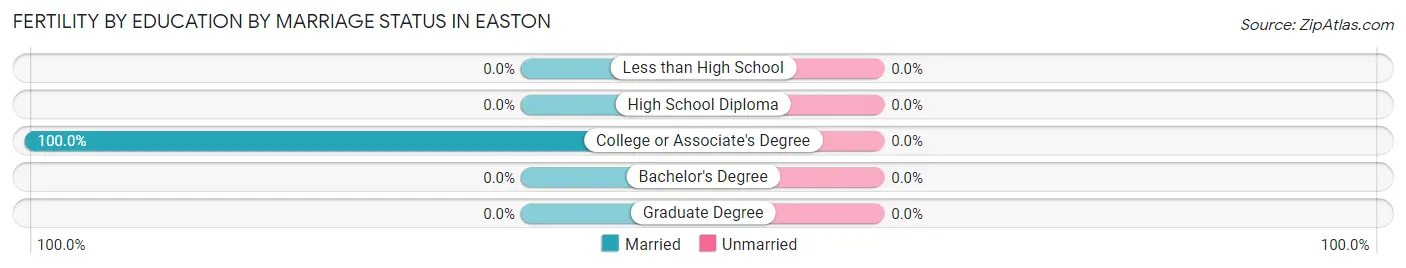
| Educational Attainment | Married | Unmarried |
| Less than High School | 0 (0.0%) | 0 (0.0%) |
| High School Diploma | 0 (0.0%) | 0 (0.0%) |
| College or Associate's Degree | 3 (100.0%) | 0 (0.0%) |
| Bachelor's Degree | 0 (0.0%) | 0 (0.0%) |
| Graduate Degree | 0 (0.0%) | 0 (0.0%) |
| Total | 3 (100.0%) | 0 (0.0%) |
Employment Characteristics in Easton
Employment by Class of Employer in Easton
Among the 82 employed individuals in Easton, private company employees (42 | 51.2%), local government employees (18 | 22.0%), and state government employees (9 | 11.0%) make up the most common classes of employment.
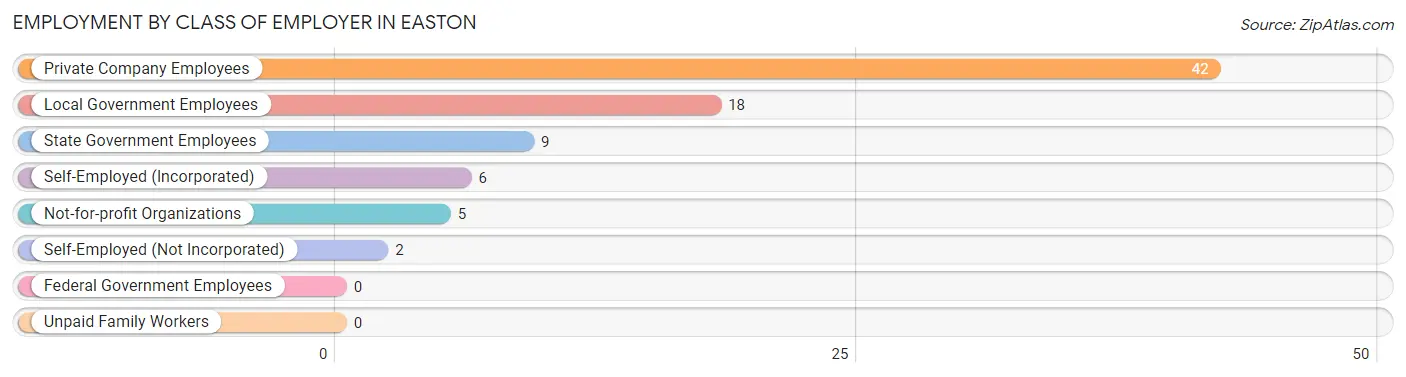
| Employer Class | # Employees | % Employees |
| Private Company Employees | 42 | 51.2% |
| Self-Employed (Incorporated) | 6 | 7.3% |
| Self-Employed (Not Incorporated) | 2 | 2.4% |
| Not-for-profit Organizations | 5 | 6.1% |
| Local Government Employees | 18 | 22.0% |
| State Government Employees | 9 | 11.0% |
| Federal Government Employees | 0 | 0.0% |
| Unpaid Family Workers | 0 | 0.0% |
| Total | 82 | 100.0% |
Employment Status by Age in Easton
According to the labor force statistics for Easton, out of the total population over 16 years of age (124), 67.7% or 84 individuals are in the labor force, with 2.4% or 2 of them unemployed. The age group with the highest labor force participation rate is 16 to 19 years, with 100.0% or 3 individuals in the labor force. Within the labor force, the 35 to 44 years age range has the highest percentage of unemployed individuals, with 6.1% or 2 of them being unemployed.
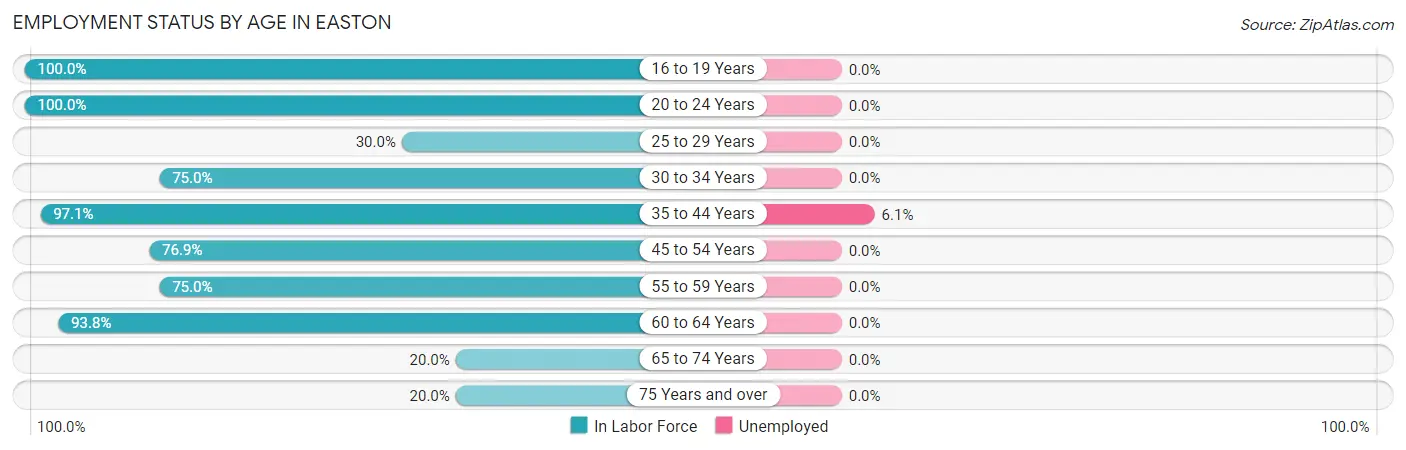
| Age Bracket | In Labor Force | Unemployed |
| 16 to 19 Years | 3 (100.0%) | 0 (0.0%) |
| 20 to 24 Years | 2 (100.0%) | 0 (0.0%) |
| 25 to 29 Years | 3 (30.0%) | 0 (0.0%) |
| 30 to 34 Years | 6 (75.0%) | 0 (0.0%) |
| 35 to 44 Years | 33 (97.1%) | 2 (6.1%) |
| 45 to 54 Years | 10 (76.9%) | 0 (0.0%) |
| 55 to 59 Years | 6 (75.0%) | 0 (0.0%) |
| 60 to 64 Years | 15 (93.8%) | 0 (0.0%) |
| 65 to 74 Years | 3 (20.0%) | 0 (0.0%) |
| 75 Years and over | 3 (20.0%) | 0 (0.0%) |
| Total | 84 (67.7%) | 2 (2.4%) |
Employment Status by Educational Attainment in Easton
According to labor force statistics for Easton, 82.0% of individuals (73) out of the total population between 25 and 64 years of age (89) are in the labor force, with 2.7% or 2 of them being unemployed. The group with the highest labor force participation rate are those with the educational attainment of bachelor's degree or higher, with 94.7% or 18 individuals in the labor force. Within the labor force, individuals with college / associate degree education have the highest percentage of unemployment, with 5.6% or 2 of them being unemployed.
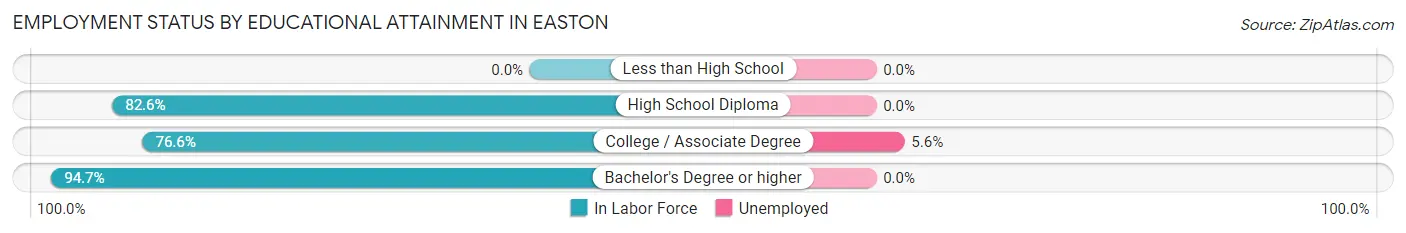
| Educational Attainment | In Labor Force | Unemployed |
| Less than High School | 0 (0.0%) | 0 (0.0%) |
| High School Diploma | 19 (82.6%) | 0 (0.0%) |
| College / Associate Degree | 36 (76.6%) | 3 (5.6%) |
| Bachelor's Degree or higher | 18 (94.7%) | 0 (0.0%) |
| Total | 73 (82.0%) | 2 (2.7%) |
Employment Occupations by Sex in Easton
Management, Business, Science and Arts Occupations
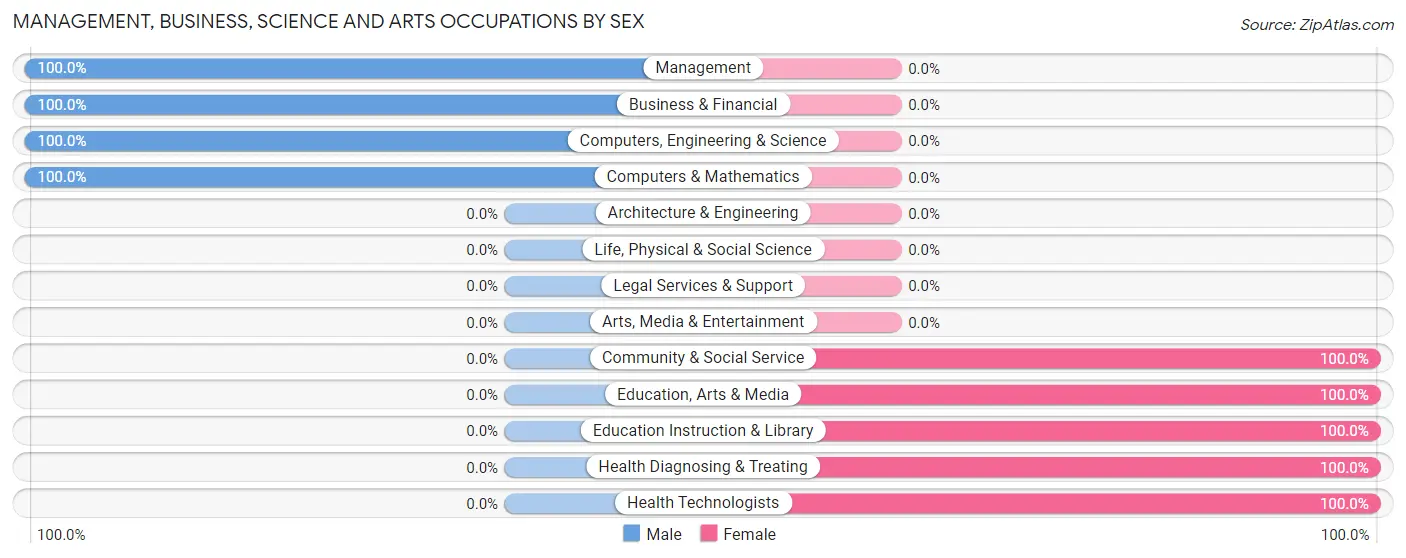
The most common Management, Business, Science and Arts occupations in Easton are Community & Social Service (12 | 14.6%), Education, Arts & Media (8 | 9.8%), Management (4 | 4.9%), Education Instruction & Library (4 | 4.9%), and Computers, Engineering & Science (3 | 3.7%).
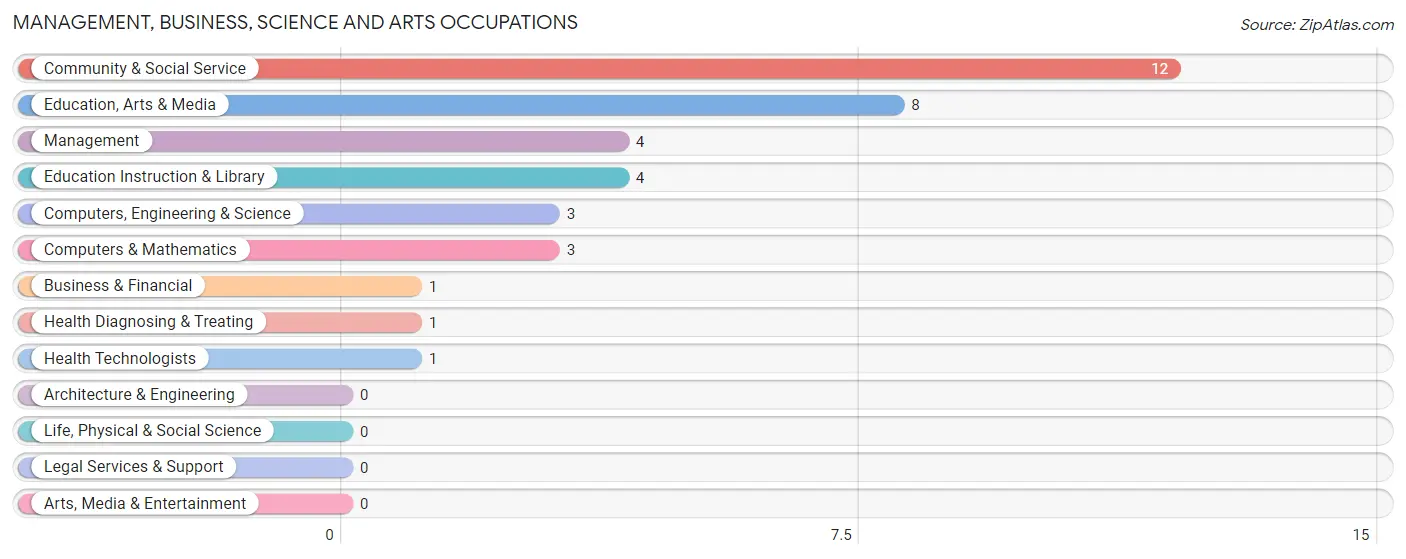
Management, Business, Science and Arts Occupations by Sex
Within the Management, Business, Science and Arts occupations in Easton, the most male-oriented occupations are Management (100.0%), Business & Financial (100.0%), and Computers, Engineering & Science (100.0%), while the most female-oriented occupations are Community & Social Service (100.0%), Education, Arts & Media (100.0%), and Education Instruction & Library (100.0%).
| Occupation | Male | Female |
| Management | 4 (100.0%) | 0 (0.0%) |
| Business & Financial | 1 (100.0%) | 0 (0.0%) |
| Computers, Engineering & Science | 3 (100.0%) | 0 (0.0%) |
| Computers & Mathematics | 3 (100.0%) | 0 (0.0%) |
| Architecture & Engineering | 0 (0.0%) | 0 (0.0%) |
| Life, Physical & Social Science | 0 (0.0%) | 0 (0.0%) |
| Community & Social Service | 0 (0.0%) | 12 (100.0%) |
| Education, Arts & Media | 0 (0.0%) | 8 (100.0%) |
| Legal Services & Support | 0 (0.0%) | 0 (0.0%) |
| Education Instruction & Library | 0 (0.0%) | 4 (100.0%) |
| Arts, Media & Entertainment | 0 (0.0%) | 0 (0.0%) |
| Health Diagnosing & Treating | 0 (0.0%) | 1 (100.0%) |
| Health Technologists | 0 (0.0%) | 1 (100.0%) |
| Total (Category) | 8 (38.1%) | 13 (61.9%) |
| Total (Overall) | 46 (56.1%) | 36 (43.9%) |
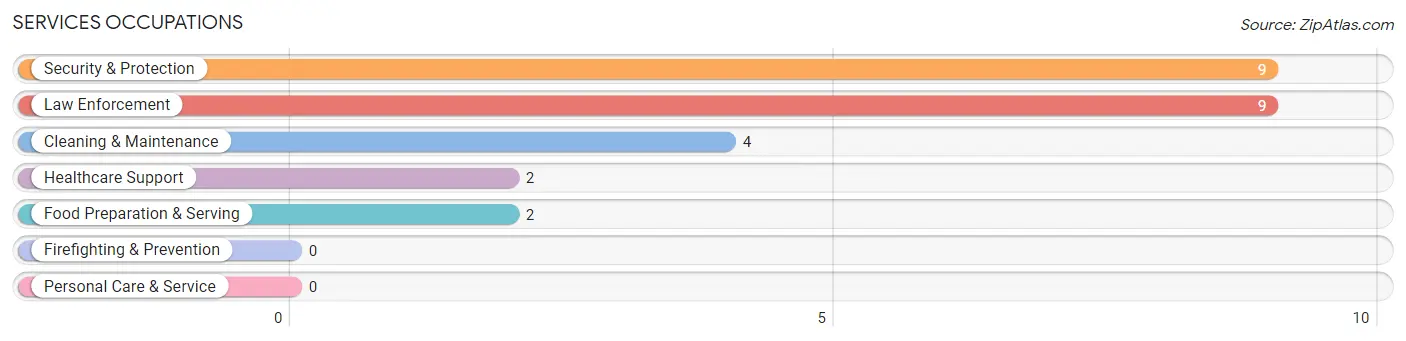
Services Occupations
The most common Services occupations in Easton are Security & Protection (9 | 11.0%), Law Enforcement (9 | 11.0%), Cleaning & Maintenance (4 | 4.9%), Healthcare Support (2 | 2.4%), and Food Preparation & Serving (2 | 2.4%).
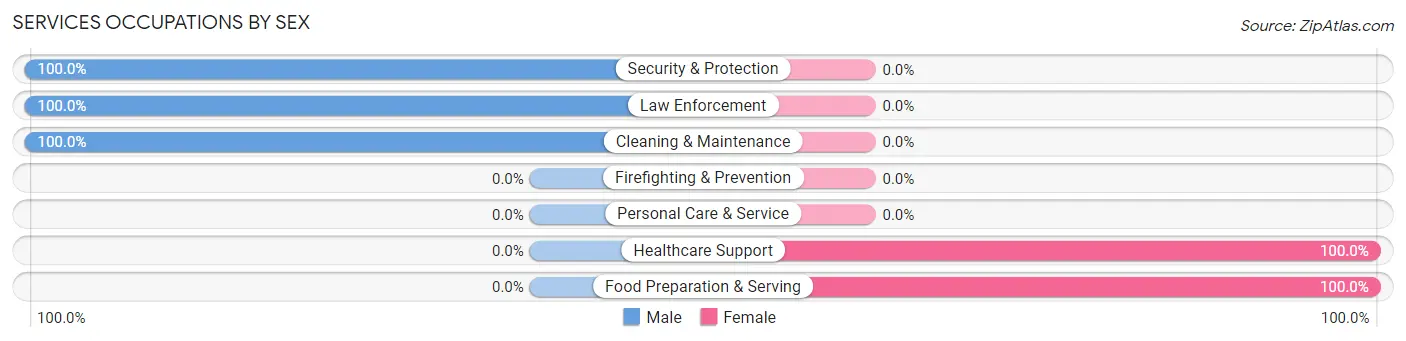
Services Occupations by Sex
Within the Services occupations in Easton, the most male-oriented occupations are Security & Protection (100.0%), Law Enforcement (100.0%), and Cleaning & Maintenance (100.0%), while the most female-oriented occupations are Healthcare Support (100.0%), and Food Preparation & Serving (100.0%).
| Occupation | Male | Female |
| Healthcare Support | 0 (0.0%) | 2 (100.0%) |
| Security & Protection | 9 (100.0%) | 0 (0.0%) |
| Firefighting & Prevention | 0 (0.0%) | 0 (0.0%) |
| Law Enforcement | 9 (100.0%) | 0 (0.0%) |
| Food Preparation & Serving | 0 (0.0%) | 2 (100.0%) |
| Cleaning & Maintenance | 4 (100.0%) | 0 (0.0%) |
| Personal Care & Service | 0 (0.0%) | 0 (0.0%) |
| Total (Category) | 13 (76.5%) | 4 (23.5%) |
| Total (Overall) | 46 (56.1%) | 36 (43.9%) |
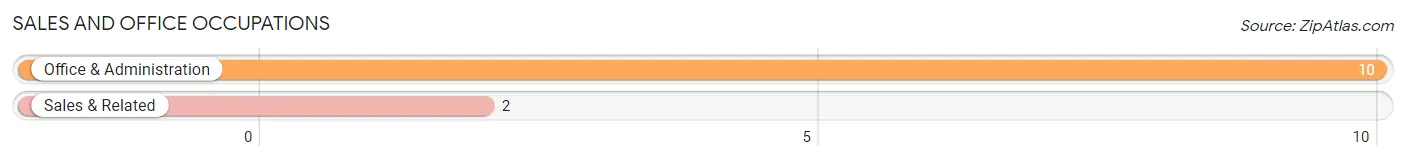
Sales and Office Occupations
The most common Sales and Office occupations in Easton are Office & Administration (10 | 12.2%), and Sales & Related (2 | 2.4%).
Sales and Office Occupations by Sex
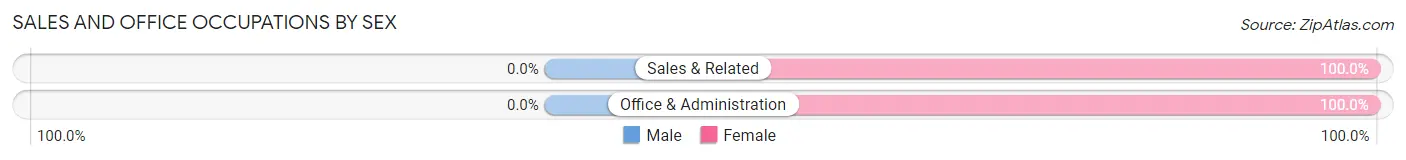
| Occupation | Male | Female |
| Sales & Related | 0 (0.0%) | 2 (100.0%) |
| Office & Administration | 0 (0.0%) | 10 (100.0%) |
| Total (Category) | 0 (0.0%) | 12 (100.0%) |
| Total (Overall) | 46 (56.1%) | 36 (43.9%) |
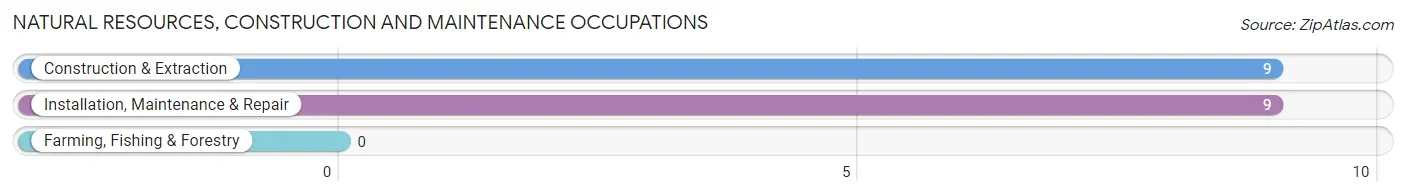
Natural Resources, Construction and Maintenance Occupations
The most common Natural Resources, Construction and Maintenance occupations in Easton are Construction & Extraction (9 | 11.0%), and Installation, Maintenance & Repair (9 | 11.0%).
Natural Resources, Construction and Maintenance Occupations by Sex
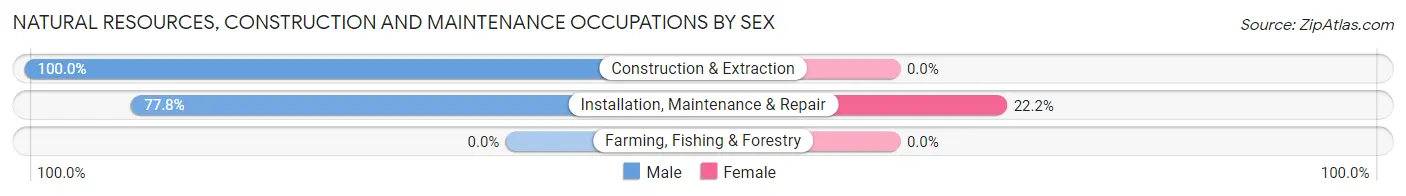
| Occupation | Male | Female |
| Farming, Fishing & Forestry | 0 (0.0%) | 0 (0.0%) |
| Construction & Extraction | 9 (100.0%) | 0 (0.0%) |
| Installation, Maintenance & Repair | 7 (77.8%) | 2 (22.2%) |
| Total (Category) | 16 (88.9%) | 2 (11.1%) |
| Total (Overall) | 46 (56.1%) | 36 (43.9%) |
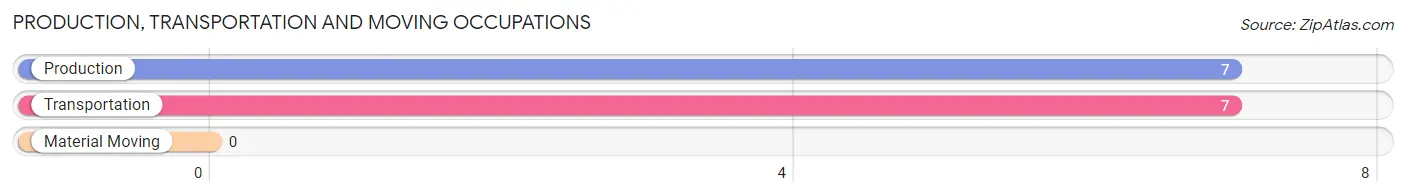
Production, Transportation and Moving Occupations
The most common Production, Transportation and Moving occupations in Easton are Production (7 | 8.5%), and Transportation (7 | 8.5%).
Production, Transportation and Moving Occupations by Sex
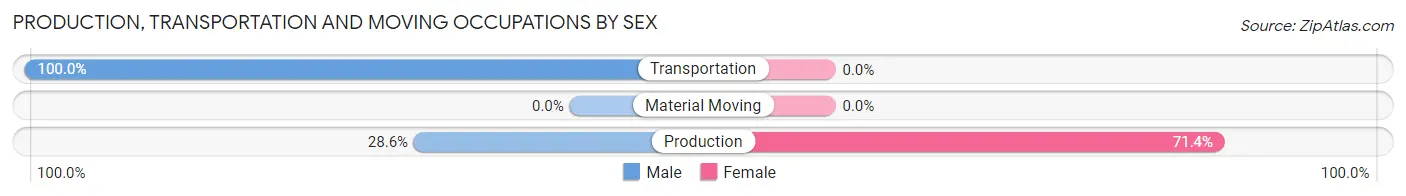
| Occupation | Male | Female |
| Production | 2 (28.6%) | 5 (71.4%) |
| Transportation | 7 (100.0%) | 0 (0.0%) |
| Material Moving | 0 (0.0%) | 0 (0.0%) |
| Total (Category) | 9 (64.3%) | 5 (35.7%) |
| Total (Overall) | 46 (56.1%) | 36 (43.9%) |
Employment Industries by Sex in Easton
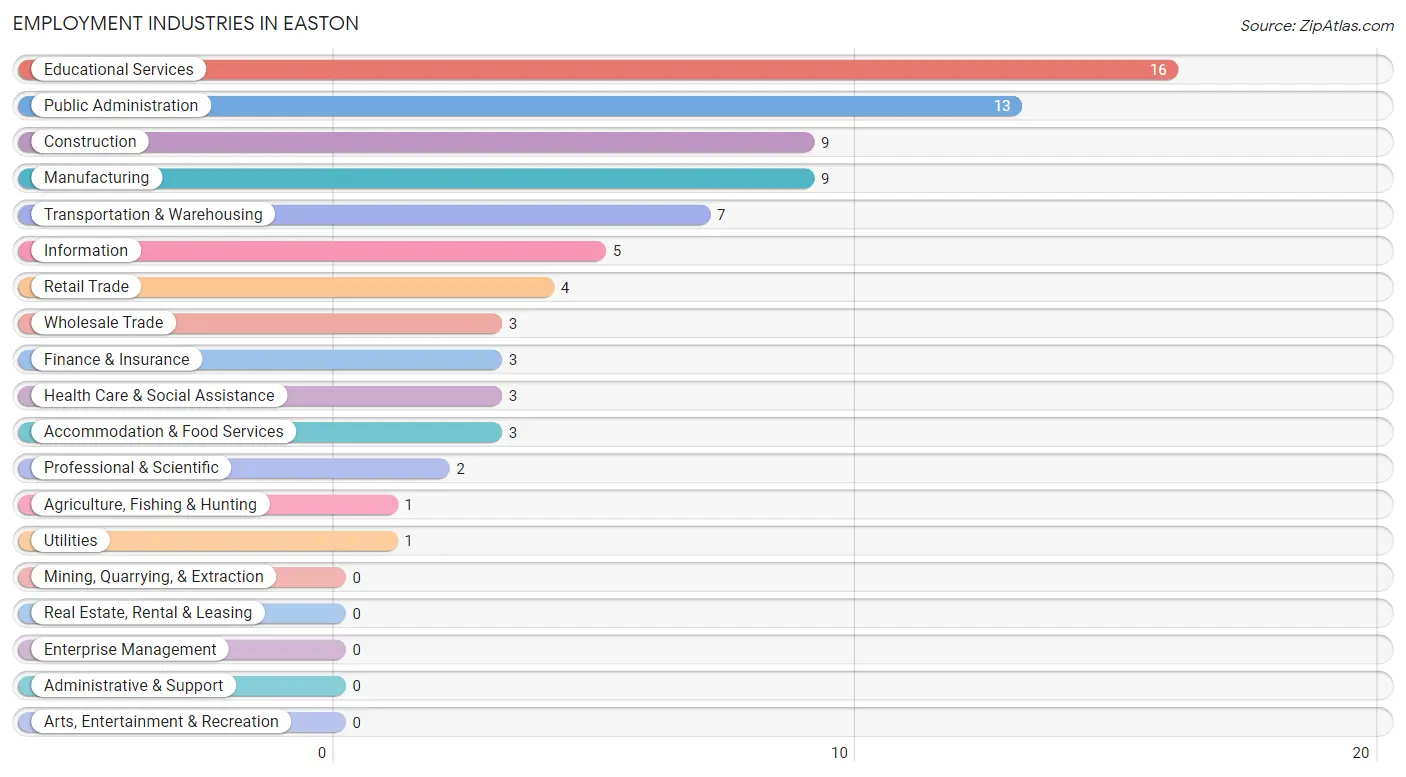
Employment Industries in Easton
The major employment industries in Easton include Educational Services (16 | 19.5%), Public Administration (13 | 15.9%), Construction (9 | 11.0%), Manufacturing (9 | 11.0%), and Transportation & Warehousing (7 | 8.5%).
Employment Industries by Sex in Easton
The Easton industries that see more men than women are Agriculture, Fishing & Hunting (100.0%), Wholesale Trade (100.0%), and Utilities (100.0%), whereas the industries that tend to have a higher number of women are Retail Trade (100.0%), Health Care & Social Assistance (100.0%), and Accommodation & Food Services (100.0%).
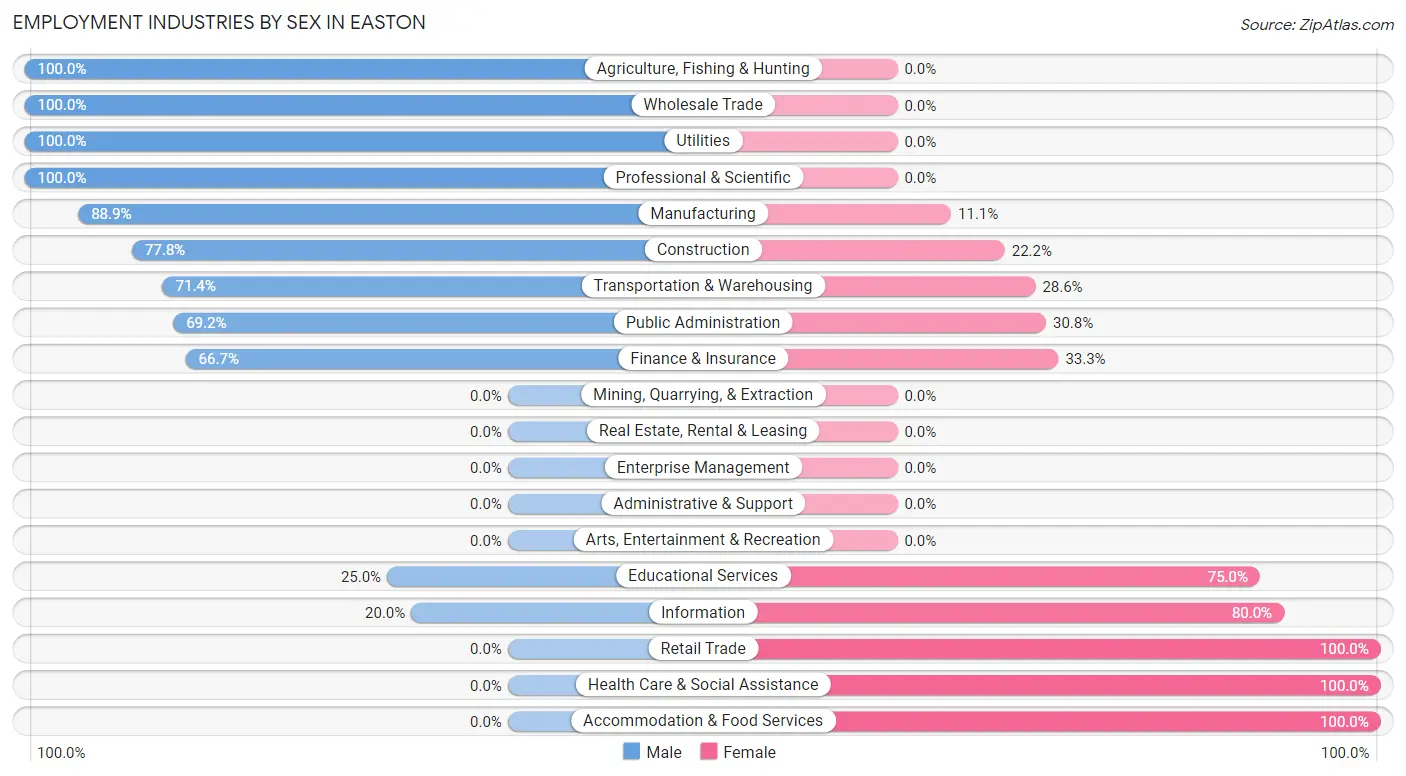
| Industry | Male | Female |
| Agriculture, Fishing & Hunting | 1 (100.0%) | 0 (0.0%) |
| Mining, Quarrying, & Extraction | 0 (0.0%) | 0 (0.0%) |
| Construction | 7 (77.8%) | 2 (22.2%) |
| Manufacturing | 8 (88.9%) | 1 (11.1%) |
| Wholesale Trade | 3 (100.0%) | 0 (0.0%) |
| Retail Trade | 0 (0.0%) | 4 (100.0%) |
| Transportation & Warehousing | 5 (71.4%) | 2 (28.6%) |
| Utilities | 1 (100.0%) | 0 (0.0%) |
| Information | 1 (20.0%) | 4 (80.0%) |
| Finance & Insurance | 2 (66.7%) | 1 (33.3%) |
| Real Estate, Rental & Leasing | 0 (0.0%) | 0 (0.0%) |
| Professional & Scientific | 2 (100.0%) | 0 (0.0%) |
| Enterprise Management | 0 (0.0%) | 0 (0.0%) |
| Administrative & Support | 0 (0.0%) | 0 (0.0%) |
| Educational Services | 4 (25.0%) | 12 (75.0%) |
| Health Care & Social Assistance | 0 (0.0%) | 3 (100.0%) |
| Arts, Entertainment & Recreation | 0 (0.0%) | 0 (0.0%) |
| Accommodation & Food Services | 0 (0.0%) | 3 (100.0%) |
| Public Administration | 9 (69.2%) | 4 (30.8%) |
| Total | 46 (56.1%) | 36 (43.9%) |
Education in Easton
School Enrollment in Easton
The most common levels of schooling among the 43 students in Easton are elementary school (20 | 46.5%), nursery / preschool (16 | 37.2%), and college / undergraduate (4 | 9.3%).
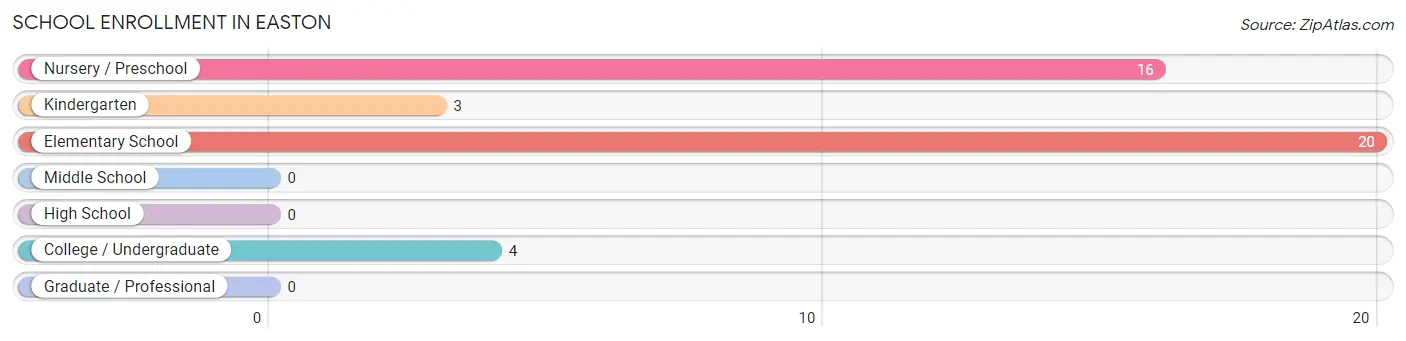
| School Level | # Students | % Students |
| Nursery / Preschool | 16 | 37.2% |
| Kindergarten | 3 | 7.0% |
| Elementary School | 20 | 46.5% |
| Middle School | 0 | 0.0% |
| High School | 0 | 0.0% |
| College / Undergraduate | 4 | 9.3% |
| Graduate / Professional | 0 | 0.0% |
| Total | 43 | 100.0% |
School Enrollment by Age by Funding Source in Easton
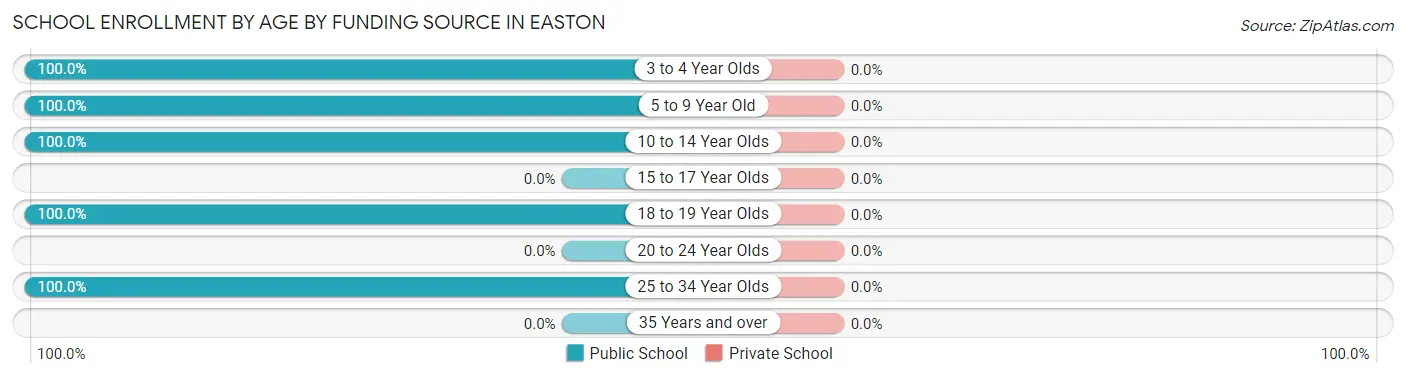
| Age Bracket | Public School | Private School |
| 3 to 4 Year Olds | 11 (100.0%) | 0 (0.0%) |
| 5 to 9 Year Old | 18 (100.0%) | 0 (0.0%) |
| 10 to 14 Year Olds | 10 (100.0%) | 0 (0.0%) |
| 15 to 17 Year Olds | 0 (0.0%) | 0 (0.0%) |
| 18 to 19 Year Olds | 1 (100.0%) | 0 (0.0%) |
| 20 to 24 Year Olds | 0 (0.0%) | 0 (0.0%) |
| 25 to 34 Year Olds | 3 (100.0%) | 0 (0.0%) |
| 35 Years and over | 0 (0.0%) | 0 (0.0%) |
| Total | 43 (100.0%) | 0 (0.0%) |
Educational Attainment by Field of Study in Easton
Arts & humanities (8 | 36.4%), science & technology (4 | 18.2%), education (3 | 13.6%), computers & mathematics (2 | 9.1%), and business (2 | 9.1%) are the most common fields of study among 22 individuals in Easton who have obtained a bachelor's degree or higher.
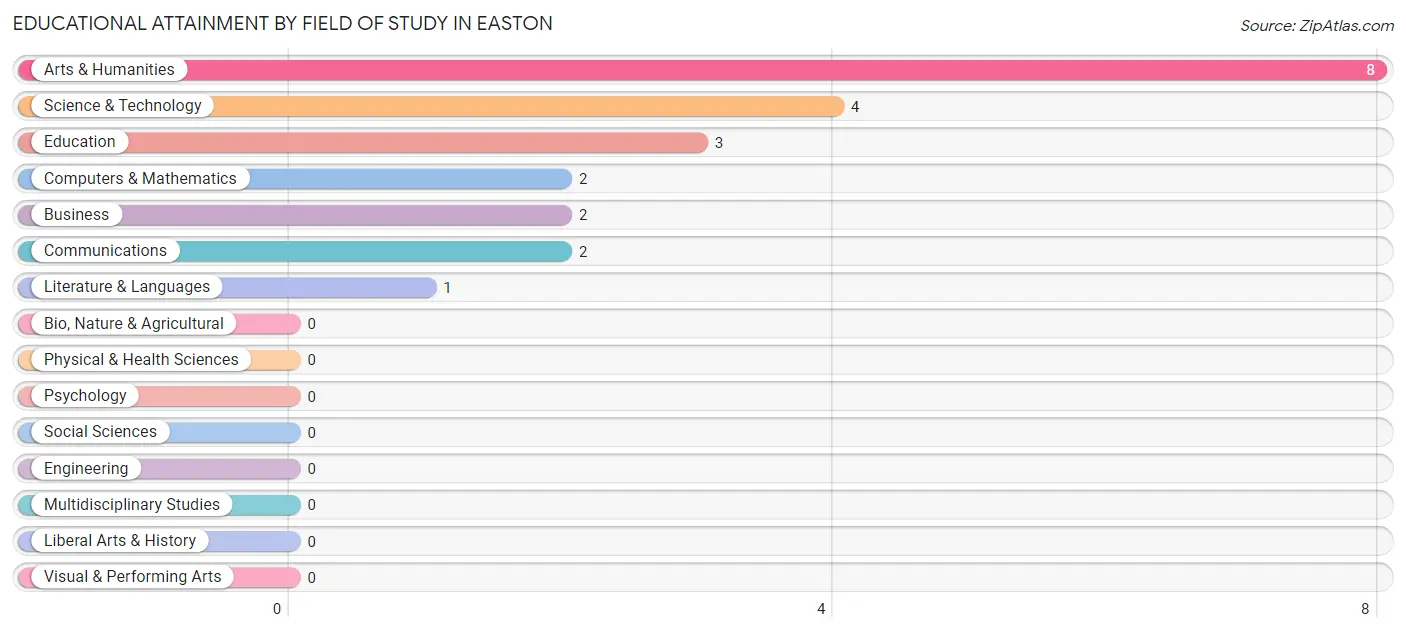
| Field of Study | # Graduates | % Graduates |
| Computers & Mathematics | 2 | 9.1% |
| Bio, Nature & Agricultural | 0 | 0.0% |
| Physical & Health Sciences | 0 | 0.0% |
| Psychology | 0 | 0.0% |
| Social Sciences | 0 | 0.0% |
| Engineering | 0 | 0.0% |
| Multidisciplinary Studies | 0 | 0.0% |
| Science & Technology | 4 | 18.2% |
| Business | 2 | 9.1% |
| Education | 3 | 13.6% |
| Literature & Languages | 1 | 4.5% |
| Liberal Arts & History | 0 | 0.0% |
| Visual & Performing Arts | 0 | 0.0% |
| Communications | 2 | 9.1% |
| Arts & Humanities | 8 | 36.4% |
| Total | 22 | 100.0% |
Transportation & Commute in Easton
Vehicle Availability by Sex in Easton
The most prevalent vehicle ownership categories in Easton are males with 2 vehicles (25, accounting for 54.3%) and females with 2 vehicles (13, making up 69.4%).
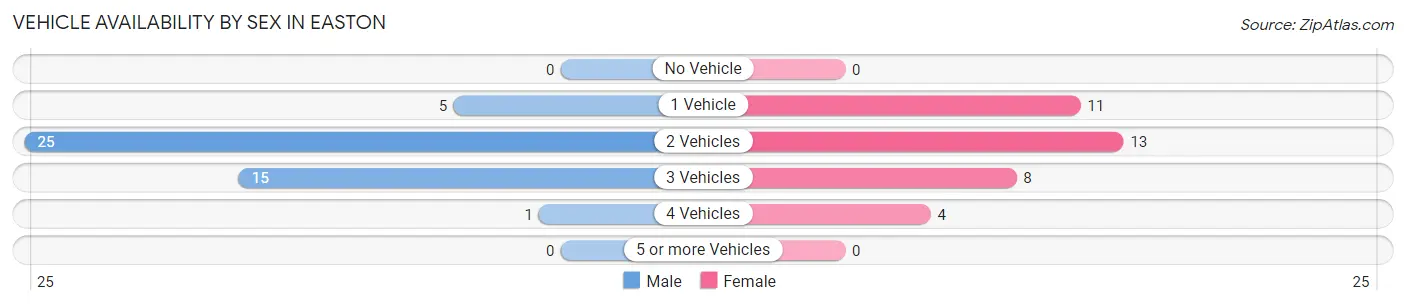
| Vehicles Available | Male | Female |
| No Vehicle | 0 (0.0%) | 0 (0.0%) |
| 1 Vehicle | 5 (10.9%) | 11 (30.6%) |
| 2 Vehicles | 25 (54.3%) | 13 (36.1%) |
| 3 Vehicles | 15 (32.6%) | 8 (22.2%) |
| 4 Vehicles | 1 (2.2%) | 4 (11.1%) |
| 5 or more Vehicles | 0 (0.0%) | 0 (0.0%) |
| Total | 46 (100.0%) | 36 (100.0%) |
Commute Time in Easton
The most frequently occuring commute durations in Easton are 45 to 59 minutes (18 commuters, 22.5%), 10 to 14 minutes (12 commuters, 15.0%), and 15 to 19 minutes (12 commuters, 15.0%).
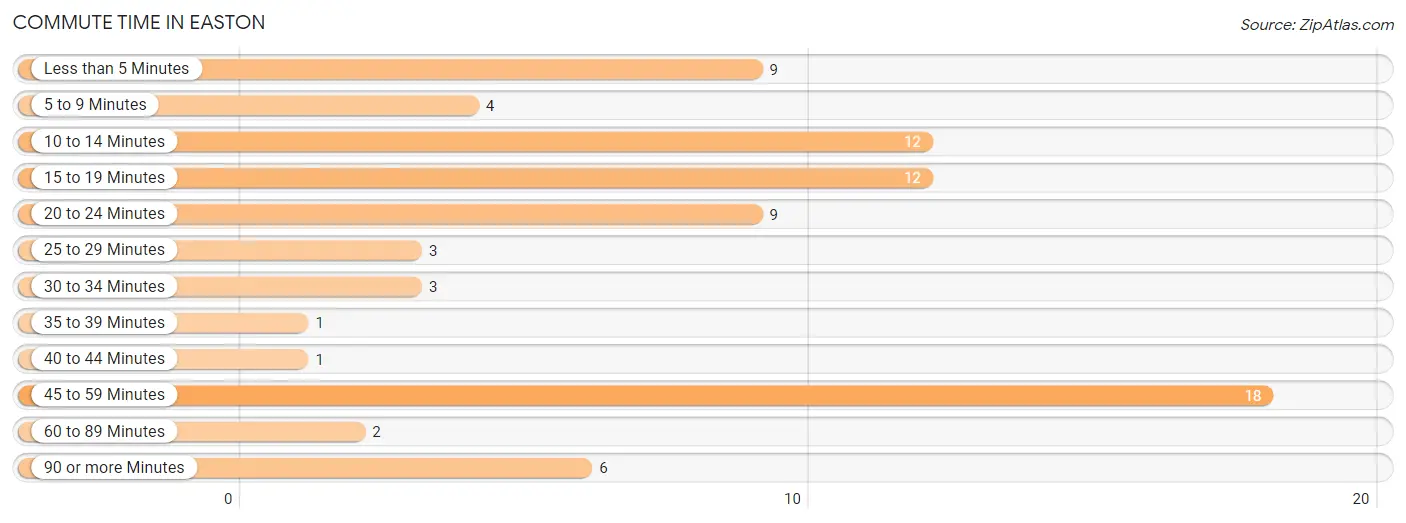
| Commute Time | # Commuters | % Commuters |
| Less than 5 Minutes | 9 | 11.3% |
| 5 to 9 Minutes | 4 | 5.0% |
| 10 to 14 Minutes | 12 | 15.0% |
| 15 to 19 Minutes | 12 | 15.0% |
| 20 to 24 Minutes | 9 | 11.3% |
| 25 to 29 Minutes | 3 | 3.7% |
| 30 to 34 Minutes | 3 | 3.7% |
| 35 to 39 Minutes | 1 | 1.3% |
| 40 to 44 Minutes | 1 | 1.3% |
| 45 to 59 Minutes | 18 | 22.5% |
| 60 to 89 Minutes | 2 | 2.5% |
| 90 or more Minutes | 6 | 7.5% |
Commute Time by Sex in Easton
The most common commute times in Easton are 15 to 19 minutes (9 commuters, 20.4%) for males and 45 to 59 minutes (9 commuters, 25.0%) for females.
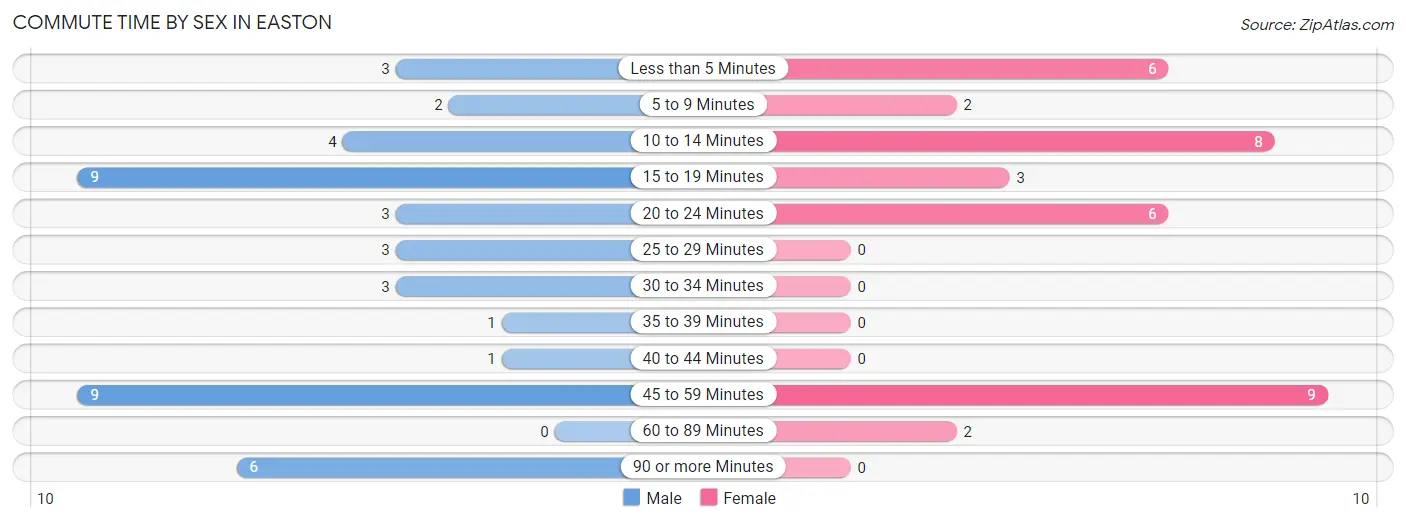
| Commute Time | Male | Female |
| Less than 5 Minutes | 3 (6.8%) | 6 (16.7%) |
| 5 to 9 Minutes | 2 (4.5%) | 2 (5.6%) |
| 10 to 14 Minutes | 4 (9.1%) | 8 (22.2%) |
| 15 to 19 Minutes | 9 (20.4%) | 3 (8.3%) |
| 20 to 24 Minutes | 3 (6.8%) | 6 (16.7%) |
| 25 to 29 Minutes | 3 (6.8%) | 0 (0.0%) |
| 30 to 34 Minutes | 3 (6.8%) | 0 (0.0%) |
| 35 to 39 Minutes | 1 (2.3%) | 0 (0.0%) |
| 40 to 44 Minutes | 1 (2.3%) | 0 (0.0%) |
| 45 to 59 Minutes | 9 (20.4%) | 9 (25.0%) |
| 60 to 89 Minutes | 0 (0.0%) | 2 (5.6%) |
| 90 or more Minutes | 6 (13.6%) | 0 (0.0%) |
Time of Departure to Work by Sex in Easton
The most frequent times of departure to work in Easton are 6:00 AM to 6:29 AM (10, 22.7%) for males and 7:00 AM to 7:29 AM (11, 30.6%) for females.
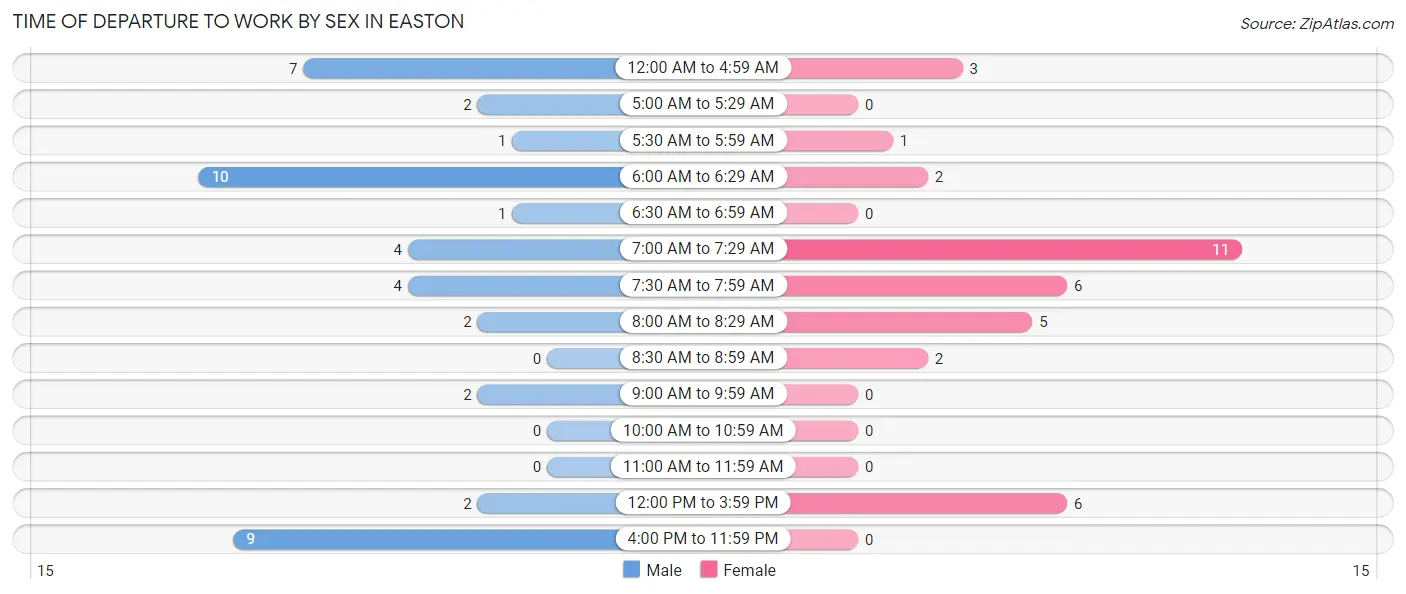
| Time of Departure | Male | Female |
| 12:00 AM to 4:59 AM | 7 (15.9%) | 3 (8.3%) |
| 5:00 AM to 5:29 AM | 2 (4.5%) | 0 (0.0%) |
| 5:30 AM to 5:59 AM | 1 (2.3%) | 1 (2.8%) |
| 6:00 AM to 6:29 AM | 10 (22.7%) | 2 (5.6%) |
| 6:30 AM to 6:59 AM | 1 (2.3%) | 0 (0.0%) |
| 7:00 AM to 7:29 AM | 4 (9.1%) | 11 (30.6%) |
| 7:30 AM to 7:59 AM | 4 (9.1%) | 6 (16.7%) |
| 8:00 AM to 8:29 AM | 2 (4.5%) | 5 (13.9%) |
| 8:30 AM to 8:59 AM | 0 (0.0%) | 2 (5.6%) |
| 9:00 AM to 9:59 AM | 2 (4.5%) | 0 (0.0%) |
| 10:00 AM to 10:59 AM | 0 (0.0%) | 0 (0.0%) |
| 11:00 AM to 11:59 AM | 0 (0.0%) | 0 (0.0%) |
| 12:00 PM to 3:59 PM | 2 (4.5%) | 6 (16.7%) |
| 4:00 PM to 11:59 PM | 9 (20.4%) | 0 (0.0%) |
| Total | 44 (100.0%) | 36 (100.0%) |
Housing Occupancy in Easton
Occupancy by Ownership in Easton
Of the total 74 dwellings in Easton, owner-occupied units account for 65 (87.8%), while renter-occupied units make up 9 (12.2%).
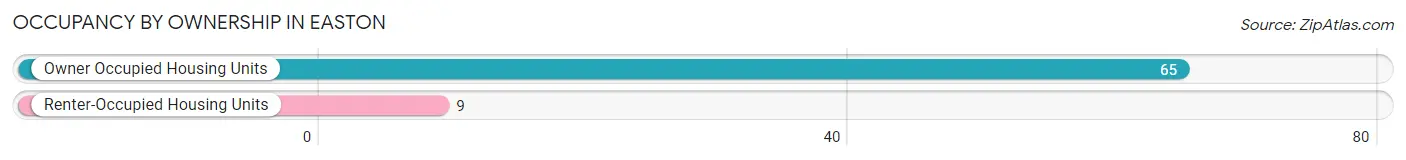
| Occupancy | # Housing Units | % Housing Units |
| Owner Occupied Housing Units | 65 | 87.8% |
| Renter-Occupied Housing Units | 9 | 12.2% |
| Total Occupied Housing Units | 74 | 100.0% |
Occupancy by Household Size in Easton
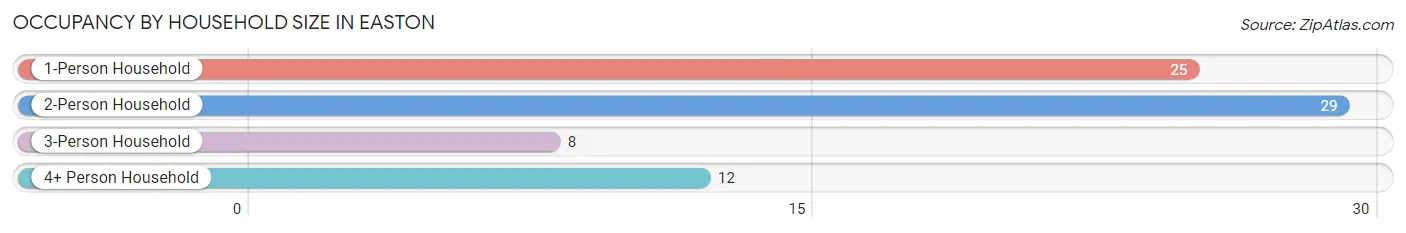
| Household Size | # Housing Units | % Housing Units |
| 1-Person Household | 25 | 33.8% |
| 2-Person Household | 29 | 39.2% |
| 3-Person Household | 8 | 10.8% |
| 4+ Person Household | 12 | 16.2% |
| Total Housing Units | 74 | 100.0% |
Occupancy by Ownership by Household Size in Easton
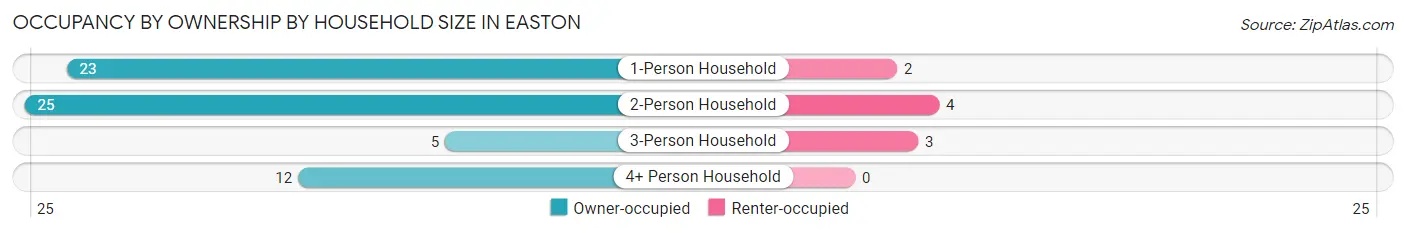
| Household Size | Owner-occupied | Renter-occupied |
| 1-Person Household | 23 (92.0%) | 2 (8.0%) |
| 2-Person Household | 25 (86.2%) | 4 (13.8%) |
| 3-Person Household | 5 (62.5%) | 3 (37.5%) |
| 4+ Person Household | 12 (100.0%) | 0 (0.0%) |
| Total Housing Units | 65 (87.8%) | 9 (12.2%) |
Occupancy by Educational Attainment in Easton
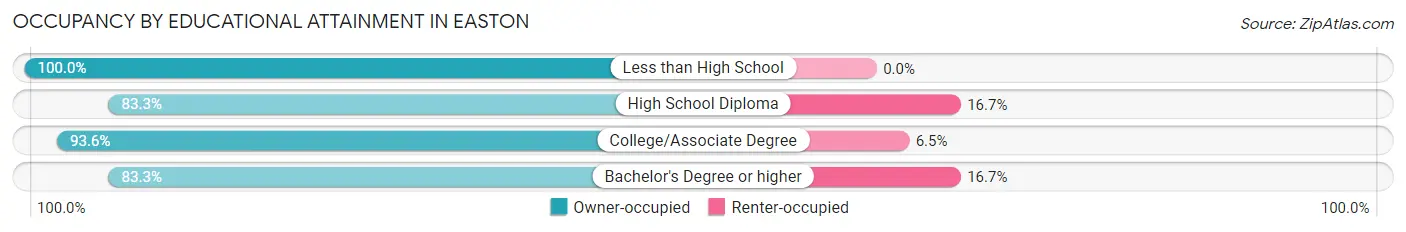
| Household Size | Owner-occupied | Renter-occupied |
| Less than High School | 1 (100.0%) | 0 (0.0%) |
| High School Diploma | 20 (83.3%) | 4 (16.7%) |
| College/Associate Degree | 29 (93.5%) | 2 (6.5%) |
| Bachelor's Degree or higher | 15 (83.3%) | 3 (16.7%) |
Occupancy by Age of Householder in Easton
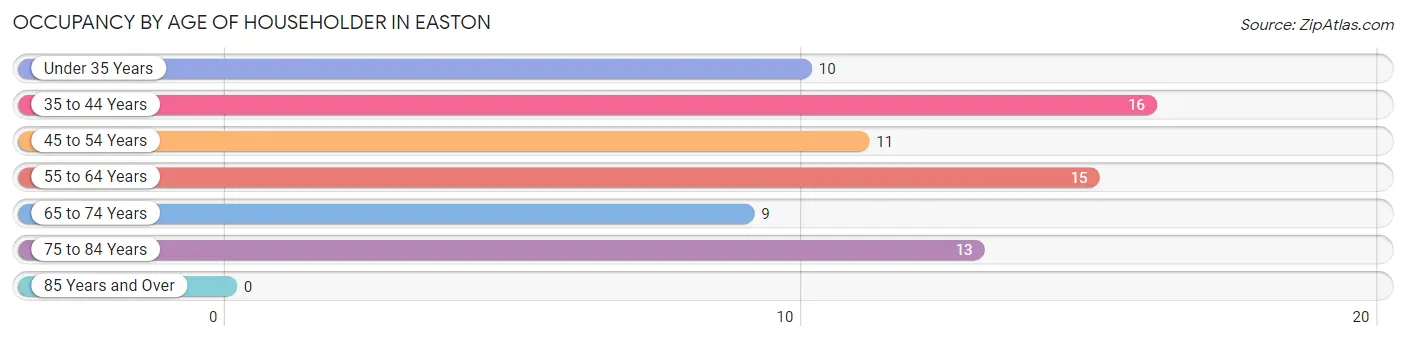
| Age Bracket | # Households | % Households |
| Under 35 Years | 10 | 13.5% |
| 35 to 44 Years | 16 | 21.6% |
| 45 to 54 Years | 11 | 14.9% |
| 55 to 64 Years | 15 | 20.3% |
| 65 to 74 Years | 9 | 12.2% |
| 75 to 84 Years | 13 | 17.6% |
| 85 Years and Over | 0 | 0.0% |
| Total | 74 | 100.0% |
Housing Finances in Easton
Median Income by Occupancy in Easton
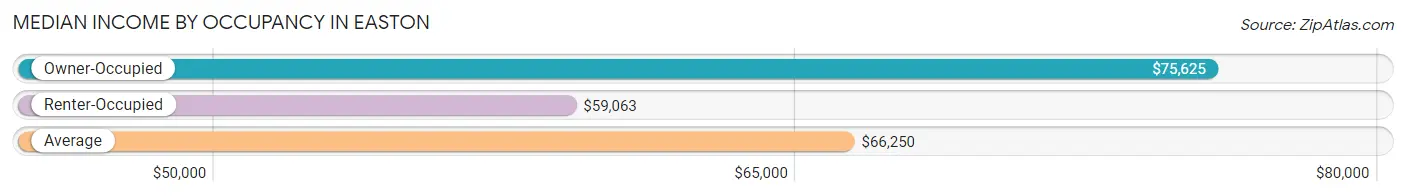
| Occupancy Type | # Households | Median Income |
| Owner-Occupied | 65 (87.8%) | $75,625 |
| Renter-Occupied | 9 (12.2%) | $59,063 |
| Average | 74 (100.0%) | $66,250 |
Occupancy by Householder Income Bracket in Easton
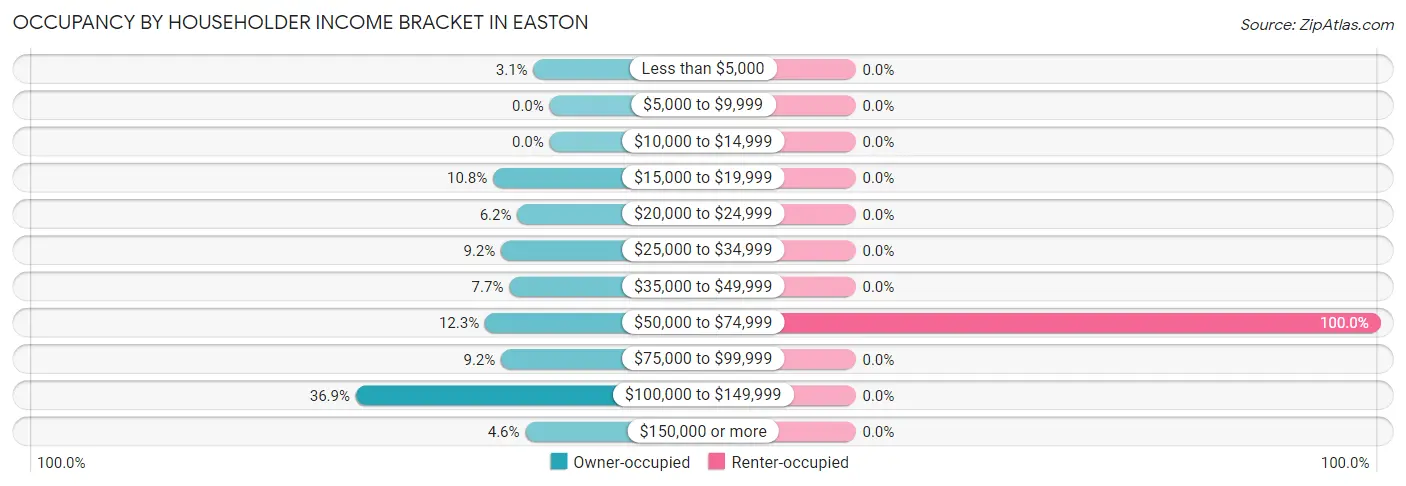
| Income Bracket | Owner-occupied | Renter-occupied |
| Less than $5,000 | 2 (3.1%) | 0 (0.0%) |
| $5,000 to $9,999 | 0 (0.0%) | 0 (0.0%) |
| $10,000 to $14,999 | 0 (0.0%) | 0 (0.0%) |
| $15,000 to $19,999 | 7 (10.8%) | 0 (0.0%) |
| $20,000 to $24,999 | 4 (6.1%) | 0 (0.0%) |
| $25,000 to $34,999 | 6 (9.2%) | 0 (0.0%) |
| $35,000 to $49,999 | 5 (7.7%) | 0 (0.0%) |
| $50,000 to $74,999 | 8 (12.3%) | 9 (100.0%) |
| $75,000 to $99,999 | 6 (9.2%) | 0 (0.0%) |
| $100,000 to $149,999 | 24 (36.9%) | 0 (0.0%) |
| $150,000 or more | 3 (4.6%) | 0 (0.0%) |
| Total | 65 (100.0%) | 9 (100.0%) |
Monthly Housing Cost Tiers in Easton
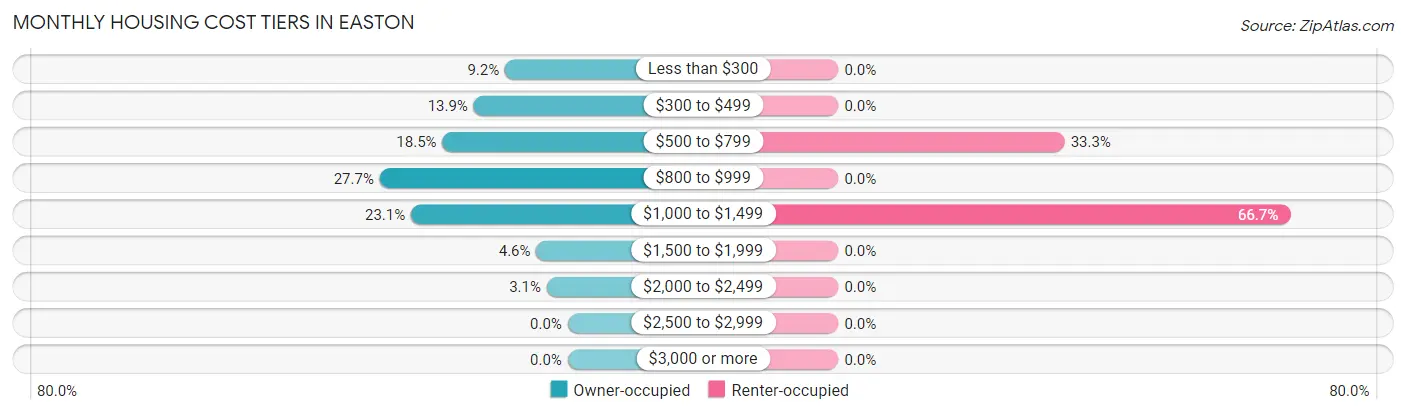
| Monthly Cost | Owner-occupied | Renter-occupied |
| Less than $300 | 6 (9.2%) | 0 (0.0%) |
| $300 to $499 | 9 (13.9%) | 0 (0.0%) |
| $500 to $799 | 12 (18.5%) | 3 (33.3%) |
| $800 to $999 | 18 (27.7%) | 0 (0.0%) |
| $1,000 to $1,499 | 15 (23.1%) | 6 (66.7%) |
| $1,500 to $1,999 | 3 (4.6%) | 0 (0.0%) |
| $2,000 to $2,499 | 2 (3.1%) | 0 (0.0%) |
| $2,500 to $2,999 | 0 (0.0%) | 0 (0.0%) |
| $3,000 or more | 0 (0.0%) | 0 (0.0%) |
| Total | 65 (100.0%) | 9 (100.0%) |
Physical Housing Characteristics in Easton
Housing Structures in Easton
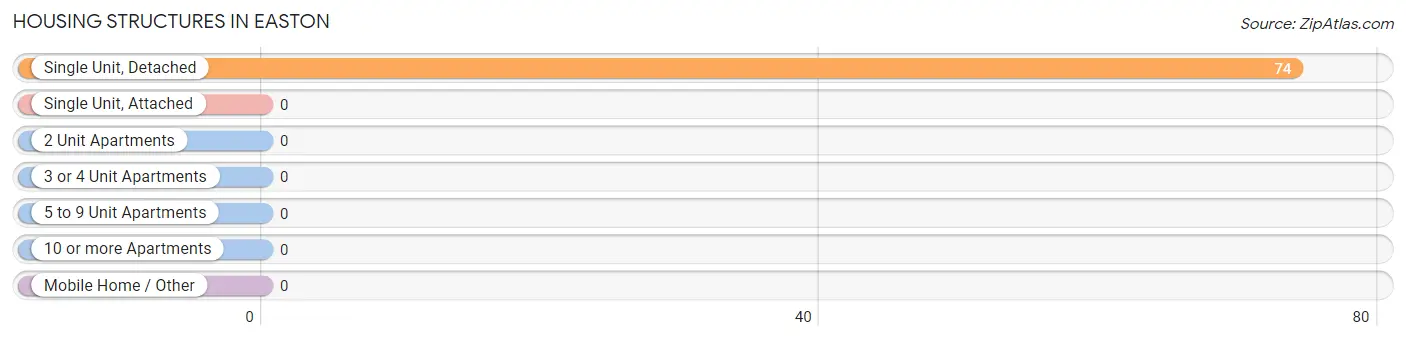
| Structure Type | # Housing Units | % Housing Units |
| Single Unit, Detached | 74 | 100.0% |
| Single Unit, Attached | 0 | 0.0% |
| 2 Unit Apartments | 0 | 0.0% |
| 3 or 4 Unit Apartments | 0 | 0.0% |
| 5 to 9 Unit Apartments | 0 | 0.0% |
| 10 or more Apartments | 0 | 0.0% |
| Mobile Home / Other | 0 | 0.0% |
| Total | 74 | 100.0% |
Housing Structures by Occupancy in Easton
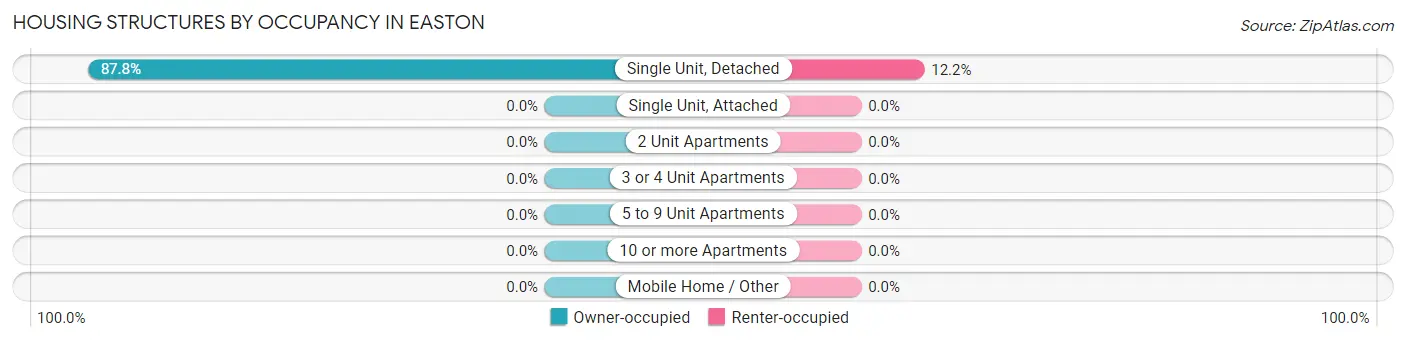
| Structure Type | Owner-occupied | Renter-occupied |
| Single Unit, Detached | 65 (87.8%) | 9 (12.2%) |
| Single Unit, Attached | 0 (0.0%) | 0 (0.0%) |
| 2 Unit Apartments | 0 (0.0%) | 0 (0.0%) |
| 3 or 4 Unit Apartments | 0 (0.0%) | 0 (0.0%) |
| 5 to 9 Unit Apartments | 0 (0.0%) | 0 (0.0%) |
| 10 or more Apartments | 0 (0.0%) | 0 (0.0%) |
| Mobile Home / Other | 0 (0.0%) | 0 (0.0%) |
| Total | 65 (87.8%) | 9 (12.2%) |
Housing Structures by Number of Rooms in Easton
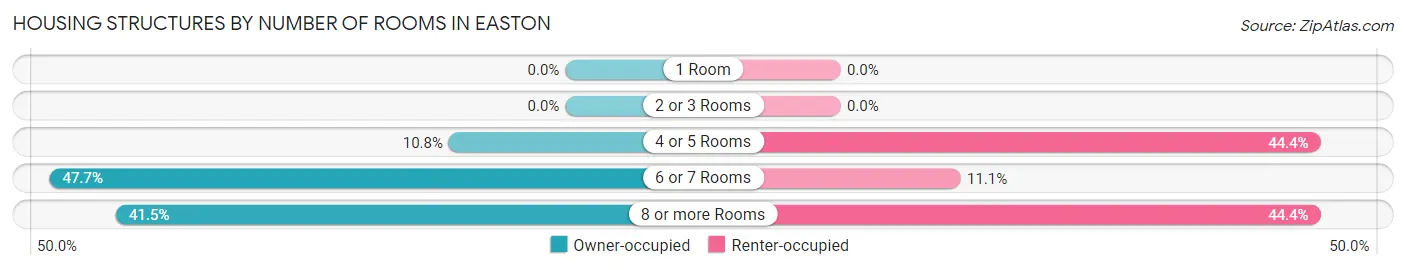
| Number of Rooms | Owner-occupied | Renter-occupied |
| 1 Room | 0 (0.0%) | 0 (0.0%) |
| 2 or 3 Rooms | 0 (0.0%) | 0 (0.0%) |
| 4 or 5 Rooms | 7 (10.8%) | 4 (44.4%) |
| 6 or 7 Rooms | 31 (47.7%) | 1 (11.1%) |
| 8 or more Rooms | 27 (41.5%) | 4 (44.4%) |
| Total | 65 (100.0%) | 9 (100.0%) |
Housing Structure by Heating Type in Easton
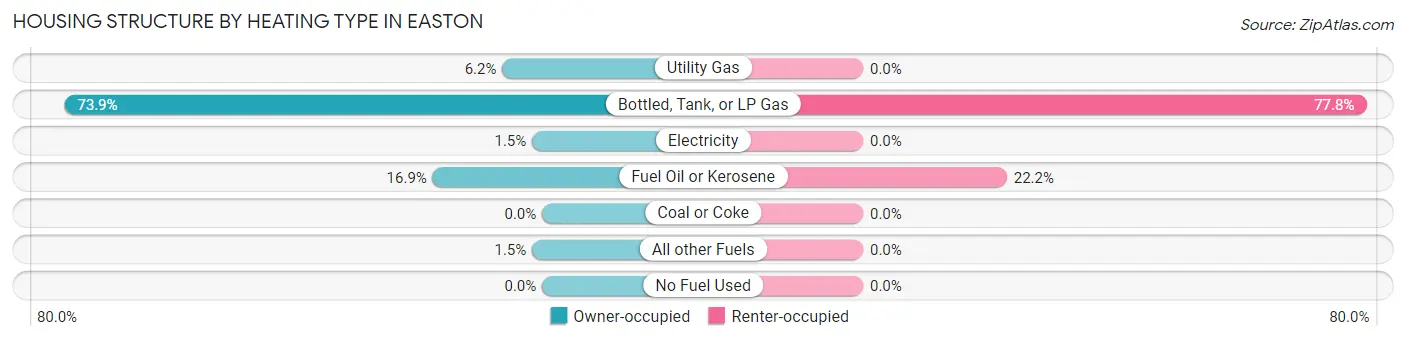
| Heating Type | Owner-occupied | Renter-occupied |
| Utility Gas | 4 (6.1%) | 0 (0.0%) |
| Bottled, Tank, or LP Gas | 48 (73.9%) | 7 (77.8%) |
| Electricity | 1 (1.5%) | 0 (0.0%) |
| Fuel Oil or Kerosene | 11 (16.9%) | 2 (22.2%) |
| Coal or Coke | 0 (0.0%) | 0 (0.0%) |
| All other Fuels | 1 (1.5%) | 0 (0.0%) |
| No Fuel Used | 0 (0.0%) | 0 (0.0%) |
| Total | 65 (100.0%) | 9 (100.0%) |
Household Vehicle Usage in Easton
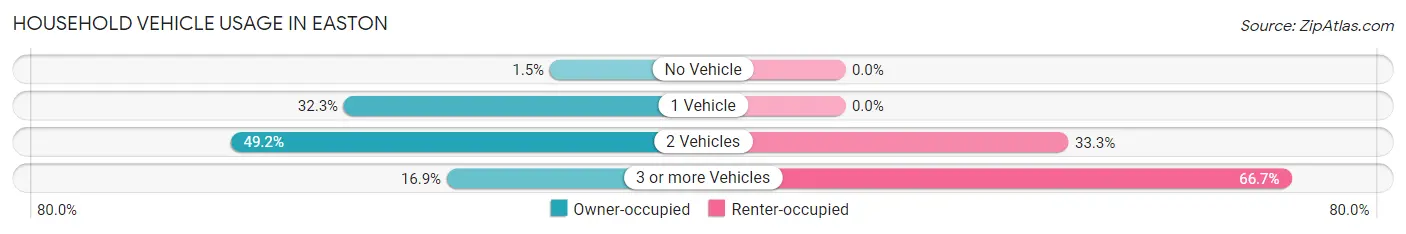
| Vehicles per Household | Owner-occupied | Renter-occupied |
| No Vehicle | 1 (1.5%) | 0 (0.0%) |
| 1 Vehicle | 21 (32.3%) | 0 (0.0%) |
| 2 Vehicles | 32 (49.2%) | 3 (33.3%) |
| 3 or more Vehicles | 11 (16.9%) | 6 (66.7%) |
| Total | 65 (100.0%) | 9 (100.0%) |
Real Estate & Mortgages in Easton
Real Estate and Mortgage Overview in Easton
| Characteristic | Without Mortgage | With Mortgage |
| Housing Units | 37 | 28 |
| Median Property Value | $81,000 | $95,300 |
| Median Household Income | $35,625 | $3 |
| Monthly Housing Costs | $588 | $0 |
| Real Estate Taxes | $990 | $0 |
Property Value by Mortgage Status in Easton
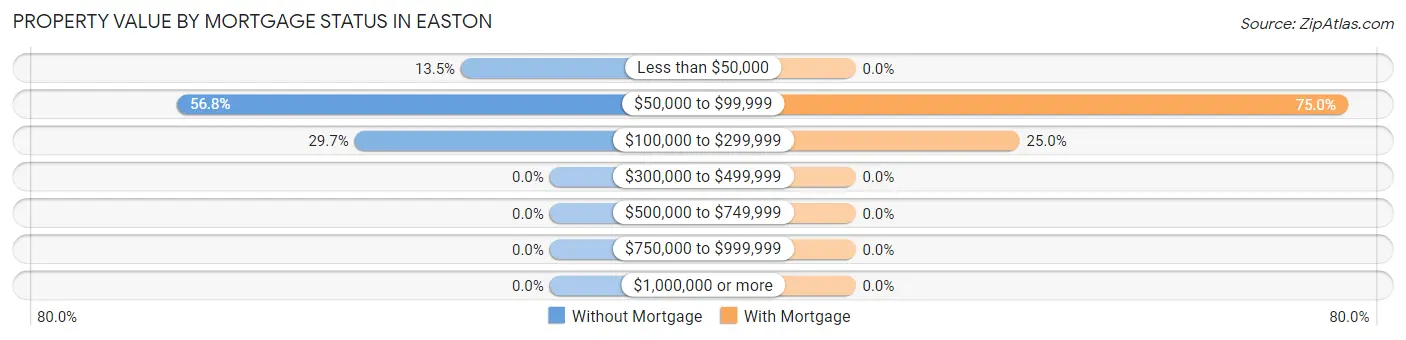
| Property Value | Without Mortgage | With Mortgage |
| Less than $50,000 | 5 (13.5%) | 0 (0.0%) |
| $50,000 to $99,999 | 21 (56.8%) | 21 (75.0%) |
| $100,000 to $299,999 | 11 (29.7%) | 7 (25.0%) |
| $300,000 to $499,999 | 0 (0.0%) | 0 (0.0%) |
| $500,000 to $749,999 | 0 (0.0%) | 0 (0.0%) |
| $750,000 to $999,999 | 0 (0.0%) | 0 (0.0%) |
| $1,000,000 or more | 0 (0.0%) | 0 (0.0%) |
| Total | 37 (100.0%) | 28 (100.0%) |
Household Income by Mortgage Status in Easton
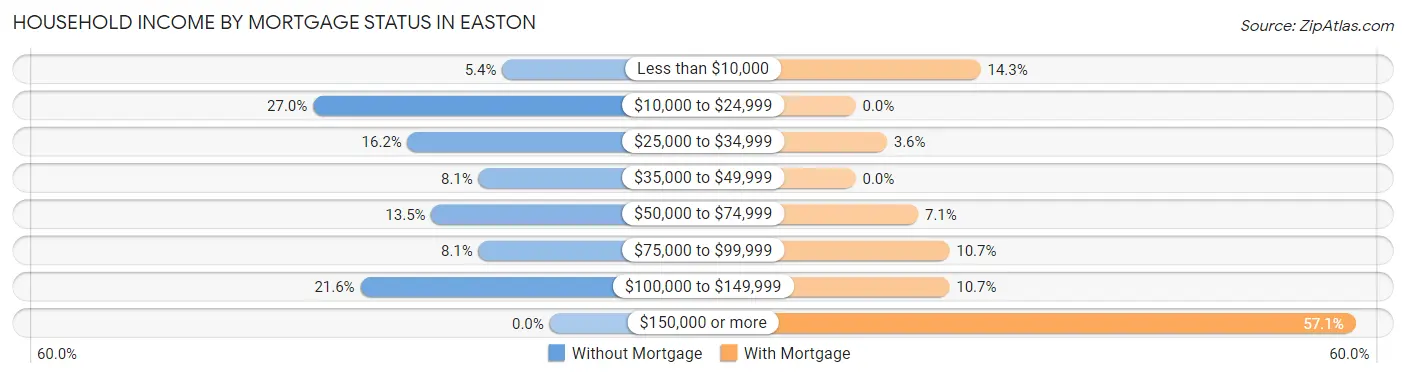
| Household Income | Without Mortgage | With Mortgage |
| Less than $10,000 | 2 (5.4%) | 4 (14.3%) |
| $10,000 to $24,999 | 10 (27.0%) | 0 (0.0%) |
| $25,000 to $34,999 | 6 (16.2%) | 1 (3.6%) |
| $35,000 to $49,999 | 3 (8.1%) | 0 (0.0%) |
| $50,000 to $74,999 | 5 (13.5%) | 2 (7.1%) |
| $75,000 to $99,999 | 3 (8.1%) | 3 (10.7%) |
| $100,000 to $149,999 | 8 (21.6%) | 3 (10.7%) |
| $150,000 or more | 0 (0.0%) | 16 (57.1%) |
| Total | 37 (100.0%) | 28 (100.0%) |
Property Value to Household Income Ratio in Easton
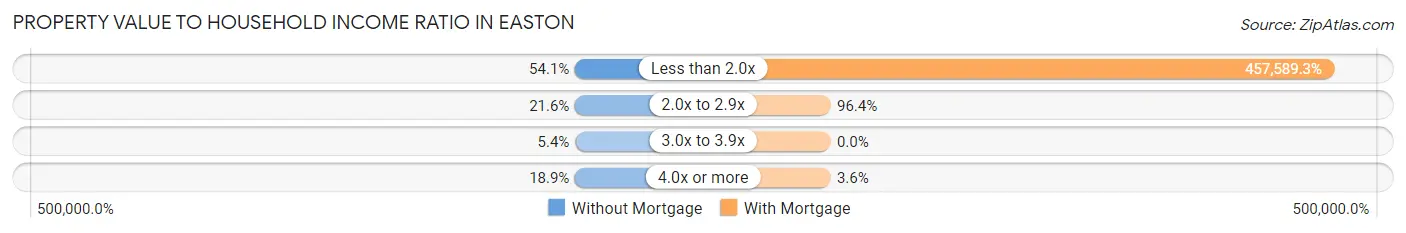
| Value-to-Income Ratio | Without Mortgage | With Mortgage |
| Less than 2.0x | 20 (54.0%) | 128,125 (457,589.3%) |
| 2.0x to 2.9x | 8 (21.6%) | 27 (96.4%) |
| 3.0x to 3.9x | 2 (5.4%) | 0 (0.0%) |
| 4.0x or more | 7 (18.9%) | 1 (3.6%) |
| Total | 37 (100.0%) | 28 (100.0%) |
Real Estate Taxes by Mortgage Status in Easton
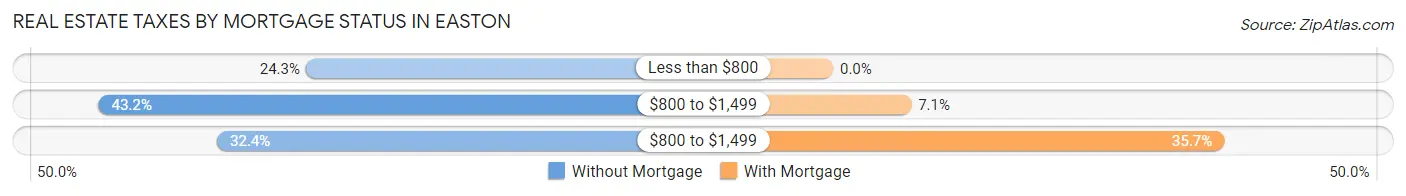
| Property Taxes | Without Mortgage | With Mortgage |
| Less than $800 | 9 (24.3%) | 0 (0.0%) |
| $800 to $1,499 | 16 (43.2%) | 2 (7.1%) |
| $800 to $1,499 | 12 (32.4%) | 10 (35.7%) |
| Total | 37 (100.0%) | 28 (100.0%) |
Health & Disability in Easton
Health Insurance Coverage by Age in Easton
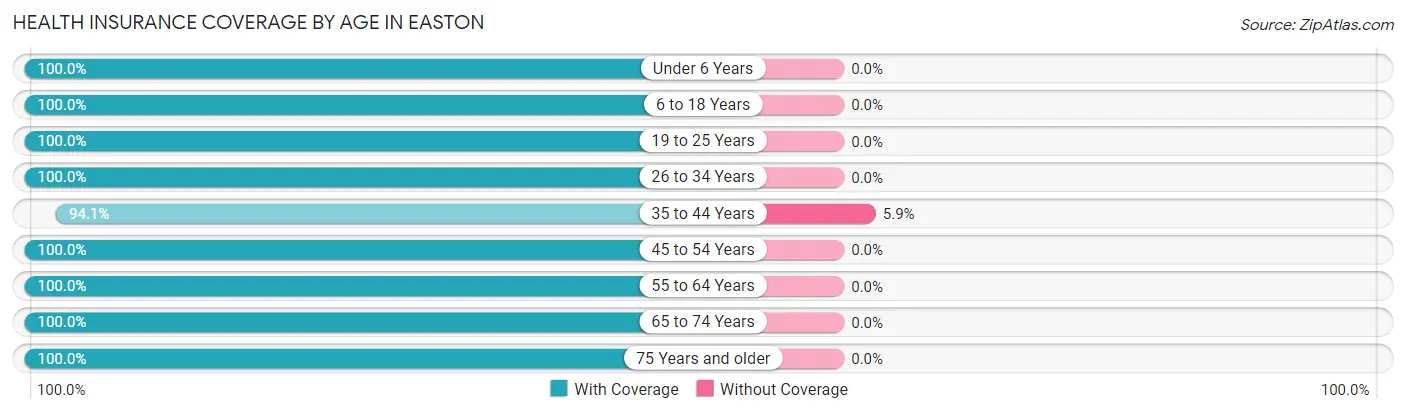
| Age Bracket | With Coverage | Without Coverage |
| Under 6 Years | 24 (100.0%) | 0 (0.0%) |
| 6 to 18 Years | 24 (100.0%) | 0 (0.0%) |
| 19 to 25 Years | 7 (100.0%) | 0 (0.0%) |
| 26 to 34 Years | 16 (100.0%) | 0 (0.0%) |
| 35 to 44 Years | 32 (94.1%) | 2 (5.9%) |
| 45 to 54 Years | 13 (100.0%) | 0 (0.0%) |
| 55 to 64 Years | 24 (100.0%) | 0 (0.0%) |
| 65 to 74 Years | 15 (100.0%) | 0 (0.0%) |
| 75 Years and older | 15 (100.0%) | 0 (0.0%) |
| Total | 170 (98.8%) | 2 (1.2%) |
Health Insurance Coverage by Citizenship Status in Easton
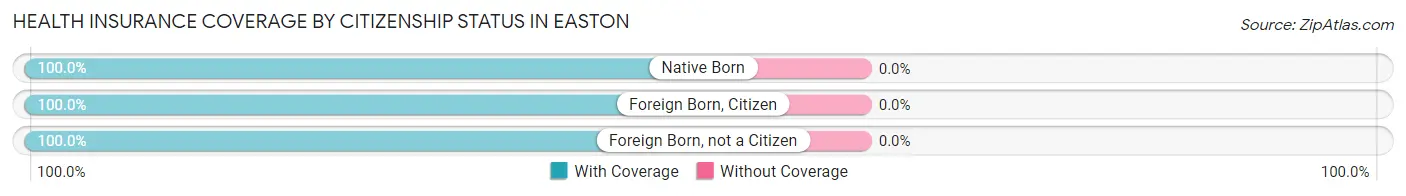
| Citizenship Status | With Coverage | Without Coverage |
| Native Born | 24 (100.0%) | 0 (0.0%) |
| Foreign Born, Citizen | 24 (100.0%) | 0 (0.0%) |
| Foreign Born, not a Citizen | 7 (100.0%) | 0 (0.0%) |
Health Insurance Coverage by Household Income in Easton
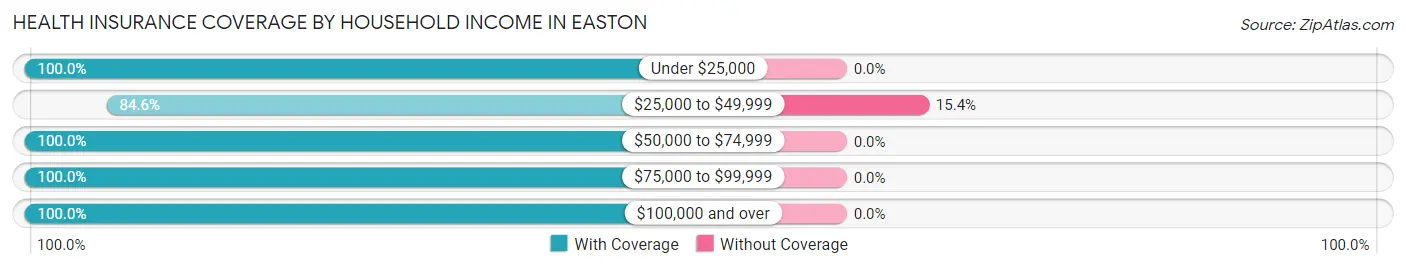
| Household Income | With Coverage | Without Coverage |
| Under $25,000 | 16 (100.0%) | 0 (0.0%) |
| $25,000 to $49,999 | 11 (84.6%) | 2 (15.4%) |
| $50,000 to $74,999 | 30 (100.0%) | 0 (0.0%) |
| $75,000 to $99,999 | 15 (100.0%) | 0 (0.0%) |
| $100,000 and over | 98 (100.0%) | 0 (0.0%) |
Public vs Private Health Insurance Coverage by Age in Easton
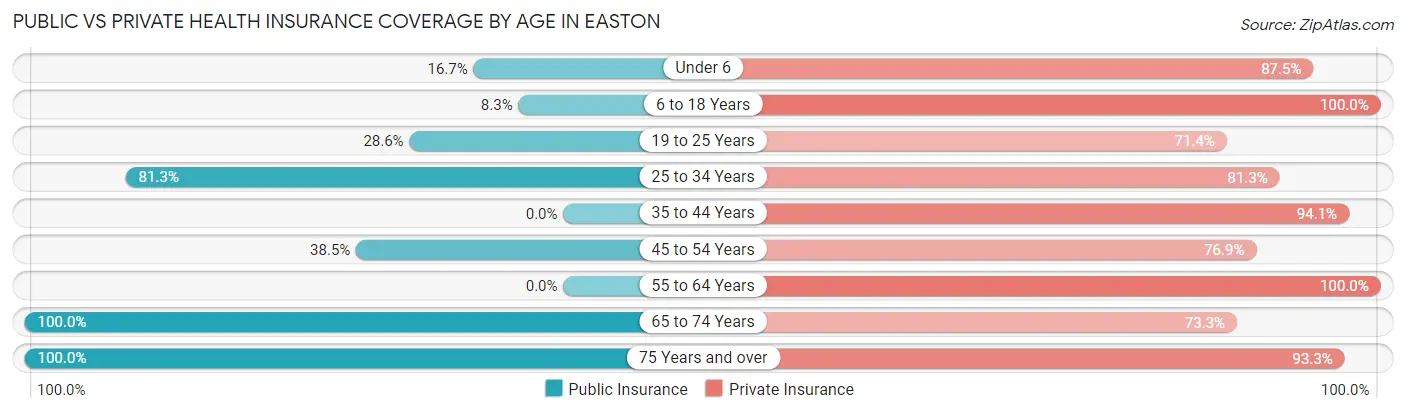
| Age Bracket | Public Insurance | Private Insurance |
| Under 6 | 4 (16.7%) | 21 (87.5%) |
| 6 to 18 Years | 2 (8.3%) | 24 (100.0%) |
| 19 to 25 Years | 2 (28.6%) | 5 (71.4%) |
| 25 to 34 Years | 13 (81.2%) | 13 (81.2%) |
| 35 to 44 Years | 0 (0.0%) | 32 (94.1%) |
| 45 to 54 Years | 5 (38.5%) | 10 (76.9%) |
| 55 to 64 Years | 0 (0.0%) | 24 (100.0%) |
| 65 to 74 Years | 15 (100.0%) | 11 (73.3%) |
| 75 Years and over | 15 (100.0%) | 14 (93.3%) |
| Total | 56 (32.6%) | 154 (89.5%) |
Disability Status by Sex by Age in Easton
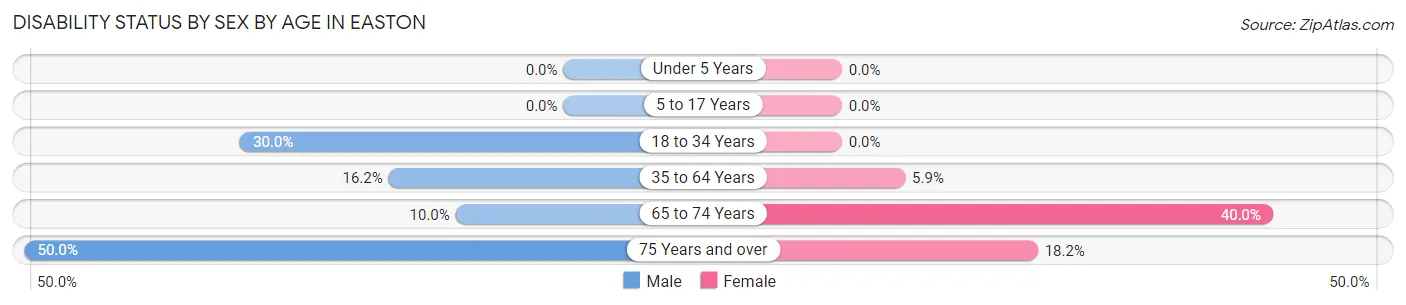
| Age Bracket | Male | Female |
| Under 5 Years | 0 (0.0%) | 0 (0.0%) |
| 5 to 17 Years | 0 (0.0%) | 0 (0.0%) |
| 18 to 34 Years | 3 (30.0%) | 0 (0.0%) |
| 35 to 64 Years | 6 (16.2%) | 2 (5.9%) |
| 65 to 74 Years | 1 (10.0%) | 2 (40.0%) |
| 75 Years and over | 2 (50.0%) | 2 (18.2%) |
Disability Class by Sex by Age in Easton
Disability Class: Hearing Difficulty
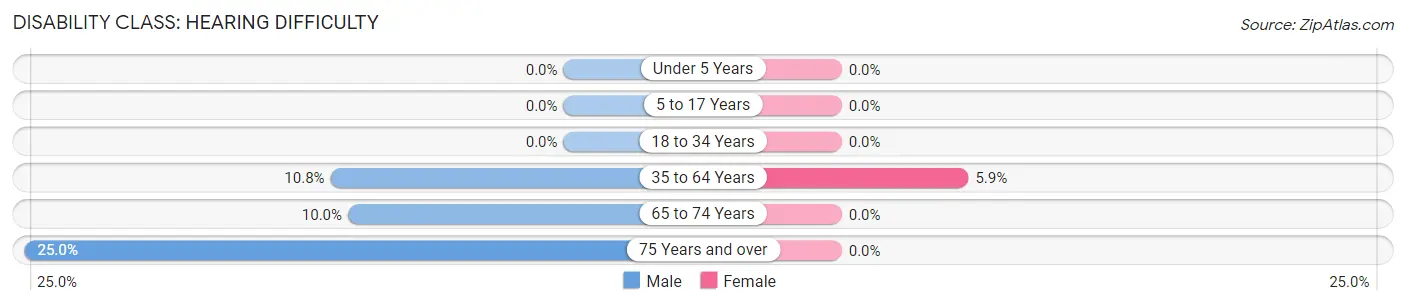
| Age Bracket | Male | Female |
| Under 5 Years | 0 (0.0%) | 0 (0.0%) |
| 5 to 17 Years | 0 (0.0%) | 0 (0.0%) |
| 18 to 34 Years | 0 (0.0%) | 0 (0.0%) |
| 35 to 64 Years | 4 (10.8%) | 2 (5.9%) |
| 65 to 74 Years | 1 (10.0%) | 0 (0.0%) |
| 75 Years and over | 1 (25.0%) | 0 (0.0%) |
Disability Class: Vision Difficulty
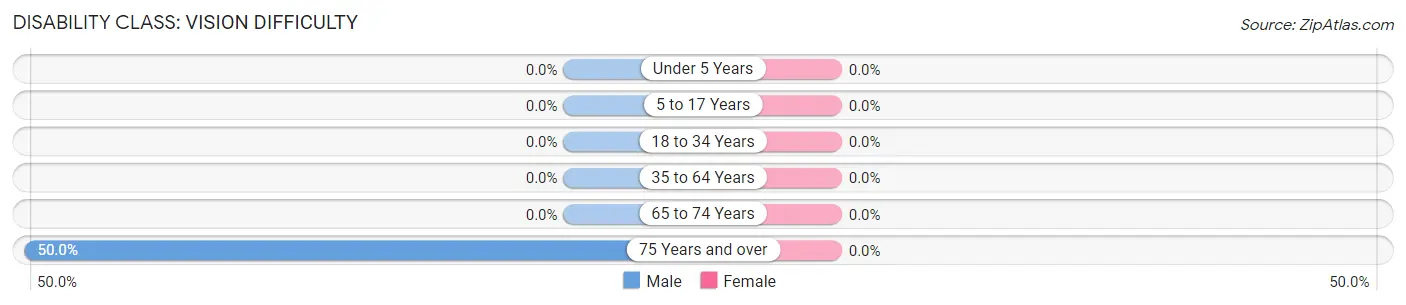
| Age Bracket | Male | Female |
| Under 5 Years | 0 (0.0%) | 0 (0.0%) |
| 5 to 17 Years | 0 (0.0%) | 0 (0.0%) |
| 18 to 34 Years | 0 (0.0%) | 0 (0.0%) |
| 35 to 64 Years | 0 (0.0%) | 0 (0.0%) |
| 65 to 74 Years | 0 (0.0%) | 0 (0.0%) |
| 75 Years and over | 2 (50.0%) | 0 (0.0%) |
Disability Class: Cognitive Difficulty
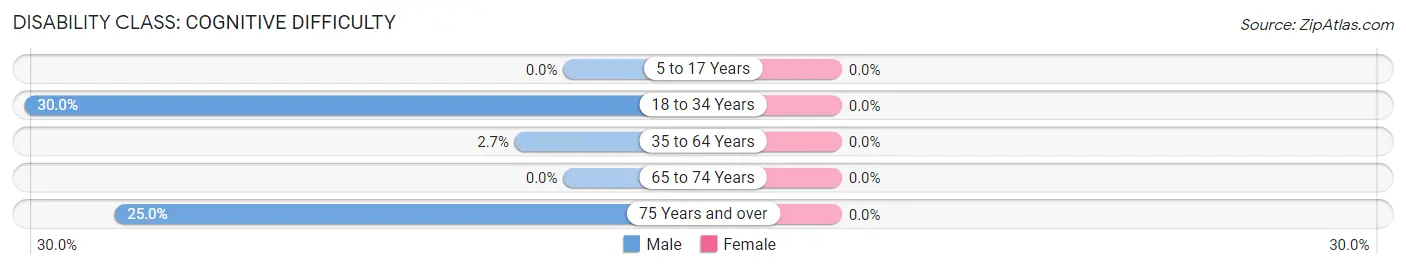
| Age Bracket | Male | Female |
| 5 to 17 Years | 0 (0.0%) | 0 (0.0%) |
| 18 to 34 Years | 3 (30.0%) | 0 (0.0%) |
| 35 to 64 Years | 1 (2.7%) | 0 (0.0%) |
| 65 to 74 Years | 0 (0.0%) | 0 (0.0%) |
| 75 Years and over | 1 (25.0%) | 0 (0.0%) |
Disability Class: Ambulatory Difficulty
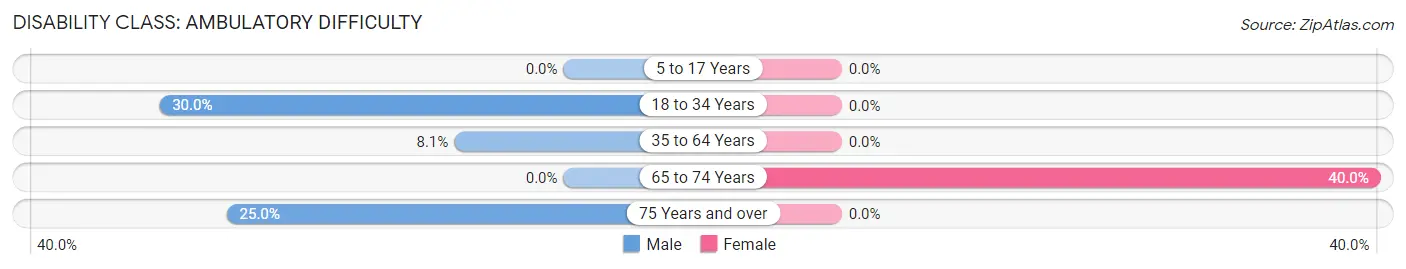
| Age Bracket | Male | Female |
| 5 to 17 Years | 0 (0.0%) | 0 (0.0%) |
| 18 to 34 Years | 3 (30.0%) | 0 (0.0%) |
| 35 to 64 Years | 3 (8.1%) | 0 (0.0%) |
| 65 to 74 Years | 0 (0.0%) | 2 (40.0%) |
| 75 Years and over | 1 (25.0%) | 0 (0.0%) |
Disability Class: Self-Care Difficulty
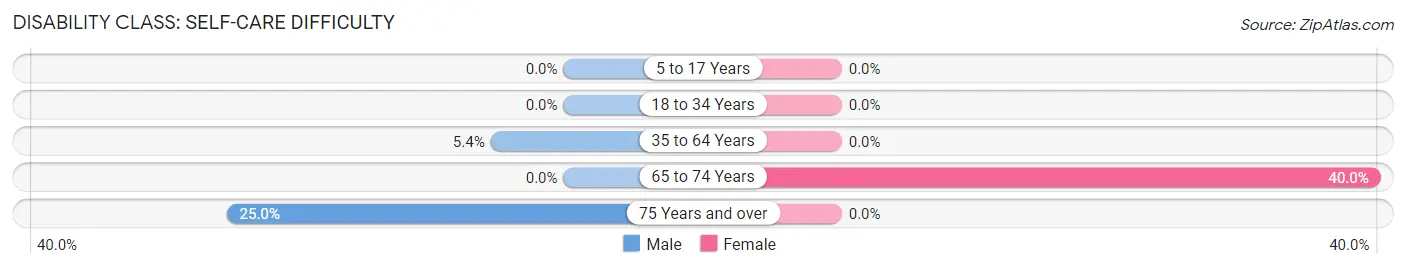
| Age Bracket | Male | Female |
| 5 to 17 Years | 0 (0.0%) | 0 (0.0%) |
| 18 to 34 Years | 0 (0.0%) | 0 (0.0%) |
| 35 to 64 Years | 2 (5.4%) | 0 (0.0%) |
| 65 to 74 Years | 0 (0.0%) | 2 (40.0%) |
| 75 Years and over | 1 (25.0%) | 0 (0.0%) |
Technology Access in Easton
Computing Device Access in Easton
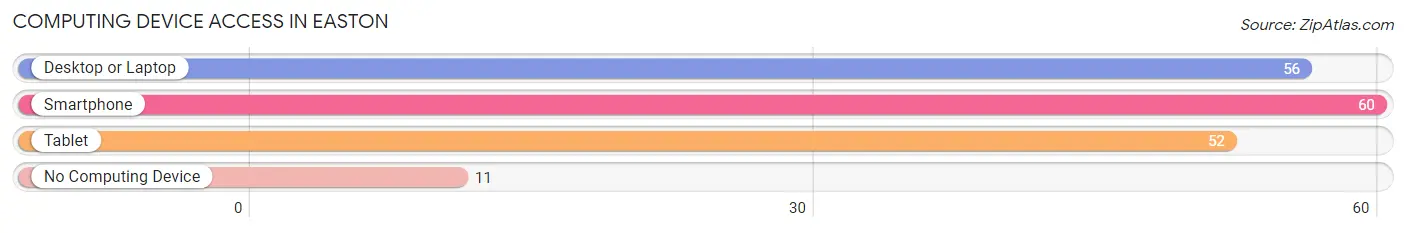
| Device Type | # Households | % Households |
| Desktop or Laptop | 56 | 75.7% |
| Smartphone | 60 | 81.1% |
| Tablet | 52 | 70.3% |
| No Computing Device | 11 | 14.9% |
| Total | 74 | 100.0% |
Internet Access in Easton
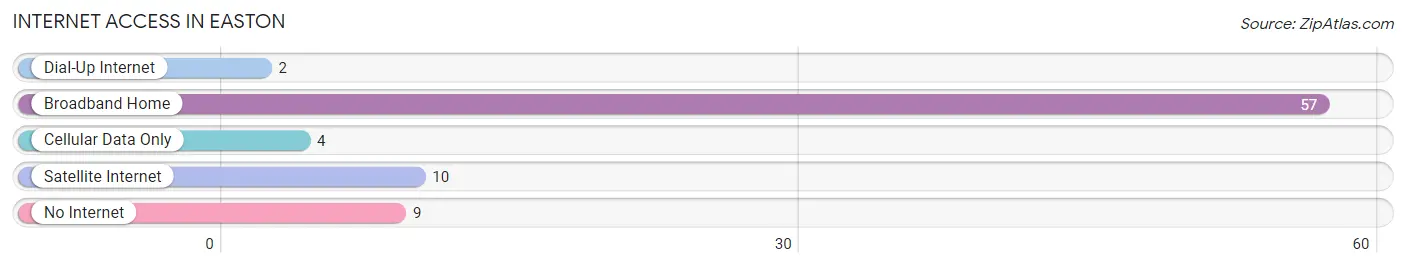
| Internet Type | # Households | % Households |
| Dial-Up Internet | 2 | 2.7% |
| Broadband Home | 57 | 77.0% |
| Cellular Data Only | 4 | 5.4% |
| Satellite Internet | 10 | 13.5% |
| No Internet | 9 | 12.2% |
| Total | 74 | 100.0% |
Easton Summary
Easton is a small city located in the state of Minnesota, in the United States of America. It is situated in the southeastern corner of the state, in the county of Stearns. The city is located on the banks of the Sauk River, and is part of the St. Cloud Metropolitan Statistical Area. As of the 2010 census, the population of Easton was 1,845.
History
Easton was first settled in 1856 by a group of German immigrants. The city was originally known as Sauk Centre, but was later renamed Easton in 1872. The name was chosen to honor the Easton family, who had been among the first settlers in the area.
The city was incorporated in 1887, and the first mayor was elected in 1888. In the early years, Easton was a small farming community, with a population of just over 500. The city grew slowly, but steadily, and by the turn of the century, the population had grown to over 1,000.
In the early 1900s, Easton began to experience a period of rapid growth. This was due in part to the construction of the Great Northern Railway, which ran through the city. The railway brought new businesses and industries to the area, and the population of Easton continued to grow. By the 1950s, the population had reached over 2,000.
Geography
Easton is located in the southeastern corner of Minnesota, in Stearns County. The city is situated on the banks of the Sauk River, and is part of the St. Cloud Metropolitan Statistical Area. The city covers an area of 2.3 square miles, and has a population density of 803.3 people per square mile.
The city is located in a region of rolling hills and wooded areas. The climate is humid continental, with cold winters and warm summers. The average annual temperature is around 40 degrees Fahrenheit, and the average annual precipitation is around 30 inches.
Economy
The economy of Easton is largely based on agriculture and manufacturing. The city is home to several large farms, which produce a variety of crops, including corn, soybeans, and wheat. The city is also home to several manufacturing companies, which produce a variety of products, including furniture, plastics, and automotive parts.
The city is also home to several small businesses, including restaurants, retail stores, and service providers. The city is served by several major highways, which provide access to the larger cities in the region.
Demographics
As of the 2010 census, the population of Easton was 1,845. The racial makeup of the city was 95.3% White, 0.7% African American, 0.3% Native American, 0.7% Asian, 0.1% Pacific Islander, 1.2% from other races, and 1.7% from two or more races. Hispanic or Latino of any race were 3.2% of the population.
The median household income in Easton was $45,938, and the median family income was $54,844. The per capita income was $21,945. About 8.3% of the population was below the poverty line.
Easton is a small city with a rich history and a diverse economy. The city is home to a variety of businesses, and the population is growing steadily. The city is served by several major highways, which provide access to the larger cities in the region. Easton is a great place to live, work, and raise a family.
Common Questions
What is Per Capita Income in Easton?
Per Capita income in Easton is $32,737.
What is the Median Family Income in Easton?
Median Family Income in Easton is $107,813.
What is the Median Household income in Easton?
Median Household Income in Easton is $66,250.
What is Income or Wage Gap in Easton?
Income or Wage Gap in Easton is 42.3%.
Women in Easton earn 57.7 cents for every dollar earned by a man.
What is Inequality or Gini Index in Easton?
Inequality or Gini Index in Easton is 0.35.
What is the Total Population of Easton?
Total Population of Easton is 172.
What is the Total Male Population of Easton?
Total Male Population of Easton is 105.
What is the Total Female Population of Easton?
Total Female Population of Easton is 67.
What is the Ratio of Males per 100 Females in Easton?
There are 156.72 Males per 100 Females in Easton.
What is the Ratio of Females per 100 Males in Easton?
There are 63.81 Females per 100 Males in Easton.
What is the Median Population Age in Easton?
Median Population Age in Easton is 39.4 Years.
What is the Average Family Size in Easton
Average Family Size in Easton is 3.1 People.
What is the Average Household Size in Easton
Average Household Size in Easton is 2.3 People.
How Large is the Labor Force in Easton?
There are 84 People in the Labor Forcein in Easton.
What is the Percentage of People in the Labor Force in Easton?
67.7% of People are in the Labor Force in Easton.
What is the Unemployment Rate in Easton?
Unemployment Rate in Easton is 2.4%.