Eagle Bend, MN Map & Demographics
Eagle Bend Map
Eagle Bend Overview
$24,810
PER CAPITA INCOME
$53,036
AVG FAMILY INCOME
$45,888
AVG HOUSEHOLD INCOME
44.5%
WAGE / INCOME GAP [ % ]
55.5¢/ $1
WAGE / INCOME GAP [ $ ]
0.41
INEQUALITY / GINI INDEX
647
TOTAL POPULATION
316
MALE POPULATION
331
FEMALE POPULATION
95.47
MALES / 100 FEMALES
104.75
FEMALES / 100 MALES
33.4
MEDIAN AGE
3.1
AVG FAMILY SIZE
2.4
AVG HOUSEHOLD SIZE
262
LABOR FORCE [ PEOPLE ]
58.1%
PERCENT IN LABOR FORCE
1.1%
UNEMPLOYMENT RATE
Eagle Bend Zip Codes
Eagle Bend Area Codes
Income in Eagle Bend
Income Overview in Eagle Bend
Per Capita Income in Eagle Bend is $24,810, while median incomes of families and households are $53,036 and $45,888 respectively.
| Characteristic | Number | Measure |
| Per Capita Income | 647 | $24,810 |
| Median Family Income | 167 | $53,036 |
| Mean Family Income | 167 | $67,058 |
| Median Household Income | 269 | $45,888 |
| Mean Household Income | 269 | $59,106 |
| Income Deficit | 167 | $0 |
| Wage / Income Gap (%) | 647 | 44.46% |
| Wage / Income Gap ($) | 647 | 55.54¢ per $1 |
| Gini / Inequality Index | 647 | 0.41 |
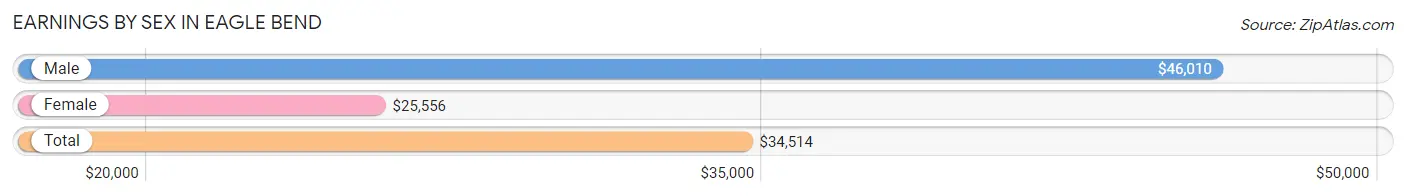
Earnings by Sex in Eagle Bend
Average Earnings in Eagle Bend are $34,514, $46,010 for men and $25,556 for women, a difference of 44.5%.
| Sex | Number | Average Earnings |
| Male | 121 (44.3%) | $46,010 |
| Female | 152 (55.7%) | $25,556 |
| Total | 273 (100.0%) | $34,514 |
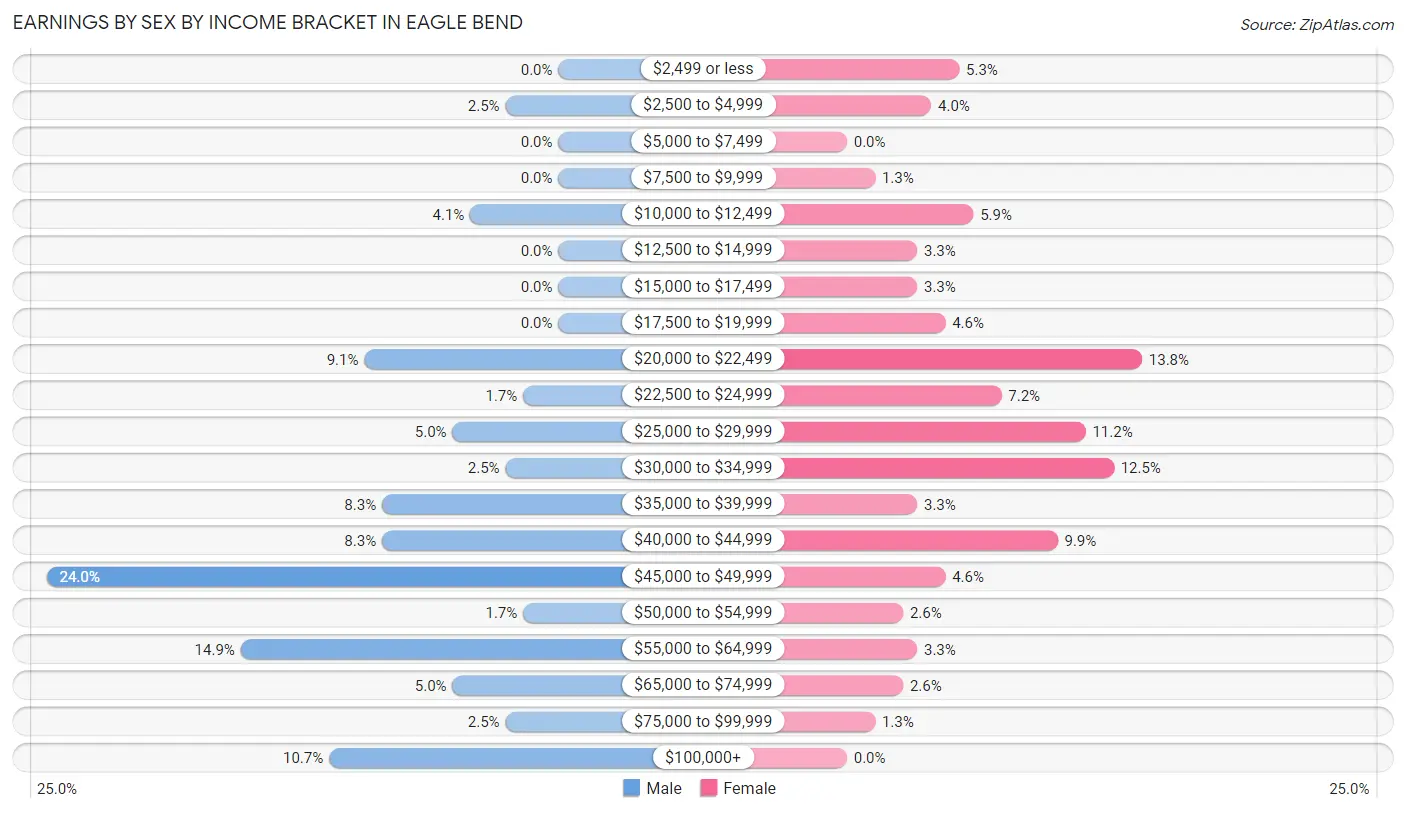
Earnings by Sex by Income Bracket in Eagle Bend
The most common earnings brackets in Eagle Bend are $45,000 to $49,999 for men (29 | 24.0%) and $20,000 to $22,499 for women (21 | 13.8%).
| Income | Male | Female |
| $2,499 or less | 0 (0.0%) | 8 (5.3%) |
| $2,500 to $4,999 | 3 (2.5%) | 6 (4.0%) |
| $5,000 to $7,499 | 0 (0.0%) | 0 (0.0%) |
| $7,500 to $9,999 | 0 (0.0%) | 2 (1.3%) |
| $10,000 to $12,499 | 5 (4.1%) | 9 (5.9%) |
| $12,500 to $14,999 | 0 (0.0%) | 5 (3.3%) |
| $15,000 to $17,499 | 0 (0.0%) | 5 (3.3%) |
| $17,500 to $19,999 | 0 (0.0%) | 7 (4.6%) |
| $20,000 to $22,499 | 11 (9.1%) | 21 (13.8%) |
| $22,500 to $24,999 | 2 (1.7%) | 11 (7.2%) |
| $25,000 to $29,999 | 6 (5.0%) | 17 (11.2%) |
| $30,000 to $34,999 | 3 (2.5%) | 19 (12.5%) |
| $35,000 to $39,999 | 10 (8.3%) | 5 (3.3%) |
| $40,000 to $44,999 | 10 (8.3%) | 15 (9.9%) |
| $45,000 to $49,999 | 29 (24.0%) | 7 (4.6%) |
| $50,000 to $54,999 | 2 (1.7%) | 4 (2.6%) |
| $55,000 to $64,999 | 18 (14.9%) | 5 (3.3%) |
| $65,000 to $74,999 | 6 (5.0%) | 4 (2.6%) |
| $75,000 to $99,999 | 3 (2.5%) | 2 (1.3%) |
| $100,000+ | 13 (10.7%) | 0 (0.0%) |
| Total | 121 (100.0%) | 152 (100.0%) |
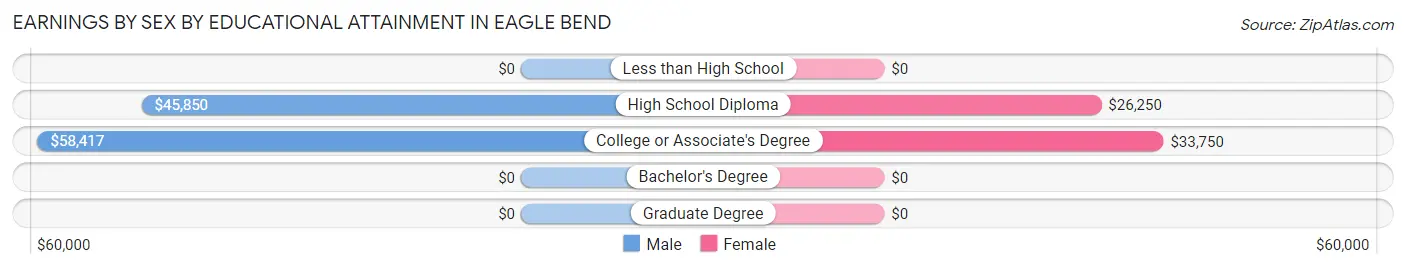
Earnings by Sex by Educational Attainment in Eagle Bend
Average earnings in Eagle Bend are $46,442 for men and $28,750 for women, a difference of 38.1%. Men with an educational attainment of college or associate's degree enjoy the highest average annual earnings of $58,417, while those with high school diploma education earn the least with $45,850. Women with an educational attainment of college or associate's degree earn the most with the average annual earnings of $33,750, while those with high school diploma education have the smallest earnings of $26,250.
| Educational Attainment | Male Income | Female Income |
| Less than High School | - | - |
| High School Diploma | $45,850 | $26,250 |
| College or Associate's Degree | $58,417 | $33,750 |
| Bachelor's Degree | - | - |
| Graduate Degree | - | - |
| Total | $46,442 | $28,750 |
Family Income in Eagle Bend
Family Income Brackets in Eagle Bend
According to the Eagle Bend family income data, there are 37 families falling into the $75,000 to $99,999 income range, which is the most common income bracket and makes up 22.2% of all families.
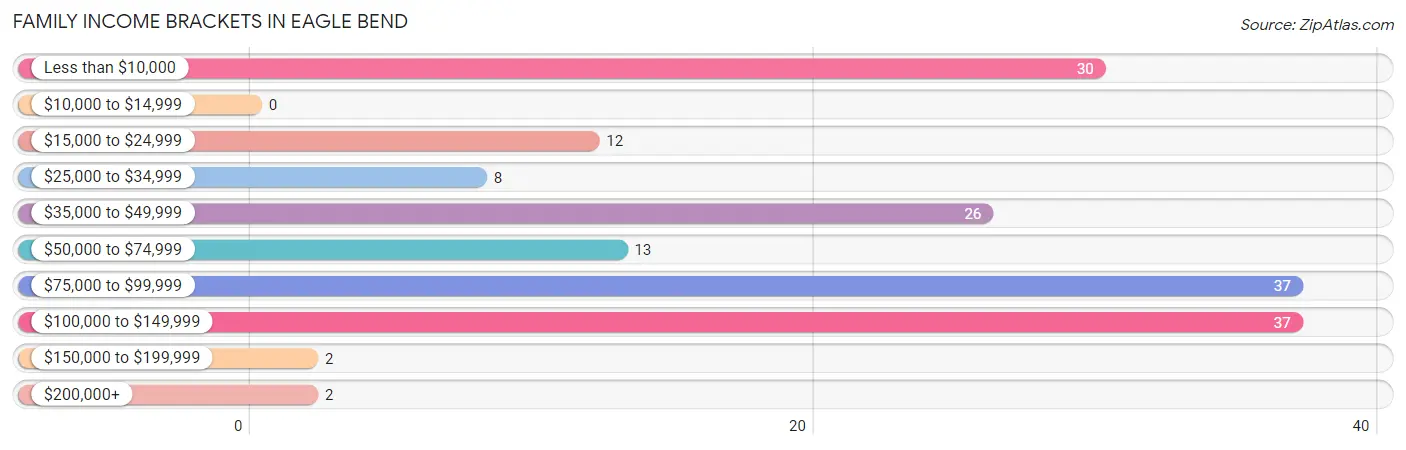
| Income Bracket | # Families | % Families |
| Less than $10,000 | 30 | 18.0% |
| $10,000 to $14,999 | 0 | 0.0% |
| $15,000 to $24,999 | 12 | 7.2% |
| $25,000 to $34,999 | 8 | 4.8% |
| $35,000 to $49,999 | 26 | 15.6% |
| $50,000 to $74,999 | 13 | 7.8% |
| $75,000 to $99,999 | 37 | 22.2% |
| $100,000 to $149,999 | 37 | 22.2% |
| $150,000 to $199,999 | 2 | 1.2% |
| $200,000+ | 2 | 1.2% |
Family Income by Famaliy Size in Eagle Bend
5-person families (19 | 11.4%) account for the highest median family income in Eagle Bend with $103,125 per family, while 2-person families (58 | 34.7%) have the highest median income of $26,250 per family member.
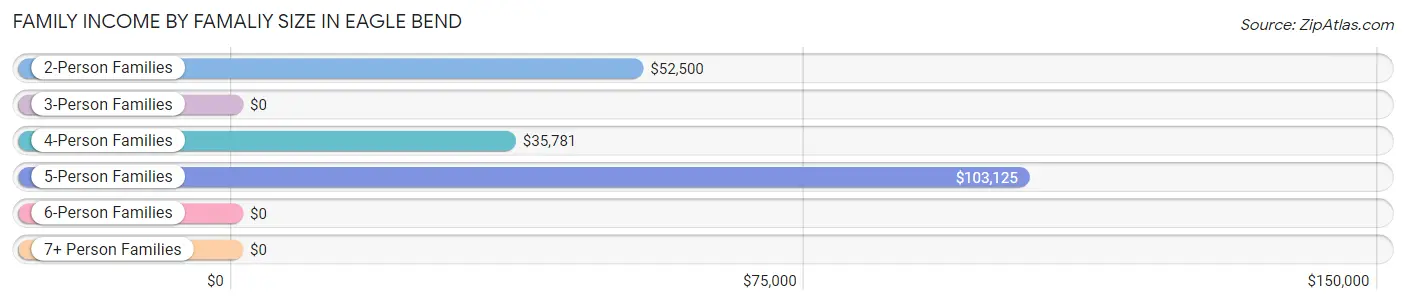
| Income Bracket | # Families | Median Income |
| 2-Person Families | 58 (34.7%) | $52,500 |
| 3-Person Families | 63 (37.7%) | $0 |
| 4-Person Families | 21 (12.6%) | $35,781 |
| 5-Person Families | 19 (11.4%) | $103,125 |
| 6-Person Families | 6 (3.6%) | $0 |
| 7+ Person Families | 0 (0.0%) | $0 |
| Total | 167 (100.0%) | $53,036 |
Family Income by Number of Earners in Eagle Bend
The median family income in Eagle Bend is $53,036, with families comprising 3+ earners (8) having the highest median family income of $107,500, while families with no earners (37) have the lowest median family income of $2,499, accounting for 4.8% and 22.2% of families, respectively.
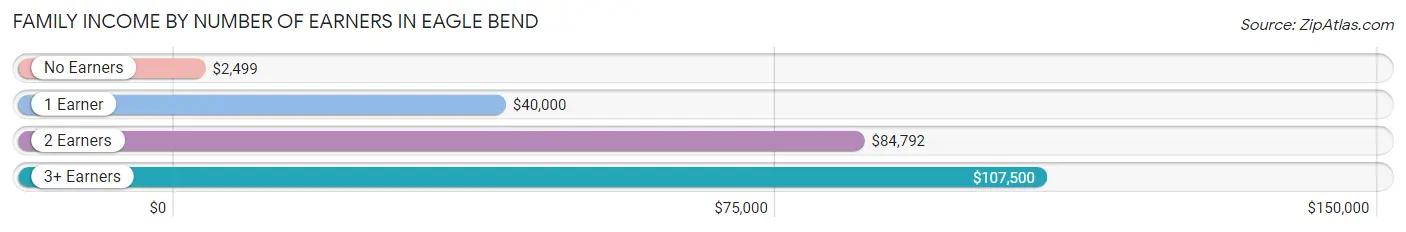
| Number of Earners | # Families | Median Income |
| No Earners | 37 (22.2%) | $2,499 |
| 1 Earner | 60 (35.9%) | $40,000 |
| 2 Earners | 62 (37.1%) | $84,792 |
| 3+ Earners | 8 (4.8%) | $107,500 |
| Total | 167 (100.0%) | $53,036 |
Household Income in Eagle Bend
Household Income Brackets in Eagle Bend
With 59 households falling in the category, the $35,000 to $49,999 income range is the most frequent in Eagle Bend, accounting for 21.9% of all households. In contrast, only 2 households (0.7%) fall into the $150,000 to $199,999 income bracket, making it the least populous group.
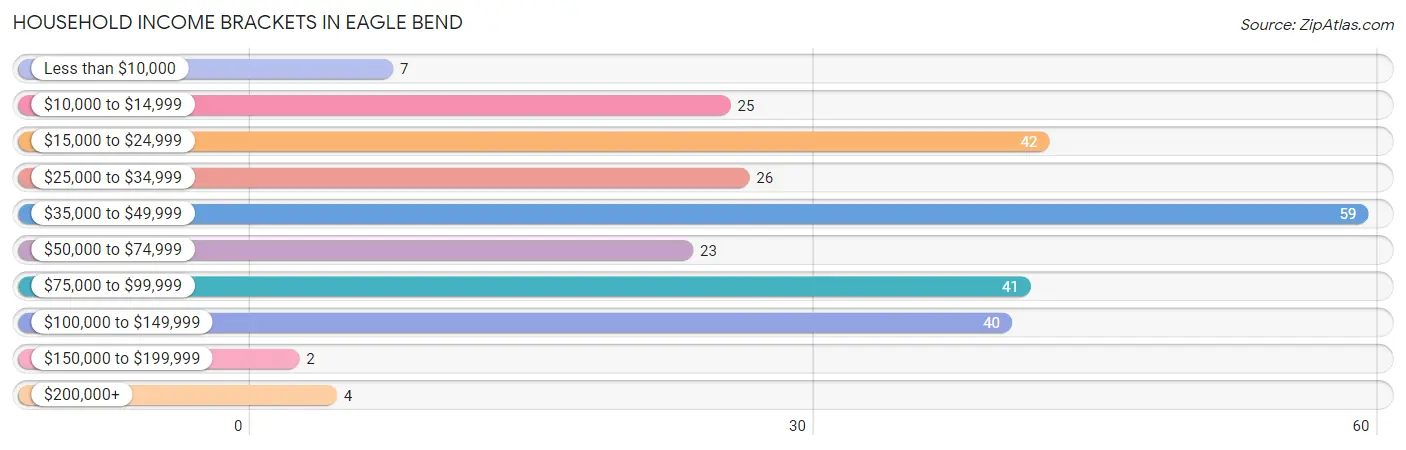
| Income Bracket | # Households | % Households |
| Less than $10,000 | 7 | 2.6% |
| $10,000 to $14,999 | 25 | 9.3% |
| $15,000 to $24,999 | 42 | 15.6% |
| $25,000 to $34,999 | 26 | 9.7% |
| $35,000 to $49,999 | 59 | 21.9% |
| $50,000 to $74,999 | 23 | 8.6% |
| $75,000 to $99,999 | 41 | 15.2% |
| $100,000 to $149,999 | 40 | 14.9% |
| $150,000 to $199,999 | 2 | 0.7% |
| $200,000+ | 4 | 1.5% |
Household Income by Householder Age in Eagle Bend
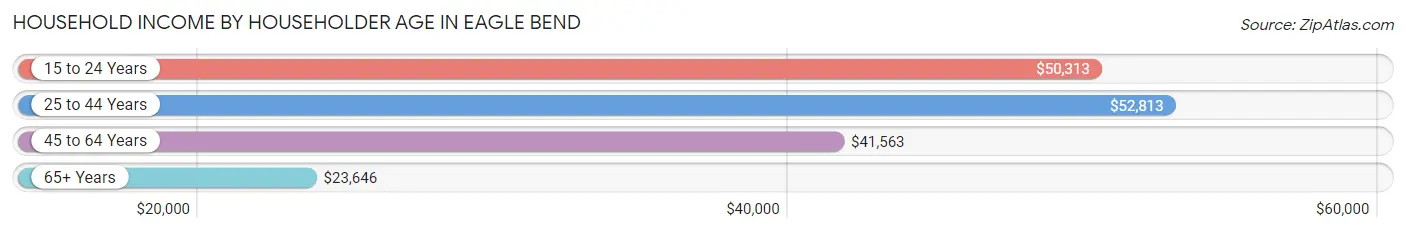
The median household income in Eagle Bend is $45,888, with the highest median household income of $52,813 found in the 25 to 44 years age bracket for the primary householder. A total of 101 households (37.6%) fall into this category. Meanwhile, the 65+ years age bracket for the primary householder has the lowest median household income of $23,646, with 86 households (32.0%) in this group.
| Income Bracket | # Households | Median Income |
| 15 to 24 Years | 9 (3.4%) | $50,313 |
| 25 to 44 Years | 101 (37.6%) | $52,813 |
| 45 to 64 Years | 73 (27.1%) | $41,563 |
| 65+ Years | 86 (32.0%) | $23,646 |
| Total | 269 (100.0%) | $45,888 |
Poverty in Eagle Bend
Income Below Poverty by Sex and Age in Eagle Bend
With 17.4% poverty level for males and 23.6% for females among the residents of Eagle Bend, 12 to 14 year old males and 6 to 11 year old females are the most vulnerable to poverty, with 26 males (60.5%) and 24 females (60.0%) in their respective age groups living below the poverty level.
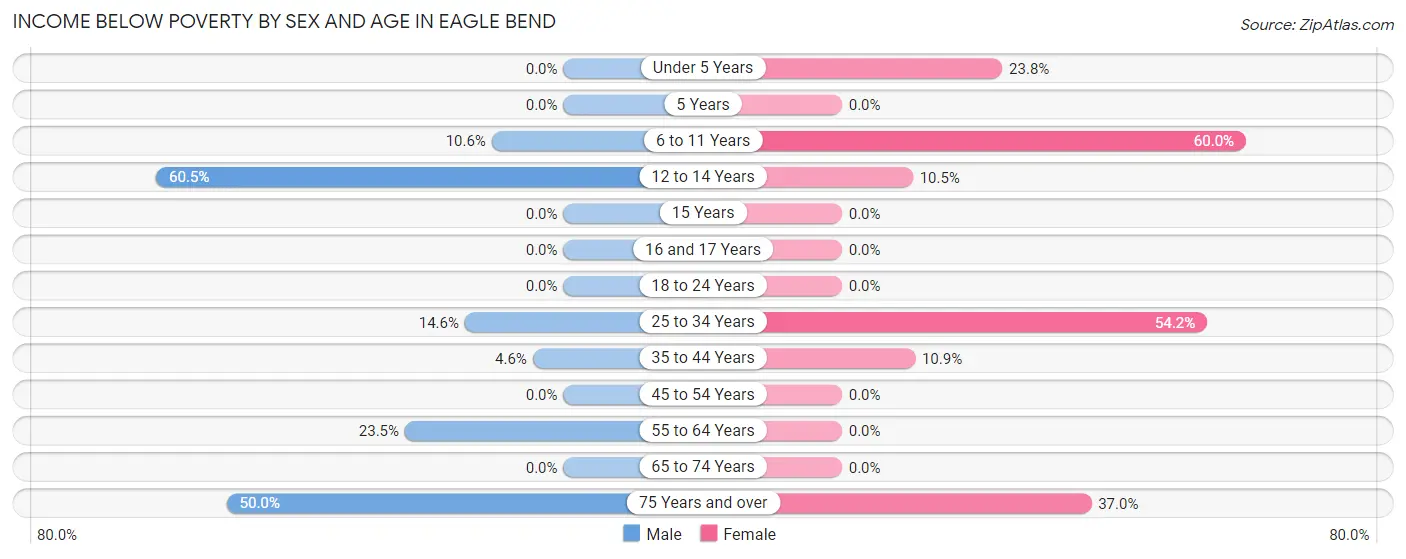
| Age Bracket | Male | Female |
| Under 5 Years | 0 (0.0%) | 5 (23.8%) |
| 5 Years | 0 (0.0%) | 0 (0.0%) |
| 6 to 11 Years | 5 (10.6%) | 24 (60.0%) |
| 12 to 14 Years | 26 (60.5%) | 2 (10.5%) |
| 15 Years | 0 (0.0%) | 0 (0.0%) |
| 16 and 17 Years | 0 (0.0%) | 0 (0.0%) |
| 18 to 24 Years | 0 (0.0%) | 0 (0.0%) |
| 25 to 34 Years | 6 (14.6%) | 32 (54.2%) |
| 35 to 44 Years | 2 (4.5%) | 5 (10.9%) |
| 45 to 54 Years | 0 (0.0%) | 0 (0.0%) |
| 55 to 64 Years | 8 (23.5%) | 0 (0.0%) |
| 65 to 74 Years | 0 (0.0%) | 0 (0.0%) |
| 75 Years and over | 8 (50.0%) | 10 (37.0%) |
| Total | 55 (17.4%) | 78 (23.6%) |
Income Above Poverty by Sex and Age in Eagle Bend
According to the poverty statistics in Eagle Bend, males aged under 5 years and females aged 5 years are the age groups that are most secure financially, with 100.0% of males and 100.0% of females in these age groups living above the poverty line.
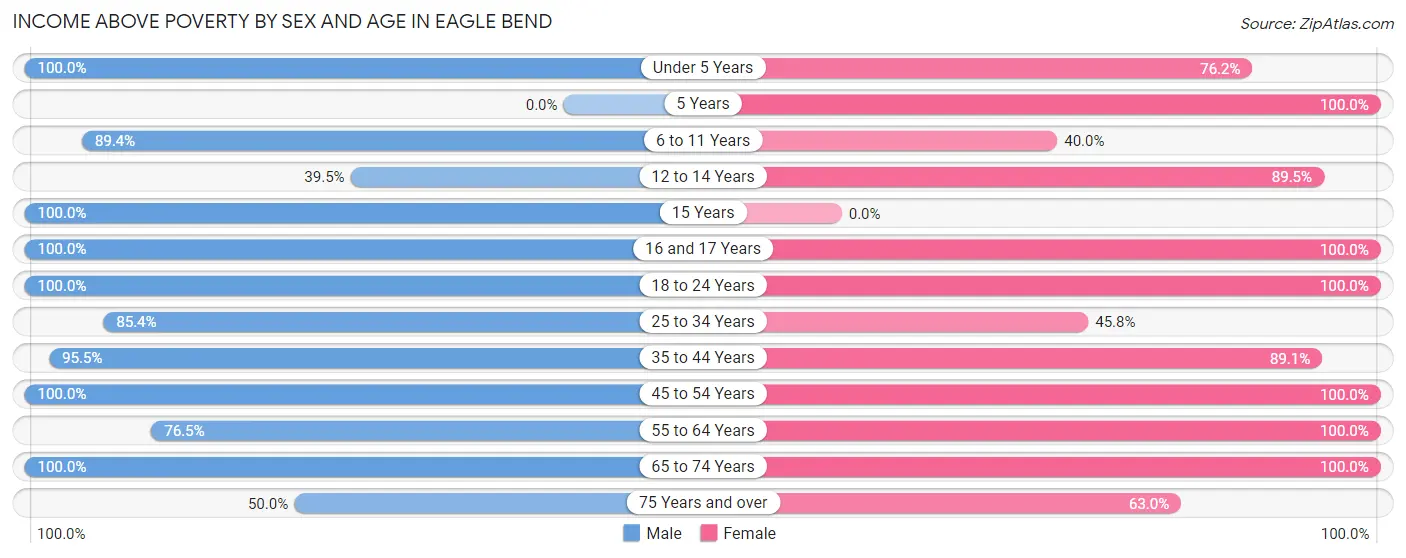
| Age Bracket | Male | Female |
| Under 5 Years | 15 (100.0%) | 16 (76.2%) |
| 5 Years | 0 (0.0%) | 9 (100.0%) |
| 6 to 11 Years | 42 (89.4%) | 16 (40.0%) |
| 12 to 14 Years | 17 (39.5%) | 17 (89.5%) |
| 15 Years | 2 (100.0%) | 0 (0.0%) |
| 16 and 17 Years | 4 (100.0%) | 4 (100.0%) |
| 18 to 24 Years | 11 (100.0%) | 22 (100.0%) |
| 25 to 34 Years | 35 (85.4%) | 27 (45.8%) |
| 35 to 44 Years | 42 (95.5%) | 41 (89.1%) |
| 45 to 54 Years | 17 (100.0%) | 14 (100.0%) |
| 55 to 64 Years | 26 (76.5%) | 42 (100.0%) |
| 65 to 74 Years | 42 (100.0%) | 28 (100.0%) |
| 75 Years and over | 8 (50.0%) | 17 (63.0%) |
| Total | 261 (82.6%) | 253 (76.4%) |
Income Below Poverty Among Married-Couple Families in Eagle Bend
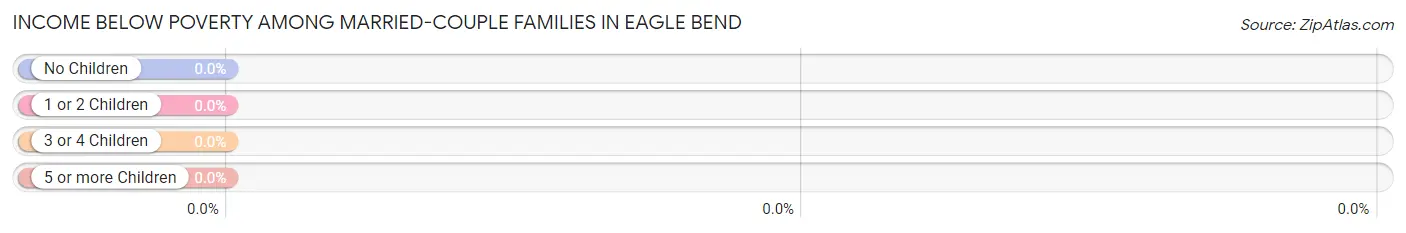
| Children | Above Poverty | Below Poverty |
| No Children | 40 (100.0%) | 0 (0.0%) |
| 1 or 2 Children | 35 (100.0%) | 0 (0.0%) |
| 3 or 4 Children | 20 (100.0%) | 0 (0.0%) |
| 5 or more Children | 0 (0.0%) | 0 (0.0%) |
| Total | 95 (100.0%) | 0 (0.0%) |
Income Below Poverty Among Single-Parent Households in Eagle Bend
According to the poverty data in Eagle Bend, 33.3% or 2 single-father households and 53.0% or 35 single-mother households are living below the poverty line. Among single-father households, those with 1 or 2 children have the highest poverty rate, with 2 households (100.0%) experiencing poverty. Likewise, among single-mother households, those with 1 or 2 children have the highest poverty rate, with 30 households (93.8%) falling below the poverty line.
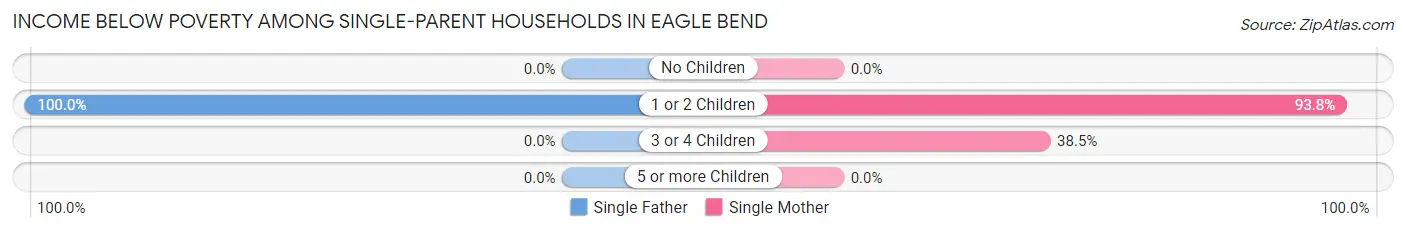
| Children | Single Father | Single Mother |
| No Children | 0 (0.0%) | 0 (0.0%) |
| 1 or 2 Children | 2 (100.0%) | 30 (93.8%) |
| 3 or 4 Children | 0 (0.0%) | 5 (38.5%) |
| 5 or more Children | 0 (0.0%) | 0 (0.0%) |
| Total | 2 (33.3%) | 35 (53.0%) |
Income Below Poverty Among Married-Couple vs Single-Parent Households in Eagle Bend
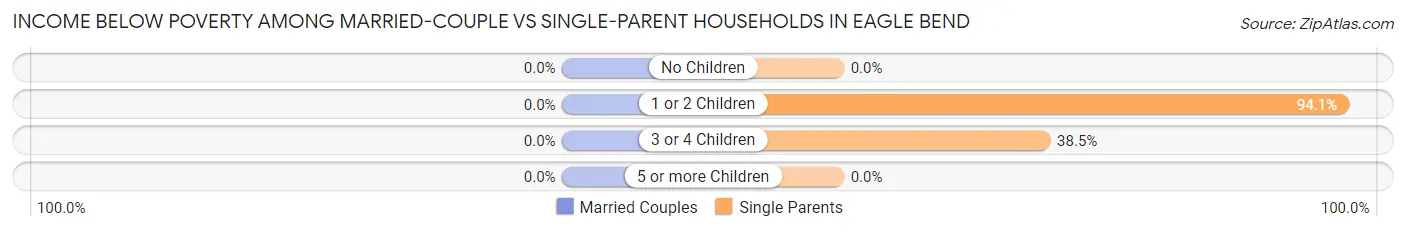
| Children | Married-Couple Families | Single-Parent Households |
| No Children | 0 (0.0%) | 0 (0.0%) |
| 1 or 2 Children | 0 (0.0%) | 32 (94.1%) |
| 3 or 4 Children | 0 (0.0%) | 5 (38.5%) |
| 5 or more Children | 0 (0.0%) | 0 (0.0%) |
| Total | 0 (0.0%) | 37 (51.4%) |
Race in Eagle Bend
The most populous races in Eagle Bend are White / Caucasian (497 | 76.8%), Two or more Races (143 | 22.1%), and Hispanic or Latino (32 | 5.0%).
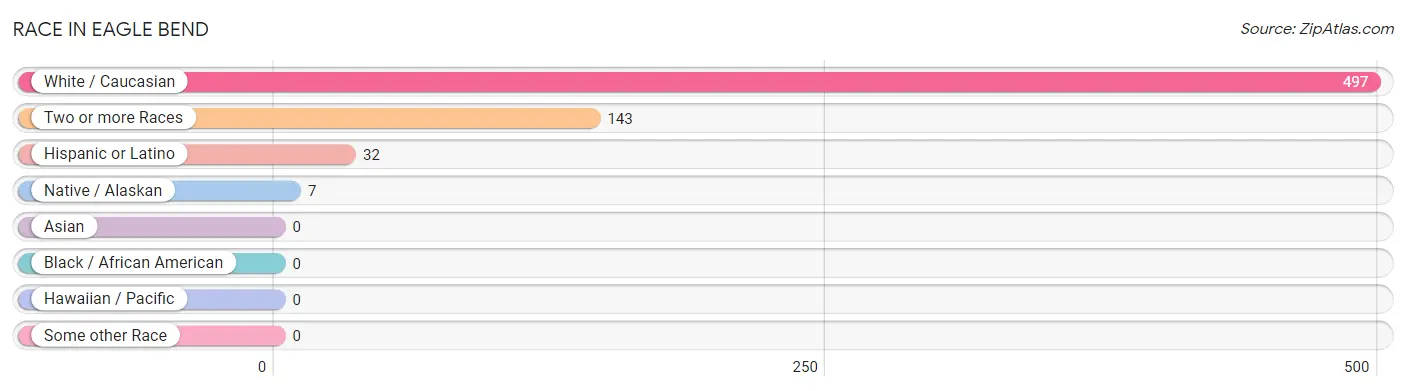
| Race | # Population | % Population |
| Asian | 0 | 0.0% |
| Black / African American | 0 | 0.0% |
| Hawaiian / Pacific | 0 | 0.0% |
| Hispanic or Latino | 32 | 5.0% |
| Native / Alaskan | 7 | 1.1% |
| White / Caucasian | 497 | 76.8% |
| Two or more Races | 143 | 22.1% |
| Some other Race | 0 | 0.0% |
| Total | 647 | 100.0% |
Ancestry in Eagle Bend
The most populous ancestries reported in Eagle Bend are German (214 | 33.1%), Polish (96 | 14.8%), Norwegian (78 | 12.1%), Swedish (40 | 6.2%), and American (32 | 5.0%), together accounting for 71.1% of all Eagle Bend residents.
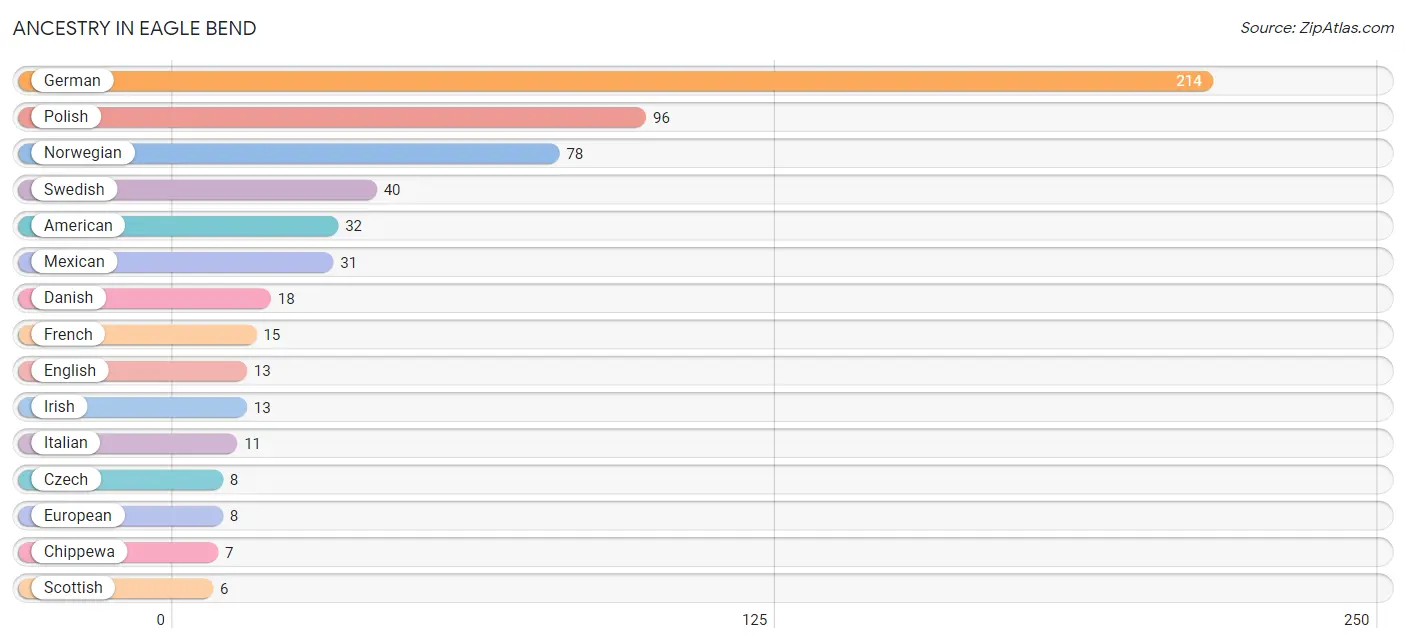
| Ancestry | # Population | % Population |
| American | 32 | 5.0% |
| British | 3 | 0.5% |
| Chippewa | 7 | 1.1% |
| Czech | 8 | 1.2% |
| Danish | 18 | 2.8% |
| Dutch | 3 | 0.5% |
| English | 13 | 2.0% |
| European | 8 | 1.2% |
| Finnish | 2 | 0.3% |
| French | 15 | 2.3% |
| French Canadian | 2 | 0.3% |
| German | 214 | 33.1% |
| Irish | 13 | 2.0% |
| Italian | 11 | 1.7% |
| Luxembourger | 2 | 0.3% |
| Mexican | 31 | 4.8% |
| Norwegian | 78 | 12.1% |
| Polish | 96 | 14.8% |
| Scandinavian | 5 | 0.8% |
| Scottish | 6 | 0.9% |
| Swedish | 40 | 6.2% |
| Swiss | 1 | 0.2% | View All 22 Rows |
Immigrants in Eagle Bend
The most numerous immigrant groups reported in Eagle Bend came from , and Canada (4 | 0.6%), together accounting for 0.6% of all Eagle Bend residents.

| Immigration Origin | # Population | % Population |
| Canada | 4 | 0.6% | View All 1 Rows |
Sex and Age in Eagle Bend
Sex and Age in Eagle Bend
The most populous age groups in Eagle Bend are 10 to 14 Years (78 | 24.7%) for men and 10 to 14 Years (45 | 13.6%) for women.
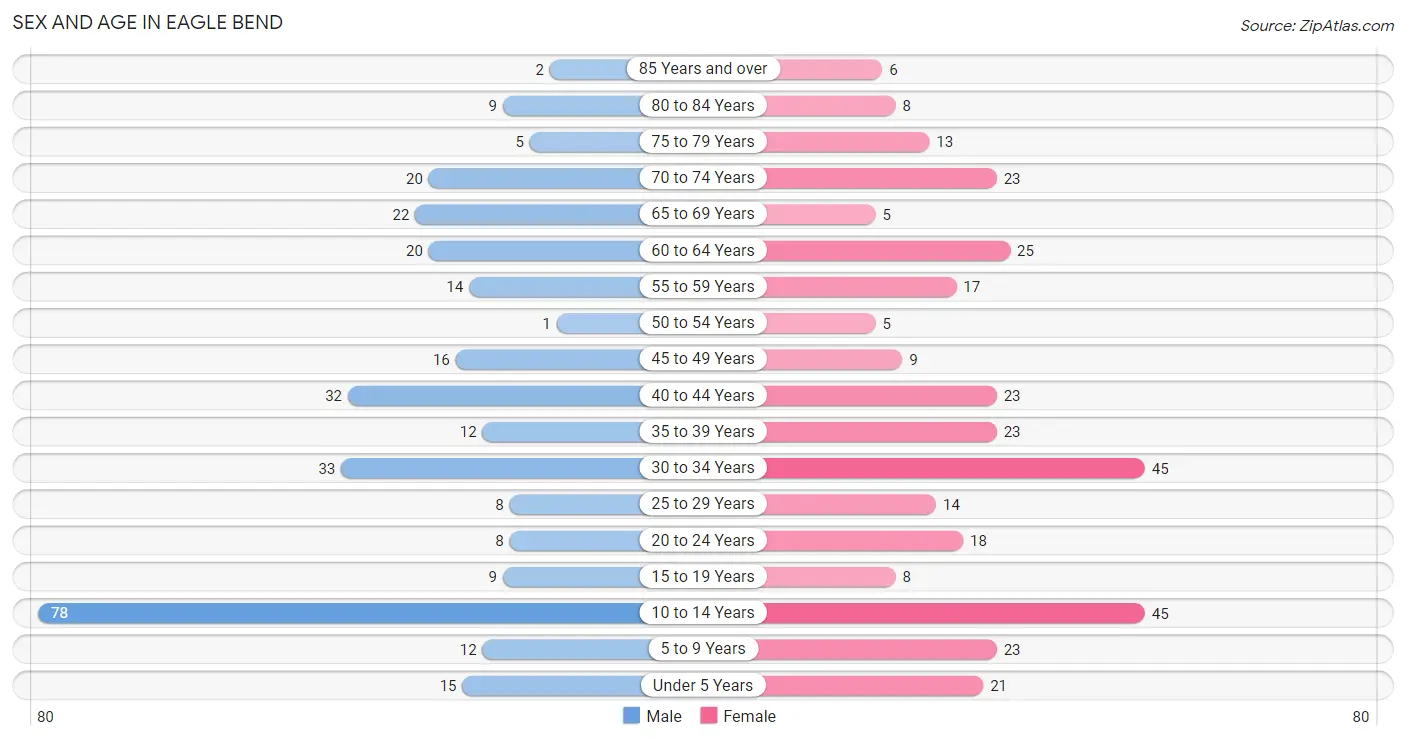
| Age Bracket | Male | Female |
| Under 5 Years | 15 (4.8%) | 21 (6.3%) |
| 5 to 9 Years | 12 (3.8%) | 23 (7.0%) |
| 10 to 14 Years | 78 (24.7%) | 45 (13.6%) |
| 15 to 19 Years | 9 (2.9%) | 8 (2.4%) |
| 20 to 24 Years | 8 (2.5%) | 18 (5.4%) |
| 25 to 29 Years | 8 (2.5%) | 14 (4.2%) |
| 30 to 34 Years | 33 (10.4%) | 45 (13.6%) |
| 35 to 39 Years | 12 (3.8%) | 23 (7.0%) |
| 40 to 44 Years | 32 (10.1%) | 23 (7.0%) |
| 45 to 49 Years | 16 (5.1%) | 9 (2.7%) |
| 50 to 54 Years | 1 (0.3%) | 5 (1.5%) |
| 55 to 59 Years | 14 (4.4%) | 17 (5.1%) |
| 60 to 64 Years | 20 (6.3%) | 25 (7.5%) |
| 65 to 69 Years | 22 (7.0%) | 5 (1.5%) |
| 70 to 74 Years | 20 (6.3%) | 23 (7.0%) |
| 75 to 79 Years | 5 (1.6%) | 13 (3.9%) |
| 80 to 84 Years | 9 (2.9%) | 8 (2.4%) |
| 85 Years and over | 2 (0.6%) | 6 (1.8%) |
| Total | 316 (100.0%) | 331 (100.0%) |
Families and Households in Eagle Bend
Median Family Size in Eagle Bend
The median family size in Eagle Bend is 3.10 persons per family, with single male/father families (6 | 3.6%) accounting for the largest median family size of 4.17 persons per family. On the other hand, single female/mother families (66 | 39.5%) represent the smallest median family size with 2.83 persons per family.
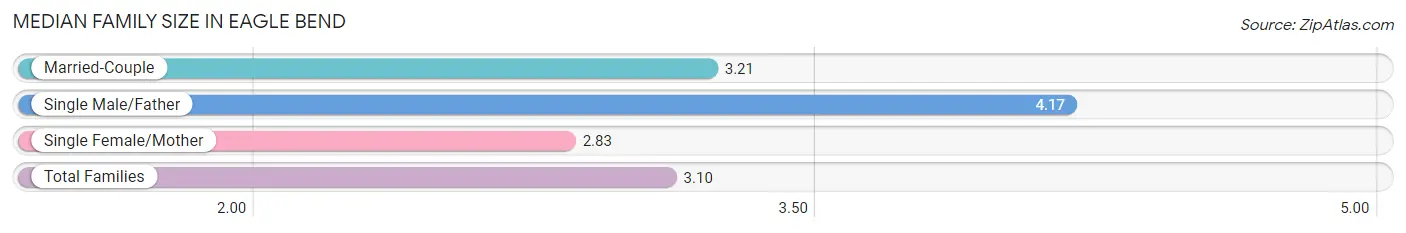
| Family Type | # Families | Family Size |
| Married-Couple | 95 (56.9%) | 3.21 |
| Single Male/Father | 6 (3.6%) | 4.17 |
| Single Female/Mother | 66 (39.5%) | 2.83 |
| Total Families | 167 (100.0%) | 3.10 |
Median Household Size in Eagle Bend
The median household size in Eagle Bend is 2.41 persons per household, with single male/father households (6 | 2.2%) accounting for the largest median household size of 4.83 persons per household. non-family households (102 | 37.9%) represent the smallest median household size with 1.03 persons per household.
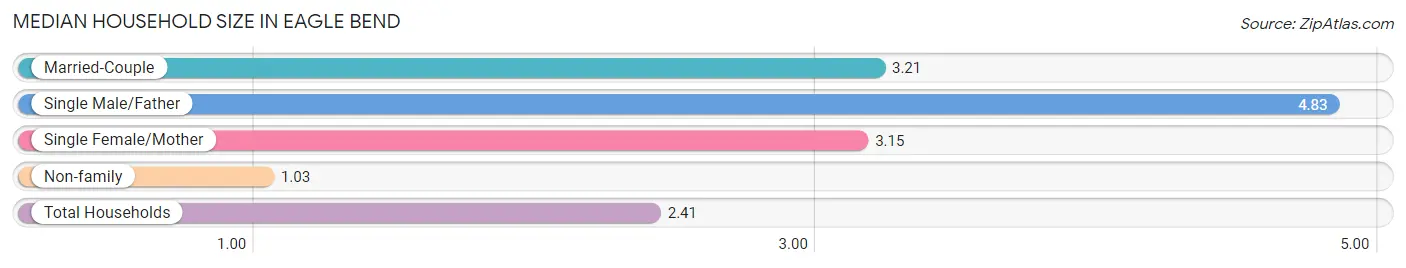
| Household Type | # Households | Household Size |
| Married-Couple | 95 (35.3%) | 3.21 |
| Single Male/Father | 6 (2.2%) | 4.83 |
| Single Female/Mother | 66 (24.5%) | 3.15 |
| Non-family | 102 (37.9%) | 1.03 |
| Total Households | 269 (100.0%) | 2.41 |
Household Size by Marriage Status in Eagle Bend
Out of a total of 269 households in Eagle Bend, 167 (62.1%) are family households, while 102 (37.9%) are nonfamily households. The most numerous type of family households are 2-person households, comprising 58, and the most common type of nonfamily households are 1-person households, comprising 97.
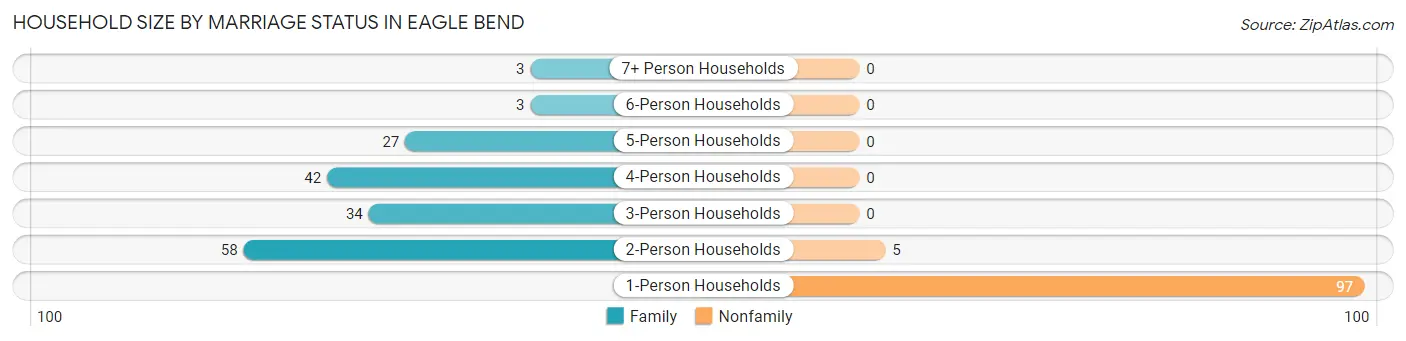
| Household Size | Family Households | Nonfamily Households |
| 1-Person Households | - | 97 (36.1%) |
| 2-Person Households | 58 (21.6%) | 5 (1.9%) |
| 3-Person Households | 34 (12.6%) | 0 (0.0%) |
| 4-Person Households | 42 (15.6%) | 0 (0.0%) |
| 5-Person Households | 27 (10.0%) | 0 (0.0%) |
| 6-Person Households | 3 (1.1%) | 0 (0.0%) |
| 7+ Person Households | 3 (1.1%) | 0 (0.0%) |
| Total | 167 (62.1%) | 102 (37.9%) |
Female Fertility in Eagle Bend
Fertility by Age in Eagle Bend
Average fertility rate in Eagle Bend is 57.0 births per 1,000 women. Women in the age bracket of 20 to 34 years have the highest fertility rate with 104.0 births per 1,000 women. Women in the age bracket of 20 to 34 years acount for 100.0% of all women with births.
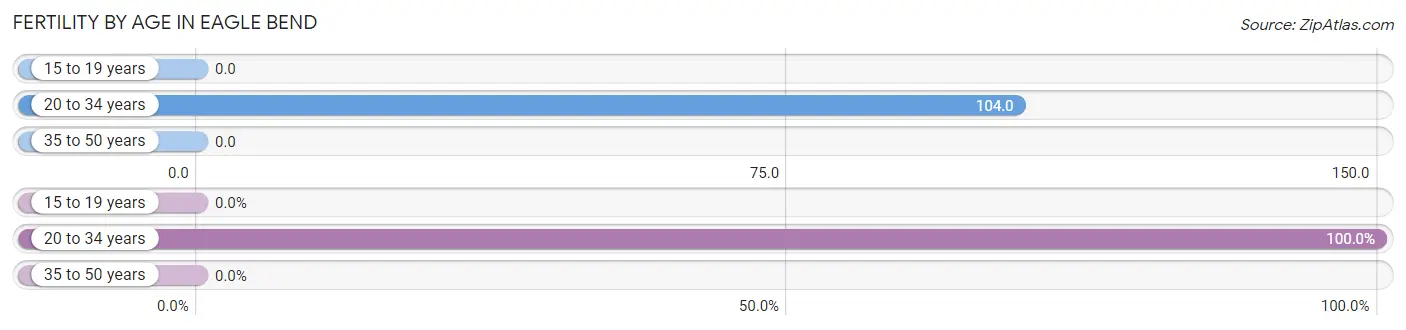
| Age Bracket | Women with Births | Births / 1,000 Women |
| 15 to 19 years | 0 (0.0%) | 0.0 |
| 20 to 34 years | 8 (100.0%) | 104.0 |
| 35 to 50 years | 0 (0.0%) | 0.0 |
| Total | 8 (100.0%) | 57.0 |
Fertility by Age by Marriage Status in Eagle Bend
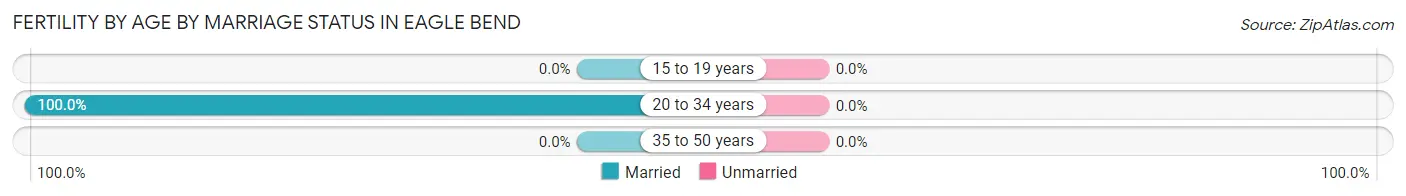
| Age Bracket | Married | Unmarried |
| 15 to 19 years | 0 (0.0%) | 0 (0.0%) |
| 20 to 34 years | 8 (100.0%) | 0 (0.0%) |
| 35 to 50 years | 0 (0.0%) | 0 (0.0%) |
| Total | 8 (100.0%) | 0 (0.0%) |
Fertility by Education in Eagle Bend
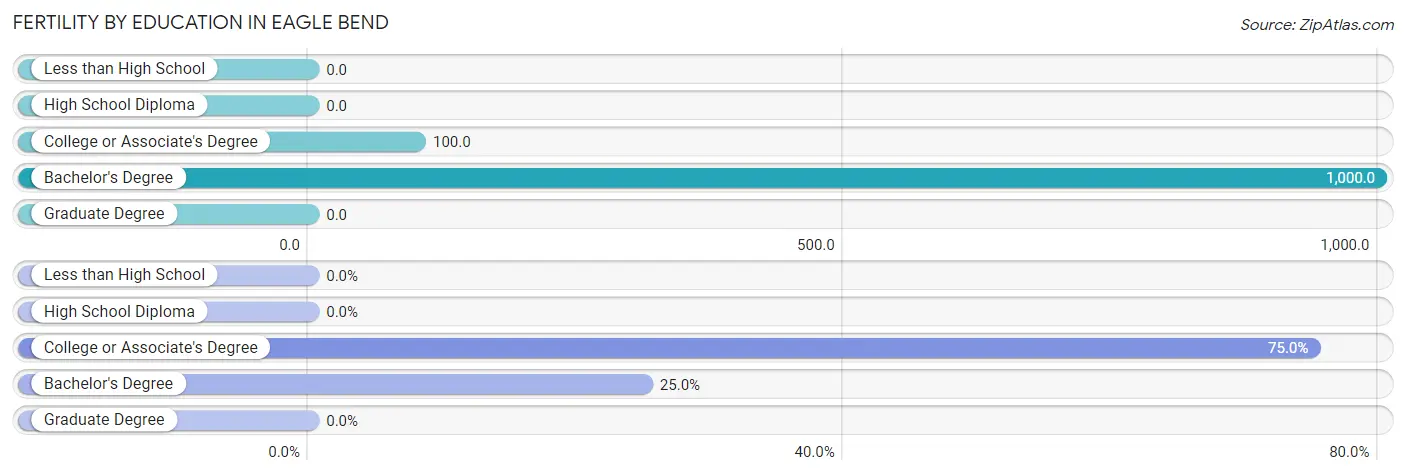
| Educational Attainment | Women with Births | Births / 1,000 Women |
| Less than High School | 0 (0.0%) | 0.0 |
| High School Diploma | 0 (0.0%) | 0.0 |
| College or Associate's Degree | 6 (75.0%) | 100.0 |
| Bachelor's Degree | 2 (25.0%) | 1,000.0 |
| Graduate Degree | 0 (0.0%) | 0.0 |
| Total | 8 (100.0%) | 57.0 |
Fertility by Education by Marriage Status in Eagle Bend
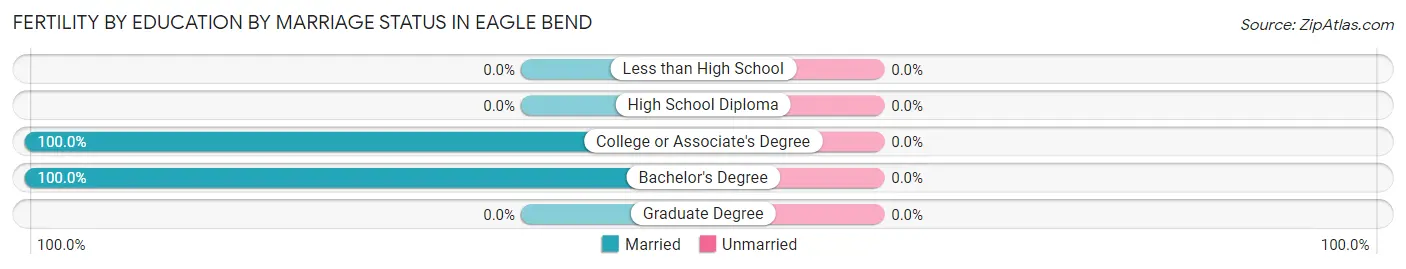
| Educational Attainment | Married | Unmarried |
| Less than High School | 0 (0.0%) | 0 (0.0%) |
| High School Diploma | 0 (0.0%) | 0 (0.0%) |
| College or Associate's Degree | 6 (100.0%) | 0 (0.0%) |
| Bachelor's Degree | 2 (100.0%) | 0 (0.0%) |
| Graduate Degree | 0 (0.0%) | 0 (0.0%) |
| Total | 8 (100.0%) | 0 (0.0%) |
Employment Characteristics in Eagle Bend
Employment by Class of Employer in Eagle Bend
Among the 257 employed individuals in Eagle Bend, private company employees (171 | 66.5%), not-for-profit organizations (25 | 9.7%), and local government employees (19 | 7.4%) make up the most common classes of employment.
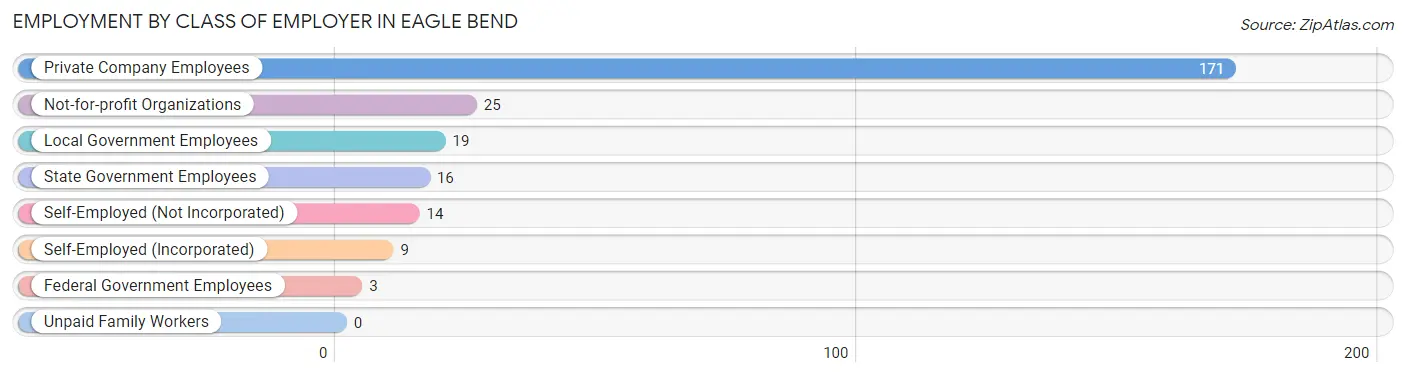
| Employer Class | # Employees | % Employees |
| Private Company Employees | 171 | 66.5% |
| Self-Employed (Incorporated) | 9 | 3.5% |
| Self-Employed (Not Incorporated) | 14 | 5.4% |
| Not-for-profit Organizations | 25 | 9.7% |
| Local Government Employees | 19 | 7.4% |
| State Government Employees | 16 | 6.2% |
| Federal Government Employees | 3 | 1.2% |
| Unpaid Family Workers | 0 | 0.0% |
| Total | 257 | 100.0% |
Employment Status by Age in Eagle Bend
According to the labor force statistics for Eagle Bend, out of the total population over 16 years of age (451), 58.1% or 262 individuals are in the labor force, with 1.1% or 3 of them unemployed. The age group with the highest labor force participation rate is 35 to 44 years, with 94.4% or 85 individuals in the labor force. Within the labor force, the 25 to 29 years age range has the highest percentage of unemployed individuals, with 13.3% or 2 of them being unemployed.
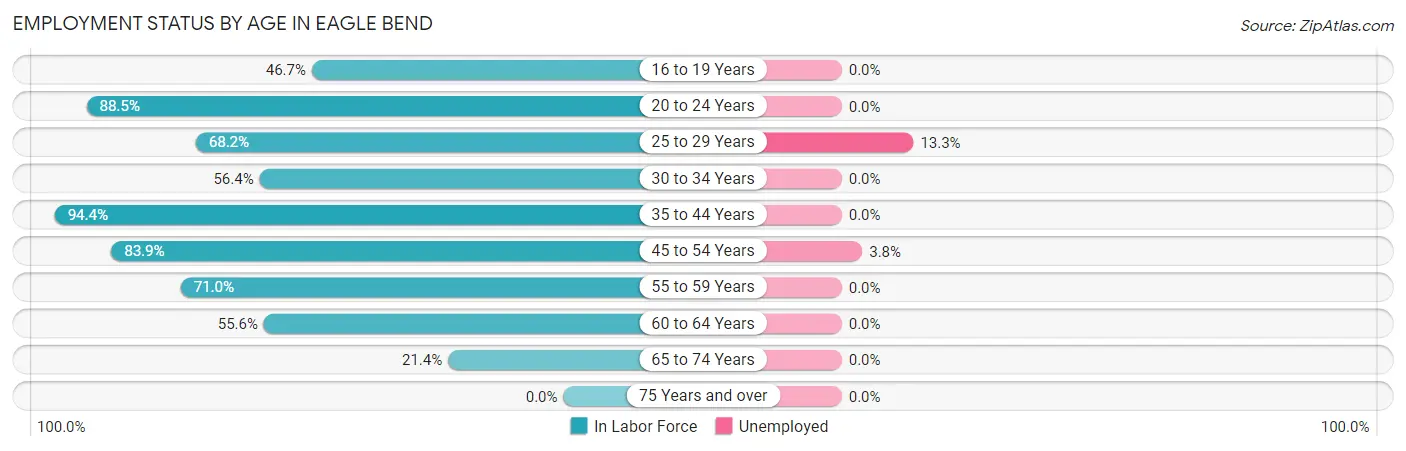
| Age Bracket | In Labor Force | Unemployed |
| 16 to 19 Years | 7 (46.7%) | 0 (0.0%) |
| 20 to 24 Years | 23 (88.5%) | 0 (0.0%) |
| 25 to 29 Years | 15 (68.2%) | 2 (13.3%) |
| 30 to 34 Years | 44 (56.4%) | 0 (0.0%) |
| 35 to 44 Years | 85 (94.4%) | 0 (0.0%) |
| 45 to 54 Years | 26 (83.9%) | 1 (3.8%) |
| 55 to 59 Years | 22 (71.0%) | 0 (0.0%) |
| 60 to 64 Years | 25 (55.6%) | 0 (0.0%) |
| 65 to 74 Years | 15 (21.4%) | 0 (0.0%) |
| 75 Years and over | 0 (0.0%) | 0 (0.0%) |
| Total | 262 (58.1%) | 3 (1.1%) |
Employment Status by Educational Attainment in Eagle Bend
According to labor force statistics for Eagle Bend, 73.1% of individuals (217) out of the total population between 25 and 64 years of age (297) are in the labor force, with 1.4% or 3 of them being unemployed. The group with the highest labor force participation rate are those with the educational attainment of less than high school, with 100.0% or 4 individuals in the labor force. Within the labor force, individuals with high school diploma education have the highest percentage of unemployment, with 2.5% or 3 of them being unemployed.
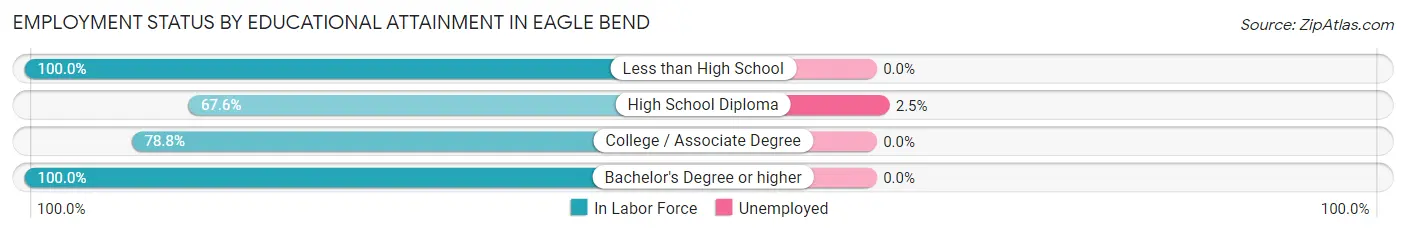
| Educational Attainment | In Labor Force | Unemployed |
| Less than High School | 4 (100.0%) | 0 (0.0%) |
| High School Diploma | 121 (67.6%) | 4 (2.5%) |
| College / Associate Degree | 82 (78.8%) | 0 (0.0%) |
| Bachelor's Degree or higher | 10 (100.0%) | 0 (0.0%) |
| Total | 217 (73.1%) | 4 (1.4%) |
Employment Occupations by Sex in Eagle Bend
Management, Business, Science and Arts Occupations
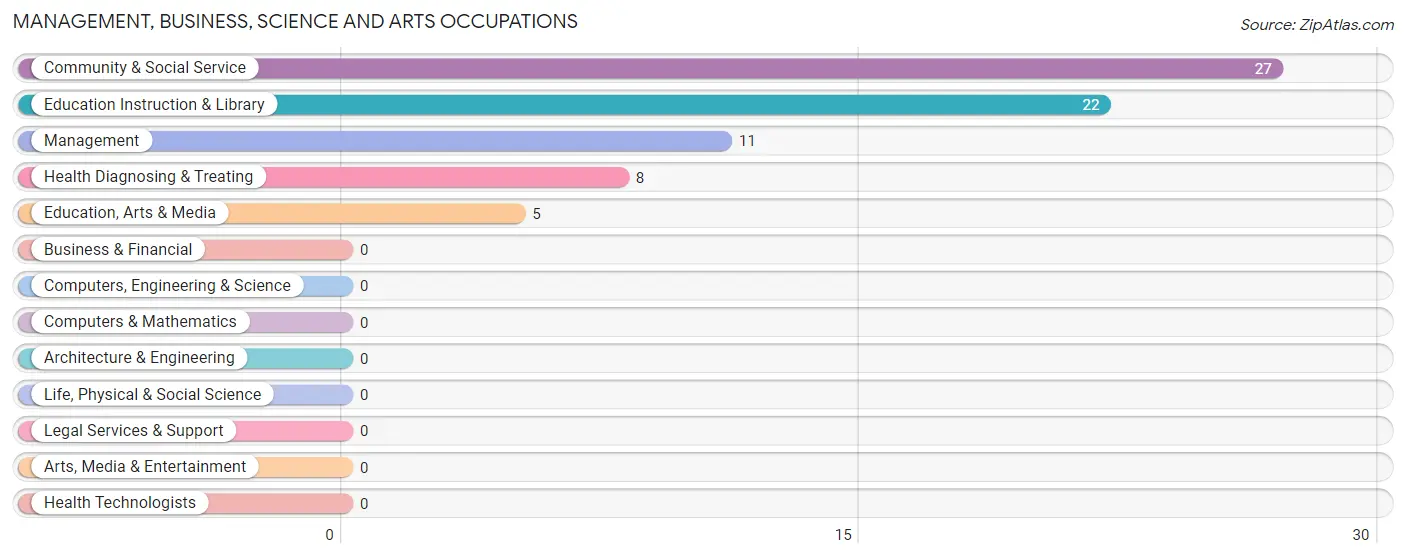
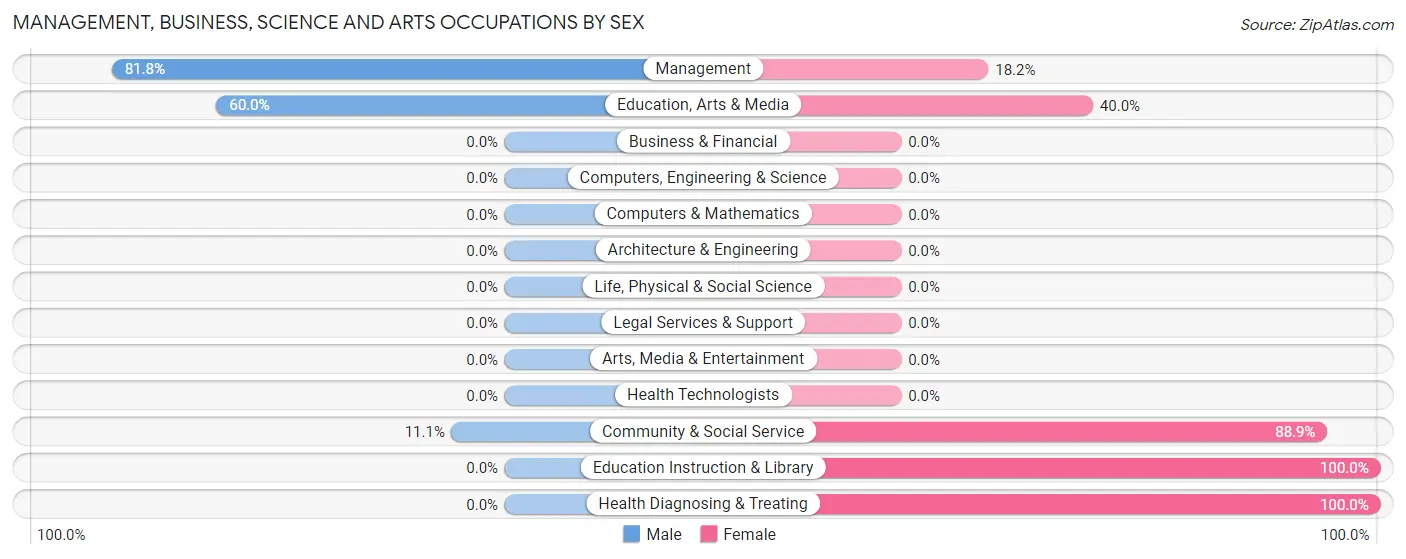
The most common Management, Business, Science and Arts occupations in Eagle Bend are Community & Social Service (27 | 10.4%), Education Instruction & Library (22 | 8.5%), Management (11 | 4.3%), Health Diagnosing & Treating (8 | 3.1%), and Education, Arts & Media (5 | 1.9%).
Management, Business, Science and Arts Occupations by Sex
Within the Management, Business, Science and Arts occupations in Eagle Bend, the most male-oriented occupations are Management (81.8%), Education, Arts & Media (60.0%), and Community & Social Service (11.1%), while the most female-oriented occupations are Education Instruction & Library (100.0%), Health Diagnosing & Treating (100.0%), and Community & Social Service (88.9%).
| Occupation | Male | Female |
| Management | 9 (81.8%) | 2 (18.2%) |
| Business & Financial | 0 (0.0%) | 0 (0.0%) |
| Computers, Engineering & Science | 0 (0.0%) | 0 (0.0%) |
| Computers & Mathematics | 0 (0.0%) | 0 (0.0%) |
| Architecture & Engineering | 0 (0.0%) | 0 (0.0%) |
| Life, Physical & Social Science | 0 (0.0%) | 0 (0.0%) |
| Community & Social Service | 3 (11.1%) | 24 (88.9%) |
| Education, Arts & Media | 3 (60.0%) | 2 (40.0%) |
| Legal Services & Support | 0 (0.0%) | 0 (0.0%) |
| Education Instruction & Library | 0 (0.0%) | 22 (100.0%) |
| Arts, Media & Entertainment | 0 (0.0%) | 0 (0.0%) |
| Health Diagnosing & Treating | 0 (0.0%) | 8 (100.0%) |
| Health Technologists | 0 (0.0%) | 0 (0.0%) |
| Total (Category) | 12 (26.1%) | 34 (73.9%) |
| Total (Overall) | 118 (45.6%) | 141 (54.4%) |
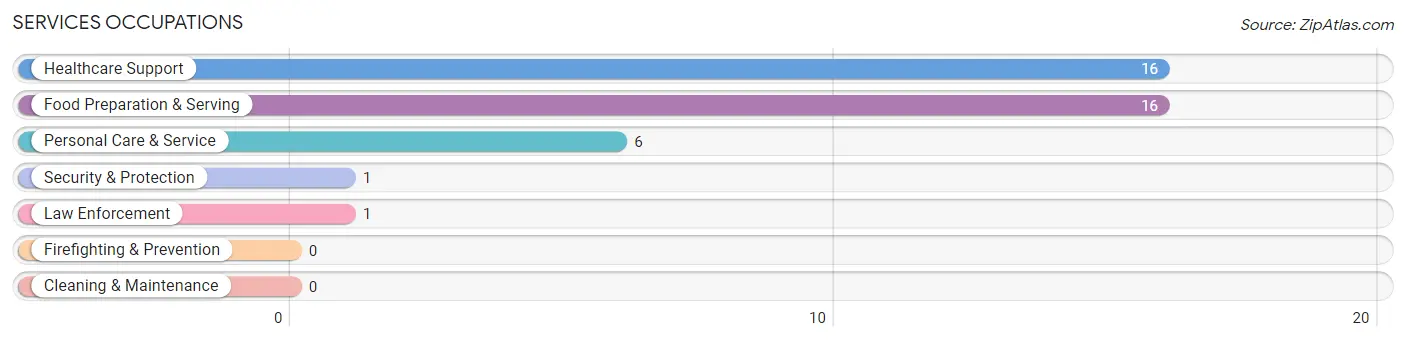
Services Occupations
The most common Services occupations in Eagle Bend are Healthcare Support (16 | 6.2%), Food Preparation & Serving (16 | 6.2%), Personal Care & Service (6 | 2.3%), Security & Protection (1 | 0.4%), and Law Enforcement (1 | 0.4%).
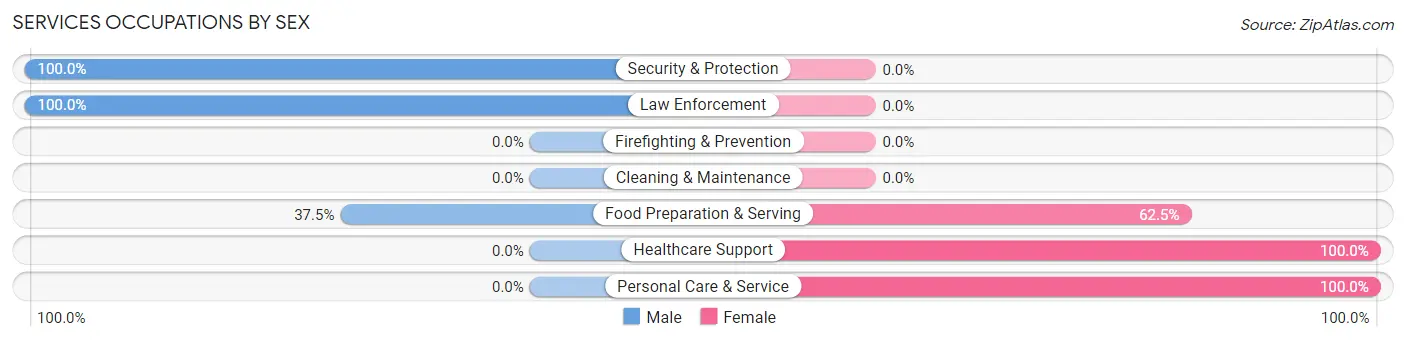
Services Occupations by Sex
Within the Services occupations in Eagle Bend, the most male-oriented occupations are Security & Protection (100.0%), Law Enforcement (100.0%), and Food Preparation & Serving (37.5%), while the most female-oriented occupations are Healthcare Support (100.0%), Personal Care & Service (100.0%), and Food Preparation & Serving (62.5%).
| Occupation | Male | Female |
| Healthcare Support | 0 (0.0%) | 16 (100.0%) |
| Security & Protection | 1 (100.0%) | 0 (0.0%) |
| Firefighting & Prevention | 0 (0.0%) | 0 (0.0%) |
| Law Enforcement | 1 (100.0%) | 0 (0.0%) |
| Food Preparation & Serving | 6 (37.5%) | 10 (62.5%) |
| Cleaning & Maintenance | 0 (0.0%) | 0 (0.0%) |
| Personal Care & Service | 0 (0.0%) | 6 (100.0%) |
| Total (Category) | 7 (17.9%) | 32 (82.1%) |
| Total (Overall) | 118 (45.6%) | 141 (54.4%) |
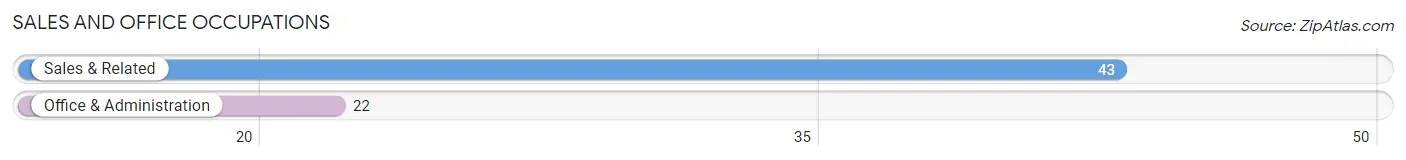
Sales and Office Occupations
The most common Sales and Office occupations in Eagle Bend are Sales & Related (43 | 16.6%), and Office & Administration (22 | 8.5%).
Sales and Office Occupations by Sex
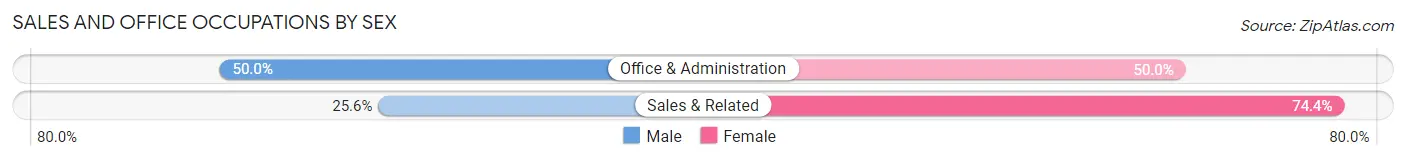
| Occupation | Male | Female |
| Sales & Related | 11 (25.6%) | 32 (74.4%) |
| Office & Administration | 11 (50.0%) | 11 (50.0%) |
| Total (Category) | 22 (33.9%) | 43 (66.1%) |
| Total (Overall) | 118 (45.6%) | 141 (54.4%) |
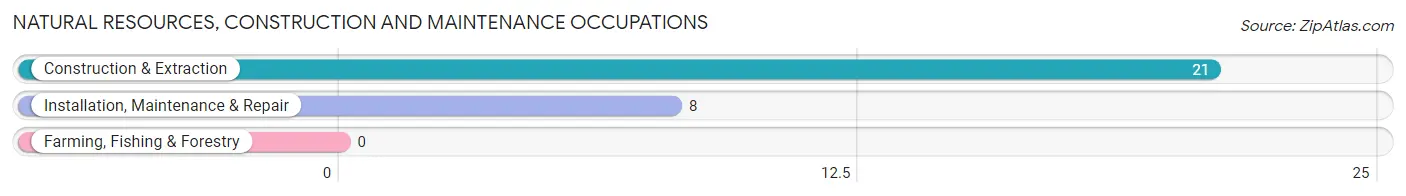
Natural Resources, Construction and Maintenance Occupations
The most common Natural Resources, Construction and Maintenance occupations in Eagle Bend are Construction & Extraction (21 | 8.1%), and Installation, Maintenance & Repair (8 | 3.1%).
Natural Resources, Construction and Maintenance Occupations by Sex
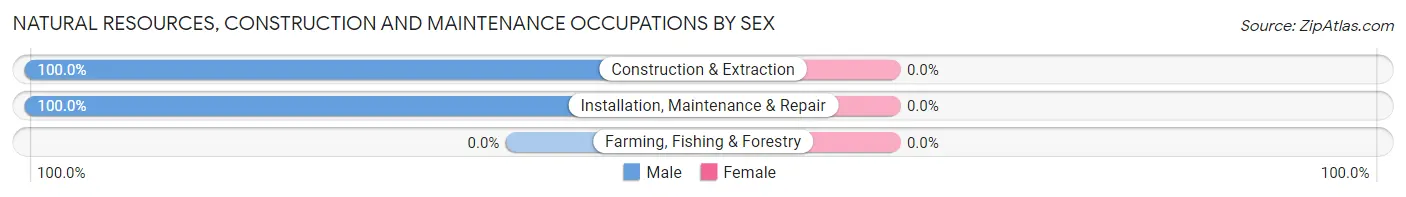
| Occupation | Male | Female |
| Farming, Fishing & Forestry | 0 (0.0%) | 0 (0.0%) |
| Construction & Extraction | 21 (100.0%) | 0 (0.0%) |
| Installation, Maintenance & Repair | 8 (100.0%) | 0 (0.0%) |
| Total (Category) | 29 (100.0%) | 0 (0.0%) |
| Total (Overall) | 118 (45.6%) | 141 (54.4%) |
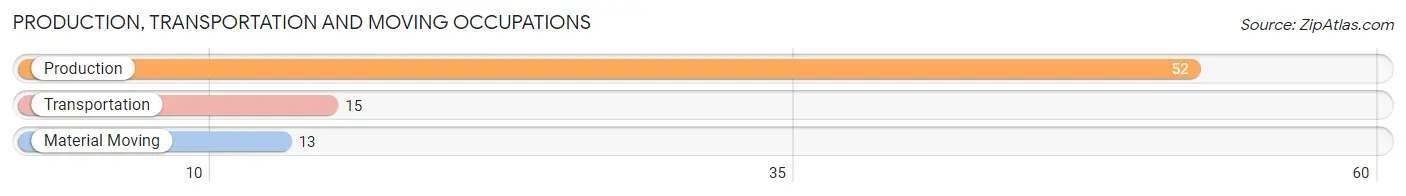
Production, Transportation and Moving Occupations
The most common Production, Transportation and Moving occupations in Eagle Bend are Production (52 | 20.1%), Transportation (15 | 5.8%), and Material Moving (13 | 5.0%).
Production, Transportation and Moving Occupations by Sex
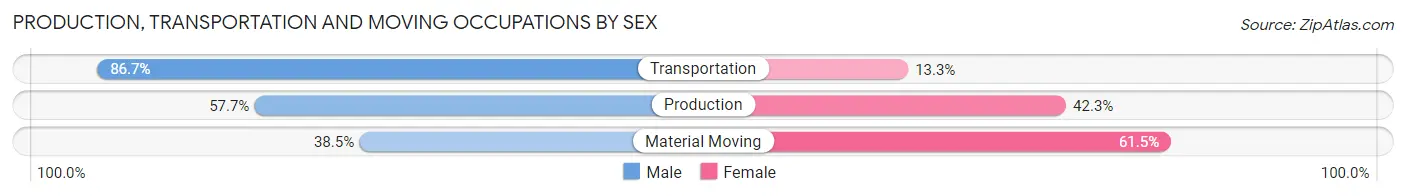
| Occupation | Male | Female |
| Production | 30 (57.7%) | 22 (42.3%) |
| Transportation | 13 (86.7%) | 2 (13.3%) |
| Material Moving | 5 (38.5%) | 8 (61.5%) |
| Total (Category) | 48 (60.0%) | 32 (40.0%) |
| Total (Overall) | 118 (45.6%) | 141 (54.4%) |
Employment Industries by Sex in Eagle Bend
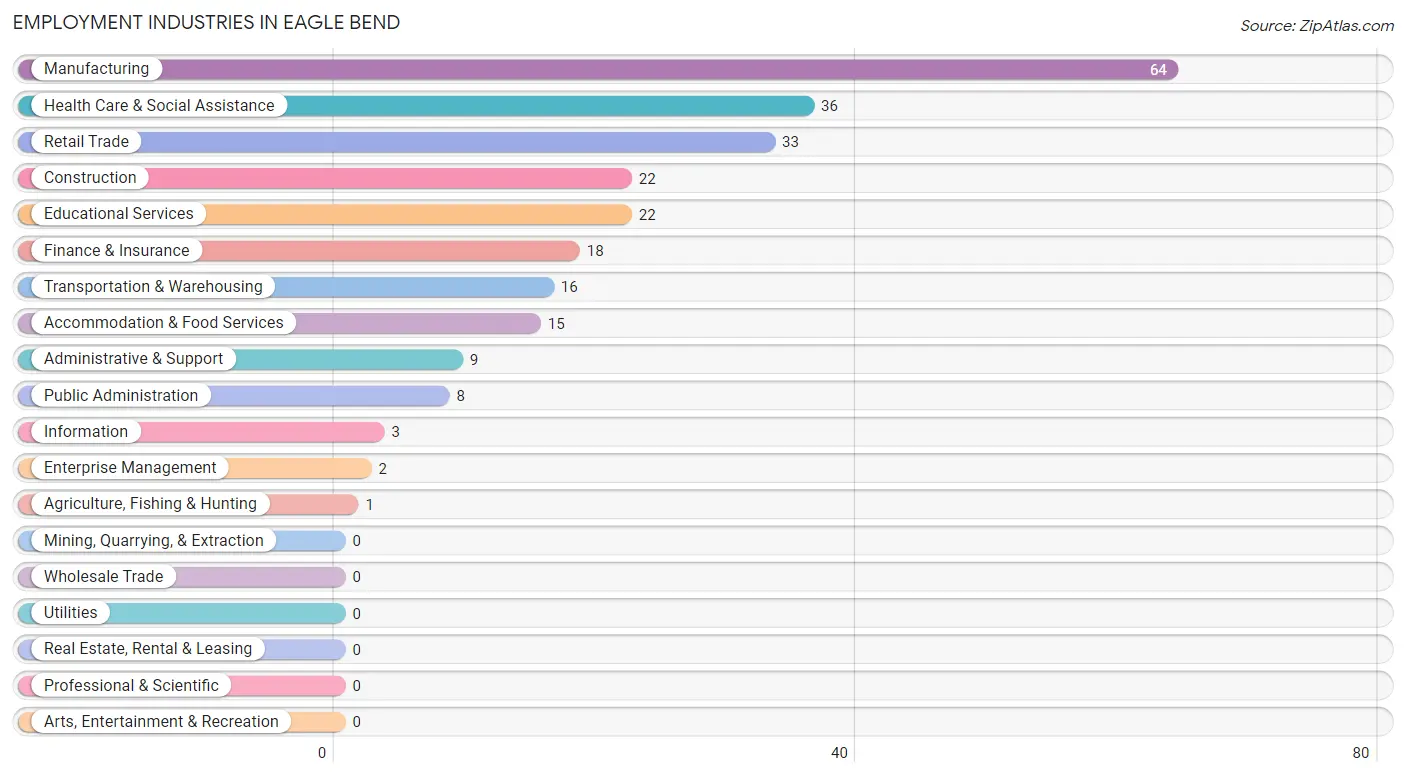
Employment Industries in Eagle Bend
The major employment industries in Eagle Bend include Manufacturing (64 | 24.7%), Health Care & Social Assistance (36 | 13.9%), Retail Trade (33 | 12.7%), Construction (22 | 8.5%), and Educational Services (22 | 8.5%).
Employment Industries by Sex in Eagle Bend
The Eagle Bend industries that see more men than women are Agriculture, Fishing & Hunting (100.0%), Construction (100.0%), and Information (100.0%), whereas the industries that tend to have a higher number of women are Educational Services (100.0%), Health Care & Social Assistance (83.3%), and Retail Trade (75.8%).
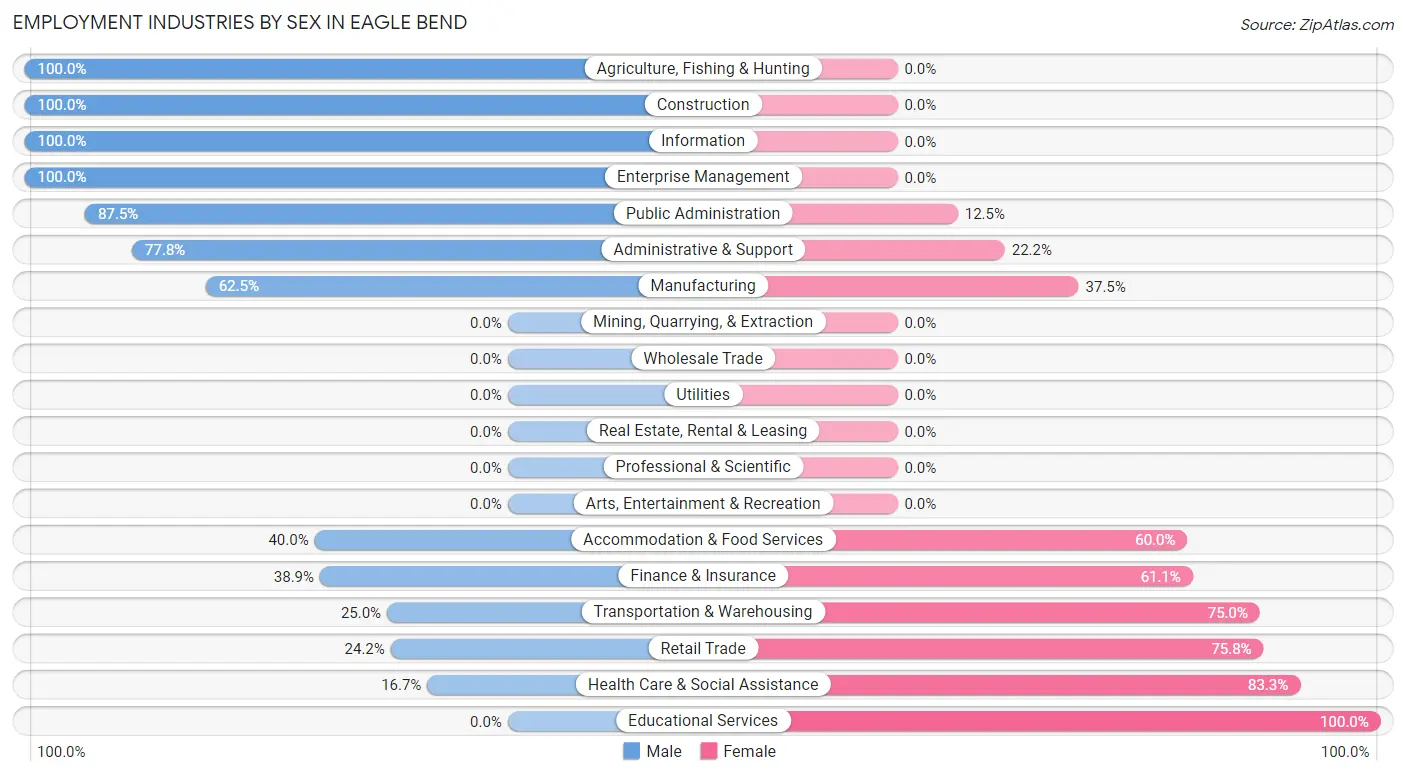
| Industry | Male | Female |
| Agriculture, Fishing & Hunting | 1 (100.0%) | 0 (0.0%) |
| Mining, Quarrying, & Extraction | 0 (0.0%) | 0 (0.0%) |
| Construction | 22 (100.0%) | 0 (0.0%) |
| Manufacturing | 40 (62.5%) | 24 (37.5%) |
| Wholesale Trade | 0 (0.0%) | 0 (0.0%) |
| Retail Trade | 8 (24.2%) | 25 (75.8%) |
| Transportation & Warehousing | 4 (25.0%) | 12 (75.0%) |
| Utilities | 0 (0.0%) | 0 (0.0%) |
| Information | 3 (100.0%) | 0 (0.0%) |
| Finance & Insurance | 7 (38.9%) | 11 (61.1%) |
| Real Estate, Rental & Leasing | 0 (0.0%) | 0 (0.0%) |
| Professional & Scientific | 0 (0.0%) | 0 (0.0%) |
| Enterprise Management | 2 (100.0%) | 0 (0.0%) |
| Administrative & Support | 7 (77.8%) | 2 (22.2%) |
| Educational Services | 0 (0.0%) | 22 (100.0%) |
| Health Care & Social Assistance | 6 (16.7%) | 30 (83.3%) |
| Arts, Entertainment & Recreation | 0 (0.0%) | 0 (0.0%) |
| Accommodation & Food Services | 6 (40.0%) | 9 (60.0%) |
| Public Administration | 7 (87.5%) | 1 (12.5%) |
| Total | 118 (45.6%) | 141 (54.4%) |
Education in Eagle Bend
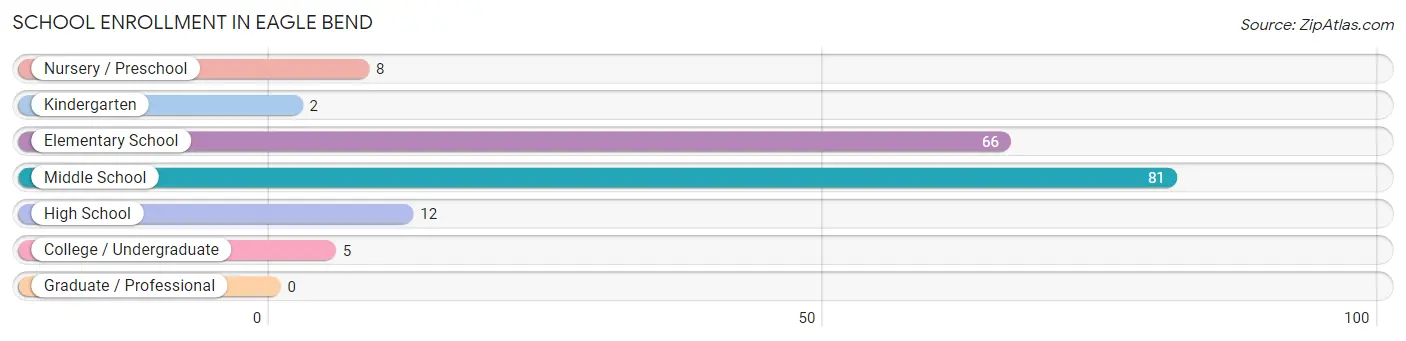
School Enrollment in Eagle Bend
The most common levels of schooling among the 174 students in Eagle Bend are middle school (81 | 46.6%), elementary school (66 | 37.9%), and high school (12 | 6.9%).
| School Level | # Students | % Students |
| Nursery / Preschool | 8 | 4.6% |
| Kindergarten | 2 | 1.1% |
| Elementary School | 66 | 37.9% |
| Middle School | 81 | 46.6% |
| High School | 12 | 6.9% |
| College / Undergraduate | 5 | 2.9% |
| Graduate / Professional | 0 | 0.0% |
| Total | 174 | 100.0% |
School Enrollment by Age by Funding Source in Eagle Bend
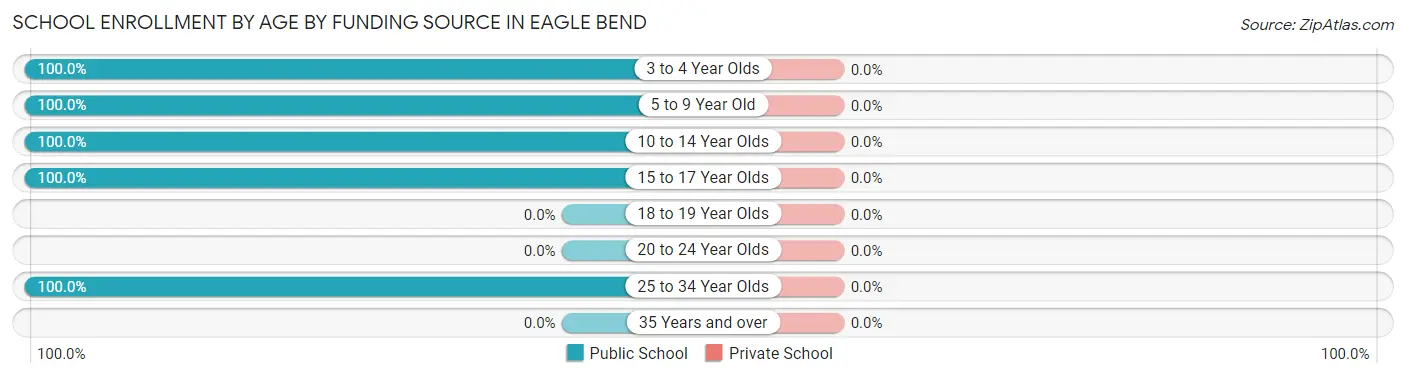
| Age Bracket | Public School | Private School |
| 3 to 4 Year Olds | 1 (100.0%) | 0 (0.0%) |
| 5 to 9 Year Old | 35 (100.0%) | 0 (0.0%) |
| 10 to 14 Year Olds | 123 (100.0%) | 0 (0.0%) |
| 15 to 17 Year Olds | 10 (100.0%) | 0 (0.0%) |
| 18 to 19 Year Olds | 0 (0.0%) | 0 (0.0%) |
| 20 to 24 Year Olds | 0 (0.0%) | 0 (0.0%) |
| 25 to 34 Year Olds | 5 (100.0%) | 0 (0.0%) |
| 35 Years and over | 0 (0.0%) | 0 (0.0%) |
| Total | 174 (100.0%) | 0 (0.0%) |
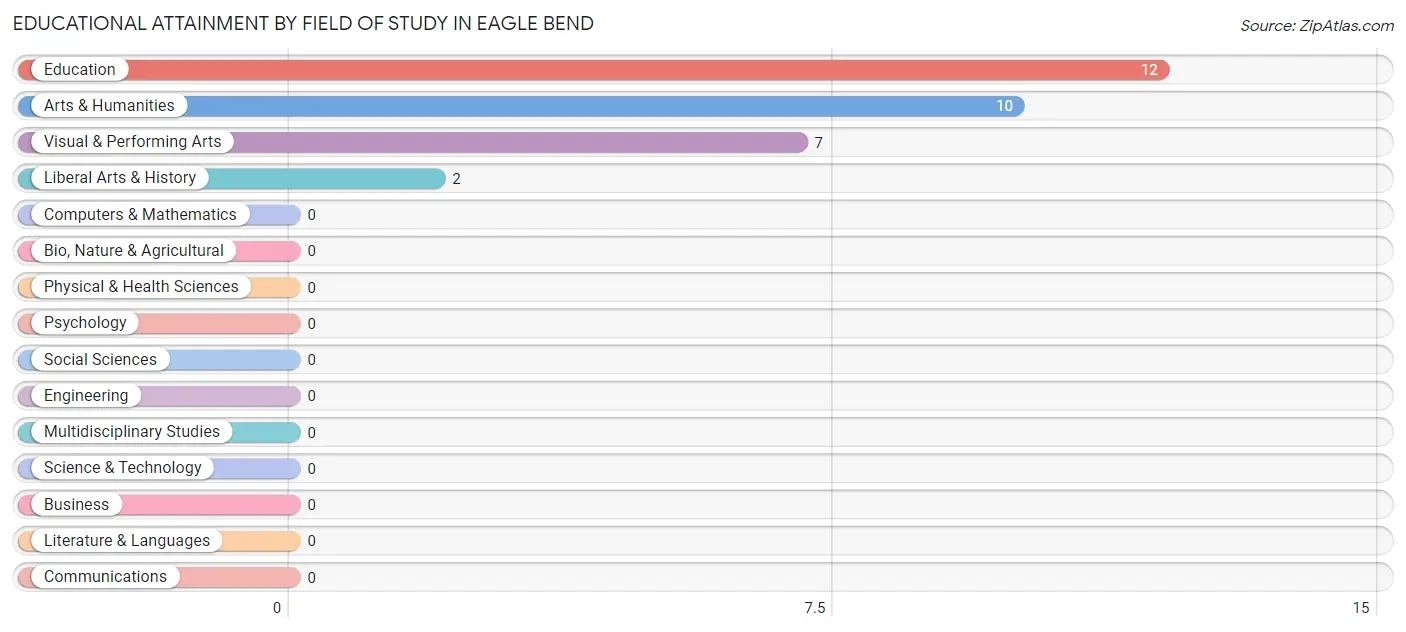
Educational Attainment by Field of Study in Eagle Bend
Education (12 | 38.7%), arts & humanities (10 | 32.3%), visual & performing arts (7 | 22.6%), and liberal arts & history (2 | 6.5%) are the most common fields of study among 31 individuals in Eagle Bend who have obtained a bachelor's degree or higher.
| Field of Study | # Graduates | % Graduates |
| Computers & Mathematics | 0 | 0.0% |
| Bio, Nature & Agricultural | 0 | 0.0% |
| Physical & Health Sciences | 0 | 0.0% |
| Psychology | 0 | 0.0% |
| Social Sciences | 0 | 0.0% |
| Engineering | 0 | 0.0% |
| Multidisciplinary Studies | 0 | 0.0% |
| Science & Technology | 0 | 0.0% |
| Business | 0 | 0.0% |
| Education | 12 | 38.7% |
| Literature & Languages | 0 | 0.0% |
| Liberal Arts & History | 2 | 6.5% |
| Visual & Performing Arts | 7 | 22.6% |
| Communications | 0 | 0.0% |
| Arts & Humanities | 10 | 32.3% |
| Total | 31 | 100.0% |
Transportation & Commute in Eagle Bend
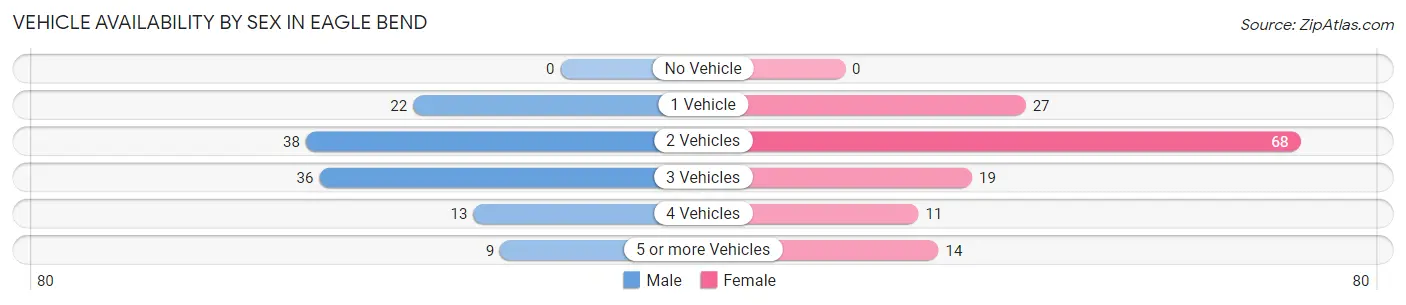
Vehicle Availability by Sex in Eagle Bend
The most prevalent vehicle ownership categories in Eagle Bend are males with 2 vehicles (38, accounting for 32.2%) and females with 2 vehicles (68, making up 27.3%).
| Vehicles Available | Male | Female |
| No Vehicle | 0 (0.0%) | 0 (0.0%) |
| 1 Vehicle | 22 (18.6%) | 27 (19.4%) |
| 2 Vehicles | 38 (32.2%) | 68 (48.9%) |
| 3 Vehicles | 36 (30.5%) | 19 (13.7%) |
| 4 Vehicles | 13 (11.0%) | 11 (7.9%) |
| 5 or more Vehicles | 9 (7.6%) | 14 (10.1%) |
| Total | 118 (100.0%) | 139 (100.0%) |
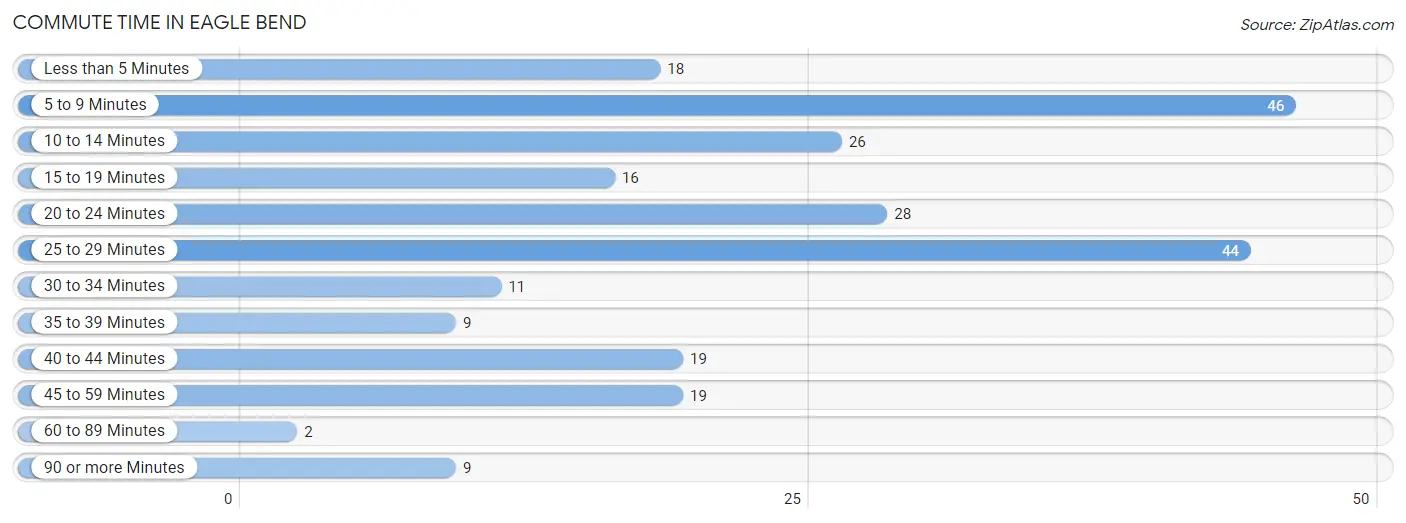
Commute Time in Eagle Bend
The most frequently occuring commute durations in Eagle Bend are 5 to 9 minutes (46 commuters, 18.6%), 25 to 29 minutes (44 commuters, 17.8%), and 20 to 24 minutes (28 commuters, 11.3%).
| Commute Time | # Commuters | % Commuters |
| Less than 5 Minutes | 18 | 7.3% |
| 5 to 9 Minutes | 46 | 18.6% |
| 10 to 14 Minutes | 26 | 10.5% |
| 15 to 19 Minutes | 16 | 6.5% |
| 20 to 24 Minutes | 28 | 11.3% |
| 25 to 29 Minutes | 44 | 17.8% |
| 30 to 34 Minutes | 11 | 4.4% |
| 35 to 39 Minutes | 9 | 3.6% |
| 40 to 44 Minutes | 19 | 7.7% |
| 45 to 59 Minutes | 19 | 7.7% |
| 60 to 89 Minutes | 2 | 0.8% |
| 90 or more Minutes | 9 | 3.6% |
Commute Time by Sex in Eagle Bend
The most common commute times in Eagle Bend are 5 to 9 minutes (17 commuters, 15.2%) for males and 25 to 29 minutes (30 commuters, 22.2%) for females.
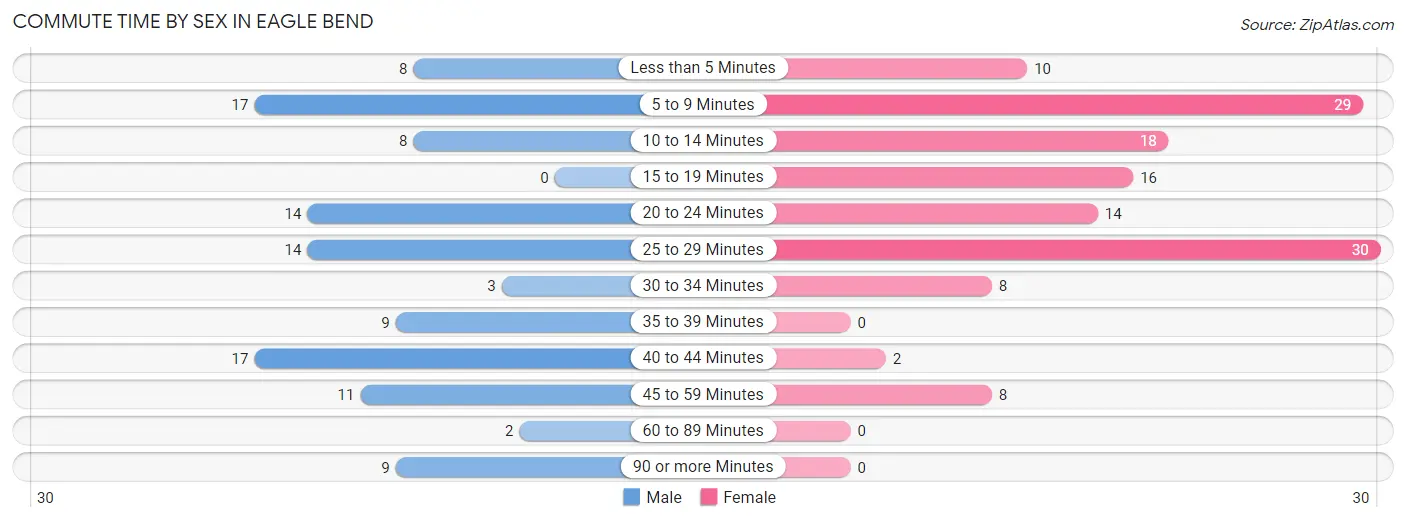
| Commute Time | Male | Female |
| Less than 5 Minutes | 8 (7.1%) | 10 (7.4%) |
| 5 to 9 Minutes | 17 (15.2%) | 29 (21.5%) |
| 10 to 14 Minutes | 8 (7.1%) | 18 (13.3%) |
| 15 to 19 Minutes | 0 (0.0%) | 16 (11.8%) |
| 20 to 24 Minutes | 14 (12.5%) | 14 (10.4%) |
| 25 to 29 Minutes | 14 (12.5%) | 30 (22.2%) |
| 30 to 34 Minutes | 3 (2.7%) | 8 (5.9%) |
| 35 to 39 Minutes | 9 (8.0%) | 0 (0.0%) |
| 40 to 44 Minutes | 17 (15.2%) | 2 (1.5%) |
| 45 to 59 Minutes | 11 (9.8%) | 8 (5.9%) |
| 60 to 89 Minutes | 2 (1.8%) | 0 (0.0%) |
| 90 or more Minutes | 9 (8.0%) | 0 (0.0%) |
Time of Departure to Work by Sex in Eagle Bend
The most frequent times of departure to work in Eagle Bend are 5:30 AM to 5:59 AM (28, 25.0%) for males and 7:00 AM to 7:29 AM (31, 23.0%) for females.
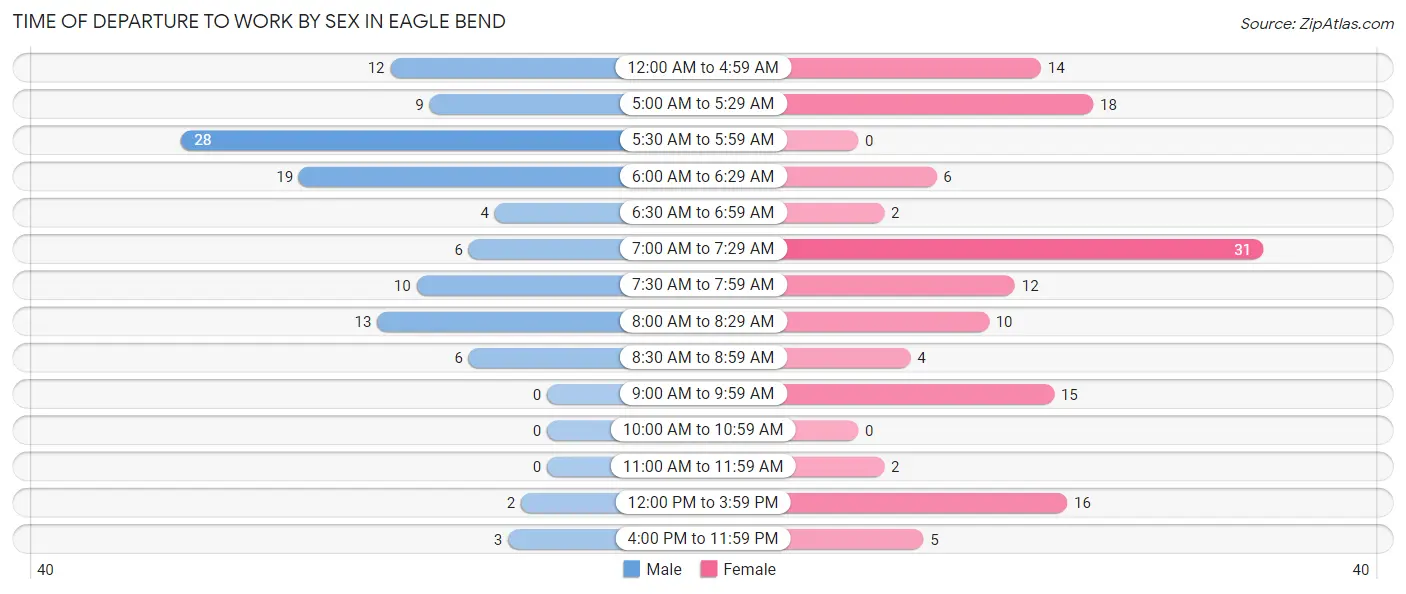
| Time of Departure | Male | Female |
| 12:00 AM to 4:59 AM | 12 (10.7%) | 14 (10.4%) |
| 5:00 AM to 5:29 AM | 9 (8.0%) | 18 (13.3%) |
| 5:30 AM to 5:59 AM | 28 (25.0%) | 0 (0.0%) |
| 6:00 AM to 6:29 AM | 19 (17.0%) | 6 (4.4%) |
| 6:30 AM to 6:59 AM | 4 (3.6%) | 2 (1.5%) |
| 7:00 AM to 7:29 AM | 6 (5.4%) | 31 (23.0%) |
| 7:30 AM to 7:59 AM | 10 (8.9%) | 12 (8.9%) |
| 8:00 AM to 8:29 AM | 13 (11.6%) | 10 (7.4%) |
| 8:30 AM to 8:59 AM | 6 (5.4%) | 4 (3.0%) |
| 9:00 AM to 9:59 AM | 0 (0.0%) | 15 (11.1%) |
| 10:00 AM to 10:59 AM | 0 (0.0%) | 0 (0.0%) |
| 11:00 AM to 11:59 AM | 0 (0.0%) | 2 (1.5%) |
| 12:00 PM to 3:59 PM | 2 (1.8%) | 16 (11.8%) |
| 4:00 PM to 11:59 PM | 3 (2.7%) | 5 (3.7%) |
| Total | 112 (100.0%) | 135 (100.0%) |
Housing Occupancy in Eagle Bend
Occupancy by Ownership in Eagle Bend
Of the total 269 dwellings in Eagle Bend, owner-occupied units account for 212 (78.8%), while renter-occupied units make up 57 (21.2%).
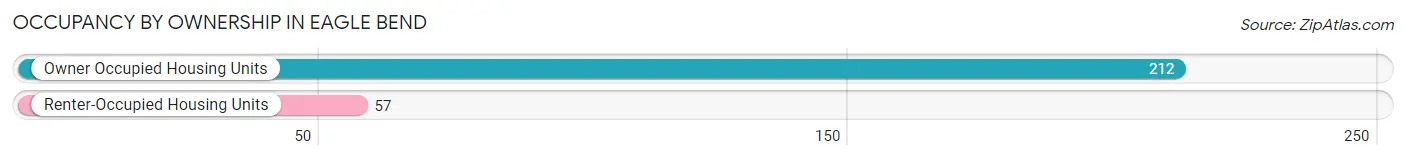
| Occupancy | # Housing Units | % Housing Units |
| Owner Occupied Housing Units | 212 | 78.8% |
| Renter-Occupied Housing Units | 57 | 21.2% |
| Total Occupied Housing Units | 269 | 100.0% |
Occupancy by Household Size in Eagle Bend
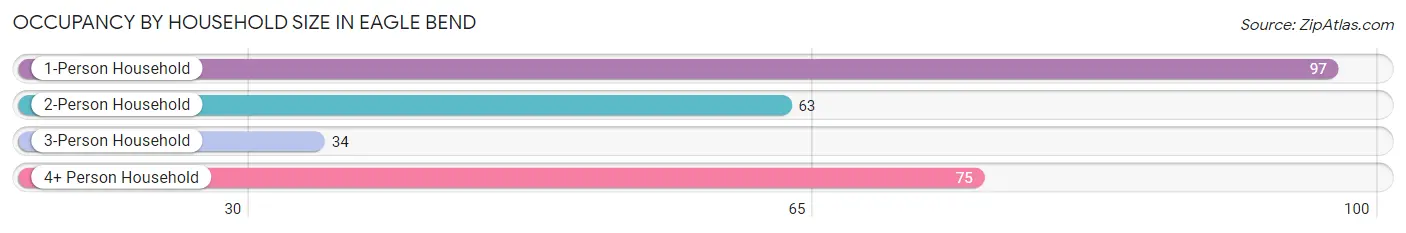
| Household Size | # Housing Units | % Housing Units |
| 1-Person Household | 97 | 36.1% |
| 2-Person Household | 63 | 23.4% |
| 3-Person Household | 34 | 12.6% |
| 4+ Person Household | 75 | 27.9% |
| Total Housing Units | 269 | 100.0% |
Occupancy by Ownership by Household Size in Eagle Bend
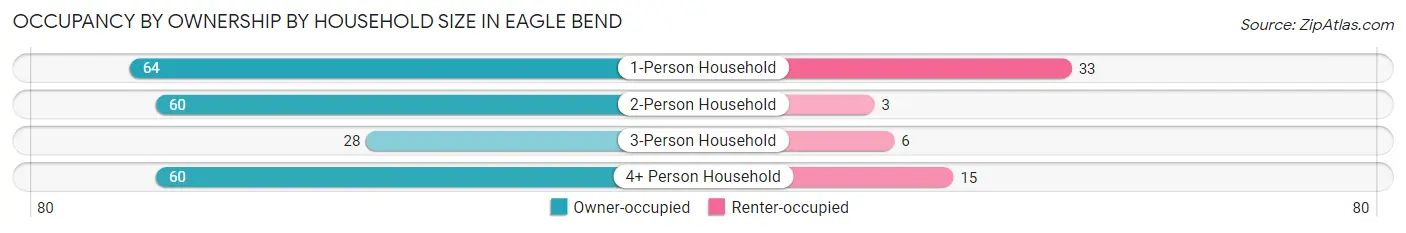
| Household Size | Owner-occupied | Renter-occupied |
| 1-Person Household | 64 (66.0%) | 33 (34.0%) |
| 2-Person Household | 60 (95.2%) | 3 (4.8%) |
| 3-Person Household | 28 (82.4%) | 6 (17.6%) |
| 4+ Person Household | 60 (80.0%) | 15 (20.0%) |
| Total Housing Units | 212 (78.8%) | 57 (21.2%) |
Occupancy by Educational Attainment in Eagle Bend
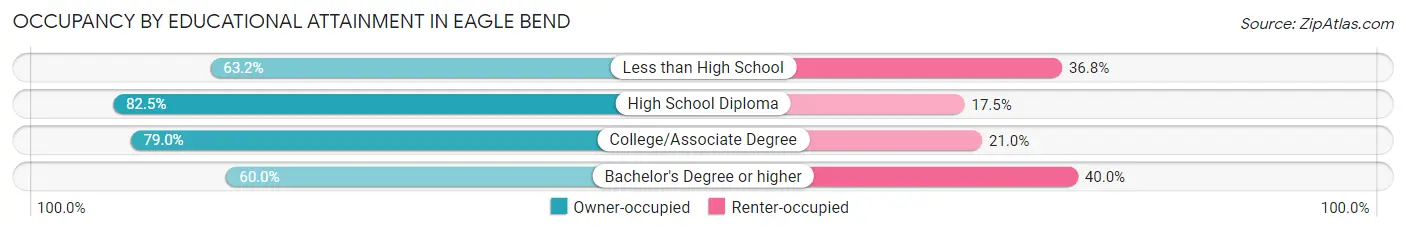
| Household Size | Owner-occupied | Renter-occupied |
| Less than High School | 12 (63.2%) | 7 (36.8%) |
| High School Diploma | 127 (82.5%) | 27 (17.5%) |
| College/Associate Degree | 64 (79.0%) | 17 (21.0%) |
| Bachelor's Degree or higher | 9 (60.0%) | 6 (40.0%) |
Occupancy by Age of Householder in Eagle Bend
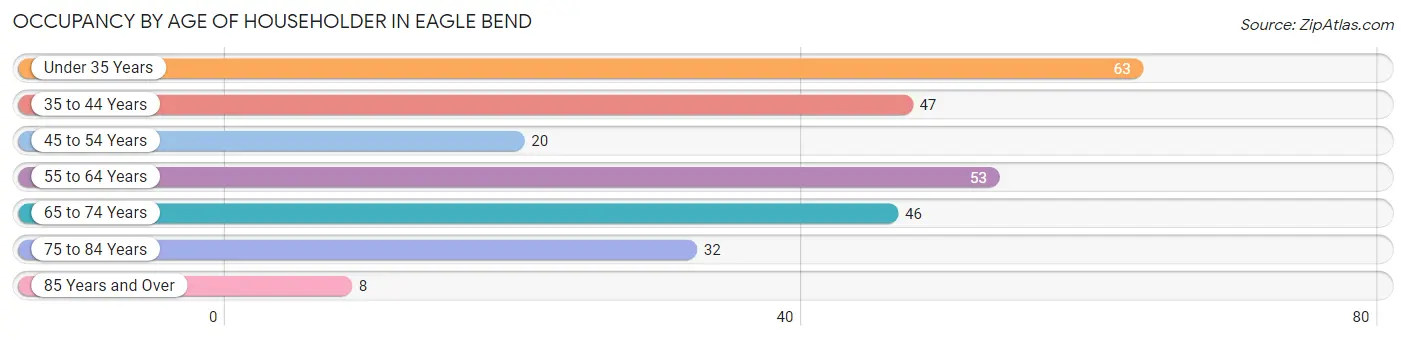
| Age Bracket | # Households | % Households |
| Under 35 Years | 63 | 23.4% |
| 35 to 44 Years | 47 | 17.5% |
| 45 to 54 Years | 20 | 7.4% |
| 55 to 64 Years | 53 | 19.7% |
| 65 to 74 Years | 46 | 17.1% |
| 75 to 84 Years | 32 | 11.9% |
| 85 Years and Over | 8 | 3.0% |
| Total | 269 | 100.0% |
Housing Finances in Eagle Bend
Median Income by Occupancy in Eagle Bend
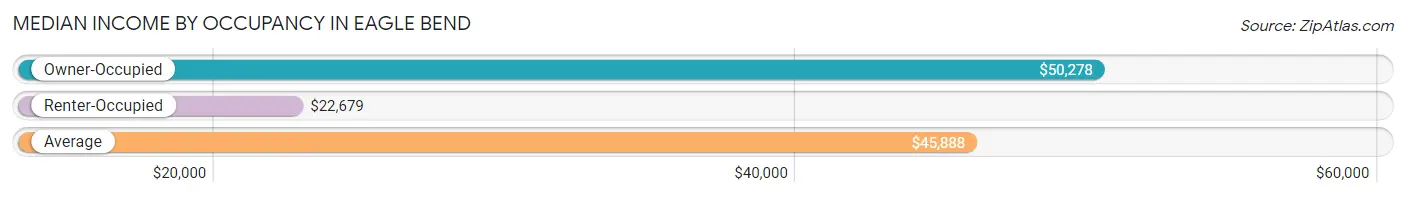
| Occupancy Type | # Households | Median Income |
| Owner-Occupied | 212 (78.8%) | $50,278 |
| Renter-Occupied | 57 (21.2%) | $22,679 |
| Average | 269 (100.0%) | $45,888 |
Occupancy by Householder Income Bracket in Eagle Bend
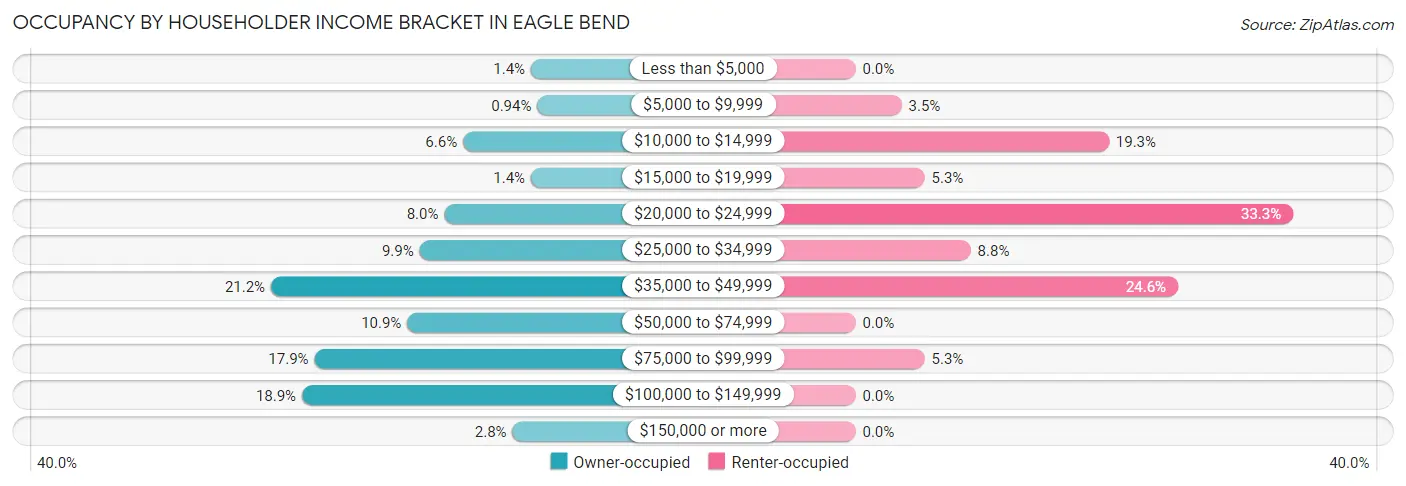
| Income Bracket | Owner-occupied | Renter-occupied |
| Less than $5,000 | 3 (1.4%) | 0 (0.0%) |
| $5,000 to $9,999 | 2 (0.9%) | 2 (3.5%) |
| $10,000 to $14,999 | 14 (6.6%) | 11 (19.3%) |
| $15,000 to $19,999 | 3 (1.4%) | 3 (5.3%) |
| $20,000 to $24,999 | 17 (8.0%) | 19 (33.3%) |
| $25,000 to $34,999 | 21 (9.9%) | 5 (8.8%) |
| $35,000 to $49,999 | 45 (21.2%) | 14 (24.6%) |
| $50,000 to $74,999 | 23 (10.8%) | 0 (0.0%) |
| $75,000 to $99,999 | 38 (17.9%) | 3 (5.3%) |
| $100,000 to $149,999 | 40 (18.9%) | 0 (0.0%) |
| $150,000 or more | 6 (2.8%) | 0 (0.0%) |
| Total | 212 (100.0%) | 57 (100.0%) |
Monthly Housing Cost Tiers in Eagle Bend
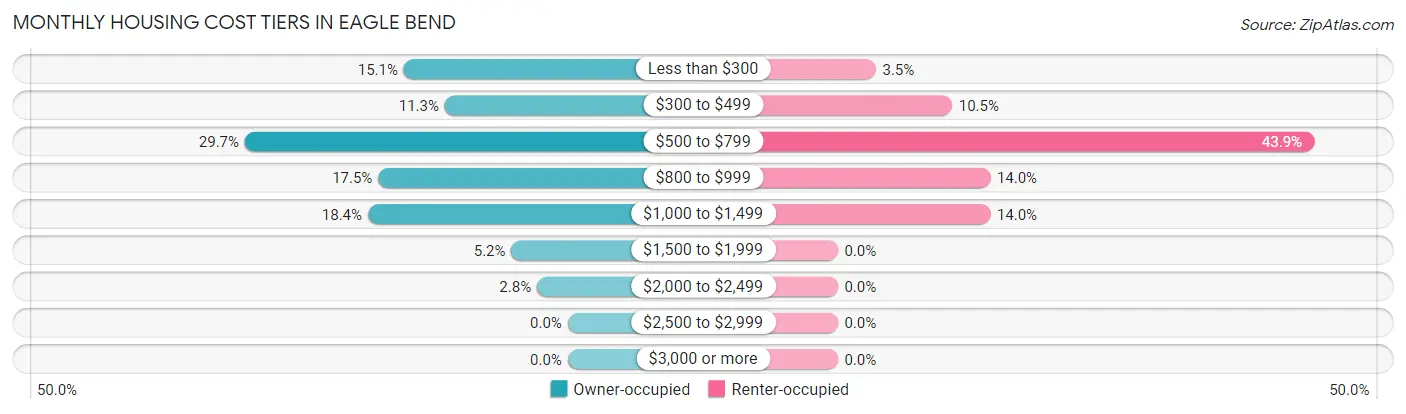
| Monthly Cost | Owner-occupied | Renter-occupied |
| Less than $300 | 32 (15.1%) | 2 (3.5%) |
| $300 to $499 | 24 (11.3%) | 6 (10.5%) |
| $500 to $799 | 63 (29.7%) | 25 (43.9%) |
| $800 to $999 | 37 (17.4%) | 8 (14.0%) |
| $1,000 to $1,499 | 39 (18.4%) | 8 (14.0%) |
| $1,500 to $1,999 | 11 (5.2%) | 0 (0.0%) |
| $2,000 to $2,499 | 6 (2.8%) | 0 (0.0%) |
| $2,500 to $2,999 | 0 (0.0%) | 0 (0.0%) |
| $3,000 or more | 0 (0.0%) | 0 (0.0%) |
| Total | 212 (100.0%) | 57 (100.0%) |
Physical Housing Characteristics in Eagle Bend
Housing Structures in Eagle Bend
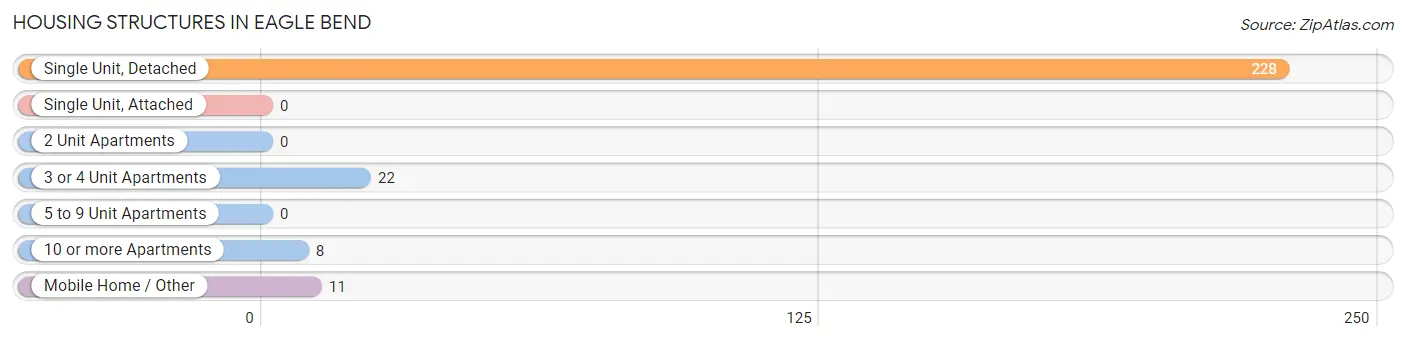
| Structure Type | # Housing Units | % Housing Units |
| Single Unit, Detached | 228 | 84.8% |
| Single Unit, Attached | 0 | 0.0% |
| 2 Unit Apartments | 0 | 0.0% |
| 3 or 4 Unit Apartments | 22 | 8.2% |
| 5 to 9 Unit Apartments | 0 | 0.0% |
| 10 or more Apartments | 8 | 3.0% |
| Mobile Home / Other | 11 | 4.1% |
| Total | 269 | 100.0% |
Housing Structures by Occupancy in Eagle Bend
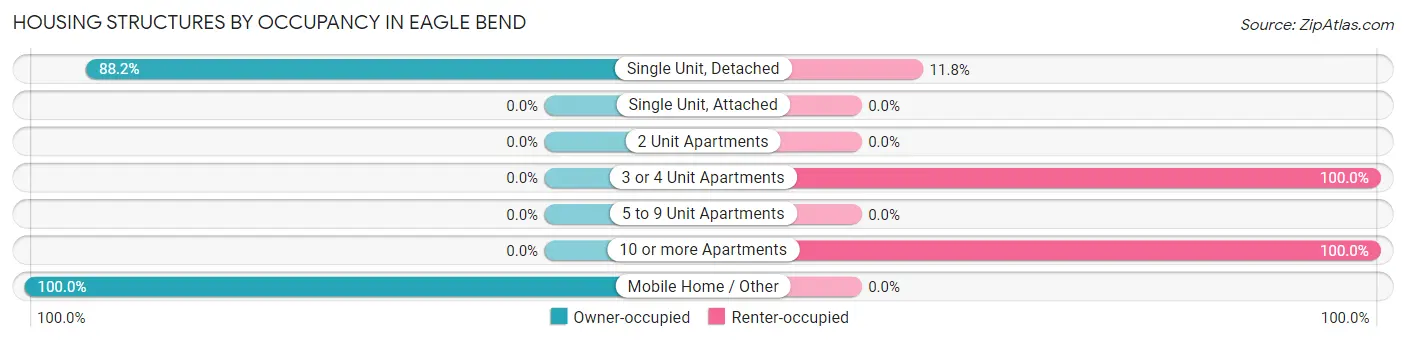
| Structure Type | Owner-occupied | Renter-occupied |
| Single Unit, Detached | 201 (88.2%) | 27 (11.8%) |
| Single Unit, Attached | 0 (0.0%) | 0 (0.0%) |
| 2 Unit Apartments | 0 (0.0%) | 0 (0.0%) |
| 3 or 4 Unit Apartments | 0 (0.0%) | 22 (100.0%) |
| 5 to 9 Unit Apartments | 0 (0.0%) | 0 (0.0%) |
| 10 or more Apartments | 0 (0.0%) | 8 (100.0%) |
| Mobile Home / Other | 11 (100.0%) | 0 (0.0%) |
| Total | 212 (78.8%) | 57 (21.2%) |
Housing Structures by Number of Rooms in Eagle Bend
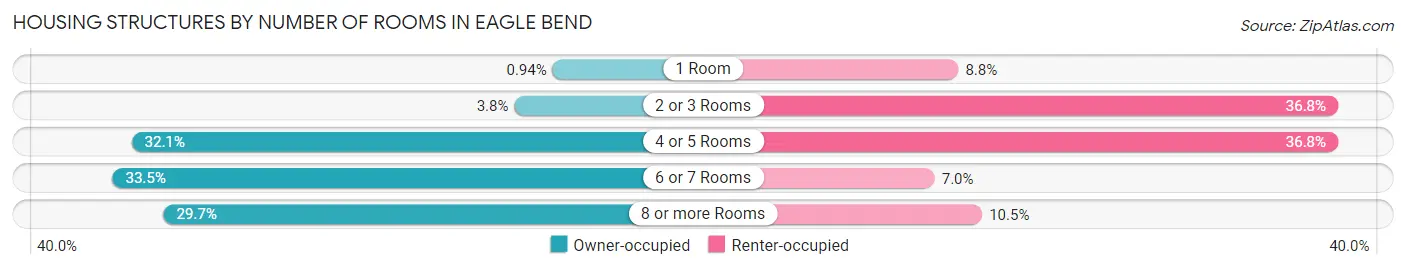
| Number of Rooms | Owner-occupied | Renter-occupied |
| 1 Room | 2 (0.9%) | 5 (8.8%) |
| 2 or 3 Rooms | 8 (3.8%) | 21 (36.8%) |
| 4 or 5 Rooms | 68 (32.1%) | 21 (36.8%) |
| 6 or 7 Rooms | 71 (33.5%) | 4 (7.0%) |
| 8 or more Rooms | 63 (29.7%) | 6 (10.5%) |
| Total | 212 (100.0%) | 57 (100.0%) |
Housing Structure by Heating Type in Eagle Bend
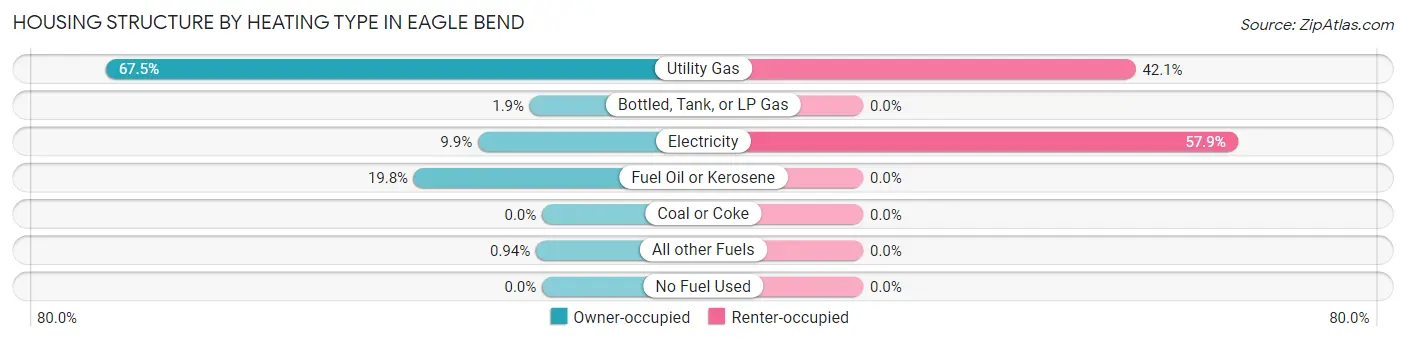
| Heating Type | Owner-occupied | Renter-occupied |
| Utility Gas | 143 (67.4%) | 24 (42.1%) |
| Bottled, Tank, or LP Gas | 4 (1.9%) | 0 (0.0%) |
| Electricity | 21 (9.9%) | 33 (57.9%) |
| Fuel Oil or Kerosene | 42 (19.8%) | 0 (0.0%) |
| Coal or Coke | 0 (0.0%) | 0 (0.0%) |
| All other Fuels | 2 (0.9%) | 0 (0.0%) |
| No Fuel Used | 0 (0.0%) | 0 (0.0%) |
| Total | 212 (100.0%) | 57 (100.0%) |
Household Vehicle Usage in Eagle Bend
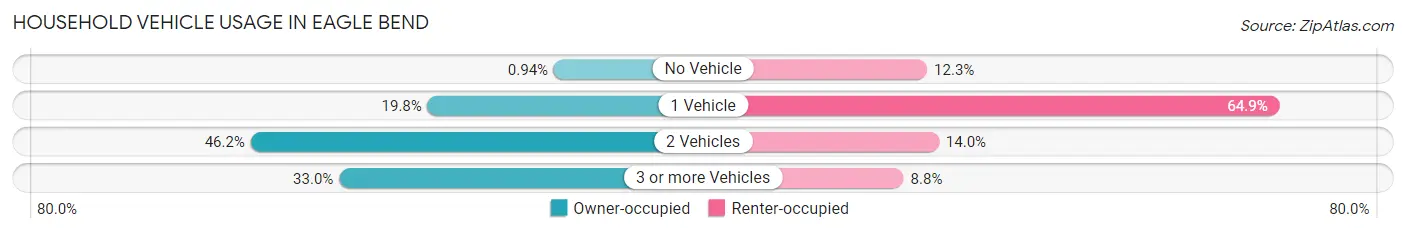
| Vehicles per Household | Owner-occupied | Renter-occupied |
| No Vehicle | 2 (0.9%) | 7 (12.3%) |
| 1 Vehicle | 42 (19.8%) | 37 (64.9%) |
| 2 Vehicles | 98 (46.2%) | 8 (14.0%) |
| 3 or more Vehicles | 70 (33.0%) | 5 (8.8%) |
| Total | 212 (100.0%) | 57 (100.0%) |
Real Estate & Mortgages in Eagle Bend
Real Estate and Mortgage Overview in Eagle Bend
| Characteristic | Without Mortgage | With Mortgage |
| Housing Units | 98 | 114 |
| Median Property Value | $72,900 | $97,900 |
| Median Household Income | $33,500 | $4 |
| Monthly Housing Costs | $442 | $0 |
| Real Estate Taxes | $1,232 | $7 |
Property Value by Mortgage Status in Eagle Bend
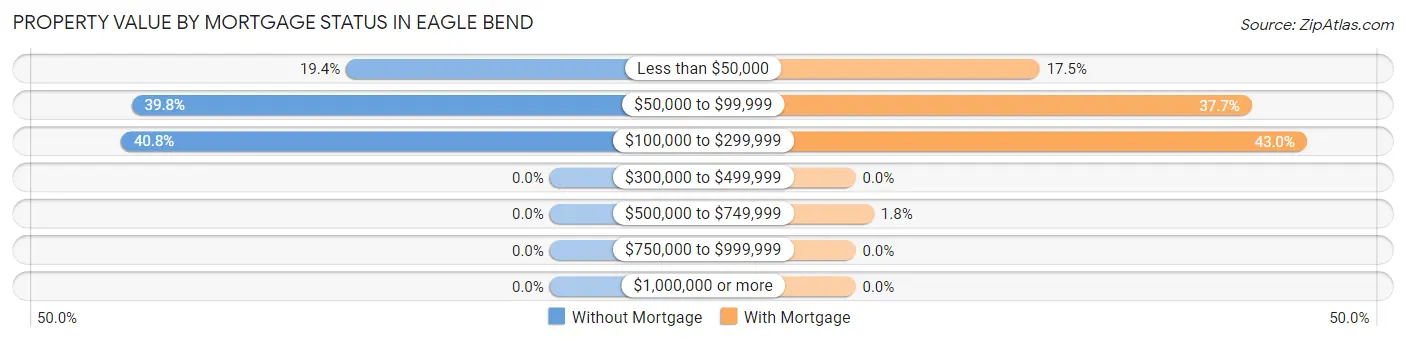
| Property Value | Without Mortgage | With Mortgage |
| Less than $50,000 | 19 (19.4%) | 20 (17.5%) |
| $50,000 to $99,999 | 39 (39.8%) | 43 (37.7%) |
| $100,000 to $299,999 | 40 (40.8%) | 49 (43.0%) |
| $300,000 to $499,999 | 0 (0.0%) | 0 (0.0%) |
| $500,000 to $749,999 | 0 (0.0%) | 2 (1.8%) |
| $750,000 to $999,999 | 0 (0.0%) | 0 (0.0%) |
| $1,000,000 or more | 0 (0.0%) | 0 (0.0%) |
| Total | 98 (100.0%) | 114 (100.0%) |
Household Income by Mortgage Status in Eagle Bend
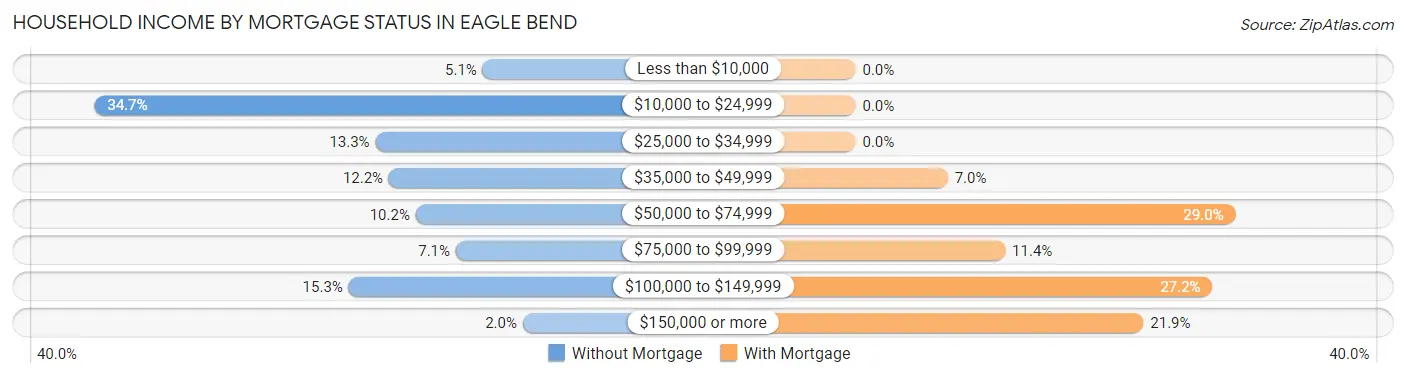
| Household Income | Without Mortgage | With Mortgage |
| Less than $10,000 | 5 (5.1%) | 0 (0.0%) |
| $10,000 to $24,999 | 34 (34.7%) | 0 (0.0%) |
| $25,000 to $34,999 | 13 (13.3%) | 0 (0.0%) |
| $35,000 to $49,999 | 12 (12.2%) | 8 (7.0%) |
| $50,000 to $74,999 | 10 (10.2%) | 33 (28.9%) |
| $75,000 to $99,999 | 7 (7.1%) | 13 (11.4%) |
| $100,000 to $149,999 | 15 (15.3%) | 31 (27.2%) |
| $150,000 or more | 2 (2.0%) | 25 (21.9%) |
| Total | 98 (100.0%) | 114 (100.0%) |
Property Value to Household Income Ratio in Eagle Bend
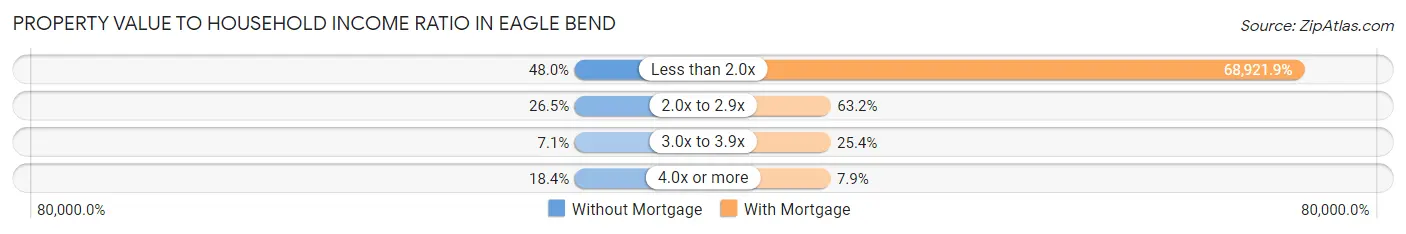
| Value-to-Income Ratio | Without Mortgage | With Mortgage |
| Less than 2.0x | 47 (48.0%) | 78,571 (68,921.9%) |
| 2.0x to 2.9x | 26 (26.5%) | 72 (63.2%) |
| 3.0x to 3.9x | 7 (7.1%) | 29 (25.4%) |
| 4.0x or more | 18 (18.4%) | 9 (7.9%) |
| Total | 98 (100.0%) | 114 (100.0%) |
Real Estate Taxes by Mortgage Status in Eagle Bend
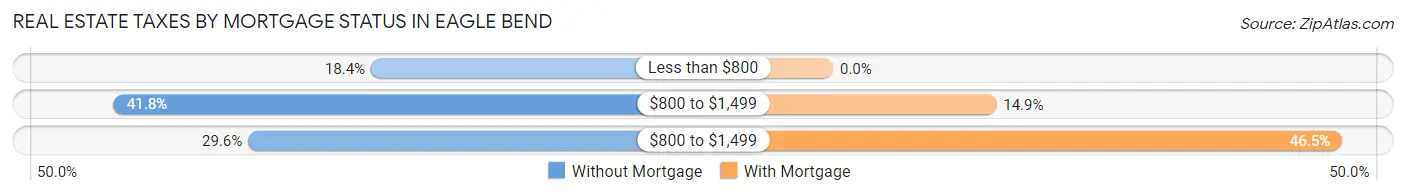
| Property Taxes | Without Mortgage | With Mortgage |
| Less than $800 | 18 (18.4%) | 0 (0.0%) |
| $800 to $1,499 | 41 (41.8%) | 17 (14.9%) |
| $800 to $1,499 | 29 (29.6%) | 53 (46.5%) |
| Total | 98 (100.0%) | 114 (100.0%) |
Health & Disability in Eagle Bend
Health Insurance Coverage by Age in Eagle Bend
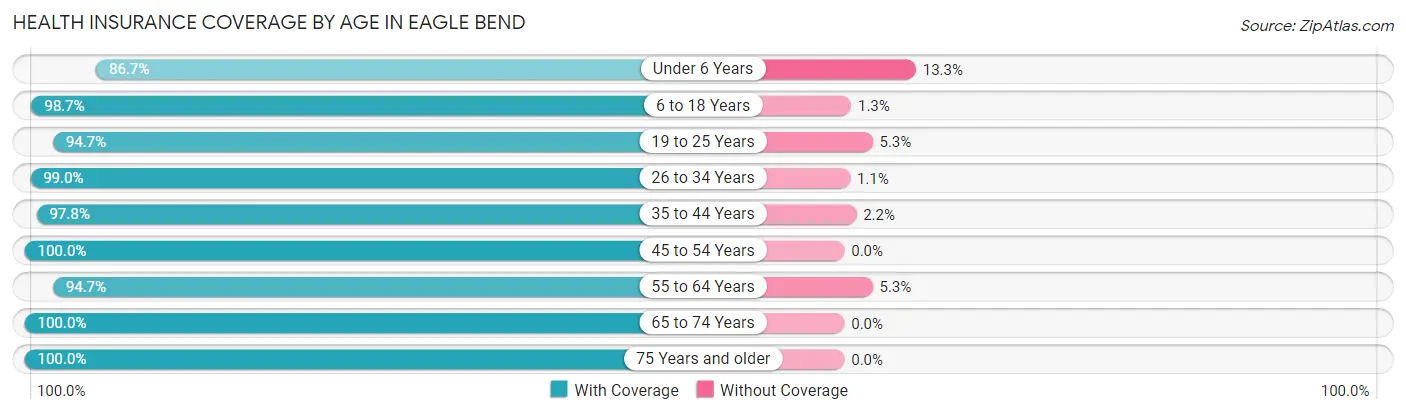
| Age Bracket | With Coverage | Without Coverage |
| Under 6 Years | 39 (86.7%) | 6 (13.3%) |
| 6 to 18 Years | 157 (98.7%) | 2 (1.3%) |
| 19 to 25 Years | 36 (94.7%) | 2 (5.3%) |
| 26 to 34 Years | 94 (99.0%) | 1 (1.1%) |
| 35 to 44 Years | 88 (97.8%) | 2 (2.2%) |
| 45 to 54 Years | 31 (100.0%) | 0 (0.0%) |
| 55 to 64 Years | 72 (94.7%) | 4 (5.3%) |
| 65 to 74 Years | 70 (100.0%) | 0 (0.0%) |
| 75 Years and older | 43 (100.0%) | 0 (0.0%) |
| Total | 630 (97.4%) | 17 (2.6%) |
Health Insurance Coverage by Citizenship Status in Eagle Bend
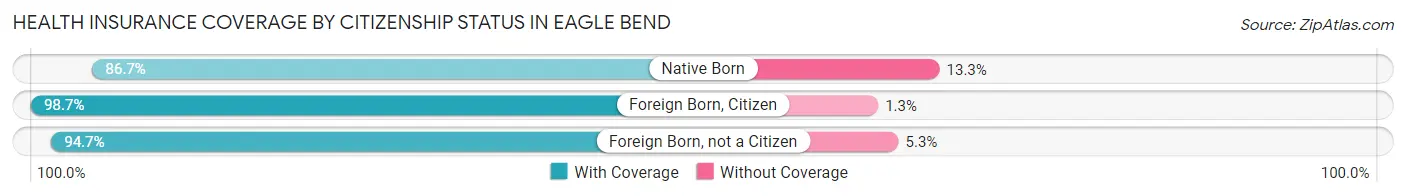
| Citizenship Status | With Coverage | Without Coverage |
| Native Born | 39 (86.7%) | 6 (13.3%) |
| Foreign Born, Citizen | 157 (98.7%) | 2 (1.3%) |
| Foreign Born, not a Citizen | 36 (94.7%) | 2 (5.3%) |
Health Insurance Coverage by Household Income in Eagle Bend
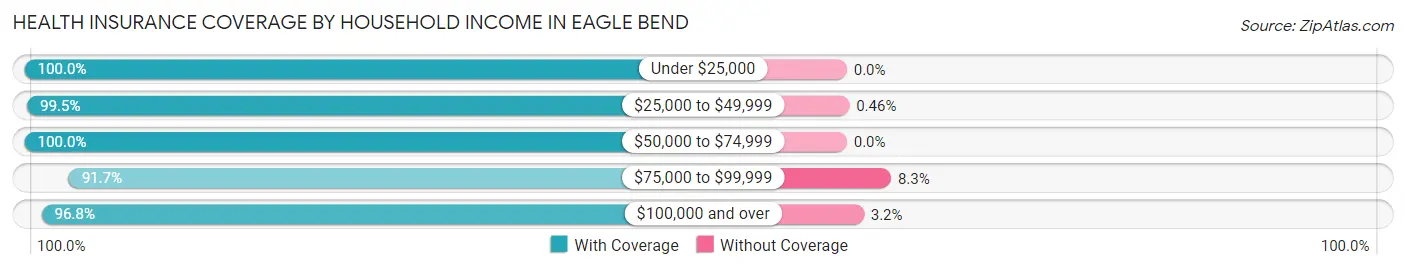
| Household Income | With Coverage | Without Coverage |
| Under $25,000 | 96 (100.0%) | 0 (0.0%) |
| $25,000 to $49,999 | 217 (99.5%) | 1 (0.5%) |
| $50,000 to $74,999 | 43 (100.0%) | 0 (0.0%) |
| $75,000 to $99,999 | 122 (91.7%) | 11 (8.3%) |
| $100,000 and over | 152 (96.8%) | 5 (3.2%) |
Public vs Private Health Insurance Coverage by Age in Eagle Bend
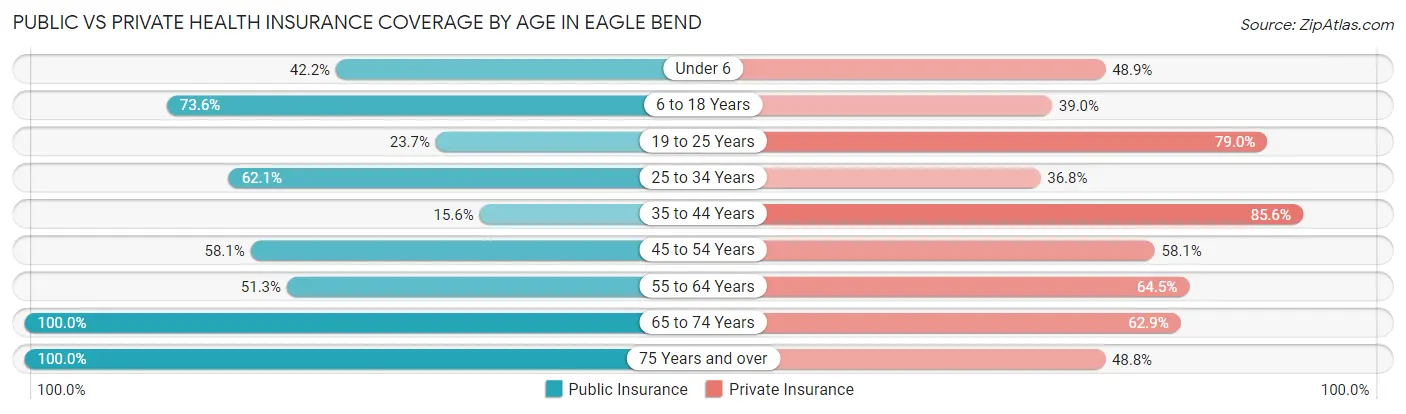
| Age Bracket | Public Insurance | Private Insurance |
| Under 6 | 19 (42.2%) | 22 (48.9%) |
| 6 to 18 Years | 117 (73.6%) | 62 (39.0%) |
| 19 to 25 Years | 9 (23.7%) | 30 (78.9%) |
| 25 to 34 Years | 59 (62.1%) | 35 (36.8%) |
| 35 to 44 Years | 14 (15.6%) | 77 (85.6%) |
| 45 to 54 Years | 18 (58.1%) | 18 (58.1%) |
| 55 to 64 Years | 39 (51.3%) | 49 (64.5%) |
| 65 to 74 Years | 70 (100.0%) | 44 (62.9%) |
| 75 Years and over | 43 (100.0%) | 21 (48.8%) |
| Total | 388 (60.0%) | 358 (55.3%) |
Disability Status by Sex by Age in Eagle Bend
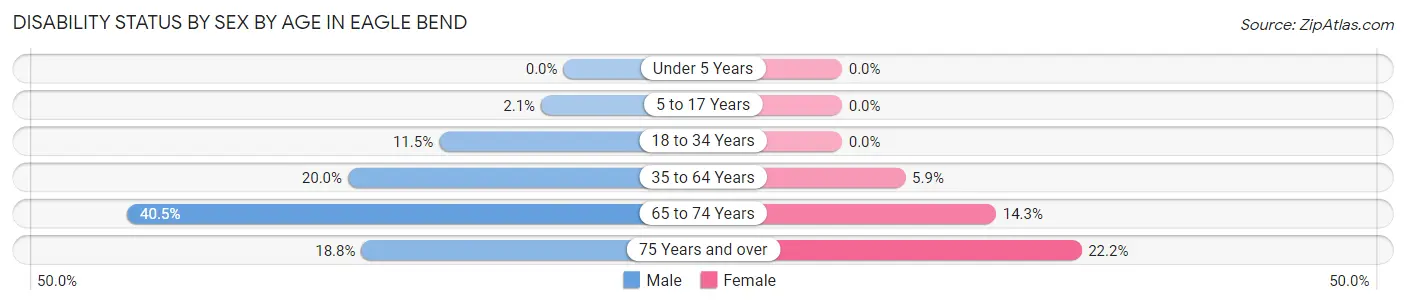
| Age Bracket | Male | Female |
| Under 5 Years | 0 (0.0%) | 0 (0.0%) |
| 5 to 17 Years | 2 (2.1%) | 0 (0.0%) |
| 18 to 34 Years | 6 (11.5%) | 0 (0.0%) |
| 35 to 64 Years | 19 (20.0%) | 6 (5.9%) |
| 65 to 74 Years | 17 (40.5%) | 4 (14.3%) |
| 75 Years and over | 3 (18.8%) | 6 (22.2%) |
Disability Class by Sex by Age in Eagle Bend
Disability Class: Hearing Difficulty
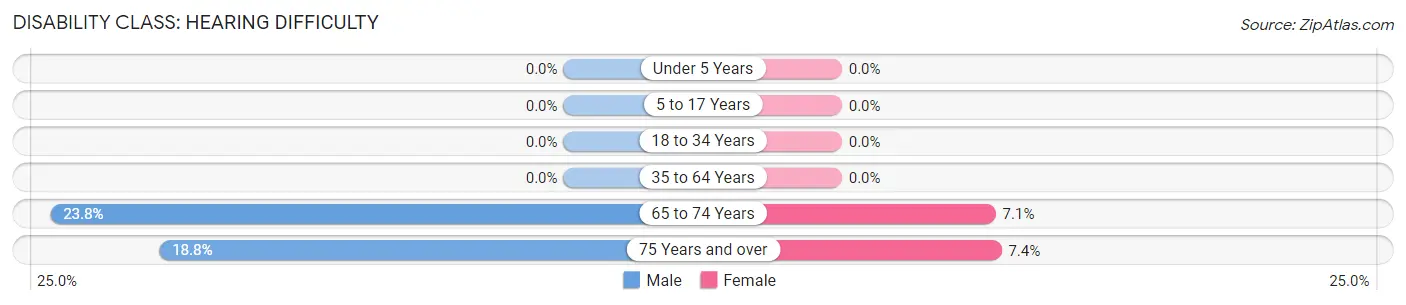
| Age Bracket | Male | Female |
| Under 5 Years | 0 (0.0%) | 0 (0.0%) |
| 5 to 17 Years | 0 (0.0%) | 0 (0.0%) |
| 18 to 34 Years | 0 (0.0%) | 0 (0.0%) |
| 35 to 64 Years | 0 (0.0%) | 0 (0.0%) |
| 65 to 74 Years | 10 (23.8%) | 2 (7.1%) |
| 75 Years and over | 3 (18.8%) | 2 (7.4%) |
Disability Class: Vision Difficulty
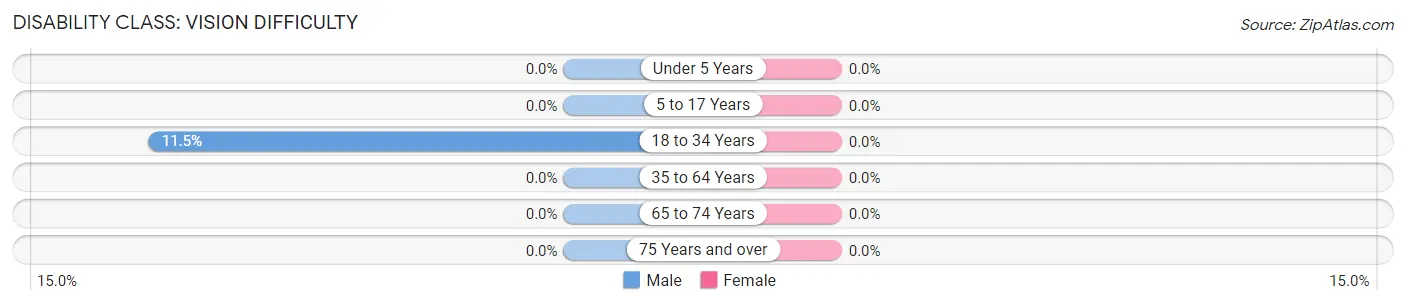
| Age Bracket | Male | Female |
| Under 5 Years | 0 (0.0%) | 0 (0.0%) |
| 5 to 17 Years | 0 (0.0%) | 0 (0.0%) |
| 18 to 34 Years | 6 (11.5%) | 0 (0.0%) |
| 35 to 64 Years | 0 (0.0%) | 0 (0.0%) |
| 65 to 74 Years | 0 (0.0%) | 0 (0.0%) |
| 75 Years and over | 0 (0.0%) | 0 (0.0%) |
Disability Class: Cognitive Difficulty
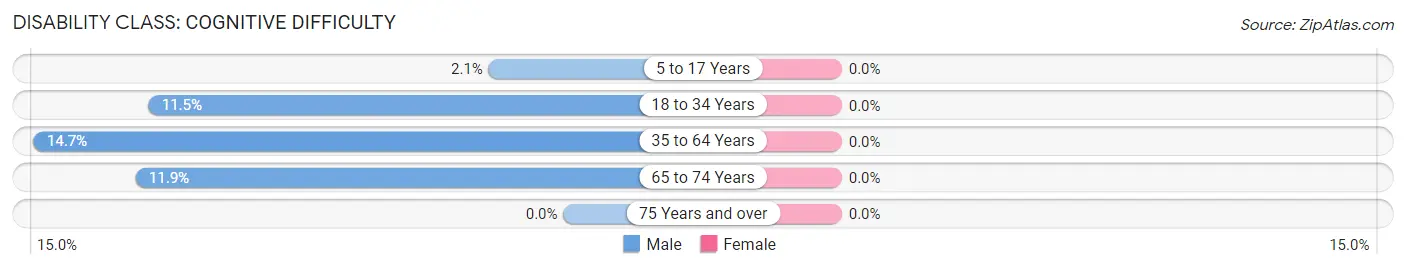
| Age Bracket | Male | Female |
| 5 to 17 Years | 2 (2.1%) | 0 (0.0%) |
| 18 to 34 Years | 6 (11.5%) | 0 (0.0%) |
| 35 to 64 Years | 14 (14.7%) | 0 (0.0%) |
| 65 to 74 Years | 5 (11.9%) | 0 (0.0%) |
| 75 Years and over | 0 (0.0%) | 0 (0.0%) |
Disability Class: Ambulatory Difficulty
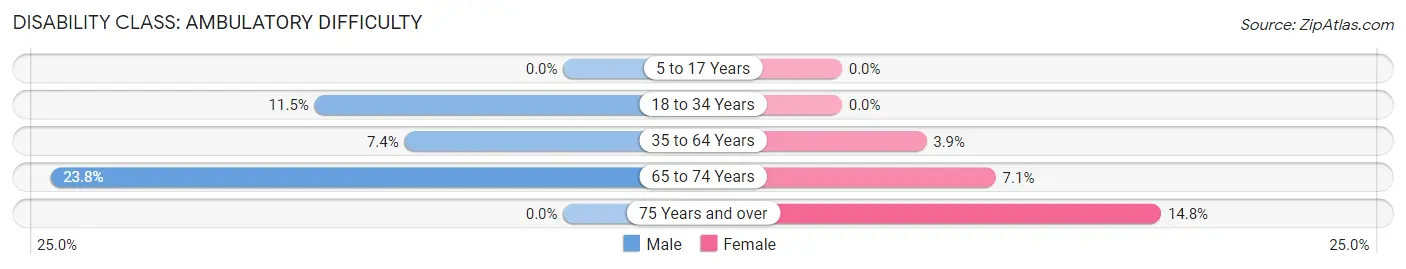
| Age Bracket | Male | Female |
| 5 to 17 Years | 0 (0.0%) | 0 (0.0%) |
| 18 to 34 Years | 6 (11.5%) | 0 (0.0%) |
| 35 to 64 Years | 7 (7.4%) | 4 (3.9%) |
| 65 to 74 Years | 10 (23.8%) | 2 (7.1%) |
| 75 Years and over | 0 (0.0%) | 4 (14.8%) |
Disability Class: Self-Care Difficulty
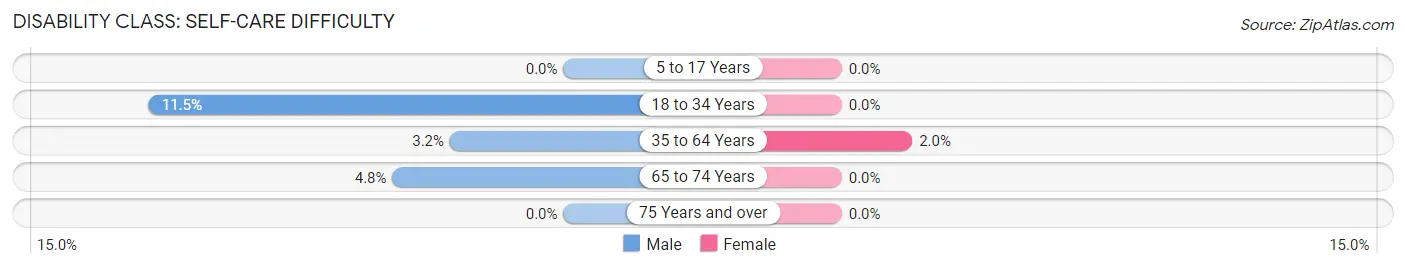
| Age Bracket | Male | Female |
| 5 to 17 Years | 0 (0.0%) | 0 (0.0%) |
| 18 to 34 Years | 6 (11.5%) | 0 (0.0%) |
| 35 to 64 Years | 3 (3.2%) | 2 (2.0%) |
| 65 to 74 Years | 2 (4.8%) | 0 (0.0%) |
| 75 Years and over | 0 (0.0%) | 0 (0.0%) |
Technology Access in Eagle Bend
Computing Device Access in Eagle Bend
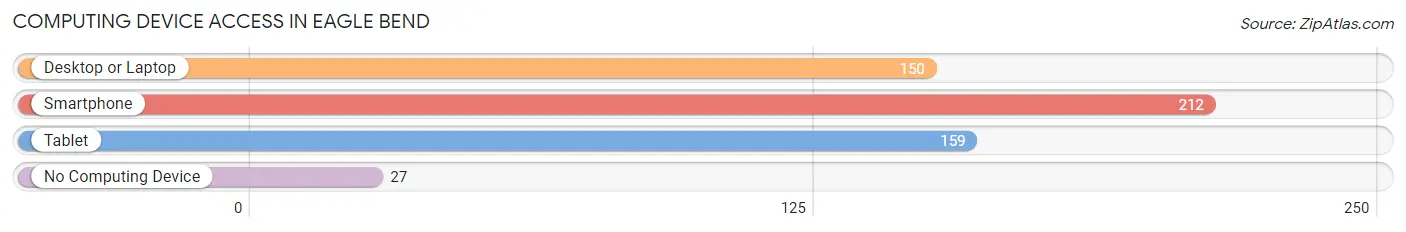
| Device Type | # Households | % Households |
| Desktop or Laptop | 150 | 55.8% |
| Smartphone | 212 | 78.8% |
| Tablet | 159 | 59.1% |
| No Computing Device | 27 | 10.0% |
| Total | 269 | 100.0% |
Internet Access in Eagle Bend
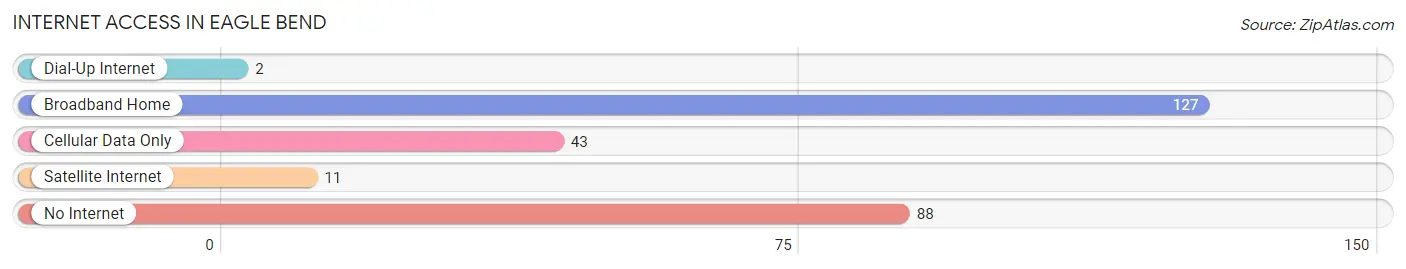
| Internet Type | # Households | % Households |
| Dial-Up Internet | 2 | 0.7% |
| Broadband Home | 127 | 47.2% |
| Cellular Data Only | 43 | 16.0% |
| Satellite Internet | 11 | 4.1% |
| No Internet | 88 | 32.7% |
| Total | 269 | 100.0% |
Eagle Bend Summary
Eagle Bend is a small city located in Todd County, Minnesota, United States. It is situated on the north shore of Eagle Lake, a popular recreational area. The city was founded in 1881 and has a population of 1,072 as of the 2010 census.
History
The area that is now Eagle Bend was first settled in the late 1800s by a group of German immigrants. The town was originally called Eagle Lake, but was later changed to Eagle Bend due to the bend in the lake. The first post office was established in 1881 and the town was officially incorporated in 1887.
The city was originally a logging and farming community, but in the early 1900s, the area began to develop into a resort destination. The first resort was built in 1906 and the area quickly became a popular destination for fishing, boating, and swimming.
In the 1950s, the city began to develop into a more modern community. The first school was built in 1954 and the city was connected to the rest of the state by a highway in 1956.
Geography
Eagle Bend is located in Todd County, Minnesota, on the north shore of Eagle Lake. The city is situated at the intersection of Minnesota State Highways 29 and 210. The city is surrounded by rolling hills and forests, and is located approximately 30 miles north of St. Cloud.
The city has a total area of 1.2 square miles, all of which is land. The elevation of the city is 1,072 feet above sea level.
Economy
The economy of Eagle Bend is largely based on tourism and recreation. The city is home to several resorts and campgrounds, as well as a marina and boat launch. The city also has several restaurants and bars, as well as a few retail stores.
The city is also home to several manufacturing companies, including a furniture manufacturer and a plastics manufacturer.
Demographics
As of the 2010 census, the population of Eagle Bend was 1,072. The racial makeup of the city was 97.2% White, 0.7% African American, 0.3% Native American, 0.2% Asian, 0.1% Pacific Islander, 0.7% from other races, and 0.9% from two or more races. Hispanic or Latino of any race were 1.7% of the population.
The median income for a household in the city was $41,250, and the median income for a family was $48,750. The per capita income for the city was $20,945. About 8.2% of families and 10.2% of the population were below the poverty line, including 14.3% of those under age 18 and 6.3% of those age 65 or over.
Common Questions
What is Per Capita Income in Eagle Bend?
Per Capita income in Eagle Bend is $24,810.
What is the Median Family Income in Eagle Bend?
Median Family Income in Eagle Bend is $53,036.
What is the Median Household income in Eagle Bend?
Median Household Income in Eagle Bend is $45,888.
What is Income or Wage Gap in Eagle Bend?
Income or Wage Gap in Eagle Bend is 44.5%.
Women in Eagle Bend earn 55.5 cents for every dollar earned by a man.
What is Inequality or Gini Index in Eagle Bend?
Inequality or Gini Index in Eagle Bend is 0.41.
What is the Total Population of Eagle Bend?
Total Population of Eagle Bend is 647.
What is the Total Male Population of Eagle Bend?
Total Male Population of Eagle Bend is 316.
What is the Total Female Population of Eagle Bend?
Total Female Population of Eagle Bend is 331.
What is the Ratio of Males per 100 Females in Eagle Bend?
There are 95.47 Males per 100 Females in Eagle Bend.
What is the Ratio of Females per 100 Males in Eagle Bend?
There are 104.75 Females per 100 Males in Eagle Bend.
What is the Median Population Age in Eagle Bend?
Median Population Age in Eagle Bend is 33.4 Years.
What is the Average Family Size in Eagle Bend
Average Family Size in Eagle Bend is 3.1 People.
What is the Average Household Size in Eagle Bend
Average Household Size in Eagle Bend is 2.4 People.
How Large is the Labor Force in Eagle Bend?
There are 262 People in the Labor Forcein in Eagle Bend.
What is the Percentage of People in the Labor Force in Eagle Bend?
58.1% of People are in the Labor Force in Eagle Bend.
What is the Unemployment Rate in Eagle Bend?
Unemployment Rate in Eagle Bend is 1.1%.