Dent, MN Map & Demographics
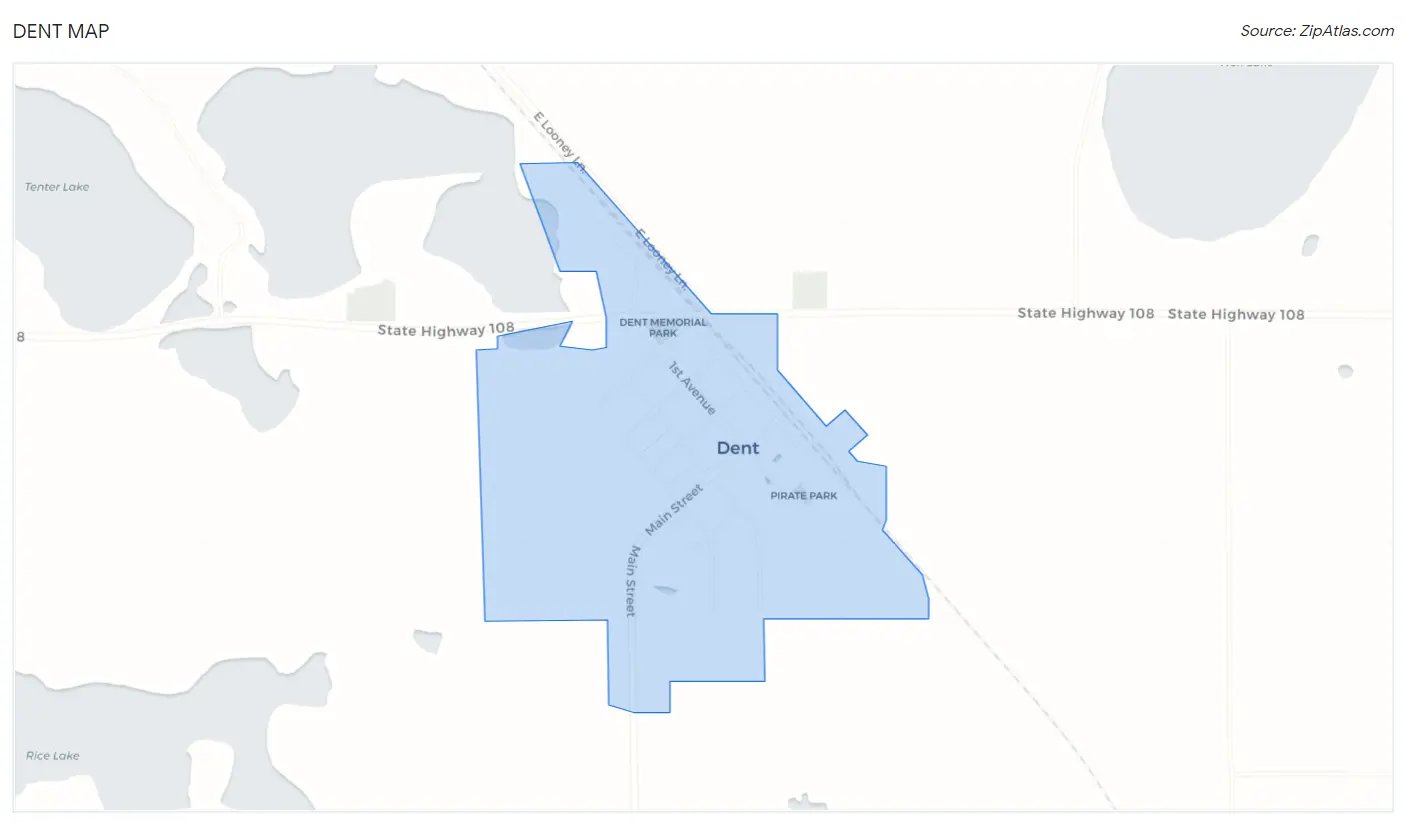
Dent Map
Dent Overview
$21,311
PER CAPITA INCOME
56.7%
WAGE / INCOME GAP [ % ]
43.3¢/ $1
WAGE / INCOME GAP [ $ ]
0.46
INEQUALITY / GINI INDEX
244
TOTAL POPULATION
126
MALE POPULATION
118
FEMALE POPULATION
106.78
MALES / 100 FEMALES
93.65
FEMALES / 100 MALES
31.5
MEDIAN AGE
3.3
AVG FAMILY SIZE
2.4
AVG HOUSEHOLD SIZE
121
LABOR FORCE [ PEOPLE ]
71.2%
PERCENT IN LABOR FORCE
6.6%
UNEMPLOYMENT RATE
Dent Zip Codes
Dent Area Codes
Income in Dent
Income Overview in Dent
| Characteristic | Number | Measure |
| Per Capita Income | 244 | $21,311 |
| Median Family Income | 54 | $0 |
| Mean Family Income | 54 | $60,917 |
| Median Household Income | 104 | $0 |
| Mean Household Income | 104 | $49,158 |
| Income Deficit | 54 | $0 |
| Wage / Income Gap (%) | 244 | 56.67% |
| Wage / Income Gap ($) | 244 | 43.33¢ per $1 |
| Gini / Inequality Index | 244 | 0.46 |
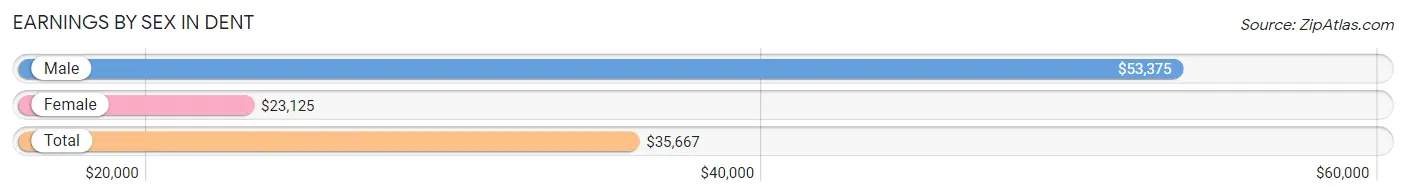
Earnings by Sex in Dent
Average Earnings in Dent are $35,667, $53,375 for men and $23,125 for women, a difference of 56.7%.
| Sex | Number | Average Earnings |
| Male | 55 (42.3%) | $53,375 |
| Female | 75 (57.7%) | $23,125 |
| Total | 130 (100.0%) | $35,667 |
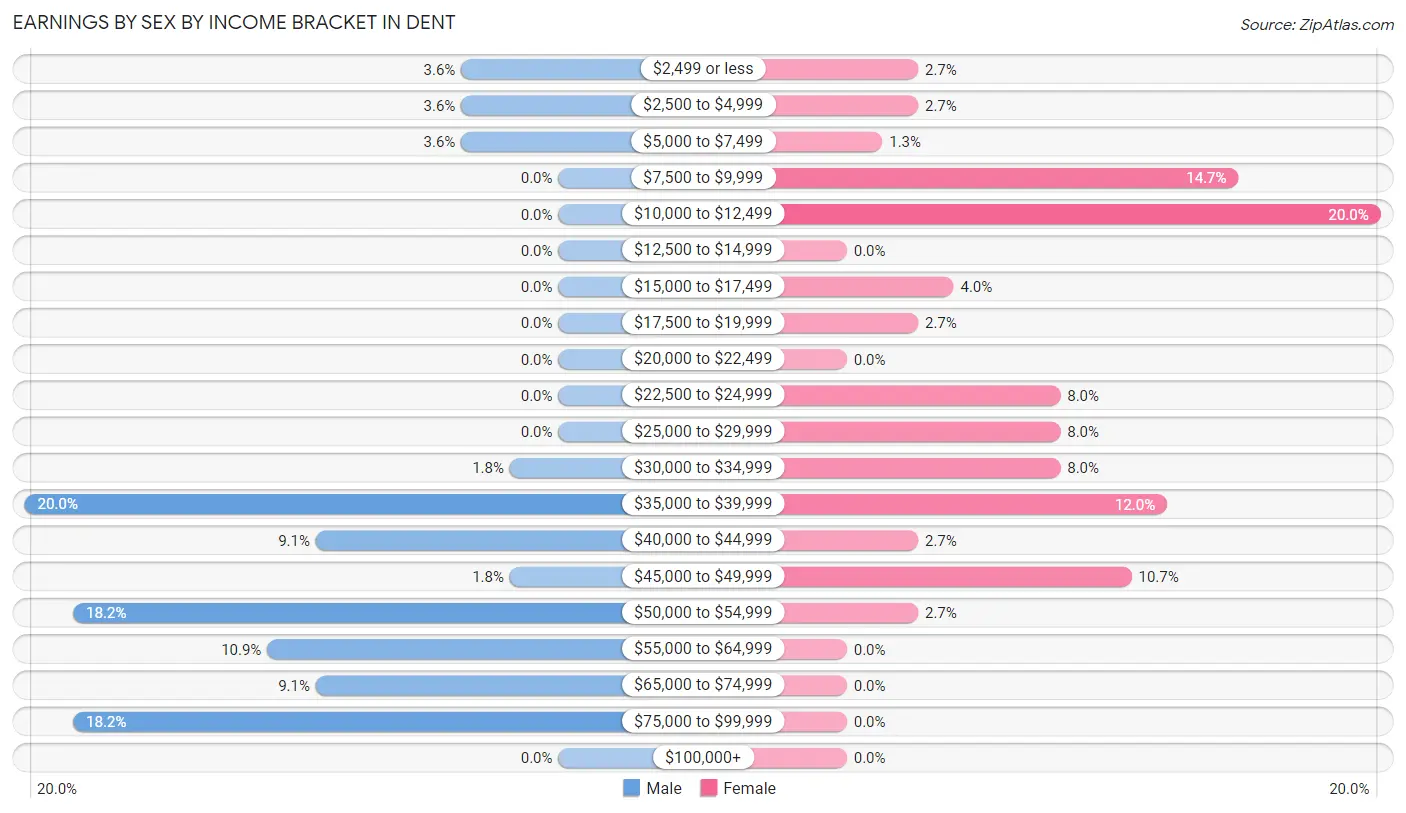
Earnings by Sex by Income Bracket in Dent
The most common earnings brackets in Dent are $35,000 to $39,999 for men (11 | 20.0%) and $10,000 to $12,499 for women (15 | 20.0%).
| Income | Male | Female |
| $2,499 or less | 2 (3.6%) | 2 (2.7%) |
| $2,500 to $4,999 | 2 (3.6%) | 2 (2.7%) |
| $5,000 to $7,499 | 2 (3.6%) | 1 (1.3%) |
| $7,500 to $9,999 | 0 (0.0%) | 11 (14.7%) |
| $10,000 to $12,499 | 0 (0.0%) | 15 (20.0%) |
| $12,500 to $14,999 | 0 (0.0%) | 0 (0.0%) |
| $15,000 to $17,499 | 0 (0.0%) | 3 (4.0%) |
| $17,500 to $19,999 | 0 (0.0%) | 2 (2.7%) |
| $20,000 to $22,499 | 0 (0.0%) | 0 (0.0%) |
| $22,500 to $24,999 | 0 (0.0%) | 6 (8.0%) |
| $25,000 to $29,999 | 0 (0.0%) | 6 (8.0%) |
| $30,000 to $34,999 | 1 (1.8%) | 6 (8.0%) |
| $35,000 to $39,999 | 11 (20.0%) | 9 (12.0%) |
| $40,000 to $44,999 | 5 (9.1%) | 2 (2.7%) |
| $45,000 to $49,999 | 1 (1.8%) | 8 (10.7%) |
| $50,000 to $54,999 | 10 (18.2%) | 2 (2.7%) |
| $55,000 to $64,999 | 6 (10.9%) | 0 (0.0%) |
| $65,000 to $74,999 | 5 (9.1%) | 0 (0.0%) |
| $75,000 to $99,999 | 10 (18.2%) | 0 (0.0%) |
| $100,000+ | 0 (0.0%) | 0 (0.0%) |
| Total | 55 (100.0%) | 75 (100.0%) |
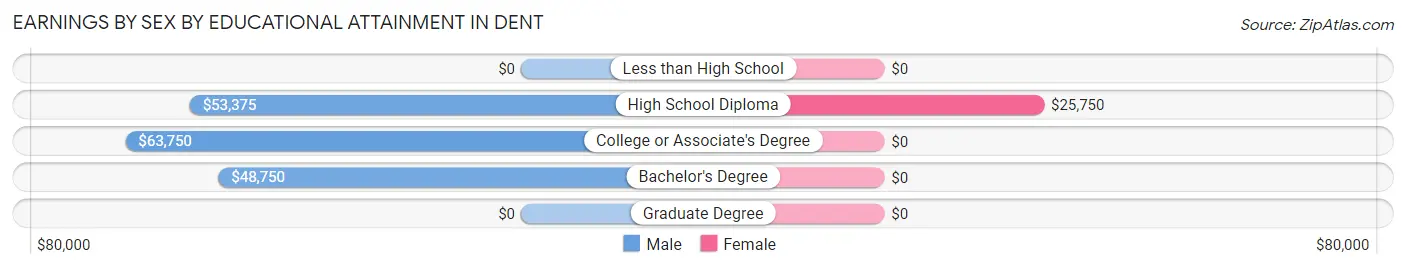
Earnings by Sex by Educational Attainment in Dent
| Educational Attainment | Male Income | Female Income |
| Less than High School | - | - |
| High School Diploma | $53,375 | $25,750 |
| College or Associate's Degree | $63,750 | $0 |
| Bachelor's Degree | $48,750 | $0 |
| Graduate Degree | - | - |
| Total | $54,500 | $0 |
Family Income in Dent
Family Income Brackets in Dent
According to the Dent family income data, there are 16 families falling into the $100,000 to $149,999 income range, which is the most common income bracket and makes up 29.6% of all families.
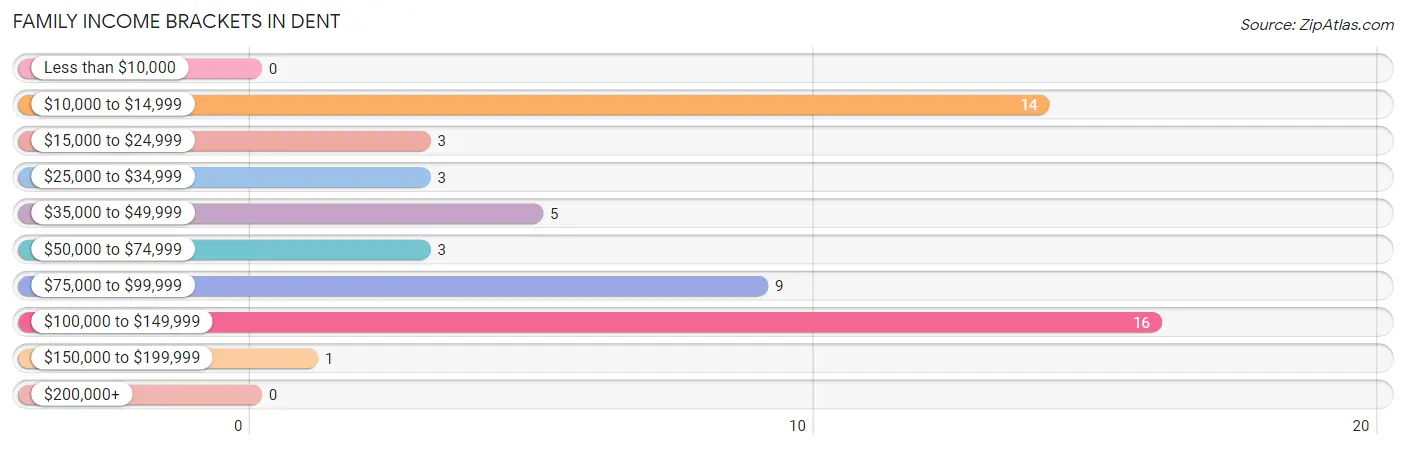
| Income Bracket | # Families | % Families |
| Less than $10,000 | 0 | 0.0% |
| $10,000 to $14,999 | 14 | 25.9% |
| $15,000 to $24,999 | 3 | 5.6% |
| $25,000 to $34,999 | 3 | 5.6% |
| $35,000 to $49,999 | 5 | 9.3% |
| $50,000 to $74,999 | 3 | 5.6% |
| $75,000 to $99,999 | 9 | 16.7% |
| $100,000 to $149,999 | 16 | 29.6% |
| $150,000 to $199,999 | 1 | 1.9% |
| $200,000+ | 0 | 0.0% |
Family Income by Famaliy Size in Dent
4-person families (4 | 7.4%) account for the highest median family income in Dent with $98,750 per family, while 2-person families (14 | 25.9%) have the highest median income of $42,500 per family member.
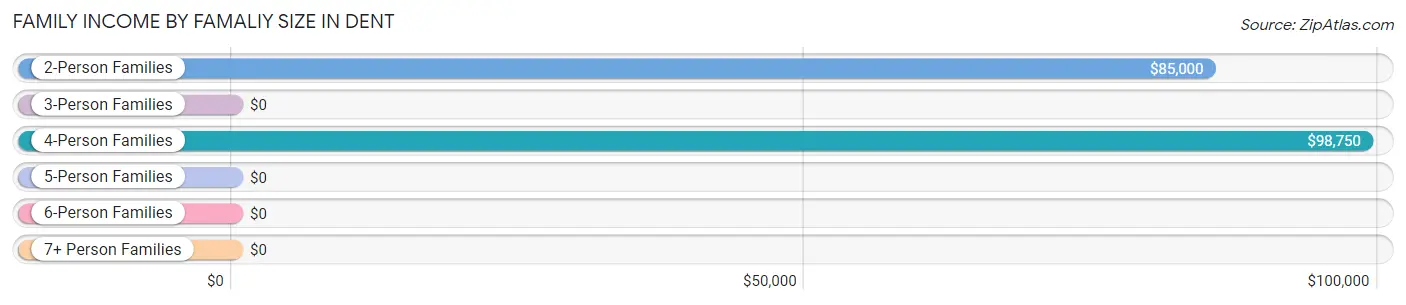
| Income Bracket | # Families | Median Income |
| 2-Person Families | 14 (25.9%) | $85,000 |
| 3-Person Families | 34 (63.0%) | $0 |
| 4-Person Families | 4 (7.4%) | $98,750 |
| 5-Person Families | 2 (3.7%) | $0 |
| 6-Person Families | 0 (0.0%) | $0 |
| 7+ Person Families | 0 (0.0%) | $0 |
| Total | 54 (100.0%) | $0 |
Family Income by Number of Earners in Dent
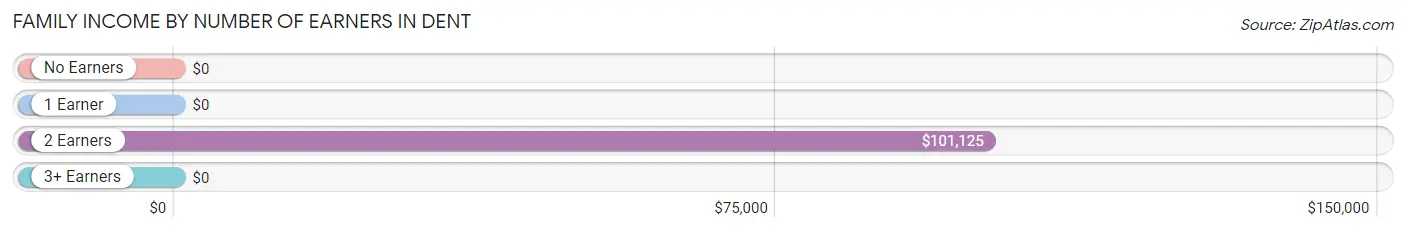
| Number of Earners | # Families | Median Income |
| No Earners | 3 (5.6%) | $0 |
| 1 Earner | 26 (48.1%) | $0 |
| 2 Earners | 21 (38.9%) | $101,125 |
| 3+ Earners | 4 (7.4%) | $0 |
| Total | 54 (100.0%) | $0 |
Household Income in Dent
Household Income Brackets in Dent
With 28 households falling in the category, the $10,000 to $14,999 income range is the most frequent in Dent, accounting for 26.9% of all households.
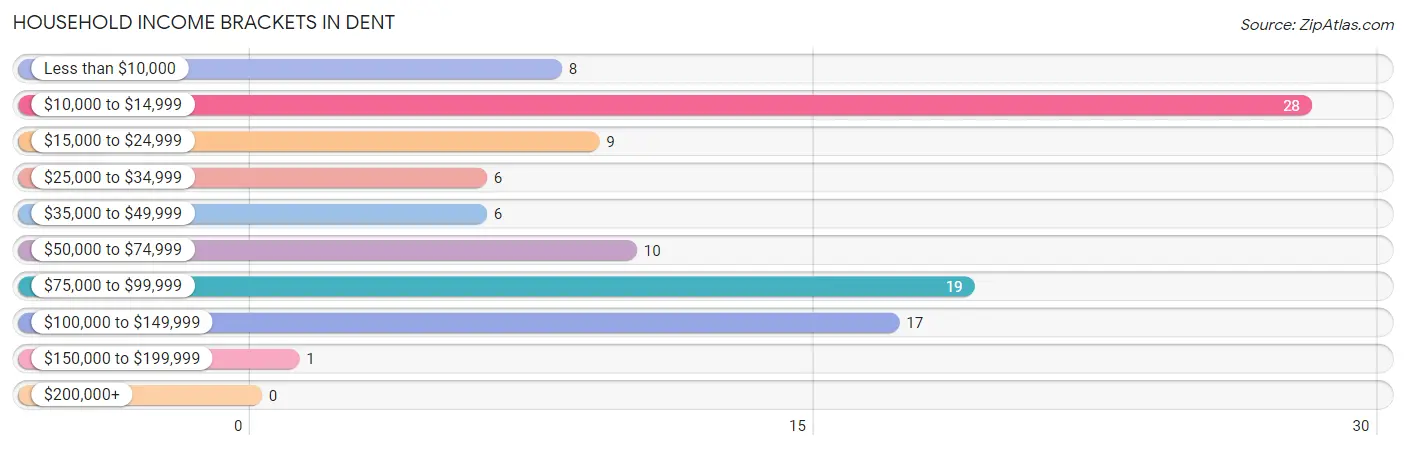
| Income Bracket | # Households | % Households |
| Less than $10,000 | 8 | 7.7% |
| $10,000 to $14,999 | 28 | 26.9% |
| $15,000 to $24,999 | 9 | 8.7% |
| $25,000 to $34,999 | 6 | 5.8% |
| $35,000 to $49,999 | 6 | 5.8% |
| $50,000 to $74,999 | 10 | 9.6% |
| $75,000 to $99,999 | 19 | 18.3% |
| $100,000 to $149,999 | 17 | 16.3% |
| $150,000 to $199,999 | 1 | 1.0% |
| $200,000+ | 0 | 0.0% |
Household Income by Householder Age in Dent
The median household income in Dent is $0, with the highest median household income of $29,583 found in the 45 to 64 years age bracket for the primary householder. A total of 31 households (29.8%) fall into this category. Meanwhile, the 15 to 24 years age bracket for the primary householder has the lowest median household income of $0, with 12 households (11.5%) in this group.
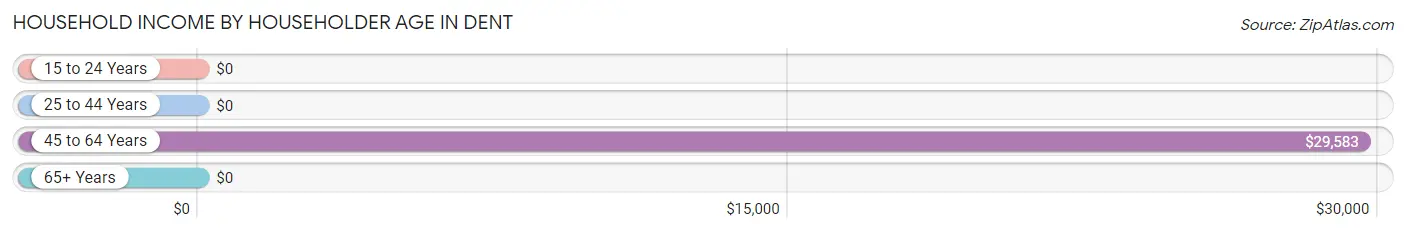
| Income Bracket | # Households | Median Income |
| 15 to 24 Years | 12 (11.5%) | $0 |
| 25 to 44 Years | 42 (40.4%) | $0 |
| 45 to 64 Years | 31 (29.8%) | $29,583 |
| 65+ Years | 19 (18.3%) | $0 |
| Total | 104 (100.0%) | $0 |
Poverty in Dent
Income Below Poverty by Sex and Age in Dent
With 50.8% poverty level for males and 25.4% for females among the residents of Dent, under 5 year old males and 35 to 44 year old females are the most vulnerable to poverty, with 7 males (100.0%) and 14 females (77.8%) in their respective age groups living below the poverty level.
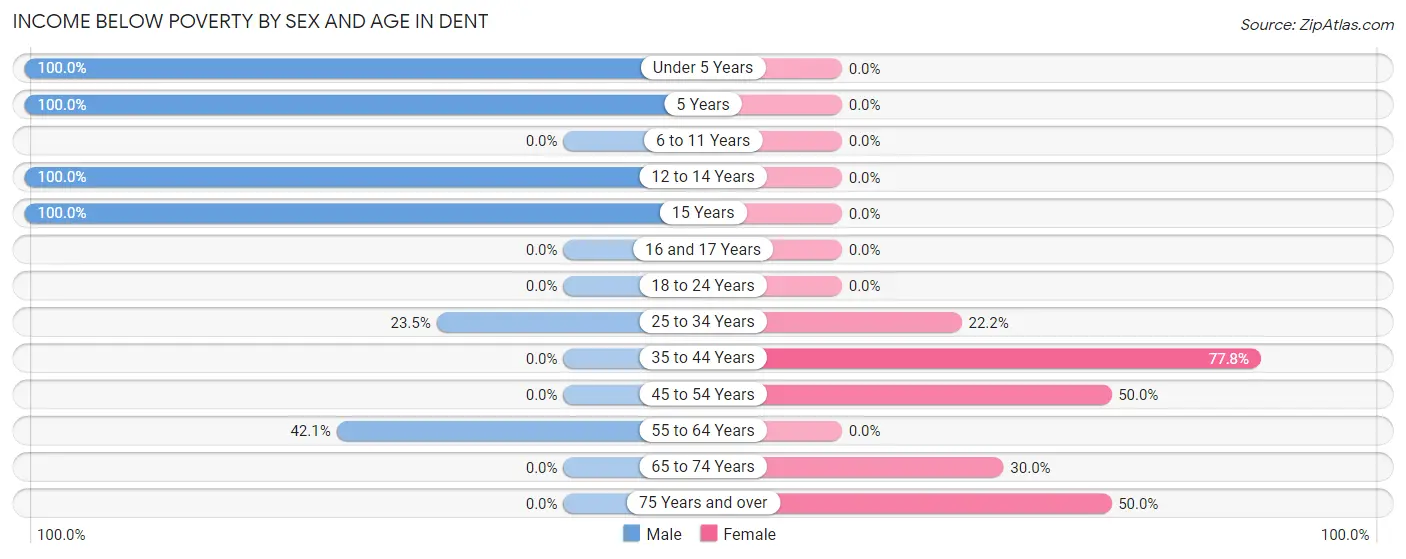
| Age Bracket | Male | Female |
| Under 5 Years | 7 (100.0%) | 0 (0.0%) |
| 5 Years | 1 (100.0%) | 0 (0.0%) |
| 6 to 11 Years | 0 (0.0%) | 0 (0.0%) |
| 12 to 14 Years | 23 (100.0%) | 0 (0.0%) |
| 15 Years | 21 (100.0%) | 0 (0.0%) |
| 16 and 17 Years | 0 (0.0%) | 0 (0.0%) |
| 18 to 24 Years | 0 (0.0%) | 0 (0.0%) |
| 25 to 34 Years | 4 (23.5%) | 4 (22.2%) |
| 35 to 44 Years | 0 (0.0%) | 14 (77.8%) |
| 45 to 54 Years | 0 (0.0%) | 5 (50.0%) |
| 55 to 64 Years | 8 (42.1%) | 0 (0.0%) |
| 65 to 74 Years | 0 (0.0%) | 3 (30.0%) |
| 75 Years and over | 0 (0.0%) | 4 (50.0%) |
| Total | 64 (50.8%) | 30 (25.4%) |
Income Above Poverty by Sex and Age in Dent
According to the poverty statistics in Dent, males aged 6 to 11 years and females aged under 5 years are the age groups that are most secure financially, with 100.0% of males and 100.0% of females in these age groups living above the poverty line.
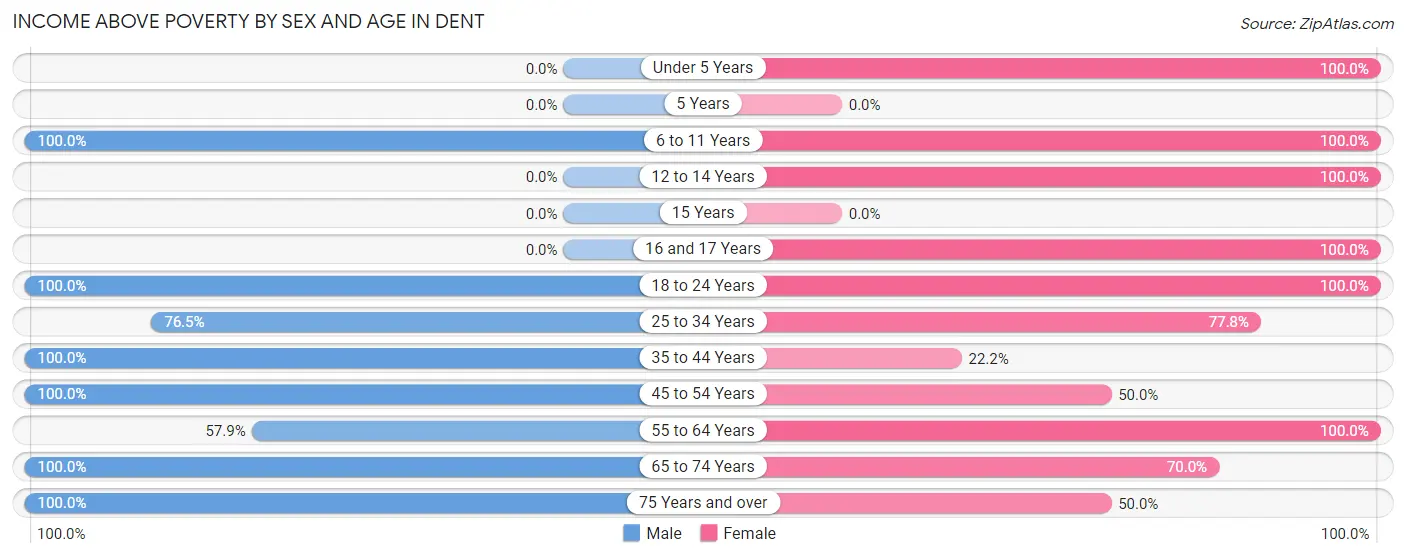
| Age Bracket | Male | Female |
| Under 5 Years | 0 (0.0%) | 1 (100.0%) |
| 5 Years | 0 (0.0%) | 0 (0.0%) |
| 6 to 11 Years | 4 (100.0%) | 3 (100.0%) |
| 12 to 14 Years | 0 (0.0%) | 14 (100.0%) |
| 15 Years | 0 (0.0%) | 0 (0.0%) |
| 16 and 17 Years | 0 (0.0%) | 2 (100.0%) |
| 18 to 24 Years | 9 (100.0%) | 15 (100.0%) |
| 25 to 34 Years | 13 (76.5%) | 14 (77.8%) |
| 35 to 44 Years | 16 (100.0%) | 4 (22.2%) |
| 45 to 54 Years | 2 (100.0%) | 5 (50.0%) |
| 55 to 64 Years | 11 (57.9%) | 19 (100.0%) |
| 65 to 74 Years | 4 (100.0%) | 7 (70.0%) |
| 75 Years and over | 3 (100.0%) | 4 (50.0%) |
| Total | 62 (49.2%) | 88 (74.6%) |
Income Below Poverty Among Married-Couple Families in Dent
The poverty statistics for married-couple families in Dent show that 3.2% or 1 of the total 31 families live below the poverty line. Families with 1 or 2 children have the highest poverty rate of 6.7%, comprising of 1 families. On the other hand, families with no children have the lowest poverty rate of 0.0%, which includes 0 families.
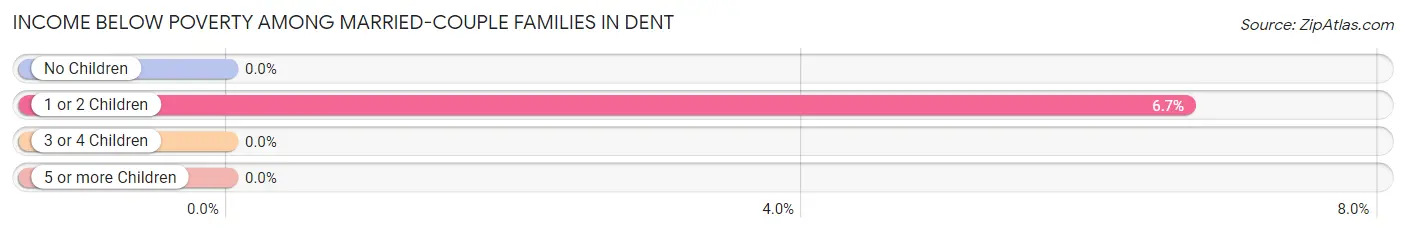
| Children | Above Poverty | Below Poverty |
| No Children | 16 (100.0%) | 0 (0.0%) |
| 1 or 2 Children | 14 (93.3%) | 1 (6.7%) |
| 3 or 4 Children | 0 (0.0%) | 0 (0.0%) |
| 5 or more Children | 0 (0.0%) | 0 (0.0%) |
| Total | 30 (96.8%) | 1 (3.2%) |
Income Below Poverty Among Single-Parent Households in Dent
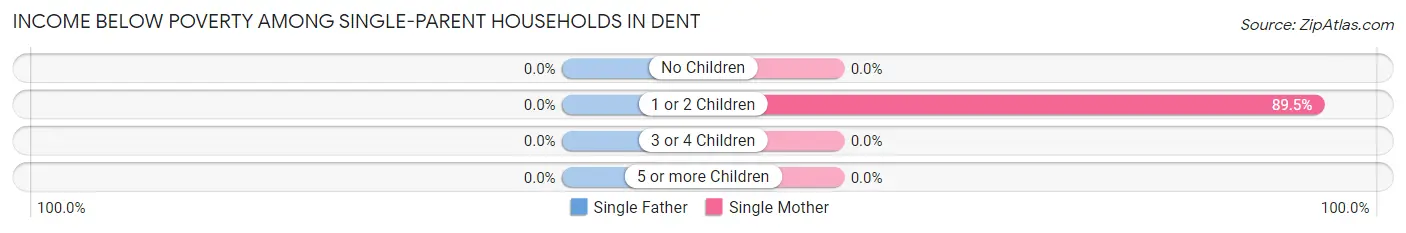
| Children | Single Father | Single Mother |
| No Children | 0 (0.0%) | 0 (0.0%) |
| 1 or 2 Children | 0 (0.0%) | 17 (89.5%) |
| 3 or 4 Children | 0 (0.0%) | 0 (0.0%) |
| 5 or more Children | 0 (0.0%) | 0 (0.0%) |
| Total | 0 (0.0%) | 17 (73.9%) |
Income Below Poverty Among Married-Couple vs Single-Parent Households in Dent
The poverty data for Dent shows that 1 of the married-couple family households (3.2%) and 17 of the single-parent households (73.9%) are living below the poverty level. Within the married-couple family households, those with 1 or 2 children have the highest poverty rate, with 1 households (6.7%) falling below the poverty line. Among the single-parent households, those with 1 or 2 children have the highest poverty rate, with 17 household (89.5%) living below poverty.
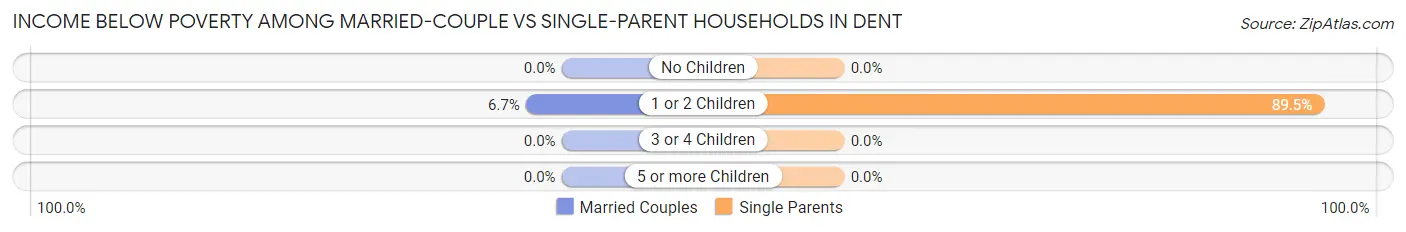
| Children | Married-Couple Families | Single-Parent Households |
| No Children | 0 (0.0%) | 0 (0.0%) |
| 1 or 2 Children | 1 (6.7%) | 17 (89.5%) |
| 3 or 4 Children | 0 (0.0%) | 0 (0.0%) |
| 5 or more Children | 0 (0.0%) | 0 (0.0%) |
| Total | 1 (3.2%) | 17 (73.9%) |
Race in Dent
The most populous races in Dent are White / Caucasian (239 | 98.0%), Two or more Races (3 | 1.2%), and Native / Alaskan (2 | 0.8%).
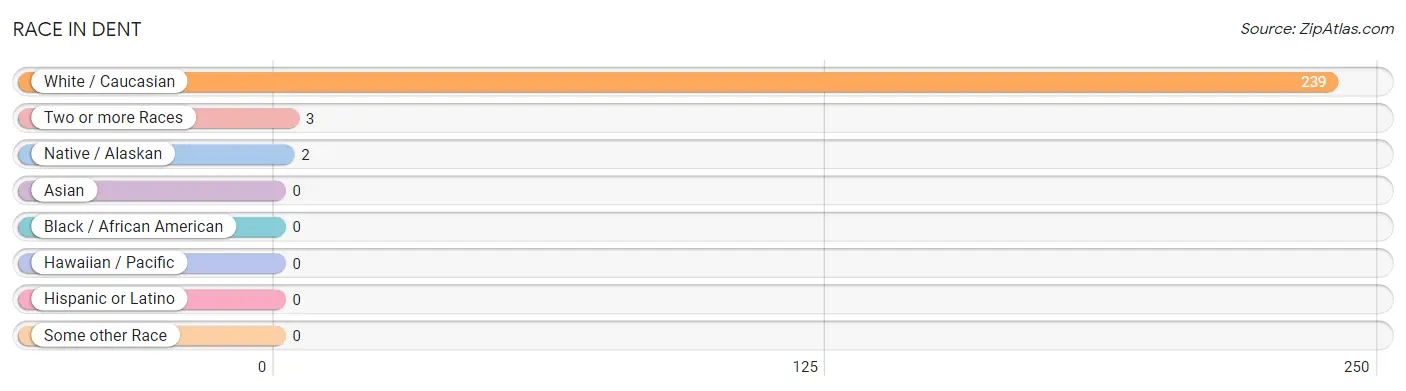
| Race | # Population | % Population |
| Asian | 0 | 0.0% |
| Black / African American | 0 | 0.0% |
| Hawaiian / Pacific | 0 | 0.0% |
| Hispanic or Latino | 0 | 0.0% |
| Native / Alaskan | 2 | 0.8% |
| White / Caucasian | 239 | 98.0% |
| Two or more Races | 3 | 1.2% |
| Some other Race | 0 | 0.0% |
| Total | 244 | 100.0% |
Ancestry in Dent
The most populous ancestries reported in Dent are German (148 | 60.7%), Polish (65 | 26.6%), Norwegian (56 | 23.0%), French (15 | 6.1%), and Irish (15 | 6.1%), together accounting for 122.6% of all Dent residents.
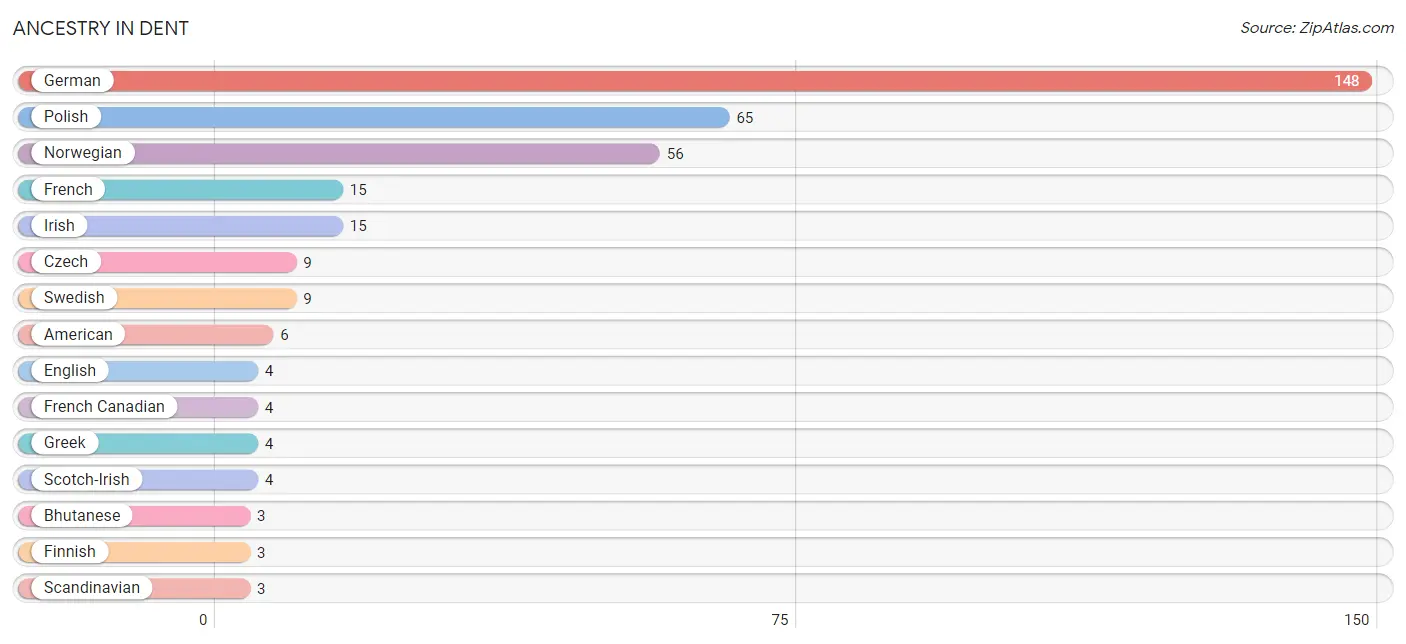
| Ancestry | # Population | % Population |
| American | 6 | 2.5% |
| Bhutanese | 3 | 1.2% |
| Czech | 9 | 3.7% |
| English | 4 | 1.6% |
| Finnish | 3 | 1.2% |
| French | 15 | 6.1% |
| French Canadian | 4 | 1.6% |
| German | 148 | 60.7% |
| Greek | 4 | 1.6% |
| Irish | 15 | 6.1% |
| Norwegian | 56 | 23.0% |
| Polish | 65 | 26.6% |
| Scandinavian | 3 | 1.2% |
| Scotch-Irish | 4 | 1.6% |
| Slovak | 1 | 0.4% |
| Swedish | 9 | 3.7% |
| Welsh | 1 | 0.4% | View All 17 Rows |
Immigrants in Dent

| Immigration Origin | # Population | % Population | View All 0 Rows |
Sex and Age in Dent
Sex and Age in Dent
The most populous age groups in Dent are 10 to 14 Years (24 | 19.1%) for men and 60 to 64 Years (16 | 13.6%) for women.
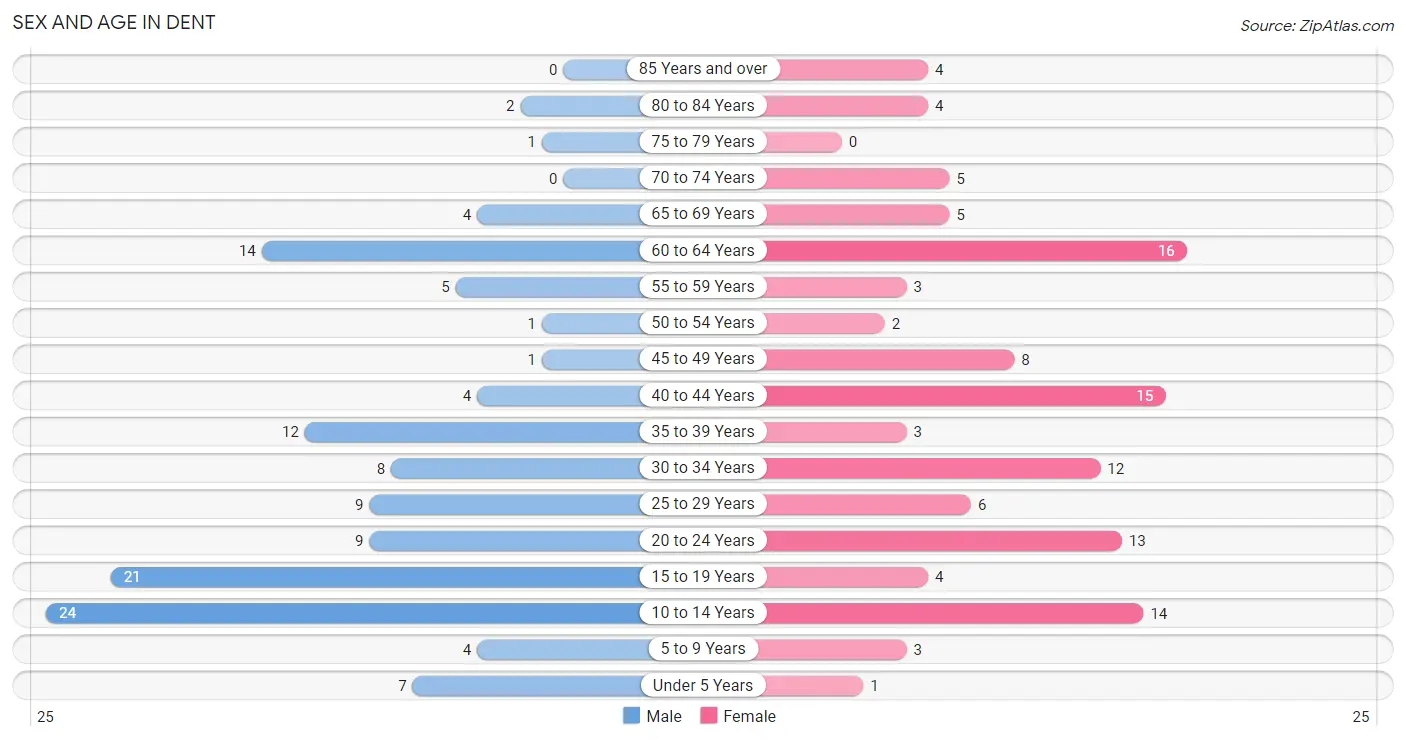
| Age Bracket | Male | Female |
| Under 5 Years | 7 (5.6%) | 1 (0.9%) |
| 5 to 9 Years | 4 (3.2%) | 3 (2.5%) |
| 10 to 14 Years | 24 (19.1%) | 14 (11.9%) |
| 15 to 19 Years | 21 (16.7%) | 4 (3.4%) |
| 20 to 24 Years | 9 (7.1%) | 13 (11.0%) |
| 25 to 29 Years | 9 (7.1%) | 6 (5.1%) |
| 30 to 34 Years | 8 (6.4%) | 12 (10.2%) |
| 35 to 39 Years | 12 (9.5%) | 3 (2.5%) |
| 40 to 44 Years | 4 (3.2%) | 15 (12.7%) |
| 45 to 49 Years | 1 (0.8%) | 8 (6.8%) |
| 50 to 54 Years | 1 (0.8%) | 2 (1.7%) |
| 55 to 59 Years | 5 (4.0%) | 3 (2.5%) |
| 60 to 64 Years | 14 (11.1%) | 16 (13.6%) |
| 65 to 69 Years | 4 (3.2%) | 5 (4.2%) |
| 70 to 74 Years | 0 (0.0%) | 5 (4.2%) |
| 75 to 79 Years | 1 (0.8%) | 0 (0.0%) |
| 80 to 84 Years | 2 (1.6%) | 4 (3.4%) |
| 85 Years and over | 0 (0.0%) | 4 (3.4%) |
| Total | 126 (100.0%) | 118 (100.0%) |
Families and Households in Dent
Median Family Size in Dent
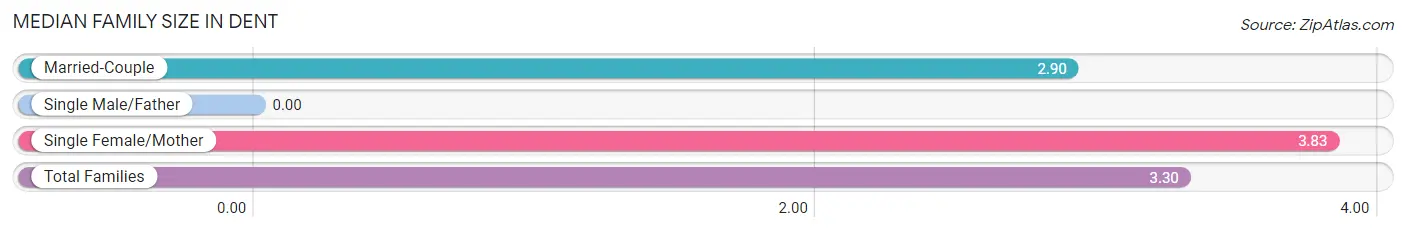
| Family Type | # Families | Family Size |
| Married-Couple | 31 (57.4%) | 2.90 |
| Single Male/Father | 0 (0.0%) | - |
| Single Female/Mother | 23 (42.6%) | 3.83 |
| Total Families | 54 (100.0%) | 3.30 |
Median Household Size in Dent
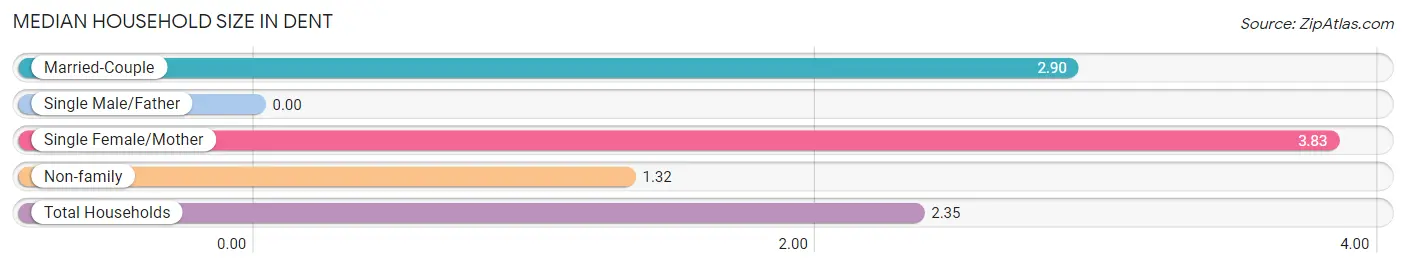
| Household Type | # Households | Household Size |
| Married-Couple | 31 (29.8%) | 2.90 |
| Single Male/Father | 0 (0.0%) | - |
| Single Female/Mother | 23 (22.1%) | 3.83 |
| Non-family | 50 (48.1%) | 1.32 |
| Total Households | 104 (100.0%) | 2.35 |
Household Size by Marriage Status in Dent
Out of a total of 104 households in Dent, 54 (51.9%) are family households, while 50 (48.1%) are nonfamily households. The most numerous type of family households are 3-person households, comprising 34, and the most common type of nonfamily households are 1-person households, comprising 36.
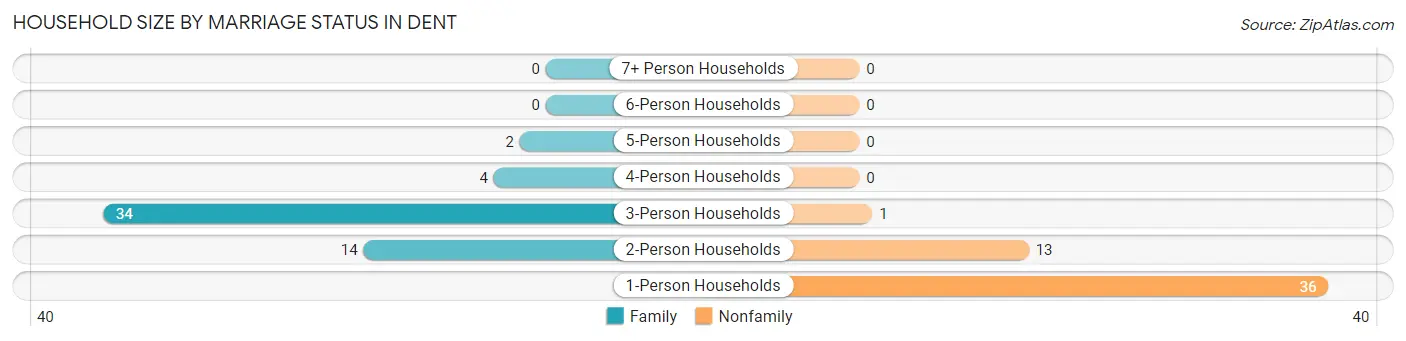
| Household Size | Family Households | Nonfamily Households |
| 1-Person Households | - | 36 (34.6%) |
| 2-Person Households | 14 (13.5%) | 13 (12.5%) |
| 3-Person Households | 34 (32.7%) | 1 (1.0%) |
| 4-Person Households | 4 (3.8%) | 0 (0.0%) |
| 5-Person Households | 2 (1.9%) | 0 (0.0%) |
| 6-Person Households | 0 (0.0%) | 0 (0.0%) |
| 7+ Person Households | 0 (0.0%) | 0 (0.0%) |
| Total | 54 (51.9%) | 50 (48.1%) |
Female Fertility in Dent
Fertility by Age in Dent
Average fertility rate in Dent is 16.0 births per 1,000 women. Women in the age bracket of 20 to 34 years have the highest fertility rate with 32.0 births per 1,000 women. Women in the age bracket of 20 to 34 years acount for 100.0% of all women with births.
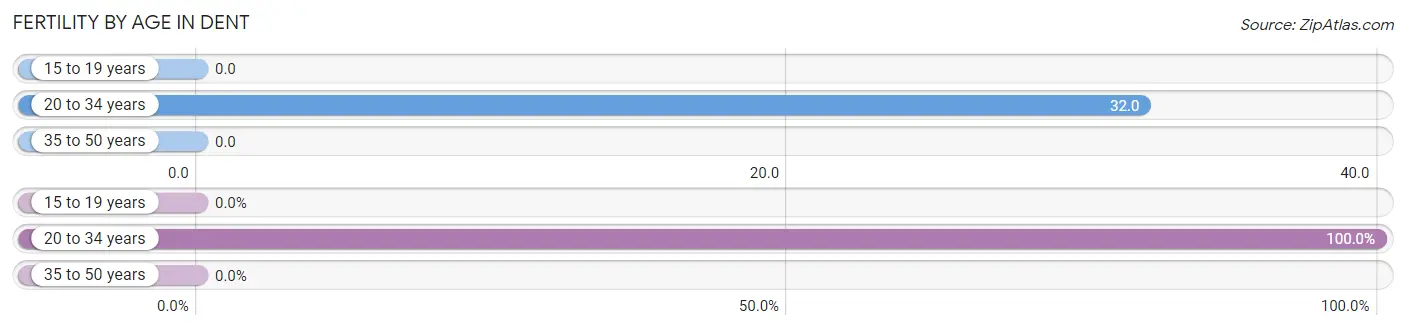
| Age Bracket | Women with Births | Births / 1,000 Women |
| 15 to 19 years | 0 (0.0%) | 0.0 |
| 20 to 34 years | 1 (100.0%) | 32.0 |
| 35 to 50 years | 0 (0.0%) | 0.0 |
| Total | 1 (100.0%) | 16.0 |
Fertility by Age by Marriage Status in Dent
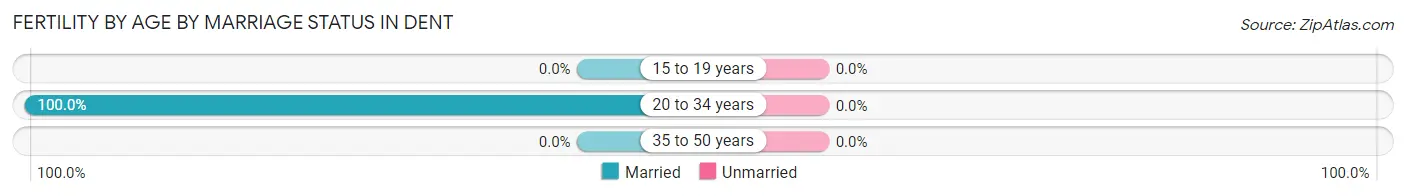
| Age Bracket | Married | Unmarried |
| 15 to 19 years | 0 (0.0%) | 0 (0.0%) |
| 20 to 34 years | 1 (100.0%) | 0 (0.0%) |
| 35 to 50 years | 0 (0.0%) | 0 (0.0%) |
| Total | 1 (100.0%) | 0 (0.0%) |
Fertility by Education in Dent
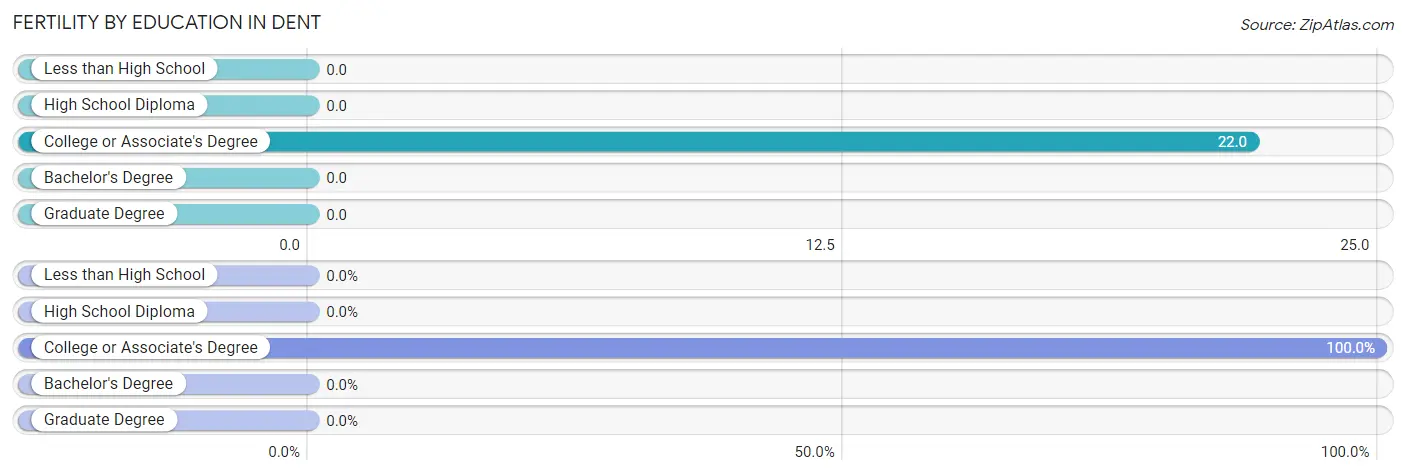
| Educational Attainment | Women with Births | Births / 1,000 Women |
| Less than High School | 0 (0.0%) | 0.0 |
| High School Diploma | 0 (0.0%) | 0.0 |
| College or Associate's Degree | 1 (100.0%) | 22.0 |
| Bachelor's Degree | 0 (0.0%) | 0.0 |
| Graduate Degree | 0 (0.0%) | 0.0 |
| Total | 1 (100.0%) | 16.0 |
Fertility by Education by Marriage Status in Dent
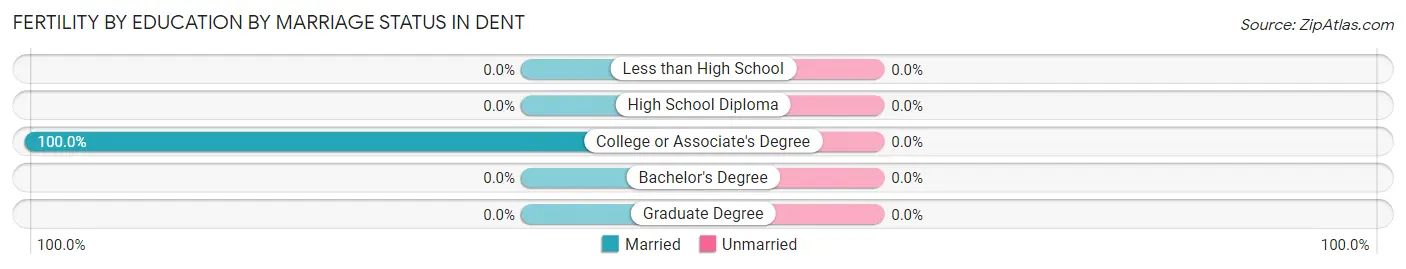
| Educational Attainment | Married | Unmarried |
| Less than High School | 0 (0.0%) | 0 (0.0%) |
| High School Diploma | 0 (0.0%) | 0 (0.0%) |
| College or Associate's Degree | 1 (100.0%) | 0 (0.0%) |
| Bachelor's Degree | 0 (0.0%) | 0 (0.0%) |
| Graduate Degree | 0 (0.0%) | 0 (0.0%) |
| Total | 1 (100.0%) | 0 (0.0%) |
Employment Characteristics in Dent
Employment by Class of Employer in Dent
Among the 113 employed individuals in Dent, private company employees (96 | 85.0%), local government employees (6 | 5.3%), and not-for-profit organizations (4 | 3.5%) make up the most common classes of employment.
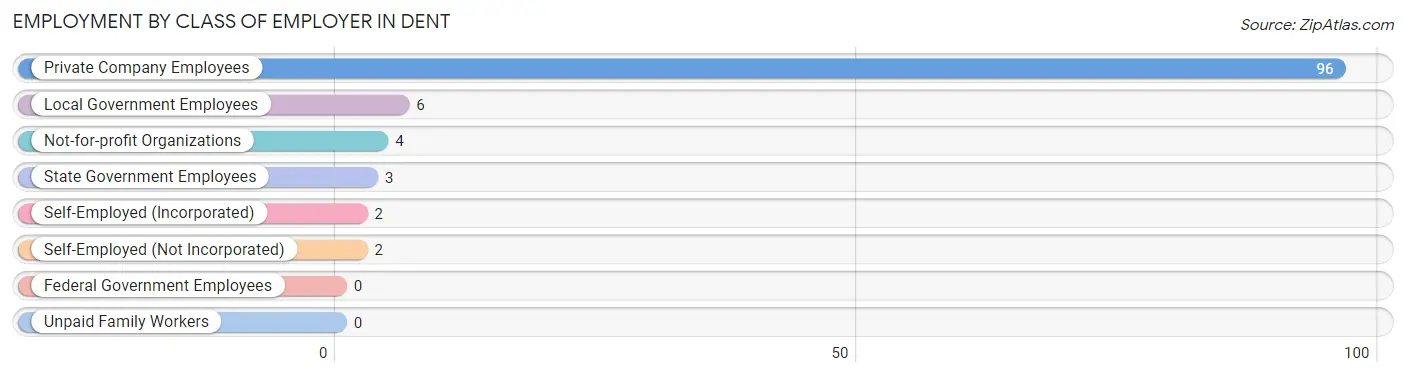
| Employer Class | # Employees | % Employees |
| Private Company Employees | 96 | 85.0% |
| Self-Employed (Incorporated) | 2 | 1.8% |
| Self-Employed (Not Incorporated) | 2 | 1.8% |
| Not-for-profit Organizations | 4 | 3.5% |
| Local Government Employees | 6 | 5.3% |
| State Government Employees | 3 | 2.6% |
| Federal Government Employees | 0 | 0.0% |
| Unpaid Family Workers | 0 | 0.0% |
| Total | 113 | 100.0% |
Employment Status by Age in Dent
According to the labor force statistics for Dent, out of the total population over 16 years of age (170), 71.2% or 121 individuals are in the labor force, with 6.6% or 8 of them unemployed. The age group with the highest labor force participation rate is 16 to 19 years, with 100.0% or 4 individuals in the labor force. Within the labor force, the 45 to 54 years age range has the highest percentage of unemployed individuals, with 50.0% or 5 of them being unemployed.
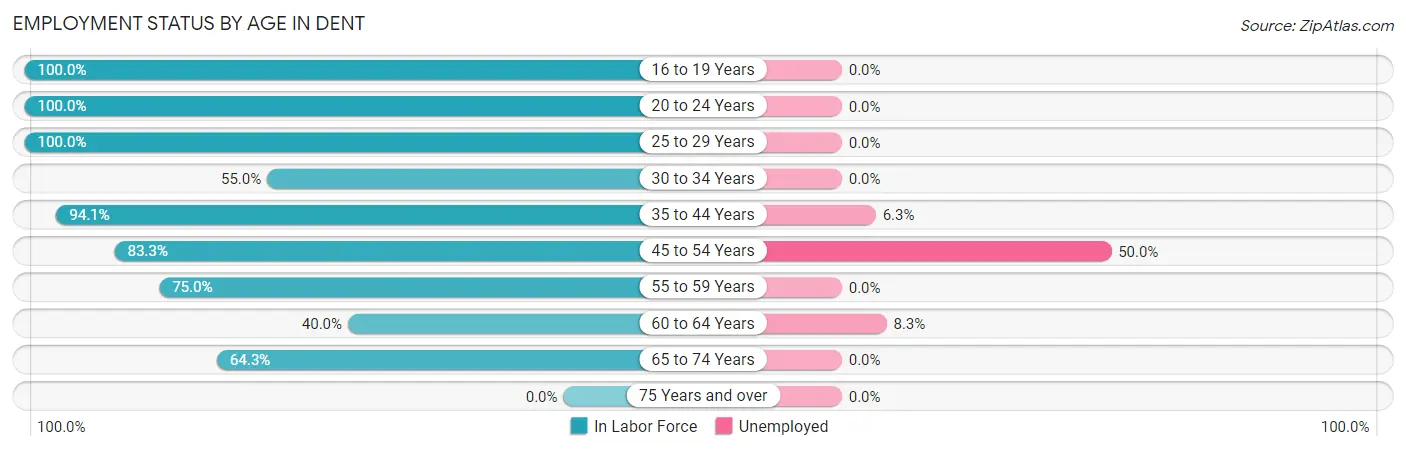
| Age Bracket | In Labor Force | Unemployed |
| 16 to 19 Years | 4 (100.0%) | 0 (0.0%) |
| 20 to 24 Years | 22 (100.0%) | 0 (0.0%) |
| 25 to 29 Years | 15 (100.0%) | 0 (0.0%) |
| 30 to 34 Years | 11 (55.0%) | 0 (0.0%) |
| 35 to 44 Years | 32 (94.1%) | 2 (6.3%) |
| 45 to 54 Years | 10 (83.3%) | 5 (50.0%) |
| 55 to 59 Years | 6 (75.0%) | 0 (0.0%) |
| 60 to 64 Years | 12 (40.0%) | 1 (8.3%) |
| 65 to 74 Years | 9 (64.3%) | 0 (0.0%) |
| 75 Years and over | 0 (0.0%) | 0 (0.0%) |
| Total | 121 (71.2%) | 8 (6.6%) |
Employment Status by Educational Attainment in Dent
According to labor force statistics for Dent, 72.3% of individuals (86) out of the total population between 25 and 64 years of age (119) are in the labor force, with 9.3% or 8 of them being unemployed. The group with the highest labor force participation rate are those with the educational attainment of college / associate degree, with 87.0% or 47 individuals in the labor force. Within the labor force, individuals with bachelor's degree or higher education have the highest percentage of unemployment, with 35.7% or 5 of them being unemployed.
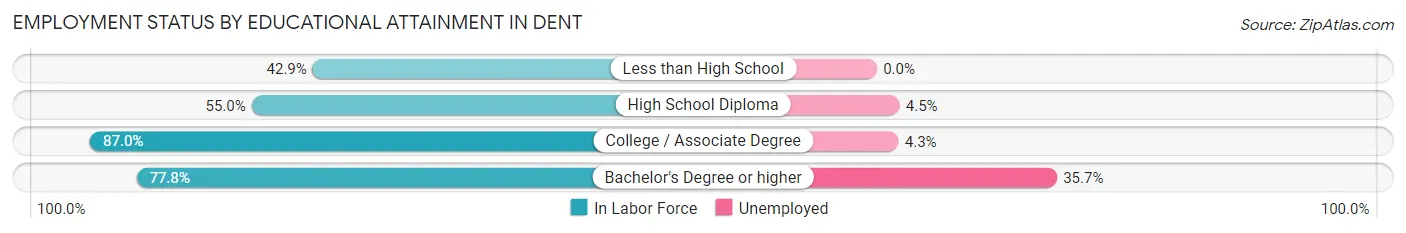
| Educational Attainment | In Labor Force | Unemployed |
| Less than High School | 3 (42.9%) | 0 (0.0%) |
| High School Diploma | 22 (55.0%) | 2 (4.5%) |
| College / Associate Degree | 47 (87.0%) | 2 (4.3%) |
| Bachelor's Degree or higher | 14 (77.8%) | 6 (35.7%) |
| Total | 86 (72.3%) | 11 (9.3%) |
Employment Occupations by Sex in Dent
Management, Business, Science and Arts Occupations
The most common Management, Business, Science and Arts occupations in Dent are Community & Social Service (13 | 11.5%), Education Instruction & Library (12 | 10.6%), Health Diagnosing & Treating (6 | 5.3%), Health Technologists (6 | 5.3%), and Computers, Engineering & Science (5 | 4.4%).
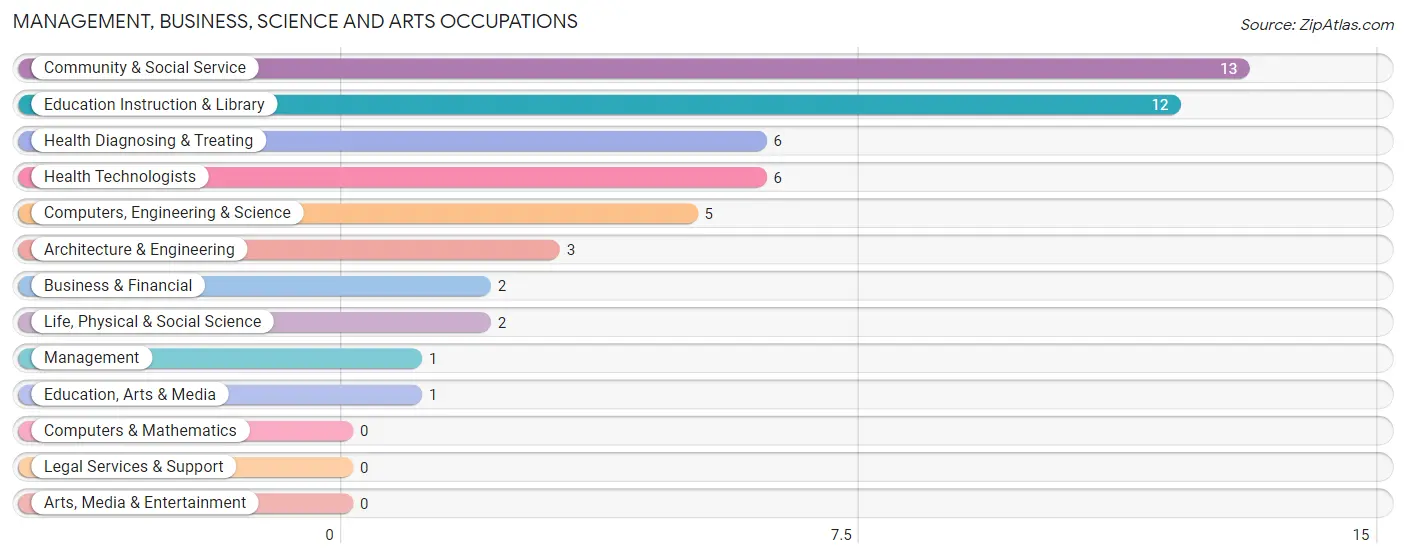
Management, Business, Science and Arts Occupations by Sex
Within the Management, Business, Science and Arts occupations in Dent, the most male-oriented occupations are Management (100.0%), Business & Financial (100.0%), and Life, Physical & Social Science (100.0%), while the most female-oriented occupations are Education, Arts & Media (100.0%), Health Diagnosing & Treating (100.0%), and Health Technologists (100.0%).
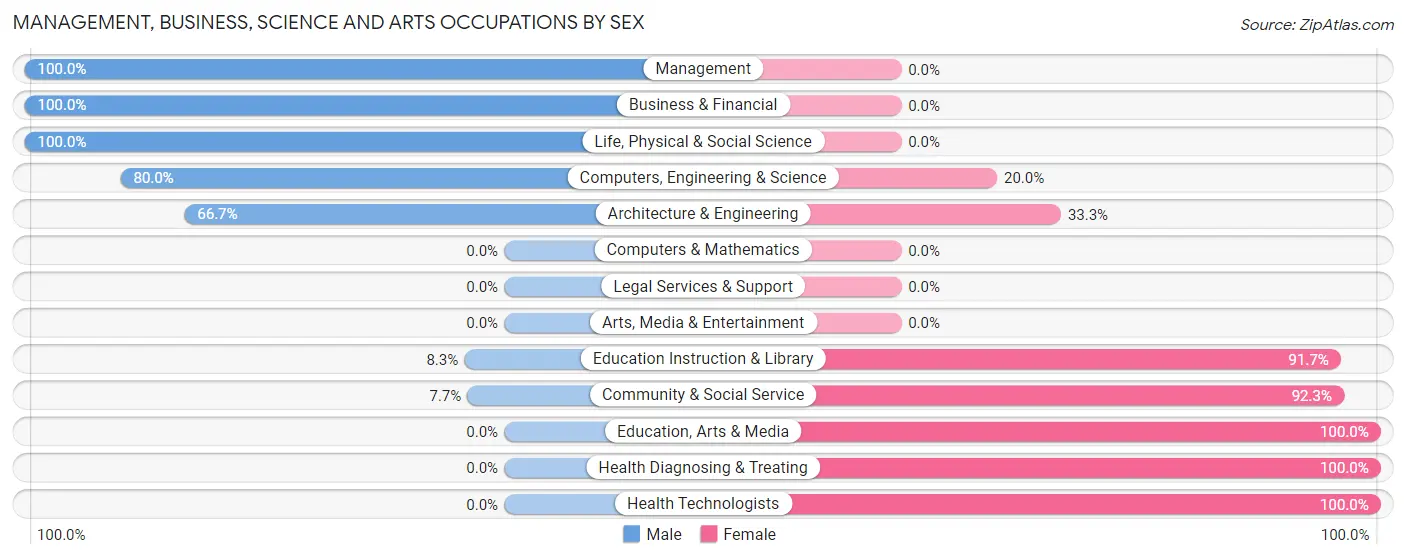
| Occupation | Male | Female |
| Management | 1 (100.0%) | 0 (0.0%) |
| Business & Financial | 2 (100.0%) | 0 (0.0%) |
| Computers, Engineering & Science | 4 (80.0%) | 1 (20.0%) |
| Computers & Mathematics | 0 (0.0%) | 0 (0.0%) |
| Architecture & Engineering | 2 (66.7%) | 1 (33.3%) |
| Life, Physical & Social Science | 2 (100.0%) | 0 (0.0%) |
| Community & Social Service | 1 (7.7%) | 12 (92.3%) |
| Education, Arts & Media | 0 (0.0%) | 1 (100.0%) |
| Legal Services & Support | 0 (0.0%) | 0 (0.0%) |
| Education Instruction & Library | 1 (8.3%) | 11 (91.7%) |
| Arts, Media & Entertainment | 0 (0.0%) | 0 (0.0%) |
| Health Diagnosing & Treating | 0 (0.0%) | 6 (100.0%) |
| Health Technologists | 0 (0.0%) | 6 (100.0%) |
| Total (Category) | 8 (29.6%) | 19 (70.4%) |
| Total (Overall) | 44 (38.9%) | 69 (61.1%) |
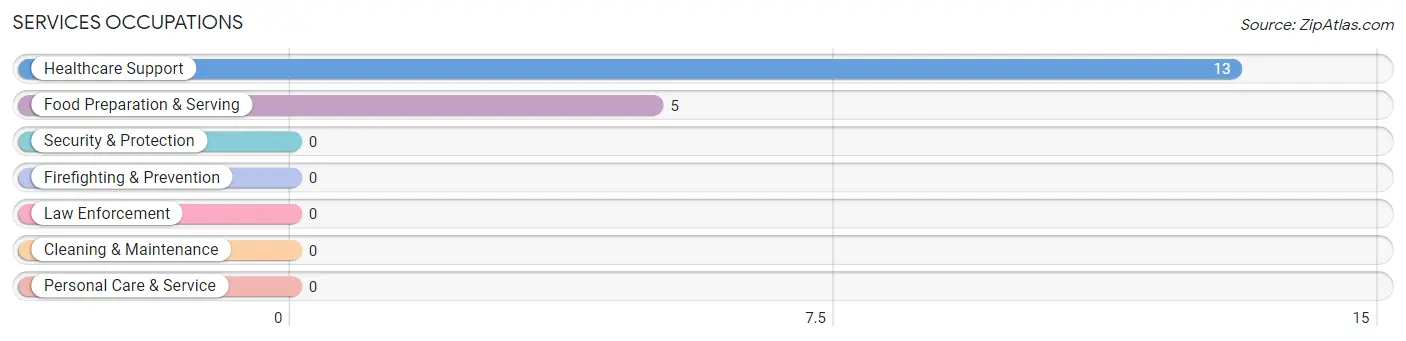
Services Occupations
The most common Services occupations in Dent are Healthcare Support (13 | 11.5%), and Food Preparation & Serving (5 | 4.4%).
Services Occupations by Sex
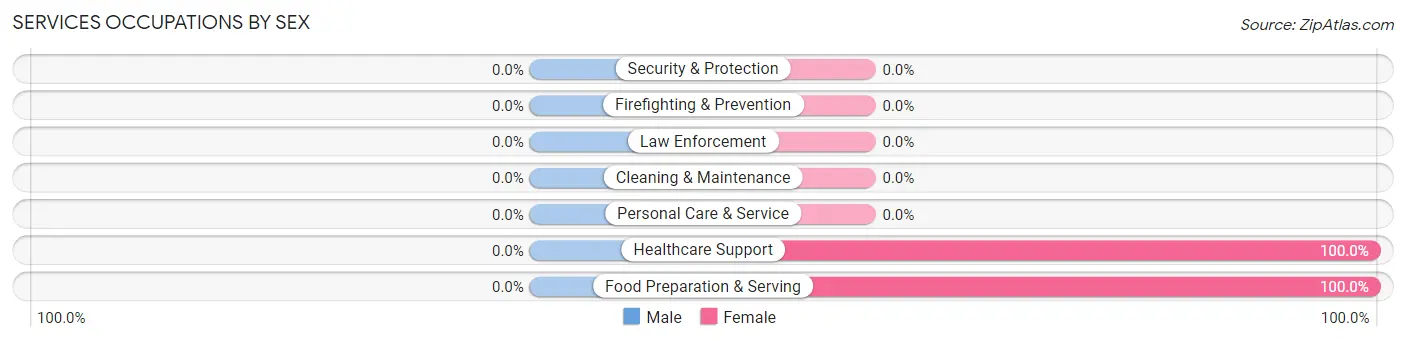
| Occupation | Male | Female |
| Healthcare Support | 0 (0.0%) | 13 (100.0%) |
| Security & Protection | 0 (0.0%) | 0 (0.0%) |
| Firefighting & Prevention | 0 (0.0%) | 0 (0.0%) |
| Law Enforcement | 0 (0.0%) | 0 (0.0%) |
| Food Preparation & Serving | 0 (0.0%) | 5 (100.0%) |
| Cleaning & Maintenance | 0 (0.0%) | 0 (0.0%) |
| Personal Care & Service | 0 (0.0%) | 0 (0.0%) |
| Total (Category) | 0 (0.0%) | 18 (100.0%) |
| Total (Overall) | 44 (38.9%) | 69 (61.1%) |
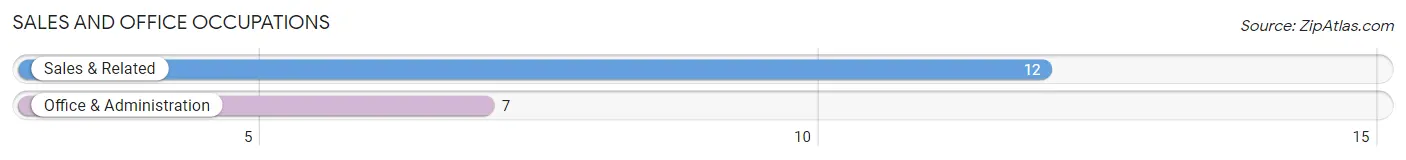
Sales and Office Occupations
The most common Sales and Office occupations in Dent are Sales & Related (12 | 10.6%), and Office & Administration (7 | 6.2%).
Sales and Office Occupations by Sex
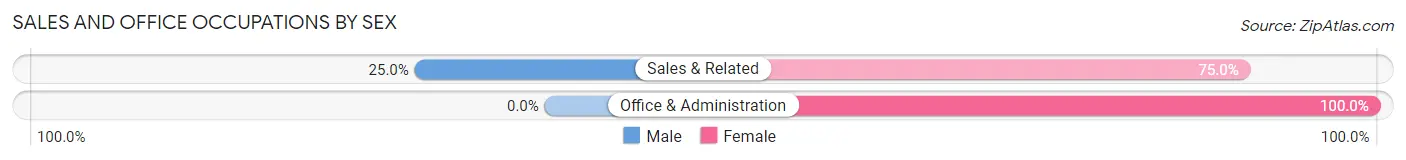
| Occupation | Male | Female |
| Sales & Related | 3 (25.0%) | 9 (75.0%) |
| Office & Administration | 0 (0.0%) | 7 (100.0%) |
| Total (Category) | 3 (15.8%) | 16 (84.2%) |
| Total (Overall) | 44 (38.9%) | 69 (61.1%) |
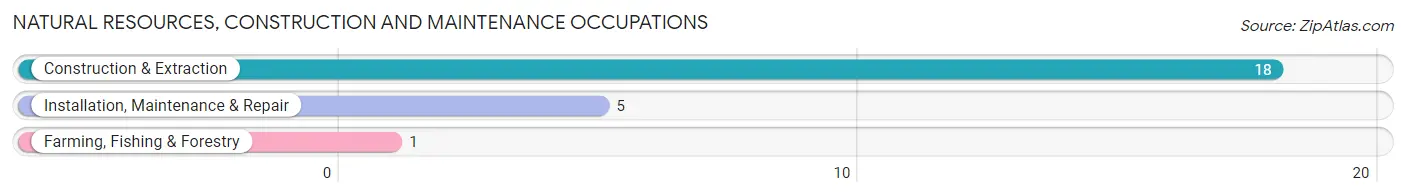
Natural Resources, Construction and Maintenance Occupations
The most common Natural Resources, Construction and Maintenance occupations in Dent are Construction & Extraction (18 | 15.9%), Installation, Maintenance & Repair (5 | 4.4%), and Farming, Fishing & Forestry (1 | 0.9%).
Natural Resources, Construction and Maintenance Occupations by Sex
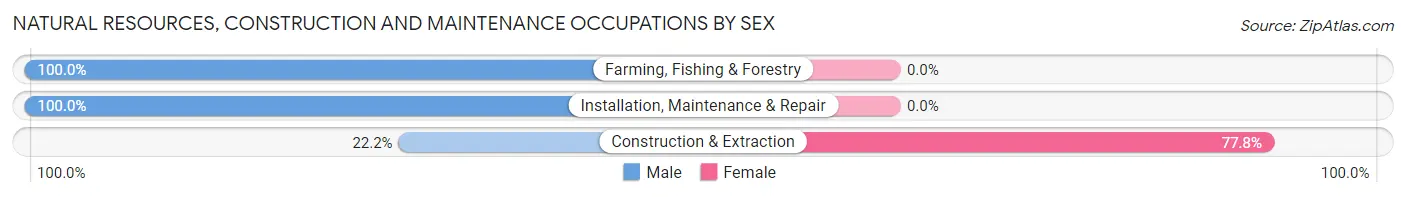
| Occupation | Male | Female |
| Farming, Fishing & Forestry | 1 (100.0%) | 0 (0.0%) |
| Construction & Extraction | 4 (22.2%) | 14 (77.8%) |
| Installation, Maintenance & Repair | 5 (100.0%) | 0 (0.0%) |
| Total (Category) | 10 (41.7%) | 14 (58.3%) |
| Total (Overall) | 44 (38.9%) | 69 (61.1%) |
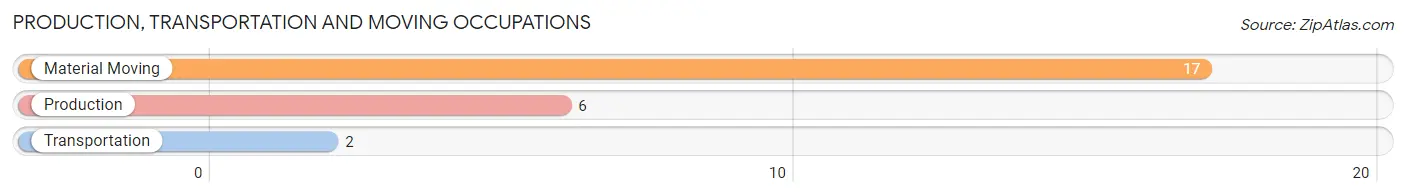
Production, Transportation and Moving Occupations
The most common Production, Transportation and Moving occupations in Dent are Material Moving (17 | 15.0%), Production (6 | 5.3%), and Transportation (2 | 1.8%).
Production, Transportation and Moving Occupations by Sex
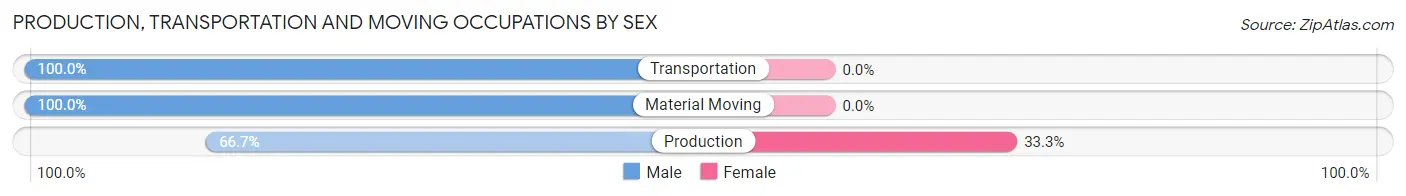
| Occupation | Male | Female |
| Production | 4 (66.7%) | 2 (33.3%) |
| Transportation | 2 (100.0%) | 0 (0.0%) |
| Material Moving | 17 (100.0%) | 0 (0.0%) |
| Total (Category) | 23 (92.0%) | 2 (8.0%) |
| Total (Overall) | 44 (38.9%) | 69 (61.1%) |
Employment Industries by Sex in Dent
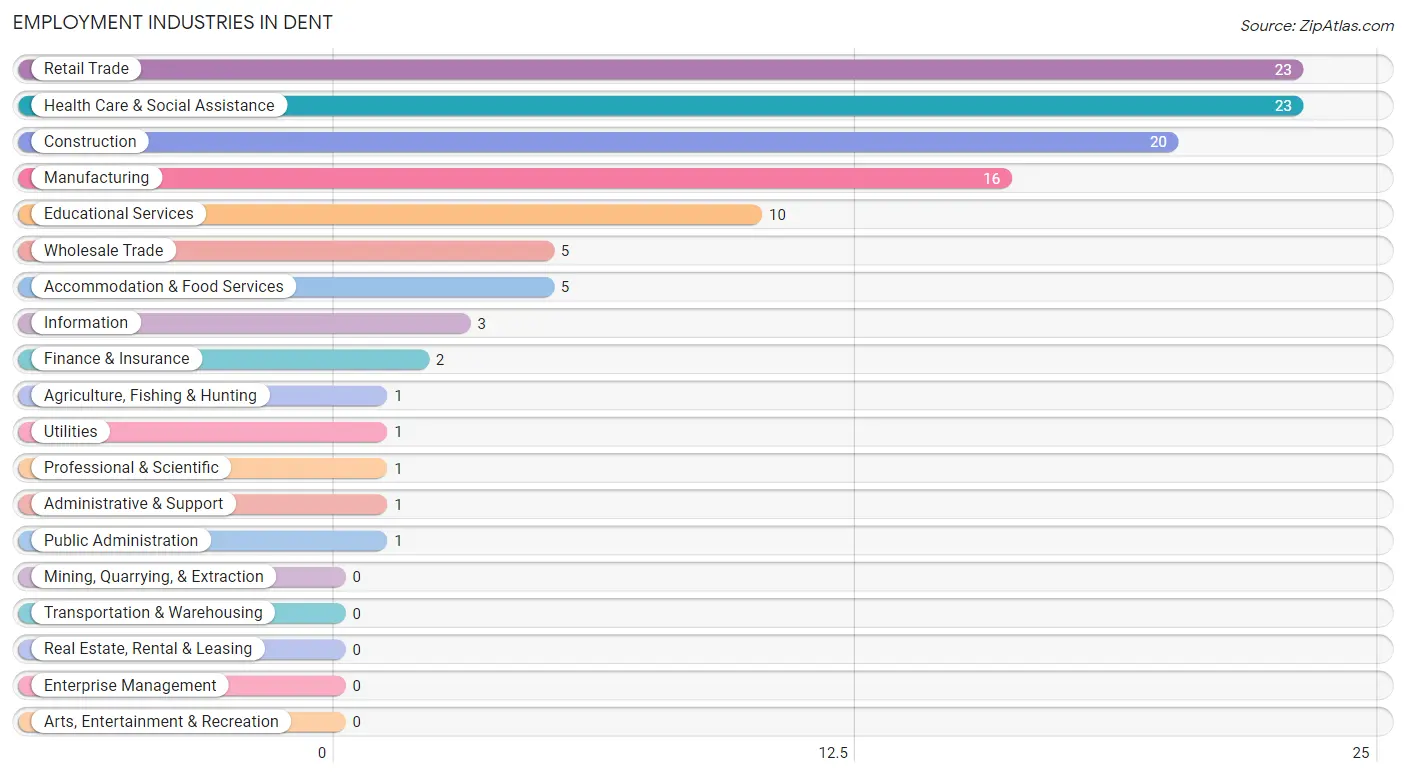
Employment Industries in Dent
The major employment industries in Dent include Retail Trade (23 | 20.3%), Health Care & Social Assistance (23 | 20.3%), Construction (20 | 17.7%), Manufacturing (16 | 14.2%), and Educational Services (10 | 8.8%).
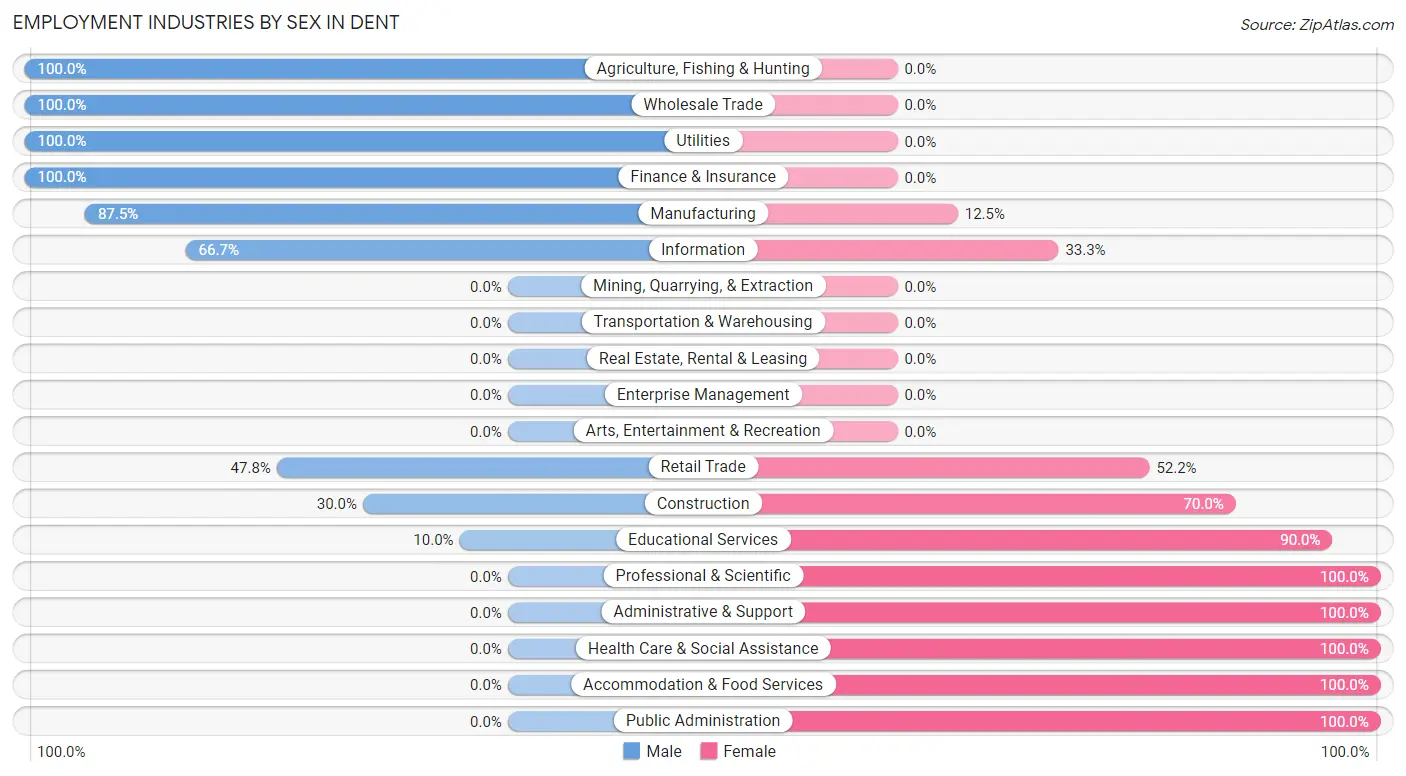
Employment Industries by Sex in Dent
The Dent industries that see more men than women are Agriculture, Fishing & Hunting (100.0%), Wholesale Trade (100.0%), and Utilities (100.0%), whereas the industries that tend to have a higher number of women are Professional & Scientific (100.0%), Administrative & Support (100.0%), and Health Care & Social Assistance (100.0%).
| Industry | Male | Female |
| Agriculture, Fishing & Hunting | 1 (100.0%) | 0 (0.0%) |
| Mining, Quarrying, & Extraction | 0 (0.0%) | 0 (0.0%) |
| Construction | 6 (30.0%) | 14 (70.0%) |
| Manufacturing | 14 (87.5%) | 2 (12.5%) |
| Wholesale Trade | 5 (100.0%) | 0 (0.0%) |
| Retail Trade | 11 (47.8%) | 12 (52.2%) |
| Transportation & Warehousing | 0 (0.0%) | 0 (0.0%) |
| Utilities | 1 (100.0%) | 0 (0.0%) |
| Information | 2 (66.7%) | 1 (33.3%) |
| Finance & Insurance | 2 (100.0%) | 0 (0.0%) |
| Real Estate, Rental & Leasing | 0 (0.0%) | 0 (0.0%) |
| Professional & Scientific | 0 (0.0%) | 1 (100.0%) |
| Enterprise Management | 0 (0.0%) | 0 (0.0%) |
| Administrative & Support | 0 (0.0%) | 1 (100.0%) |
| Educational Services | 1 (10.0%) | 9 (90.0%) |
| Health Care & Social Assistance | 0 (0.0%) | 23 (100.0%) |
| Arts, Entertainment & Recreation | 0 (0.0%) | 0 (0.0%) |
| Accommodation & Food Services | 0 (0.0%) | 5 (100.0%) |
| Public Administration | 0 (0.0%) | 1 (100.0%) |
| Total | 44 (38.9%) | 69 (61.1%) |
Education in Dent
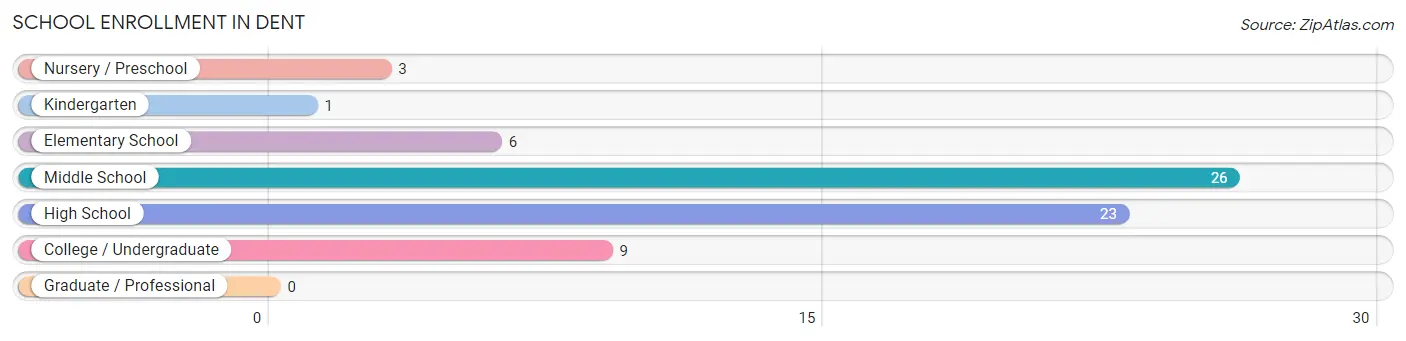
School Enrollment in Dent
The most common levels of schooling among the 68 students in Dent are middle school (26 | 38.2%), high school (23 | 33.8%), and college / undergraduate (9 | 13.2%).
| School Level | # Students | % Students |
| Nursery / Preschool | 3 | 4.4% |
| Kindergarten | 1 | 1.5% |
| Elementary School | 6 | 8.8% |
| Middle School | 26 | 38.2% |
| High School | 23 | 33.8% |
| College / Undergraduate | 9 | 13.2% |
| Graduate / Professional | 0 | 0.0% |
| Total | 68 | 100.0% |
School Enrollment by Age by Funding Source in Dent
Out of a total of 68 students who are enrolled in schools in Dent, 9 (13.2%) attend a private institution, while the remaining 59 (86.8%) are enrolled in public schools. The age group of 20 to 24 year olds has the highest likelihood of being enrolled in private schools, with 4 (100.0% in the age bracket) enrolled. Conversely, the age group of 3 to 4 year olds has the lowest likelihood of being enrolled in a private school, with 3 (100.0% in the age bracket) attending a public institution.
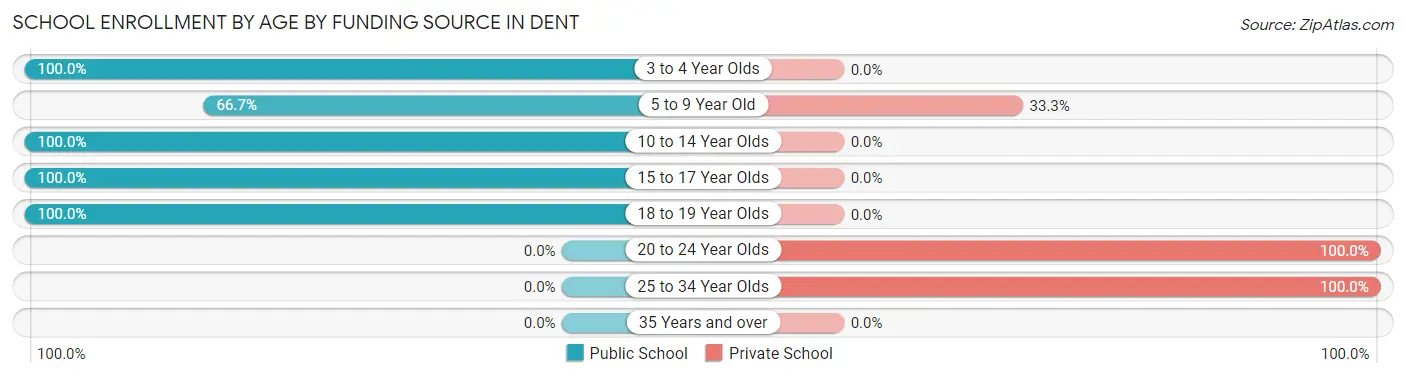
| Age Bracket | Public School | Private School |
| 3 to 4 Year Olds | 3 (100.0%) | 0 (0.0%) |
| 5 to 9 Year Old | 4 (66.7%) | 2 (33.3%) |
| 10 to 14 Year Olds | 27 (100.0%) | 0 (0.0%) |
| 15 to 17 Year Olds | 23 (100.0%) | 0 (0.0%) |
| 18 to 19 Year Olds | 2 (100.0%) | 0 (0.0%) |
| 20 to 24 Year Olds | 0 (0.0%) | 4 (100.0%) |
| 25 to 34 Year Olds | 0 (0.0%) | 3 (100.0%) |
| 35 Years and over | 0 (0.0%) | 0 (0.0%) |
| Total | 59 (86.8%) | 9 (13.2%) |
Educational Attainment by Field of Study in Dent
Bio, nature & agricultural (7 | 38.9%), arts & humanities (5 | 27.8%), computers & mathematics (2 | 11.1%), education (2 | 11.1%), and physical & health sciences (1 | 5.6%) are the most common fields of study among 18 individuals in Dent who have obtained a bachelor's degree or higher.
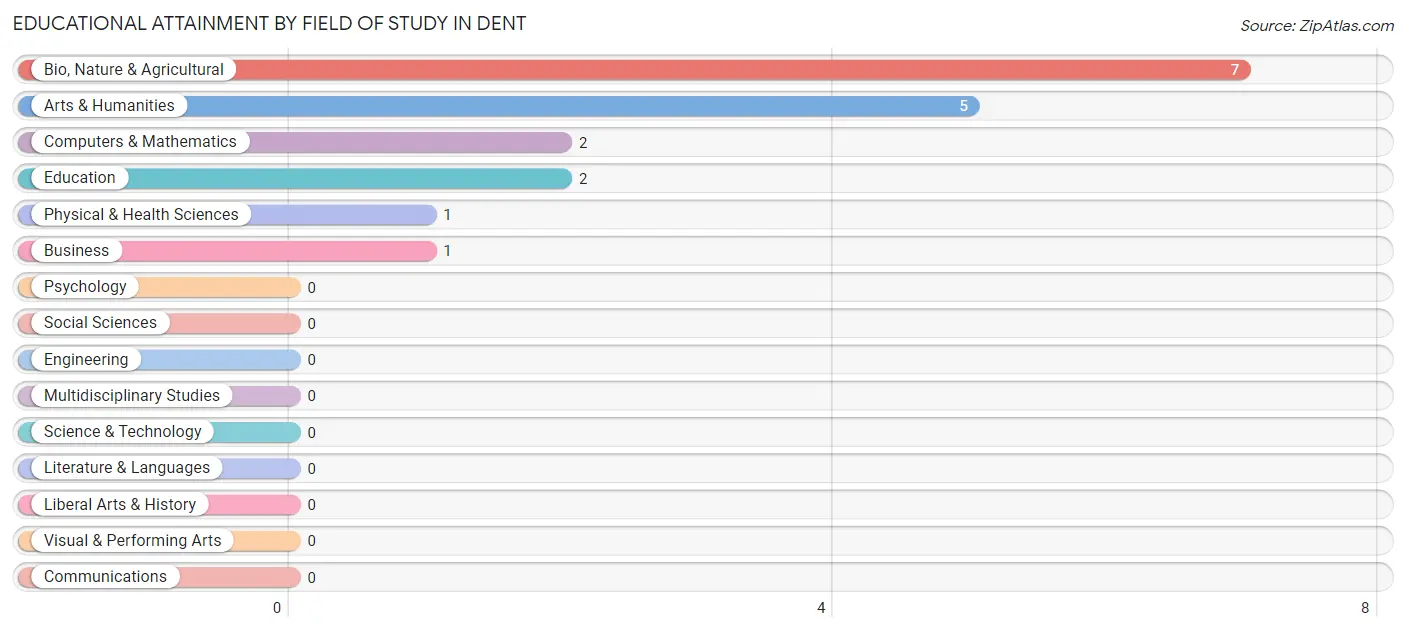
| Field of Study | # Graduates | % Graduates |
| Computers & Mathematics | 2 | 11.1% |
| Bio, Nature & Agricultural | 7 | 38.9% |
| Physical & Health Sciences | 1 | 5.6% |
| Psychology | 0 | 0.0% |
| Social Sciences | 0 | 0.0% |
| Engineering | 0 | 0.0% |
| Multidisciplinary Studies | 0 | 0.0% |
| Science & Technology | 0 | 0.0% |
| Business | 1 | 5.6% |
| Education | 2 | 11.1% |
| Literature & Languages | 0 | 0.0% |
| Liberal Arts & History | 0 | 0.0% |
| Visual & Performing Arts | 0 | 0.0% |
| Communications | 0 | 0.0% |
| Arts & Humanities | 5 | 27.8% |
| Total | 18 | 100.0% |
Transportation & Commute in Dent
Vehicle Availability by Sex in Dent
The most prevalent vehicle ownership categories in Dent are males with 2 vehicles (20, accounting for 45.5%) and females with 2 vehicles (30, making up 29.0%).
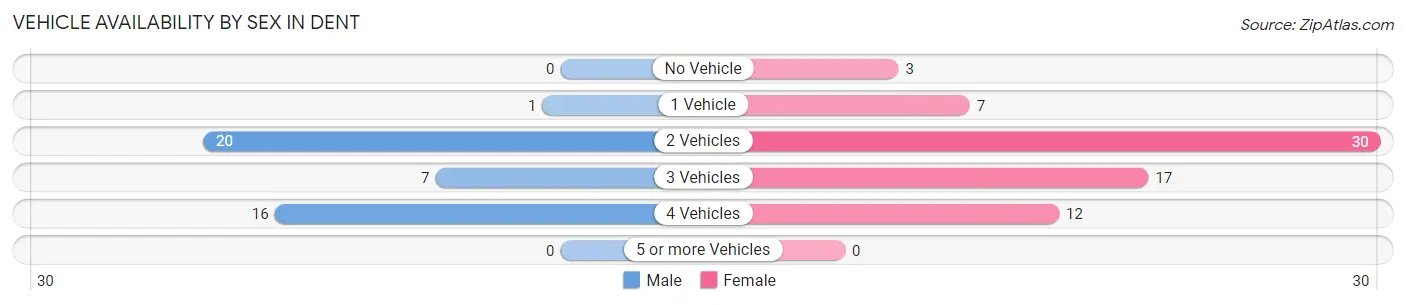
| Vehicles Available | Male | Female |
| No Vehicle | 0 (0.0%) | 3 (4.3%) |
| 1 Vehicle | 1 (2.3%) | 7 (10.1%) |
| 2 Vehicles | 20 (45.5%) | 30 (43.5%) |
| 3 Vehicles | 7 (15.9%) | 17 (24.6%) |
| 4 Vehicles | 16 (36.4%) | 12 (17.4%) |
| 5 or more Vehicles | 0 (0.0%) | 0 (0.0%) |
| Total | 44 (100.0%) | 69 (100.0%) |
Commute Time in Dent
The most frequently occuring commute durations in Dent are 15 to 19 minutes (33 commuters, 32.7%), 20 to 24 minutes (19 commuters, 18.8%), and 10 to 14 minutes (17 commuters, 16.8%).
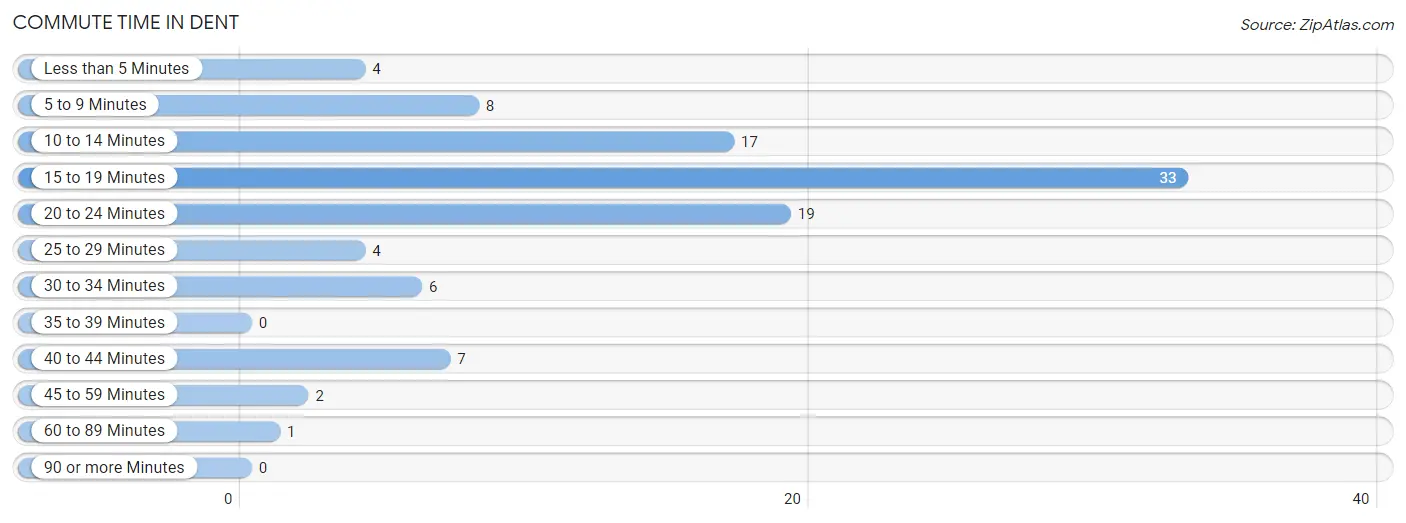
| Commute Time | # Commuters | % Commuters |
| Less than 5 Minutes | 4 | 4.0% |
| 5 to 9 Minutes | 8 | 7.9% |
| 10 to 14 Minutes | 17 | 16.8% |
| 15 to 19 Minutes | 33 | 32.7% |
| 20 to 24 Minutes | 19 | 18.8% |
| 25 to 29 Minutes | 4 | 4.0% |
| 30 to 34 Minutes | 6 | 5.9% |
| 35 to 39 Minutes | 0 | 0.0% |
| 40 to 44 Minutes | 7 | 6.9% |
| 45 to 59 Minutes | 2 | 2.0% |
| 60 to 89 Minutes | 1 | 1.0% |
| 90 or more Minutes | 0 | 0.0% |
Commute Time by Sex in Dent
The most common commute times in Dent are 20 to 24 minutes (11 commuters, 32.4%) for males and 15 to 19 minutes (23 commuters, 34.3%) for females.
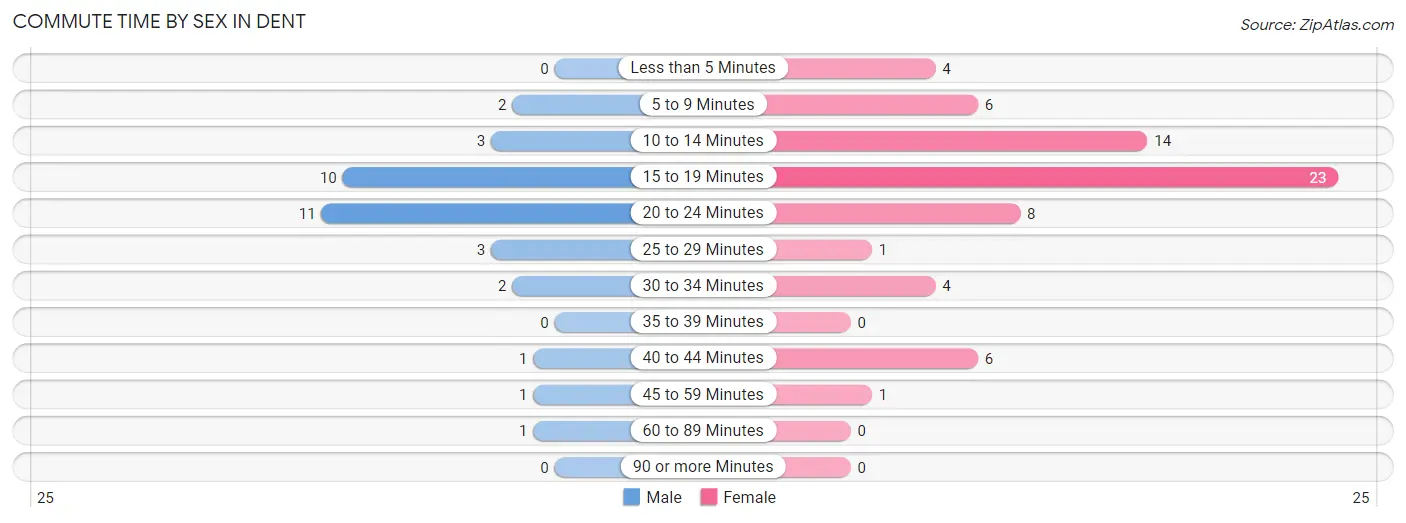
| Commute Time | Male | Female |
| Less than 5 Minutes | 0 (0.0%) | 4 (6.0%) |
| 5 to 9 Minutes | 2 (5.9%) | 6 (9.0%) |
| 10 to 14 Minutes | 3 (8.8%) | 14 (20.9%) |
| 15 to 19 Minutes | 10 (29.4%) | 23 (34.3%) |
| 20 to 24 Minutes | 11 (32.4%) | 8 (11.9%) |
| 25 to 29 Minutes | 3 (8.8%) | 1 (1.5%) |
| 30 to 34 Minutes | 2 (5.9%) | 4 (6.0%) |
| 35 to 39 Minutes | 0 (0.0%) | 0 (0.0%) |
| 40 to 44 Minutes | 1 (2.9%) | 6 (9.0%) |
| 45 to 59 Minutes | 1 (2.9%) | 1 (1.5%) |
| 60 to 89 Minutes | 1 (2.9%) | 0 (0.0%) |
| 90 or more Minutes | 0 (0.0%) | 0 (0.0%) |
Time of Departure to Work by Sex in Dent
The most frequent times of departure to work in Dent are 12:00 AM to 4:59 AM (10, 29.4%) for males and 8:00 AM to 8:29 AM (26, 38.8%) for females.
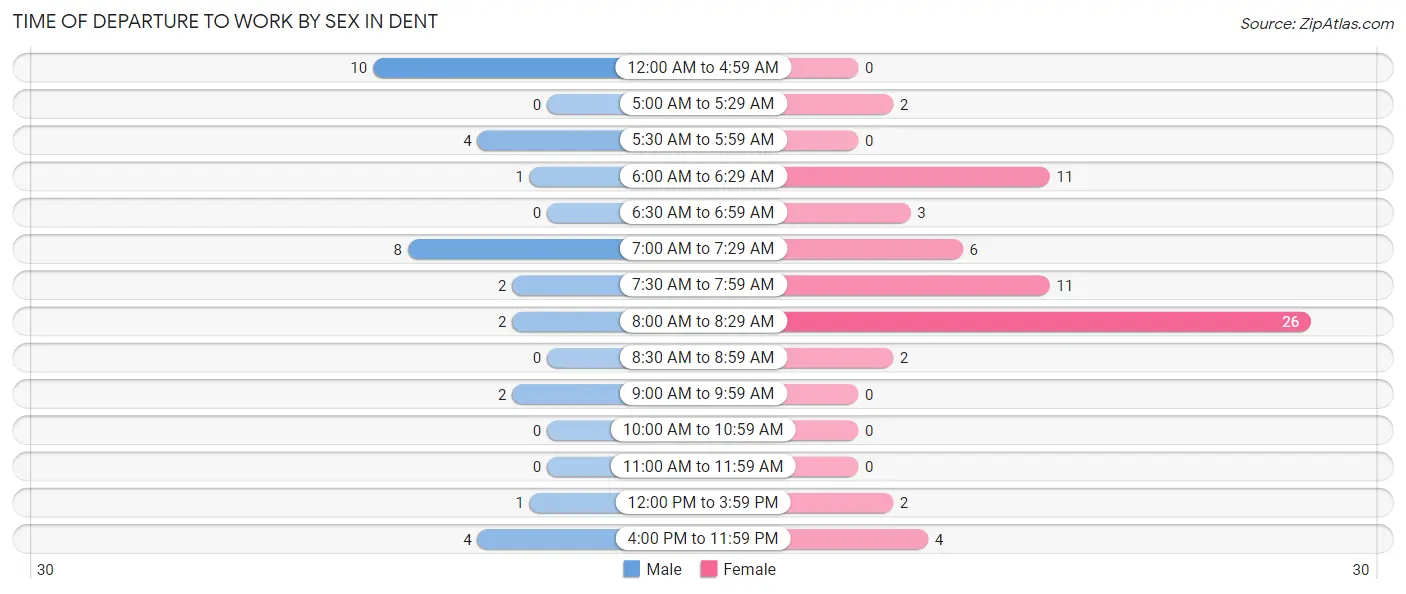
| Time of Departure | Male | Female |
| 12:00 AM to 4:59 AM | 10 (29.4%) | 0 (0.0%) |
| 5:00 AM to 5:29 AM | 0 (0.0%) | 2 (3.0%) |
| 5:30 AM to 5:59 AM | 4 (11.8%) | 0 (0.0%) |
| 6:00 AM to 6:29 AM | 1 (2.9%) | 11 (16.4%) |
| 6:30 AM to 6:59 AM | 0 (0.0%) | 3 (4.5%) |
| 7:00 AM to 7:29 AM | 8 (23.5%) | 6 (9.0%) |
| 7:30 AM to 7:59 AM | 2 (5.9%) | 11 (16.4%) |
| 8:00 AM to 8:29 AM | 2 (5.9%) | 26 (38.8%) |
| 8:30 AM to 8:59 AM | 0 (0.0%) | 2 (3.0%) |
| 9:00 AM to 9:59 AM | 2 (5.9%) | 0 (0.0%) |
| 10:00 AM to 10:59 AM | 0 (0.0%) | 0 (0.0%) |
| 11:00 AM to 11:59 AM | 0 (0.0%) | 0 (0.0%) |
| 12:00 PM to 3:59 PM | 1 (2.9%) | 2 (3.0%) |
| 4:00 PM to 11:59 PM | 4 (11.8%) | 4 (6.0%) |
| Total | 34 (100.0%) | 67 (100.0%) |
Housing Occupancy in Dent
Occupancy by Ownership in Dent
Of the total 104 dwellings in Dent, owner-occupied units account for 84 (80.8%), while renter-occupied units make up 20 (19.2%).
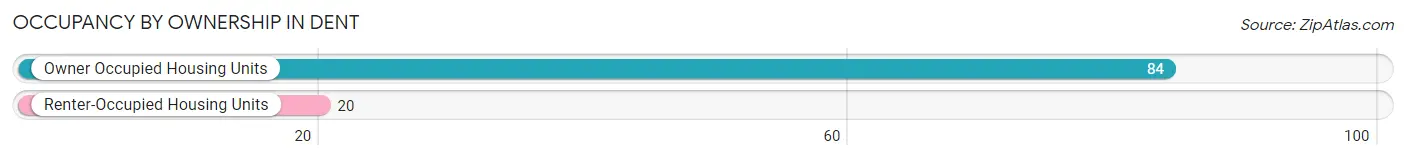
| Occupancy | # Housing Units | % Housing Units |
| Owner Occupied Housing Units | 84 | 80.8% |
| Renter-Occupied Housing Units | 20 | 19.2% |
| Total Occupied Housing Units | 104 | 100.0% |
Occupancy by Household Size in Dent
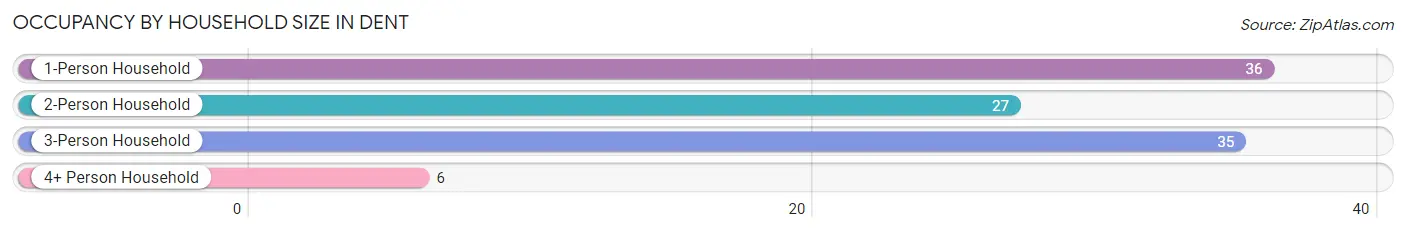
| Household Size | # Housing Units | % Housing Units |
| 1-Person Household | 36 | 34.6% |
| 2-Person Household | 27 | 26.0% |
| 3-Person Household | 35 | 33.7% |
| 4+ Person Household | 6 | 5.8% |
| Total Housing Units | 104 | 100.0% |
Occupancy by Ownership by Household Size in Dent
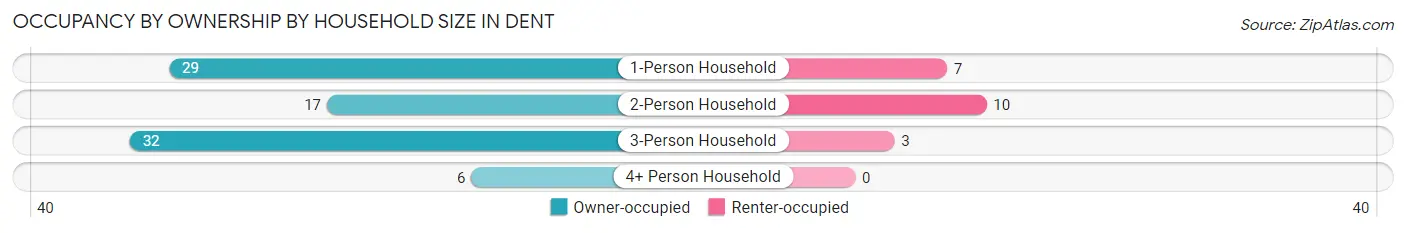
| Household Size | Owner-occupied | Renter-occupied |
| 1-Person Household | 29 (80.6%) | 7 (19.4%) |
| 2-Person Household | 17 (63.0%) | 10 (37.0%) |
| 3-Person Household | 32 (91.4%) | 3 (8.6%) |
| 4+ Person Household | 6 (100.0%) | 0 (0.0%) |
| Total Housing Units | 84 (80.8%) | 20 (19.2%) |
Occupancy by Educational Attainment in Dent
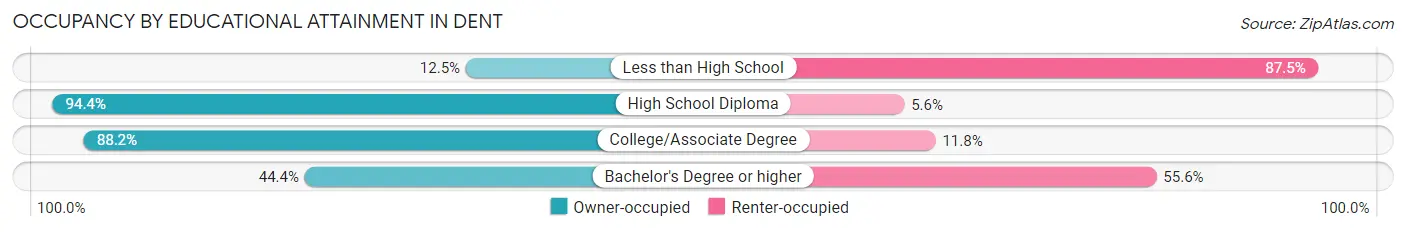
| Household Size | Owner-occupied | Renter-occupied |
| Less than High School | 1 (12.5%) | 7 (87.5%) |
| High School Diploma | 34 (94.4%) | 2 (5.6%) |
| College/Associate Degree | 45 (88.2%) | 6 (11.8%) |
| Bachelor's Degree or higher | 4 (44.4%) | 5 (55.6%) |
Occupancy by Age of Householder in Dent
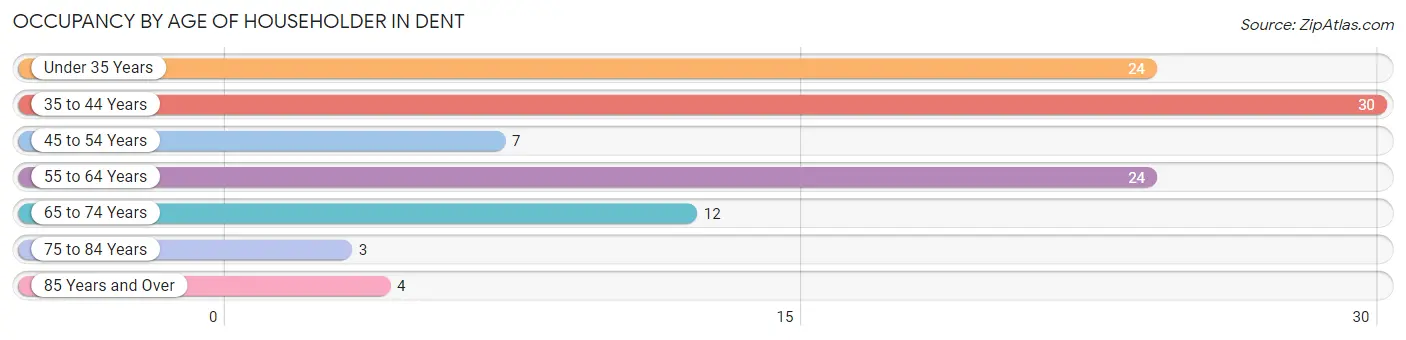
| Age Bracket | # Households | % Households |
| Under 35 Years | 24 | 23.1% |
| 35 to 44 Years | 30 | 28.8% |
| 45 to 54 Years | 7 | 6.7% |
| 55 to 64 Years | 24 | 23.1% |
| 65 to 74 Years | 12 | 11.5% |
| 75 to 84 Years | 3 | 2.9% |
| 85 Years and Over | 4 | 3.8% |
| Total | 104 | 100.0% |
Housing Finances in Dent
Median Income by Occupancy in Dent
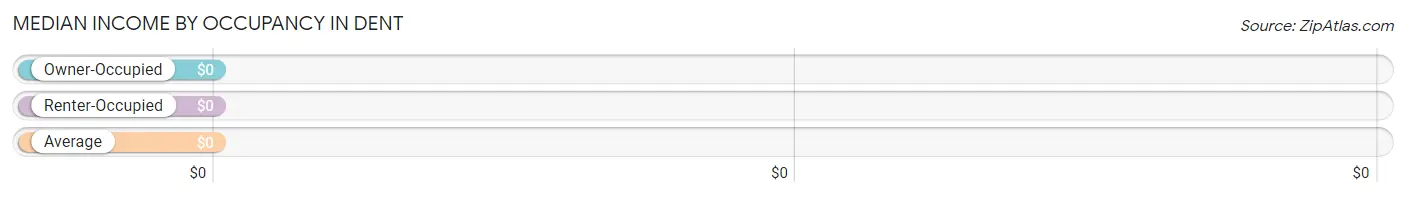
| Occupancy Type | # Households | Median Income |
| Owner-Occupied | 84 (80.8%) | $0 |
| Renter-Occupied | 20 (19.2%) | $0 |
| Average | 104 (100.0%) | $0 |
Occupancy by Householder Income Bracket in Dent
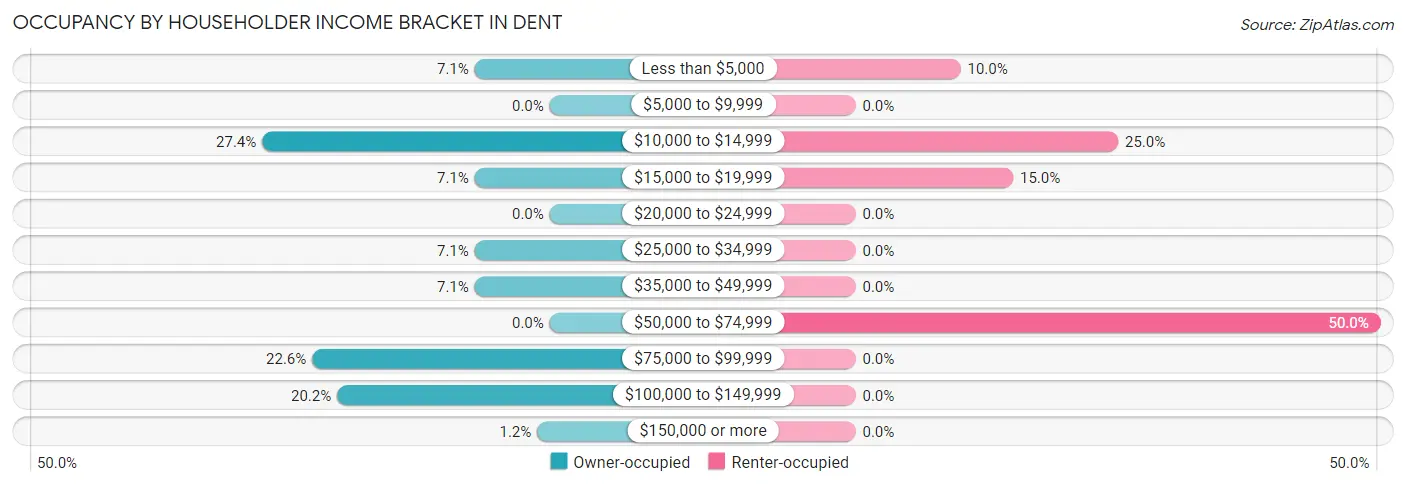
| Income Bracket | Owner-occupied | Renter-occupied |
| Less than $5,000 | 6 (7.1%) | 2 (10.0%) |
| $5,000 to $9,999 | 0 (0.0%) | 0 (0.0%) |
| $10,000 to $14,999 | 23 (27.4%) | 5 (25.0%) |
| $15,000 to $19,999 | 6 (7.1%) | 3 (15.0%) |
| $20,000 to $24,999 | 0 (0.0%) | 0 (0.0%) |
| $25,000 to $34,999 | 6 (7.1%) | 0 (0.0%) |
| $35,000 to $49,999 | 6 (7.1%) | 0 (0.0%) |
| $50,000 to $74,999 | 0 (0.0%) | 10 (50.0%) |
| $75,000 to $99,999 | 19 (22.6%) | 0 (0.0%) |
| $100,000 to $149,999 | 17 (20.2%) | 0 (0.0%) |
| $150,000 or more | 1 (1.2%) | 0 (0.0%) |
| Total | 84 (100.0%) | 20 (100.0%) |
Monthly Housing Cost Tiers in Dent
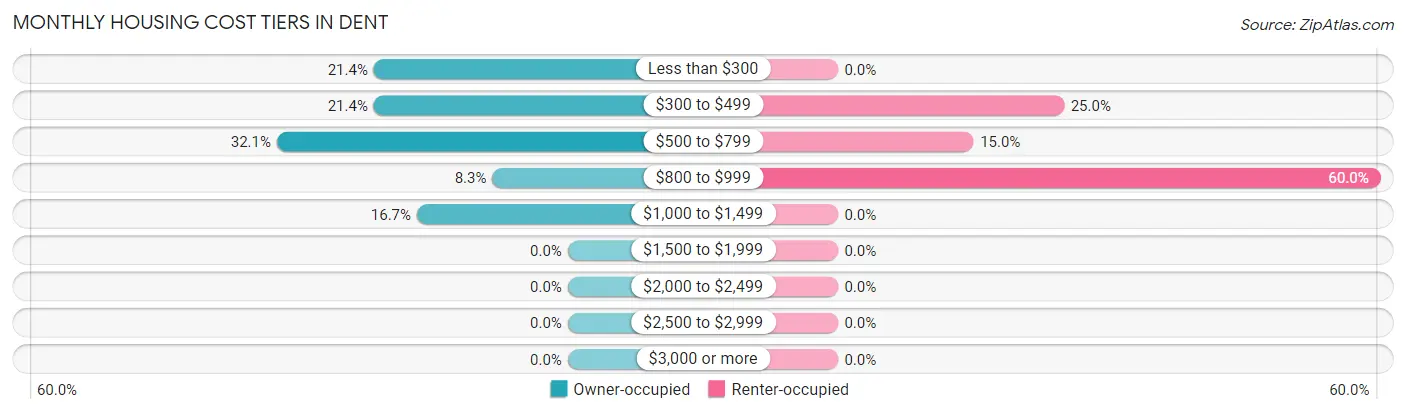
| Monthly Cost | Owner-occupied | Renter-occupied |
| Less than $300 | 18 (21.4%) | 0 (0.0%) |
| $300 to $499 | 18 (21.4%) | 5 (25.0%) |
| $500 to $799 | 27 (32.1%) | 3 (15.0%) |
| $800 to $999 | 7 (8.3%) | 12 (60.0%) |
| $1,000 to $1,499 | 14 (16.7%) | 0 (0.0%) |
| $1,500 to $1,999 | 0 (0.0%) | 0 (0.0%) |
| $2,000 to $2,499 | 0 (0.0%) | 0 (0.0%) |
| $2,500 to $2,999 | 0 (0.0%) | 0 (0.0%) |
| $3,000 or more | 0 (0.0%) | 0 (0.0%) |
| Total | 84 (100.0%) | 20 (100.0%) |
Physical Housing Characteristics in Dent
Housing Structures in Dent
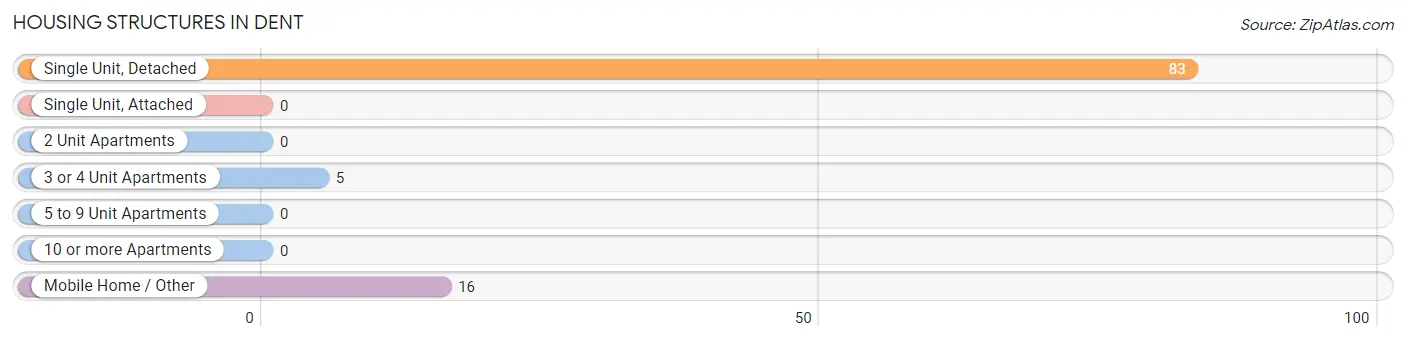
| Structure Type | # Housing Units | % Housing Units |
| Single Unit, Detached | 83 | 79.8% |
| Single Unit, Attached | 0 | 0.0% |
| 2 Unit Apartments | 0 | 0.0% |
| 3 or 4 Unit Apartments | 5 | 4.8% |
| 5 to 9 Unit Apartments | 0 | 0.0% |
| 10 or more Apartments | 0 | 0.0% |
| Mobile Home / Other | 16 | 15.4% |
| Total | 104 | 100.0% |
Housing Structures by Occupancy in Dent
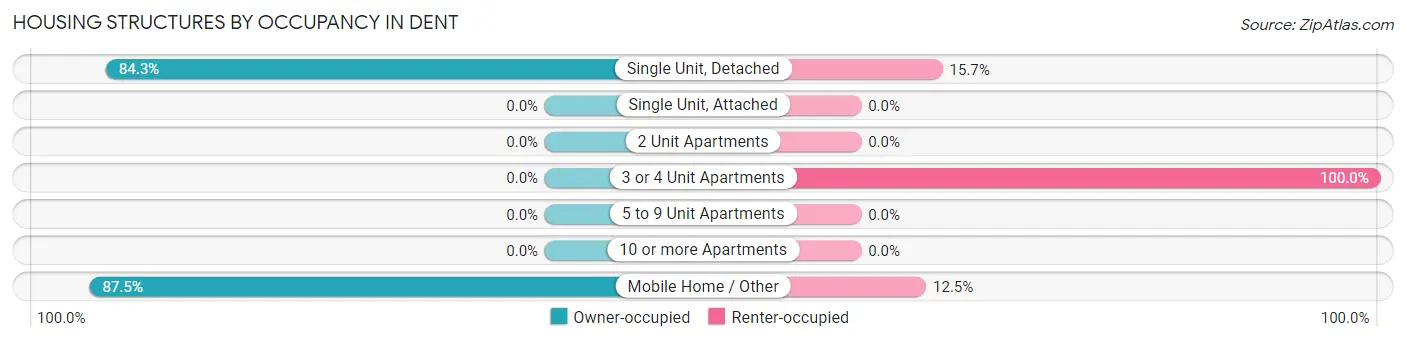
| Structure Type | Owner-occupied | Renter-occupied |
| Single Unit, Detached | 70 (84.3%) | 13 (15.7%) |
| Single Unit, Attached | 0 (0.0%) | 0 (0.0%) |
| 2 Unit Apartments | 0 (0.0%) | 0 (0.0%) |
| 3 or 4 Unit Apartments | 0 (0.0%) | 5 (100.0%) |
| 5 to 9 Unit Apartments | 0 (0.0%) | 0 (0.0%) |
| 10 or more Apartments | 0 (0.0%) | 0 (0.0%) |
| Mobile Home / Other | 14 (87.5%) | 2 (12.5%) |
| Total | 84 (80.8%) | 20 (19.2%) |
Housing Structures by Number of Rooms in Dent
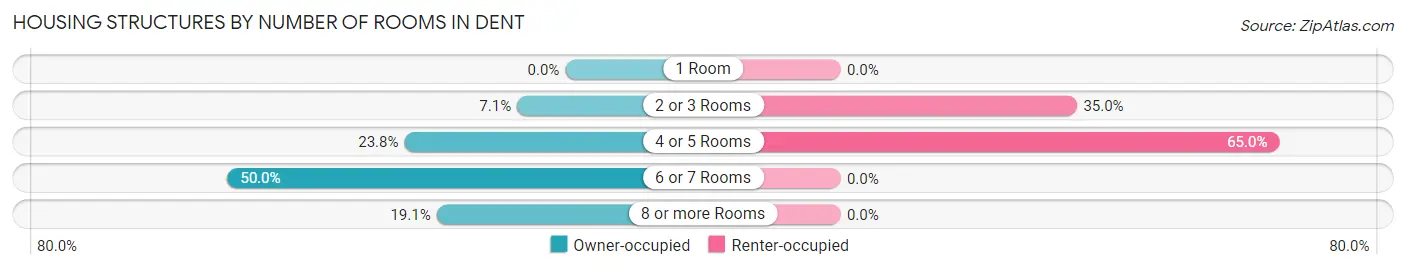
| Number of Rooms | Owner-occupied | Renter-occupied |
| 1 Room | 0 (0.0%) | 0 (0.0%) |
| 2 or 3 Rooms | 6 (7.1%) | 7 (35.0%) |
| 4 or 5 Rooms | 20 (23.8%) | 13 (65.0%) |
| 6 or 7 Rooms | 42 (50.0%) | 0 (0.0%) |
| 8 or more Rooms | 16 (19.1%) | 0 (0.0%) |
| Total | 84 (100.0%) | 20 (100.0%) |
Housing Structure by Heating Type in Dent
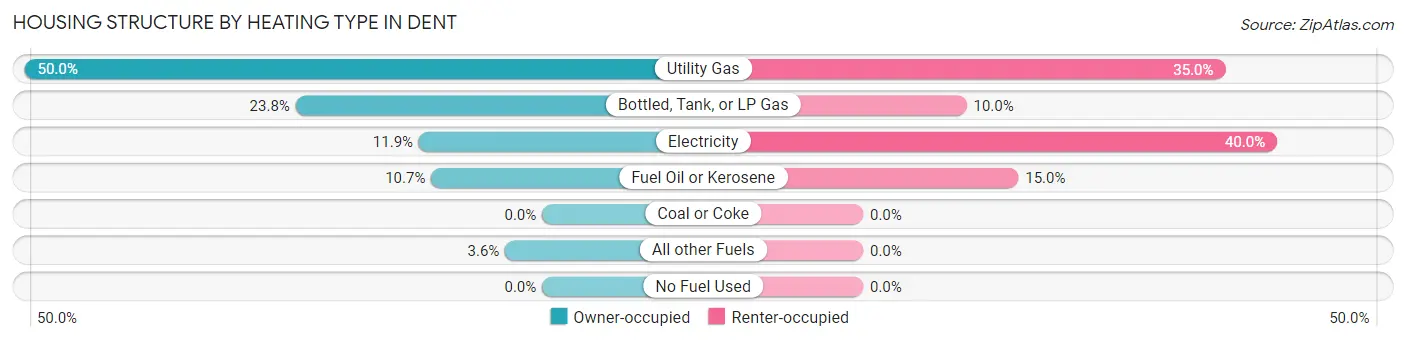
| Heating Type | Owner-occupied | Renter-occupied |
| Utility Gas | 42 (50.0%) | 7 (35.0%) |
| Bottled, Tank, or LP Gas | 20 (23.8%) | 2 (10.0%) |
| Electricity | 10 (11.9%) | 8 (40.0%) |
| Fuel Oil or Kerosene | 9 (10.7%) | 3 (15.0%) |
| Coal or Coke | 0 (0.0%) | 0 (0.0%) |
| All other Fuels | 3 (3.6%) | 0 (0.0%) |
| No Fuel Used | 0 (0.0%) | 0 (0.0%) |
| Total | 84 (100.0%) | 20 (100.0%) |
Household Vehicle Usage in Dent
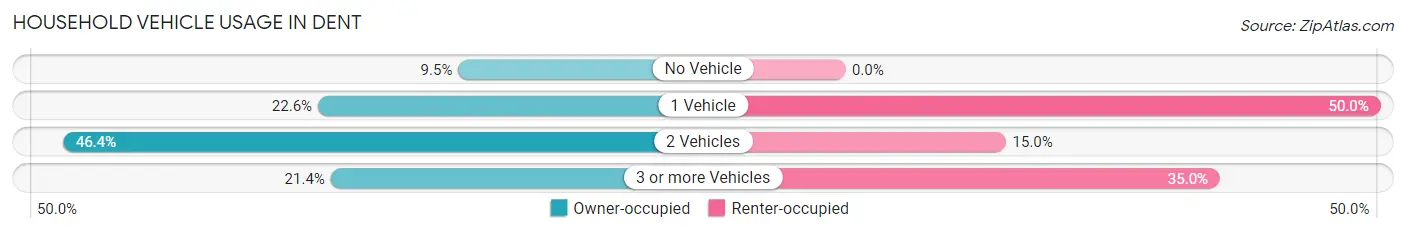
| Vehicles per Household | Owner-occupied | Renter-occupied |
| No Vehicle | 8 (9.5%) | 0 (0.0%) |
| 1 Vehicle | 19 (22.6%) | 10 (50.0%) |
| 2 Vehicles | 39 (46.4%) | 3 (15.0%) |
| 3 or more Vehicles | 18 (21.4%) | 7 (35.0%) |
| Total | 84 (100.0%) | 20 (100.0%) |
Real Estate & Mortgages in Dent
Real Estate and Mortgage Overview in Dent
| Characteristic | Without Mortgage | With Mortgage |
| Housing Units | 44 | 40 |
| Median Property Value | - | - |
| Median Household Income | $11,905 | $1 |
| Monthly Housing Costs | $318 | $0 |
| Real Estate Taxes | $700 | $0 |
Property Value by Mortgage Status in Dent
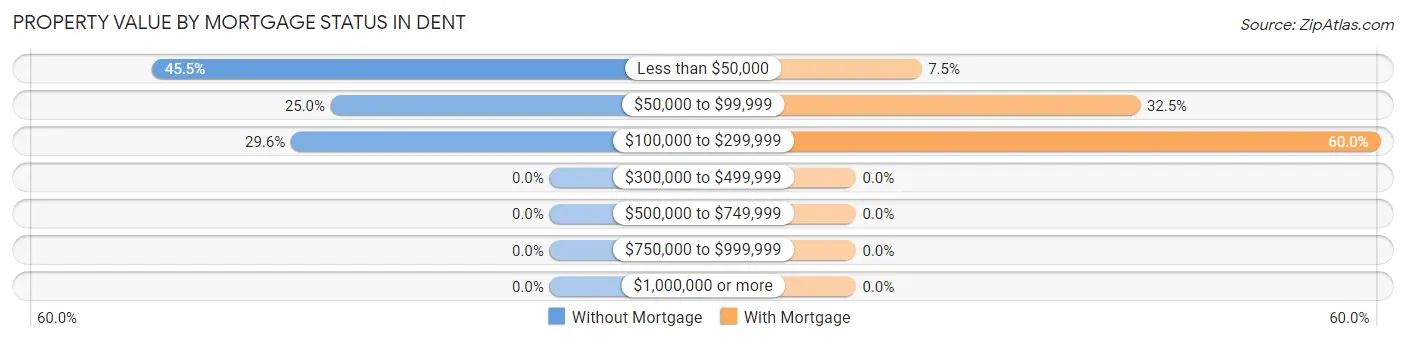
| Property Value | Without Mortgage | With Mortgage |
| Less than $50,000 | 20 (45.5%) | 3 (7.5%) |
| $50,000 to $99,999 | 11 (25.0%) | 13 (32.5%) |
| $100,000 to $299,999 | 13 (29.5%) | 24 (60.0%) |
| $300,000 to $499,999 | 0 (0.0%) | 0 (0.0%) |
| $500,000 to $749,999 | 0 (0.0%) | 0 (0.0%) |
| $750,000 to $999,999 | 0 (0.0%) | 0 (0.0%) |
| $1,000,000 or more | 0 (0.0%) | 0 (0.0%) |
| Total | 44 (100.0%) | 40 (100.0%) |
Household Income by Mortgage Status in Dent
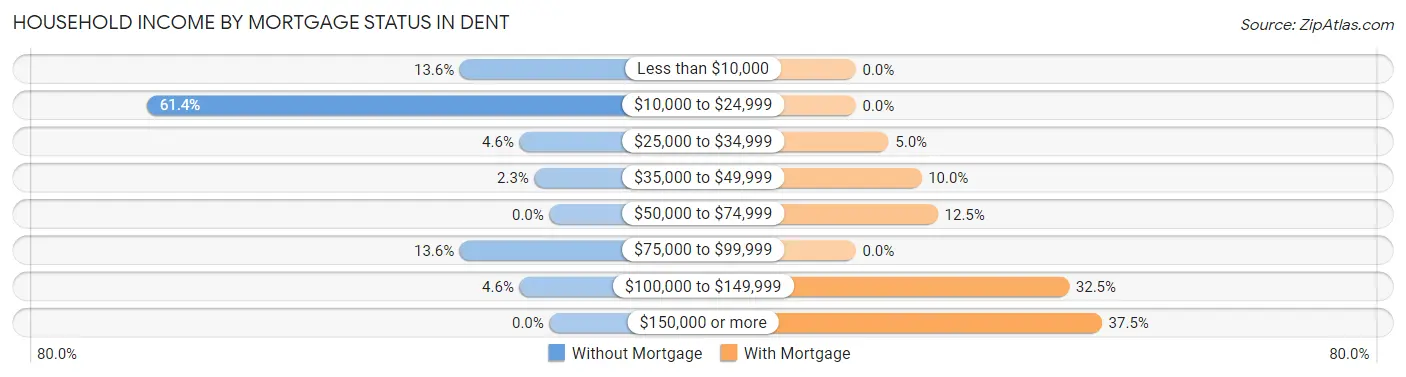
| Household Income | Without Mortgage | With Mortgage |
| Less than $10,000 | 6 (13.6%) | 0 (0.0%) |
| $10,000 to $24,999 | 27 (61.4%) | 0 (0.0%) |
| $25,000 to $34,999 | 2 (4.5%) | 2 (5.0%) |
| $35,000 to $49,999 | 1 (2.3%) | 4 (10.0%) |
| $50,000 to $74,999 | 0 (0.0%) | 5 (12.5%) |
| $75,000 to $99,999 | 6 (13.6%) | 0 (0.0%) |
| $100,000 to $149,999 | 2 (4.5%) | 13 (32.5%) |
| $150,000 or more | 0 (0.0%) | 15 (37.5%) |
| Total | 44 (100.0%) | 40 (100.0%) |
Property Value to Household Income Ratio in Dent
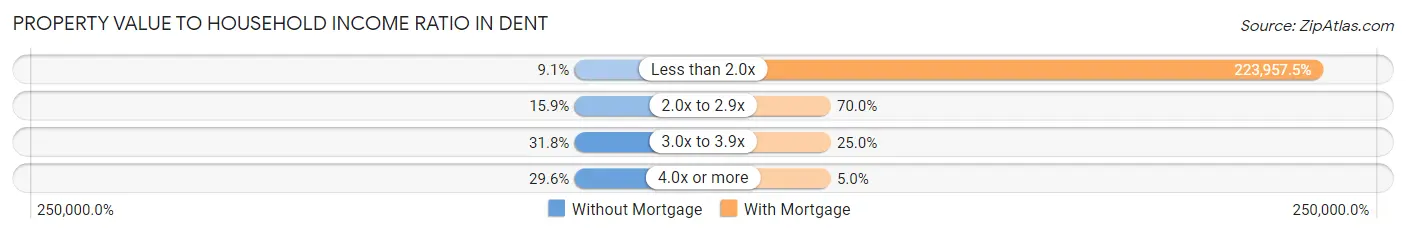
| Value-to-Income Ratio | Without Mortgage | With Mortgage |
| Less than 2.0x | 4 (9.1%) | 89,583 (223,957.5%) |
| 2.0x to 2.9x | 7 (15.9%) | 28 (70.0%) |
| 3.0x to 3.9x | 14 (31.8%) | 10 (25.0%) |
| 4.0x or more | 13 (29.5%) | 2 (5.0%) |
| Total | 44 (100.0%) | 40 (100.0%) |
Real Estate Taxes by Mortgage Status in Dent
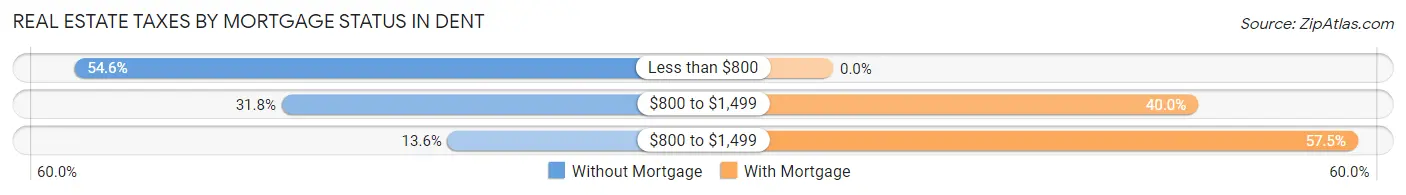
| Property Taxes | Without Mortgage | With Mortgage |
| Less than $800 | 24 (54.5%) | 0 (0.0%) |
| $800 to $1,499 | 14 (31.8%) | 16 (40.0%) |
| $800 to $1,499 | 6 (13.6%) | 23 (57.5%) |
| Total | 44 (100.0%) | 40 (100.0%) |
Health & Disability in Dent
Health Insurance Coverage by Age in Dent
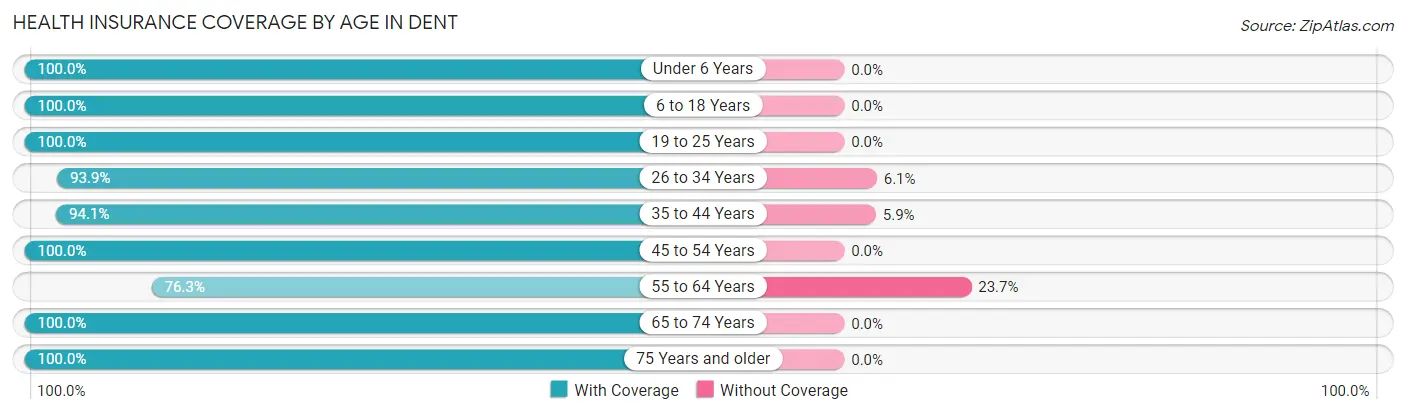
| Age Bracket | With Coverage | Without Coverage |
| Under 6 Years | 9 (100.0%) | 0 (0.0%) |
| 6 to 18 Years | 67 (100.0%) | 0 (0.0%) |
| 19 to 25 Years | 26 (100.0%) | 0 (0.0%) |
| 26 to 34 Years | 31 (93.9%) | 2 (6.1%) |
| 35 to 44 Years | 32 (94.1%) | 2 (5.9%) |
| 45 to 54 Years | 12 (100.0%) | 0 (0.0%) |
| 55 to 64 Years | 29 (76.3%) | 9 (23.7%) |
| 65 to 74 Years | 14 (100.0%) | 0 (0.0%) |
| 75 Years and older | 11 (100.0%) | 0 (0.0%) |
| Total | 231 (94.7%) | 13 (5.3%) |
Health Insurance Coverage by Citizenship Status in Dent
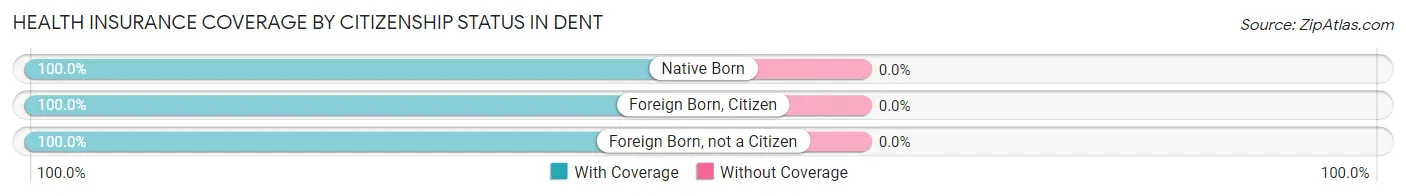
| Citizenship Status | With Coverage | Without Coverage |
| Native Born | 9 (100.0%) | 0 (0.0%) |
| Foreign Born, Citizen | 67 (100.0%) | 0 (0.0%) |
| Foreign Born, not a Citizen | 26 (100.0%) | 0 (0.0%) |
Health Insurance Coverage by Household Income in Dent
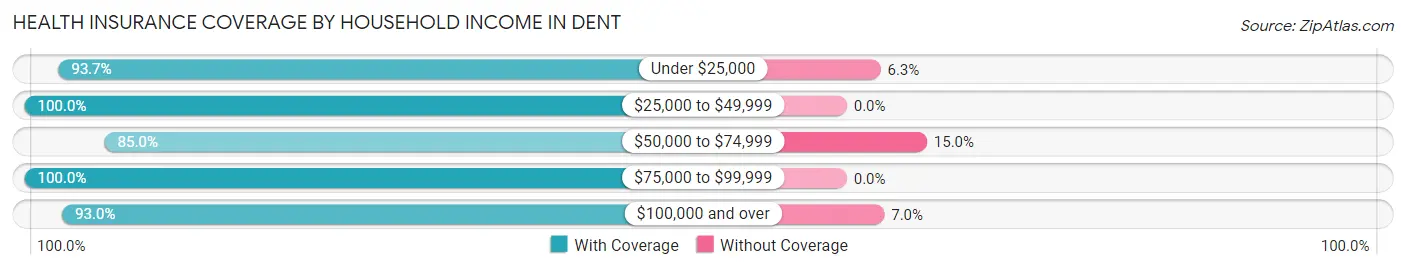
| Household Income | With Coverage | Without Coverage |
| Under $25,000 | 89 (93.7%) | 6 (6.3%) |
| $25,000 to $49,999 | 31 (100.0%) | 0 (0.0%) |
| $50,000 to $74,999 | 17 (85.0%) | 3 (15.0%) |
| $75,000 to $99,999 | 41 (100.0%) | 0 (0.0%) |
| $100,000 and over | 53 (93.0%) | 4 (7.0%) |
Public vs Private Health Insurance Coverage by Age in Dent
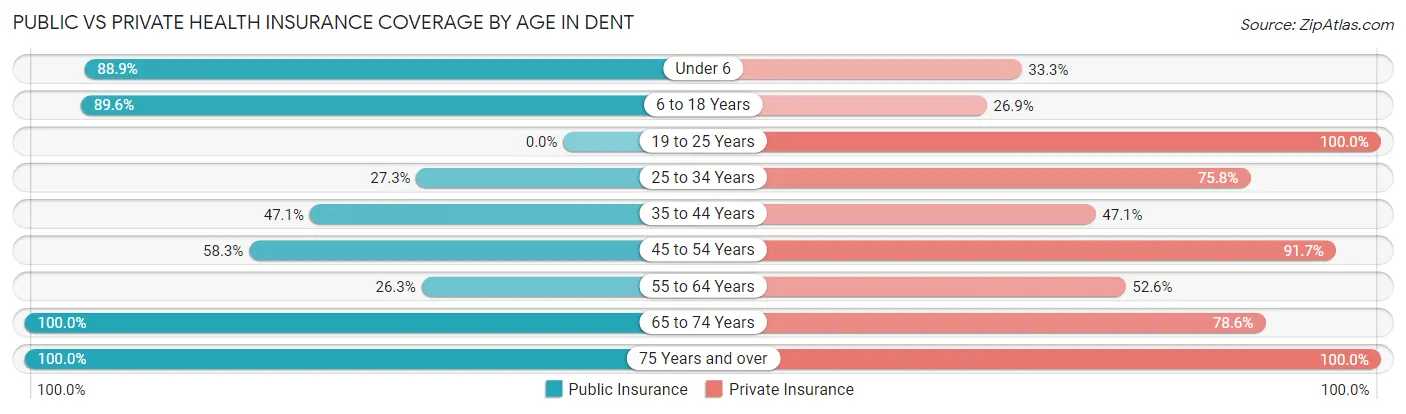
| Age Bracket | Public Insurance | Private Insurance |
| Under 6 | 8 (88.9%) | 3 (33.3%) |
| 6 to 18 Years | 60 (89.5%) | 18 (26.9%) |
| 19 to 25 Years | 0 (0.0%) | 26 (100.0%) |
| 25 to 34 Years | 9 (27.3%) | 25 (75.8%) |
| 35 to 44 Years | 16 (47.1%) | 16 (47.1%) |
| 45 to 54 Years | 7 (58.3%) | 11 (91.7%) |
| 55 to 64 Years | 10 (26.3%) | 20 (52.6%) |
| 65 to 74 Years | 14 (100.0%) | 11 (78.6%) |
| 75 Years and over | 11 (100.0%) | 11 (100.0%) |
| Total | 135 (55.3%) | 141 (57.8%) |
Disability Status by Sex by Age in Dent
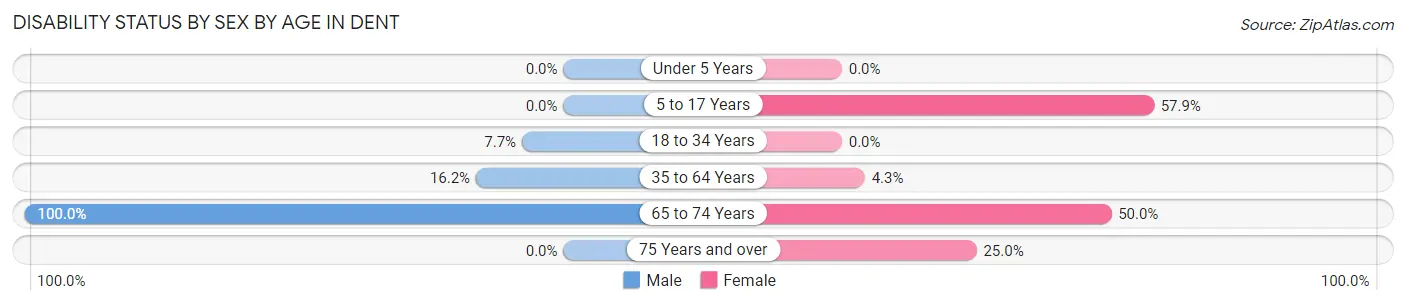
| Age Bracket | Male | Female |
| Under 5 Years | 0 (0.0%) | 0 (0.0%) |
| 5 to 17 Years | 0 (0.0%) | 11 (57.9%) |
| 18 to 34 Years | 2 (7.7%) | 0 (0.0%) |
| 35 to 64 Years | 6 (16.2%) | 2 (4.3%) |
| 65 to 74 Years | 4 (100.0%) | 5 (50.0%) |
| 75 Years and over | 0 (0.0%) | 2 (25.0%) |
Disability Class by Sex by Age in Dent
Disability Class: Hearing Difficulty
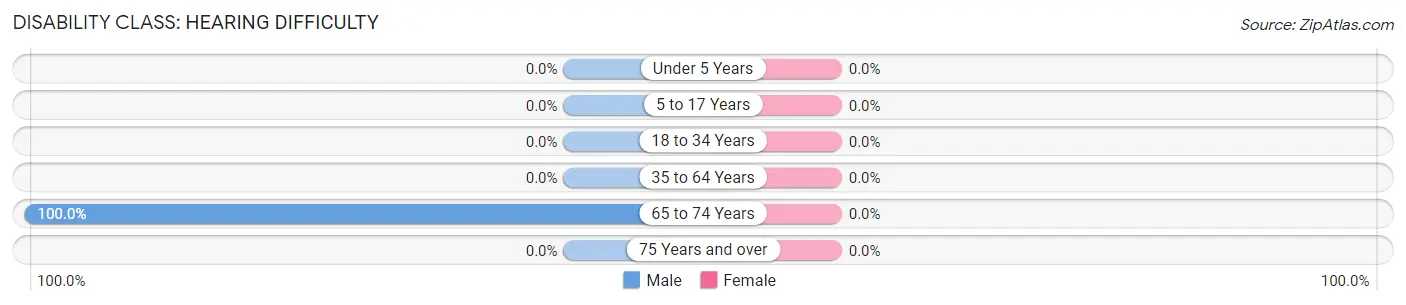
| Age Bracket | Male | Female |
| Under 5 Years | 0 (0.0%) | 0 (0.0%) |
| 5 to 17 Years | 0 (0.0%) | 0 (0.0%) |
| 18 to 34 Years | 0 (0.0%) | 0 (0.0%) |
| 35 to 64 Years | 0 (0.0%) | 0 (0.0%) |
| 65 to 74 Years | 4 (100.0%) | 0 (0.0%) |
| 75 Years and over | 0 (0.0%) | 0 (0.0%) |
Disability Class: Vision Difficulty
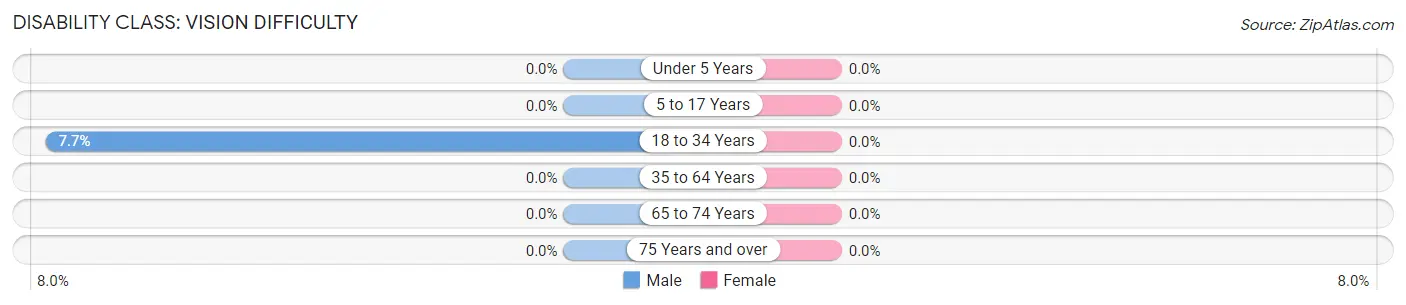
| Age Bracket | Male | Female |
| Under 5 Years | 0 (0.0%) | 0 (0.0%) |
| 5 to 17 Years | 0 (0.0%) | 0 (0.0%) |
| 18 to 34 Years | 2 (7.7%) | 0 (0.0%) |
| 35 to 64 Years | 0 (0.0%) | 0 (0.0%) |
| 65 to 74 Years | 0 (0.0%) | 0 (0.0%) |
| 75 Years and over | 0 (0.0%) | 0 (0.0%) |
Disability Class: Cognitive Difficulty
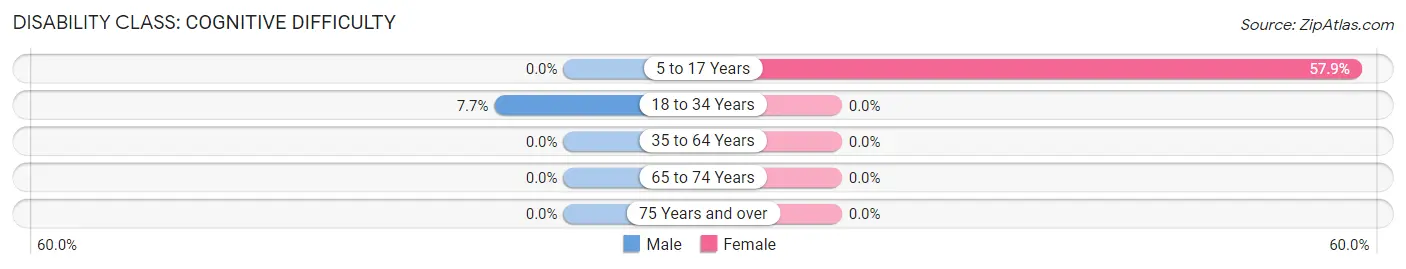
| Age Bracket | Male | Female |
| 5 to 17 Years | 0 (0.0%) | 11 (57.9%) |
| 18 to 34 Years | 2 (7.7%) | 0 (0.0%) |
| 35 to 64 Years | 0 (0.0%) | 0 (0.0%) |
| 65 to 74 Years | 0 (0.0%) | 0 (0.0%) |
| 75 Years and over | 0 (0.0%) | 0 (0.0%) |
Disability Class: Ambulatory Difficulty
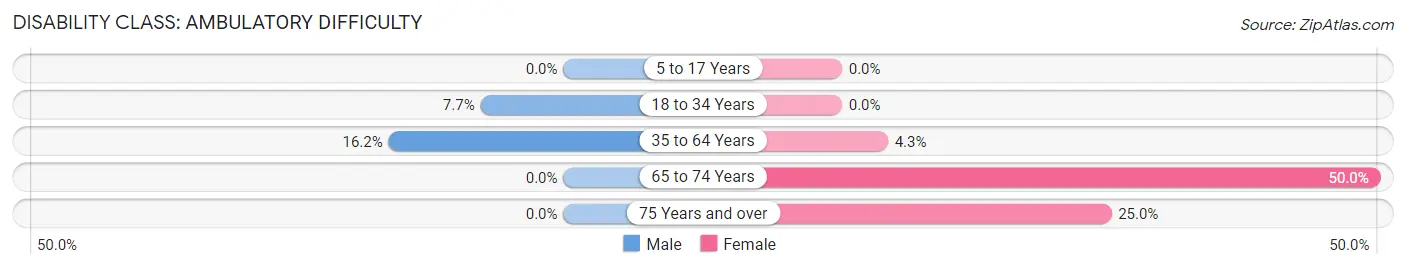
| Age Bracket | Male | Female |
| 5 to 17 Years | 0 (0.0%) | 0 (0.0%) |
| 18 to 34 Years | 2 (7.7%) | 0 (0.0%) |
| 35 to 64 Years | 6 (16.2%) | 2 (4.3%) |
| 65 to 74 Years | 0 (0.0%) | 5 (50.0%) |
| 75 Years and over | 0 (0.0%) | 2 (25.0%) |
Disability Class: Self-Care Difficulty
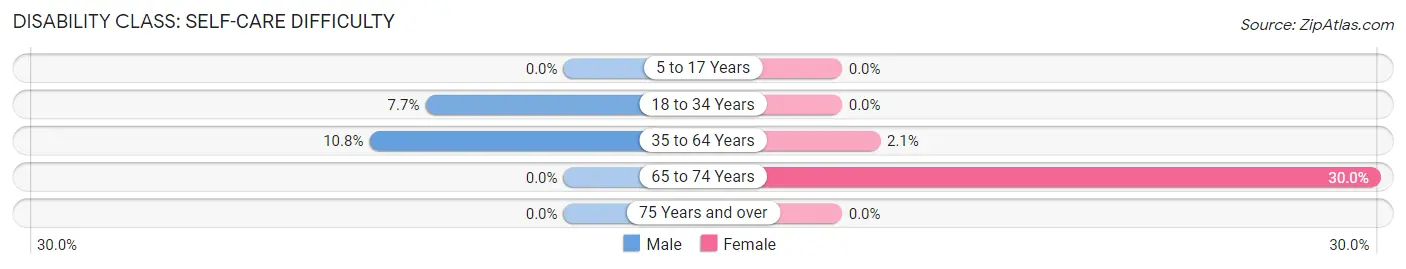
| Age Bracket | Male | Female |
| 5 to 17 Years | 0 (0.0%) | 0 (0.0%) |
| 18 to 34 Years | 2 (7.7%) | 0 (0.0%) |
| 35 to 64 Years | 4 (10.8%) | 1 (2.1%) |
| 65 to 74 Years | 0 (0.0%) | 3 (30.0%) |
| 75 Years and over | 0 (0.0%) | 0 (0.0%) |
Technology Access in Dent
Computing Device Access in Dent
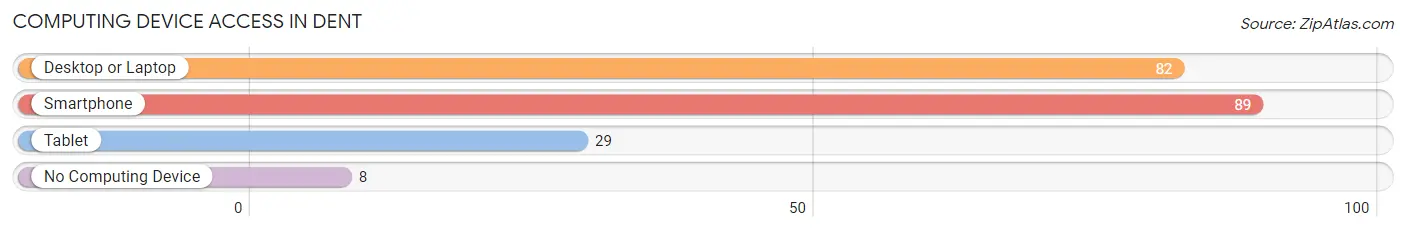
| Device Type | # Households | % Households |
| Desktop or Laptop | 82 | 78.8% |
| Smartphone | 89 | 85.6% |
| Tablet | 29 | 27.9% |
| No Computing Device | 8 | 7.7% |
| Total | 104 | 100.0% |
Internet Access in Dent
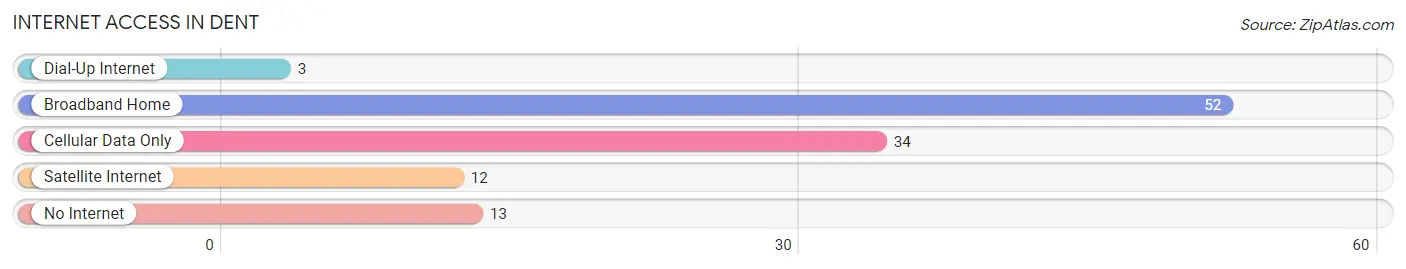
| Internet Type | # Households | % Households |
| Dial-Up Internet | 3 | 2.9% |
| Broadband Home | 52 | 50.0% |
| Cellular Data Only | 34 | 32.7% |
| Satellite Internet | 12 | 11.5% |
| No Internet | 13 | 12.5% |
| Total | 104 | 100.0% |
Dent Summary
Dent is a small city located in Otter Tail County, Minnesota. It is situated on the western edge of the state, near the border with North Dakota. The city has a population of approximately 1,000 people and is part of the Fergus Falls Metropolitan Statistical Area.
History
Dent was founded in 1881 by a group of settlers from Norway. The city was named after a Norwegian immigrant, Ole J. Dent, who was one of the first settlers in the area. The city was incorporated in 1883 and has remained a small, rural community ever since.
The city was originally a farming community, with many of the settlers growing wheat, oats, and barley. In the early 1900s, the city began to diversify its economy, with the establishment of a creamery, a flour mill, and a lumber mill.
Geography
Dent is located in the western part of Minnesota, near the border with North Dakota. The city is situated on the banks of the Otter Tail River, which flows through the city. The city is surrounded by rolling hills and farmland, and is located about 25 miles from the nearest major city, Fergus Falls.
The climate in Dent is typical of the Midwest, with cold winters and hot summers. The average temperature in the winter is around 20 degrees Fahrenheit, while the average temperature in the summer is around 70 degrees Fahrenheit.
Economy
Dent’s economy is largely based on agriculture and tourism. The city is home to several farms, which produce a variety of crops, including wheat, oats, barley, and hay. The city also has a number of small businesses, including restaurants, retail stores, and service providers.
The city is also a popular tourist destination, with many visitors coming to enjoy the city’s natural beauty and outdoor activities. The city is home to several parks, including the Otter Tail River State Park, which offers camping, fishing, and hiking opportunities.
Demographics
As of the 2010 census, the population of Dent was 1,000 people. The racial makeup of the city was 97.2% White, 0.7% African American, 0.3% Native American, 0.2% Asian, 0.1% Pacific Islander, and 1.5% from other races. The median household income in the city was $41,250, and the median age was 43.7 years.
Conclusion
Dent is a small city located in Otter Tail County, Minnesota. It was founded in 1881 by a group of settlers from Norway and has remained a small, rural community ever since. The city’s economy is largely based on agriculture and tourism, and it is a popular tourist destination due to its natural beauty and outdoor activities. The population of Dent is 1,000 people, with a median household income of $41,250 and a median age of 43.7 years.
Common Questions
What is Per Capita Income in Dent?
Per Capita income in Dent is $21,311.
What is Income or Wage Gap in Dent?
Income or Wage Gap in Dent is 56.7%.
Women in Dent earn 43.3 cents for every dollar earned by a man.
What is Inequality or Gini Index in Dent?
Inequality or Gini Index in Dent is 0.46.
What is the Total Population of Dent?
Total Population of Dent is 244.
What is the Total Male Population of Dent?
Total Male Population of Dent is 126.
What is the Total Female Population of Dent?
Total Female Population of Dent is 118.
What is the Ratio of Males per 100 Females in Dent?
There are 106.78 Males per 100 Females in Dent.
What is the Ratio of Females per 100 Males in Dent?
There are 93.65 Females per 100 Males in Dent.
What is the Median Population Age in Dent?
Median Population Age in Dent is 31.5 Years.
What is the Average Family Size in Dent
Average Family Size in Dent is 3.3 People.
What is the Average Household Size in Dent
Average Household Size in Dent is 2.4 People.
How Large is the Labor Force in Dent?
There are 121 People in the Labor Forcein in Dent.
What is the Percentage of People in the Labor Force in Dent?
71.2% of People are in the Labor Force in Dent.
What is the Unemployment Rate in Dent?
Unemployment Rate in Dent is 6.6%.