Danube, MN Map & Demographics
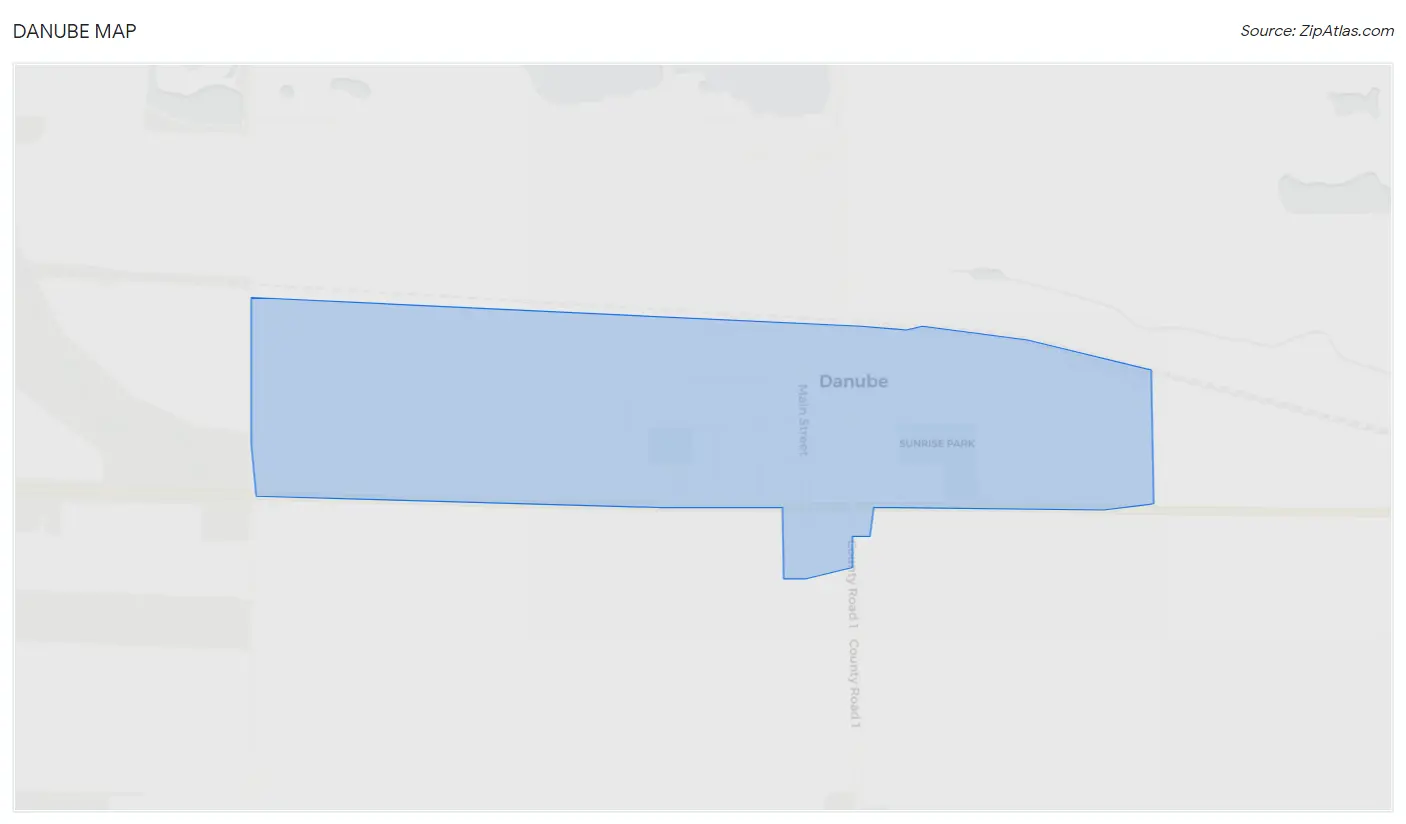
Danube Map
Danube Overview
$32,291
PER CAPITA INCOME
$67,500
AVG FAMILY INCOME
$57,083
AVG HOUSEHOLD INCOME
49.7%
WAGE / INCOME GAP [ % ]
50.3¢/ $1
WAGE / INCOME GAP [ $ ]
0.42
INEQUALITY / GINI INDEX
458
TOTAL POPULATION
249
MALE POPULATION
209
FEMALE POPULATION
119.14
MALES / 100 FEMALES
83.94
FEMALES / 100 MALES
36.0
MEDIAN AGE
3.1
AVG FAMILY SIZE
2.3
AVG HOUSEHOLD SIZE
224
LABOR FORCE [ PEOPLE ]
64.0%
PERCENT IN LABOR FORCE
0.4%
UNEMPLOYMENT RATE
Danube Zip Codes
Danube Area Codes
Income in Danube
Income Overview in Danube
Per Capita Income in Danube is $32,291, while median incomes of families and households are $67,500 and $57,083 respectively.
| Characteristic | Number | Measure |
| Per Capita Income | 458 | $32,291 |
| Median Family Income | 110 | $67,500 |
| Mean Family Income | 110 | $91,896 |
| Median Household Income | 197 | $57,083 |
| Mean Household Income | 197 | $71,000 |
| Income Deficit | 110 | $0 |
| Wage / Income Gap (%) | 458 | 49.70% |
| Wage / Income Gap ($) | 458 | 50.30¢ per $1 |
| Gini / Inequality Index | 458 | 0.42 |
Earnings by Sex in Danube
Average Earnings in Danube are $39,231, $57,566 for men and $28,958 for women, a difference of 49.7%.
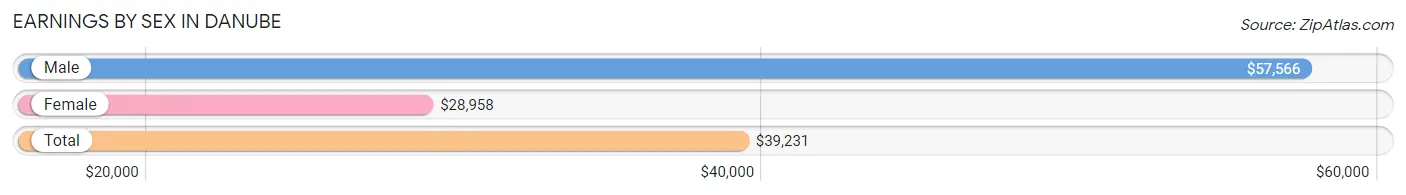
| Sex | Number | Average Earnings |
| Male | 139 (56.5%) | $57,566 |
| Female | 107 (43.5%) | $28,958 |
| Total | 246 (100.0%) | $39,231 |
Earnings by Sex by Income Bracket in Danube
The most common earnings brackets in Danube are $55,000 to $64,999 for men (29 | 20.9%) and $10,000 to $12,499 for women (14 | 13.1%).
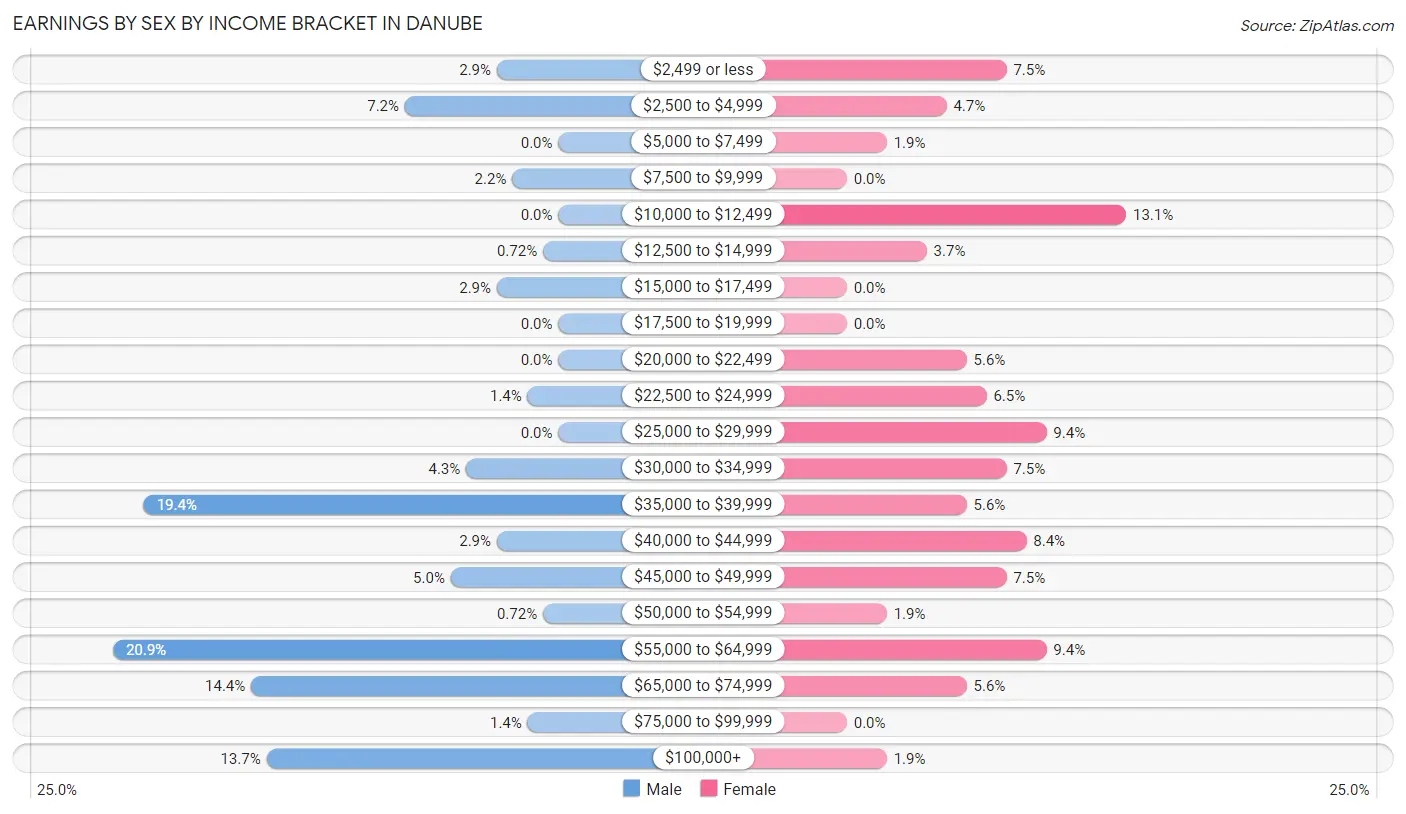
| Income | Male | Female |
| $2,499 or less | 4 (2.9%) | 8 (7.5%) |
| $2,500 to $4,999 | 10 (7.2%) | 5 (4.7%) |
| $5,000 to $7,499 | 0 (0.0%) | 2 (1.9%) |
| $7,500 to $9,999 | 3 (2.2%) | 0 (0.0%) |
| $10,000 to $12,499 | 0 (0.0%) | 14 (13.1%) |
| $12,500 to $14,999 | 1 (0.7%) | 4 (3.7%) |
| $15,000 to $17,499 | 4 (2.9%) | 0 (0.0%) |
| $17,500 to $19,999 | 0 (0.0%) | 0 (0.0%) |
| $20,000 to $22,499 | 0 (0.0%) | 6 (5.6%) |
| $22,500 to $24,999 | 2 (1.4%) | 7 (6.5%) |
| $25,000 to $29,999 | 0 (0.0%) | 10 (9.3%) |
| $30,000 to $34,999 | 6 (4.3%) | 8 (7.5%) |
| $35,000 to $39,999 | 27 (19.4%) | 6 (5.6%) |
| $40,000 to $44,999 | 4 (2.9%) | 9 (8.4%) |
| $45,000 to $49,999 | 7 (5.0%) | 8 (7.5%) |
| $50,000 to $54,999 | 1 (0.7%) | 2 (1.9%) |
| $55,000 to $64,999 | 29 (20.9%) | 10 (9.3%) |
| $65,000 to $74,999 | 20 (14.4%) | 6 (5.6%) |
| $75,000 to $99,999 | 2 (1.4%) | 0 (0.0%) |
| $100,000+ | 19 (13.7%) | 2 (1.9%) |
| Total | 139 (100.0%) | 107 (100.0%) |
Earnings by Sex by Educational Attainment in Danube
Average earnings in Danube are $59,271 for men and $29,583 for women, a difference of 50.1%. Men with an educational attainment of college or associate's degree enjoy the highest average annual earnings of $61,250, while those with less than high school education earn the least with $43,125. Women with an educational attainment of graduate degree earn the most with the average annual earnings of $71,500, while those with college or associate's degree education have the smallest earnings of $28,750.
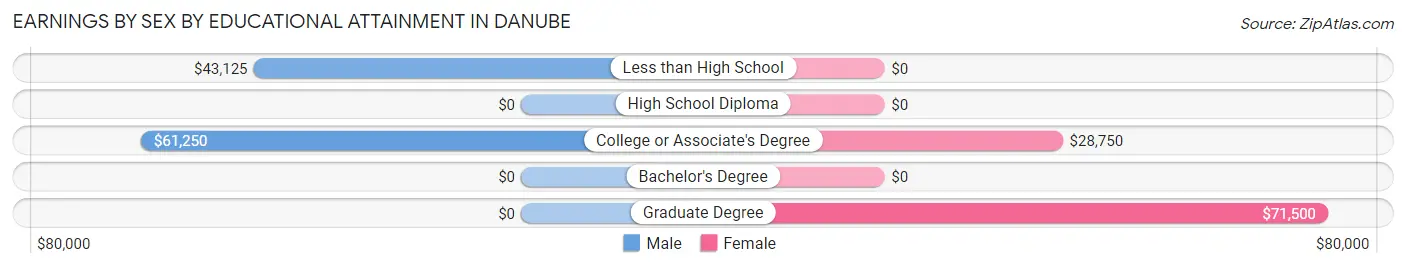
| Educational Attainment | Male Income | Female Income |
| Less than High School | $43,125 | $0 |
| High School Diploma | - | - |
| College or Associate's Degree | $61,250 | $28,750 |
| Bachelor's Degree | - | - |
| Graduate Degree | - | - |
| Total | $59,271 | $29,583 |
Family Income in Danube
Family Income Brackets in Danube
According to the Danube family income data, there are 30 families falling into the $35,000 to $49,999 income range, which is the most common income bracket and makes up 27.3% of all families.
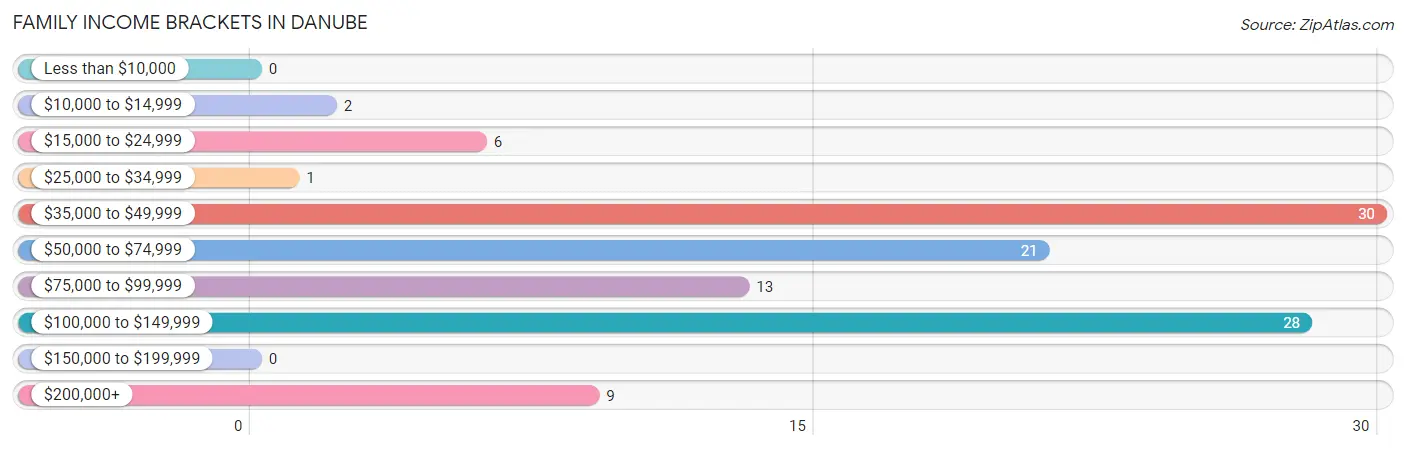
| Income Bracket | # Families | % Families |
| Less than $10,000 | 0 | 0.0% |
| $10,000 to $14,999 | 2 | 1.8% |
| $15,000 to $24,999 | 6 | 5.5% |
| $25,000 to $34,999 | 1 | 0.9% |
| $35,000 to $49,999 | 30 | 27.3% |
| $50,000 to $74,999 | 21 | 19.1% |
| $75,000 to $99,999 | 13 | 11.8% |
| $100,000 to $149,999 | 28 | 25.5% |
| $150,000 to $199,999 | 0 | 0.0% |
| $200,000+ | 9 | 8.2% |
Family Income by Famaliy Size in Danube
5-person families (13 | 11.8%) account for the highest median family income in Danube with $118,393 per family, while 3-person families (9 | 8.2%) have the highest median income of $30,208 per family member.
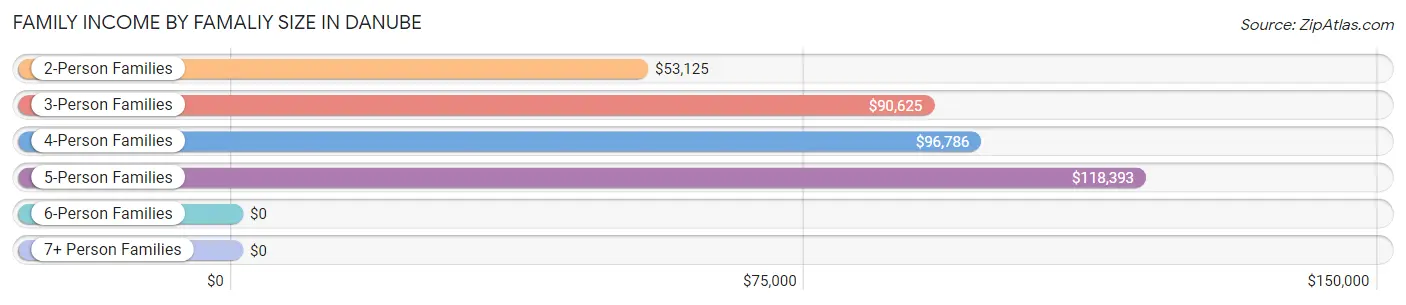
| Income Bracket | # Families | Median Income |
| 2-Person Families | 64 (58.2%) | $53,125 |
| 3-Person Families | 9 (8.2%) | $90,625 |
| 4-Person Families | 20 (18.2%) | $96,786 |
| 5-Person Families | 13 (11.8%) | $118,393 |
| 6-Person Families | 4 (3.6%) | $0 |
| 7+ Person Families | 0 (0.0%) | $0 |
| Total | 110 (100.0%) | $67,500 |
Family Income by Number of Earners in Danube
The median family income in Danube is $67,500, with families comprising 3+ earners (10) having the highest median family income of $116,875, while families with no earners (20) have the lowest median family income of $45,625, accounting for 9.1% and 18.2% of families, respectively.
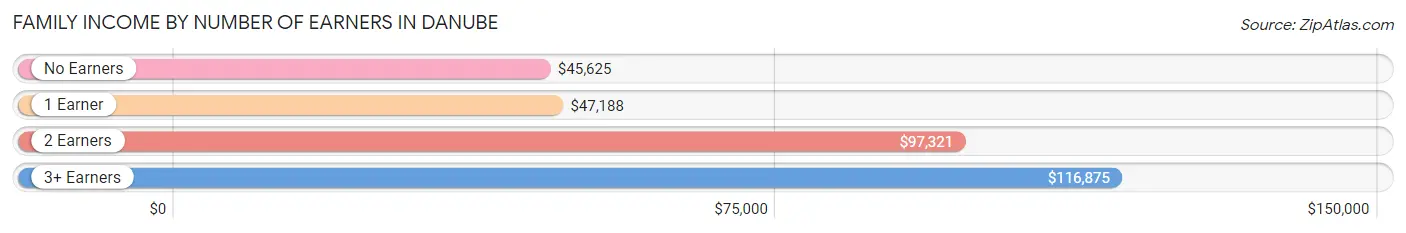
| Number of Earners | # Families | Median Income |
| No Earners | 20 (18.2%) | $45,625 |
| 1 Earner | 27 (24.5%) | $47,188 |
| 2 Earners | 53 (48.2%) | $97,321 |
| 3+ Earners | 10 (9.1%) | $116,875 |
| Total | 110 (100.0%) | $67,500 |
Household Income in Danube
Household Income Brackets in Danube
With 55 households falling in the category, the $50,000 to $74,999 income range is the most frequent in Danube, accounting for 27.9% of all households.
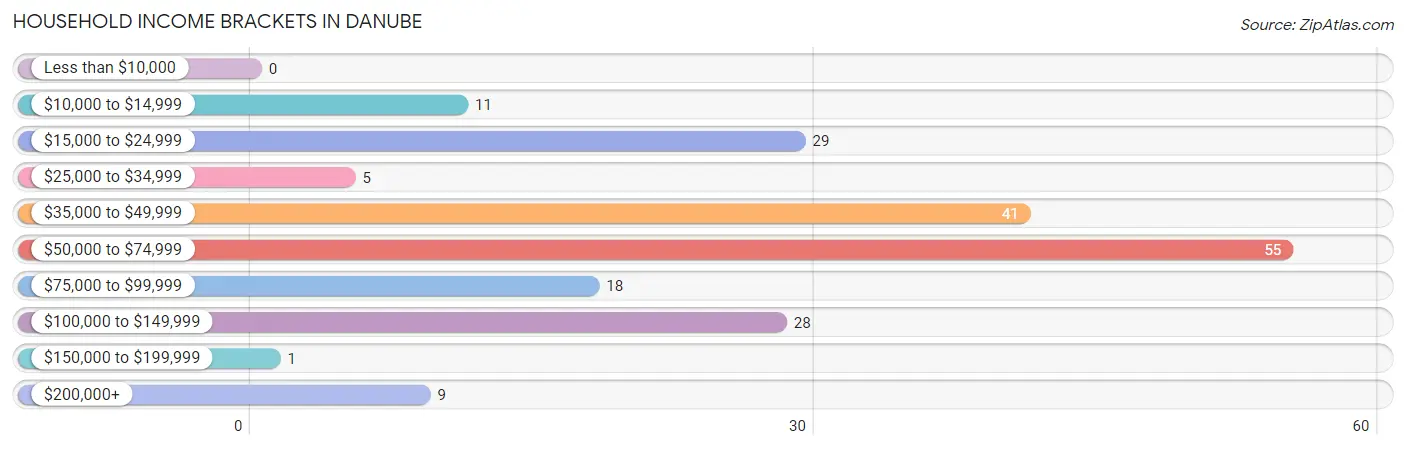
| Income Bracket | # Households | % Households |
| Less than $10,000 | 0 | 0.0% |
| $10,000 to $14,999 | 11 | 5.6% |
| $15,000 to $24,999 | 29 | 14.7% |
| $25,000 to $34,999 | 5 | 2.5% |
| $35,000 to $49,999 | 41 | 20.8% |
| $50,000 to $74,999 | 55 | 27.9% |
| $75,000 to $99,999 | 18 | 9.1% |
| $100,000 to $149,999 | 28 | 14.2% |
| $150,000 to $199,999 | 1 | 0.5% |
| $200,000+ | 9 | 4.6% |
Household Income by Householder Age in Danube
The median household income in Danube is $57,083, with the highest median household income of $62,143 found in the 25 to 44 years age bracket for the primary householder. A total of 60 households (30.5%) fall into this category. Meanwhile, the 65+ years age bracket for the primary householder has the lowest median household income of $38,542, with 61 households (31.0%) in this group.
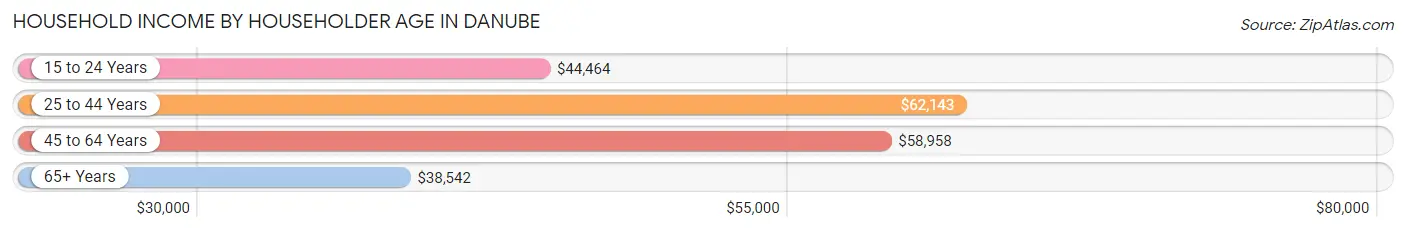
| Income Bracket | # Households | Median Income |
| 15 to 24 Years | 17 (8.6%) | $44,464 |
| 25 to 44 Years | 60 (30.5%) | $62,143 |
| 45 to 64 Years | 59 (29.9%) | $58,958 |
| 65+ Years | 61 (31.0%) | $38,542 |
| Total | 197 (100.0%) | $57,083 |
Poverty in Danube
Income Below Poverty by Sex and Age in Danube
With 3.3% poverty level for males and 5.9% for females among the residents of Danube, 55 to 64 year old males and 25 to 34 year old females are the most vulnerable to poverty, with 8 males (44.4%) and 6 females (42.9%) in their respective age groups living below the poverty level.
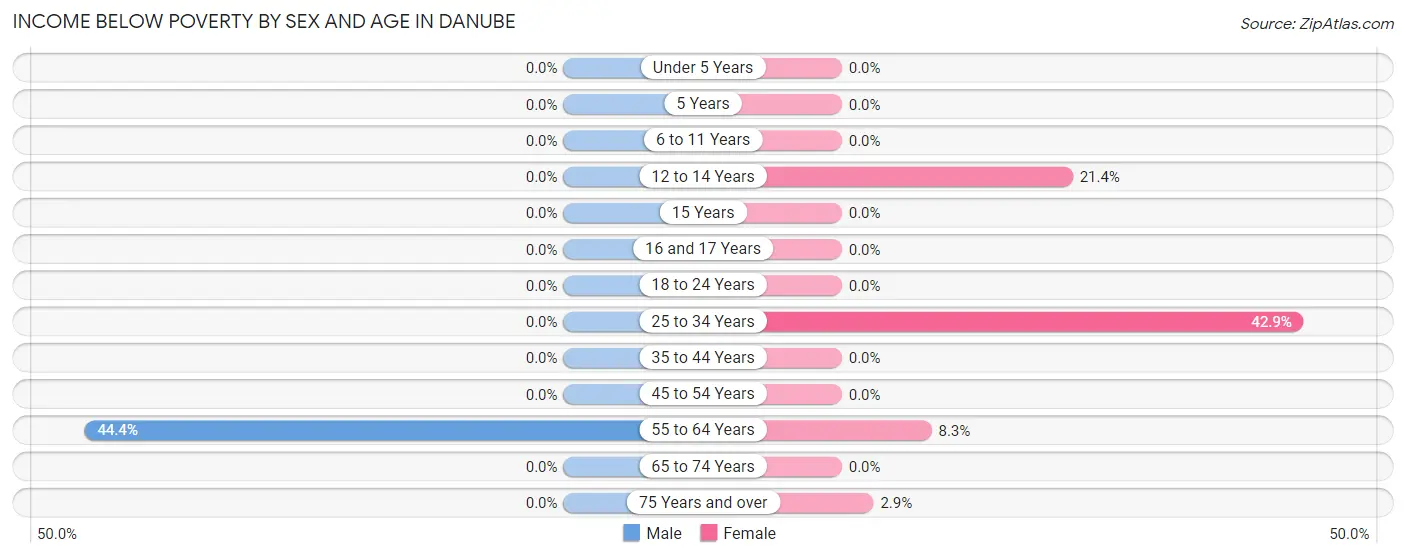
| Age Bracket | Male | Female |
| Under 5 Years | 0 (0.0%) | 0 (0.0%) |
| 5 Years | 0 (0.0%) | 0 (0.0%) |
| 6 to 11 Years | 0 (0.0%) | 0 (0.0%) |
| 12 to 14 Years | 0 (0.0%) | 3 (21.4%) |
| 15 Years | 0 (0.0%) | 0 (0.0%) |
| 16 and 17 Years | 0 (0.0%) | 0 (0.0%) |
| 18 to 24 Years | 0 (0.0%) | 0 (0.0%) |
| 25 to 34 Years | 0 (0.0%) | 6 (42.9%) |
| 35 to 44 Years | 0 (0.0%) | 0 (0.0%) |
| 45 to 54 Years | 0 (0.0%) | 0 (0.0%) |
| 55 to 64 Years | 8 (44.4%) | 2 (8.3%) |
| 65 to 74 Years | 0 (0.0%) | 0 (0.0%) |
| 75 Years and over | 0 (0.0%) | 1 (2.9%) |
| Total | 8 (3.3%) | 12 (5.9%) |
Income Above Poverty by Sex and Age in Danube
According to the poverty statistics in Danube, males aged under 5 years and females aged under 5 years are the age groups that are most secure financially, with 100.0% of males and 100.0% of females in these age groups living above the poverty line.
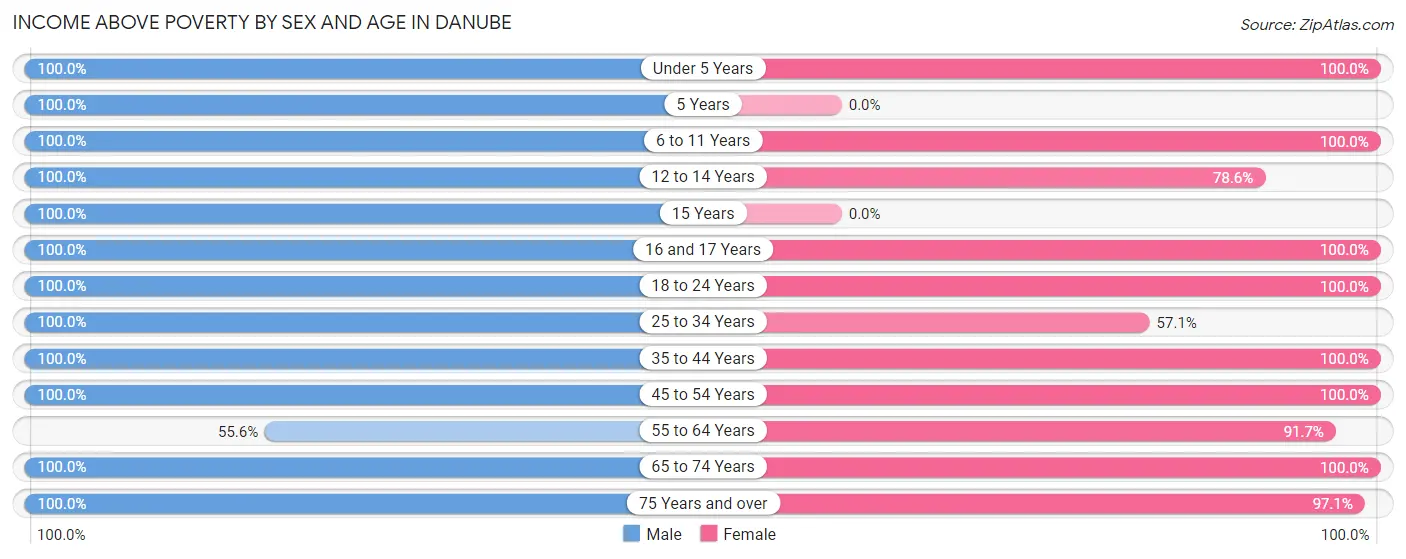
| Age Bracket | Male | Female |
| Under 5 Years | 14 (100.0%) | 17 (100.0%) |
| 5 Years | 3 (100.0%) | 0 (0.0%) |
| 6 to 11 Years | 36 (100.0%) | 3 (100.0%) |
| 12 to 14 Years | 2 (100.0%) | 11 (78.6%) |
| 15 Years | 6 (100.0%) | 0 (0.0%) |
| 16 and 17 Years | 2 (100.0%) | 3 (100.0%) |
| 18 to 24 Years | 28 (100.0%) | 15 (100.0%) |
| 25 to 34 Years | 39 (100.0%) | 8 (57.1%) |
| 35 to 44 Years | 37 (100.0%) | 32 (100.0%) |
| 45 to 54 Years | 17 (100.0%) | 24 (100.0%) |
| 55 to 64 Years | 10 (55.6%) | 22 (91.7%) |
| 65 to 74 Years | 26 (100.0%) | 22 (100.0%) |
| 75 Years and over | 15 (100.0%) | 33 (97.1%) |
| Total | 235 (96.7%) | 190 (94.1%) |
Income Below Poverty Among Married-Couple Families in Danube
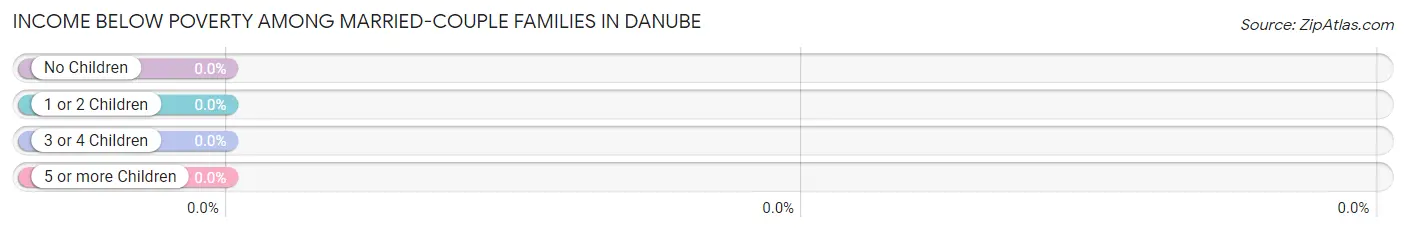
| Children | Above Poverty | Below Poverty |
| No Children | 52 (100.0%) | 0 (0.0%) |
| 1 or 2 Children | 24 (100.0%) | 0 (0.0%) |
| 3 or 4 Children | 13 (100.0%) | 0 (0.0%) |
| 5 or more Children | 0 (0.0%) | 0 (0.0%) |
| Total | 89 (100.0%) | 0 (0.0%) |
Income Below Poverty Among Single-Parent Households in Danube
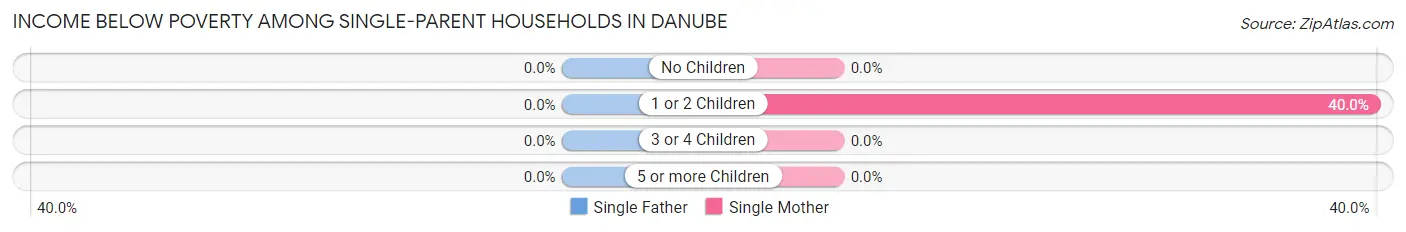
| Children | Single Father | Single Mother |
| No Children | 0 (0.0%) | 0 (0.0%) |
| 1 or 2 Children | 0 (0.0%) | 2 (40.0%) |
| 3 or 4 Children | 0 (0.0%) | 0 (0.0%) |
| 5 or more Children | 0 (0.0%) | 0 (0.0%) |
| Total | 0 (0.0%) | 2 (13.3%) |
Income Below Poverty Among Married-Couple vs Single-Parent Households in Danube
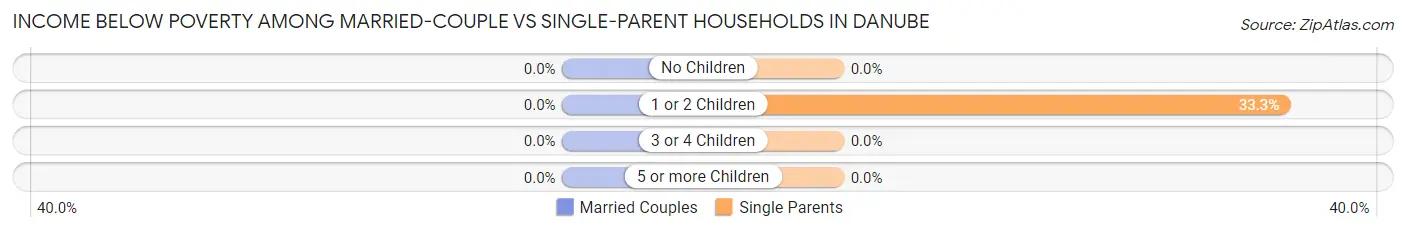
| Children | Married-Couple Families | Single-Parent Households |
| No Children | 0 (0.0%) | 0 (0.0%) |
| 1 or 2 Children | 0 (0.0%) | 2 (33.3%) |
| 3 or 4 Children | 0 (0.0%) | 0 (0.0%) |
| 5 or more Children | 0 (0.0%) | 0 (0.0%) |
| Total | 0 (0.0%) | 2 (9.5%) |
Race in Danube
The most populous races in Danube are White / Caucasian (436 | 95.2%), Hispanic or Latino (24 | 5.2%), and Some other Race (21 | 4.6%).
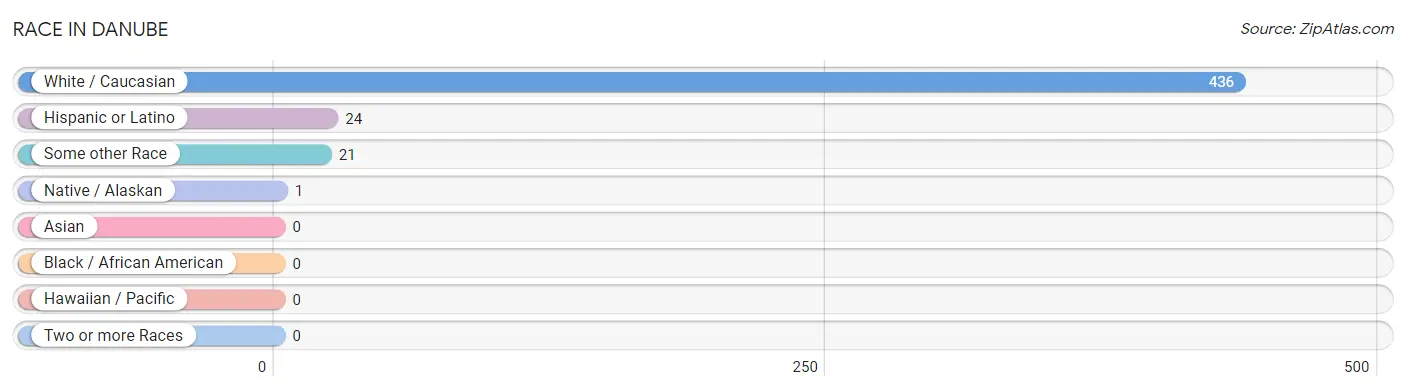
| Race | # Population | % Population |
| Asian | 0 | 0.0% |
| Black / African American | 0 | 0.0% |
| Hawaiian / Pacific | 0 | 0.0% |
| Hispanic or Latino | 24 | 5.2% |
| Native / Alaskan | 1 | 0.2% |
| White / Caucasian | 436 | 95.2% |
| Two or more Races | 0 | 0.0% |
| Some other Race | 21 | 4.6% |
| Total | 458 | 100.0% |
Ancestry in Danube
The most populous ancestries reported in Danube are German (226 | 49.3%), Norwegian (59 | 12.9%), French (51 | 11.1%), Irish (50 | 10.9%), and Czech (24 | 5.2%), together accounting for 89.5% of all Danube residents.
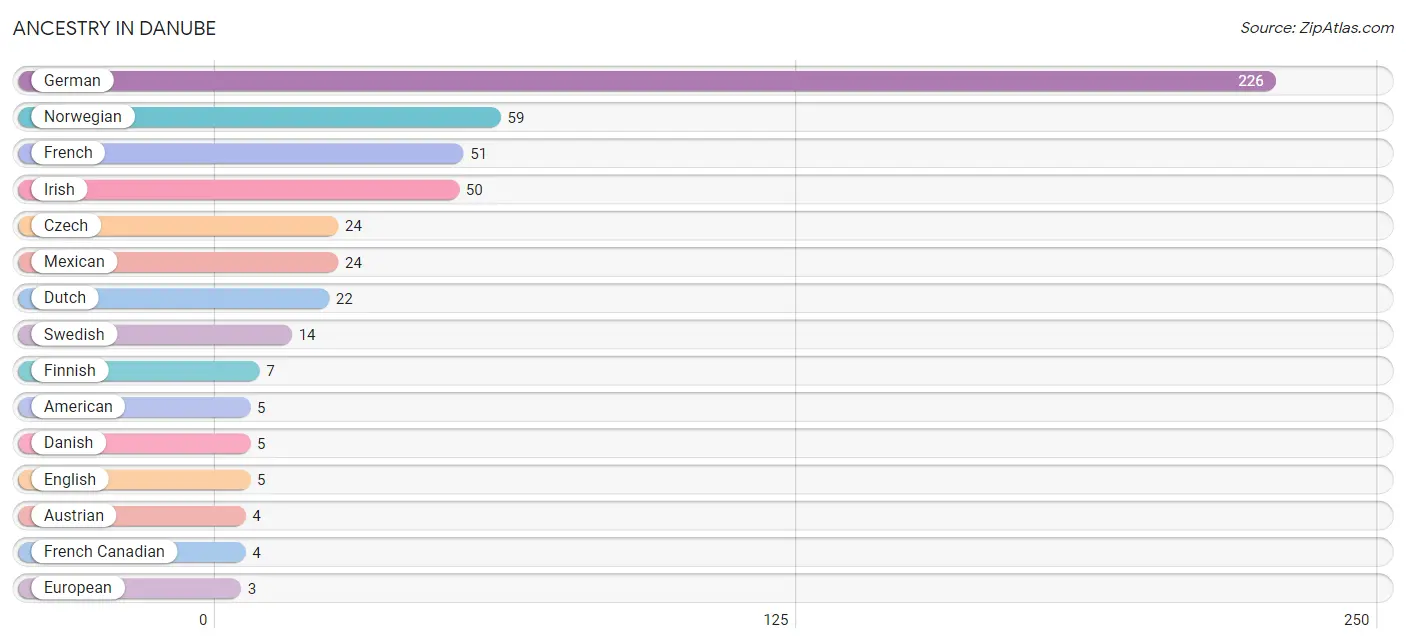
| Ancestry | # Population | % Population |
| American | 5 | 1.1% |
| Austrian | 4 | 0.9% |
| Belgian | 1 | 0.2% |
| Czech | 24 | 5.2% |
| Danish | 5 | 1.1% |
| Dutch | 22 | 4.8% |
| English | 5 | 1.1% |
| European | 3 | 0.7% |
| Finnish | 7 | 1.5% |
| French | 51 | 11.1% |
| French Canadian | 4 | 0.9% |
| German | 226 | 49.3% |
| Irish | 50 | 10.9% |
| Italian | 3 | 0.7% |
| Mexican | 24 | 5.2% |
| Northern European | 2 | 0.4% |
| Norwegian | 59 | 12.9% |
| Polish | 2 | 0.4% |
| Scandinavian | 2 | 0.4% |
| Seminole | 1 | 0.2% |
| Swedish | 14 | 3.1% |
| Swiss | 1 | 0.2% | View All 22 Rows |
Immigrants in Danube
The most numerous immigrant groups reported in Danube came from Central America (9 | 2.0%), Latin America (9 | 2.0%), and Mexico (9 | 2.0%), together accounting for 5.9% of all Danube residents.
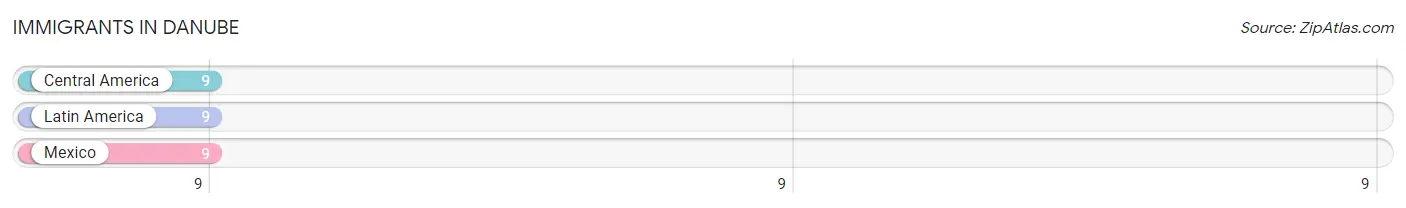
| Immigration Origin | # Population | % Population |
| Central America | 9 | 2.0% |
| Latin America | 9 | 2.0% |
| Mexico | 9 | 2.0% | View All 3 Rows |
Sex and Age in Danube
Sex and Age in Danube
The most populous age groups in Danube are 35 to 39 Years (27 | 10.8%) for men and Under 5 Years (24 | 11.5%) for women.
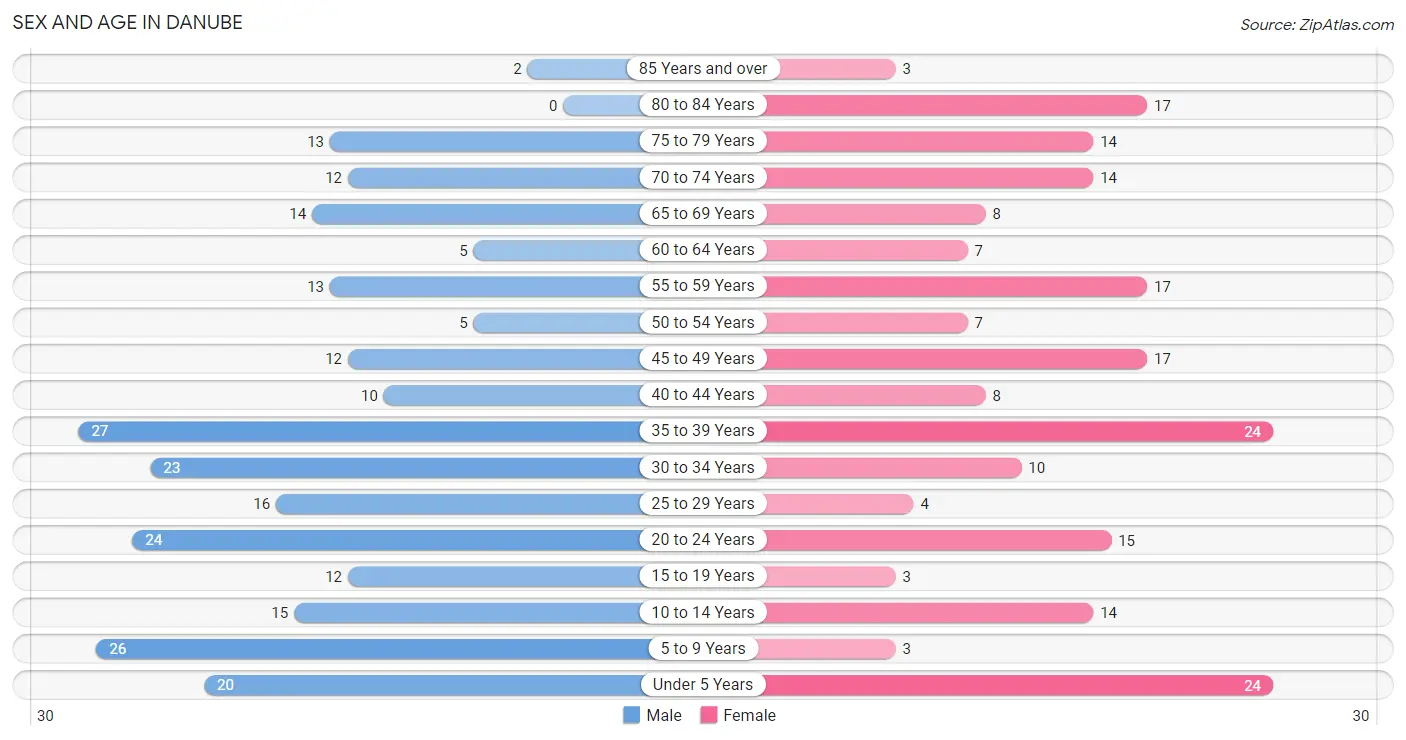
| Age Bracket | Male | Female |
| Under 5 Years | 20 (8.0%) | 24 (11.5%) |
| 5 to 9 Years | 26 (10.4%) | 3 (1.4%) |
| 10 to 14 Years | 15 (6.0%) | 14 (6.7%) |
| 15 to 19 Years | 12 (4.8%) | 3 (1.4%) |
| 20 to 24 Years | 24 (9.6%) | 15 (7.2%) |
| 25 to 29 Years | 16 (6.4%) | 4 (1.9%) |
| 30 to 34 Years | 23 (9.2%) | 10 (4.8%) |
| 35 to 39 Years | 27 (10.8%) | 24 (11.5%) |
| 40 to 44 Years | 10 (4.0%) | 8 (3.8%) |
| 45 to 49 Years | 12 (4.8%) | 17 (8.1%) |
| 50 to 54 Years | 5 (2.0%) | 7 (3.4%) |
| 55 to 59 Years | 13 (5.2%) | 17 (8.1%) |
| 60 to 64 Years | 5 (2.0%) | 7 (3.4%) |
| 65 to 69 Years | 14 (5.6%) | 8 (3.8%) |
| 70 to 74 Years | 12 (4.8%) | 14 (6.7%) |
| 75 to 79 Years | 13 (5.2%) | 14 (6.7%) |
| 80 to 84 Years | 0 (0.0%) | 17 (8.1%) |
| 85 Years and over | 2 (0.8%) | 3 (1.4%) |
| Total | 249 (100.0%) | 209 (100.0%) |
Families and Households in Danube
Median Family Size in Danube
The median family size in Danube is 3.15 persons per family, with single female/mother families (15 | 13.6%) accounting for the largest median family size of 3.53 persons per family. On the other hand, single male/father families (6 | 5.4%) represent the smallest median family size with 2.17 persons per family.
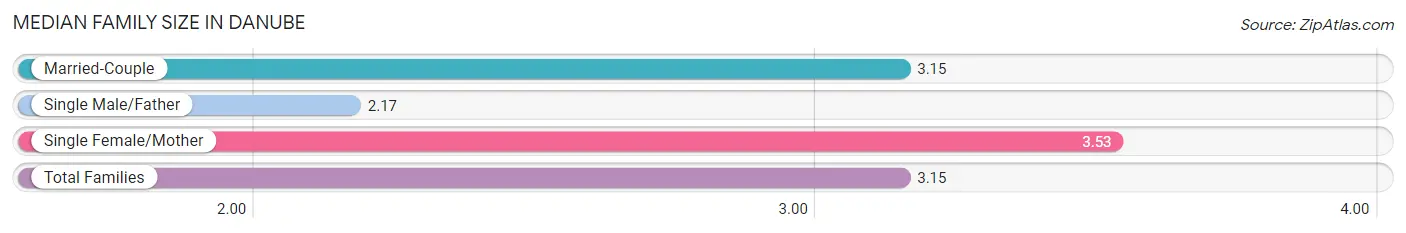
| Family Type | # Families | Family Size |
| Married-Couple | 89 (80.9%) | 3.15 |
| Single Male/Father | 6 (5.4%) | 2.17 |
| Single Female/Mother | 15 (13.6%) | 3.53 |
| Total Families | 110 (100.0%) | 3.15 |
Median Household Size in Danube
The median household size in Danube is 2.32 persons per household, with single female/mother households (15 | 7.6%) accounting for the largest median household size of 3.53 persons per household. non-family households (87 | 44.2%) represent the smallest median household size with 1.24 persons per household.
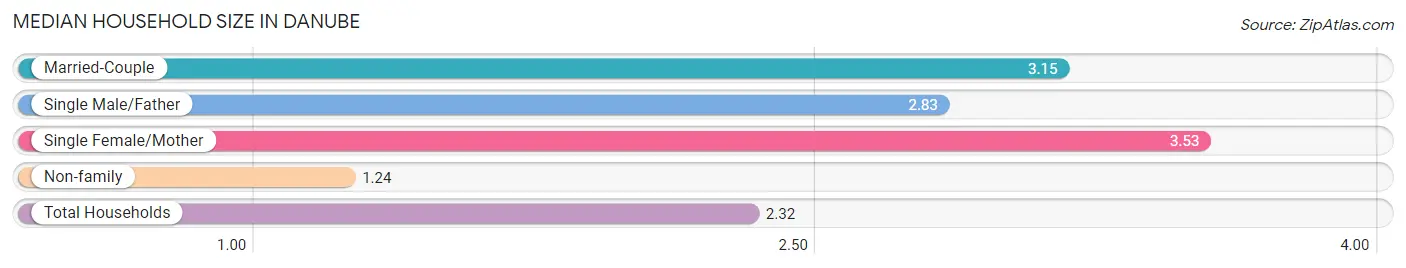
| Household Type | # Households | Household Size |
| Married-Couple | 89 (45.2%) | 3.15 |
| Single Male/Father | 6 (3.0%) | 2.83 |
| Single Female/Mother | 15 (7.6%) | 3.53 |
| Non-family | 87 (44.2%) | 1.24 |
| Total Households | 197 (100.0%) | 2.32 |
Household Size by Marriage Status in Danube
Out of a total of 197 households in Danube, 110 (55.8%) are family households, while 87 (44.2%) are nonfamily households. The most numerous type of family households are 2-person households, comprising 58, and the most common type of nonfamily households are 1-person households, comprising 82.
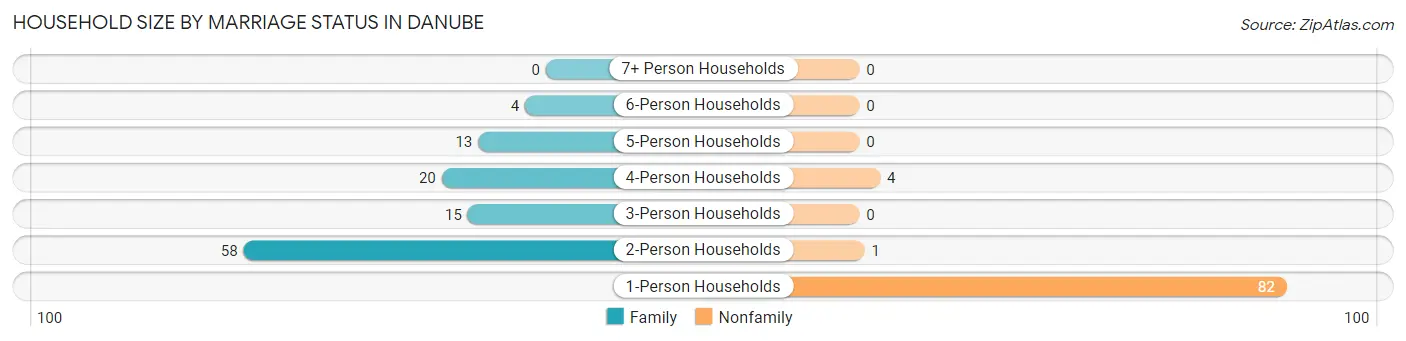
| Household Size | Family Households | Nonfamily Households |
| 1-Person Households | - | 82 (41.6%) |
| 2-Person Households | 58 (29.4%) | 1 (0.5%) |
| 3-Person Households | 15 (7.6%) | 0 (0.0%) |
| 4-Person Households | 20 (10.2%) | 4 (2.0%) |
| 5-Person Households | 13 (6.6%) | 0 (0.0%) |
| 6-Person Households | 4 (2.0%) | 0 (0.0%) |
| 7+ Person Households | 0 (0.0%) | 0 (0.0%) |
| Total | 110 (55.8%) | 87 (44.2%) |
Female Fertility in Danube
Fertility by Age in Danube
| Age Bracket | Women with Births | Births / 1,000 Women |
| 15 to 19 years | 0 (0.0%) | 0.0 |
| 20 to 34 years | 0 (0.0%) | 0.0 |
| 35 to 50 years | 0 (0.0%) | 0.0 |
| Total | 0 (0.0%) | 0.0 |
Fertility by Age by Marriage Status in Danube
| Age Bracket | Married | Unmarried |
| 15 to 19 years | 0 (0.0%) | 0 (0.0%) |
| 20 to 34 years | 0 (0.0%) | 0 (0.0%) |
| 35 to 50 years | 0 (0.0%) | 0 (0.0%) |
| Total | 0 (0.0%) | 0 (0.0%) |
Fertility by Education in Danube
| Educational Attainment | Women with Births | Births / 1,000 Women |
| Less than High School | 0 (0.0%) | 0.0 |
| High School Diploma | 0 (0.0%) | 0.0 |
| College or Associate's Degree | 0 (0.0%) | 0.0 |
| Bachelor's Degree | 0 (0.0%) | 0.0 |
| Graduate Degree | 0 (0.0%) | 0.0 |
| Total | 0 (0.0%) | 0.0 |
Fertility by Education by Marriage Status in Danube
| Educational Attainment | Married | Unmarried |
| Less than High School | 0 (0.0%) | 0 (0.0%) |
| High School Diploma | 0 (0.0%) | 0 (0.0%) |
| College or Associate's Degree | 0 (0.0%) | 0 (0.0%) |
| Bachelor's Degree | 0 (0.0%) | 0 (0.0%) |
| Graduate Degree | 0 (0.0%) | 0 (0.0%) |
| Total | 0 (0.0%) | 0 (0.0%) |
Employment Characteristics in Danube
Employment by Class of Employer in Danube
Among the 218 employed individuals in Danube, private company employees (148 | 67.9%), not-for-profit organizations (32 | 14.7%), and self-employed (not incorporated) (15 | 6.9%) make up the most common classes of employment.
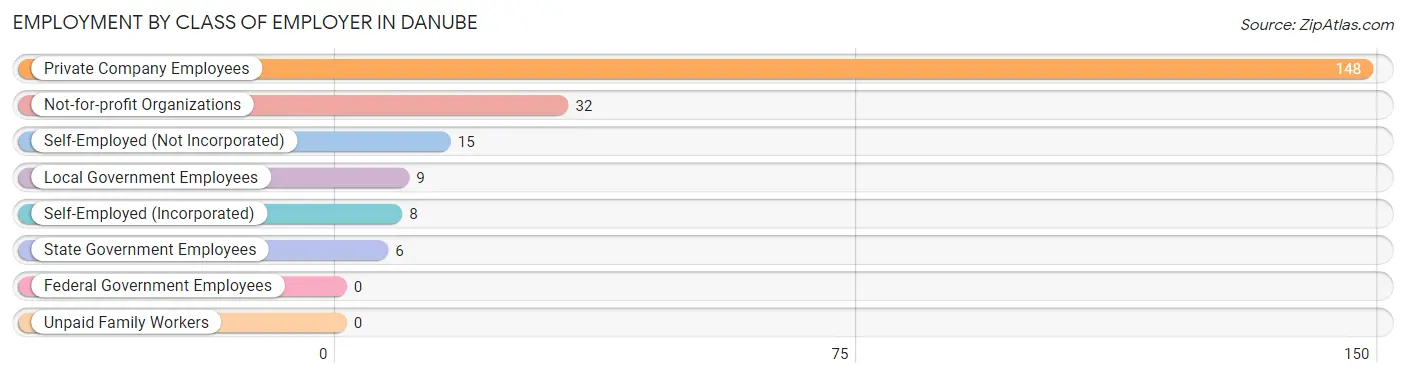
| Employer Class | # Employees | % Employees |
| Private Company Employees | 148 | 67.9% |
| Self-Employed (Incorporated) | 8 | 3.7% |
| Self-Employed (Not Incorporated) | 15 | 6.9% |
| Not-for-profit Organizations | 32 | 14.7% |
| Local Government Employees | 9 | 4.1% |
| State Government Employees | 6 | 2.8% |
| Federal Government Employees | 0 | 0.0% |
| Unpaid Family Workers | 0 | 0.0% |
| Total | 218 | 100.0% |
Employment Status by Age in Danube
According to the labor force statistics for Danube, out of the total population over 16 years of age (350), 64.0% or 224 individuals are in the labor force, with 0.4% or 1 of them unemployed. The age group with the highest labor force participation rate is 30 to 34 years, with 100.0% or 33 individuals in the labor force. Within the labor force, the 75 years and over age range has the highest percentage of unemployed individuals, with 50.0% or 1 of them being unemployed.
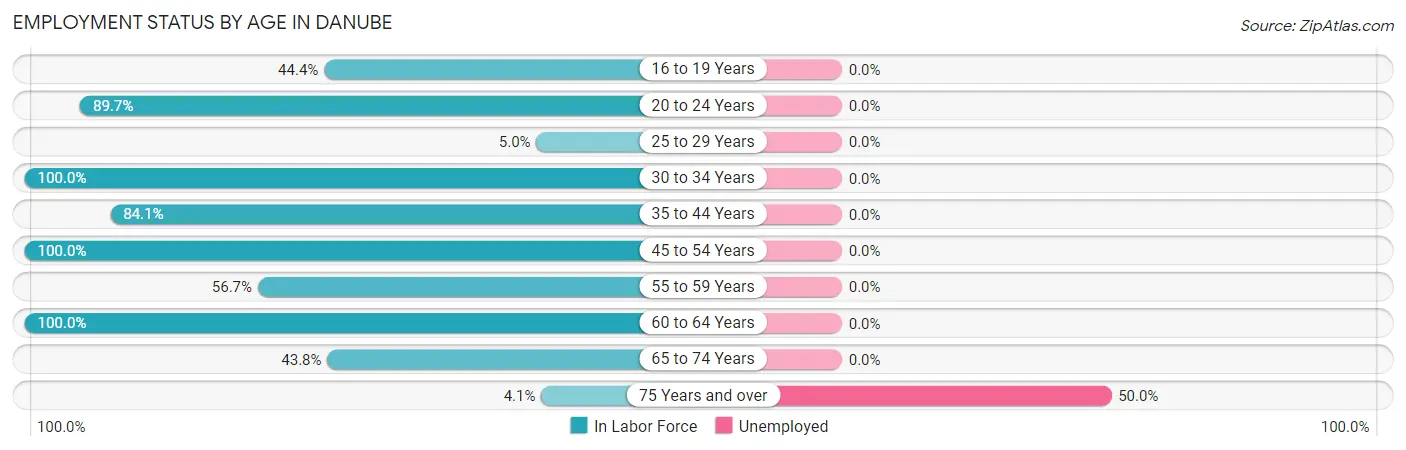
| Age Bracket | In Labor Force | Unemployed |
| 16 to 19 Years | 4 (44.4%) | 0 (0.0%) |
| 20 to 24 Years | 35 (89.7%) | 0 (0.0%) |
| 25 to 29 Years | 1 (5.0%) | 0 (0.0%) |
| 30 to 34 Years | 33 (100.0%) | 0 (0.0%) |
| 35 to 44 Years | 58 (84.1%) | 0 (0.0%) |
| 45 to 54 Years | 41 (100.0%) | 0 (0.0%) |
| 55 to 59 Years | 17 (56.7%) | 0 (0.0%) |
| 60 to 64 Years | 12 (100.0%) | 0 (0.0%) |
| 65 to 74 Years | 21 (43.8%) | 0 (0.0%) |
| 75 Years and over | 2 (4.1%) | 1 (50.0%) |
| Total | 224 (64.0%) | 1 (0.4%) |
Employment Status by Educational Attainment in Danube
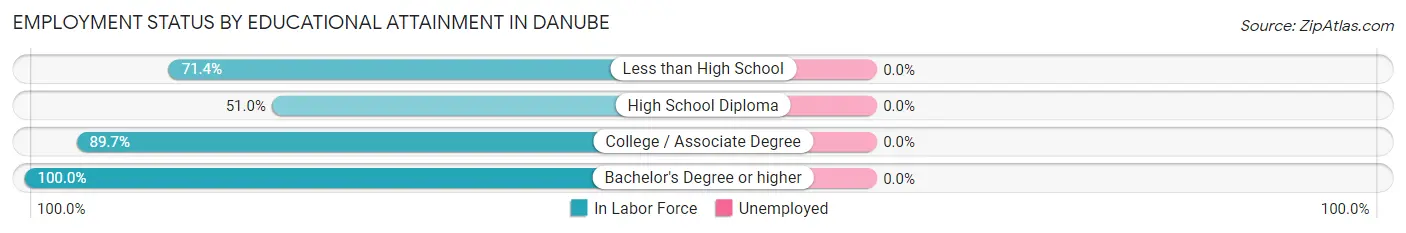
| Educational Attainment | In Labor Force | Unemployed |
| Less than High School | 15 (71.4%) | 0 (0.0%) |
| High School Diploma | 26 (51.0%) | 0 (0.0%) |
| College / Associate Degree | 105 (89.7%) | 0 (0.0%) |
| Bachelor's Degree or higher | 16 (100.0%) | 0 (0.0%) |
| Total | 162 (79.0%) | 0 (0.0%) |
Employment Occupations by Sex in Danube
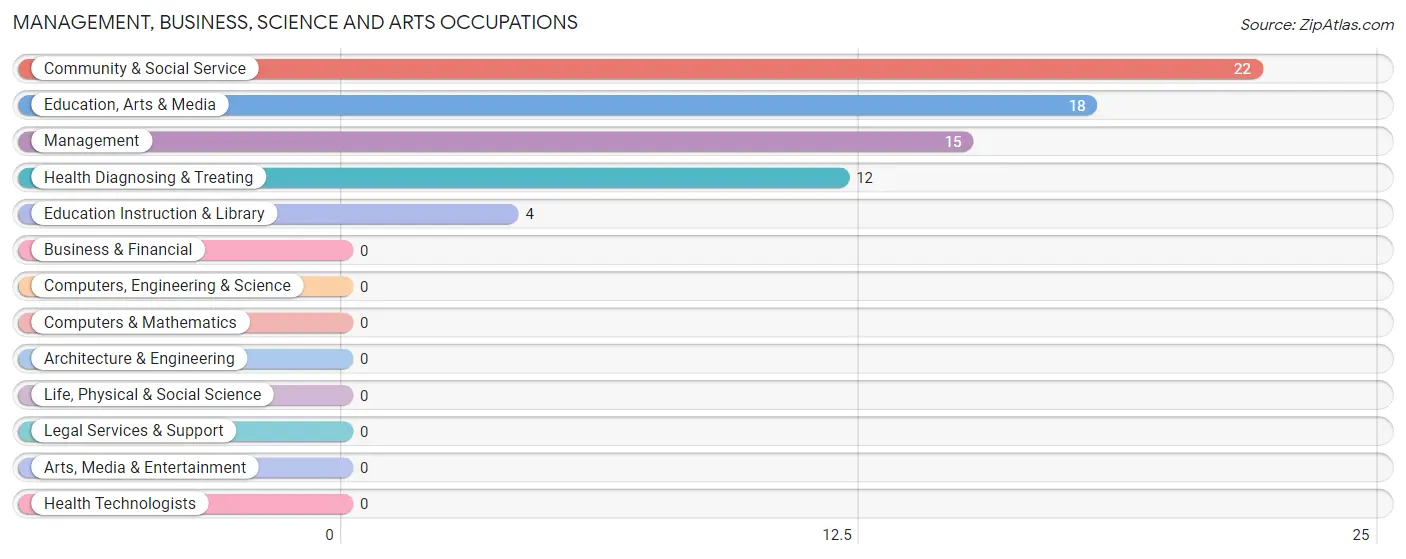
Management, Business, Science and Arts Occupations
The most common Management, Business, Science and Arts occupations in Danube are Community & Social Service (22 | 9.9%), Education, Arts & Media (18 | 8.1%), Management (15 | 6.7%), Health Diagnosing & Treating (12 | 5.4%), and Education Instruction & Library (4 | 1.8%).
Management, Business, Science and Arts Occupations by Sex
Within the Management, Business, Science and Arts occupations in Danube, the most male-oriented occupations are Management (80.0%), Education, Arts & Media (50.0%), and Community & Social Service (40.9%), while the most female-oriented occupations are Education Instruction & Library (100.0%), Health Diagnosing & Treating (100.0%), and Community & Social Service (59.1%).
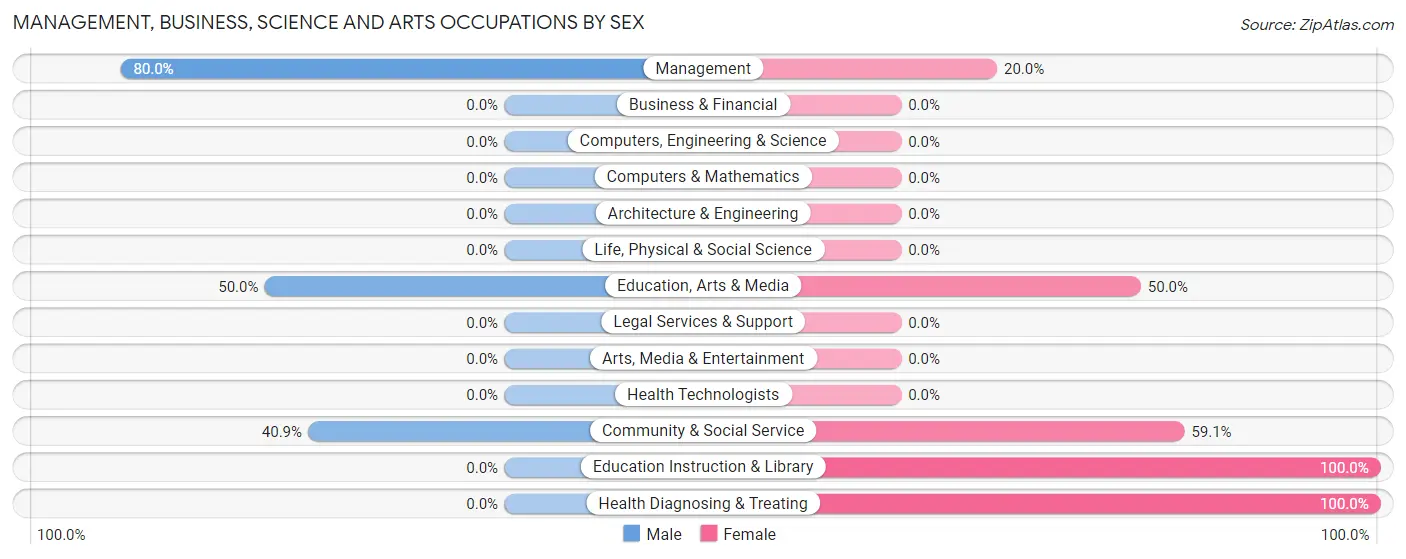
| Occupation | Male | Female |
| Management | 12 (80.0%) | 3 (20.0%) |
| Business & Financial | 0 (0.0%) | 0 (0.0%) |
| Computers, Engineering & Science | 0 (0.0%) | 0 (0.0%) |
| Computers & Mathematics | 0 (0.0%) | 0 (0.0%) |
| Architecture & Engineering | 0 (0.0%) | 0 (0.0%) |
| Life, Physical & Social Science | 0 (0.0%) | 0 (0.0%) |
| Community & Social Service | 9 (40.9%) | 13 (59.1%) |
| Education, Arts & Media | 9 (50.0%) | 9 (50.0%) |
| Legal Services & Support | 0 (0.0%) | 0 (0.0%) |
| Education Instruction & Library | 0 (0.0%) | 4 (100.0%) |
| Arts, Media & Entertainment | 0 (0.0%) | 0 (0.0%) |
| Health Diagnosing & Treating | 0 (0.0%) | 12 (100.0%) |
| Health Technologists | 0 (0.0%) | 0 (0.0%) |
| Total (Category) | 21 (42.9%) | 28 (57.1%) |
| Total (Overall) | 130 (58.3%) | 93 (41.7%) |
Services Occupations
The most common Services occupations in Danube are Food Preparation & Serving (17 | 7.6%), Personal Care & Service (9 | 4.0%), Healthcare Support (7 | 3.1%), Security & Protection (4 | 1.8%), and Firefighting & Prevention (4 | 1.8%).
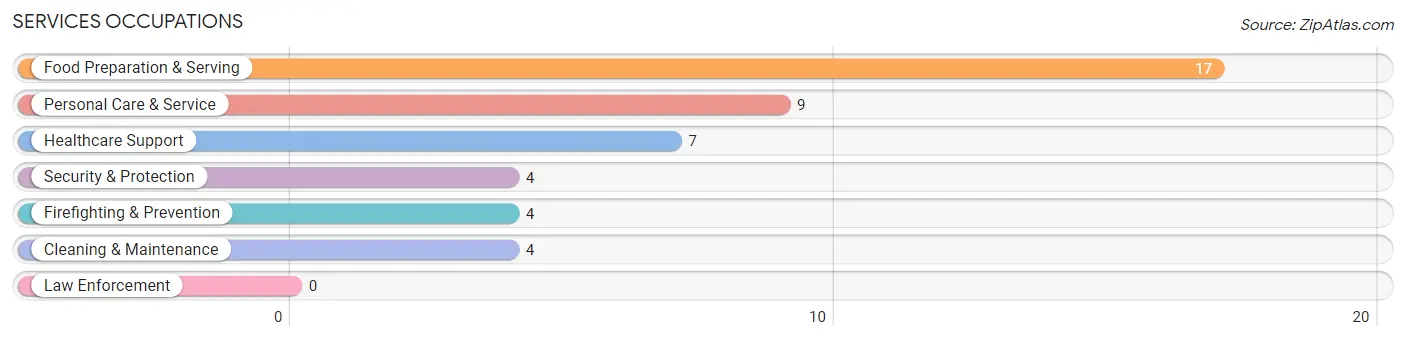
Services Occupations by Sex
Within the Services occupations in Danube, the most male-oriented occupations are Cleaning & Maintenance (100.0%), and Food Preparation & Serving (52.9%), while the most female-oriented occupations are Healthcare Support (100.0%), Security & Protection (100.0%), and Firefighting & Prevention (100.0%).
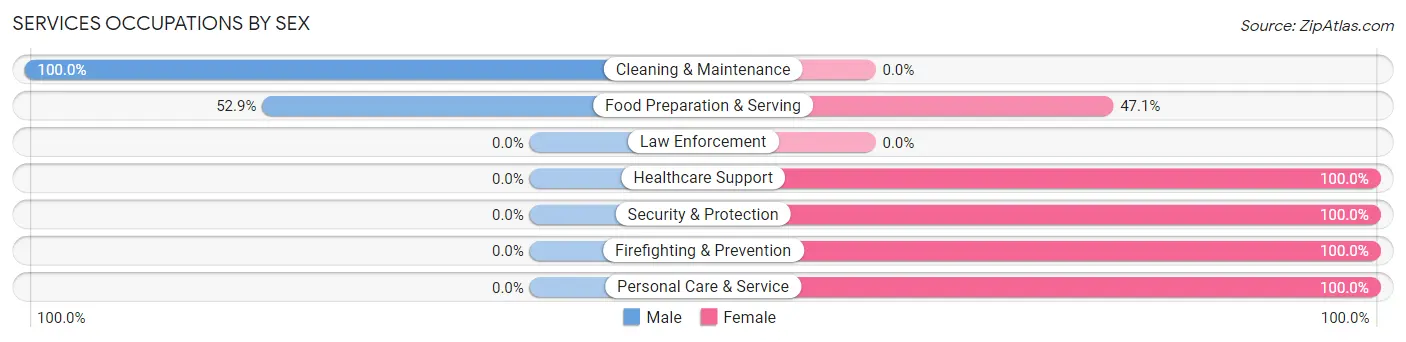
| Occupation | Male | Female |
| Healthcare Support | 0 (0.0%) | 7 (100.0%) |
| Security & Protection | 0 (0.0%) | 4 (100.0%) |
| Firefighting & Prevention | 0 (0.0%) | 4 (100.0%) |
| Law Enforcement | 0 (0.0%) | 0 (0.0%) |
| Food Preparation & Serving | 9 (52.9%) | 8 (47.1%) |
| Cleaning & Maintenance | 4 (100.0%) | 0 (0.0%) |
| Personal Care & Service | 0 (0.0%) | 9 (100.0%) |
| Total (Category) | 13 (31.7%) | 28 (68.3%) |
| Total (Overall) | 130 (58.3%) | 93 (41.7%) |
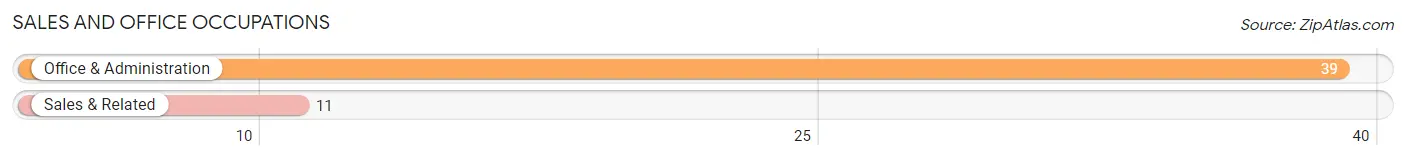
Sales and Office Occupations
The most common Sales and Office occupations in Danube are Office & Administration (39 | 17.5%), and Sales & Related (11 | 4.9%).
Sales and Office Occupations by Sex
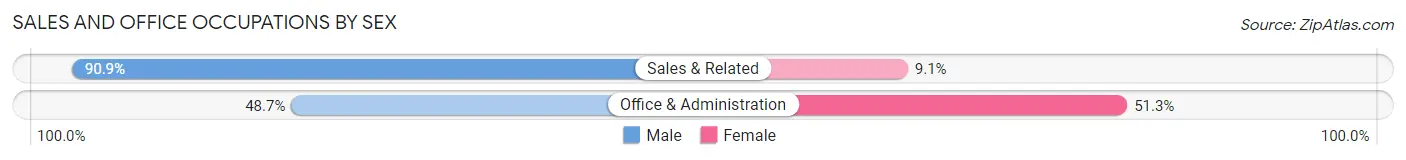
| Occupation | Male | Female |
| Sales & Related | 10 (90.9%) | 1 (9.1%) |
| Office & Administration | 19 (48.7%) | 20 (51.3%) |
| Total (Category) | 29 (58.0%) | 21 (42.0%) |
| Total (Overall) | 130 (58.3%) | 93 (41.7%) |
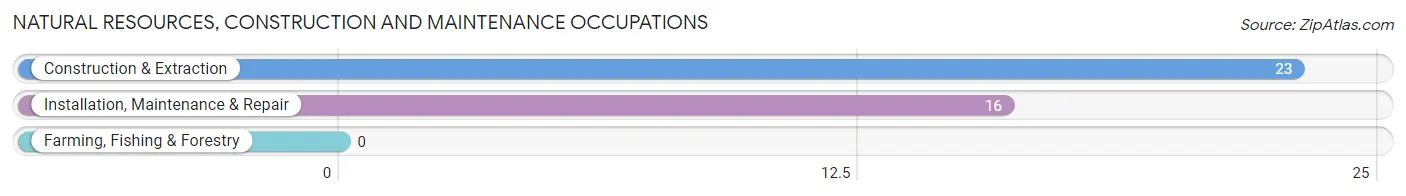
Natural Resources, Construction and Maintenance Occupations
The most common Natural Resources, Construction and Maintenance occupations in Danube are Construction & Extraction (23 | 10.3%), and Installation, Maintenance & Repair (16 | 7.2%).
Natural Resources, Construction and Maintenance Occupations by Sex
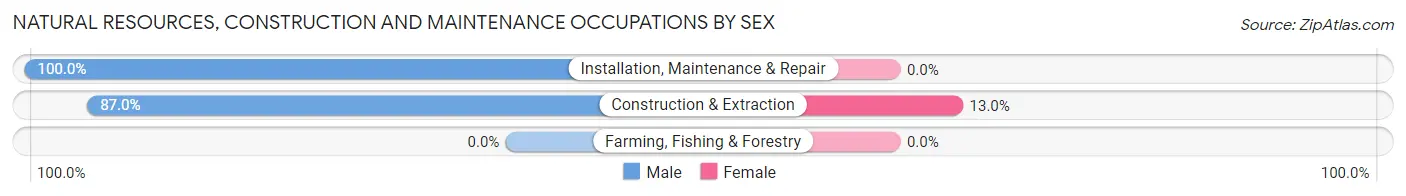
| Occupation | Male | Female |
| Farming, Fishing & Forestry | 0 (0.0%) | 0 (0.0%) |
| Construction & Extraction | 20 (87.0%) | 3 (13.0%) |
| Installation, Maintenance & Repair | 16 (100.0%) | 0 (0.0%) |
| Total (Category) | 36 (92.3%) | 3 (7.7%) |
| Total (Overall) | 130 (58.3%) | 93 (41.7%) |
Production, Transportation and Moving Occupations
The most common Production, Transportation and Moving occupations in Danube are Material Moving (21 | 9.4%), Production (17 | 7.6%), and Transportation (6 | 2.7%).
Production, Transportation and Moving Occupations by Sex
| Occupation | Male | Female |
| Production | 14 (82.4%) | 3 (17.6%) |
| Transportation | 2 (33.3%) | 4 (66.7%) |
| Material Moving | 15 (71.4%) | 6 (28.6%) |
| Total (Category) | 31 (70.5%) | 13 (29.5%) |
| Total (Overall) | 130 (58.3%) | 93 (41.7%) |
Employment Industries by Sex in Danube
Employment Industries in Danube
The major employment industries in Danube include Manufacturing (50 | 22.4%), Health Care & Social Assistance (35 | 15.7%), Construction (24 | 10.8%), Wholesale Trade (22 | 9.9%), and Accommodation & Food Services (15 | 6.7%).
Employment Industries by Sex in Danube
The Danube industries that see more men than women are Agriculture, Fishing & Hunting (100.0%), Transportation & Warehousing (100.0%), and Construction (95.8%), whereas the industries that tend to have a higher number of women are Educational Services (100.0%), Public Administration (100.0%), and Health Care & Social Assistance (74.3%).
| Industry | Male | Female |
| Agriculture, Fishing & Hunting | 9 (100.0%) | 0 (0.0%) |
| Mining, Quarrying, & Extraction | 0 (0.0%) | 0 (0.0%) |
| Construction | 23 (95.8%) | 1 (4.2%) |
| Manufacturing | 39 (78.0%) | 11 (22.0%) |
| Wholesale Trade | 18 (81.8%) | 4 (18.2%) |
| Retail Trade | 5 (50.0%) | 5 (50.0%) |
| Transportation & Warehousing | 2 (100.0%) | 0 (0.0%) |
| Utilities | 2 (40.0%) | 3 (60.0%) |
| Information | 7 (77.8%) | 2 (22.2%) |
| Finance & Insurance | 5 (71.4%) | 2 (28.6%) |
| Real Estate, Rental & Leasing | 0 (0.0%) | 0 (0.0%) |
| Professional & Scientific | 0 (0.0%) | 0 (0.0%) |
| Enterprise Management | 0 (0.0%) | 0 (0.0%) |
| Administrative & Support | 0 (0.0%) | 0 (0.0%) |
| Educational Services | 0 (0.0%) | 12 (100.0%) |
| Health Care & Social Assistance | 9 (25.7%) | 26 (74.3%) |
| Arts, Entertainment & Recreation | 0 (0.0%) | 0 (0.0%) |
| Accommodation & Food Services | 9 (60.0%) | 6 (40.0%) |
| Public Administration | 0 (0.0%) | 9 (100.0%) |
| Total | 130 (58.3%) | 93 (41.7%) |
Education in Danube
School Enrollment in Danube
The most common levels of schooling among the 91 students in Danube are elementary school (30 | 33.0%), nursery / preschool (25 | 27.5%), and middle school (25 | 27.5%).
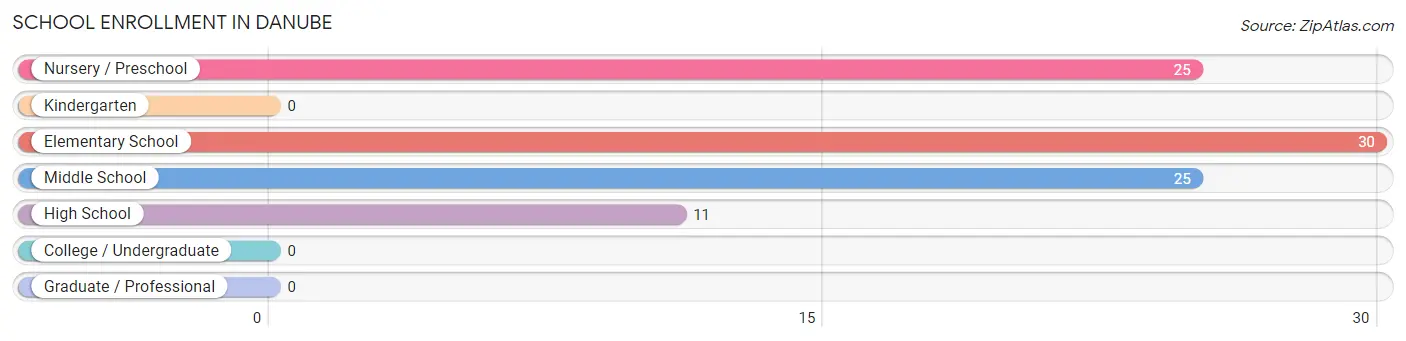
| School Level | # Students | % Students |
| Nursery / Preschool | 25 | 27.5% |
| Kindergarten | 0 | 0.0% |
| Elementary School | 30 | 33.0% |
| Middle School | 25 | 27.5% |
| High School | 11 | 12.1% |
| College / Undergraduate | 0 | 0.0% |
| Graduate / Professional | 0 | 0.0% |
| Total | 91 | 100.0% |
School Enrollment by Age by Funding Source in Danube
Out of a total of 91 students who are enrolled in schools in Danube, 13 (14.3%) attend a private institution, while the remaining 78 (85.7%) are enrolled in public schools. The age group of 5 to 9 year old has the highest likelihood of being enrolled in private schools, with 9 (31.0% in the age bracket) enrolled. Conversely, the age group of 3 to 4 year olds has the lowest likelihood of being enrolled in a private school, with 22 (100.0% in the age bracket) attending a public institution.
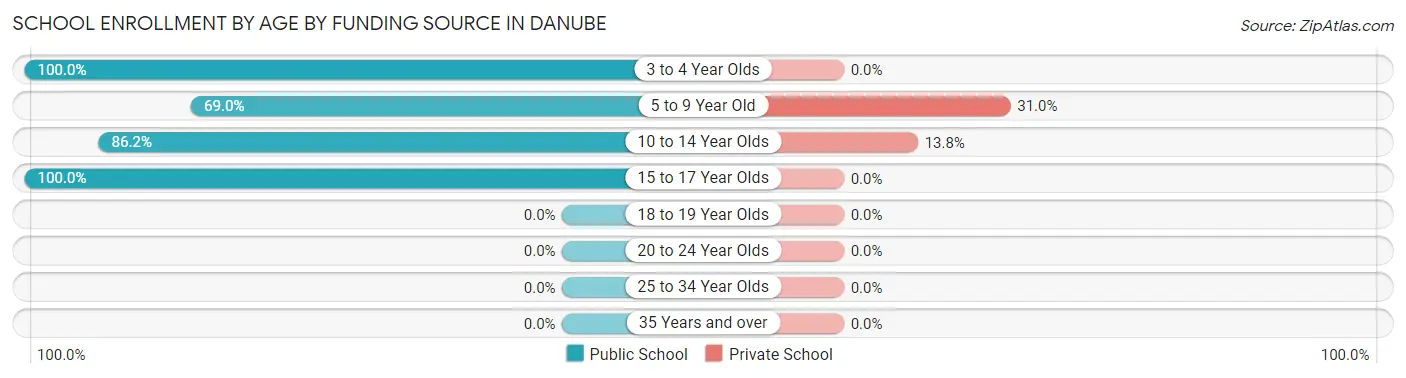
| Age Bracket | Public School | Private School |
| 3 to 4 Year Olds | 22 (100.0%) | 0 (0.0%) |
| 5 to 9 Year Old | 20 (69.0%) | 9 (31.0%) |
| 10 to 14 Year Olds | 25 (86.2%) | 4 (13.8%) |
| 15 to 17 Year Olds | 11 (100.0%) | 0 (0.0%) |
| 18 to 19 Year Olds | 0 (0.0%) | 0 (0.0%) |
| 20 to 24 Year Olds | 0 (0.0%) | 0 (0.0%) |
| 25 to 34 Year Olds | 0 (0.0%) | 0 (0.0%) |
| 35 Years and over | 0 (0.0%) | 0 (0.0%) |
| Total | 78 (85.7%) | 13 (14.3%) |
Educational Attainment by Field of Study in Danube
Psychology (8 | 27.6%), business (5 | 17.2%), bio, nature & agricultural (4 | 13.8%), science & technology (4 | 13.8%), and education (4 | 13.8%) are the most common fields of study among 29 individuals in Danube who have obtained a bachelor's degree or higher.
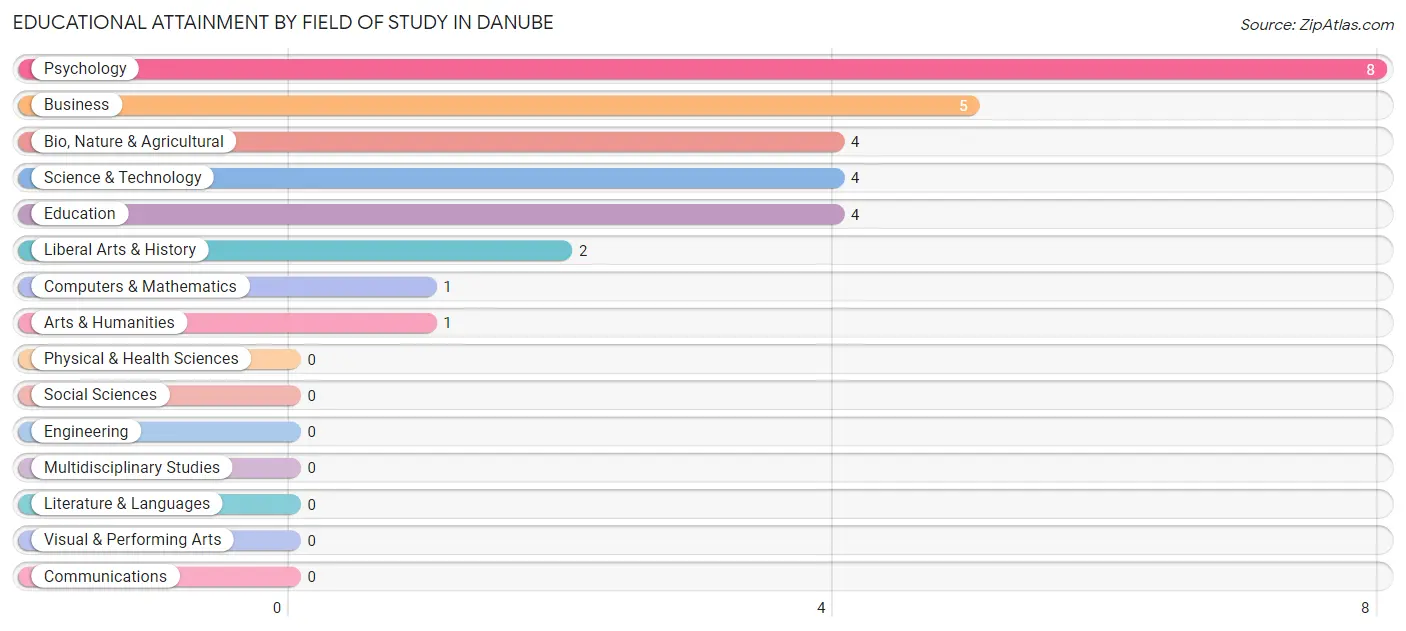
| Field of Study | # Graduates | % Graduates |
| Computers & Mathematics | 1 | 3.5% |
| Bio, Nature & Agricultural | 4 | 13.8% |
| Physical & Health Sciences | 0 | 0.0% |
| Psychology | 8 | 27.6% |
| Social Sciences | 0 | 0.0% |
| Engineering | 0 | 0.0% |
| Multidisciplinary Studies | 0 | 0.0% |
| Science & Technology | 4 | 13.8% |
| Business | 5 | 17.2% |
| Education | 4 | 13.8% |
| Literature & Languages | 0 | 0.0% |
| Liberal Arts & History | 2 | 6.9% |
| Visual & Performing Arts | 0 | 0.0% |
| Communications | 0 | 0.0% |
| Arts & Humanities | 1 | 3.5% |
| Total | 29 | 100.0% |
Transportation & Commute in Danube
Vehicle Availability by Sex in Danube
The most prevalent vehicle ownership categories in Danube are males with 2 vehicles (48, accounting for 38.4%) and females with 2 vehicles (37, making up 51.6%).
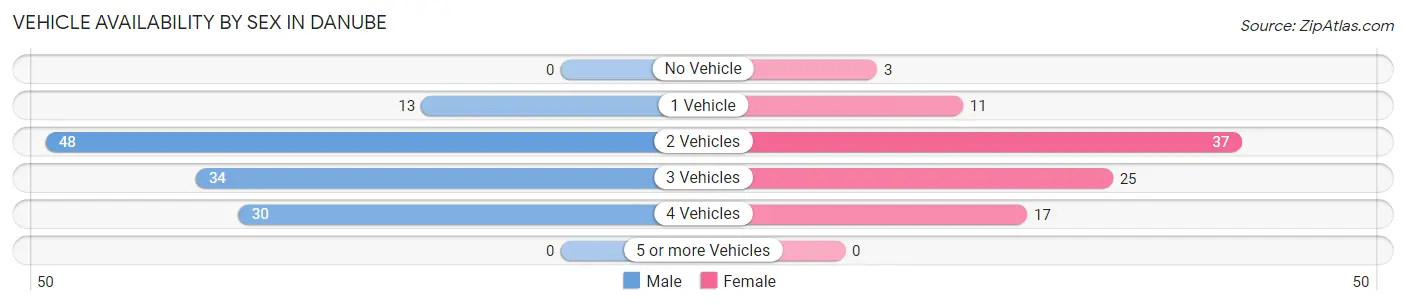
| Vehicles Available | Male | Female |
| No Vehicle | 0 (0.0%) | 3 (3.2%) |
| 1 Vehicle | 13 (10.4%) | 11 (11.8%) |
| 2 Vehicles | 48 (38.4%) | 37 (39.8%) |
| 3 Vehicles | 34 (27.2%) | 25 (26.9%) |
| 4 Vehicles | 30 (24.0%) | 17 (18.3%) |
| 5 or more Vehicles | 0 (0.0%) | 0 (0.0%) |
| Total | 125 (100.0%) | 93 (100.0%) |
Commute Time in Danube
The most frequently occuring commute durations in Danube are 10 to 14 minutes (65 commuters, 32.8%), 15 to 19 minutes (25 commuters, 12.6%), and 5 to 9 minutes (24 commuters, 12.1%).
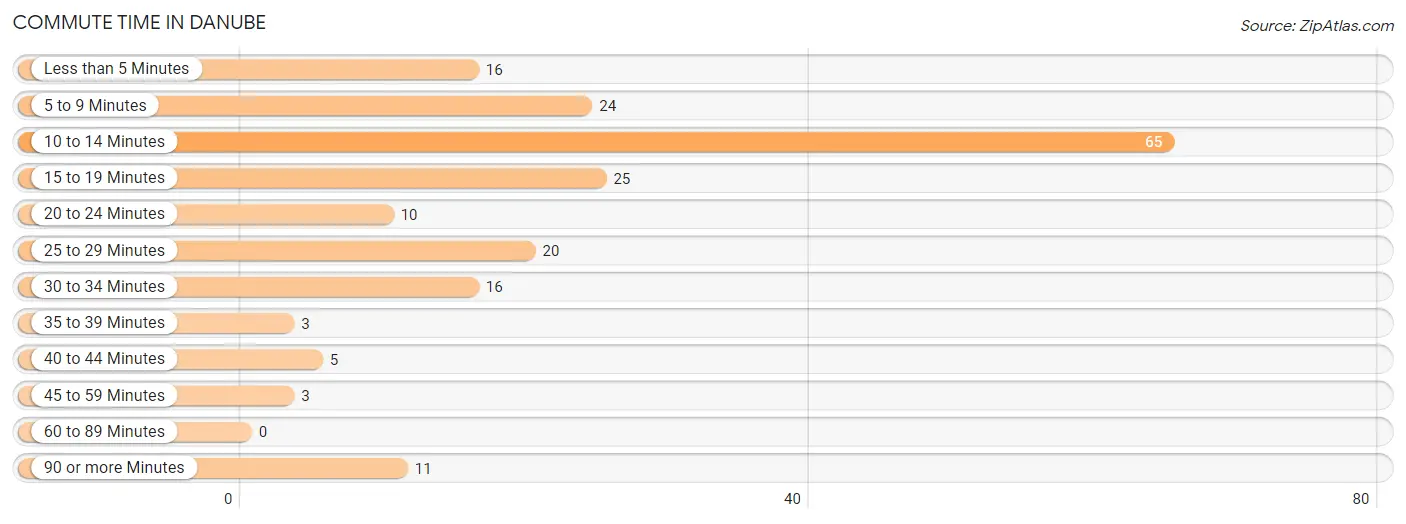
| Commute Time | # Commuters | % Commuters |
| Less than 5 Minutes | 16 | 8.1% |
| 5 to 9 Minutes | 24 | 12.1% |
| 10 to 14 Minutes | 65 | 32.8% |
| 15 to 19 Minutes | 25 | 12.6% |
| 20 to 24 Minutes | 10 | 5.1% |
| 25 to 29 Minutes | 20 | 10.1% |
| 30 to 34 Minutes | 16 | 8.1% |
| 35 to 39 Minutes | 3 | 1.5% |
| 40 to 44 Minutes | 5 | 2.5% |
| 45 to 59 Minutes | 3 | 1.5% |
| 60 to 89 Minutes | 0 | 0.0% |
| 90 or more Minutes | 11 | 5.6% |
Commute Time by Sex in Danube
The most common commute times in Danube are 10 to 14 minutes (38 commuters, 34.2%) for males and 10 to 14 minutes (27 commuters, 31.0%) for females.
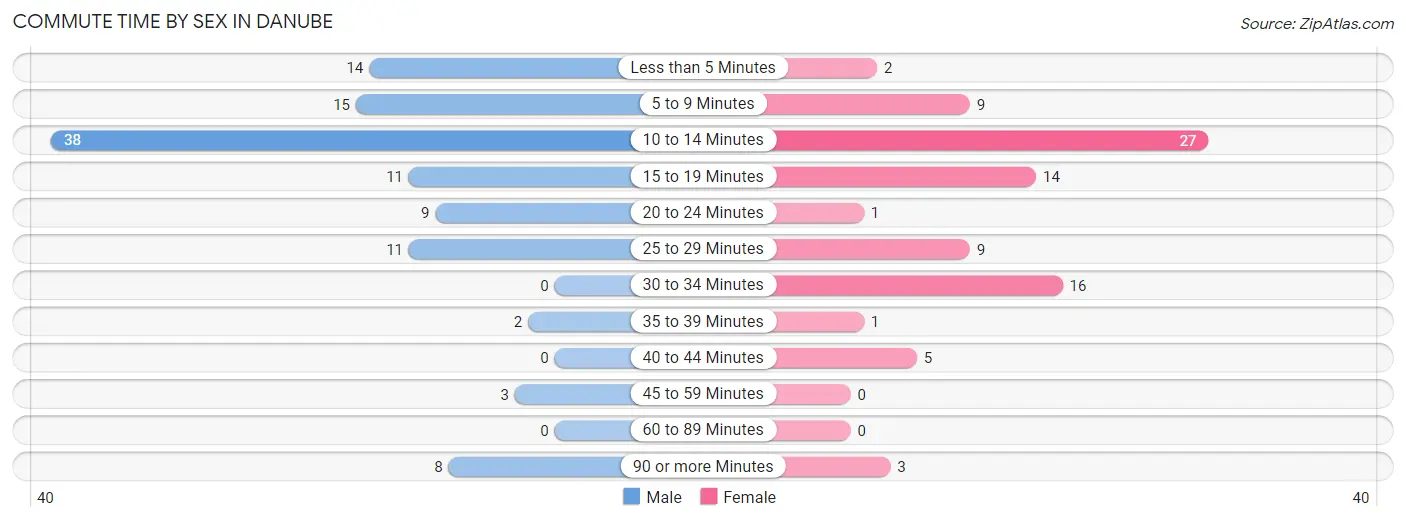
| Commute Time | Male | Female |
| Less than 5 Minutes | 14 (12.6%) | 2 (2.3%) |
| 5 to 9 Minutes | 15 (13.5%) | 9 (10.3%) |
| 10 to 14 Minutes | 38 (34.2%) | 27 (31.0%) |
| 15 to 19 Minutes | 11 (9.9%) | 14 (16.1%) |
| 20 to 24 Minutes | 9 (8.1%) | 1 (1.1%) |
| 25 to 29 Minutes | 11 (9.9%) | 9 (10.3%) |
| 30 to 34 Minutes | 0 (0.0%) | 16 (18.4%) |
| 35 to 39 Minutes | 2 (1.8%) | 1 (1.1%) |
| 40 to 44 Minutes | 0 (0.0%) | 5 (5.8%) |
| 45 to 59 Minutes | 3 (2.7%) | 0 (0.0%) |
| 60 to 89 Minutes | 0 (0.0%) | 0 (0.0%) |
| 90 or more Minutes | 8 (7.2%) | 3 (3.5%) |
Time of Departure to Work by Sex in Danube
The most frequent times of departure to work in Danube are 5:30 AM to 5:59 AM (26, 23.4%) for males and 7:30 AM to 7:59 AM (17, 19.5%) for females.
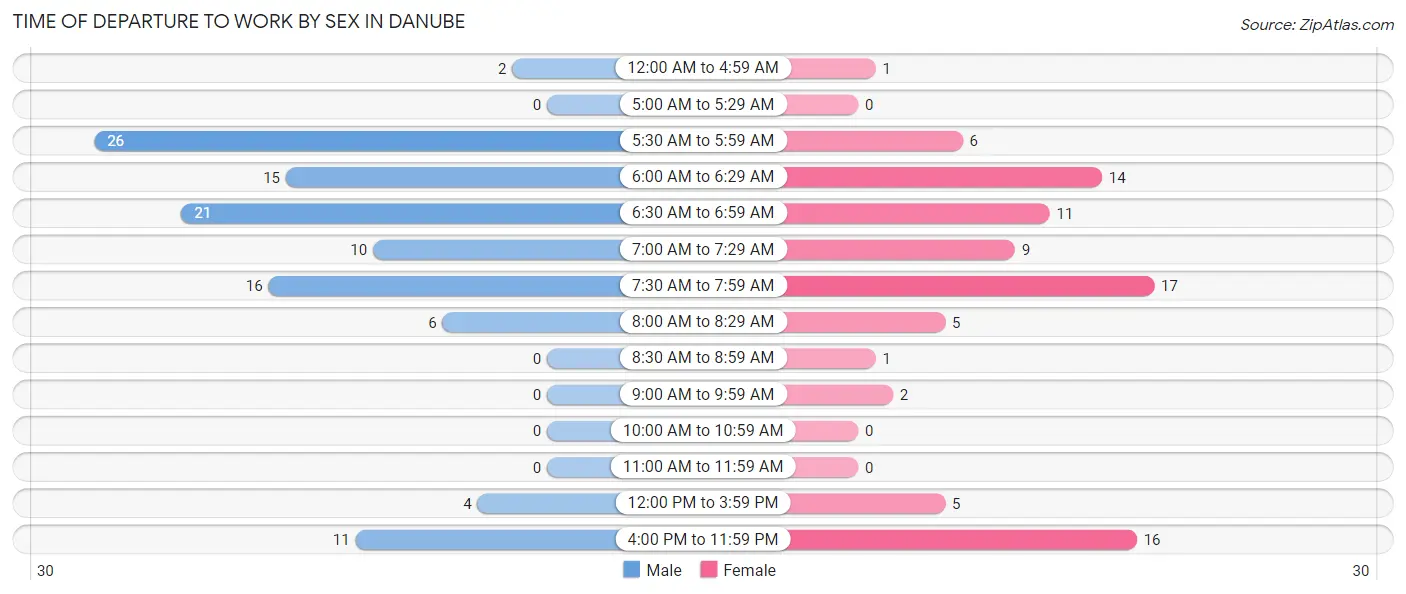
| Time of Departure | Male | Female |
| 12:00 AM to 4:59 AM | 2 (1.8%) | 1 (1.1%) |
| 5:00 AM to 5:29 AM | 0 (0.0%) | 0 (0.0%) |
| 5:30 AM to 5:59 AM | 26 (23.4%) | 6 (6.9%) |
| 6:00 AM to 6:29 AM | 15 (13.5%) | 14 (16.1%) |
| 6:30 AM to 6:59 AM | 21 (18.9%) | 11 (12.6%) |
| 7:00 AM to 7:29 AM | 10 (9.0%) | 9 (10.3%) |
| 7:30 AM to 7:59 AM | 16 (14.4%) | 17 (19.5%) |
| 8:00 AM to 8:29 AM | 6 (5.4%) | 5 (5.8%) |
| 8:30 AM to 8:59 AM | 0 (0.0%) | 1 (1.1%) |
| 9:00 AM to 9:59 AM | 0 (0.0%) | 2 (2.3%) |
| 10:00 AM to 10:59 AM | 0 (0.0%) | 0 (0.0%) |
| 11:00 AM to 11:59 AM | 0 (0.0%) | 0 (0.0%) |
| 12:00 PM to 3:59 PM | 4 (3.6%) | 5 (5.8%) |
| 4:00 PM to 11:59 PM | 11 (9.9%) | 16 (18.4%) |
| Total | 111 (100.0%) | 87 (100.0%) |
Housing Occupancy in Danube
Occupancy by Ownership in Danube
Of the total 197 dwellings in Danube, owner-occupied units account for 160 (81.2%), while renter-occupied units make up 37 (18.8%).
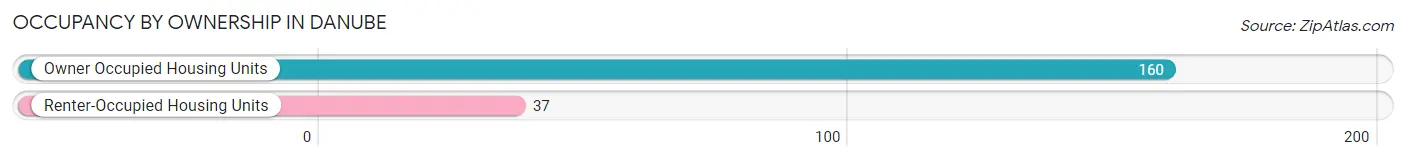
| Occupancy | # Housing Units | % Housing Units |
| Owner Occupied Housing Units | 160 | 81.2% |
| Renter-Occupied Housing Units | 37 | 18.8% |
| Total Occupied Housing Units | 197 | 100.0% |
Occupancy by Household Size in Danube
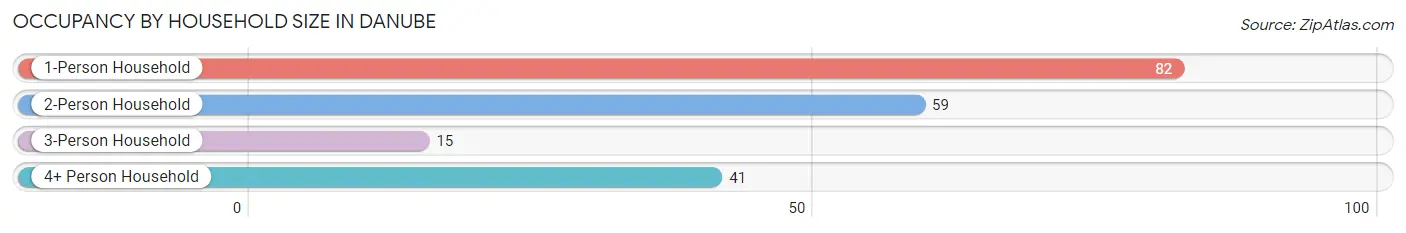
| Household Size | # Housing Units | % Housing Units |
| 1-Person Household | 82 | 41.6% |
| 2-Person Household | 59 | 29.9% |
| 3-Person Household | 15 | 7.6% |
| 4+ Person Household | 41 | 20.8% |
| Total Housing Units | 197 | 100.0% |
Occupancy by Ownership by Household Size in Danube
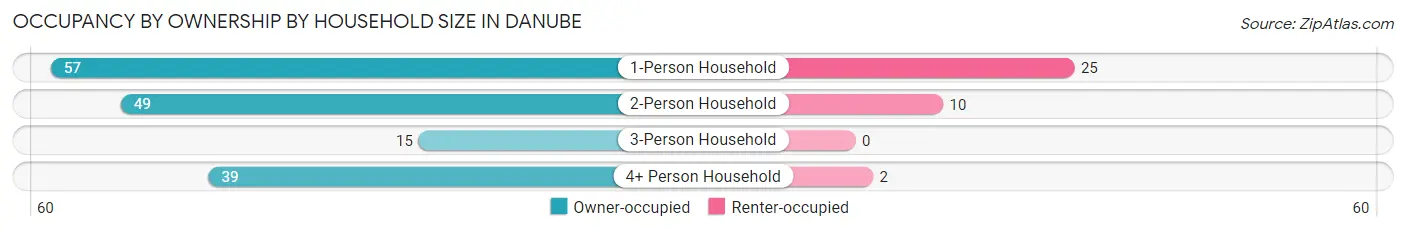
| Household Size | Owner-occupied | Renter-occupied |
| 1-Person Household | 57 (69.5%) | 25 (30.5%) |
| 2-Person Household | 49 (83.1%) | 10 (17.0%) |
| 3-Person Household | 15 (100.0%) | 0 (0.0%) |
| 4+ Person Household | 39 (95.1%) | 2 (4.9%) |
| Total Housing Units | 160 (81.2%) | 37 (18.8%) |
Occupancy by Educational Attainment in Danube
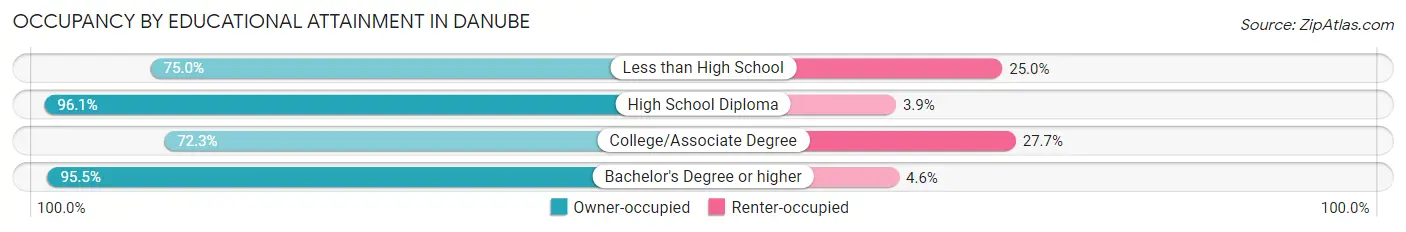
| Household Size | Owner-occupied | Renter-occupied |
| Less than High School | 9 (75.0%) | 3 (25.0%) |
| High School Diploma | 49 (96.1%) | 2 (3.9%) |
| College/Associate Degree | 81 (72.3%) | 31 (27.7%) |
| Bachelor's Degree or higher | 21 (95.5%) | 1 (4.5%) |
Occupancy by Age of Householder in Danube
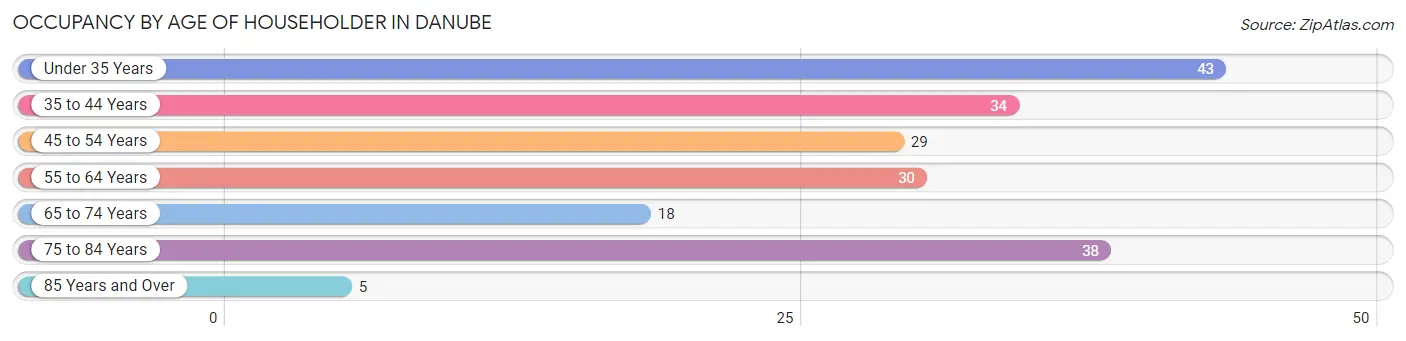
| Age Bracket | # Households | % Households |
| Under 35 Years | 43 | 21.8% |
| 35 to 44 Years | 34 | 17.3% |
| 45 to 54 Years | 29 | 14.7% |
| 55 to 64 Years | 30 | 15.2% |
| 65 to 74 Years | 18 | 9.1% |
| 75 to 84 Years | 38 | 19.3% |
| 85 Years and Over | 5 | 2.5% |
| Total | 197 | 100.0% |
Housing Finances in Danube
Median Income by Occupancy in Danube
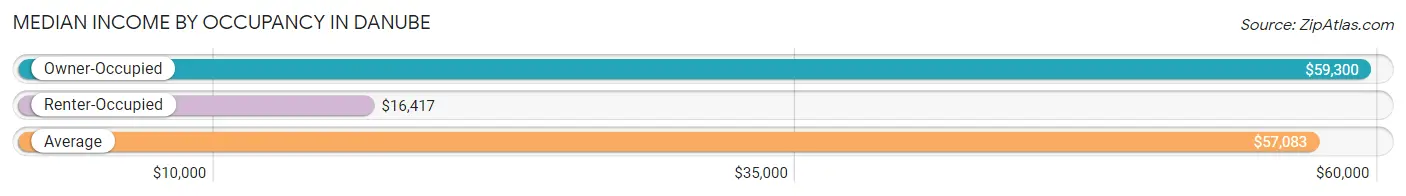
| Occupancy Type | # Households | Median Income |
| Owner-Occupied | 160 (81.2%) | $59,300 |
| Renter-Occupied | 37 (18.8%) | $16,417 |
| Average | 197 (100.0%) | $57,083 |
Occupancy by Householder Income Bracket in Danube
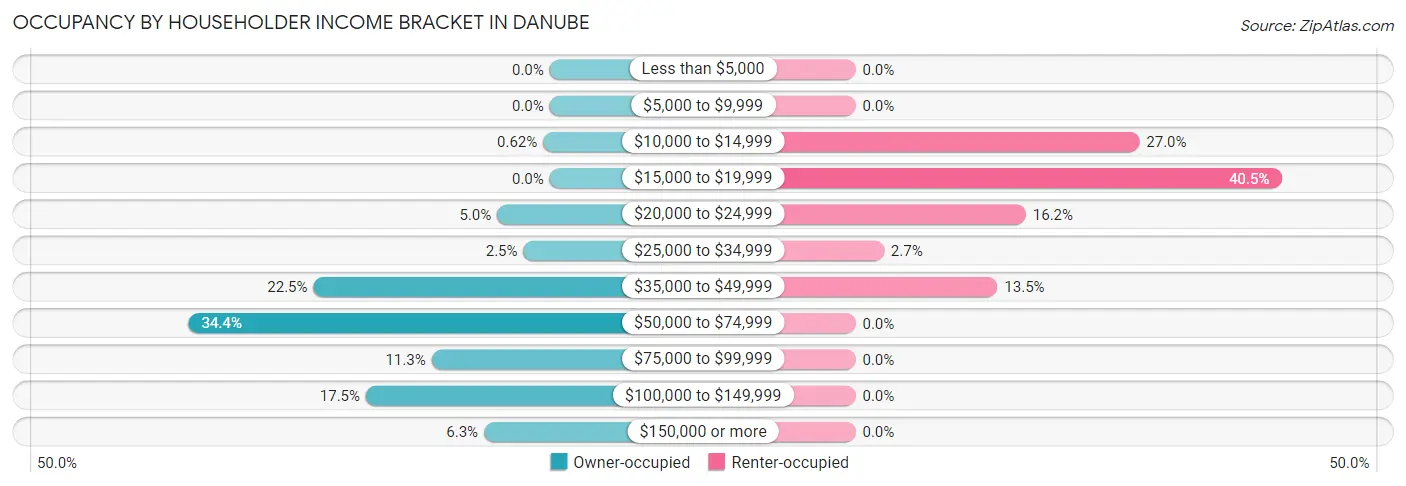
| Income Bracket | Owner-occupied | Renter-occupied |
| Less than $5,000 | 0 (0.0%) | 0 (0.0%) |
| $5,000 to $9,999 | 0 (0.0%) | 0 (0.0%) |
| $10,000 to $14,999 | 1 (0.6%) | 10 (27.0%) |
| $15,000 to $19,999 | 0 (0.0%) | 15 (40.5%) |
| $20,000 to $24,999 | 8 (5.0%) | 6 (16.2%) |
| $25,000 to $34,999 | 4 (2.5%) | 1 (2.7%) |
| $35,000 to $49,999 | 36 (22.5%) | 5 (13.5%) |
| $50,000 to $74,999 | 55 (34.4%) | 0 (0.0%) |
| $75,000 to $99,999 | 18 (11.3%) | 0 (0.0%) |
| $100,000 to $149,999 | 28 (17.5%) | 0 (0.0%) |
| $150,000 or more | 10 (6.2%) | 0 (0.0%) |
| Total | 160 (100.0%) | 37 (100.0%) |
Monthly Housing Cost Tiers in Danube
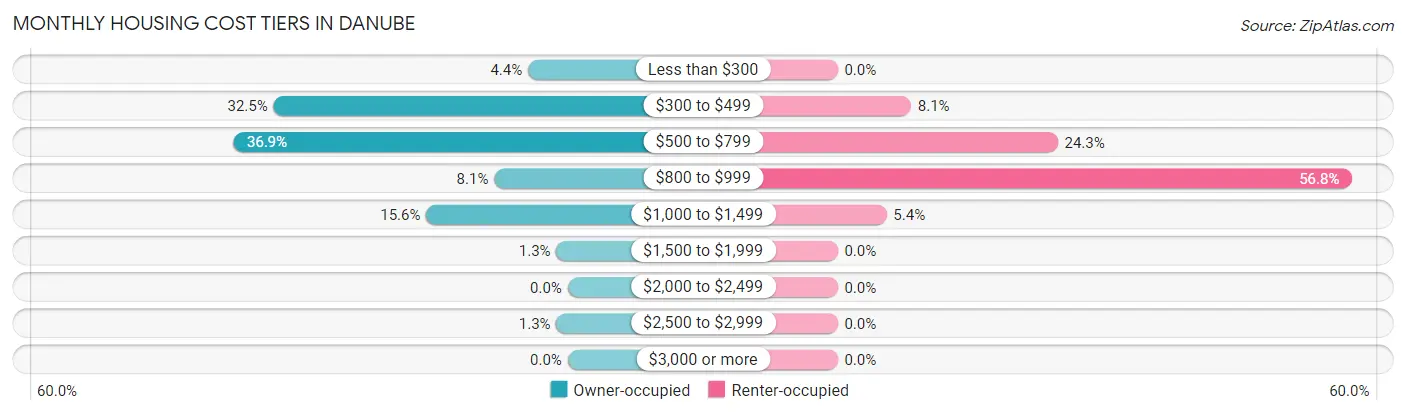
| Monthly Cost | Owner-occupied | Renter-occupied |
| Less than $300 | 7 (4.4%) | 0 (0.0%) |
| $300 to $499 | 52 (32.5%) | 3 (8.1%) |
| $500 to $799 | 59 (36.9%) | 9 (24.3%) |
| $800 to $999 | 13 (8.1%) | 21 (56.8%) |
| $1,000 to $1,499 | 25 (15.6%) | 2 (5.4%) |
| $1,500 to $1,999 | 2 (1.3%) | 0 (0.0%) |
| $2,000 to $2,499 | 0 (0.0%) | 0 (0.0%) |
| $2,500 to $2,999 | 2 (1.3%) | 0 (0.0%) |
| $3,000 or more | 0 (0.0%) | 0 (0.0%) |
| Total | 160 (100.0%) | 37 (100.0%) |
Physical Housing Characteristics in Danube
Housing Structures in Danube
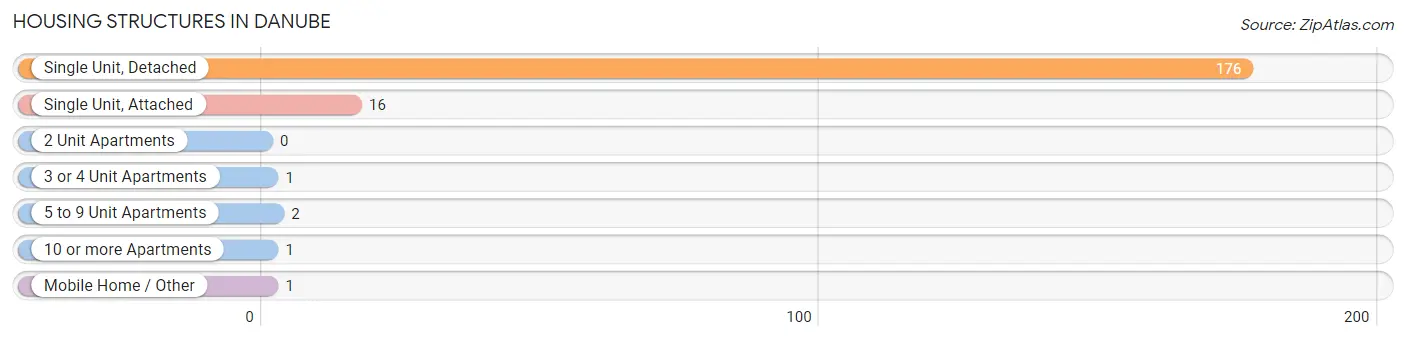
| Structure Type | # Housing Units | % Housing Units |
| Single Unit, Detached | 176 | 89.3% |
| Single Unit, Attached | 16 | 8.1% |
| 2 Unit Apartments | 0 | 0.0% |
| 3 or 4 Unit Apartments | 1 | 0.5% |
| 5 to 9 Unit Apartments | 2 | 1.0% |
| 10 or more Apartments | 1 | 0.5% |
| Mobile Home / Other | 1 | 0.5% |
| Total | 197 | 100.0% |
Housing Structures by Occupancy in Danube
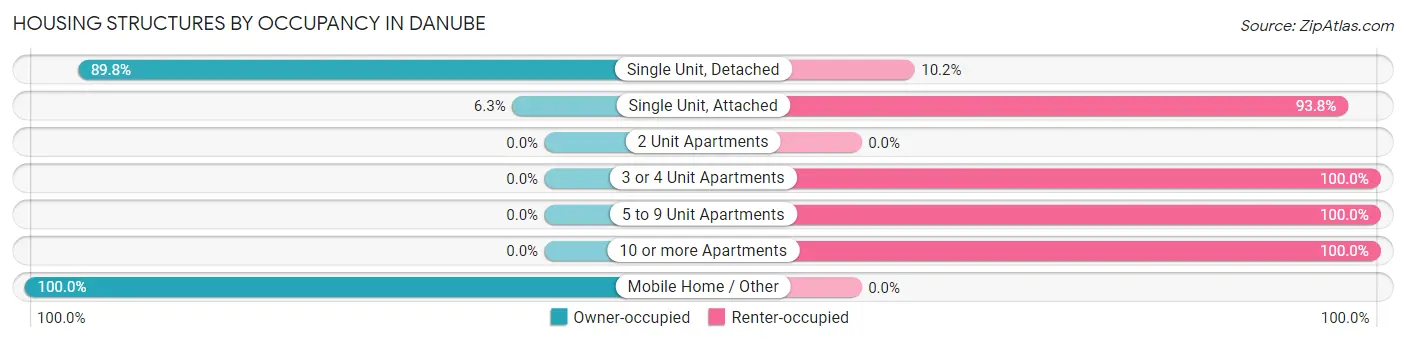
| Structure Type | Owner-occupied | Renter-occupied |
| Single Unit, Detached | 158 (89.8%) | 18 (10.2%) |
| Single Unit, Attached | 1 (6.2%) | 15 (93.8%) |
| 2 Unit Apartments | 0 (0.0%) | 0 (0.0%) |
| 3 or 4 Unit Apartments | 0 (0.0%) | 1 (100.0%) |
| 5 to 9 Unit Apartments | 0 (0.0%) | 2 (100.0%) |
| 10 or more Apartments | 0 (0.0%) | 1 (100.0%) |
| Mobile Home / Other | 1 (100.0%) | 0 (0.0%) |
| Total | 160 (81.2%) | 37 (18.8%) |
Housing Structures by Number of Rooms in Danube
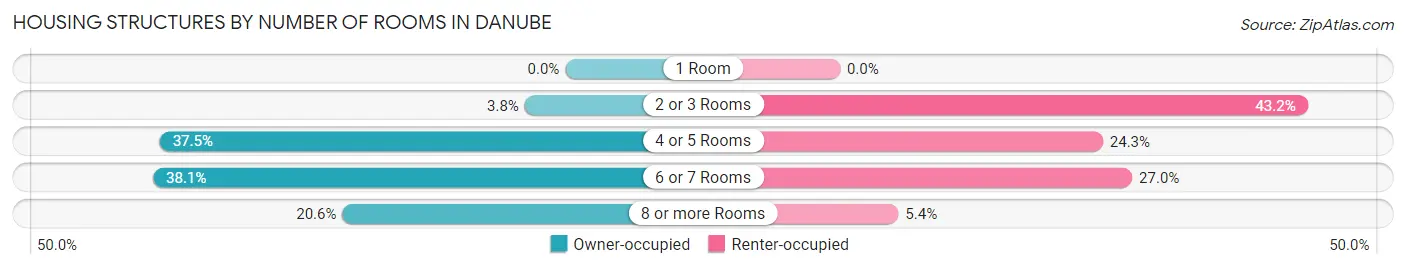
| Number of Rooms | Owner-occupied | Renter-occupied |
| 1 Room | 0 (0.0%) | 0 (0.0%) |
| 2 or 3 Rooms | 6 (3.7%) | 16 (43.2%) |
| 4 or 5 Rooms | 60 (37.5%) | 9 (24.3%) |
| 6 or 7 Rooms | 61 (38.1%) | 10 (27.0%) |
| 8 or more Rooms | 33 (20.6%) | 2 (5.4%) |
| Total | 160 (100.0%) | 37 (100.0%) |
Housing Structure by Heating Type in Danube
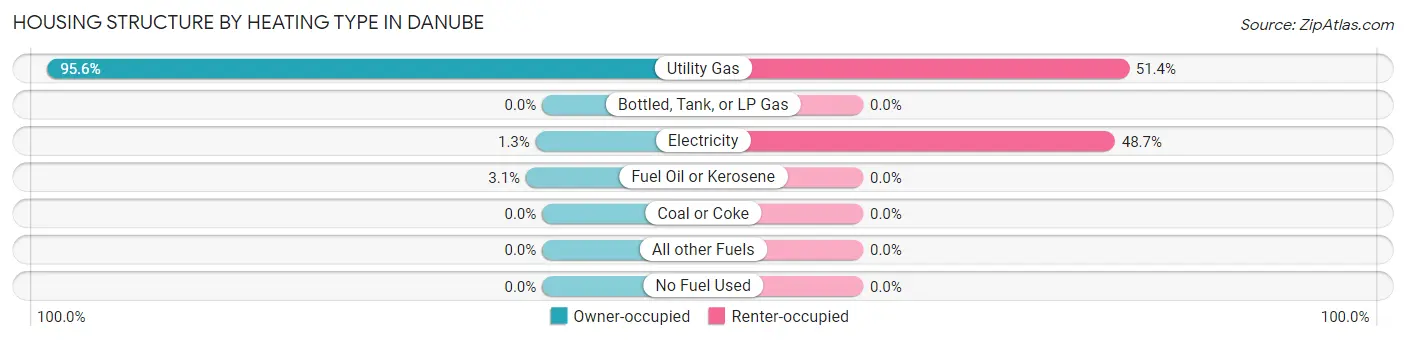
| Heating Type | Owner-occupied | Renter-occupied |
| Utility Gas | 153 (95.6%) | 19 (51.3%) |
| Bottled, Tank, or LP Gas | 0 (0.0%) | 0 (0.0%) |
| Electricity | 2 (1.3%) | 18 (48.6%) |
| Fuel Oil or Kerosene | 5 (3.1%) | 0 (0.0%) |
| Coal or Coke | 0 (0.0%) | 0 (0.0%) |
| All other Fuels | 0 (0.0%) | 0 (0.0%) |
| No Fuel Used | 0 (0.0%) | 0 (0.0%) |
| Total | 160 (100.0%) | 37 (100.0%) |
Household Vehicle Usage in Danube
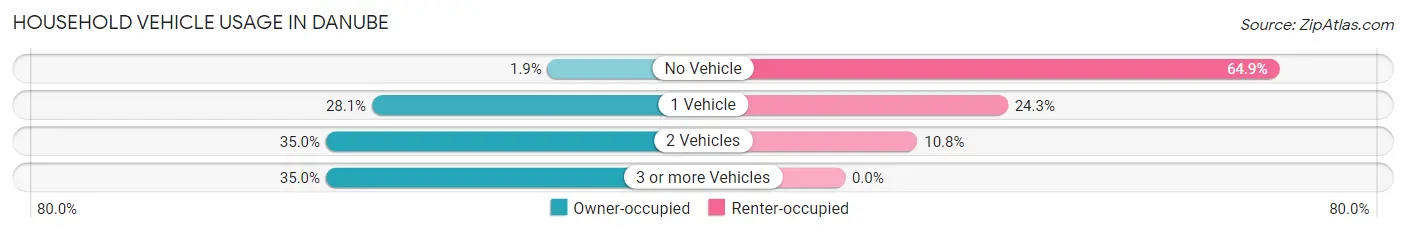
| Vehicles per Household | Owner-occupied | Renter-occupied |
| No Vehicle | 3 (1.9%) | 24 (64.9%) |
| 1 Vehicle | 45 (28.1%) | 9 (24.3%) |
| 2 Vehicles | 56 (35.0%) | 4 (10.8%) |
| 3 or more Vehicles | 56 (35.0%) | 0 (0.0%) |
| Total | 160 (100.0%) | 37 (100.0%) |
Real Estate & Mortgages in Danube
Real Estate and Mortgage Overview in Danube
| Characteristic | Without Mortgage | With Mortgage |
| Housing Units | 91 | 69 |
| Median Property Value | $122,900 | $117,500 |
| Median Household Income | $58,264 | $3 |
| Monthly Housing Costs | $480 | $0 |
| Real Estate Taxes | $1,224 | $0 |
Property Value by Mortgage Status in Danube
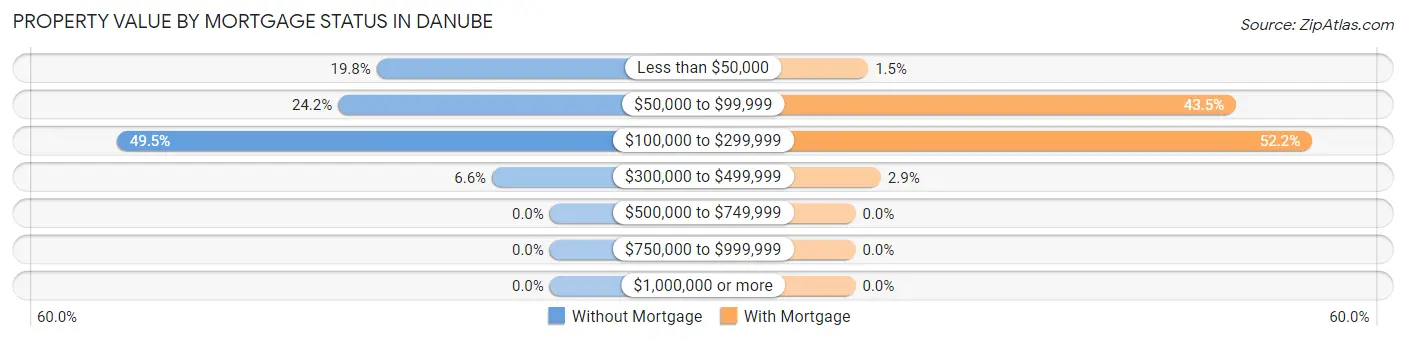
| Property Value | Without Mortgage | With Mortgage |
| Less than $50,000 | 18 (19.8%) | 1 (1.5%) |
| $50,000 to $99,999 | 22 (24.2%) | 30 (43.5%) |
| $100,000 to $299,999 | 45 (49.4%) | 36 (52.2%) |
| $300,000 to $499,999 | 6 (6.6%) | 2 (2.9%) |
| $500,000 to $749,999 | 0 (0.0%) | 0 (0.0%) |
| $750,000 to $999,999 | 0 (0.0%) | 0 (0.0%) |
| $1,000,000 or more | 0 (0.0%) | 0 (0.0%) |
| Total | 91 (100.0%) | 69 (100.0%) |
Household Income by Mortgage Status in Danube
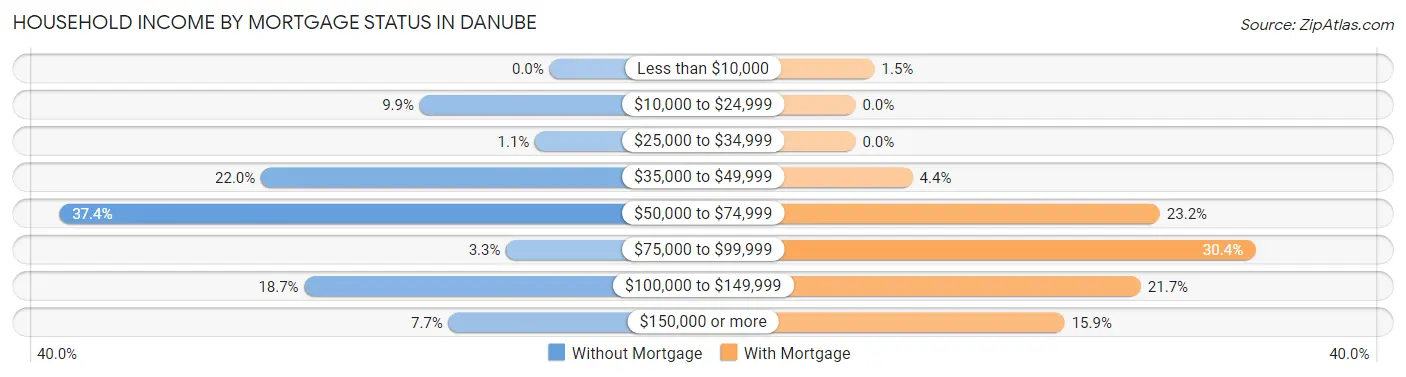
| Household Income | Without Mortgage | With Mortgage |
| Less than $10,000 | 0 (0.0%) | 1 (1.5%) |
| $10,000 to $24,999 | 9 (9.9%) | 0 (0.0%) |
| $25,000 to $34,999 | 1 (1.1%) | 0 (0.0%) |
| $35,000 to $49,999 | 20 (22.0%) | 3 (4.3%) |
| $50,000 to $74,999 | 34 (37.4%) | 16 (23.2%) |
| $75,000 to $99,999 | 3 (3.3%) | 21 (30.4%) |
| $100,000 to $149,999 | 17 (18.7%) | 15 (21.7%) |
| $150,000 or more | 7 (7.7%) | 11 (15.9%) |
| Total | 91 (100.0%) | 69 (100.0%) |
Property Value to Household Income Ratio in Danube
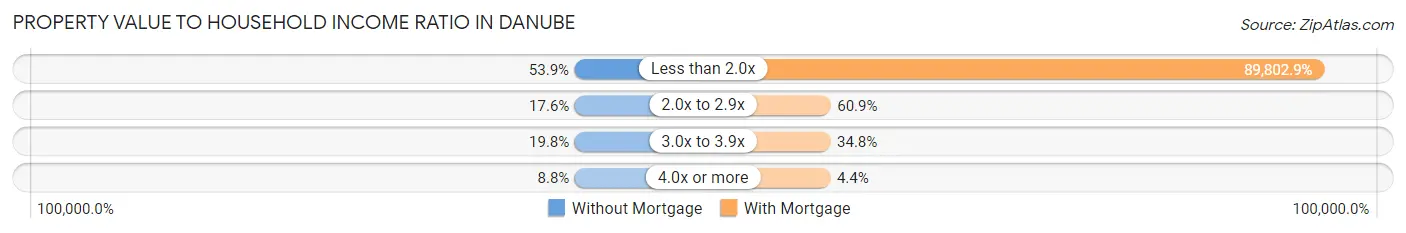
| Value-to-Income Ratio | Without Mortgage | With Mortgage |
| Less than 2.0x | 49 (53.8%) | 61,964 (89,802.9%) |
| 2.0x to 2.9x | 16 (17.6%) | 42 (60.9%) |
| 3.0x to 3.9x | 18 (19.8%) | 24 (34.8%) |
| 4.0x or more | 8 (8.8%) | 3 (4.3%) |
| Total | 91 (100.0%) | 69 (100.0%) |
Real Estate Taxes by Mortgage Status in Danube
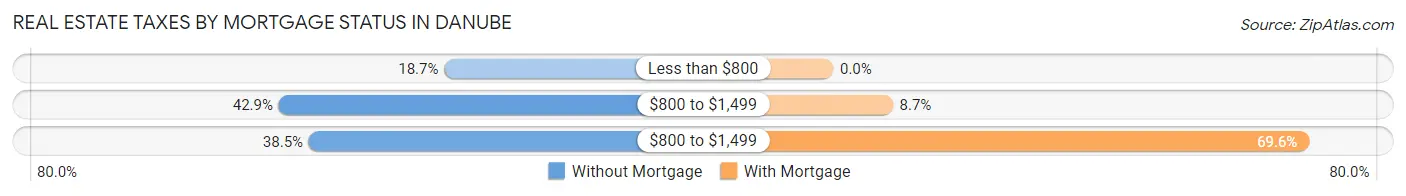
| Property Taxes | Without Mortgage | With Mortgage |
| Less than $800 | 17 (18.7%) | 0 (0.0%) |
| $800 to $1,499 | 39 (42.9%) | 6 (8.7%) |
| $800 to $1,499 | 35 (38.5%) | 48 (69.6%) |
| Total | 91 (100.0%) | 69 (100.0%) |
Health & Disability in Danube
Health Insurance Coverage by Age in Danube
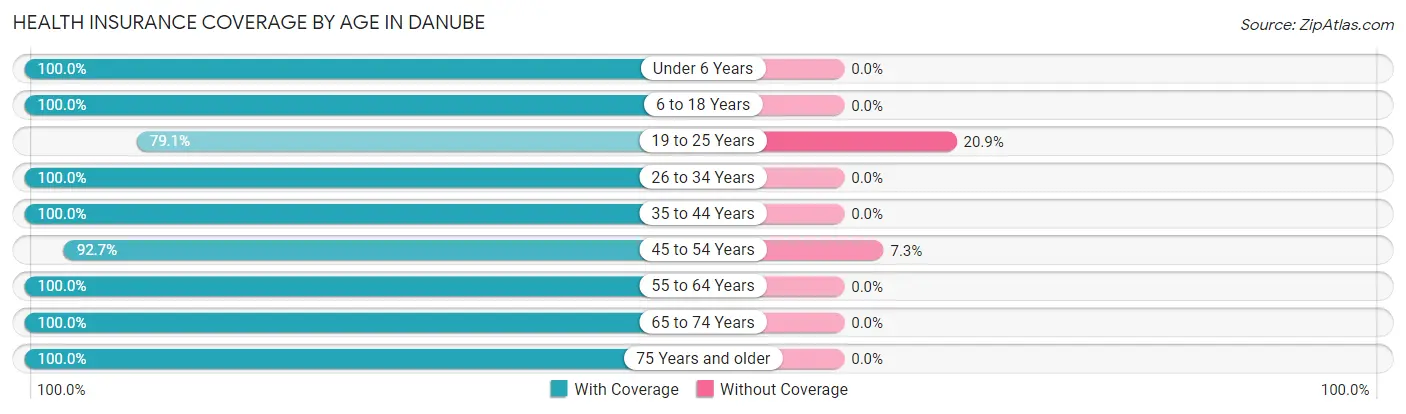
| Age Bracket | With Coverage | Without Coverage |
| Under 6 Years | 47 (100.0%) | 0 (0.0%) |
| 6 to 18 Years | 66 (100.0%) | 0 (0.0%) |
| 19 to 25 Years | 34 (79.1%) | 9 (20.9%) |
| 26 to 34 Years | 53 (100.0%) | 0 (0.0%) |
| 35 to 44 Years | 69 (100.0%) | 0 (0.0%) |
| 45 to 54 Years | 38 (92.7%) | 3 (7.3%) |
| 55 to 64 Years | 42 (100.0%) | 0 (0.0%) |
| 65 to 74 Years | 48 (100.0%) | 0 (0.0%) |
| 75 Years and older | 49 (100.0%) | 0 (0.0%) |
| Total | 446 (97.4%) | 12 (2.6%) |
Health Insurance Coverage by Citizenship Status in Danube
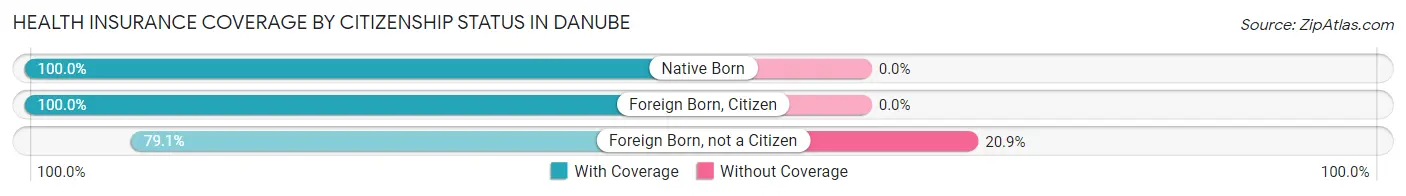
| Citizenship Status | With Coverage | Without Coverage |
| Native Born | 47 (100.0%) | 0 (0.0%) |
| Foreign Born, Citizen | 66 (100.0%) | 0 (0.0%) |
| Foreign Born, not a Citizen | 34 (79.1%) | 9 (20.9%) |
Health Insurance Coverage by Household Income in Danube
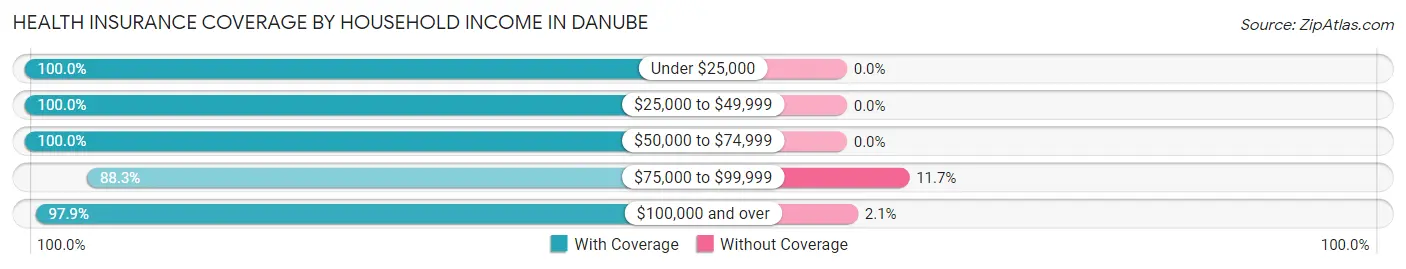
| Household Income | With Coverage | Without Coverage |
| Under $25,000 | 54 (100.0%) | 0 (0.0%) |
| $25,000 to $49,999 | 106 (100.0%) | 0 (0.0%) |
| $50,000 to $74,999 | 76 (100.0%) | 0 (0.0%) |
| $75,000 to $99,999 | 68 (88.3%) | 9 (11.7%) |
| $100,000 and over | 142 (97.9%) | 3 (2.1%) |
Public vs Private Health Insurance Coverage by Age in Danube
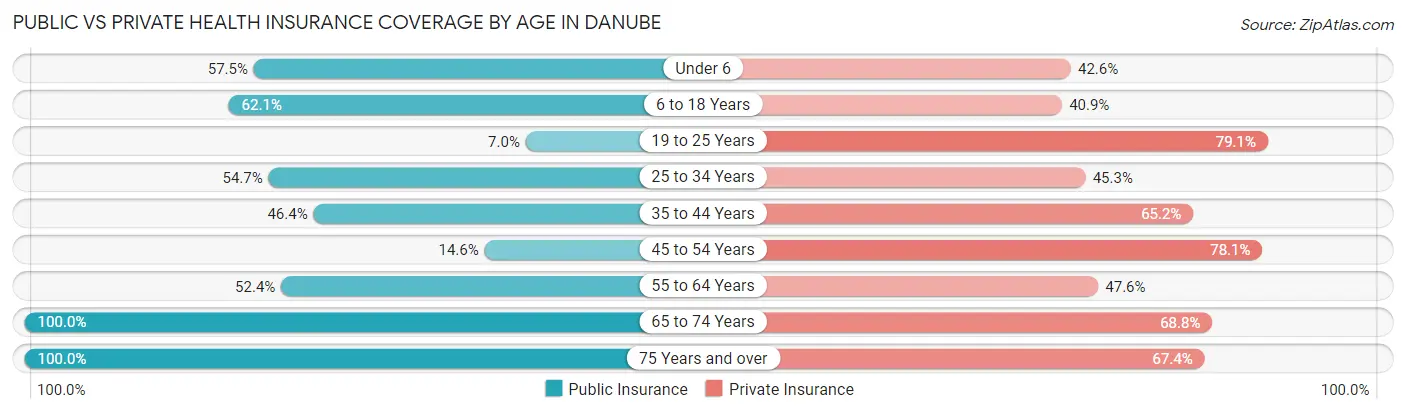
| Age Bracket | Public Insurance | Private Insurance |
| Under 6 | 27 (57.5%) | 20 (42.5%) |
| 6 to 18 Years | 41 (62.1%) | 27 (40.9%) |
| 19 to 25 Years | 3 (7.0%) | 34 (79.1%) |
| 25 to 34 Years | 29 (54.7%) | 24 (45.3%) |
| 35 to 44 Years | 32 (46.4%) | 45 (65.2%) |
| 45 to 54 Years | 6 (14.6%) | 32 (78.0%) |
| 55 to 64 Years | 22 (52.4%) | 20 (47.6%) |
| 65 to 74 Years | 48 (100.0%) | 33 (68.8%) |
| 75 Years and over | 49 (100.0%) | 33 (67.3%) |
| Total | 257 (56.1%) | 268 (58.5%) |
Disability Status by Sex by Age in Danube
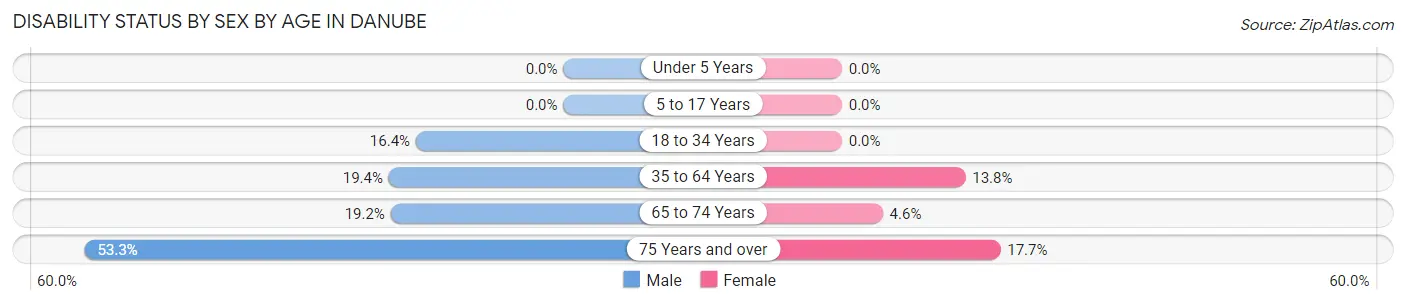
| Age Bracket | Male | Female |
| Under 5 Years | 0 (0.0%) | 0 (0.0%) |
| 5 to 17 Years | 0 (0.0%) | 0 (0.0%) |
| 18 to 34 Years | 11 (16.4%) | 0 (0.0%) |
| 35 to 64 Years | 14 (19.4%) | 11 (13.8%) |
| 65 to 74 Years | 5 (19.2%) | 1 (4.5%) |
| 75 Years and over | 8 (53.3%) | 6 (17.6%) |
Disability Class by Sex by Age in Danube
Disability Class: Hearing Difficulty
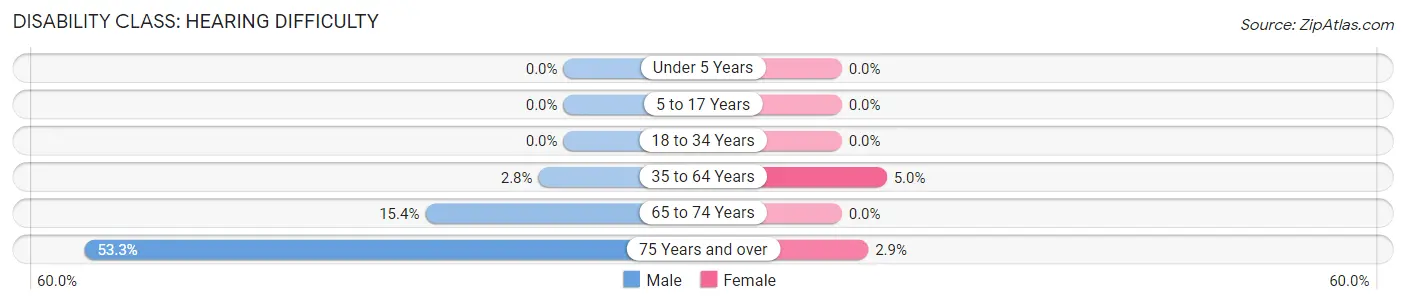
| Age Bracket | Male | Female |
| Under 5 Years | 0 (0.0%) | 0 (0.0%) |
| 5 to 17 Years | 0 (0.0%) | 0 (0.0%) |
| 18 to 34 Years | 0 (0.0%) | 0 (0.0%) |
| 35 to 64 Years | 2 (2.8%) | 4 (5.0%) |
| 65 to 74 Years | 4 (15.4%) | 0 (0.0%) |
| 75 Years and over | 8 (53.3%) | 1 (2.9%) |
Disability Class: Vision Difficulty
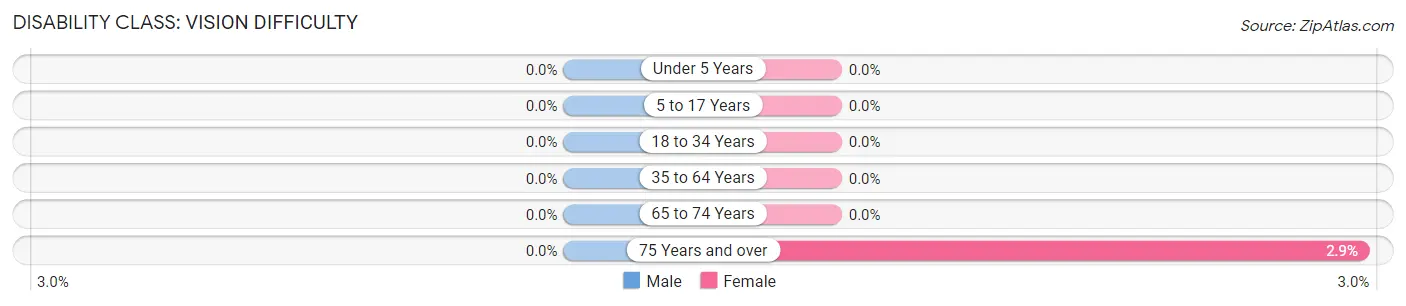
| Age Bracket | Male | Female |
| Under 5 Years | 0 (0.0%) | 0 (0.0%) |
| 5 to 17 Years | 0 (0.0%) | 0 (0.0%) |
| 18 to 34 Years | 0 (0.0%) | 0 (0.0%) |
| 35 to 64 Years | 0 (0.0%) | 0 (0.0%) |
| 65 to 74 Years | 0 (0.0%) | 0 (0.0%) |
| 75 Years and over | 0 (0.0%) | 1 (2.9%) |
Disability Class: Cognitive Difficulty
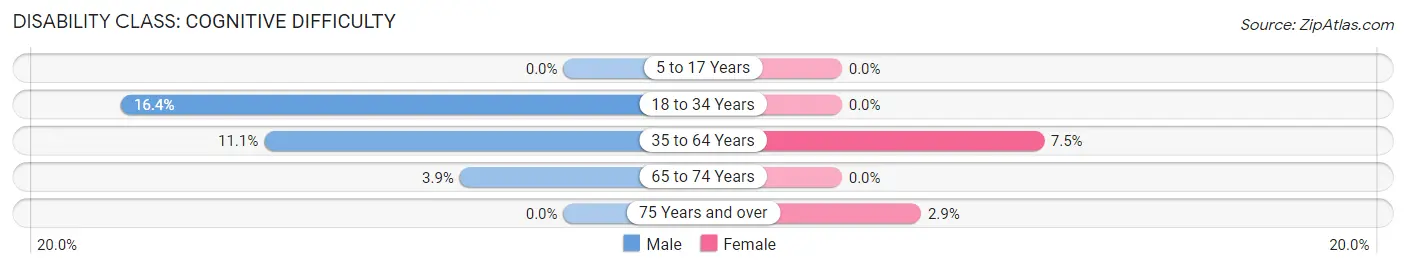
| Age Bracket | Male | Female |
| 5 to 17 Years | 0 (0.0%) | 0 (0.0%) |
| 18 to 34 Years | 11 (16.4%) | 0 (0.0%) |
| 35 to 64 Years | 8 (11.1%) | 6 (7.5%) |
| 65 to 74 Years | 1 (3.8%) | 0 (0.0%) |
| 75 Years and over | 0 (0.0%) | 1 (2.9%) |
Disability Class: Ambulatory Difficulty
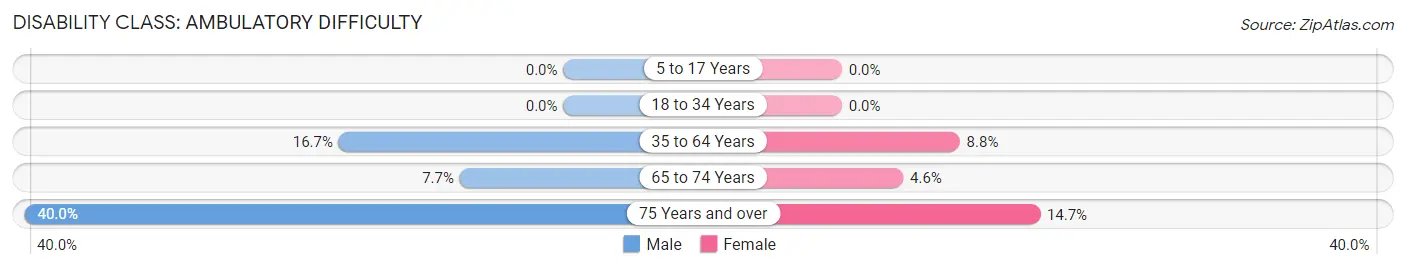
| Age Bracket | Male | Female |
| 5 to 17 Years | 0 (0.0%) | 0 (0.0%) |
| 18 to 34 Years | 0 (0.0%) | 0 (0.0%) |
| 35 to 64 Years | 12 (16.7%) | 7 (8.7%) |
| 65 to 74 Years | 2 (7.7%) | 1 (4.5%) |
| 75 Years and over | 6 (40.0%) | 5 (14.7%) |
Disability Class: Self-Care Difficulty
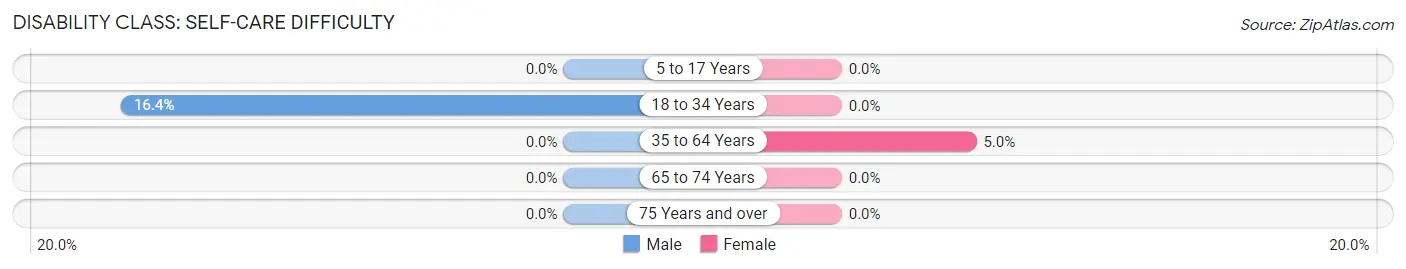
| Age Bracket | Male | Female |
| 5 to 17 Years | 0 (0.0%) | 0 (0.0%) |
| 18 to 34 Years | 11 (16.4%) | 0 (0.0%) |
| 35 to 64 Years | 0 (0.0%) | 4 (5.0%) |
| 65 to 74 Years | 0 (0.0%) | 0 (0.0%) |
| 75 Years and over | 0 (0.0%) | 0 (0.0%) |
Technology Access in Danube
Computing Device Access in Danube
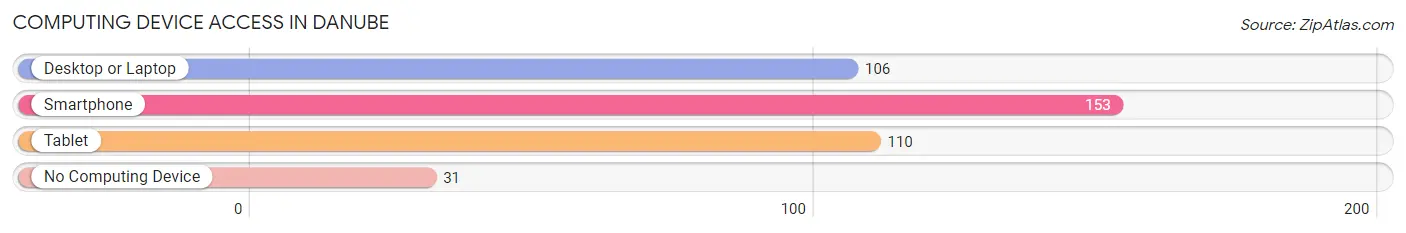
| Device Type | # Households | % Households |
| Desktop or Laptop | 106 | 53.8% |
| Smartphone | 153 | 77.7% |
| Tablet | 110 | 55.8% |
| No Computing Device | 31 | 15.7% |
| Total | 197 | 100.0% |
Internet Access in Danube
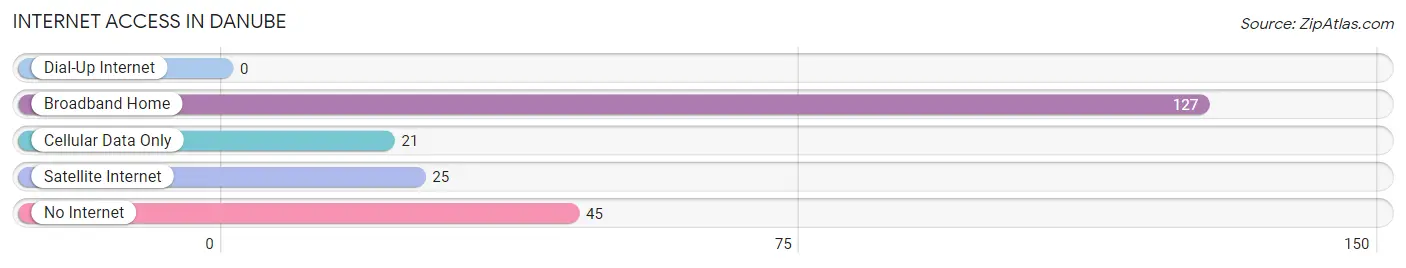
| Internet Type | # Households | % Households |
| Dial-Up Internet | 0 | 0.0% |
| Broadband Home | 127 | 64.5% |
| Cellular Data Only | 21 | 10.7% |
| Satellite Internet | 25 | 12.7% |
| No Internet | 45 | 22.8% |
| Total | 197 | 100.0% |
Danube Summary
Danube, Minnesota is a small city located in the western part of the state, in the heart of the Red River Valley. It is situated in the middle of the Red River Valley, which is a large agricultural area. The city is located in the county of Renville, and is part of the larger region known as the Minnesota River Valley. The city is located on the banks of the Red River, and is surrounded by rolling hills and farmland.
History
The area that is now Danube was first settled in the late 1800s by German immigrants. The city was originally known as “New Danube”, and was founded in 1883. The city was named after the Danube River in Europe, and was intended to be a place for German immigrants to settle and start a new life. The city was incorporated in 1887, and the first mayor was elected in 1888.
The city grew rapidly in the early 1900s, and by 1910 the population had grown to over 1,000 people. The city was a major center for the agricultural industry, and was home to several grain elevators and other businesses. The city also had a large number of churches, and was a major center for the Lutheran faith.
In the 1920s, the city began to experience a decline in population, as many of the German immigrants moved away. The city was also affected by the Great Depression, and the population dropped to just over 500 people by 1940. The city experienced a resurgence in the 1950s, as the agricultural industry began to recover. The population grew to over 1,000 people by 1960, and has remained relatively stable since then.
Geography
Danube is located in the western part of Minnesota, in the heart of the Red River Valley. The city is situated in the middle of the Red River Valley, which is a large agricultural area. The city is located on the banks of the Red River, and is surrounded by rolling hills and farmland. The city is located in the county of Renville, and is part of the larger region known as the Minnesota River Valley.
The city has a total area of 1.2 square miles, all of which is land. The city is located at an elevation of 1,072 feet above sea level. The climate in Danube is classified as humid continental, with cold winters and hot summers. The average annual temperature is around 40 degrees Fahrenheit, and the average annual precipitation is around 28 inches.
Economy
The economy of Danube is largely based on agriculture. The city is located in the heart of the Red River Valley, which is a major agricultural area. The city is home to several grain elevators, and is a major center for the production of wheat, corn, and other grains. The city is also home to several dairy farms, and is a major center for the production of dairy products.
The city is also home to several manufacturing companies, including a furniture factory and a plastics factory. The city is also home to several retail stores, including a grocery store, a hardware store, and a clothing store. The city is also home to several restaurants, and is a popular destination for tourists.
Demographics
As of the 2010 census, the population of Danube was 1,092 people. The racial makeup of the city was 97.3% White, 0.7% African American, 0.2% Native American, 0.2% Asian, 0.2% from other races, and 1.6% from two or more races. Hispanic or Latino of any race were 1.2% of the population.
The median income for a household in the city was $41,250, and the median income for a family was $50,000. The per capita income for the city was $19,945. About 8.3% of families and 10.2% of the population were below the poverty line, including 14.3% of those under age 18 and 8.3% of those age 65 or over.
Common Questions
What is Per Capita Income in Danube?
Per Capita income in Danube is $32,291.
What is the Median Family Income in Danube?
Median Family Income in Danube is $67,500.
What is the Median Household income in Danube?
Median Household Income in Danube is $57,083.
What is Income or Wage Gap in Danube?
Income or Wage Gap in Danube is 49.7%.
Women in Danube earn 50.3 cents for every dollar earned by a man.
What is Inequality or Gini Index in Danube?
Inequality or Gini Index in Danube is 0.42.
What is the Total Population of Danube?
Total Population of Danube is 458.
What is the Total Male Population of Danube?
Total Male Population of Danube is 249.
What is the Total Female Population of Danube?
Total Female Population of Danube is 209.
What is the Ratio of Males per 100 Females in Danube?
There are 119.14 Males per 100 Females in Danube.
What is the Ratio of Females per 100 Males in Danube?
There are 83.94 Females per 100 Males in Danube.
What is the Median Population Age in Danube?
Median Population Age in Danube is 36.0 Years.
What is the Average Family Size in Danube
Average Family Size in Danube is 3.1 People.
What is the Average Household Size in Danube
Average Household Size in Danube is 2.3 People.
How Large is the Labor Force in Danube?
There are 224 People in the Labor Forcein in Danube.
What is the Percentage of People in the Labor Force in Danube?
64.0% of People are in the Labor Force in Danube.
What is the Unemployment Rate in Danube?
Unemployment Rate in Danube is 0.4%.