Crosby, MN Map & Demographics
Crosby Map
Crosby Overview
$33,109
PER CAPITA INCOME
$56,324
AVG FAMILY INCOME
$42,973
AVG HOUSEHOLD INCOME
21.7%
WAGE / INCOME GAP [ % ]
78.3¢/ $1
WAGE / INCOME GAP [ $ ]
$11,485
FAMILY INCOME DEFICIT
0.51
INEQUALITY / GINI INDEX
2,519
TOTAL POPULATION
1,178
MALE POPULATION
1,341
FEMALE POPULATION
87.84
MALES / 100 FEMALES
113.84
FEMALES / 100 MALES
50.4
MEDIAN AGE
2.9
AVG FAMILY SIZE
2.0
AVG HOUSEHOLD SIZE
989
LABOR FORCE [ PEOPLE ]
45.6%
PERCENT IN LABOR FORCE
5.4%
UNEMPLOYMENT RATE
Crosby Zip Codes
Crosby Area Codes
Income in Crosby
Income Overview in Crosby
Per Capita Income in Crosby is $33,109, while median incomes of families and households are $56,324 and $42,973 respectively.
| Characteristic | Number | Measure |
| Per Capita Income | 2,519 | $33,109 |
| Median Family Income | 540 | $56,324 |
| Mean Family Income | 540 | $85,057 |
| Median Household Income | 1,212 | $42,973 |
| Mean Household Income | 1,212 | $65,615 |
| Income Deficit | 540 | $11,485 |
| Wage / Income Gap (%) | 2,519 | 21.70% |
| Wage / Income Gap ($) | 2,519 | 78.30¢ per $1 |
| Gini / Inequality Index | 2,519 | 0.51 |
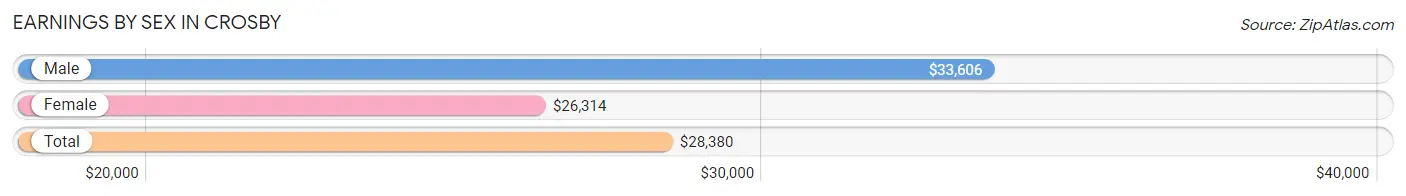
Earnings by Sex in Crosby
Average Earnings in Crosby are $28,380, $33,606 for men and $26,314 for women, a difference of 21.7%.
| Sex | Number | Average Earnings |
| Male | 609 (54.0%) | $33,606 |
| Female | 518 (46.0%) | $26,314 |
| Total | 1,127 (100.0%) | $28,380 |
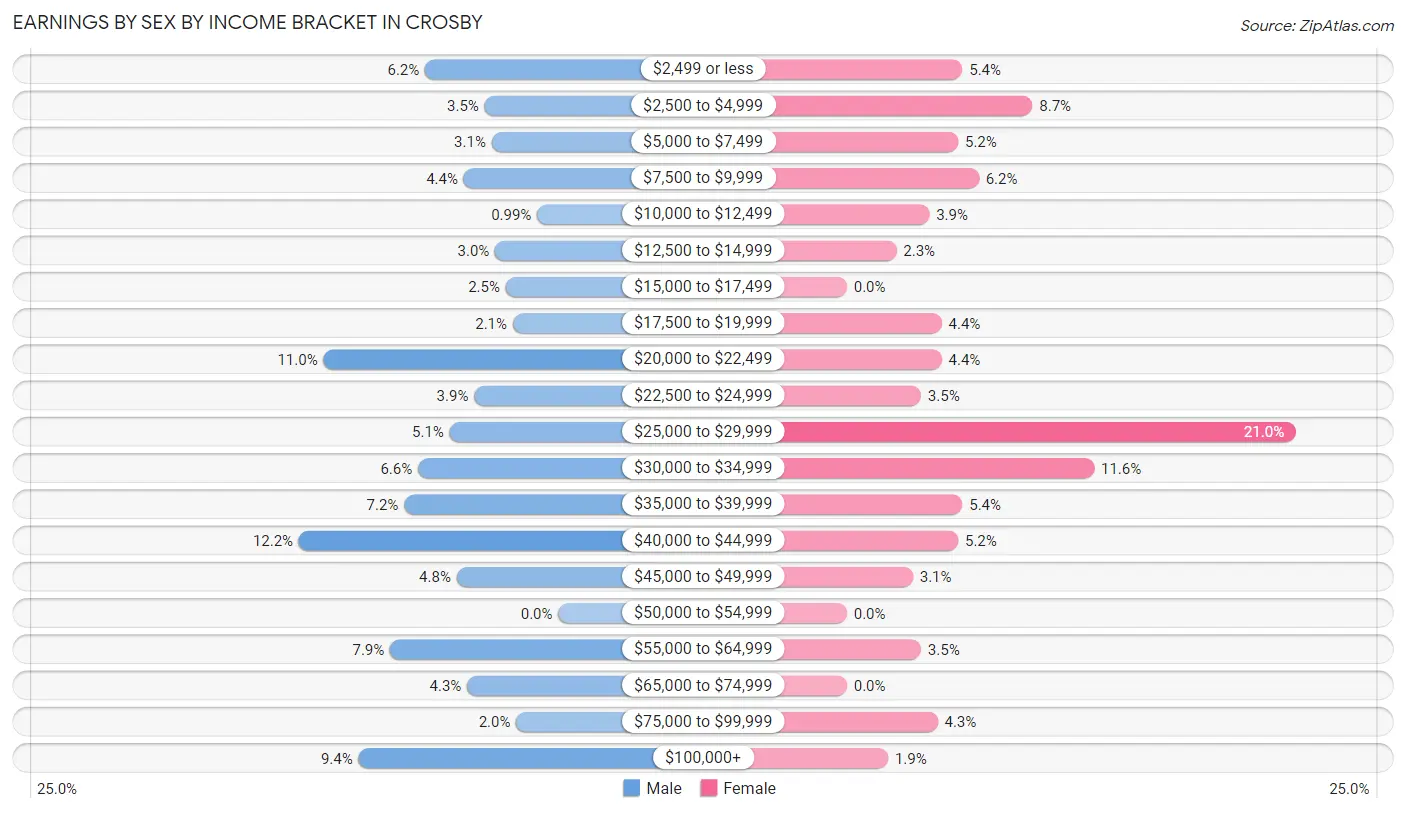
Earnings by Sex by Income Bracket in Crosby
The most common earnings brackets in Crosby are $40,000 to $44,999 for men (74 | 12.1%) and $25,000 to $29,999 for women (109 | 21.0%).
| Income | Male | Female |
| $2,499 or less | 38 (6.2%) | 28 (5.4%) |
| $2,500 to $4,999 | 21 (3.5%) | 45 (8.7%) |
| $5,000 to $7,499 | 19 (3.1%) | 27 (5.2%) |
| $7,500 to $9,999 | 27 (4.4%) | 32 (6.2%) |
| $10,000 to $12,499 | 6 (1.0%) | 20 (3.9%) |
| $12,500 to $14,999 | 18 (3.0%) | 12 (2.3%) |
| $15,000 to $17,499 | 15 (2.5%) | 0 (0.0%) |
| $17,500 to $19,999 | 13 (2.1%) | 23 (4.4%) |
| $20,000 to $22,499 | 67 (11.0%) | 23 (4.4%) |
| $22,500 to $24,999 | 24 (3.9%) | 18 (3.5%) |
| $25,000 to $29,999 | 31 (5.1%) | 109 (21.0%) |
| $30,000 to $34,999 | 40 (6.6%) | 60 (11.6%) |
| $35,000 to $39,999 | 44 (7.2%) | 28 (5.4%) |
| $40,000 to $44,999 | 74 (12.1%) | 27 (5.2%) |
| $45,000 to $49,999 | 29 (4.8%) | 16 (3.1%) |
| $50,000 to $54,999 | 0 (0.0%) | 0 (0.0%) |
| $55,000 to $64,999 | 48 (7.9%) | 18 (3.5%) |
| $65,000 to $74,999 | 26 (4.3%) | 0 (0.0%) |
| $75,000 to $99,999 | 12 (2.0%) | 22 (4.3%) |
| $100,000+ | 57 (9.4%) | 10 (1.9%) |
| Total | 609 (100.0%) | 518 (100.0%) |
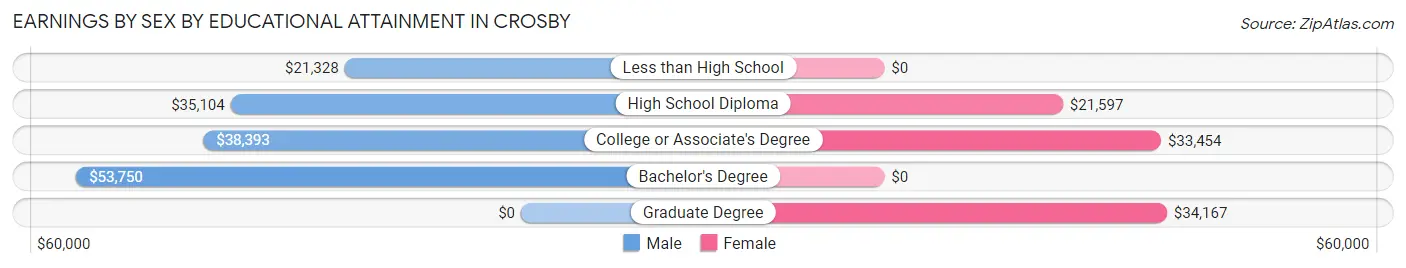
Earnings by Sex by Educational Attainment in Crosby
Average earnings in Crosby are $37,277 for men and $27,475 for women, a difference of 26.3%. Men with an educational attainment of bachelor's degree enjoy the highest average annual earnings of $53,750, while those with less than high school education earn the least with $21,328. Women with an educational attainment of graduate degree earn the most with the average annual earnings of $34,167, while those with high school diploma education have the smallest earnings of $21,597.
| Educational Attainment | Male Income | Female Income |
| Less than High School | $21,328 | $0 |
| High School Diploma | $35,104 | $21,597 |
| College or Associate's Degree | $38,393 | $33,454 |
| Bachelor's Degree | $53,750 | $0 |
| Graduate Degree | - | - |
| Total | $37,277 | $27,475 |
Family Income in Crosby
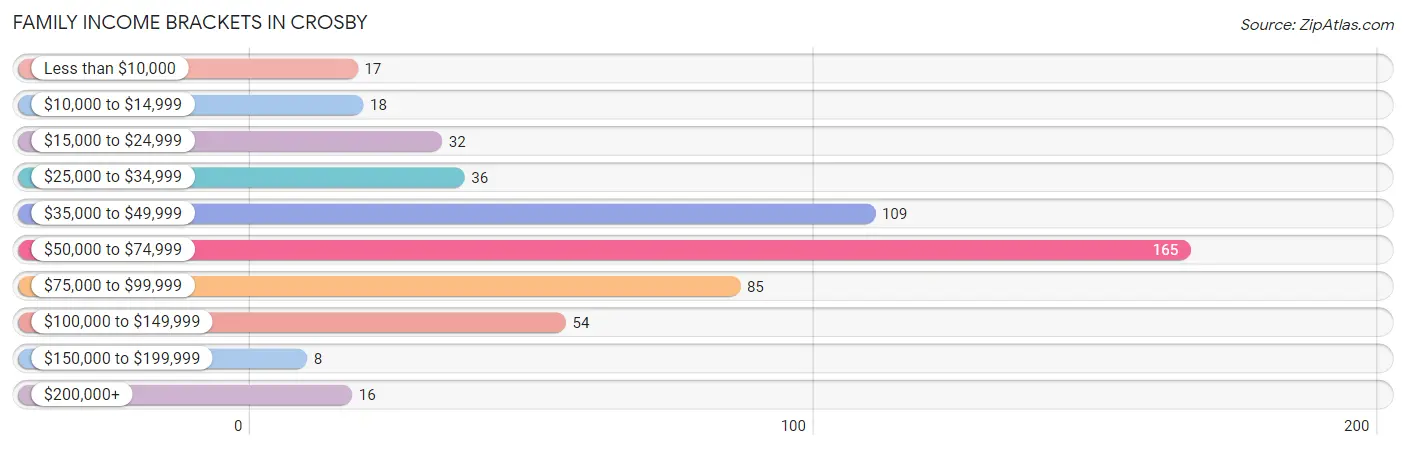
Family Income Brackets in Crosby
According to the Crosby family income data, there are 165 families falling into the $50,000 to $74,999 income range, which is the most common income bracket and makes up 30.6% of all families. Conversely, the $150,000 to $199,999 income bracket is the least frequent group with only 8 families (1.5%) belonging to this category.
| Income Bracket | # Families | % Families |
| Less than $10,000 | 17 | 3.1% |
| $10,000 to $14,999 | 18 | 3.3% |
| $15,000 to $24,999 | 32 | 5.9% |
| $25,000 to $34,999 | 36 | 6.7% |
| $35,000 to $49,999 | 109 | 20.2% |
| $50,000 to $74,999 | 165 | 30.6% |
| $75,000 to $99,999 | 85 | 15.7% |
| $100,000 to $149,999 | 54 | 10.0% |
| $150,000 to $199,999 | 8 | 1.5% |
| $200,000+ | 16 | 3.0% |
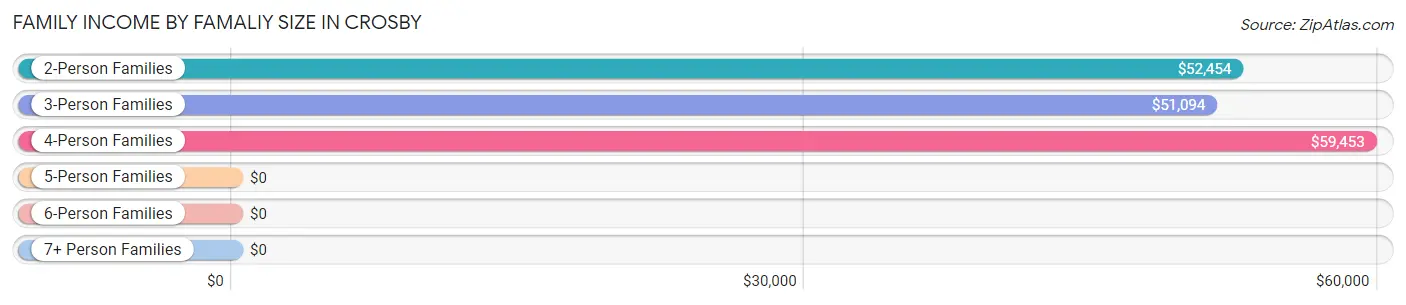
Family Income by Famaliy Size in Crosby
4-person families (66 | 12.2%) account for the highest median family income in Crosby with $59,453 per family, while 2-person families (301 | 55.7%) have the highest median income of $26,227 per family member.
| Income Bracket | # Families | Median Income |
| 2-Person Families | 301 (55.7%) | $52,454 |
| 3-Person Families | 140 (25.9%) | $51,094 |
| 4-Person Families | 66 (12.2%) | $59,453 |
| 5-Person Families | 9 (1.7%) | $0 |
| 6-Person Families | 14 (2.6%) | $0 |
| 7+ Person Families | 10 (1.8%) | $0 |
| Total | 540 (100.0%) | $56,324 |
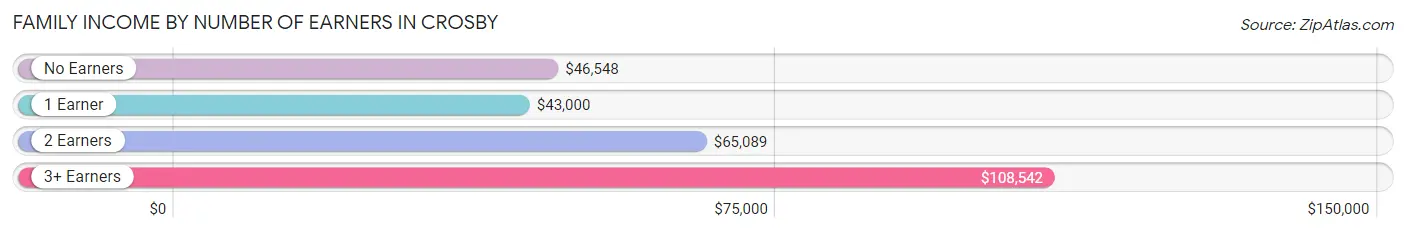
Family Income by Number of Earners in Crosby
The median family income in Crosby is $56,324, with families comprising 3+ earners (43) having the highest median family income of $108,542, while families with 1 earner (166) have the lowest median family income of $43,000, accounting for 8.0% and 30.7% of families, respectively.
| Number of Earners | # Families | Median Income |
| No Earners | 152 (28.1%) | $46,548 |
| 1 Earner | 166 (30.7%) | $43,000 |
| 2 Earners | 179 (33.2%) | $65,089 |
| 3+ Earners | 43 (8.0%) | $108,542 |
| Total | 540 (100.0%) | $56,324 |
Household Income in Crosby
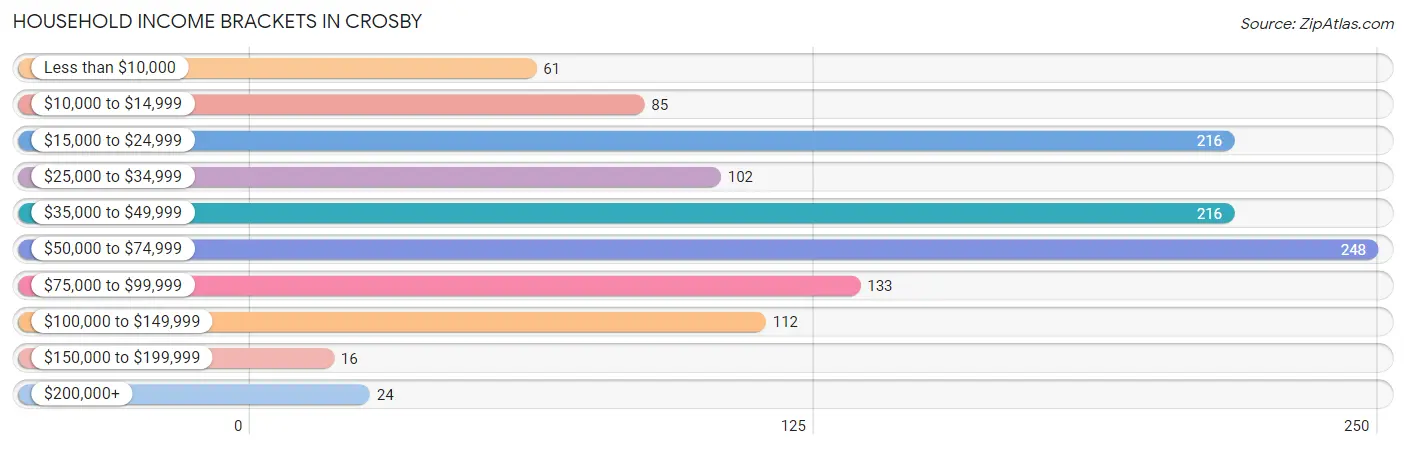
Household Income Brackets in Crosby
With 248 households falling in the category, the $50,000 to $74,999 income range is the most frequent in Crosby, accounting for 20.5% of all households. In contrast, only 16 households (1.3%) fall into the $150,000 to $199,999 income bracket, making it the least populous group.
| Income Bracket | # Households | % Households |
| Less than $10,000 | 61 | 5.0% |
| $10,000 to $14,999 | 85 | 7.0% |
| $15,000 to $24,999 | 216 | 17.8% |
| $25,000 to $34,999 | 102 | 8.4% |
| $35,000 to $49,999 | 216 | 17.8% |
| $50,000 to $74,999 | 248 | 20.5% |
| $75,000 to $99,999 | 133 | 11.0% |
| $100,000 to $149,999 | 112 | 9.2% |
| $150,000 to $199,999 | 16 | 1.3% |
| $200,000+ | 24 | 2.0% |
Household Income by Householder Age in Crosby
The median household income in Crosby is $42,973, with the highest median household income of $53,571 found in the 45 to 64 years age bracket for the primary householder. A total of 324 households (26.7%) fall into this category. Meanwhile, the 65+ years age bracket for the primary householder has the lowest median household income of $25,515, with 507 households (41.8%) in this group.
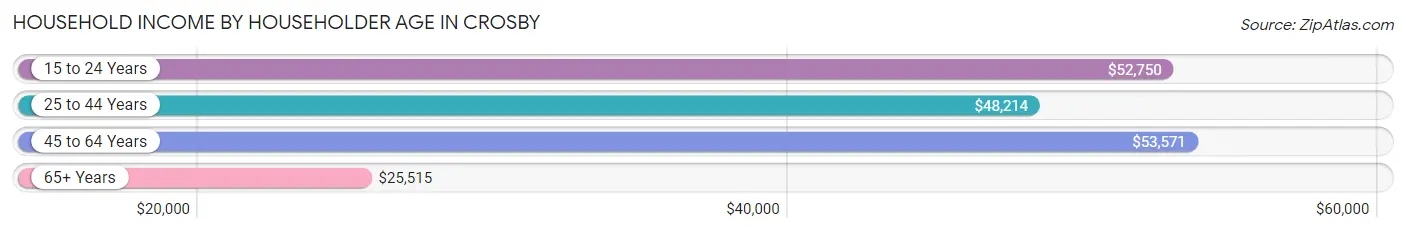
| Income Bracket | # Households | Median Income |
| 15 to 24 Years | 27 (2.2%) | $52,750 |
| 25 to 44 Years | 354 (29.2%) | $48,214 |
| 45 to 64 Years | 324 (26.7%) | $53,571 |
| 65+ Years | 507 (41.8%) | $25,515 |
| Total | 1,212 (100.0%) | $42,973 |
Poverty in Crosby
Income Below Poverty by Sex and Age in Crosby
With 15.3% poverty level for males and 23.4% for females among the residents of Crosby, 16 and 17 year old males and 12 to 14 year old females are the most vulnerable to poverty, with 29 males (85.3%) and 9 females (100.0%) in their respective age groups living below the poverty level.
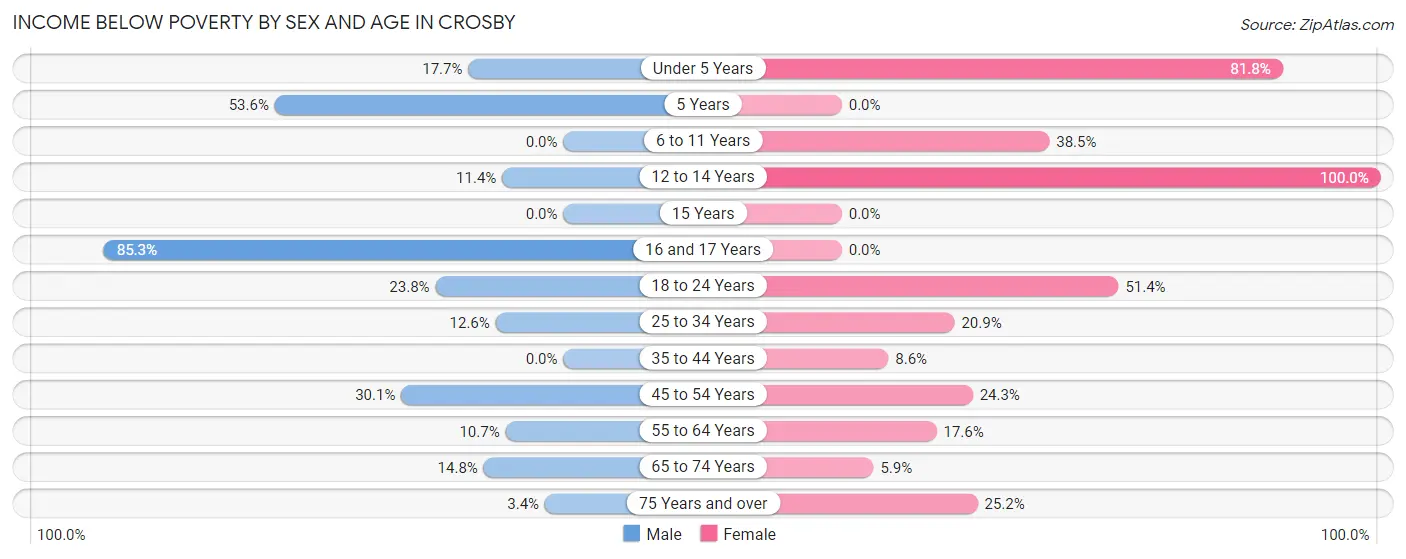
| Age Bracket | Male | Female |
| Under 5 Years | 3 (17.6%) | 27 (81.8%) |
| 5 Years | 15 (53.6%) | 0 (0.0%) |
| 6 to 11 Years | 0 (0.0%) | 47 (38.5%) |
| 12 to 14 Years | 5 (11.4%) | 9 (100.0%) |
| 15 Years | 0 (0.0%) | 0 (0.0%) |
| 16 and 17 Years | 29 (85.3%) | 0 (0.0%) |
| 18 to 24 Years | 19 (23.7%) | 38 (51.3%) |
| 25 to 34 Years | 24 (12.6%) | 41 (20.9%) |
| 35 to 44 Years | 0 (0.0%) | 7 (8.6%) |
| 45 to 54 Years | 34 (30.1%) | 26 (24.3%) |
| 55 to 64 Years | 13 (10.7%) | 32 (17.6%) |
| 65 to 74 Years | 21 (14.8%) | 11 (5.9%) |
| 75 Years and over | 5 (3.4%) | 62 (25.2%) |
| Total | 168 (15.3%) | 300 (23.4%) |
Income Above Poverty by Sex and Age in Crosby
According to the poverty statistics in Crosby, males aged 6 to 11 years and females aged 5 years are the age groups that are most secure financially, with 100.0% of males and 100.0% of females in these age groups living above the poverty line.
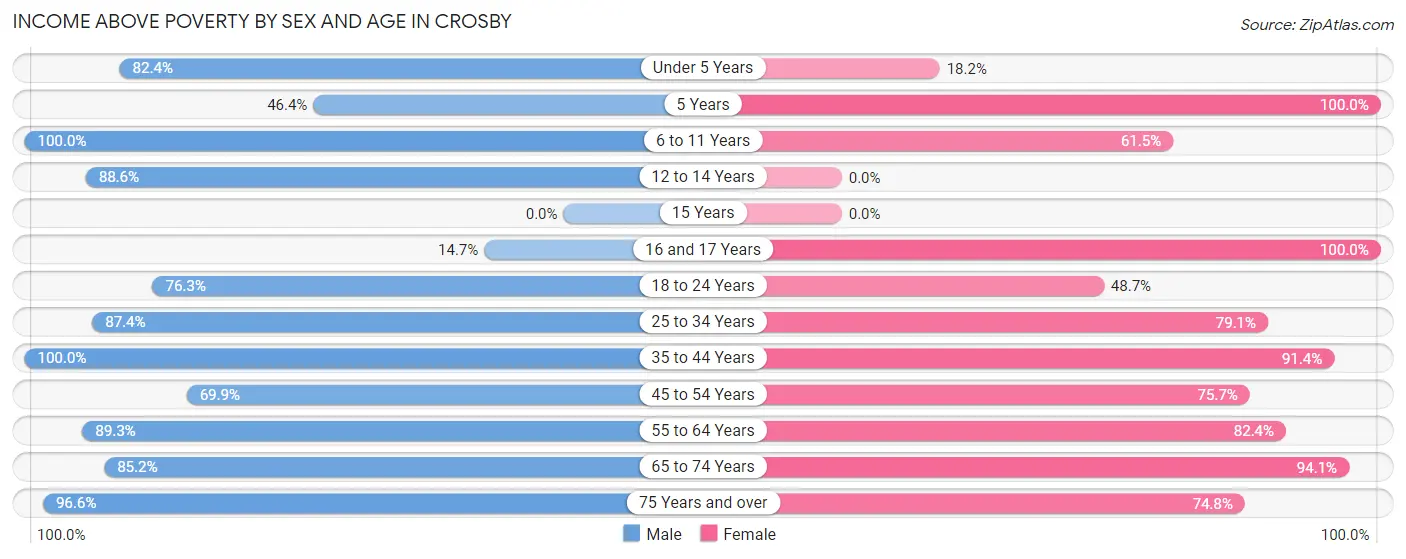
| Age Bracket | Male | Female |
| Under 5 Years | 14 (82.4%) | 6 (18.2%) |
| 5 Years | 13 (46.4%) | 26 (100.0%) |
| 6 to 11 Years | 64 (100.0%) | 75 (61.5%) |
| 12 to 14 Years | 39 (88.6%) | 0 (0.0%) |
| 15 Years | 0 (0.0%) | 0 (0.0%) |
| 16 and 17 Years | 5 (14.7%) | 22 (100.0%) |
| 18 to 24 Years | 61 (76.2%) | 36 (48.6%) |
| 25 to 34 Years | 167 (87.4%) | 155 (79.1%) |
| 35 to 44 Years | 121 (100.0%) | 74 (91.4%) |
| 45 to 54 Years | 79 (69.9%) | 81 (75.7%) |
| 55 to 64 Years | 108 (89.3%) | 150 (82.4%) |
| 65 to 74 Years | 121 (85.2%) | 176 (94.1%) |
| 75 Years and over | 141 (96.6%) | 184 (74.8%) |
| Total | 933 (84.7%) | 985 (76.6%) |
Income Below Poverty Among Married-Couple Families in Crosby
The poverty statistics for married-couple families in Crosby show that 6.5% or 27 of the total 418 families live below the poverty line. Families with 5 or more children have the highest poverty rate of 100.0%, comprising of 10 families. On the other hand, families with 1 or 2 children have the lowest poverty rate of 0.0%, which includes 0 families.
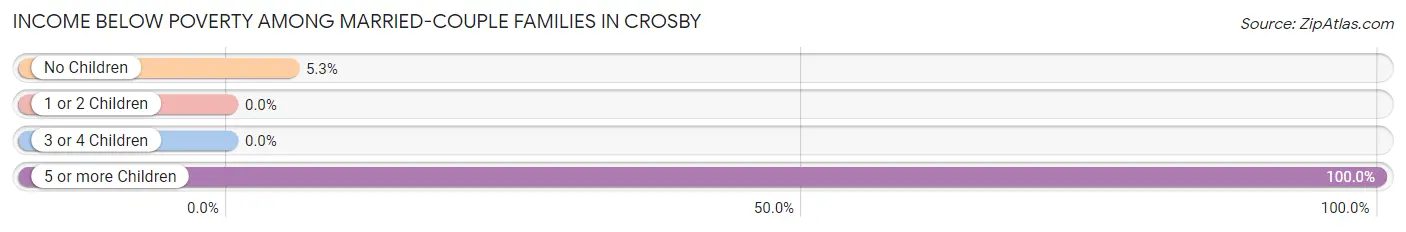
| Children | Above Poverty | Below Poverty |
| No Children | 303 (94.7%) | 17 (5.3%) |
| 1 or 2 Children | 79 (100.0%) | 0 (0.0%) |
| 3 or 4 Children | 9 (100.0%) | 0 (0.0%) |
| 5 or more Children | 0 (0.0%) | 10 (100.0%) |
| Total | 391 (93.5%) | 27 (6.5%) |
Income Below Poverty Among Single-Parent Households in Crosby
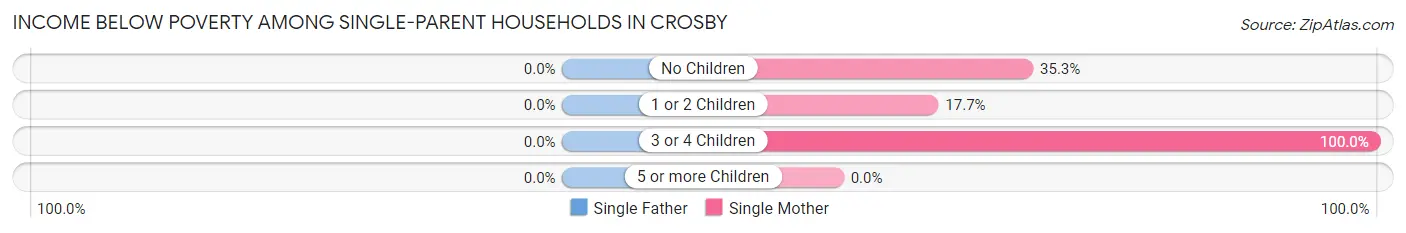
| Children | Single Father | Single Mother |
| No Children | 0 (0.0%) | 12 (35.3%) |
| 1 or 2 Children | 0 (0.0%) | 12 (17.6%) |
| 3 or 4 Children | 0 (0.0%) | 15 (100.0%) |
| 5 or more Children | 0 (0.0%) | 0 (0.0%) |
| Total | 0 (0.0%) | 39 (33.3%) |
Income Below Poverty Among Married-Couple vs Single-Parent Households in Crosby
The poverty data for Crosby shows that 27 of the married-couple family households (6.5%) and 39 of the single-parent households (32.0%) are living below the poverty level. Within the married-couple family households, those with 5 or more children have the highest poverty rate, with 10 households (100.0%) falling below the poverty line. Among the single-parent households, those with 3 or 4 children have the highest poverty rate, with 15 household (100.0%) living below poverty.
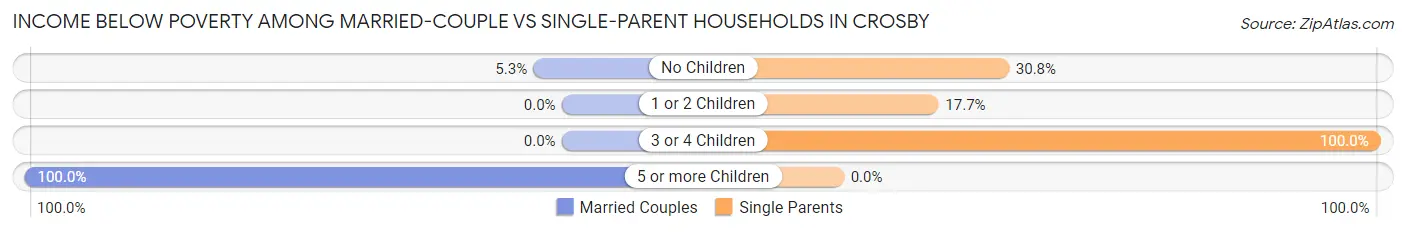
| Children | Married-Couple Families | Single-Parent Households |
| No Children | 17 (5.3%) | 12 (30.8%) |
| 1 or 2 Children | 0 (0.0%) | 12 (17.6%) |
| 3 or 4 Children | 0 (0.0%) | 15 (100.0%) |
| 5 or more Children | 10 (100.0%) | 0 (0.0%) |
| Total | 27 (6.5%) | 39 (32.0%) |
Race in Crosby
The most populous races in Crosby are White / Caucasian (2,298 | 91.2%), Two or more Races (154 | 6.1%), and Hispanic or Latino (78 | 3.1%).
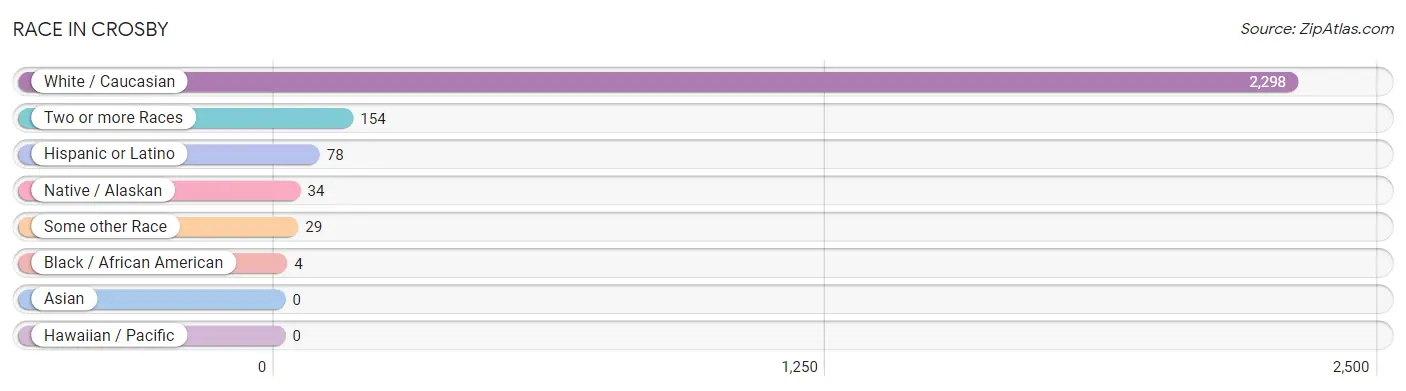
| Race | # Population | % Population |
| Asian | 0 | 0.0% |
| Black / African American | 4 | 0.2% |
| Hawaiian / Pacific | 0 | 0.0% |
| Hispanic or Latino | 78 | 3.1% |
| Native / Alaskan | 34 | 1.3% |
| White / Caucasian | 2,298 | 91.2% |
| Two or more Races | 154 | 6.1% |
| Some other Race | 29 | 1.1% |
| Total | 2,519 | 100.0% |
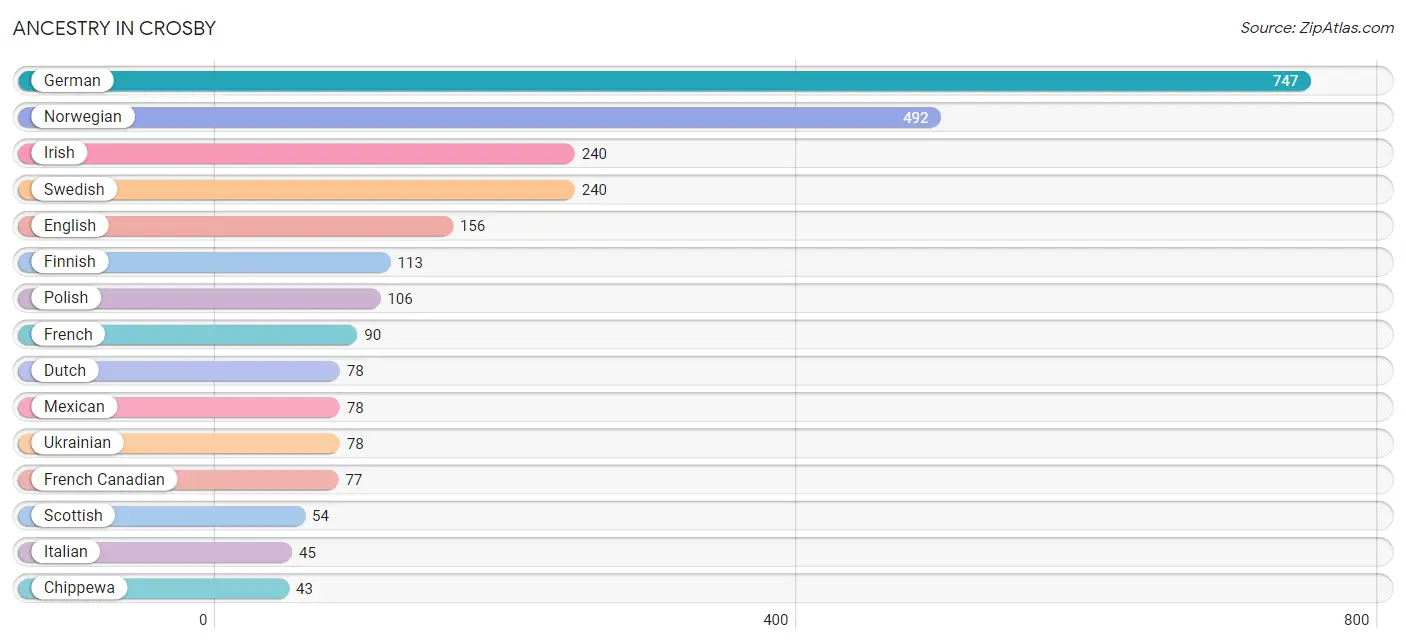
Ancestry in Crosby
The most populous ancestries reported in Crosby are German (747 | 29.6%), Norwegian (492 | 19.5%), Irish (240 | 9.5%), Swedish (240 | 9.5%), and English (156 | 6.2%), together accounting for 74.4% of all Crosby residents.
| Ancestry | # Population | % Population |
| American | 37 | 1.5% |
| Austrian | 18 | 0.7% |
| British | 6 | 0.2% |
| Cherokee | 8 | 0.3% |
| Chippewa | 43 | 1.7% |
| Croatian | 29 | 1.1% |
| Danish | 13 | 0.5% |
| Dutch | 78 | 3.1% |
| English | 156 | 6.2% |
| European | 5 | 0.2% |
| Finnish | 113 | 4.5% |
| French | 90 | 3.6% |
| French Canadian | 77 | 3.1% |
| German | 747 | 29.6% |
| Greek | 10 | 0.4% |
| Hungarian | 19 | 0.7% |
| Indian (Asian) | 31 | 1.2% |
| Irish | 240 | 9.5% |
| Italian | 45 | 1.8% |
| Korean | 31 | 1.2% |
| Malaysian | 12 | 0.5% |
| Mexican | 78 | 3.1% |
| Norwegian | 492 | 19.5% |
| Polish | 106 | 4.2% |
| Russian | 7 | 0.3% |
| Scandinavian | 7 | 0.3% |
| Scotch-Irish | 40 | 1.6% |
| Scottish | 54 | 2.1% |
| Sioux | 16 | 0.6% |
| Slovak | 11 | 0.4% |
| Slovene | 25 | 1.0% |
| Swedish | 240 | 9.5% |
| Ukrainian | 78 | 3.1% |
| Welsh | 17 | 0.7% |
| Yugoslavian | 20 | 0.8% | View All 35 Rows |
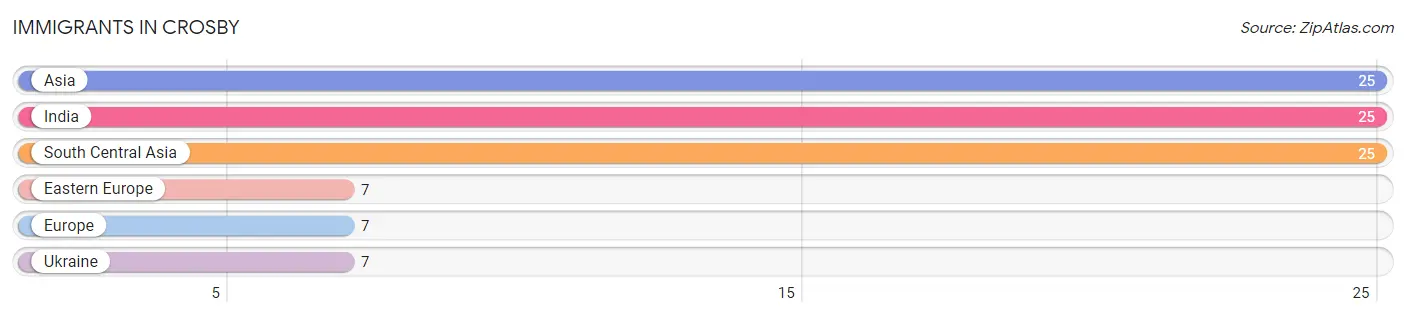
Immigrants in Crosby
The most numerous immigrant groups reported in Crosby came from Asia (25 | 1.0%), India (25 | 1.0%), South Central Asia (25 | 1.0%), Eastern Europe (7 | 0.3%), and Europe (7 | 0.3%), together accounting for 3.5% of all Crosby residents.
| Immigration Origin | # Population | % Population |
| Asia | 25 | 1.0% |
| Eastern Europe | 7 | 0.3% |
| Europe | 7 | 0.3% |
| India | 25 | 1.0% |
| South Central Asia | 25 | 1.0% |
| Ukraine | 7 | 0.3% | View All 6 Rows |
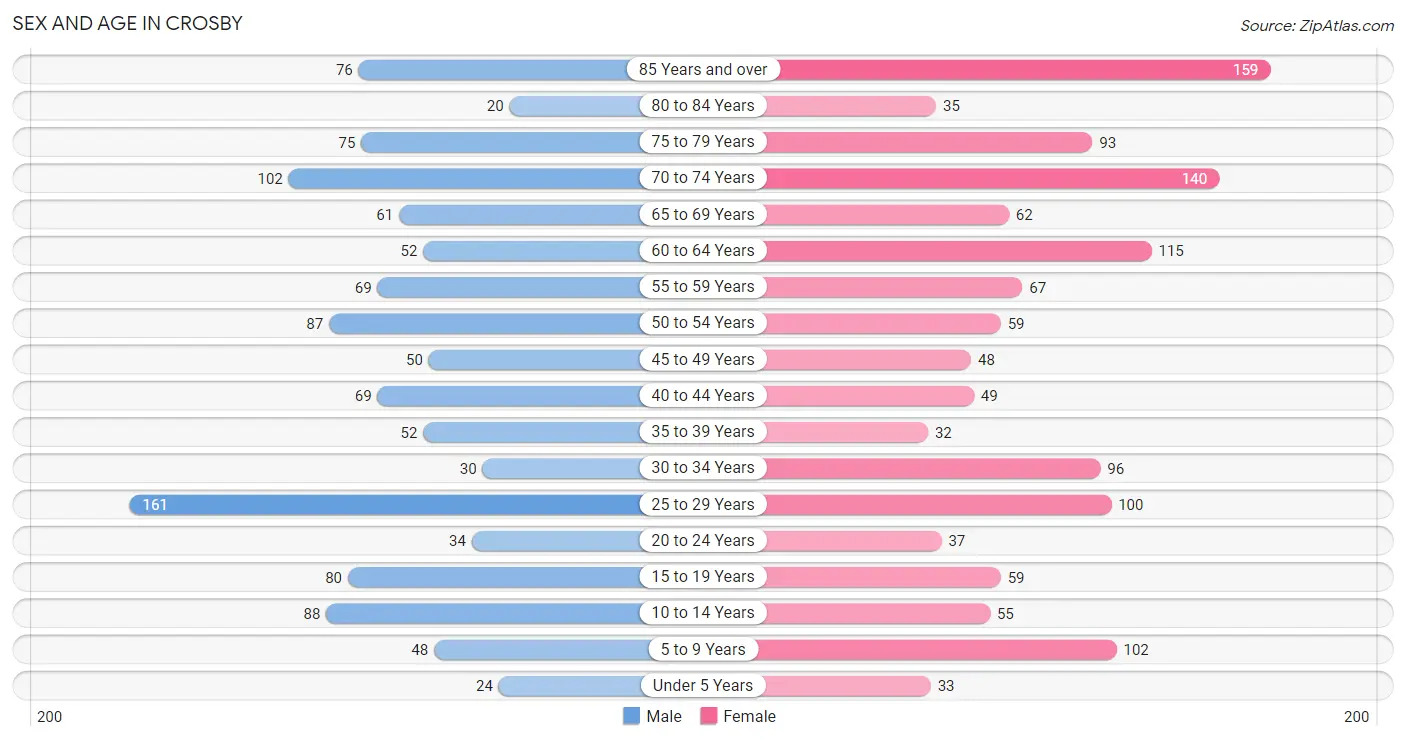
Sex and Age in Crosby
Sex and Age in Crosby
The most populous age groups in Crosby are 25 to 29 Years (161 | 13.7%) for men and 85 Years and over (159 | 11.9%) for women.
| Age Bracket | Male | Female |
| Under 5 Years | 24 (2.0%) | 33 (2.5%) |
| 5 to 9 Years | 48 (4.1%) | 102 (7.6%) |
| 10 to 14 Years | 88 (7.5%) | 55 (4.1%) |
| 15 to 19 Years | 80 (6.8%) | 59 (4.4%) |
| 20 to 24 Years | 34 (2.9%) | 37 (2.8%) |
| 25 to 29 Years | 161 (13.7%) | 100 (7.5%) |
| 30 to 34 Years | 30 (2.5%) | 96 (7.2%) |
| 35 to 39 Years | 52 (4.4%) | 32 (2.4%) |
| 40 to 44 Years | 69 (5.9%) | 49 (3.6%) |
| 45 to 49 Years | 50 (4.2%) | 48 (3.6%) |
| 50 to 54 Years | 87 (7.4%) | 59 (4.4%) |
| 55 to 59 Years | 69 (5.9%) | 67 (5.0%) |
| 60 to 64 Years | 52 (4.4%) | 115 (8.6%) |
| 65 to 69 Years | 61 (5.2%) | 62 (4.6%) |
| 70 to 74 Years | 102 (8.7%) | 140 (10.4%) |
| 75 to 79 Years | 75 (6.4%) | 93 (6.9%) |
| 80 to 84 Years | 20 (1.7%) | 35 (2.6%) |
| 85 Years and over | 76 (6.5%) | 159 (11.9%) |
| Total | 1,178 (100.0%) | 1,341 (100.0%) |
Families and Households in Crosby
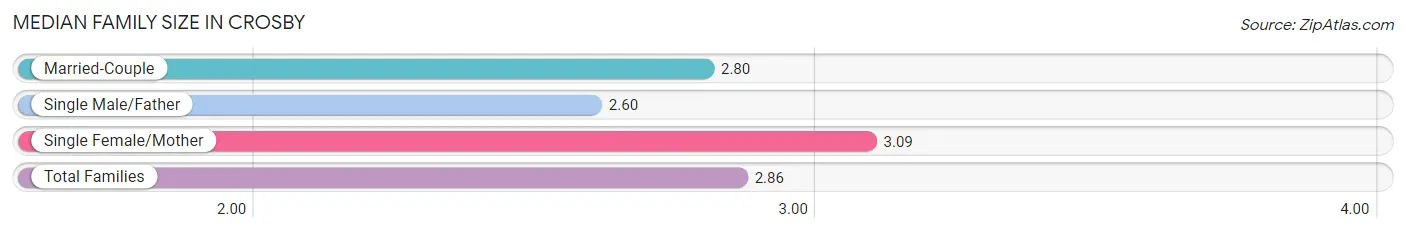
Median Family Size in Crosby
The median family size in Crosby is 2.86 persons per family, with single female/mother families (117 | 21.7%) accounting for the largest median family size of 3.09 persons per family. On the other hand, single male/father families (5 | 0.9%) represent the smallest median family size with 2.60 persons per family.
| Family Type | # Families | Family Size |
| Married-Couple | 418 (77.4%) | 2.80 |
| Single Male/Father | 5 (0.9%) | 2.60 |
| Single Female/Mother | 117 (21.7%) | 3.09 |
| Total Families | 540 (100.0%) | 2.86 |
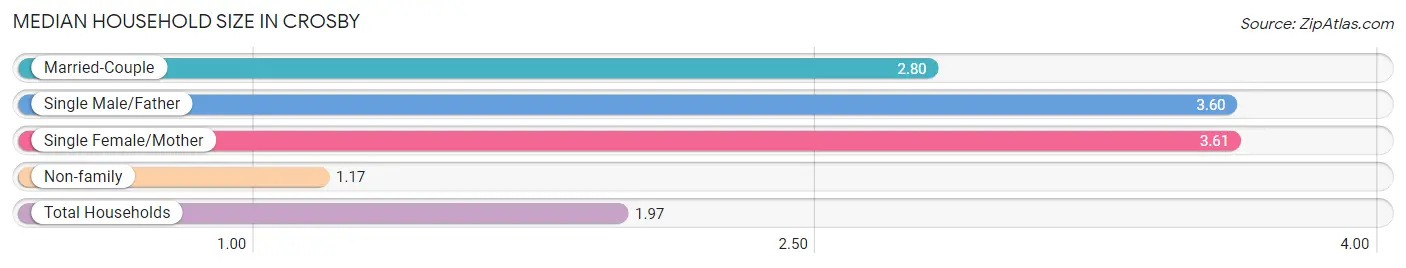
Median Household Size in Crosby
The median household size in Crosby is 1.97 persons per household, with single female/mother households (117 | 9.7%) accounting for the largest median household size of 3.61 persons per household. non-family households (672 | 55.4%) represent the smallest median household size with 1.17 persons per household.
| Household Type | # Households | Household Size |
| Married-Couple | 418 (34.5%) | 2.80 |
| Single Male/Father | 5 (0.4%) | 3.60 |
| Single Female/Mother | 117 (9.7%) | 3.61 |
| Non-family | 672 (55.4%) | 1.17 |
| Total Households | 1,212 (100.0%) | 1.97 |
Household Size by Marriage Status in Crosby
Out of a total of 1,212 households in Crosby, 540 (44.6%) are family households, while 672 (55.4%) are nonfamily households. The most numerous type of family households are 2-person households, comprising 290, and the most common type of nonfamily households are 1-person households, comprising 592.
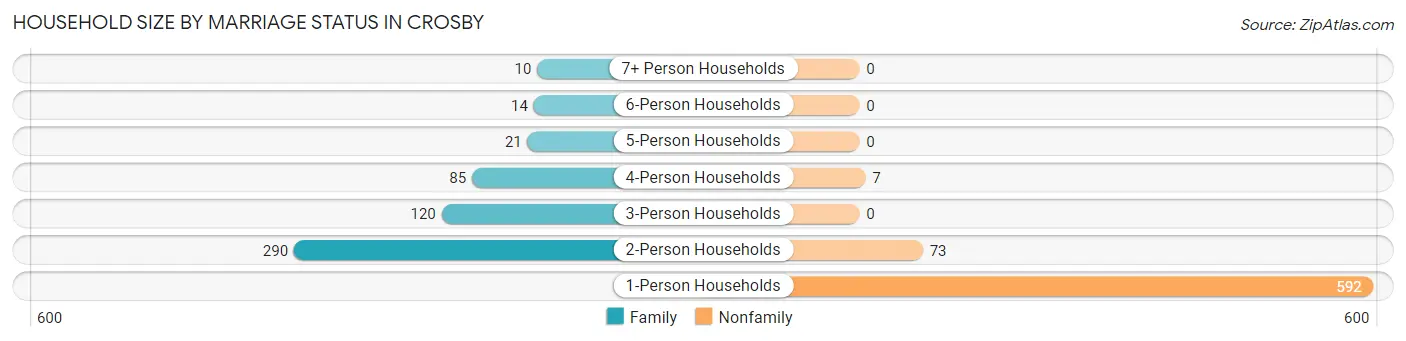
| Household Size | Family Households | Nonfamily Households |
| 1-Person Households | - | 592 (48.8%) |
| 2-Person Households | 290 (23.9%) | 73 (6.0%) |
| 3-Person Households | 120 (9.9%) | 0 (0.0%) |
| 4-Person Households | 85 (7.0%) | 7 (0.6%) |
| 5-Person Households | 21 (1.7%) | 0 (0.0%) |
| 6-Person Households | 14 (1.2%) | 0 (0.0%) |
| 7+ Person Households | 10 (0.8%) | 0 (0.0%) |
| Total | 540 (44.6%) | 672 (55.4%) |
Female Fertility in Crosby
Fertility by Age in Crosby
Average fertility rate in Crosby is 34.0 births per 1,000 women. Women in the age bracket of 20 to 34 years have the highest fertility rate with 64.0 births per 1,000 women. Women in the age bracket of 20 to 34 years acount for 100.0% of all women with births.
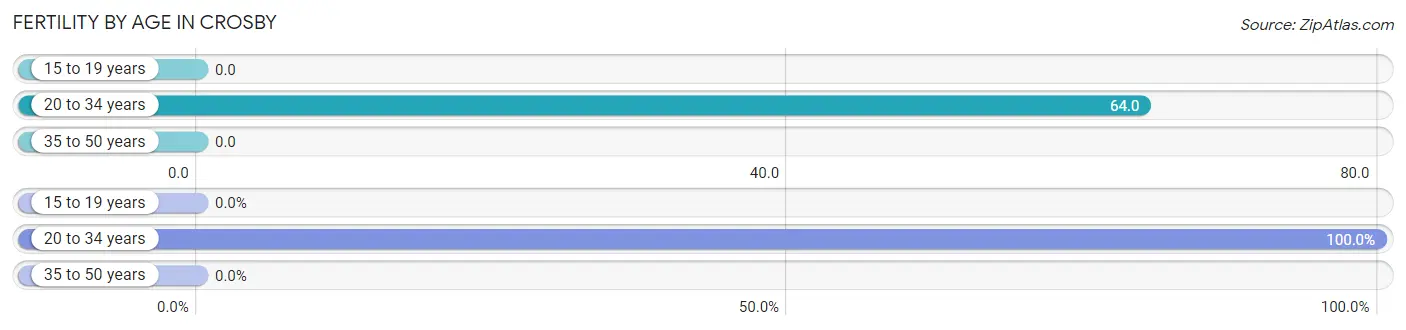
| Age Bracket | Women with Births | Births / 1,000 Women |
| 15 to 19 years | 0 (0.0%) | 0.0 |
| 20 to 34 years | 15 (100.0%) | 64.0 |
| 35 to 50 years | 0 (0.0%) | 0.0 |
| Total | 15 (100.0%) | 34.0 |
Fertility by Age by Marriage Status in Crosby
46.7% of women with births (15) in Crosby are married. The highest percentage of unmarried women with births falls into 20 to 34 years age bracket with 53.3% of them unmarried at the time of birth, while the lowest percentage of unmarried women with births belong to 20 to 34 years age bracket with 53.3% of them unmarried.
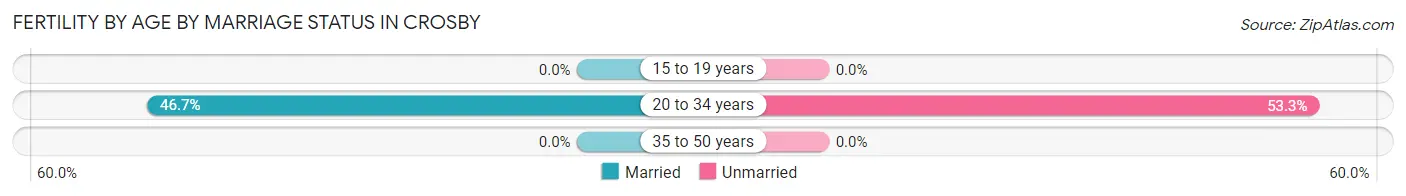
| Age Bracket | Married | Unmarried |
| 15 to 19 years | 0 (0.0%) | 0 (0.0%) |
| 20 to 34 years | 7 (46.7%) | 8 (53.3%) |
| 35 to 50 years | 0 (0.0%) | 0 (0.0%) |
| Total | 7 (46.7%) | 8 (53.3%) |
Fertility by Education in Crosby
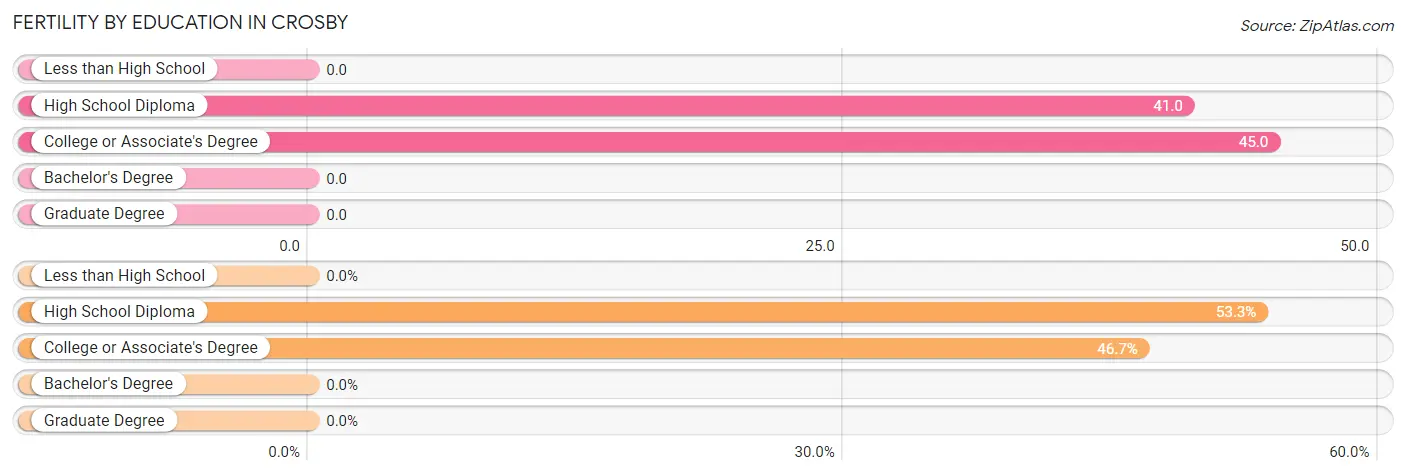
| Educational Attainment | Women with Births | Births / 1,000 Women |
| Less than High School | 0 (0.0%) | 0.0 |
| High School Diploma | 8 (53.3%) | 41.0 |
| College or Associate's Degree | 7 (46.7%) | 45.0 |
| Bachelor's Degree | 0 (0.0%) | 0.0 |
| Graduate Degree | 0 (0.0%) | 0.0 |
| Total | 15 (100.0%) | 34.0 |
Fertility by Education by Marriage Status in Crosby
53.3% of women with births in Crosby are unmarried. Women with the educational attainment of college or associate's degree are most likely to be married with 100.0% of them married at childbirth, while women with the educational attainment of high school diploma are least likely to be married with 100.0% of them unmarried at childbirth.
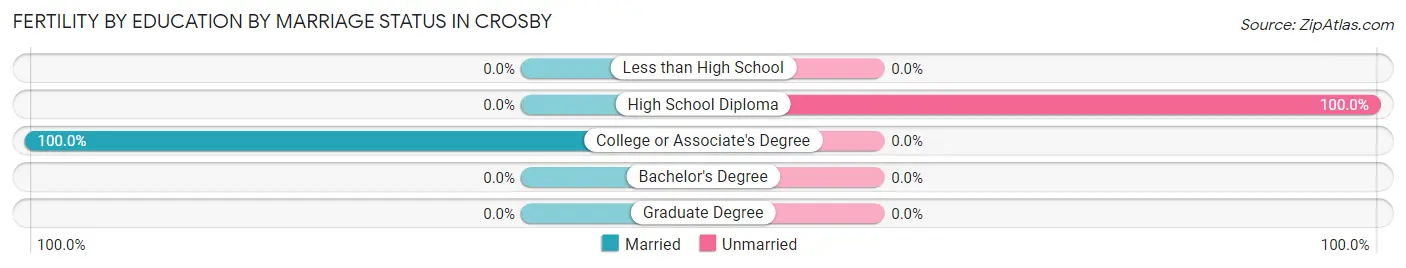
| Educational Attainment | Married | Unmarried |
| Less than High School | 0 (0.0%) | 0 (0.0%) |
| High School Diploma | 0 (0.0%) | 8 (100.0%) |
| College or Associate's Degree | 7 (100.0%) | 0 (0.0%) |
| Bachelor's Degree | 0 (0.0%) | 0 (0.0%) |
| Graduate Degree | 0 (0.0%) | 0 (0.0%) |
| Total | 7 (46.7%) | 8 (53.3%) |
Employment Characteristics in Crosby
Employment by Class of Employer in Crosby
Among the 936 employed individuals in Crosby, private company employees (623 | 66.6%), not-for-profit organizations (113 | 12.1%), and local government employees (58 | 6.2%) make up the most common classes of employment.
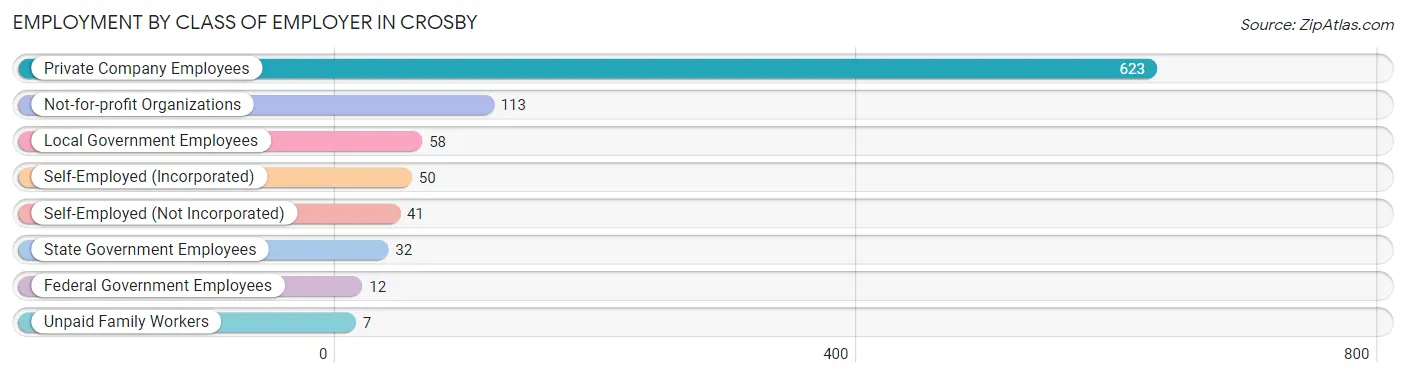
| Employer Class | # Employees | % Employees |
| Private Company Employees | 623 | 66.6% |
| Self-Employed (Incorporated) | 50 | 5.3% |
| Self-Employed (Not Incorporated) | 41 | 4.4% |
| Not-for-profit Organizations | 113 | 12.1% |
| Local Government Employees | 58 | 6.2% |
| State Government Employees | 32 | 3.4% |
| Federal Government Employees | 12 | 1.3% |
| Unpaid Family Workers | 7 | 0.7% |
| Total | 936 | 100.0% |
Employment Status by Age in Crosby
According to the labor force statistics for Crosby, out of the total population over 16 years of age (2,169), 45.6% or 989 individuals are in the labor force, with 5.4% or 53 of them unemployed. The age group with the highest labor force participation rate is 25 to 29 years, with 89.3% or 233 individuals in the labor force. Within the labor force, the 16 to 19 years age range has the highest percentage of unemployed individuals, with 30.2% or 16 of them being unemployed.
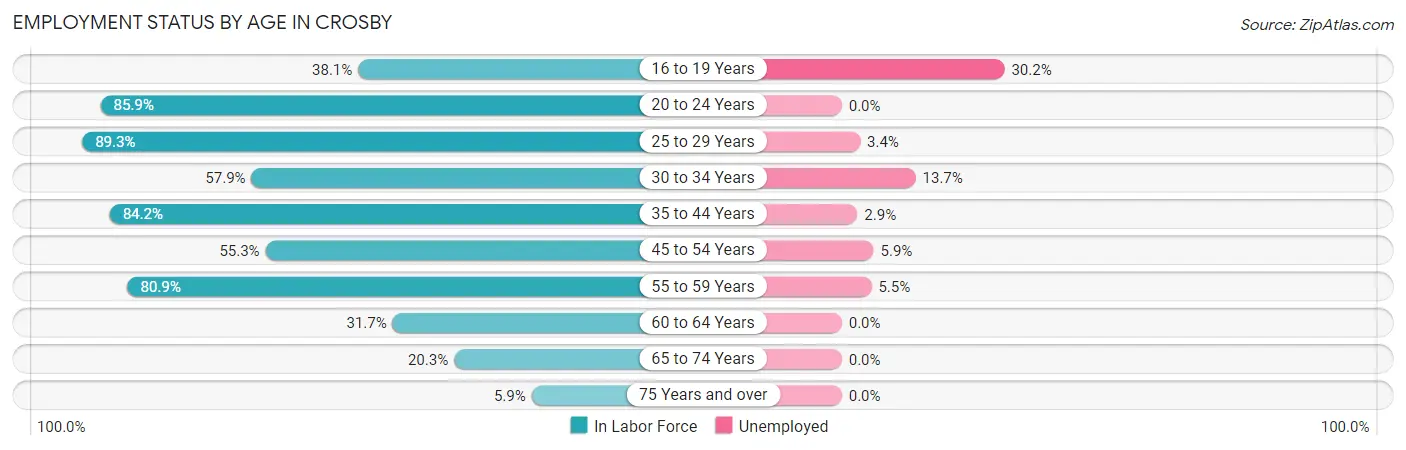
| Age Bracket | In Labor Force | Unemployed |
| 16 to 19 Years | 53 (38.1%) | 16 (30.2%) |
| 20 to 24 Years | 61 (85.9%) | 0 (0.0%) |
| 25 to 29 Years | 233 (89.3%) | 8 (3.4%) |
| 30 to 34 Years | 73 (57.9%) | 10 (13.7%) |
| 35 to 44 Years | 170 (84.2%) | 5 (2.9%) |
| 45 to 54 Years | 135 (55.3%) | 8 (5.9%) |
| 55 to 59 Years | 110 (80.9%) | 6 (5.5%) |
| 60 to 64 Years | 53 (31.7%) | 0 (0.0%) |
| 65 to 74 Years | 74 (20.3%) | 0 (0.0%) |
| 75 Years and over | 27 (5.9%) | 0 (0.0%) |
| Total | 989 (45.6%) | 53 (5.4%) |
Employment Status by Educational Attainment in Crosby
According to labor force statistics for Crosby, 68.1% of individuals (774) out of the total population between 25 and 64 years of age (1,136) are in the labor force, with 4.8% or 37 of them being unemployed. The group with the highest labor force participation rate are those with the educational attainment of bachelor's degree or higher, with 87.7% or 114 individuals in the labor force. Within the labor force, individuals with less than high school education have the highest percentage of unemployment, with 17.9% or 5 of them being unemployed.
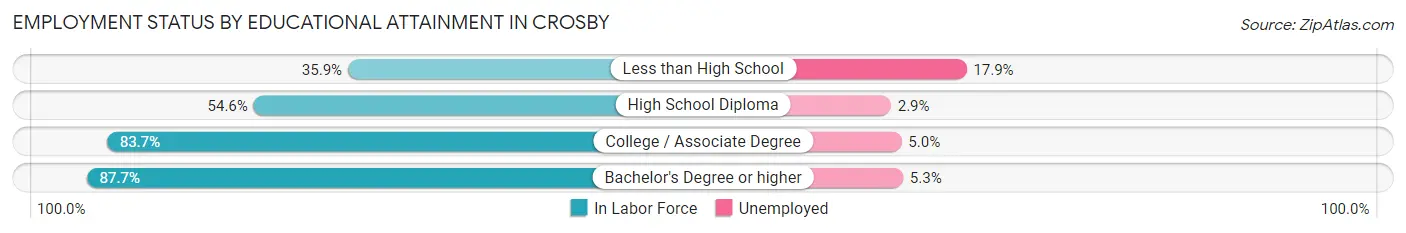
| Educational Attainment | In Labor Force | Unemployed |
| Less than High School | 28 (35.9%) | 14 (17.9%) |
| High School Diploma | 272 (54.6%) | 14 (2.9%) |
| College / Associate Degree | 360 (83.7%) | 22 (5.0%) |
| Bachelor's Degree or higher | 114 (87.7%) | 7 (5.3%) |
| Total | 774 (68.1%) | 55 (4.8%) |
Employment Occupations by Sex in Crosby
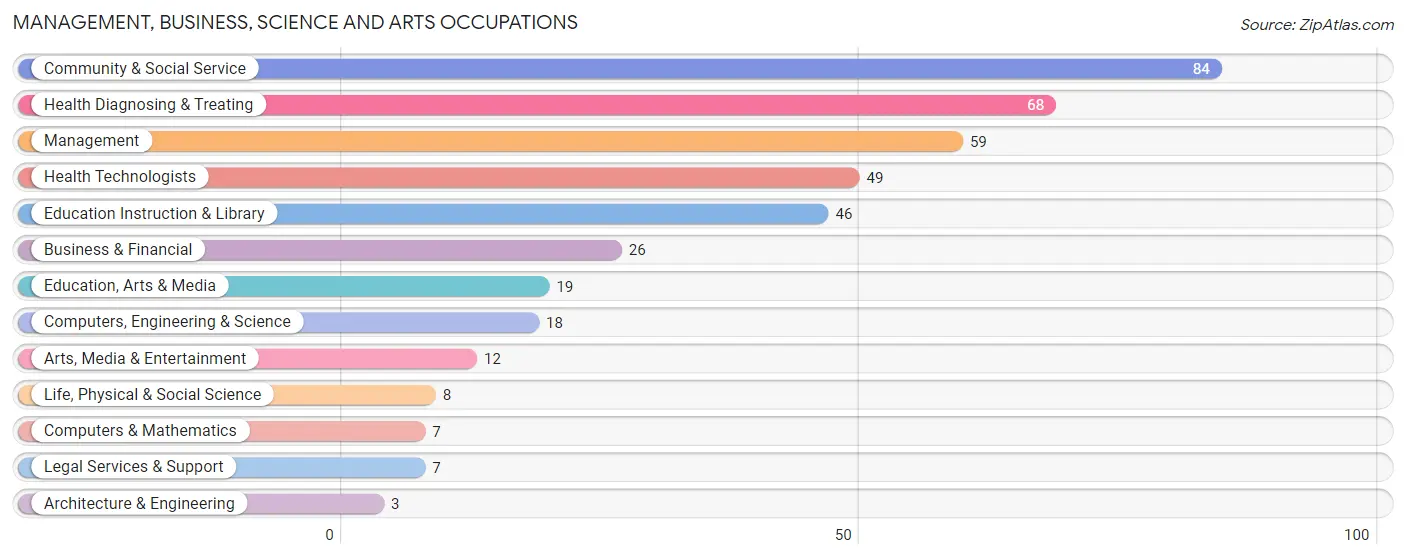
Management, Business, Science and Arts Occupations
The most common Management, Business, Science and Arts occupations in Crosby are Community & Social Service (84 | 9.0%), Health Diagnosing & Treating (68 | 7.3%), Management (59 | 6.3%), Health Technologists (49 | 5.2%), and Education Instruction & Library (46 | 4.9%).
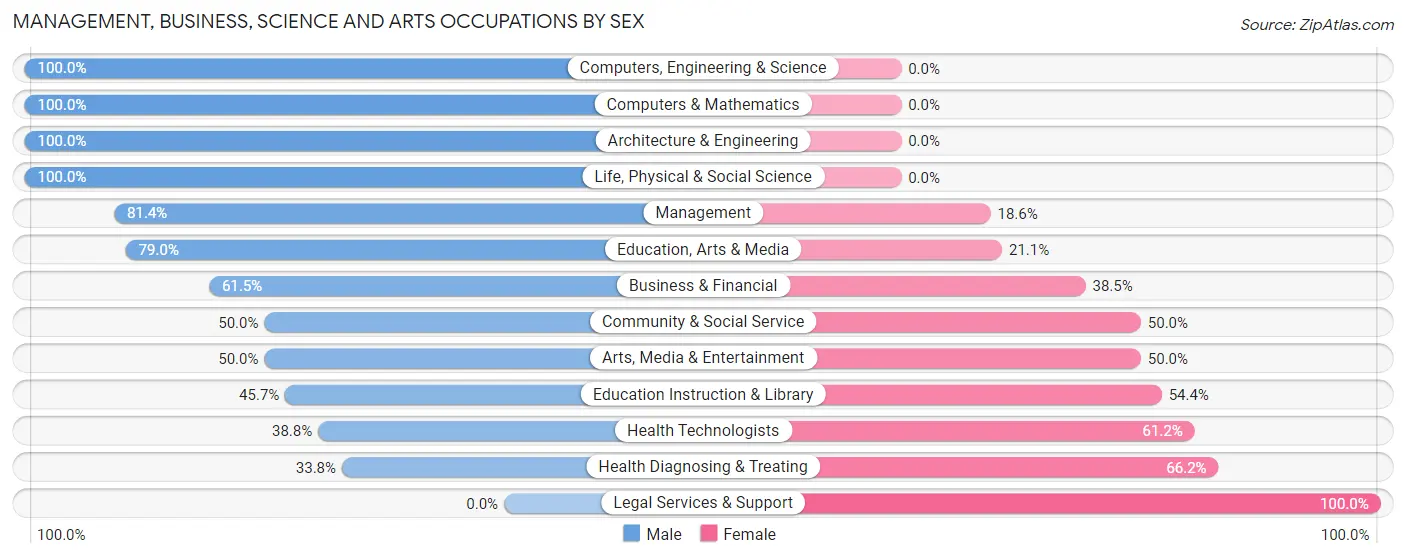
Management, Business, Science and Arts Occupations by Sex
Within the Management, Business, Science and Arts occupations in Crosby, the most male-oriented occupations are Computers, Engineering & Science (100.0%), Computers & Mathematics (100.0%), and Architecture & Engineering (100.0%), while the most female-oriented occupations are Legal Services & Support (100.0%), Health Diagnosing & Treating (66.2%), and Health Technologists (61.2%).
| Occupation | Male | Female |
| Management | 48 (81.4%) | 11 (18.6%) |
| Business & Financial | 16 (61.5%) | 10 (38.5%) |
| Computers, Engineering & Science | 18 (100.0%) | 0 (0.0%) |
| Computers & Mathematics | 7 (100.0%) | 0 (0.0%) |
| Architecture & Engineering | 3 (100.0%) | 0 (0.0%) |
| Life, Physical & Social Science | 8 (100.0%) | 0 (0.0%) |
| Community & Social Service | 42 (50.0%) | 42 (50.0%) |
| Education, Arts & Media | 15 (78.9%) | 4 (21.0%) |
| Legal Services & Support | 0 (0.0%) | 7 (100.0%) |
| Education Instruction & Library | 21 (45.7%) | 25 (54.3%) |
| Arts, Media & Entertainment | 6 (50.0%) | 6 (50.0%) |
| Health Diagnosing & Treating | 23 (33.8%) | 45 (66.2%) |
| Health Technologists | 19 (38.8%) | 30 (61.2%) |
| Total (Category) | 147 (57.7%) | 108 (42.3%) |
| Total (Overall) | 496 (53.0%) | 440 (47.0%) |
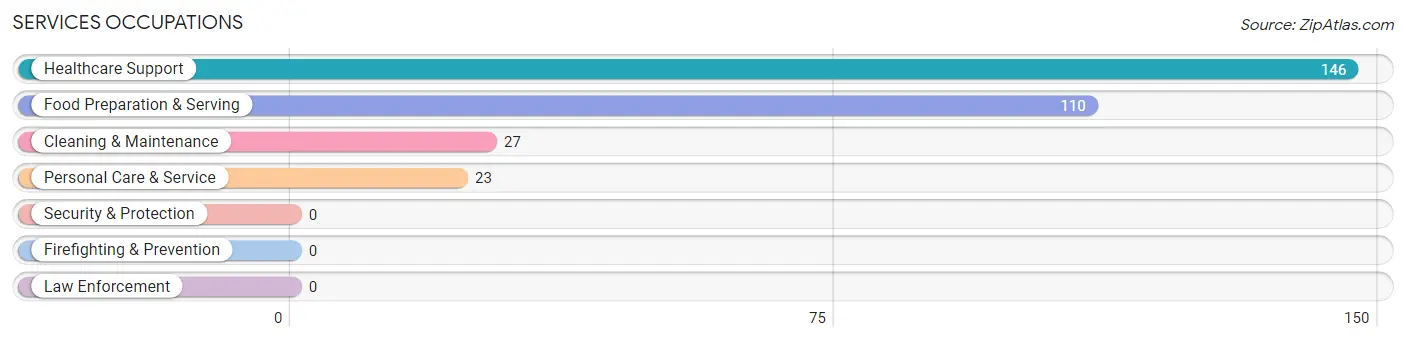
Services Occupations
The most common Services occupations in Crosby are Healthcare Support (146 | 15.6%), Food Preparation & Serving (110 | 11.7%), Cleaning & Maintenance (27 | 2.9%), and Personal Care & Service (23 | 2.5%).
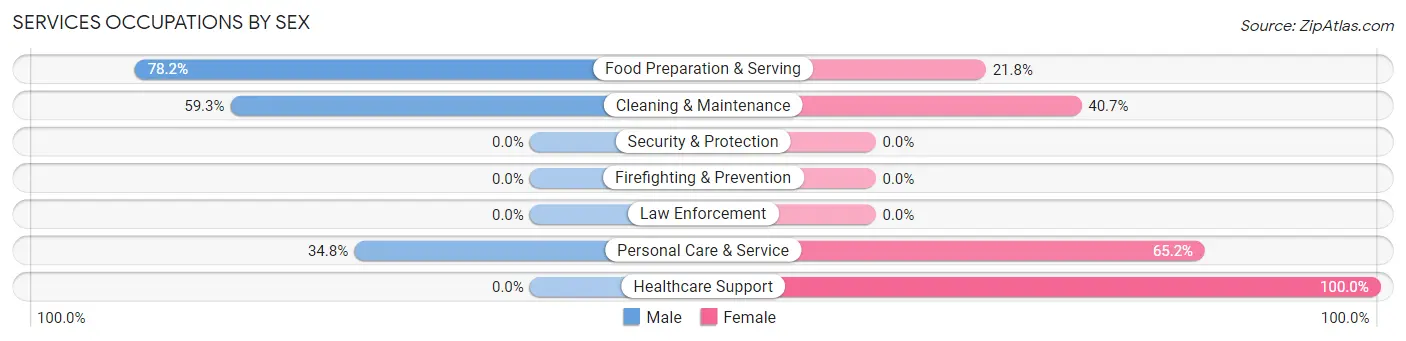
Services Occupations by Sex
Within the Services occupations in Crosby, the most male-oriented occupations are Food Preparation & Serving (78.2%), Cleaning & Maintenance (59.3%), and Personal Care & Service (34.8%), while the most female-oriented occupations are Healthcare Support (100.0%), Personal Care & Service (65.2%), and Cleaning & Maintenance (40.7%).
| Occupation | Male | Female |
| Healthcare Support | 0 (0.0%) | 146 (100.0%) |
| Security & Protection | 0 (0.0%) | 0 (0.0%) |
| Firefighting & Prevention | 0 (0.0%) | 0 (0.0%) |
| Law Enforcement | 0 (0.0%) | 0 (0.0%) |
| Food Preparation & Serving | 86 (78.2%) | 24 (21.8%) |
| Cleaning & Maintenance | 16 (59.3%) | 11 (40.7%) |
| Personal Care & Service | 8 (34.8%) | 15 (65.2%) |
| Total (Category) | 110 (35.9%) | 196 (64.0%) |
| Total (Overall) | 496 (53.0%) | 440 (47.0%) |
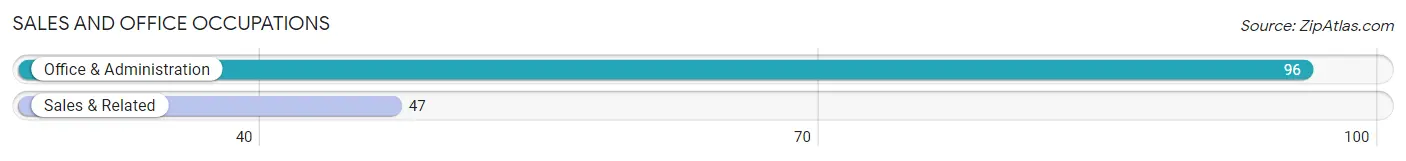
Sales and Office Occupations
The most common Sales and Office occupations in Crosby are Office & Administration (96 | 10.3%), and Sales & Related (47 | 5.0%).
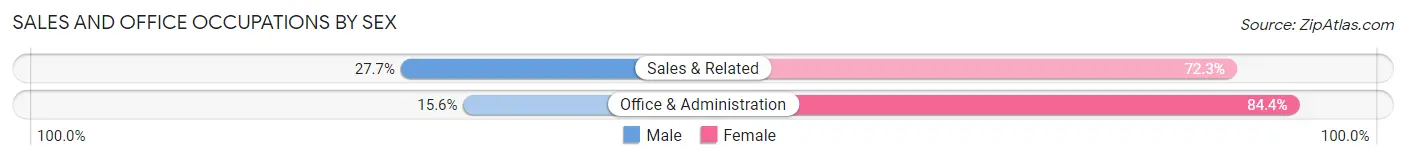
Sales and Office Occupations by Sex
| Occupation | Male | Female |
| Sales & Related | 13 (27.7%) | 34 (72.3%) |
| Office & Administration | 15 (15.6%) | 81 (84.4%) |
| Total (Category) | 28 (19.6%) | 115 (80.4%) |
| Total (Overall) | 496 (53.0%) | 440 (47.0%) |
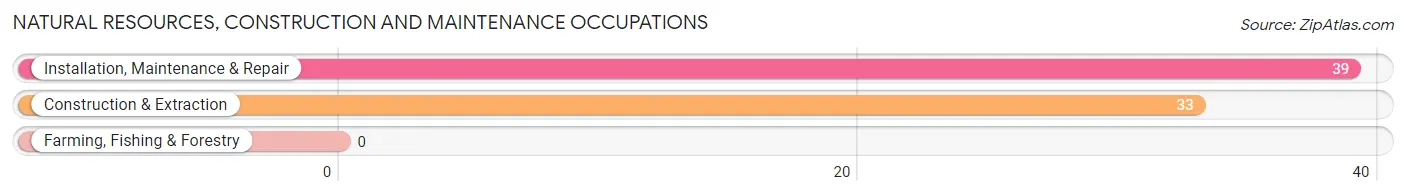
Natural Resources, Construction and Maintenance Occupations
The most common Natural Resources, Construction and Maintenance occupations in Crosby are Installation, Maintenance & Repair (39 | 4.2%), and Construction & Extraction (33 | 3.5%).
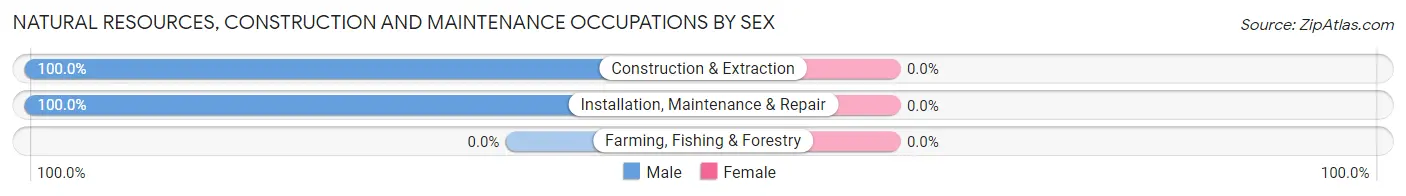
Natural Resources, Construction and Maintenance Occupations by Sex
| Occupation | Male | Female |
| Farming, Fishing & Forestry | 0 (0.0%) | 0 (0.0%) |
| Construction & Extraction | 33 (100.0%) | 0 (0.0%) |
| Installation, Maintenance & Repair | 39 (100.0%) | 0 (0.0%) |
| Total (Category) | 72 (100.0%) | 0 (0.0%) |
| Total (Overall) | 496 (53.0%) | 440 (47.0%) |
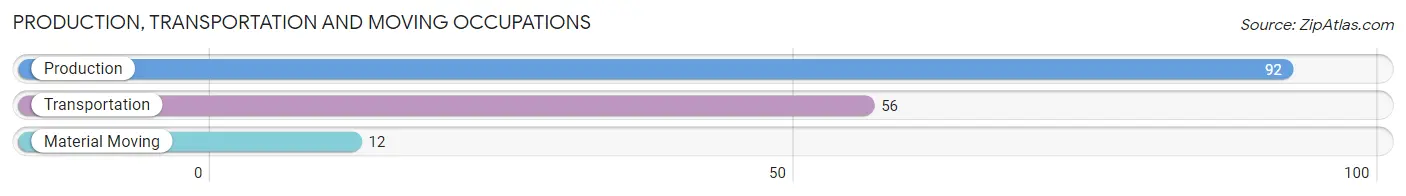
Production, Transportation and Moving Occupations
The most common Production, Transportation and Moving occupations in Crosby are Production (92 | 9.8%), Transportation (56 | 6.0%), and Material Moving (12 | 1.3%).
Production, Transportation and Moving Occupations by Sex
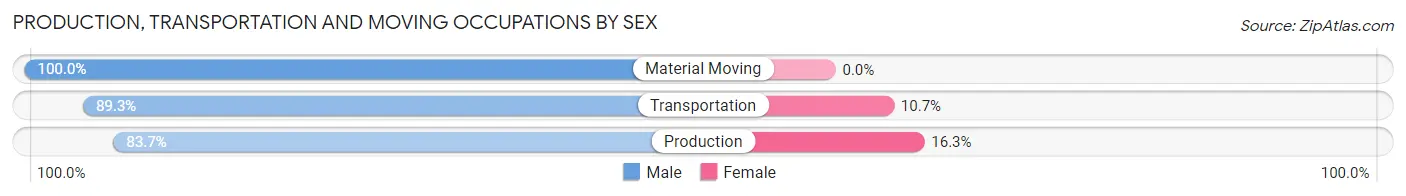
| Occupation | Male | Female |
| Production | 77 (83.7%) | 15 (16.3%) |
| Transportation | 50 (89.3%) | 6 (10.7%) |
| Material Moving | 12 (100.0%) | 0 (0.0%) |
| Total (Category) | 139 (86.9%) | 21 (13.1%) |
| Total (Overall) | 496 (53.0%) | 440 (47.0%) |
Employment Industries by Sex in Crosby
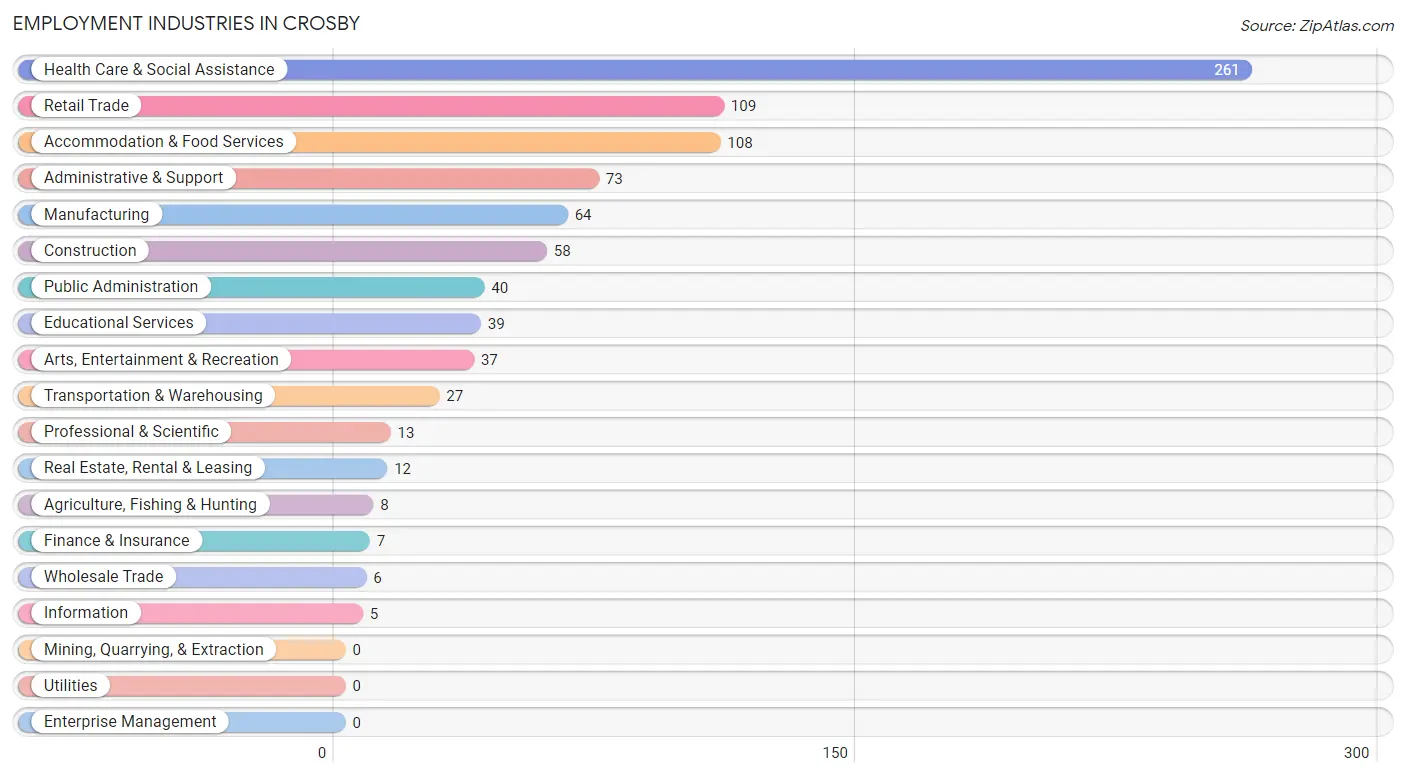
Employment Industries in Crosby
The major employment industries in Crosby include Health Care & Social Assistance (261 | 27.9%), Retail Trade (109 | 11.7%), Accommodation & Food Services (108 | 11.5%), Administrative & Support (73 | 7.8%), and Manufacturing (64 | 6.8%).
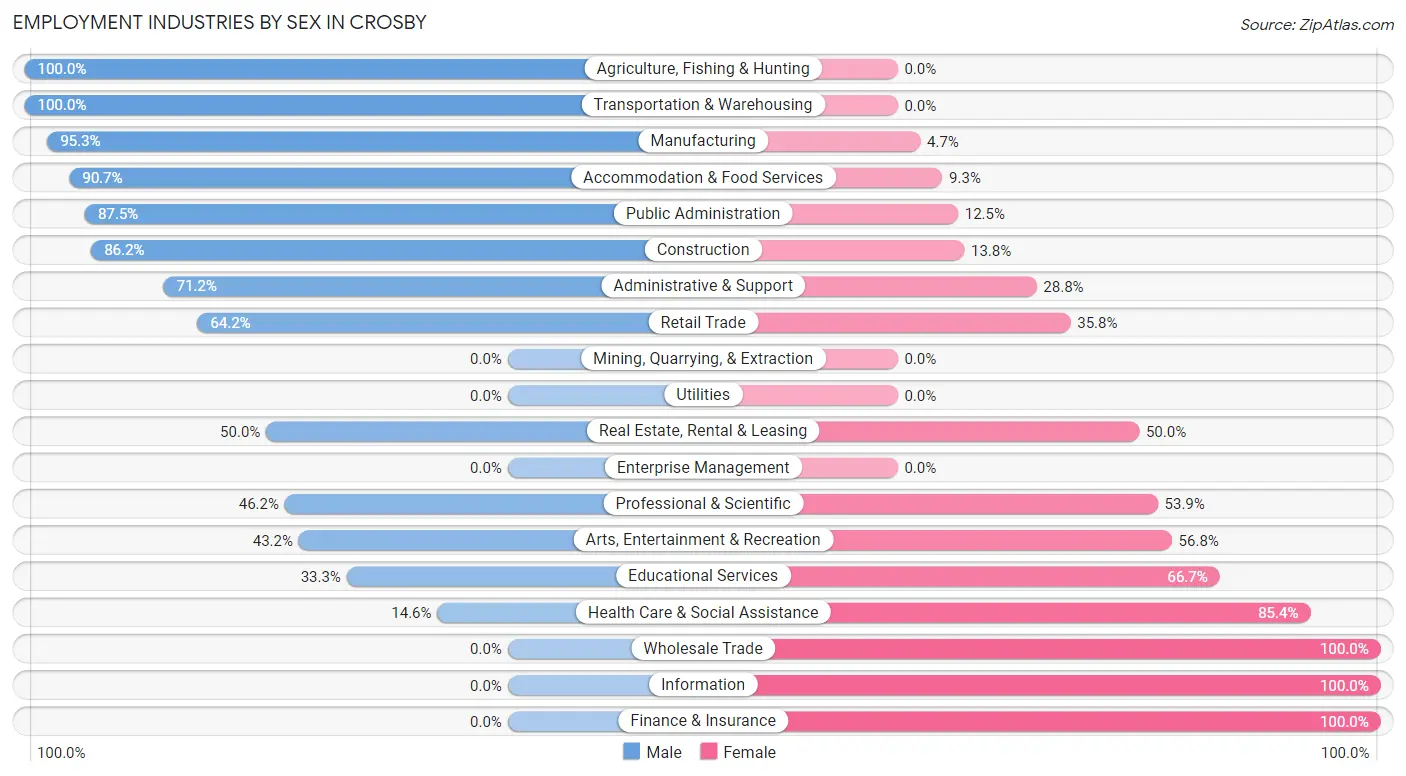
Employment Industries by Sex in Crosby
The Crosby industries that see more men than women are Agriculture, Fishing & Hunting (100.0%), Transportation & Warehousing (100.0%), and Manufacturing (95.3%), whereas the industries that tend to have a higher number of women are Wholesale Trade (100.0%), Information (100.0%), and Finance & Insurance (100.0%).
| Industry | Male | Female |
| Agriculture, Fishing & Hunting | 8 (100.0%) | 0 (0.0%) |
| Mining, Quarrying, & Extraction | 0 (0.0%) | 0 (0.0%) |
| Construction | 50 (86.2%) | 8 (13.8%) |
| Manufacturing | 61 (95.3%) | 3 (4.7%) |
| Wholesale Trade | 0 (0.0%) | 6 (100.0%) |
| Retail Trade | 70 (64.2%) | 39 (35.8%) |
| Transportation & Warehousing | 27 (100.0%) | 0 (0.0%) |
| Utilities | 0 (0.0%) | 0 (0.0%) |
| Information | 0 (0.0%) | 5 (100.0%) |
| Finance & Insurance | 0 (0.0%) | 7 (100.0%) |
| Real Estate, Rental & Leasing | 6 (50.0%) | 6 (50.0%) |
| Professional & Scientific | 6 (46.2%) | 7 (53.8%) |
| Enterprise Management | 0 (0.0%) | 0 (0.0%) |
| Administrative & Support | 52 (71.2%) | 21 (28.8%) |
| Educational Services | 13 (33.3%) | 26 (66.7%) |
| Health Care & Social Assistance | 38 (14.6%) | 223 (85.4%) |
| Arts, Entertainment & Recreation | 16 (43.2%) | 21 (56.8%) |
| Accommodation & Food Services | 98 (90.7%) | 10 (9.3%) |
| Public Administration | 35 (87.5%) | 5 (12.5%) |
| Total | 496 (53.0%) | 440 (47.0%) |
Education in Crosby
School Enrollment in Crosby
The most common levels of schooling among the 299 students in Crosby are middle school (65 | 21.7%), high school (64 | 21.4%), and elementary school (62 | 20.7%).
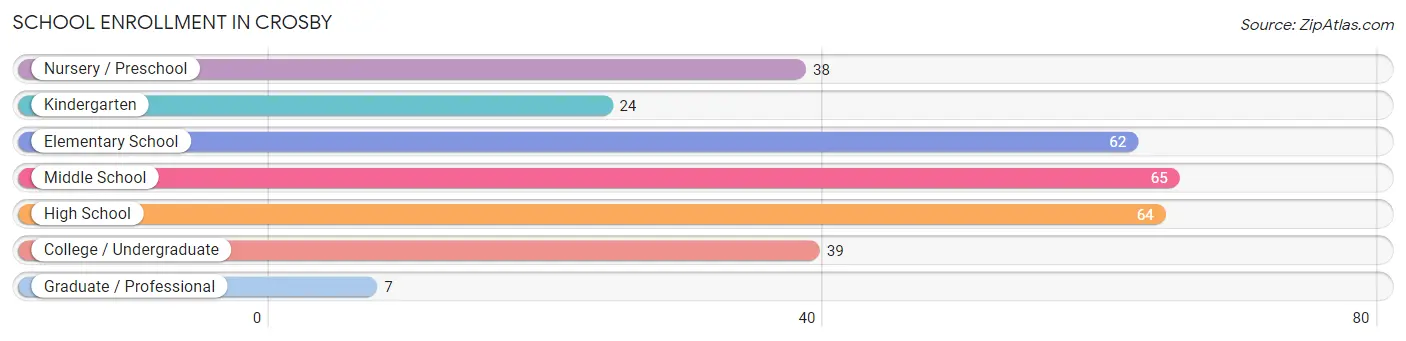
| School Level | # Students | % Students |
| Nursery / Preschool | 38 | 12.7% |
| Kindergarten | 24 | 8.0% |
| Elementary School | 62 | 20.7% |
| Middle School | 65 | 21.7% |
| High School | 64 | 21.4% |
| College / Undergraduate | 39 | 13.0% |
| Graduate / Professional | 7 | 2.3% |
| Total | 299 | 100.0% |
School Enrollment by Age by Funding Source in Crosby
Out of a total of 299 students who are enrolled in schools in Crosby, 8 (2.7%) attend a private institution, while the remaining 291 (97.3%) are enrolled in public schools. The age group of 18 to 19 year olds has the highest likelihood of being enrolled in private schools, with 8 (50.0% in the age bracket) enrolled. Conversely, the age group of 3 to 4 year olds has the lowest likelihood of being enrolled in a private school, with 6 (100.0% in the age bracket) attending a public institution.
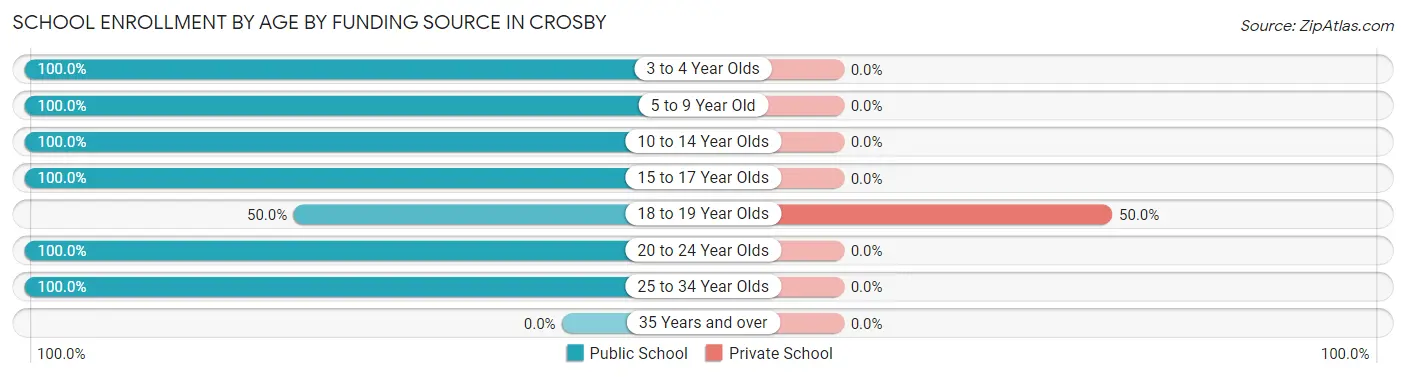
| Age Bracket | Public School | Private School |
| 3 to 4 Year Olds | 6 (100.0%) | 0 (0.0%) |
| 5 to 9 Year Old | 118 (100.0%) | 0 (0.0%) |
| 10 to 14 Year Olds | 65 (100.0%) | 0 (0.0%) |
| 15 to 17 Year Olds | 56 (100.0%) | 0 (0.0%) |
| 18 to 19 Year Olds | 8 (50.0%) | 8 (50.0%) |
| 20 to 24 Year Olds | 25 (100.0%) | 0 (0.0%) |
| 25 to 34 Year Olds | 13 (100.0%) | 0 (0.0%) |
| 35 Years and over | 0 (0.0%) | 0 (0.0%) |
| Total | 291 (97.3%) | 8 (2.7%) |
Educational Attainment by Field of Study in Crosby
Education (109 | 34.5%), bio, nature & agricultural (50 | 15.8%), literature & languages (30 | 9.5%), social sciences (27 | 8.5%), and arts & humanities (25 | 7.9%) are the most common fields of study among 316 individuals in Crosby who have obtained a bachelor's degree or higher.
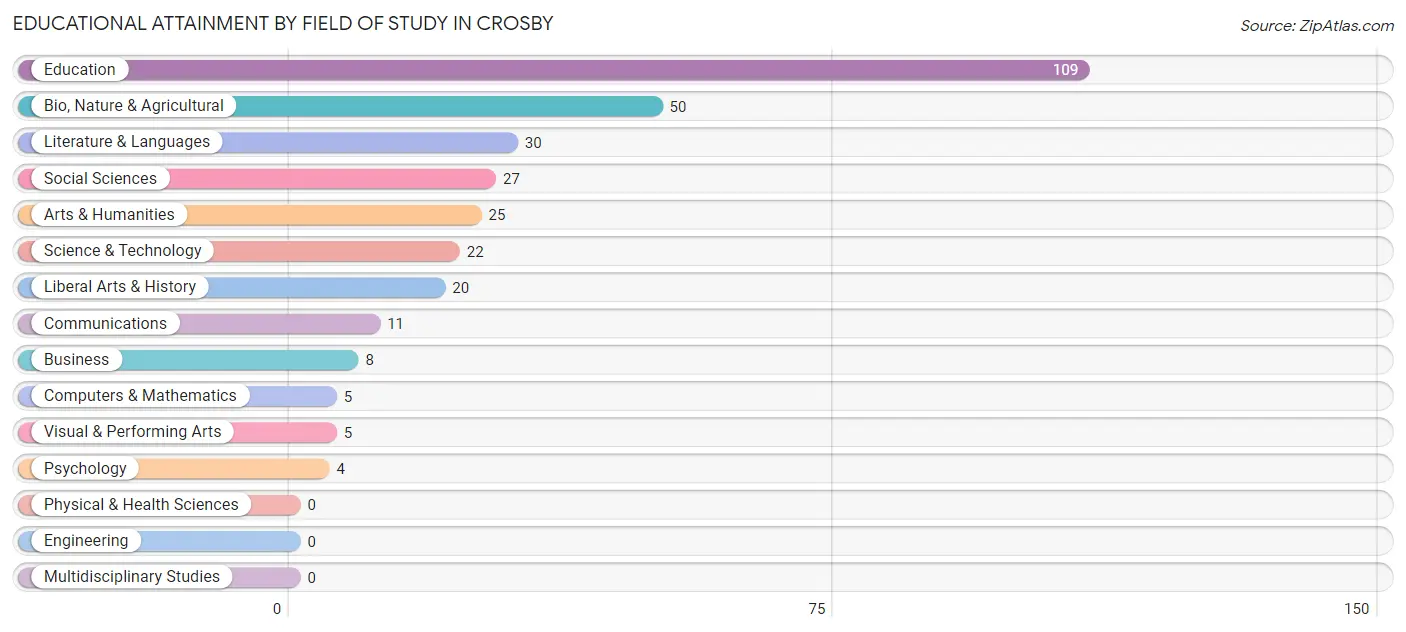
| Field of Study | # Graduates | % Graduates |
| Computers & Mathematics | 5 | 1.6% |
| Bio, Nature & Agricultural | 50 | 15.8% |
| Physical & Health Sciences | 0 | 0.0% |
| Psychology | 4 | 1.3% |
| Social Sciences | 27 | 8.5% |
| Engineering | 0 | 0.0% |
| Multidisciplinary Studies | 0 | 0.0% |
| Science & Technology | 22 | 7.0% |
| Business | 8 | 2.5% |
| Education | 109 | 34.5% |
| Literature & Languages | 30 | 9.5% |
| Liberal Arts & History | 20 | 6.3% |
| Visual & Performing Arts | 5 | 1.6% |
| Communications | 11 | 3.5% |
| Arts & Humanities | 25 | 7.9% |
| Total | 316 | 100.0% |
Transportation & Commute in Crosby
Vehicle Availability by Sex in Crosby
The most prevalent vehicle ownership categories in Crosby are males with 2 vehicles (186, accounting for 37.5%) and females with 2 vehicles (130, making up 42.3%).
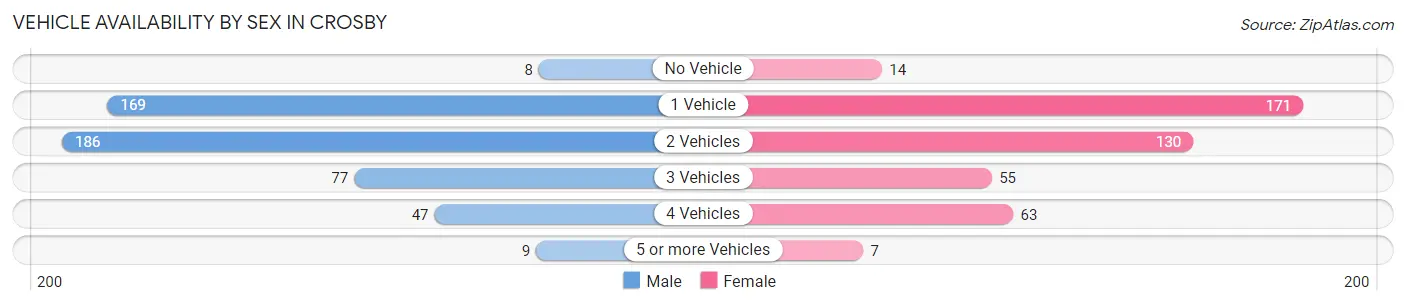
| Vehicles Available | Male | Female |
| No Vehicle | 8 (1.6%) | 14 (3.2%) |
| 1 Vehicle | 169 (34.1%) | 171 (38.9%) |
| 2 Vehicles | 186 (37.5%) | 130 (29.5%) |
| 3 Vehicles | 77 (15.5%) | 55 (12.5%) |
| 4 Vehicles | 47 (9.5%) | 63 (14.3%) |
| 5 or more Vehicles | 9 (1.8%) | 7 (1.6%) |
| Total | 496 (100.0%) | 440 (100.0%) |
Commute Time in Crosby
The most frequently occuring commute durations in Crosby are 5 to 9 minutes (302 commuters, 33.4%), 30 to 34 minutes (143 commuters, 15.8%), and less than 5 minutes (103 commuters, 11.4%).
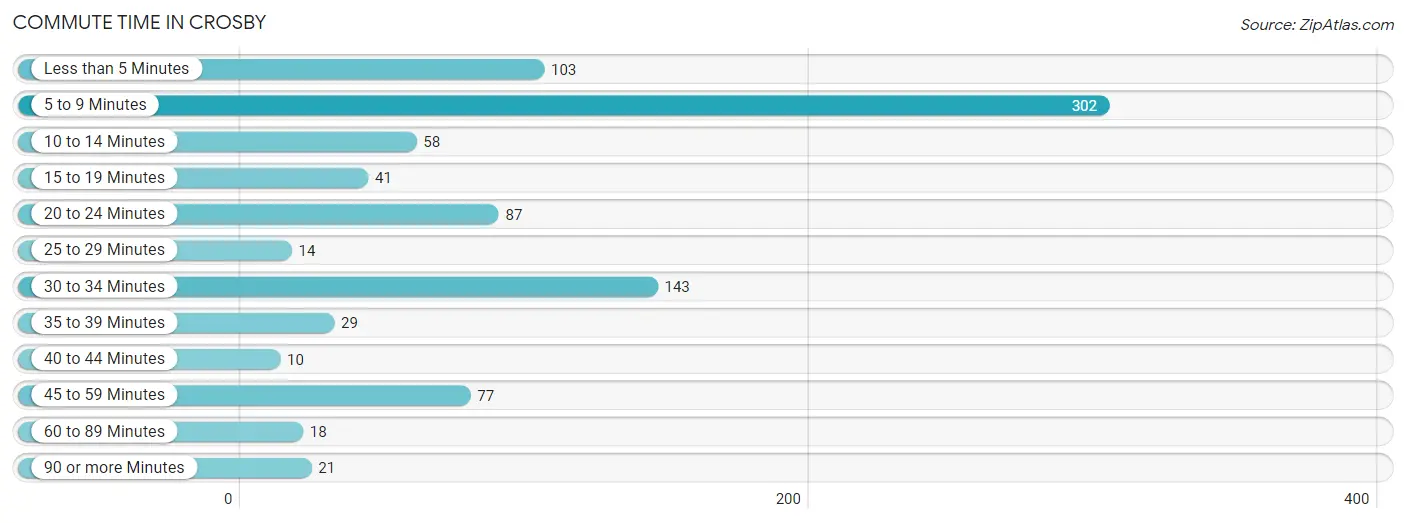
| Commute Time | # Commuters | % Commuters |
| Less than 5 Minutes | 103 | 11.4% |
| 5 to 9 Minutes | 302 | 33.4% |
| 10 to 14 Minutes | 58 | 6.4% |
| 15 to 19 Minutes | 41 | 4.5% |
| 20 to 24 Minutes | 87 | 9.6% |
| 25 to 29 Minutes | 14 | 1.5% |
| 30 to 34 Minutes | 143 | 15.8% |
| 35 to 39 Minutes | 29 | 3.2% |
| 40 to 44 Minutes | 10 | 1.1% |
| 45 to 59 Minutes | 77 | 8.5% |
| 60 to 89 Minutes | 18 | 2.0% |
| 90 or more Minutes | 21 | 2.3% |
Commute Time by Sex in Crosby
The most common commute times in Crosby are 5 to 9 minutes (166 commuters, 33.7%) for males and 5 to 9 minutes (136 commuters, 33.1%) for females.
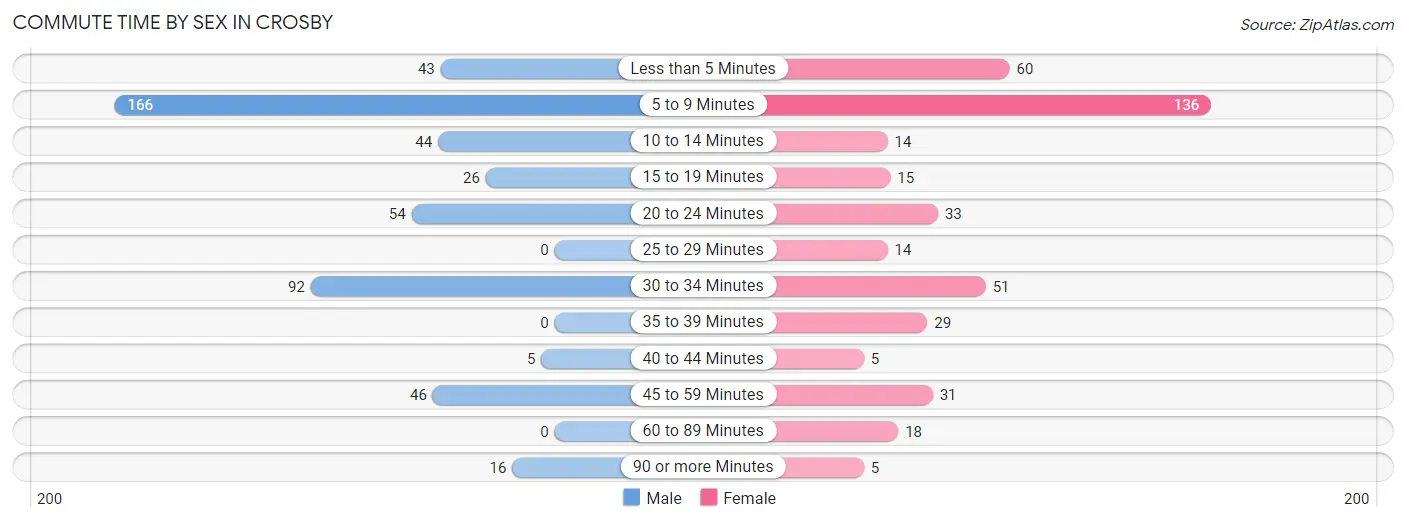
| Commute Time | Male | Female |
| Less than 5 Minutes | 43 (8.7%) | 60 (14.6%) |
| 5 to 9 Minutes | 166 (33.7%) | 136 (33.1%) |
| 10 to 14 Minutes | 44 (8.9%) | 14 (3.4%) |
| 15 to 19 Minutes | 26 (5.3%) | 15 (3.6%) |
| 20 to 24 Minutes | 54 (11.0%) | 33 (8.0%) |
| 25 to 29 Minutes | 0 (0.0%) | 14 (3.4%) |
| 30 to 34 Minutes | 92 (18.7%) | 51 (12.4%) |
| 35 to 39 Minutes | 0 (0.0%) | 29 (7.1%) |
| 40 to 44 Minutes | 5 (1.0%) | 5 (1.2%) |
| 45 to 59 Minutes | 46 (9.3%) | 31 (7.5%) |
| 60 to 89 Minutes | 0 (0.0%) | 18 (4.4%) |
| 90 or more Minutes | 16 (3.3%) | 5 (1.2%) |
Time of Departure to Work by Sex in Crosby
The most frequent times of departure to work in Crosby are 7:00 AM to 7:29 AM (75, 15.2%) for males and 7:30 AM to 7:59 AM (94, 22.9%) for females.
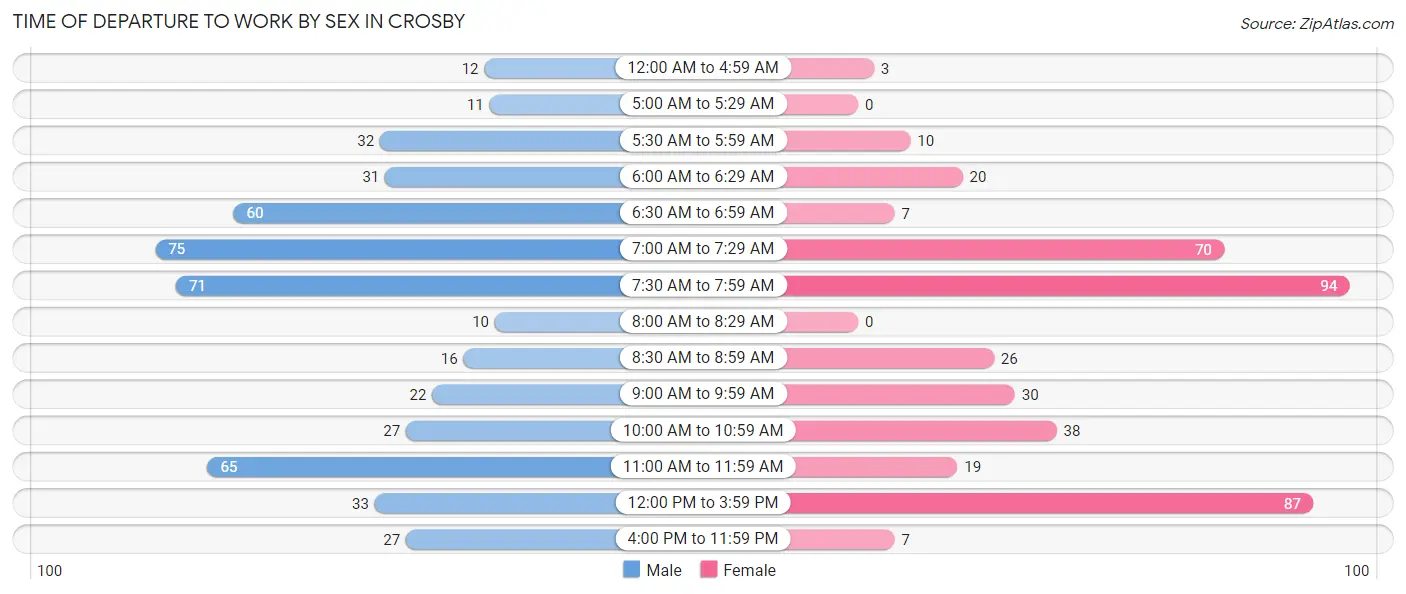
| Time of Departure | Male | Female |
| 12:00 AM to 4:59 AM | 12 (2.4%) | 3 (0.7%) |
| 5:00 AM to 5:29 AM | 11 (2.2%) | 0 (0.0%) |
| 5:30 AM to 5:59 AM | 32 (6.5%) | 10 (2.4%) |
| 6:00 AM to 6:29 AM | 31 (6.3%) | 20 (4.9%) |
| 6:30 AM to 6:59 AM | 60 (12.2%) | 7 (1.7%) |
| 7:00 AM to 7:29 AM | 75 (15.2%) | 70 (17.0%) |
| 7:30 AM to 7:59 AM | 71 (14.4%) | 94 (22.9%) |
| 8:00 AM to 8:29 AM | 10 (2.0%) | 0 (0.0%) |
| 8:30 AM to 8:59 AM | 16 (3.3%) | 26 (6.3%) |
| 9:00 AM to 9:59 AM | 22 (4.5%) | 30 (7.3%) |
| 10:00 AM to 10:59 AM | 27 (5.5%) | 38 (9.2%) |
| 11:00 AM to 11:59 AM | 65 (13.2%) | 19 (4.6%) |
| 12:00 PM to 3:59 PM | 33 (6.7%) | 87 (21.2%) |
| 4:00 PM to 11:59 PM | 27 (5.5%) | 7 (1.7%) |
| Total | 492 (100.0%) | 411 (100.0%) |
Housing Occupancy in Crosby
Occupancy by Ownership in Crosby
Of the total 1,212 dwellings in Crosby, owner-occupied units account for 622 (51.3%), while renter-occupied units make up 590 (48.7%).
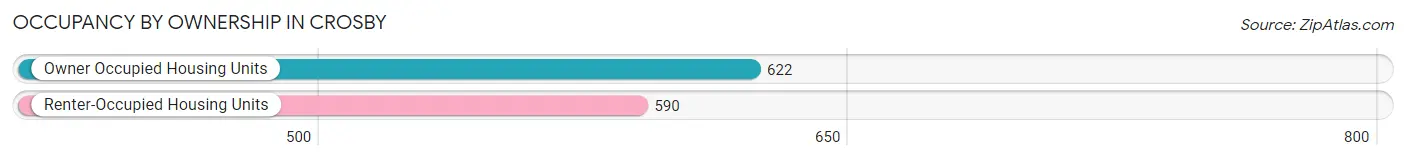
| Occupancy | # Housing Units | % Housing Units |
| Owner Occupied Housing Units | 622 | 51.3% |
| Renter-Occupied Housing Units | 590 | 48.7% |
| Total Occupied Housing Units | 1,212 | 100.0% |
Occupancy by Household Size in Crosby
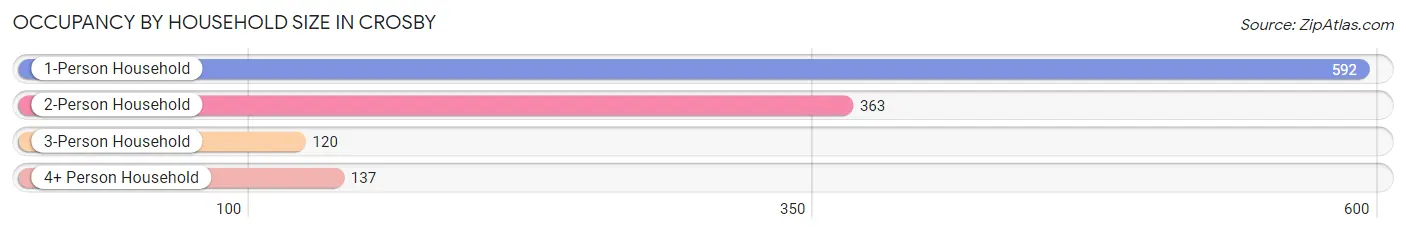
| Household Size | # Housing Units | % Housing Units |
| 1-Person Household | 592 | 48.8% |
| 2-Person Household | 363 | 29.9% |
| 3-Person Household | 120 | 9.9% |
| 4+ Person Household | 137 | 11.3% |
| Total Housing Units | 1,212 | 100.0% |
Occupancy by Ownership by Household Size in Crosby
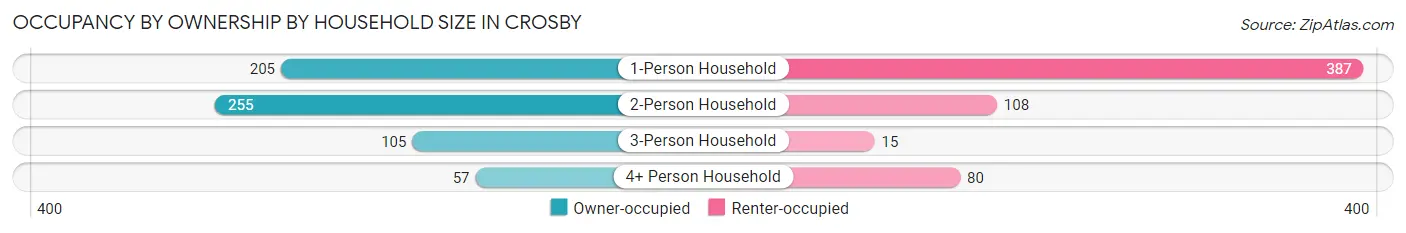
| Household Size | Owner-occupied | Renter-occupied |
| 1-Person Household | 205 (34.6%) | 387 (65.4%) |
| 2-Person Household | 255 (70.3%) | 108 (29.7%) |
| 3-Person Household | 105 (87.5%) | 15 (12.5%) |
| 4+ Person Household | 57 (41.6%) | 80 (58.4%) |
| Total Housing Units | 622 (51.3%) | 590 (48.7%) |
Occupancy by Educational Attainment in Crosby
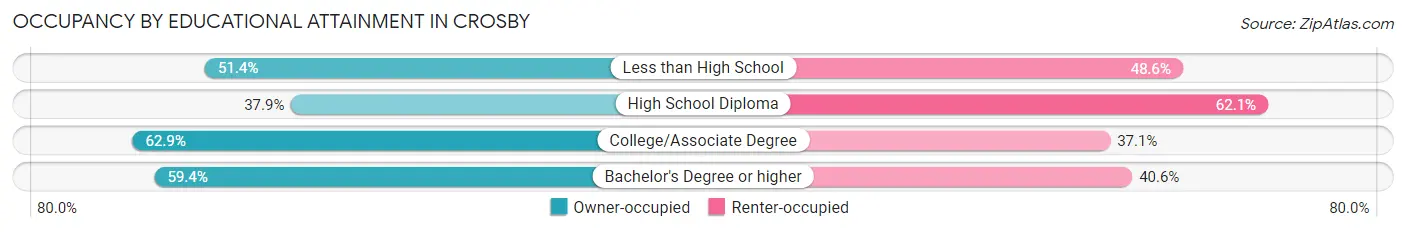
| Household Size | Owner-occupied | Renter-occupied |
| Less than High School | 75 (51.4%) | 71 (48.6%) |
| High School Diploma | 178 (37.9%) | 292 (62.1%) |
| College/Associate Degree | 271 (62.9%) | 160 (37.1%) |
| Bachelor's Degree or higher | 98 (59.4%) | 67 (40.6%) |
Occupancy by Age of Householder in Crosby
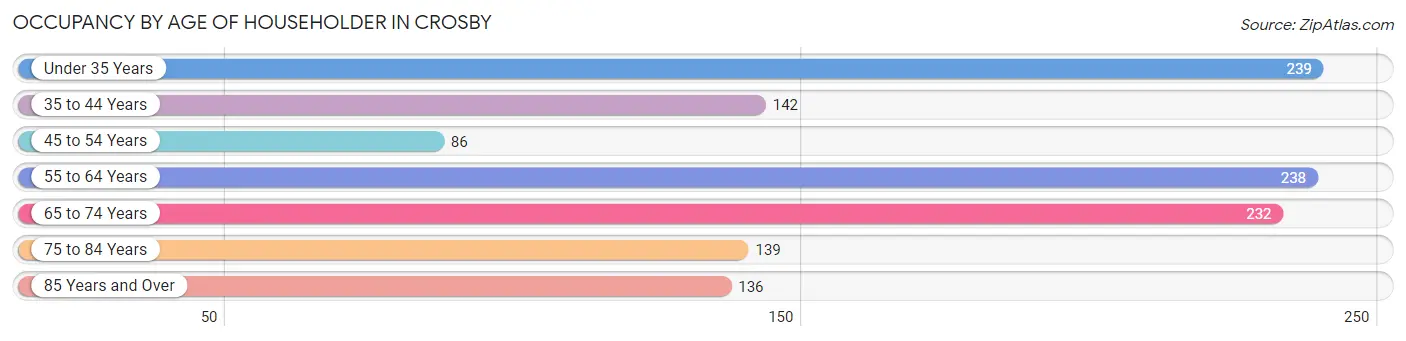
| Age Bracket | # Households | % Households |
| Under 35 Years | 239 | 19.7% |
| 35 to 44 Years | 142 | 11.7% |
| 45 to 54 Years | 86 | 7.1% |
| 55 to 64 Years | 238 | 19.6% |
| 65 to 74 Years | 232 | 19.1% |
| 75 to 84 Years | 139 | 11.5% |
| 85 Years and Over | 136 | 11.2% |
| Total | 1,212 | 100.0% |
Housing Finances in Crosby
Median Income by Occupancy in Crosby
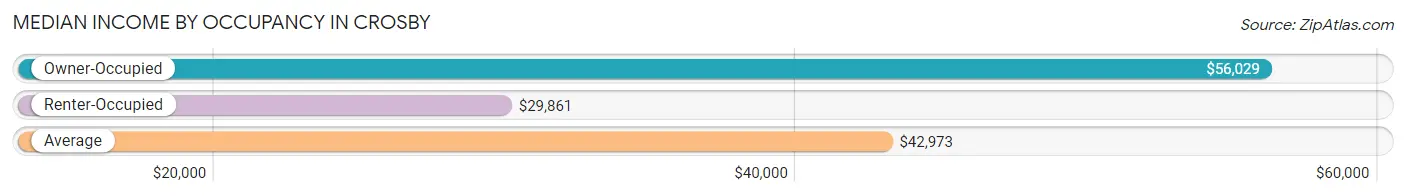
| Occupancy Type | # Households | Median Income |
| Owner-Occupied | 622 (51.3%) | $56,029 |
| Renter-Occupied | 590 (48.7%) | $29,861 |
| Average | 1,212 (100.0%) | $42,973 |
Occupancy by Householder Income Bracket in Crosby
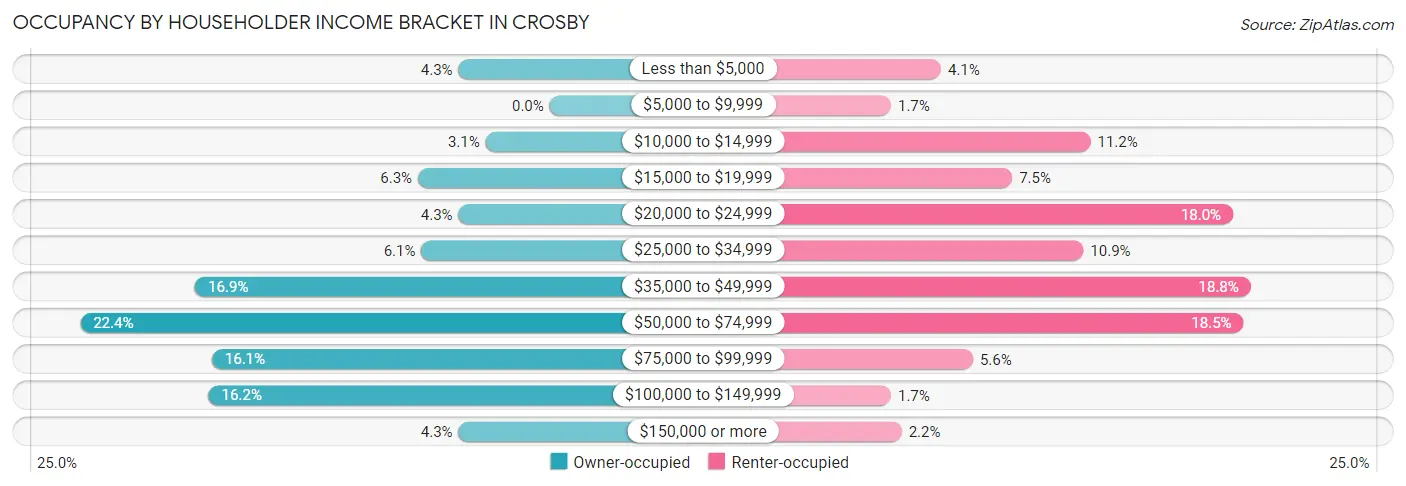
| Income Bracket | Owner-occupied | Renter-occupied |
| Less than $5,000 | 27 (4.3%) | 24 (4.1%) |
| $5,000 to $9,999 | 0 (0.0%) | 10 (1.7%) |
| $10,000 to $14,999 | 19 (3.0%) | 66 (11.2%) |
| $15,000 to $19,999 | 39 (6.3%) | 44 (7.5%) |
| $20,000 to $24,999 | 27 (4.3%) | 106 (18.0%) |
| $25,000 to $34,999 | 38 (6.1%) | 64 (10.8%) |
| $35,000 to $49,999 | 105 (16.9%) | 111 (18.8%) |
| $50,000 to $74,999 | 139 (22.4%) | 109 (18.5%) |
| $75,000 to $99,999 | 100 (16.1%) | 33 (5.6%) |
| $100,000 to $149,999 | 101 (16.2%) | 10 (1.7%) |
| $150,000 or more | 27 (4.3%) | 13 (2.2%) |
| Total | 622 (100.0%) | 590 (100.0%) |
Monthly Housing Cost Tiers in Crosby
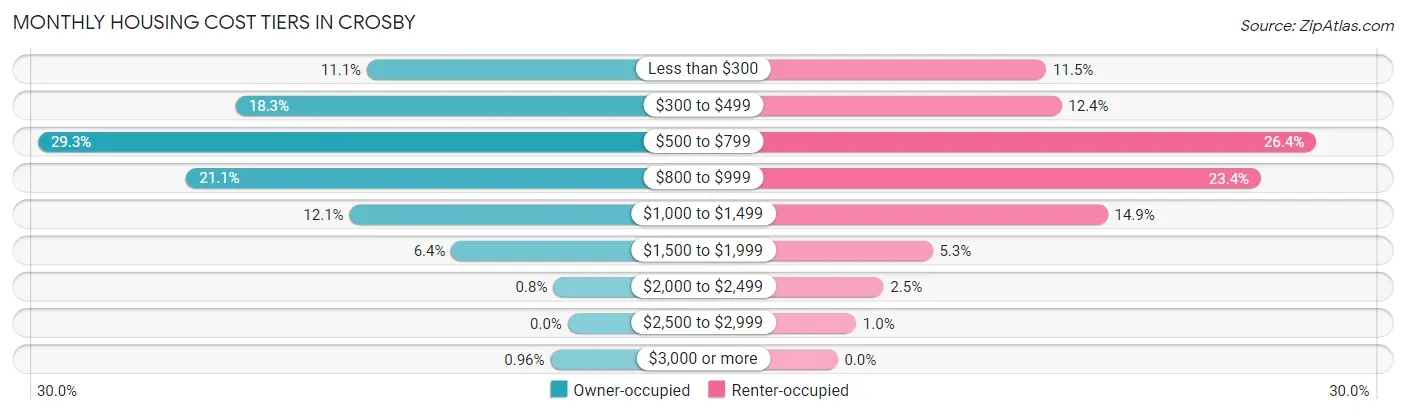
| Monthly Cost | Owner-occupied | Renter-occupied |
| Less than $300 | 69 (11.1%) | 68 (11.5%) |
| $300 to $499 | 114 (18.3%) | 73 (12.4%) |
| $500 to $799 | 182 (29.3%) | 156 (26.4%) |
| $800 to $999 | 131 (21.1%) | 138 (23.4%) |
| $1,000 to $1,499 | 75 (12.1%) | 88 (14.9%) |
| $1,500 to $1,999 | 40 (6.4%) | 31 (5.2%) |
| $2,000 to $2,499 | 5 (0.8%) | 15 (2.5%) |
| $2,500 to $2,999 | 0 (0.0%) | 6 (1.0%) |
| $3,000 or more | 6 (1.0%) | 0 (0.0%) |
| Total | 622 (100.0%) | 590 (100.0%) |
Physical Housing Characteristics in Crosby
Housing Structures in Crosby
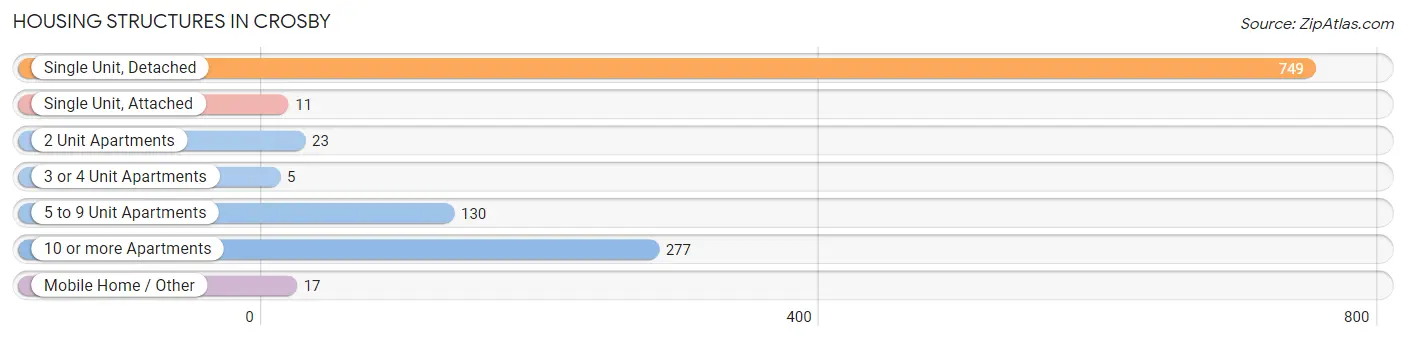
| Structure Type | # Housing Units | % Housing Units |
| Single Unit, Detached | 749 | 61.8% |
| Single Unit, Attached | 11 | 0.9% |
| 2 Unit Apartments | 23 | 1.9% |
| 3 or 4 Unit Apartments | 5 | 0.4% |
| 5 to 9 Unit Apartments | 130 | 10.7% |
| 10 or more Apartments | 277 | 22.9% |
| Mobile Home / Other | 17 | 1.4% |
| Total | 1,212 | 100.0% |
Housing Structures by Occupancy in Crosby
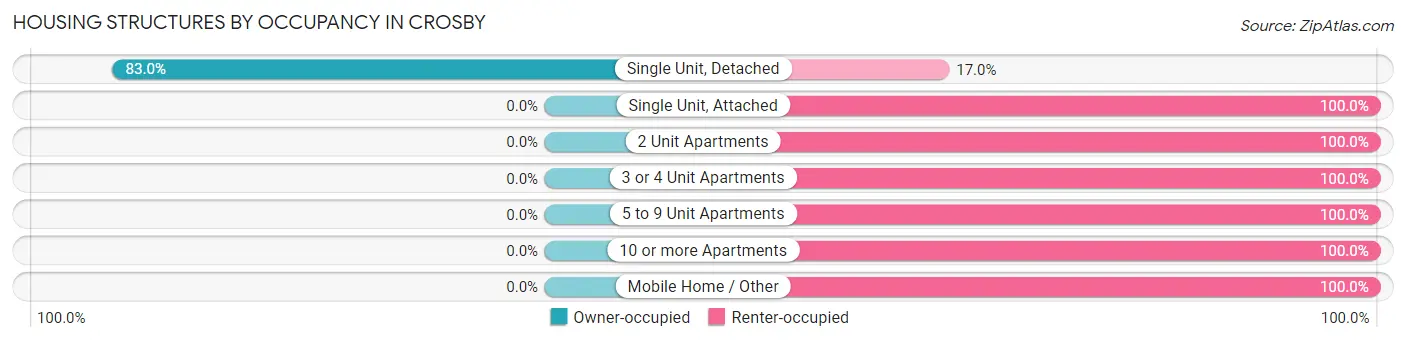
| Structure Type | Owner-occupied | Renter-occupied |
| Single Unit, Detached | 622 (83.0%) | 127 (17.0%) |
| Single Unit, Attached | 0 (0.0%) | 11 (100.0%) |
| 2 Unit Apartments | 0 (0.0%) | 23 (100.0%) |
| 3 or 4 Unit Apartments | 0 (0.0%) | 5 (100.0%) |
| 5 to 9 Unit Apartments | 0 (0.0%) | 130 (100.0%) |
| 10 or more Apartments | 0 (0.0%) | 277 (100.0%) |
| Mobile Home / Other | 0 (0.0%) | 17 (100.0%) |
| Total | 622 (51.3%) | 590 (48.7%) |
Housing Structures by Number of Rooms in Crosby
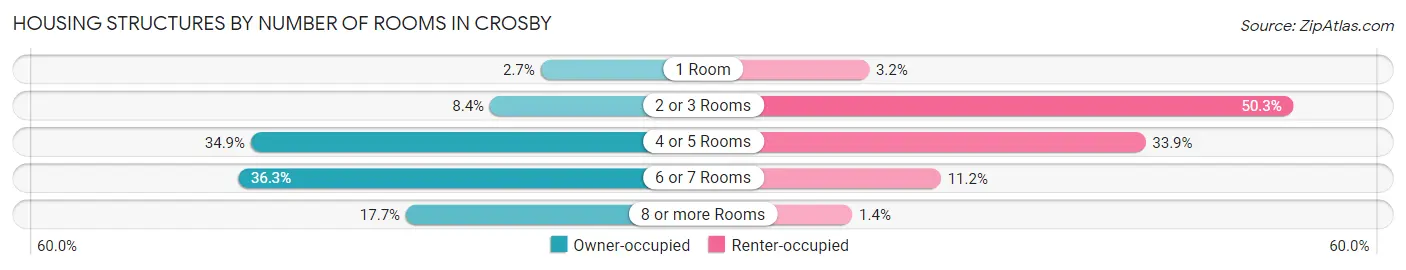
| Number of Rooms | Owner-occupied | Renter-occupied |
| 1 Room | 17 (2.7%) | 19 (3.2%) |
| 2 or 3 Rooms | 52 (8.4%) | 297 (50.3%) |
| 4 or 5 Rooms | 217 (34.9%) | 200 (33.9%) |
| 6 or 7 Rooms | 226 (36.3%) | 66 (11.2%) |
| 8 or more Rooms | 110 (17.7%) | 8 (1.4%) |
| Total | 622 (100.0%) | 590 (100.0%) |
Housing Structure by Heating Type in Crosby
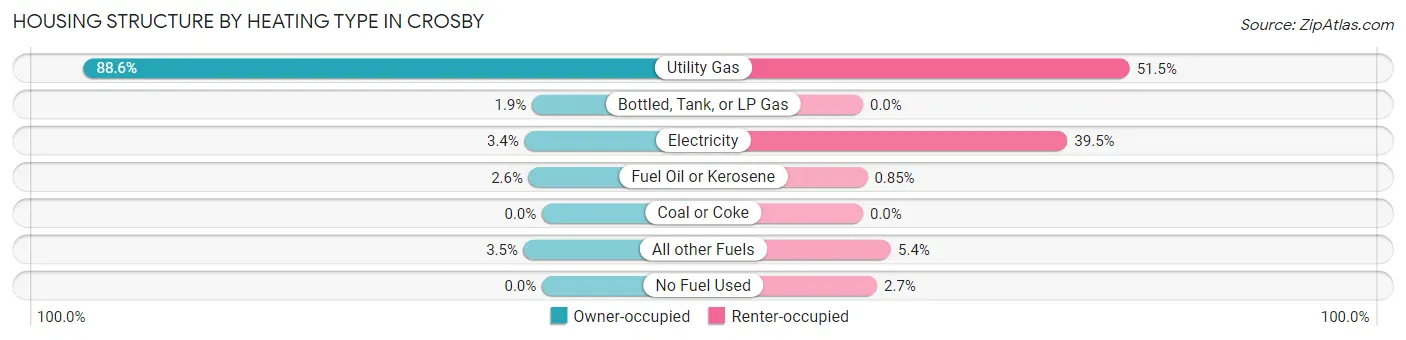
| Heating Type | Owner-occupied | Renter-occupied |
| Utility Gas | 551 (88.6%) | 304 (51.5%) |
| Bottled, Tank, or LP Gas | 12 (1.9%) | 0 (0.0%) |
| Electricity | 21 (3.4%) | 233 (39.5%) |
| Fuel Oil or Kerosene | 16 (2.6%) | 5 (0.9%) |
| Coal or Coke | 0 (0.0%) | 0 (0.0%) |
| All other Fuels | 22 (3.5%) | 32 (5.4%) |
| No Fuel Used | 0 (0.0%) | 16 (2.7%) |
| Total | 622 (100.0%) | 590 (100.0%) |
Household Vehicle Usage in Crosby
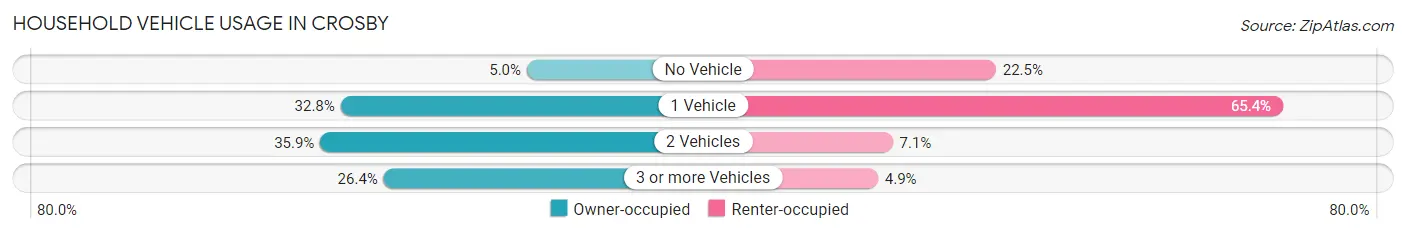
| Vehicles per Household | Owner-occupied | Renter-occupied |
| No Vehicle | 31 (5.0%) | 133 (22.5%) |
| 1 Vehicle | 204 (32.8%) | 386 (65.4%) |
| 2 Vehicles | 223 (35.8%) | 42 (7.1%) |
| 3 or more Vehicles | 164 (26.4%) | 29 (4.9%) |
| Total | 622 (100.0%) | 590 (100.0%) |
Real Estate & Mortgages in Crosby
Real Estate and Mortgage Overview in Crosby
| Characteristic | Without Mortgage | With Mortgage |
| Housing Units | 285 | 337 |
| Median Property Value | $164,000 | $121,500 |
| Median Household Income | $46,250 | $27 |
| Monthly Housing Costs | $448 | $6 |
| Real Estate Taxes | $1,118 | $6 |
Property Value by Mortgage Status in Crosby
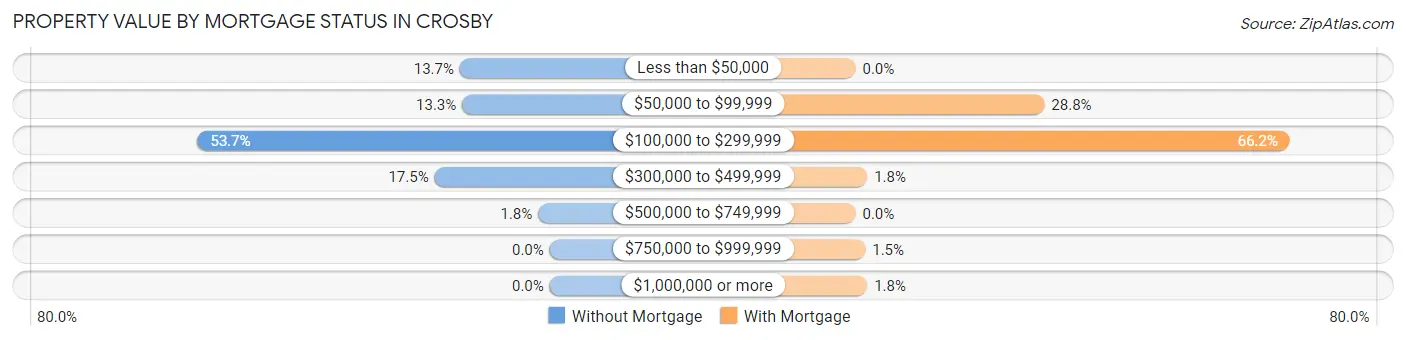
| Property Value | Without Mortgage | With Mortgage |
| Less than $50,000 | 39 (13.7%) | 0 (0.0%) |
| $50,000 to $99,999 | 38 (13.3%) | 97 (28.8%) |
| $100,000 to $299,999 | 153 (53.7%) | 223 (66.2%) |
| $300,000 to $499,999 | 50 (17.5%) | 6 (1.8%) |
| $500,000 to $749,999 | 5 (1.8%) | 0 (0.0%) |
| $750,000 to $999,999 | 0 (0.0%) | 5 (1.5%) |
| $1,000,000 or more | 0 (0.0%) | 6 (1.8%) |
| Total | 285 (100.0%) | 337 (100.0%) |
Household Income by Mortgage Status in Crosby
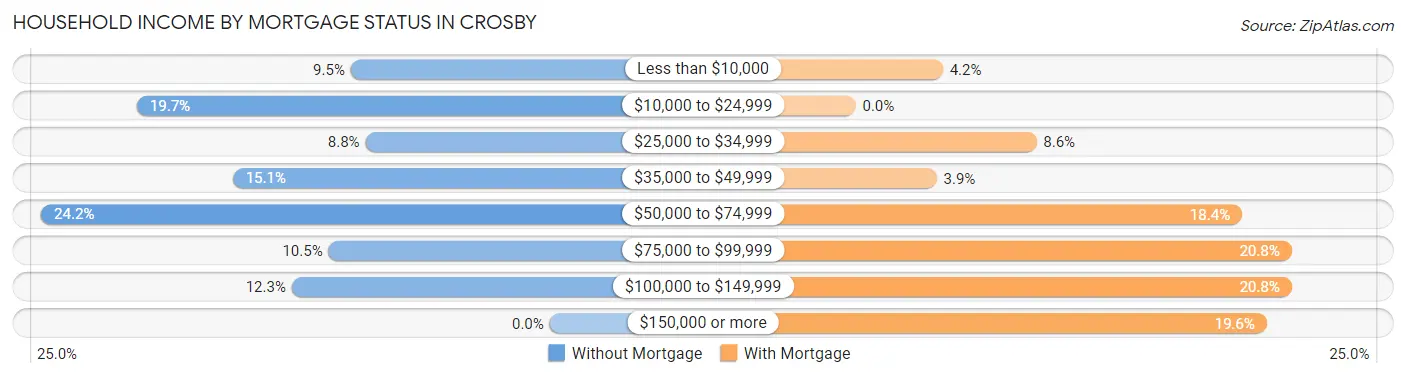
| Household Income | Without Mortgage | With Mortgage |
| Less than $10,000 | 27 (9.5%) | 14 (4.2%) |
| $10,000 to $24,999 | 56 (19.7%) | 0 (0.0%) |
| $25,000 to $34,999 | 25 (8.8%) | 29 (8.6%) |
| $35,000 to $49,999 | 43 (15.1%) | 13 (3.9%) |
| $50,000 to $74,999 | 69 (24.2%) | 62 (18.4%) |
| $75,000 to $99,999 | 30 (10.5%) | 70 (20.8%) |
| $100,000 to $149,999 | 35 (12.3%) | 70 (20.8%) |
| $150,000 or more | 0 (0.0%) | 66 (19.6%) |
| Total | 285 (100.0%) | 337 (100.0%) |
Property Value to Household Income Ratio in Crosby
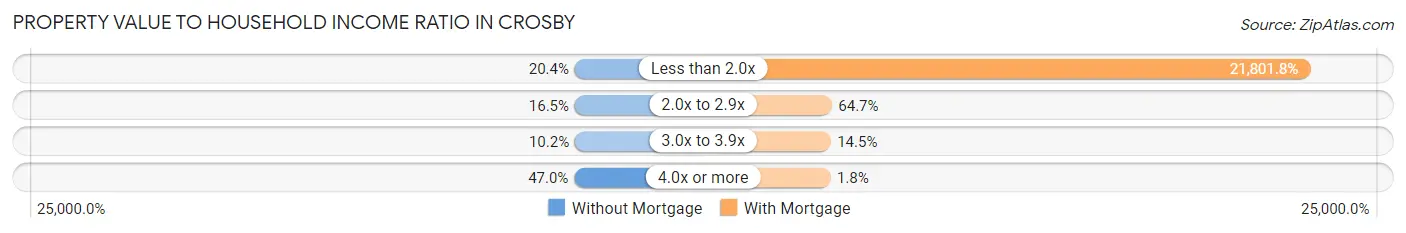
| Value-to-Income Ratio | Without Mortgage | With Mortgage |
| Less than 2.0x | 58 (20.3%) | 73,472 (21,801.8%) |
| 2.0x to 2.9x | 47 (16.5%) | 218 (64.7%) |
| 3.0x to 3.9x | 29 (10.2%) | 49 (14.5%) |
| 4.0x or more | 134 (47.0%) | 6 (1.8%) |
| Total | 285 (100.0%) | 337 (100.0%) |
Real Estate Taxes by Mortgage Status in Crosby
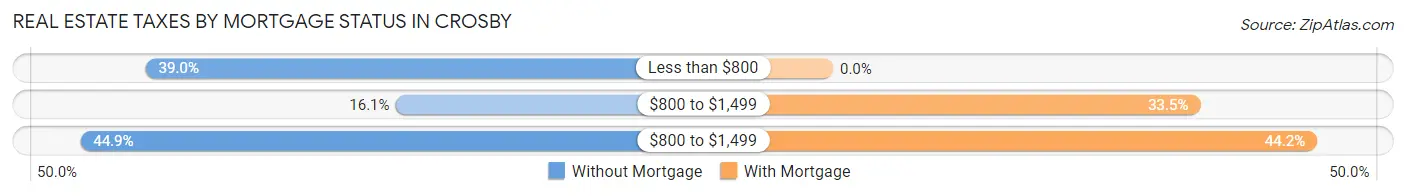
| Property Taxes | Without Mortgage | With Mortgage |
| Less than $800 | 111 (39.0%) | 0 (0.0%) |
| $800 to $1,499 | 46 (16.1%) | 113 (33.5%) |
| $800 to $1,499 | 128 (44.9%) | 149 (44.2%) |
| Total | 285 (100.0%) | 337 (100.0%) |
Health & Disability in Crosby
Health Insurance Coverage by Age in Crosby
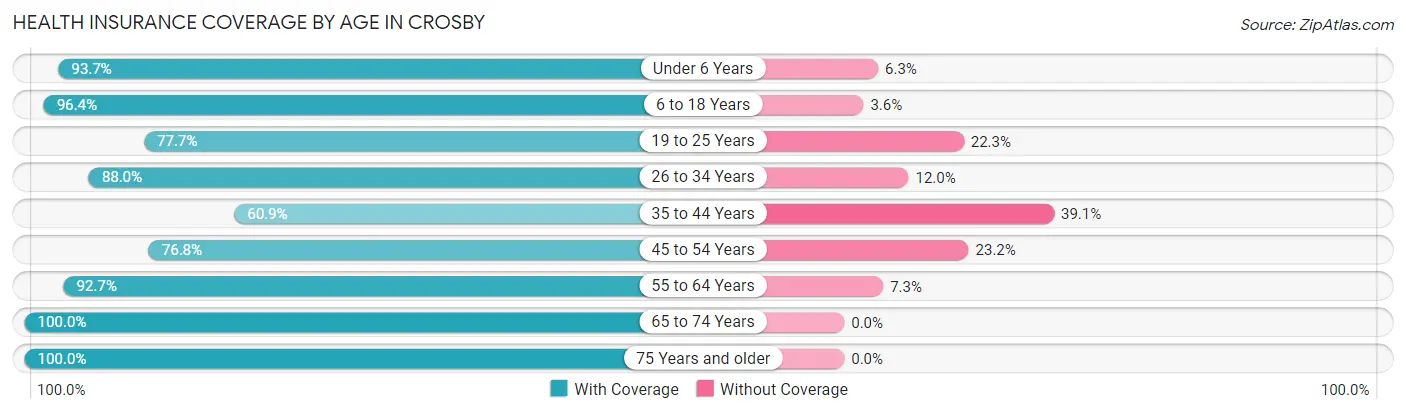
| Age Bracket | With Coverage | Without Coverage |
| Under 6 Years | 104 (93.7%) | 7 (6.3%) |
| 6 to 18 Years | 323 (96.4%) | 12 (3.6%) |
| 19 to 25 Years | 143 (77.7%) | 41 (22.3%) |
| 26 to 34 Years | 279 (88.0%) | 38 (12.0%) |
| 35 to 44 Years | 123 (60.9%) | 79 (39.1%) |
| 45 to 54 Years | 169 (76.8%) | 51 (23.2%) |
| 55 to 64 Years | 281 (92.7%) | 22 (7.3%) |
| 65 to 74 Years | 329 (100.0%) | 0 (0.0%) |
| 75 Years and older | 392 (100.0%) | 0 (0.0%) |
| Total | 2,143 (89.5%) | 250 (10.4%) |
Health Insurance Coverage by Citizenship Status in Crosby
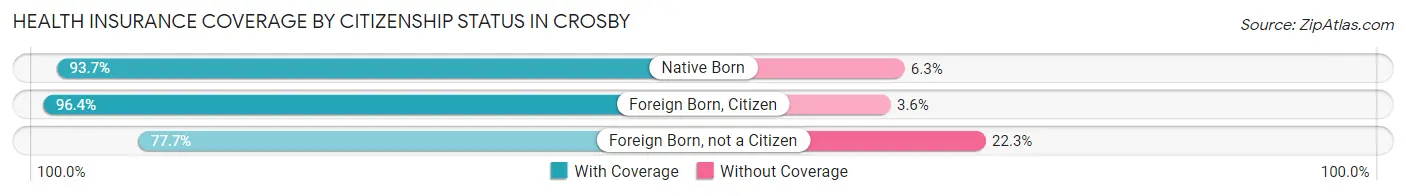
| Citizenship Status | With Coverage | Without Coverage |
| Native Born | 104 (93.7%) | 7 (6.3%) |
| Foreign Born, Citizen | 323 (96.4%) | 12 (3.6%) |
| Foreign Born, not a Citizen | 143 (77.7%) | 41 (22.3%) |
Health Insurance Coverage by Household Income in Crosby
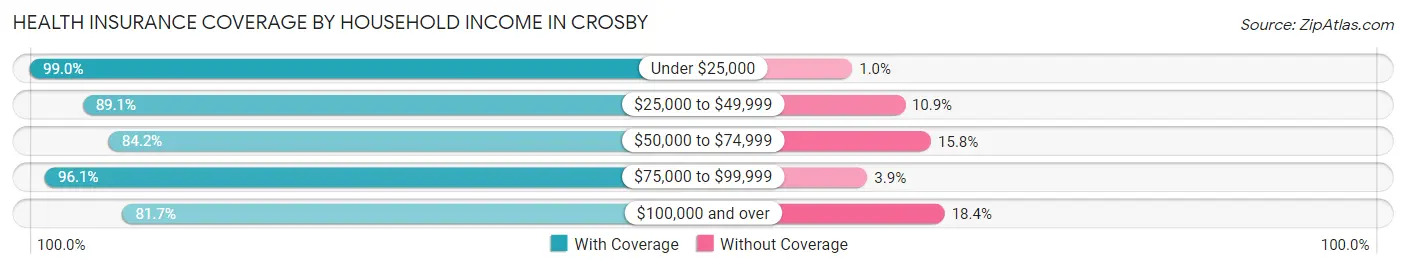
| Household Income | With Coverage | Without Coverage |
| Under $25,000 | 479 (99.0%) | 5 (1.0%) |
| $25,000 to $49,999 | 532 (89.1%) | 65 (10.9%) |
| $50,000 to $74,999 | 517 (84.2%) | 97 (15.8%) |
| $75,000 to $99,999 | 299 (96.1%) | 12 (3.9%) |
| $100,000 and over | 316 (81.7%) | 71 (18.3%) |
Public vs Private Health Insurance Coverage by Age in Crosby
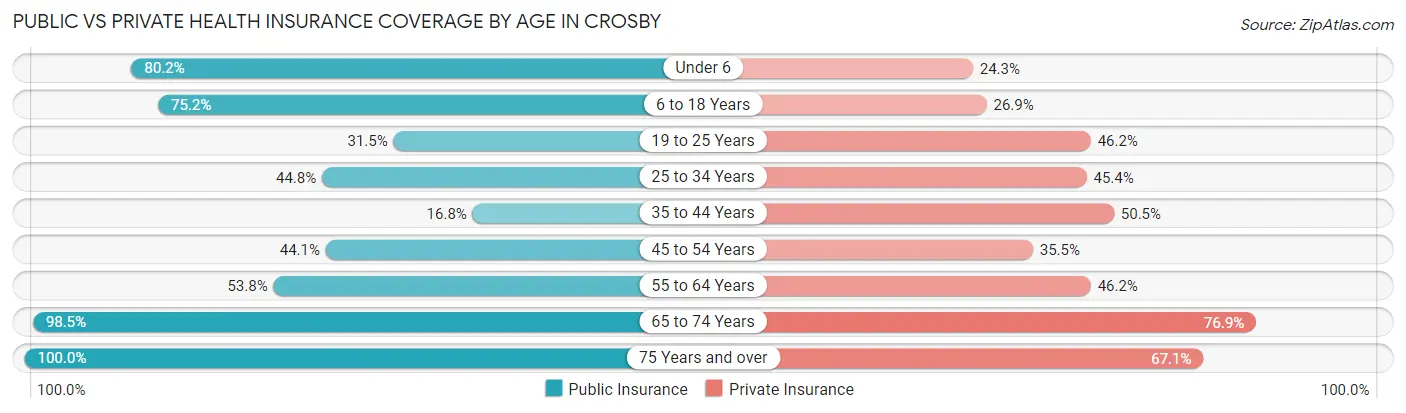
| Age Bracket | Public Insurance | Private Insurance |
| Under 6 | 89 (80.2%) | 27 (24.3%) |
| 6 to 18 Years | 252 (75.2%) | 90 (26.9%) |
| 19 to 25 Years | 58 (31.5%) | 85 (46.2%) |
| 25 to 34 Years | 142 (44.8%) | 144 (45.4%) |
| 35 to 44 Years | 34 (16.8%) | 102 (50.5%) |
| 45 to 54 Years | 97 (44.1%) | 78 (35.4%) |
| 55 to 64 Years | 163 (53.8%) | 140 (46.2%) |
| 65 to 74 Years | 324 (98.5%) | 253 (76.9%) |
| 75 Years and over | 392 (100.0%) | 263 (67.1%) |
| Total | 1,551 (64.8%) | 1,182 (49.4%) |
Disability Status by Sex by Age in Crosby
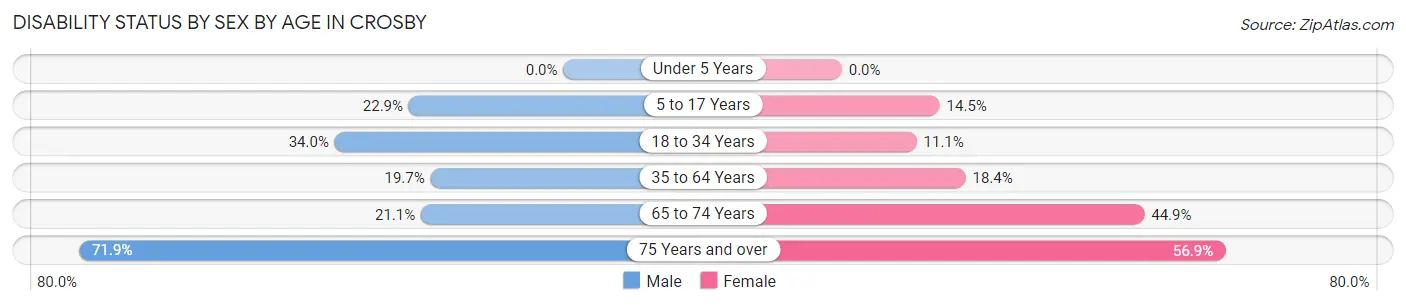
| Age Bracket | Male | Female |
| Under 5 Years | 0 (0.0%) | 0 (0.0%) |
| 5 to 17 Years | 39 (22.9%) | 26 (14.5%) |
| 18 to 34 Years | 92 (34.0%) | 30 (11.1%) |
| 35 to 64 Years | 70 (19.7%) | 68 (18.4%) |
| 65 to 74 Years | 30 (21.1%) | 84 (44.9%) |
| 75 Years and over | 105 (71.9%) | 140 (56.9%) |
Disability Class by Sex by Age in Crosby
Disability Class: Hearing Difficulty
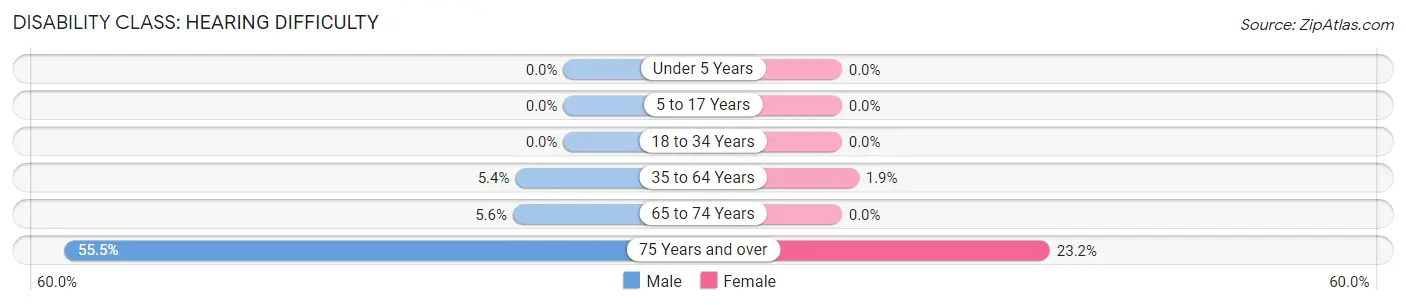
| Age Bracket | Male | Female |
| Under 5 Years | 0 (0.0%) | 0 (0.0%) |
| 5 to 17 Years | 0 (0.0%) | 0 (0.0%) |
| 18 to 34 Years | 0 (0.0%) | 0 (0.0%) |
| 35 to 64 Years | 19 (5.3%) | 7 (1.9%) |
| 65 to 74 Years | 8 (5.6%) | 0 (0.0%) |
| 75 Years and over | 81 (55.5%) | 57 (23.2%) |
Disability Class: Vision Difficulty
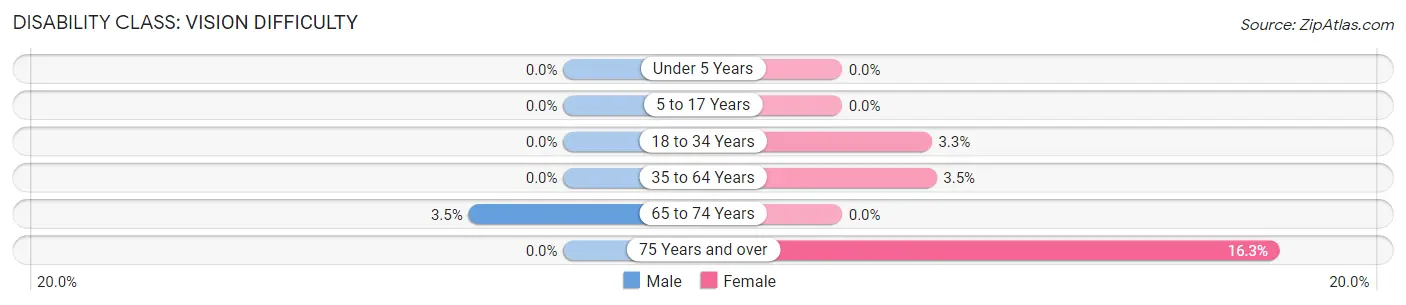
| Age Bracket | Male | Female |
| Under 5 Years | 0 (0.0%) | 0 (0.0%) |
| 5 to 17 Years | 0 (0.0%) | 0 (0.0%) |
| 18 to 34 Years | 0 (0.0%) | 9 (3.3%) |
| 35 to 64 Years | 0 (0.0%) | 13 (3.5%) |
| 65 to 74 Years | 5 (3.5%) | 0 (0.0%) |
| 75 Years and over | 0 (0.0%) | 40 (16.3%) |
Disability Class: Cognitive Difficulty
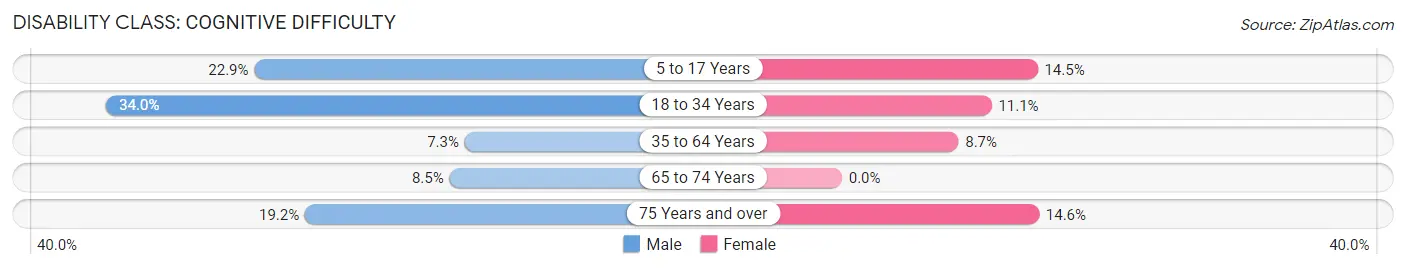
| Age Bracket | Male | Female |
| 5 to 17 Years | 39 (22.9%) | 26 (14.5%) |
| 18 to 34 Years | 92 (34.0%) | 30 (11.1%) |
| 35 to 64 Years | 26 (7.3%) | 32 (8.6%) |
| 65 to 74 Years | 12 (8.5%) | 0 (0.0%) |
| 75 Years and over | 28 (19.2%) | 36 (14.6%) |
Disability Class: Ambulatory Difficulty
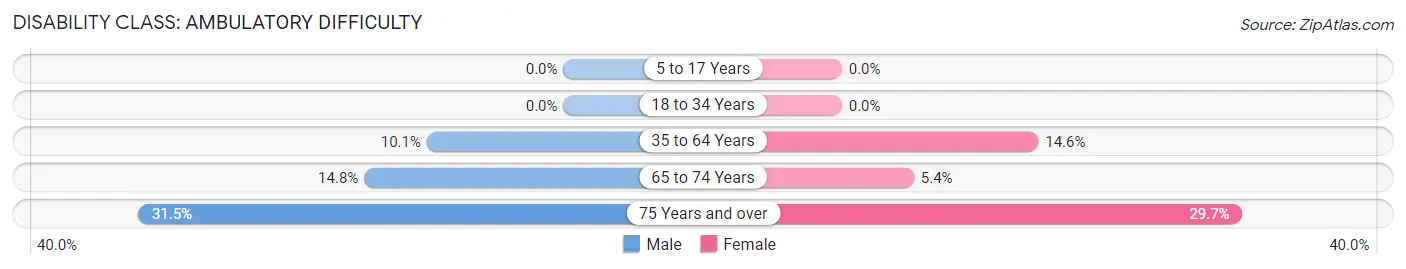
| Age Bracket | Male | Female |
| 5 to 17 Years | 0 (0.0%) | 0 (0.0%) |
| 18 to 34 Years | 0 (0.0%) | 0 (0.0%) |
| 35 to 64 Years | 36 (10.1%) | 54 (14.6%) |
| 65 to 74 Years | 21 (14.8%) | 10 (5.3%) |
| 75 Years and over | 46 (31.5%) | 73 (29.7%) |
Disability Class: Self-Care Difficulty
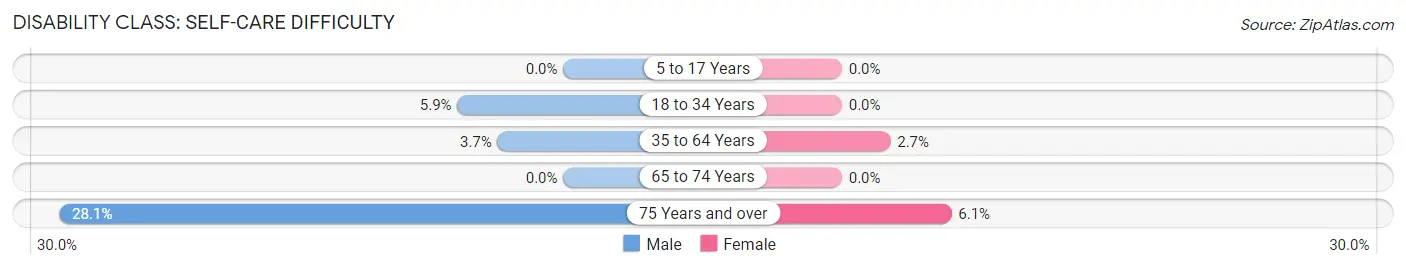
| Age Bracket | Male | Female |
| 5 to 17 Years | 0 (0.0%) | 0 (0.0%) |
| 18 to 34 Years | 16 (5.9%) | 0 (0.0%) |
| 35 to 64 Years | 13 (3.7%) | 10 (2.7%) |
| 65 to 74 Years | 0 (0.0%) | 0 (0.0%) |
| 75 Years and over | 41 (28.1%) | 15 (6.1%) |
Technology Access in Crosby
Computing Device Access in Crosby
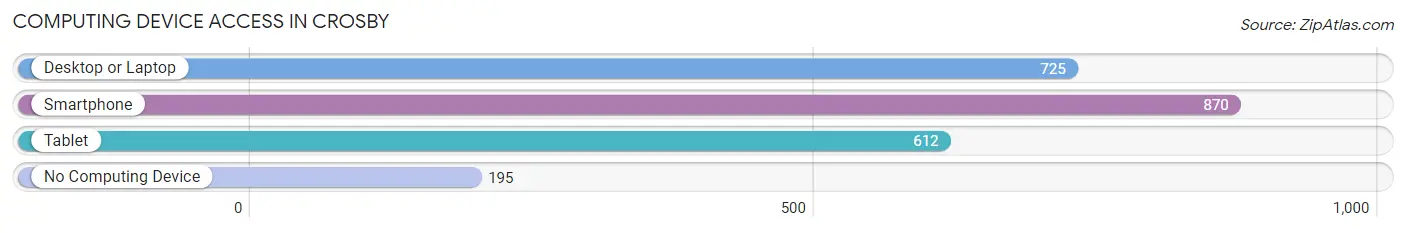
| Device Type | # Households | % Households |
| Desktop or Laptop | 725 | 59.8% |
| Smartphone | 870 | 71.8% |
| Tablet | 612 | 50.5% |
| No Computing Device | 195 | 16.1% |
| Total | 1,212 | 100.0% |
Internet Access in Crosby
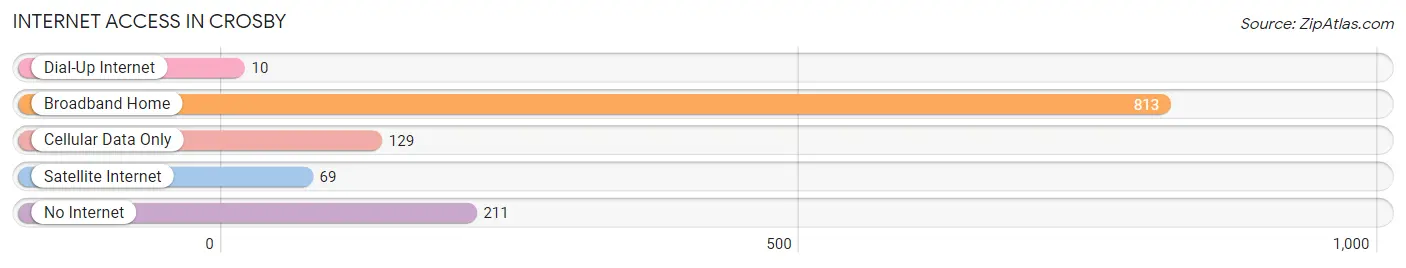
| Internet Type | # Households | % Households |
| Dial-Up Internet | 10 | 0.8% |
| Broadband Home | 813 | 67.1% |
| Cellular Data Only | 129 | 10.6% |
| Satellite Internet | 69 | 5.7% |
| No Internet | 211 | 17.4% |
| Total | 1,212 | 100.0% |
Crosby Summary
Crosby, Minnesota is a small city located in Crow Wing County in the north-central part of the state. It is situated on the banks of the Mississippi River, about 25 miles northeast of Brainerd. The city has a population of 2,743 as of the 2010 census, making it the largest city in Crow Wing County.
History
The area that is now Crosby was first settled in the late 1800s by a group of Norwegian immigrants. The city was originally known as "Crow Wing Crossing" and was later renamed after a local settler, John Crosby. The city was officially incorporated in 1891.
In the early 1900s, Crosby was a thriving logging and lumber town. The city was home to several sawmills and lumber companies, and the local economy was largely dependent on the timber industry. The city also had a thriving agricultural sector, with many farmers growing potatoes, corn, and other crops.
In the 1950s, the timber industry began to decline, and the city's economy shifted to tourism. The city is now home to several resorts and recreational areas, including the Cuyuna Country State Recreation Area, which is located just outside of town.
Geography
Crosby is located in the north-central part of Minnesota, about 25 miles northeast of Brainerd. The city is situated on the banks of the Mississippi River, and is surrounded by several lakes, including the Cuyuna Lakes, which are popular for fishing and boating. The city is also located near the Cuyuna Country State Recreation Area, which offers a variety of outdoor activities, including hiking, biking, and camping.
The city has a total area of 4.2 square miles, all of which is land. The city has a humid continental climate, with cold winters and warm summers.
Economy
The economy of Crosby is largely based on tourism and recreation. The city is home to several resorts and recreational areas, including the Cuyuna Country State Recreation Area, which is located just outside of town. The city also has a thriving agricultural sector, with many farmers growing potatoes, corn, and other crops.
The city is also home to several manufacturing companies, including a paper mill and a metal fabrication plant. The city also has a growing retail sector, with several stores and restaurants located in the downtown area.
Demographics
As of the 2010 census, the population of Crosby was 2,743. The racial makeup of the city was 97.2% White, 0.7% African American, 0.3% Native American, 0.3% Asian, 0.2% from other races, and 1.5% from two or more races. Hispanic or Latino of any race were 1.2% of the population.
The median household income in Crosby was $41,944, and the median family income was $50,938. The per capita income for the city was $20,945. About 11.2% of families and 14.2% of the population were below the poverty line, including 19.2% of those under age 18 and 8.2% of those age 65 or over.
Common Questions
What is Per Capita Income in Crosby?
Per Capita income in Crosby is $33,109.
What is the Median Family Income in Crosby?
Median Family Income in Crosby is $56,324.
What is the Median Household income in Crosby?
Median Household Income in Crosby is $42,973.
What is Income or Wage Gap in Crosby?
Income or Wage Gap in Crosby is 21.7%.
Women in Crosby earn 78.3 cents for every dollar earned by a man.
What is Family Income Deficit in Crosby?
Family Income Deficit in Crosby is $11,485.
Families that are below poverty line in Crosby earn $11,485 less on average than the poverty threshold level.
What is Inequality or Gini Index in Crosby?
Inequality or Gini Index in Crosby is 0.51.
What is the Total Population of Crosby?
Total Population of Crosby is 2,519.
What is the Total Male Population of Crosby?
Total Male Population of Crosby is 1,178.
What is the Total Female Population of Crosby?
Total Female Population of Crosby is 1,341.
What is the Ratio of Males per 100 Females in Crosby?
There are 87.84 Males per 100 Females in Crosby.
What is the Ratio of Females per 100 Males in Crosby?
There are 113.84 Females per 100 Males in Crosby.
What is the Median Population Age in Crosby?
Median Population Age in Crosby is 50.4 Years.
What is the Average Family Size in Crosby
Average Family Size in Crosby is 2.9 People.
What is the Average Household Size in Crosby
Average Household Size in Crosby is 2.0 People.
How Large is the Labor Force in Crosby?
There are 989 People in the Labor Forcein in Crosby.
What is the Percentage of People in the Labor Force in Crosby?
45.6% of People are in the Labor Force in Crosby.
What is the Unemployment Rate in Crosby?
Unemployment Rate in Crosby is 5.4%.