Cromwell, MN Map & Demographics
Cromwell Map
Cromwell Overview
$21,346
PER CAPITA INCOME
$88,250
AVG FAMILY INCOME
$49,583
AVG HOUSEHOLD INCOME
51.9%
WAGE / INCOME GAP [ % ]
48.1¢/ $1
WAGE / INCOME GAP [ $ ]
0.40
INEQUALITY / GINI INDEX
366
TOTAL POPULATION
159
MALE POPULATION
207
FEMALE POPULATION
76.81
MALES / 100 FEMALES
130.19
FEMALES / 100 MALES
34.2
MEDIAN AGE
4.3
AVG FAMILY SIZE
2.8
AVG HOUSEHOLD SIZE
99
LABOR FORCE [ PEOPLE ]
42.3%
PERCENT IN LABOR FORCE
Cromwell Zip Codes
Cromwell Area Codes
Income in Cromwell
Income Overview in Cromwell
Per Capita Income in Cromwell is $21,346, while median incomes of families and households are $88,250 and $49,583 respectively.
| Characteristic | Number | Measure |
| Per Capita Income | 366 | $21,346 |
| Median Family Income | 62 | $88,250 |
| Mean Family Income | 62 | $82,827 |
| Median Household Income | 118 | $49,583 |
| Mean Household Income | 118 | $60,161 |
| Income Deficit | 62 | $0 |
| Wage / Income Gap (%) | 366 | 51.92% |
| Wage / Income Gap ($) | 366 | 48.08¢ per $1 |
| Gini / Inequality Index | 366 | 0.40 |
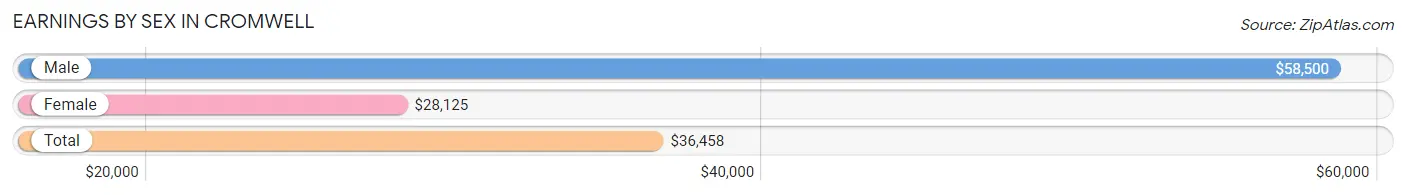
Earnings by Sex in Cromwell
Average Earnings in Cromwell are $36,458, $58,500 for men and $28,125 for women, a difference of 51.9%.
| Sex | Number | Average Earnings |
| Male | 58 (58.0%) | $58,500 |
| Female | 42 (42.0%) | $28,125 |
| Total | 100 (100.0%) | $36,458 |
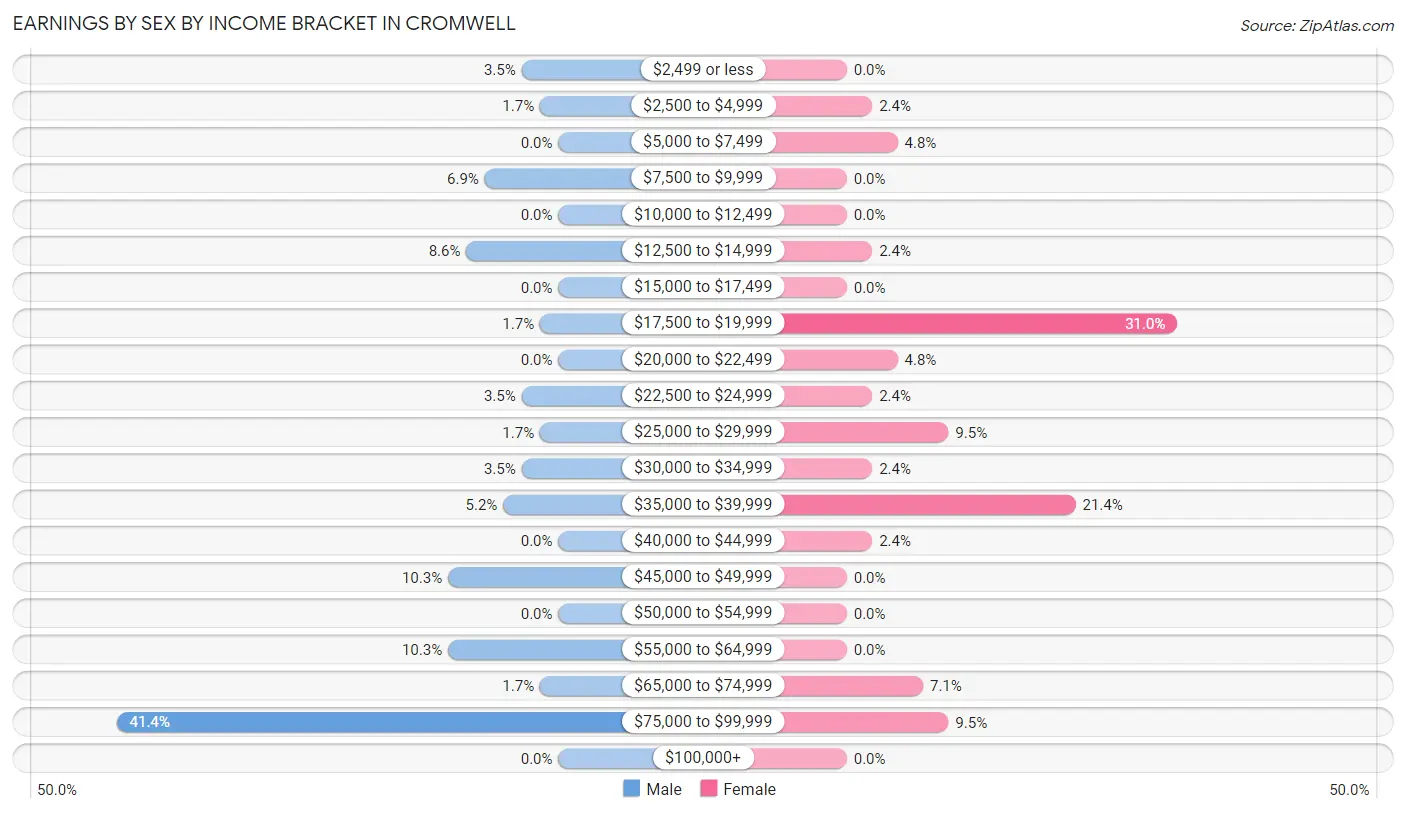
Earnings by Sex by Income Bracket in Cromwell
The most common earnings brackets in Cromwell are $75,000 to $99,999 for men (24 | 41.4%) and $17,500 to $19,999 for women (13 | 30.9%).
| Income | Male | Female |
| $2,499 or less | 2 (3.5%) | 0 (0.0%) |
| $2,500 to $4,999 | 1 (1.7%) | 1 (2.4%) |
| $5,000 to $7,499 | 0 (0.0%) | 2 (4.8%) |
| $7,500 to $9,999 | 4 (6.9%) | 0 (0.0%) |
| $10,000 to $12,499 | 0 (0.0%) | 0 (0.0%) |
| $12,500 to $14,999 | 5 (8.6%) | 1 (2.4%) |
| $15,000 to $17,499 | 0 (0.0%) | 0 (0.0%) |
| $17,500 to $19,999 | 1 (1.7%) | 13 (30.9%) |
| $20,000 to $22,499 | 0 (0.0%) | 2 (4.8%) |
| $22,500 to $24,999 | 2 (3.5%) | 1 (2.4%) |
| $25,000 to $29,999 | 1 (1.7%) | 4 (9.5%) |
| $30,000 to $34,999 | 2 (3.5%) | 1 (2.4%) |
| $35,000 to $39,999 | 3 (5.2%) | 9 (21.4%) |
| $40,000 to $44,999 | 0 (0.0%) | 1 (2.4%) |
| $45,000 to $49,999 | 6 (10.3%) | 0 (0.0%) |
| $50,000 to $54,999 | 0 (0.0%) | 0 (0.0%) |
| $55,000 to $64,999 | 6 (10.3%) | 0 (0.0%) |
| $65,000 to $74,999 | 1 (1.7%) | 3 (7.1%) |
| $75,000 to $99,999 | 24 (41.4%) | 4 (9.5%) |
| $100,000+ | 0 (0.0%) | 0 (0.0%) |
| Total | 58 (100.0%) | 42 (100.0%) |
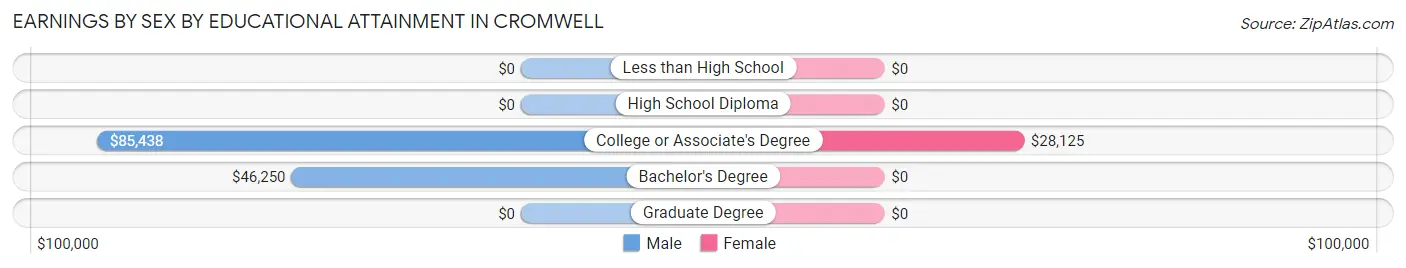
Earnings by Sex by Educational Attainment in Cromwell
Average earnings in Cromwell are $60,000 for men and $29,063 for women, a difference of 51.6%. Men with an educational attainment of college or associate's degree enjoy the highest average annual earnings of $85,438, while those with bachelor's degree education earn the least with $46,250. Women with an educational attainment of college or associate's degree earn the most with the average annual earnings of $28,125, while those with college or associate's degree education have the smallest earnings of $28,125.
| Educational Attainment | Male Income | Female Income |
| Less than High School | - | - |
| High School Diploma | - | - |
| College or Associate's Degree | $85,438 | $28,125 |
| Bachelor's Degree | $46,250 | $0 |
| Graduate Degree | - | - |
| Total | $60,000 | $29,063 |
Family Income in Cromwell
Family Income Brackets in Cromwell
According to the Cromwell family income data, there are 26 families falling into the $75,000 to $99,999 income range, which is the most common income bracket and makes up 41.9% of all families.
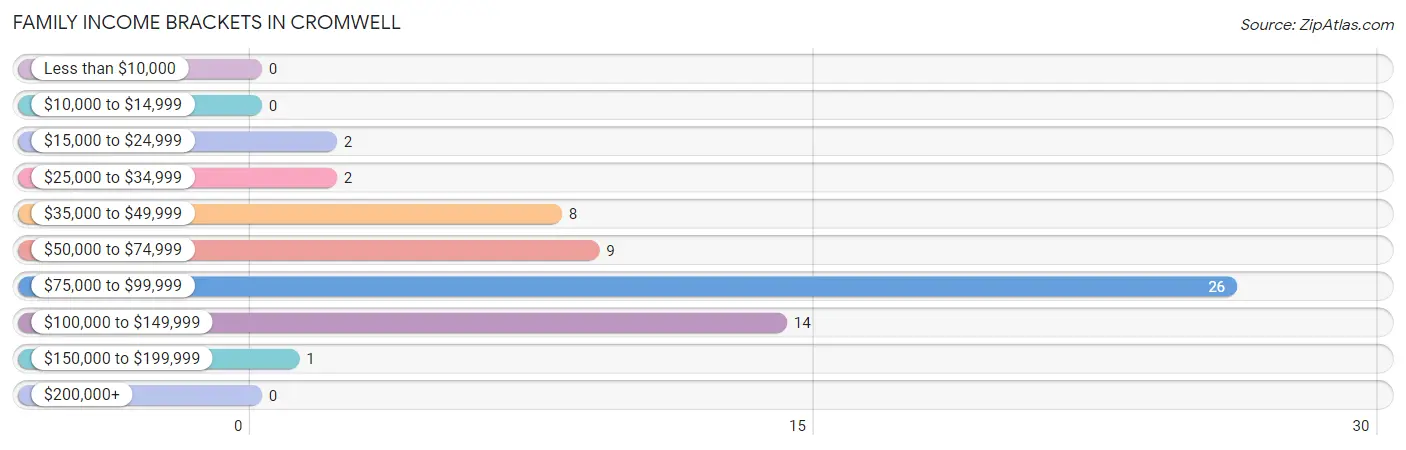
| Income Bracket | # Families | % Families |
| Less than $10,000 | 0 | 0.0% |
| $10,000 to $14,999 | 0 | 0.0% |
| $15,000 to $24,999 | 2 | 3.2% |
| $25,000 to $34,999 | 2 | 3.2% |
| $35,000 to $49,999 | 8 | 12.9% |
| $50,000 to $74,999 | 9 | 14.5% |
| $75,000 to $99,999 | 26 | 41.9% |
| $100,000 to $149,999 | 14 | 22.6% |
| $150,000 to $199,999 | 1 | 1.6% |
| $200,000+ | 0 | 0.0% |
Family Income by Famaliy Size in Cromwell
5-person families (30 | 48.4%) account for the highest median family income in Cromwell with $89,250 per family, while 2-person families (25 | 40.3%) have the highest median income of $31,406 per family member.
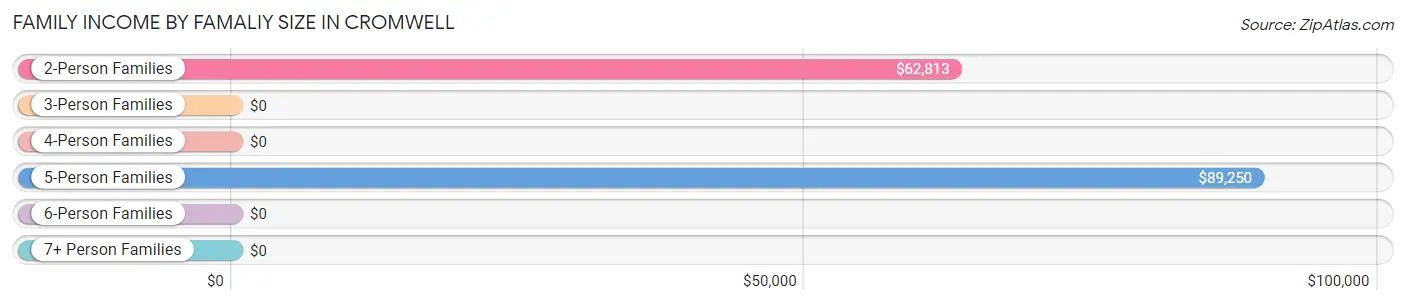
| Income Bracket | # Families | Median Income |
| 2-Person Families | 25 (40.3%) | $62,813 |
| 3-Person Families | 2 (3.2%) | $0 |
| 4-Person Families | 4 (6.5%) | $0 |
| 5-Person Families | 30 (48.4%) | $89,250 |
| 6-Person Families | 1 (1.6%) | $0 |
| 7+ Person Families | 0 (0.0%) | $0 |
| Total | 62 (100.0%) | $88,250 |
Family Income by Number of Earners in Cromwell
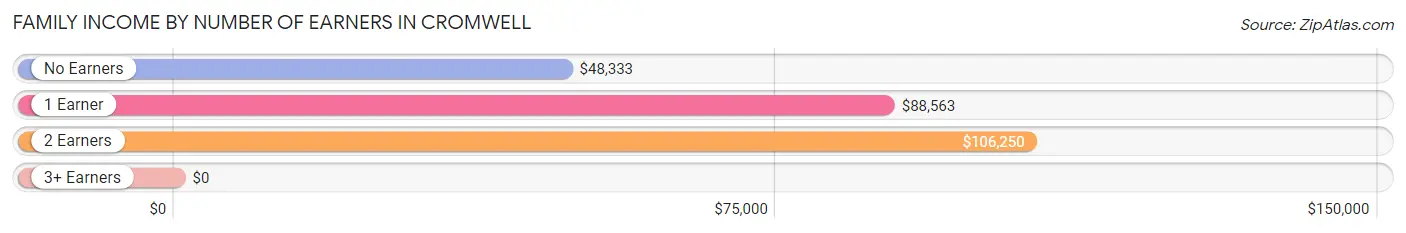
| Number of Earners | # Families | Median Income |
| No Earners | 12 (19.4%) | $48,333 |
| 1 Earner | 27 (43.5%) | $88,563 |
| 2 Earners | 13 (21.0%) | $106,250 |
| 3+ Earners | 10 (16.1%) | $0 |
| Total | 62 (100.0%) | $88,250 |
Household Income in Cromwell
Household Income Brackets in Cromwell
With 27 households falling in the category, the $75,000 to $99,999 income range is the most frequent in Cromwell, accounting for 22.9% of all households.
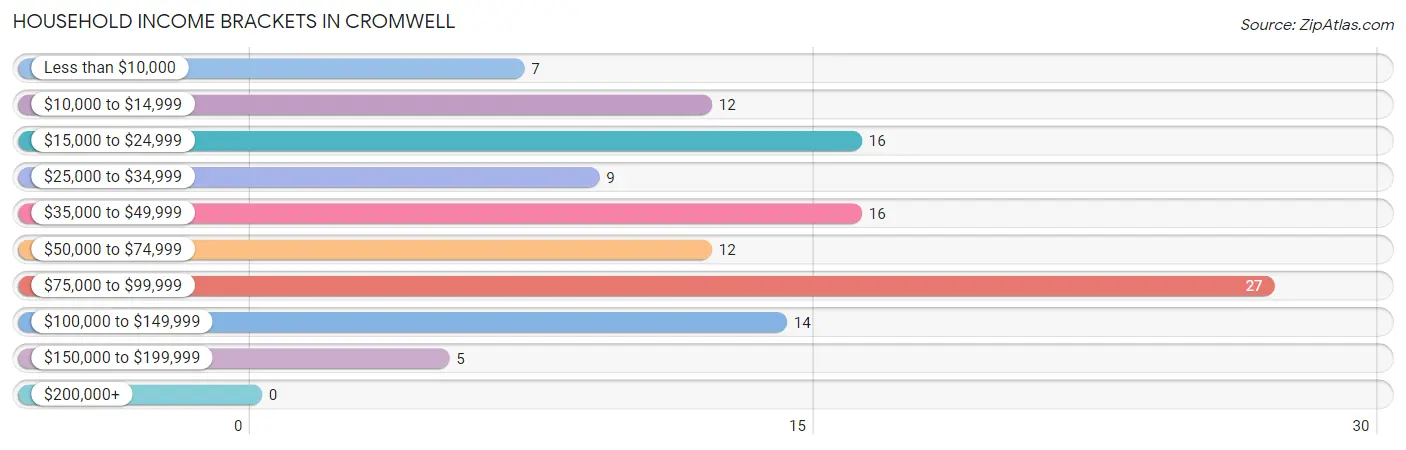
| Income Bracket | # Households | % Households |
| Less than $10,000 | 7 | 5.9% |
| $10,000 to $14,999 | 12 | 10.2% |
| $15,000 to $24,999 | 16 | 13.6% |
| $25,000 to $34,999 | 9 | 7.6% |
| $35,000 to $49,999 | 16 | 13.6% |
| $50,000 to $74,999 | 12 | 10.2% |
| $75,000 to $99,999 | 27 | 22.9% |
| $100,000 to $149,999 | 14 | 11.9% |
| $150,000 to $199,999 | 5 | 4.2% |
| $200,000+ | 0 | 0.0% |
Household Income by Householder Age in Cromwell
The median household income in Cromwell is $49,583, with the highest median household income of $88,250 found in the 25 to 44 years age bracket for the primary householder. A total of 48 households (40.7%) fall into this category. Meanwhile, the 15 to 24 years age bracket for the primary householder has the lowest median household income of $0, with 2 households (1.7%) in this group.
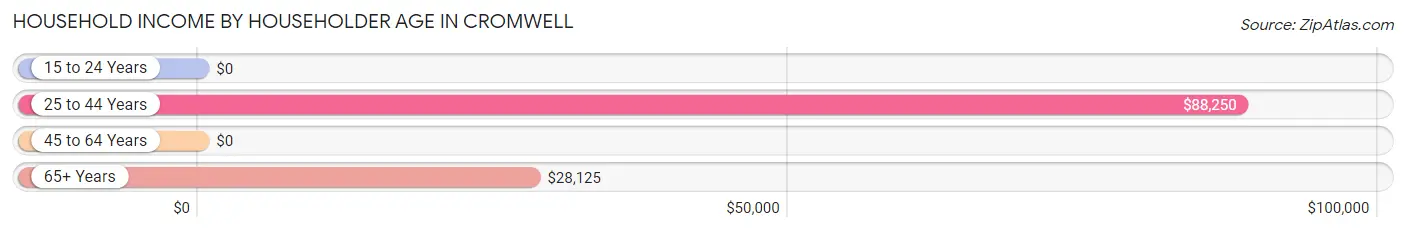
| Income Bracket | # Households | Median Income |
| 15 to 24 Years | 2 (1.7%) | $0 |
| 25 to 44 Years | 48 (40.7%) | $88,250 |
| 45 to 64 Years | 24 (20.3%) | $0 |
| 65+ Years | 44 (37.3%) | $28,125 |
| Total | 118 (100.0%) | $49,583 |
Poverty in Cromwell
Income Below Poverty by Sex and Age in Cromwell
With 7.1% poverty level for males and 4.6% for females among the residents of Cromwell, 75 year old and over males and 18 to 24 year old females are the most vulnerable to poverty, with 4 males (26.7%) and 2 females (66.7%) in their respective age groups living below the poverty level.
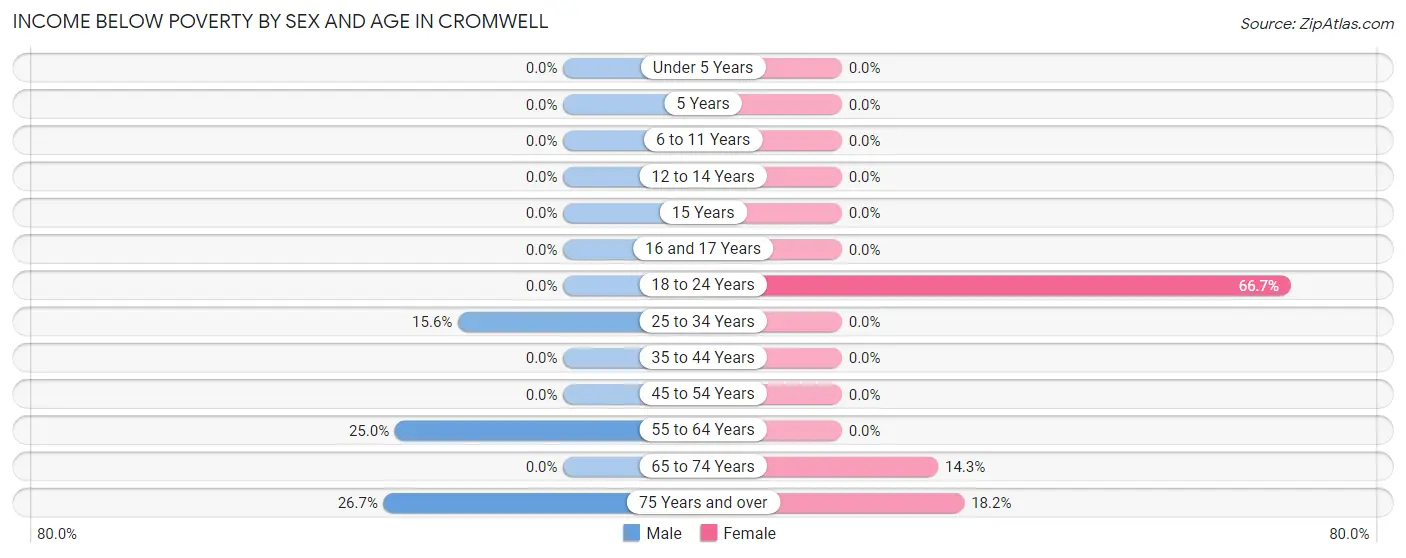
| Age Bracket | Male | Female |
| Under 5 Years | 0 (0.0%) | 0 (0.0%) |
| 5 Years | 0 (0.0%) | 0 (0.0%) |
| 6 to 11 Years | 0 (0.0%) | 0 (0.0%) |
| 12 to 14 Years | 0 (0.0%) | 0 (0.0%) |
| 15 Years | 0 (0.0%) | 0 (0.0%) |
| 16 and 17 Years | 0 (0.0%) | 0 (0.0%) |
| 18 to 24 Years | 0 (0.0%) | 2 (66.7%) |
| 25 to 34 Years | 5 (15.6%) | 0 (0.0%) |
| 35 to 44 Years | 0 (0.0%) | 0 (0.0%) |
| 45 to 54 Years | 0 (0.0%) | 0 (0.0%) |
| 55 to 64 Years | 2 (25.0%) | 0 (0.0%) |
| 65 to 74 Years | 0 (0.0%) | 2 (14.3%) |
| 75 Years and over | 4 (26.7%) | 4 (18.2%) |
| Total | 11 (7.1%) | 8 (4.6%) |
Income Above Poverty by Sex and Age in Cromwell
According to the poverty statistics in Cromwell, males aged under 5 years and females aged under 5 years are the age groups that are most secure financially, with 100.0% of males and 100.0% of females in these age groups living above the poverty line.
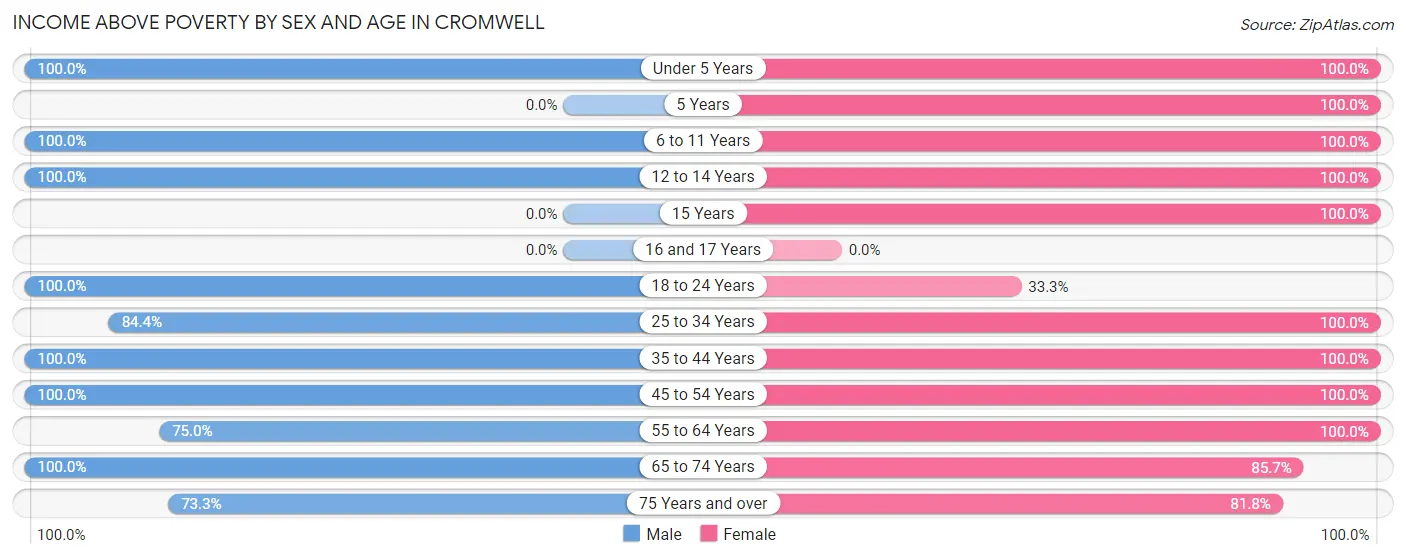
| Age Bracket | Male | Female |
| Under 5 Years | 67 (100.0%) | 39 (100.0%) |
| 5 Years | 0 (0.0%) | 2 (100.0%) |
| 6 to 11 Years | 4 (100.0%) | 4 (100.0%) |
| 12 to 14 Years | 1 (100.0%) | 1 (100.0%) |
| 15 Years | 0 (0.0%) | 14 (100.0%) |
| 16 and 17 Years | 0 (0.0%) | 0 (0.0%) |
| 18 to 24 Years | 6 (100.0%) | 1 (33.3%) |
| 25 to 34 Years | 27 (84.4%) | 26 (100.0%) |
| 35 to 44 Years | 4 (100.0%) | 13 (100.0%) |
| 45 to 54 Years | 9 (100.0%) | 25 (100.0%) |
| 55 to 64 Years | 6 (75.0%) | 9 (100.0%) |
| 65 to 74 Years | 9 (100.0%) | 12 (85.7%) |
| 75 Years and over | 11 (73.3%) | 18 (81.8%) |
| Total | 144 (92.9%) | 164 (95.4%) |
Income Below Poverty Among Married-Couple Families in Cromwell
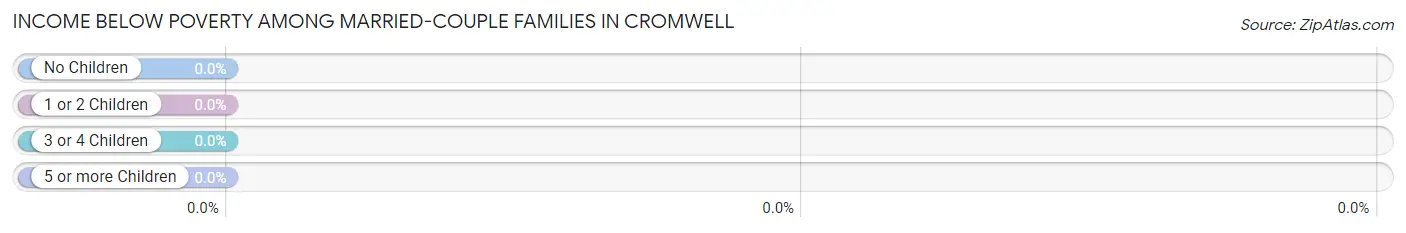
| Children | Above Poverty | Below Poverty |
| No Children | 23 (100.0%) | 0 (0.0%) |
| 1 or 2 Children | 4 (100.0%) | 0 (0.0%) |
| 3 or 4 Children | 23 (100.0%) | 0 (0.0%) |
| 5 or more Children | 0 (0.0%) | 0 (0.0%) |
| Total | 50 (100.0%) | 0 (0.0%) |
Income Below Poverty Among Single-Parent Households in Cromwell
| Children | Single Father | Single Mother |
| No Children | 0 (0.0%) | 0 (0.0%) |
| 1 or 2 Children | 0 (0.0%) | 0 (0.0%) |
| 3 or 4 Children | 0 (0.0%) | 0 (0.0%) |
| 5 or more Children | 0 (0.0%) | 0 (0.0%) |
| Total | 0 (0.0%) | 0 (0.0%) |
Income Below Poverty Among Married-Couple vs Single-Parent Households in Cromwell
| Children | Married-Couple Families | Single-Parent Households |
| No Children | 0 (0.0%) | 0 (0.0%) |
| 1 or 2 Children | 0 (0.0%) | 0 (0.0%) |
| 3 or 4 Children | 0 (0.0%) | 0 (0.0%) |
| 5 or more Children | 0 (0.0%) | 0 (0.0%) |
| Total | 0 (0.0%) | 0 (0.0%) |
Race in Cromwell
The most populous races in Cromwell are White / Caucasian (357 | 97.5%), Two or more Races (5 | 1.4%), and Black / African American (4 | 1.1%).
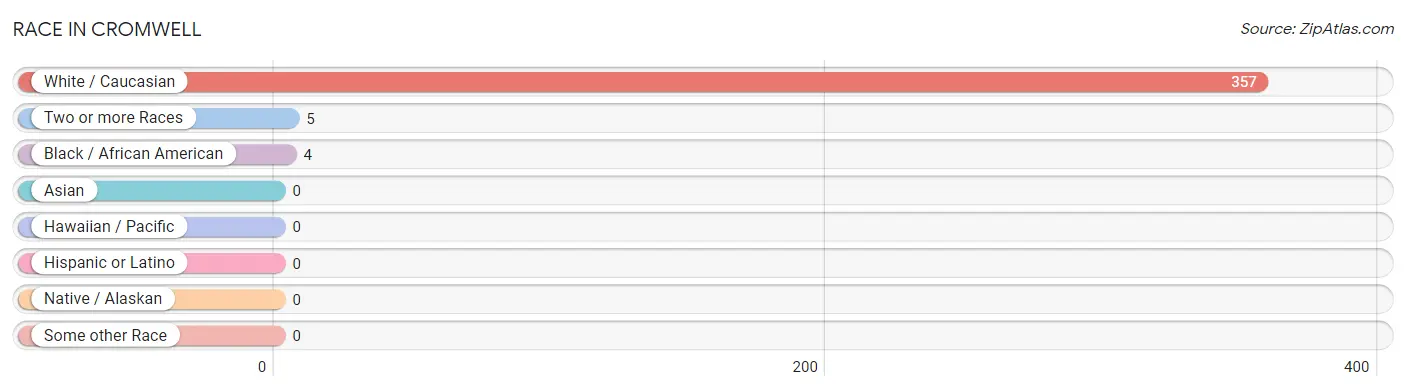
| Race | # Population | % Population |
| Asian | 0 | 0.0% |
| Black / African American | 4 | 1.1% |
| Hawaiian / Pacific | 0 | 0.0% |
| Hispanic or Latino | 0 | 0.0% |
| Native / Alaskan | 0 | 0.0% |
| White / Caucasian | 357 | 97.5% |
| Two or more Races | 5 | 1.4% |
| Some other Race | 0 | 0.0% |
| Total | 366 | 100.0% |
Ancestry in Cromwell
The most populous ancestries reported in Cromwell are Swedish (136 | 37.2%), German (115 | 31.4%), Finnish (85 | 23.2%), Iranian (52 | 14.2%), and Norwegian (46 | 12.6%), together accounting for 118.6% of all Cromwell residents.
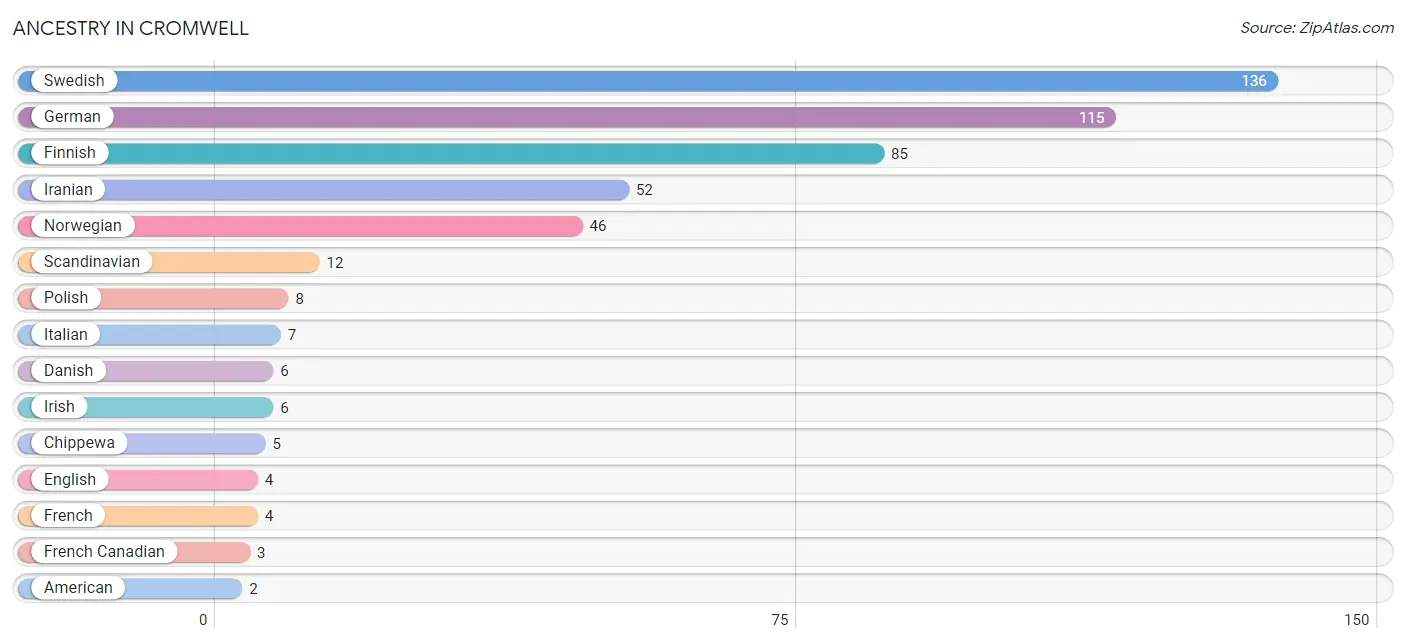
| Ancestry | # Population | % Population |
| American | 2 | 0.5% |
| British | 1 | 0.3% |
| Chippewa | 5 | 1.4% |
| Croatian | 1 | 0.3% |
| Danish | 6 | 1.6% |
| Dutch | 2 | 0.5% |
| English | 4 | 1.1% |
| European | 2 | 0.5% |
| Finnish | 85 | 23.2% |
| French | 4 | 1.1% |
| French Canadian | 3 | 0.8% |
| German | 115 | 31.4% |
| Iranian | 52 | 14.2% |
| Irish | 6 | 1.6% |
| Italian | 7 | 1.9% |
| Norwegian | 46 | 12.6% |
| Polish | 8 | 2.2% |
| Russian | 1 | 0.3% |
| Scandinavian | 12 | 3.3% |
| Scotch-Irish | 1 | 0.3% |
| Swedish | 136 | 37.2% | View All 21 Rows |
Immigrants in Cromwell
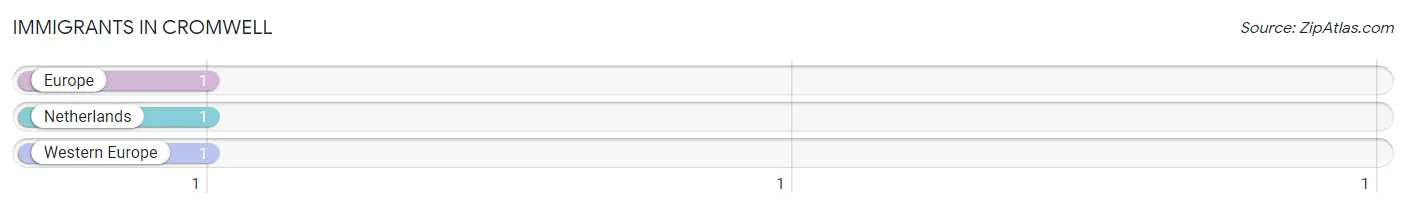
The most numerous immigrant groups reported in Cromwell came from Europe (1 | 0.3%), Netherlands (1 | 0.3%), and Western Europe (1 | 0.3%), together accounting for 0.8% of all Cromwell residents.
| Immigration Origin | # Population | % Population |
| Europe | 1 | 0.3% |
| Netherlands | 1 | 0.3% |
| Western Europe | 1 | 0.3% | View All 3 Rows |
Sex and Age in Cromwell
Sex and Age in Cromwell
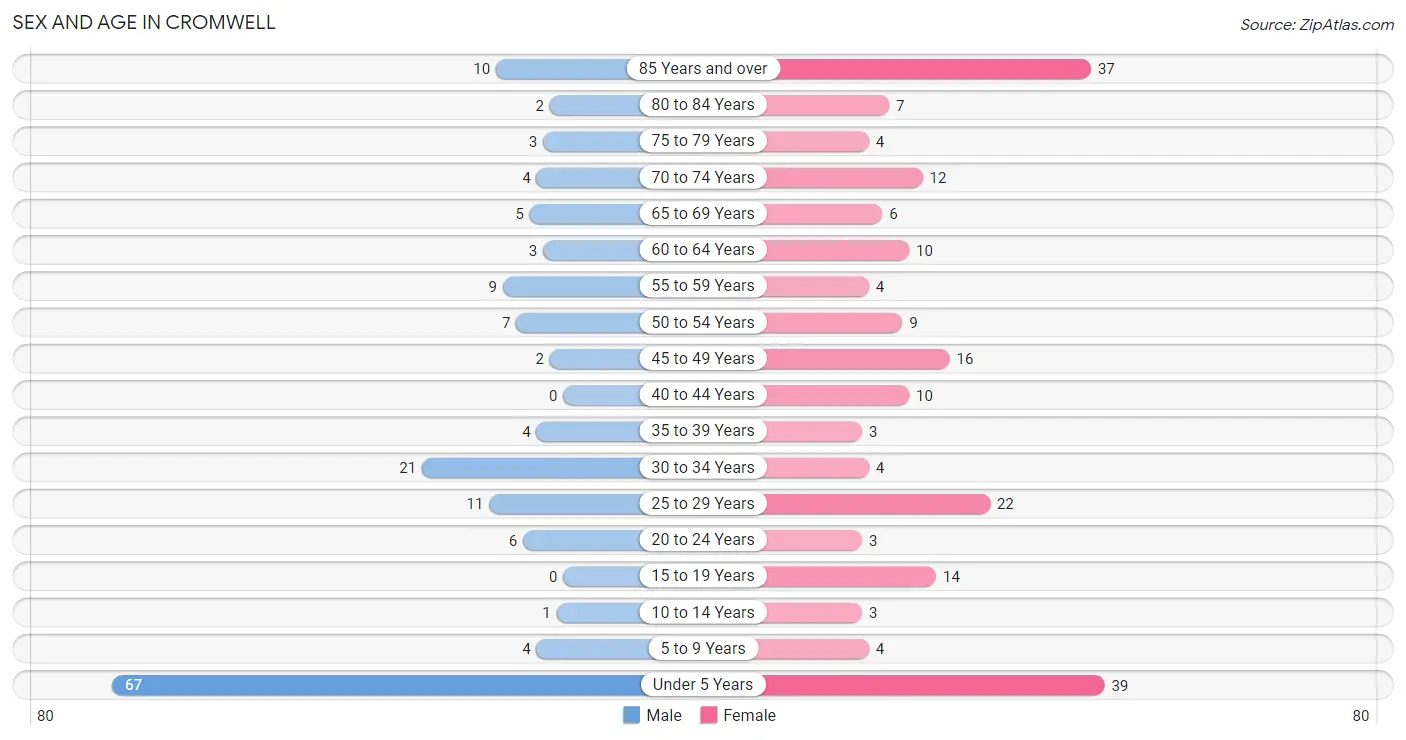
The most populous age groups in Cromwell are Under 5 Years (67 | 42.1%) for men and Under 5 Years (39 | 18.8%) for women.
| Age Bracket | Male | Female |
| Under 5 Years | 67 (42.1%) | 39 (18.8%) |
| 5 to 9 Years | 4 (2.5%) | 4 (1.9%) |
| 10 to 14 Years | 1 (0.6%) | 3 (1.5%) |
| 15 to 19 Years | 0 (0.0%) | 14 (6.8%) |
| 20 to 24 Years | 6 (3.8%) | 3 (1.5%) |
| 25 to 29 Years | 11 (6.9%) | 22 (10.6%) |
| 30 to 34 Years | 21 (13.2%) | 4 (1.9%) |
| 35 to 39 Years | 4 (2.5%) | 3 (1.5%) |
| 40 to 44 Years | 0 (0.0%) | 10 (4.8%) |
| 45 to 49 Years | 2 (1.3%) | 16 (7.7%) |
| 50 to 54 Years | 7 (4.4%) | 9 (4.3%) |
| 55 to 59 Years | 9 (5.7%) | 4 (1.9%) |
| 60 to 64 Years | 3 (1.9%) | 10 (4.8%) |
| 65 to 69 Years | 5 (3.1%) | 6 (2.9%) |
| 70 to 74 Years | 4 (2.5%) | 12 (5.8%) |
| 75 to 79 Years | 3 (1.9%) | 4 (1.9%) |
| 80 to 84 Years | 2 (1.3%) | 7 (3.4%) |
| 85 Years and over | 10 (6.3%) | 37 (17.9%) |
| Total | 159 (100.0%) | 207 (100.0%) |
Families and Households in Cromwell
Median Family Size in Cromwell
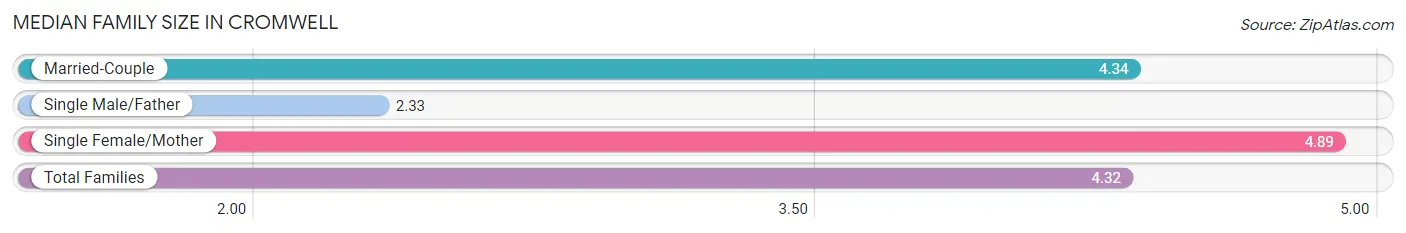
The median family size in Cromwell is 4.32 persons per family, with single female/mother families (9 | 14.5%) accounting for the largest median family size of 4.89 persons per family. On the other hand, single male/father families (3 | 4.8%) represent the smallest median family size with 2.33 persons per family.
| Family Type | # Families | Family Size |
| Married-Couple | 50 (80.6%) | 4.34 |
| Single Male/Father | 3 (4.8%) | 2.33 |
| Single Female/Mother | 9 (14.5%) | 4.89 |
| Total Families | 62 (100.0%) | 4.32 |
Median Household Size in Cromwell
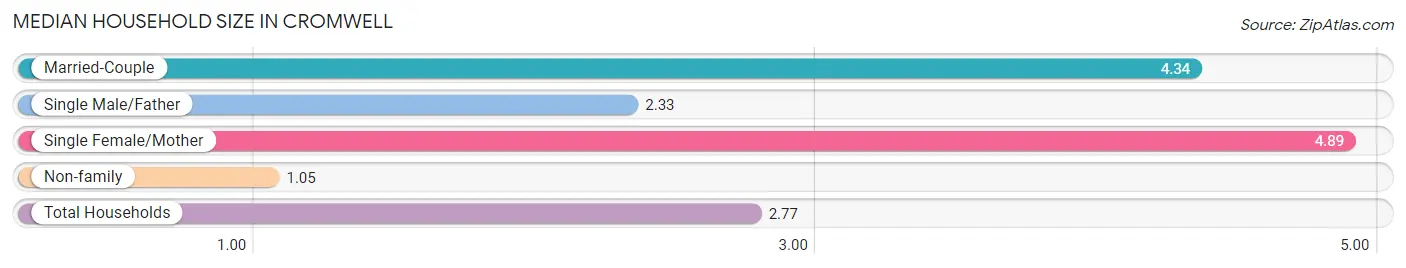
The median household size in Cromwell is 2.77 persons per household, with single female/mother households (9 | 7.6%) accounting for the largest median household size of 4.89 persons per household. non-family households (56 | 47.5%) represent the smallest median household size with 1.05 persons per household.
| Household Type | # Households | Household Size |
| Married-Couple | 50 (42.4%) | 4.34 |
| Single Male/Father | 3 (2.5%) | 2.33 |
| Single Female/Mother | 9 (7.6%) | 4.89 |
| Non-family | 56 (47.5%) | 1.05 |
| Total Households | 118 (100.0%) | 2.77 |
Household Size by Marriage Status in Cromwell
Out of a total of 118 households in Cromwell, 62 (52.5%) are family households, while 56 (47.5%) are nonfamily households. The most numerous type of family households are 5-person households, comprising 30, and the most common type of nonfamily households are 1-person households, comprising 52.
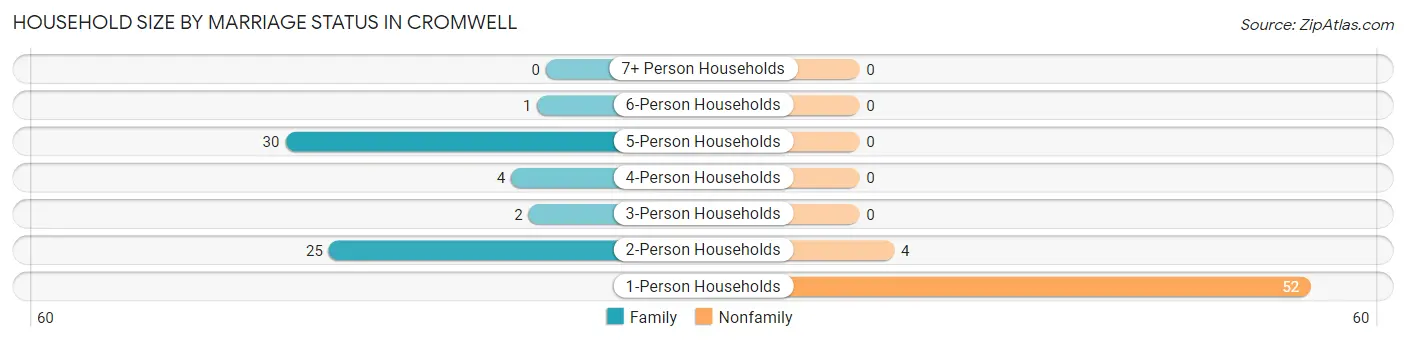
| Household Size | Family Households | Nonfamily Households |
| 1-Person Households | - | 52 (44.1%) |
| 2-Person Households | 25 (21.2%) | 4 (3.4%) |
| 3-Person Households | 2 (1.7%) | 0 (0.0%) |
| 4-Person Households | 4 (3.4%) | 0 (0.0%) |
| 5-Person Households | 30 (25.4%) | 0 (0.0%) |
| 6-Person Households | 1 (0.9%) | 0 (0.0%) |
| 7+ Person Households | 0 (0.0%) | 0 (0.0%) |
| Total | 62 (52.5%) | 56 (47.5%) |
Female Fertility in Cromwell
Fertility by Age in Cromwell
Average fertility rate in Cromwell is 26.0 births per 1,000 women. Women in the age bracket of 20 to 34 years have the highest fertility rate with 69.0 births per 1,000 women. Women in the age bracket of 20 to 34 years acount for 100.0% of all women with births.
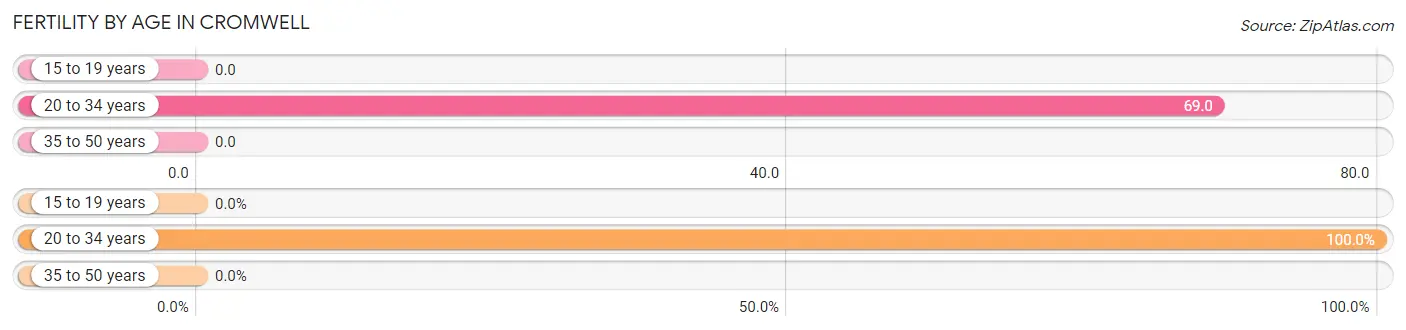
| Age Bracket | Women with Births | Births / 1,000 Women |
| 15 to 19 years | 0 (0.0%) | 0.0 |
| 20 to 34 years | 2 (100.0%) | 69.0 |
| 35 to 50 years | 0 (0.0%) | 0.0 |
| Total | 2 (100.0%) | 26.0 |
Fertility by Age by Marriage Status in Cromwell
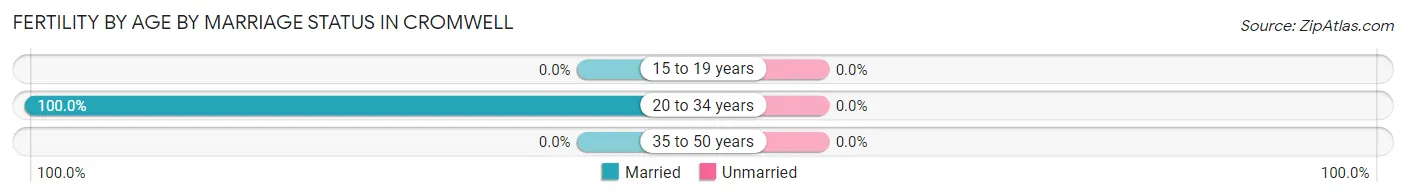
| Age Bracket | Married | Unmarried |
| 15 to 19 years | 0 (0.0%) | 0 (0.0%) |
| 20 to 34 years | 2 (100.0%) | 0 (0.0%) |
| 35 to 50 years | 0 (0.0%) | 0 (0.0%) |
| Total | 2 (100.0%) | 0 (0.0%) |
Fertility by Education in Cromwell
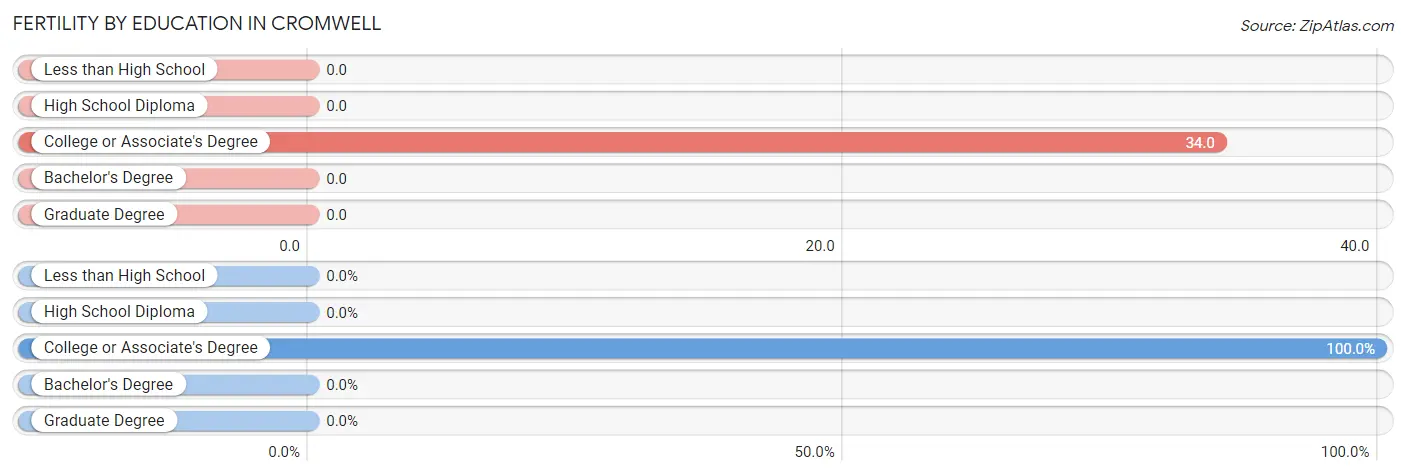
| Educational Attainment | Women with Births | Births / 1,000 Women |
| Less than High School | 0 (0.0%) | 0.0 |
| High School Diploma | 0 (0.0%) | 0.0 |
| College or Associate's Degree | 2 (100.0%) | 34.0 |
| Bachelor's Degree | 0 (0.0%) | 0.0 |
| Graduate Degree | 0 (0.0%) | 0.0 |
| Total | 2 (100.0%) | 26.0 |
Fertility by Education by Marriage Status in Cromwell
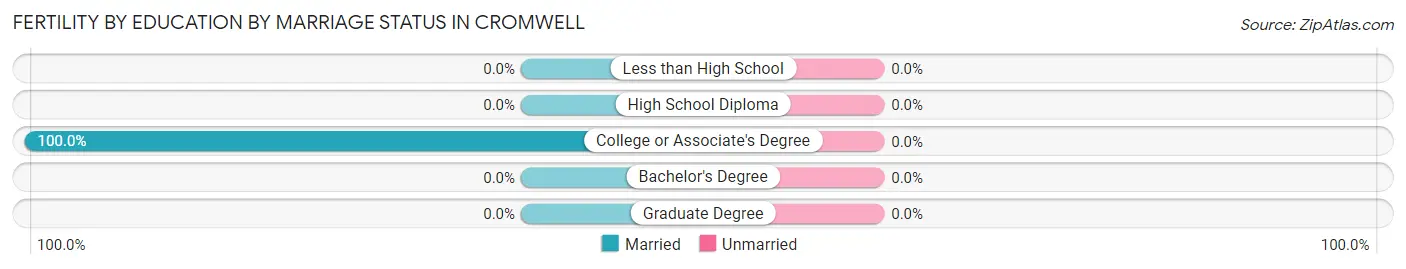
| Educational Attainment | Married | Unmarried |
| Less than High School | 0 (0.0%) | 0 (0.0%) |
| High School Diploma | 0 (0.0%) | 0 (0.0%) |
| College or Associate's Degree | 2 (100.0%) | 0 (0.0%) |
| Bachelor's Degree | 0 (0.0%) | 0 (0.0%) |
| Graduate Degree | 0 (0.0%) | 0 (0.0%) |
| Total | 2 (100.0%) | 0 (0.0%) |
Employment Characteristics in Cromwell
Employment by Class of Employer in Cromwell
Among the 97 employed individuals in Cromwell, private company employees (58 | 59.8%), local government employees (26 | 26.8%), and not-for-profit organizations (9 | 9.3%) make up the most common classes of employment.
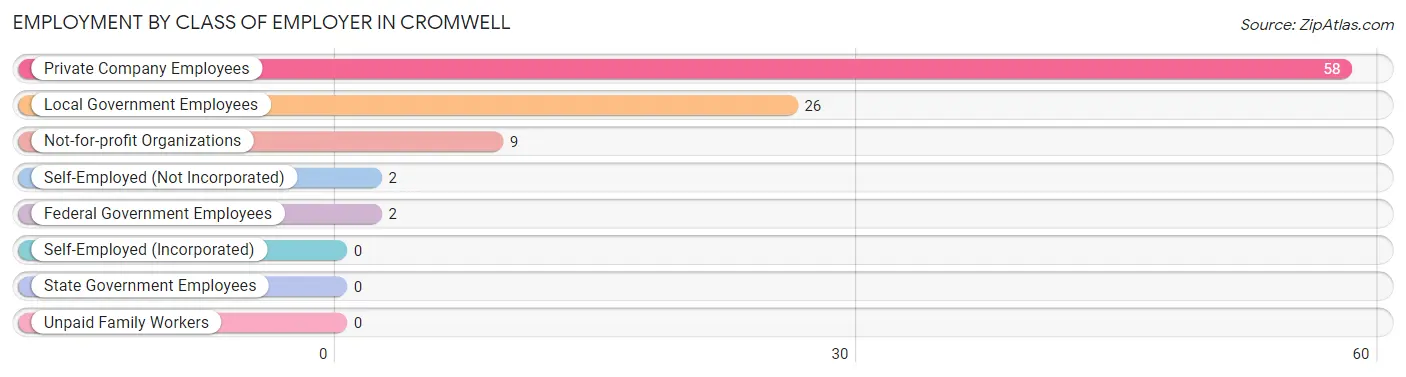
| Employer Class | # Employees | % Employees |
| Private Company Employees | 58 | 59.8% |
| Self-Employed (Incorporated) | 0 | 0.0% |
| Self-Employed (Not Incorporated) | 2 | 2.1% |
| Not-for-profit Organizations | 9 | 9.3% |
| Local Government Employees | 26 | 26.8% |
| State Government Employees | 0 | 0.0% |
| Federal Government Employees | 2 | 2.1% |
| Unpaid Family Workers | 0 | 0.0% |
| Total | 97 | 100.0% |
Employment Status by Age in Cromwell
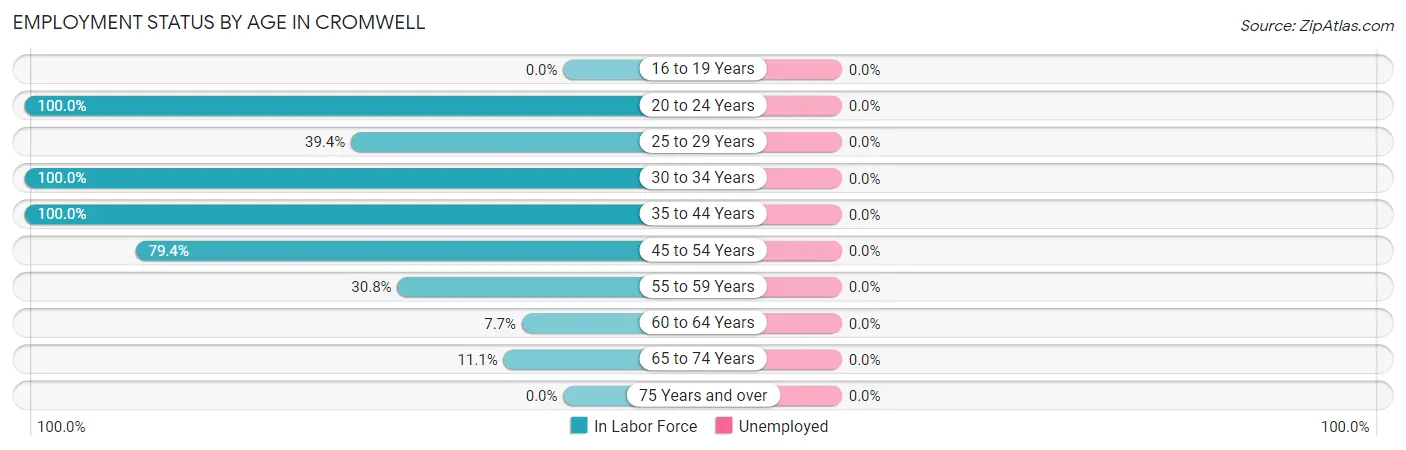
| Age Bracket | In Labor Force | Unemployed |
| 16 to 19 Years | 0 (0.0%) | 0 (0.0%) |
| 20 to 24 Years | 9 (100.0%) | 0 (0.0%) |
| 25 to 29 Years | 13 (39.4%) | 0 (0.0%) |
| 30 to 34 Years | 25 (100.0%) | 0 (0.0%) |
| 35 to 44 Years | 17 (100.0%) | 0 (0.0%) |
| 45 to 54 Years | 27 (79.4%) | 0 (0.0%) |
| 55 to 59 Years | 4 (30.8%) | 0 (0.0%) |
| 60 to 64 Years | 1 (7.7%) | 0 (0.0%) |
| 65 to 74 Years | 3 (11.1%) | 0 (0.0%) |
| 75 Years and over | 0 (0.0%) | 0 (0.0%) |
| Total | 99 (42.3%) | 0 (0.0%) |
Employment Status by Educational Attainment in Cromwell
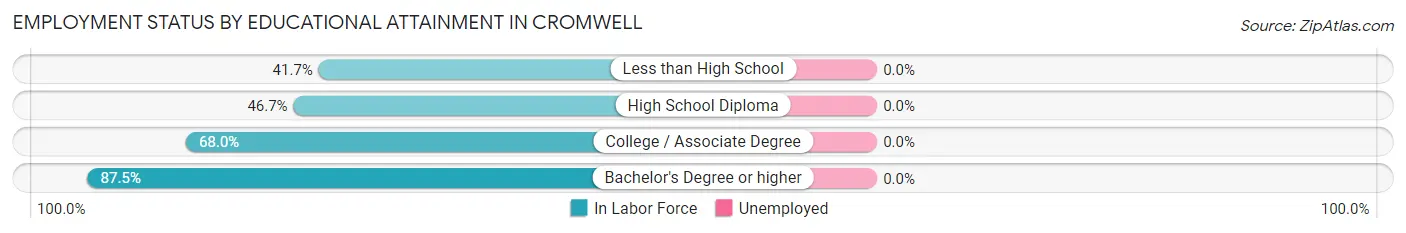
| Educational Attainment | In Labor Force | Unemployed |
| Less than High School | 5 (41.7%) | 0 (0.0%) |
| High School Diploma | 7 (46.7%) | 0 (0.0%) |
| College / Associate Degree | 68 (68.0%) | 0 (0.0%) |
| Bachelor's Degree or higher | 7 (87.5%) | 0 (0.0%) |
| Total | 87 (64.4%) | 0 (0.0%) |
Employment Occupations by Sex in Cromwell
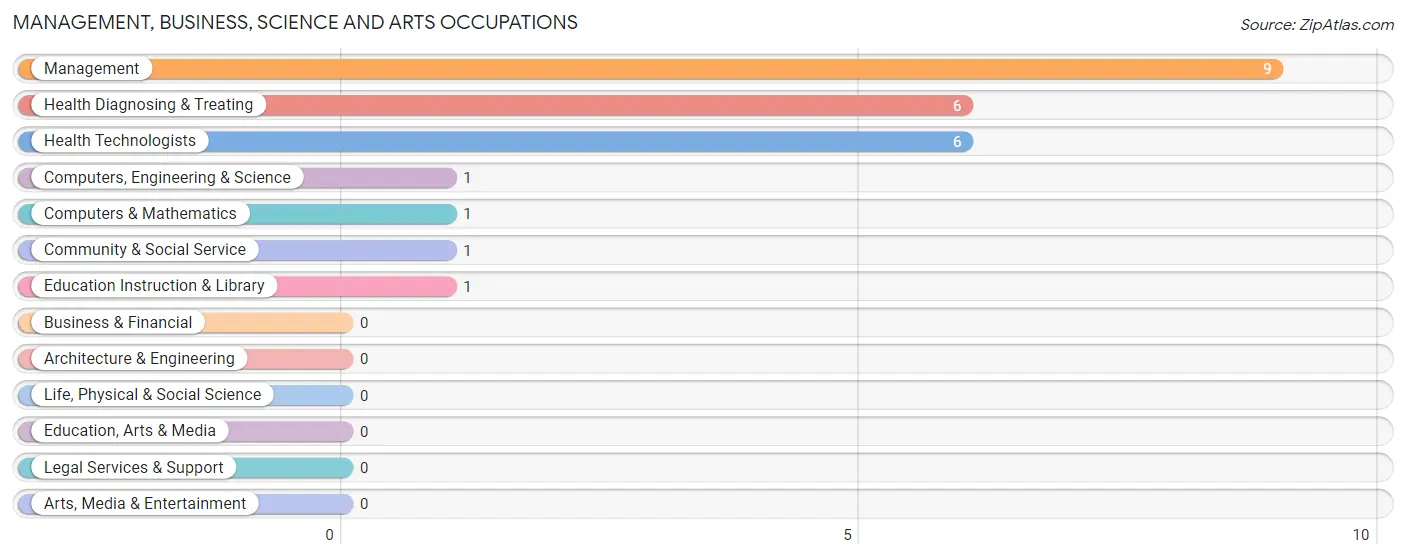
Management, Business, Science and Arts Occupations
The most common Management, Business, Science and Arts occupations in Cromwell are Management (9 | 9.1%), Health Diagnosing & Treating (6 | 6.1%), Health Technologists (6 | 6.1%), Computers, Engineering & Science (1 | 1.0%), and Computers & Mathematics (1 | 1.0%).
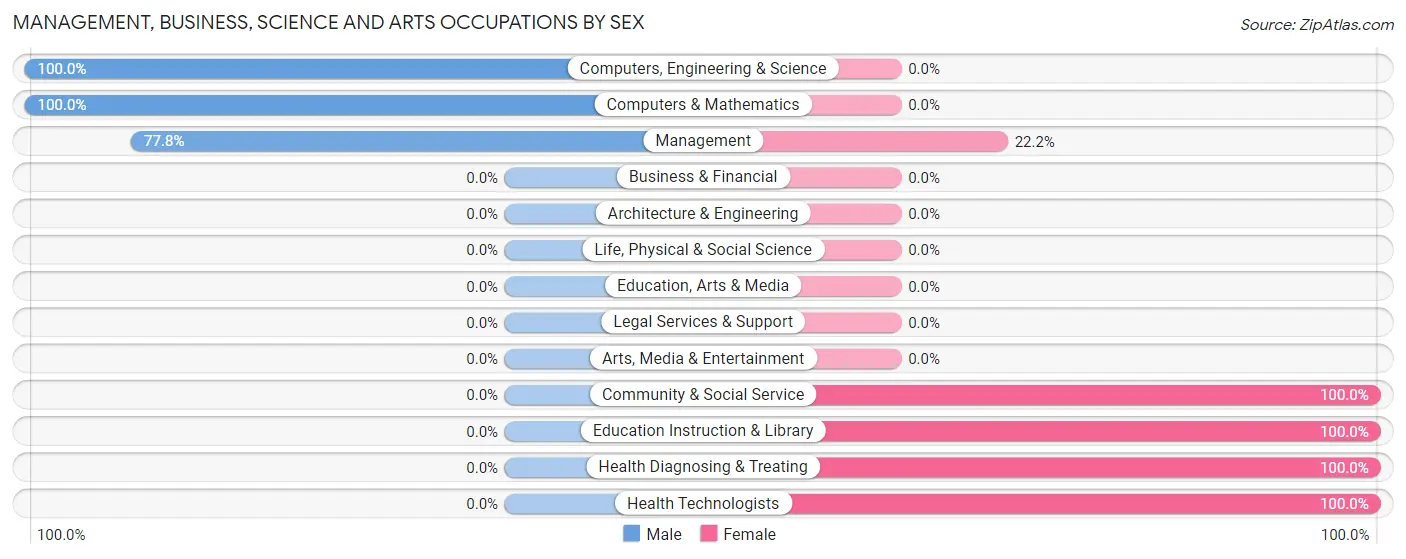
Management, Business, Science and Arts Occupations by Sex
Within the Management, Business, Science and Arts occupations in Cromwell, the most male-oriented occupations are Computers, Engineering & Science (100.0%), Computers & Mathematics (100.0%), and Management (77.8%), while the most female-oriented occupations are Community & Social Service (100.0%), Education Instruction & Library (100.0%), and Health Diagnosing & Treating (100.0%).
| Occupation | Male | Female |
| Management | 7 (77.8%) | 2 (22.2%) |
| Business & Financial | 0 (0.0%) | 0 (0.0%) |
| Computers, Engineering & Science | 1 (100.0%) | 0 (0.0%) |
| Computers & Mathematics | 1 (100.0%) | 0 (0.0%) |
| Architecture & Engineering | 0 (0.0%) | 0 (0.0%) |
| Life, Physical & Social Science | 0 (0.0%) | 0 (0.0%) |
| Community & Social Service | 0 (0.0%) | 1 (100.0%) |
| Education, Arts & Media | 0 (0.0%) | 0 (0.0%) |
| Legal Services & Support | 0 (0.0%) | 0 (0.0%) |
| Education Instruction & Library | 0 (0.0%) | 1 (100.0%) |
| Arts, Media & Entertainment | 0 (0.0%) | 0 (0.0%) |
| Health Diagnosing & Treating | 0 (0.0%) | 6 (100.0%) |
| Health Technologists | 0 (0.0%) | 6 (100.0%) |
| Total (Category) | 8 (47.1%) | 9 (52.9%) |
| Total (Overall) | 57 (57.6%) | 42 (42.4%) |
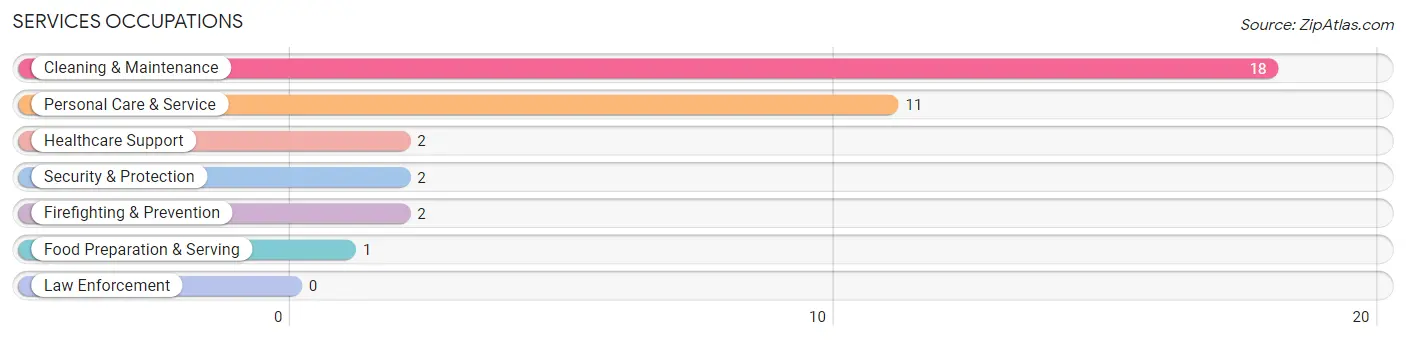
Services Occupations
The most common Services occupations in Cromwell are Cleaning & Maintenance (18 | 18.2%), Personal Care & Service (11 | 11.1%), Healthcare Support (2 | 2.0%), Security & Protection (2 | 2.0%), and Firefighting & Prevention (2 | 2.0%).
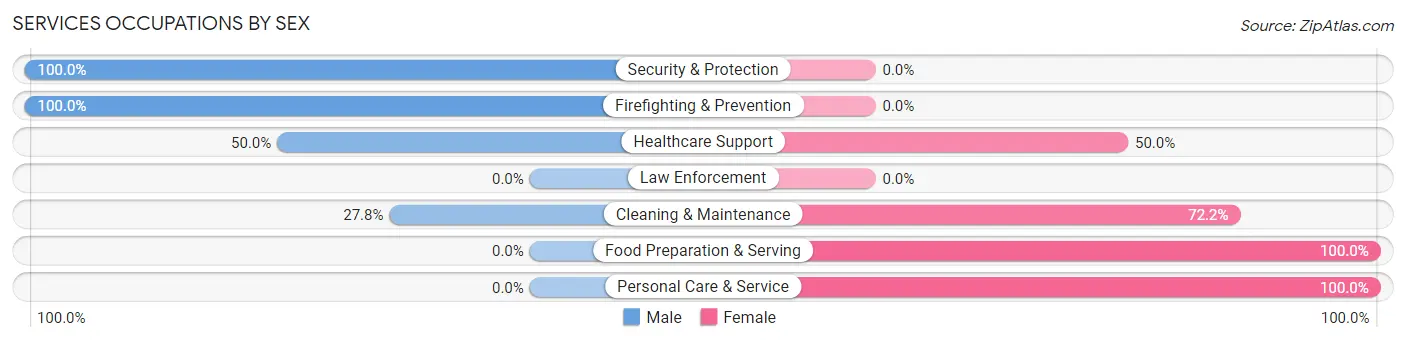
Services Occupations by Sex
Within the Services occupations in Cromwell, the most male-oriented occupations are Security & Protection (100.0%), Firefighting & Prevention (100.0%), and Healthcare Support (50.0%), while the most female-oriented occupations are Food Preparation & Serving (100.0%), Personal Care & Service (100.0%), and Cleaning & Maintenance (72.2%).
| Occupation | Male | Female |
| Healthcare Support | 1 (50.0%) | 1 (50.0%) |
| Security & Protection | 2 (100.0%) | 0 (0.0%) |
| Firefighting & Prevention | 2 (100.0%) | 0 (0.0%) |
| Law Enforcement | 0 (0.0%) | 0 (0.0%) |
| Food Preparation & Serving | 0 (0.0%) | 1 (100.0%) |
| Cleaning & Maintenance | 5 (27.8%) | 13 (72.2%) |
| Personal Care & Service | 0 (0.0%) | 11 (100.0%) |
| Total (Category) | 8 (23.5%) | 26 (76.5%) |
| Total (Overall) | 57 (57.6%) | 42 (42.4%) |
Sales and Office Occupations
The most common Sales and Office occupations in Cromwell are Sales & Related (6 | 6.1%), and Office & Administration (3 | 3.0%).
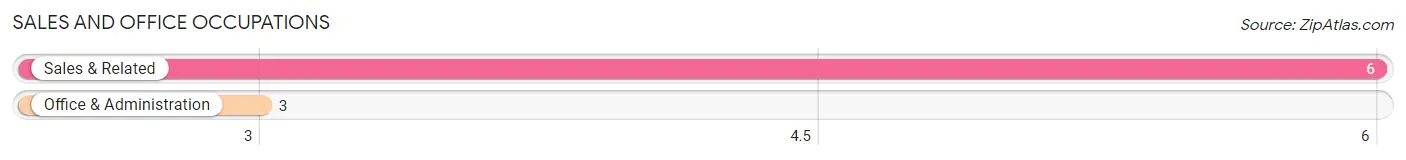
Sales and Office Occupations by Sex

| Occupation | Male | Female |
| Sales & Related | 4 (66.7%) | 2 (33.3%) |
| Office & Administration | 0 (0.0%) | 3 (100.0%) |
| Total (Category) | 4 (44.4%) | 5 (55.6%) |
| Total (Overall) | 57 (57.6%) | 42 (42.4%) |
Natural Resources, Construction and Maintenance Occupations
The most common Natural Resources, Construction and Maintenance occupations in Cromwell are Construction & Extraction (22 | 22.2%), Farming, Fishing & Forestry (2 | 2.0%), and Installation, Maintenance & Repair (2 | 2.0%).
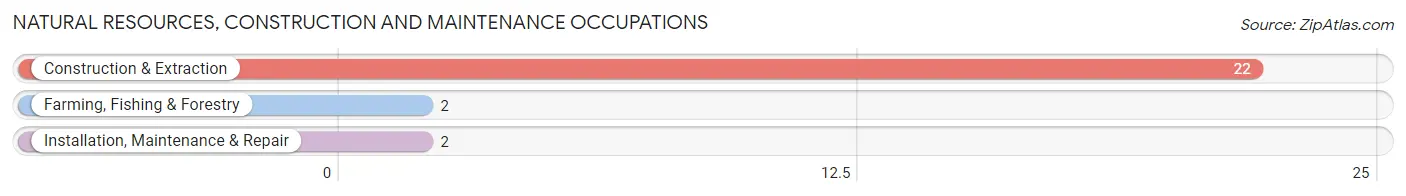
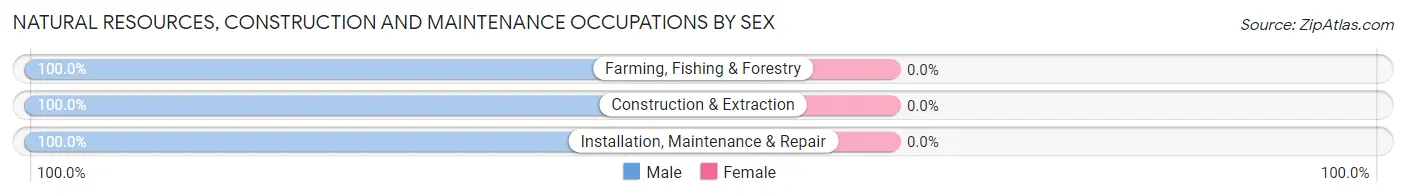
Natural Resources, Construction and Maintenance Occupations by Sex
| Occupation | Male | Female |
| Farming, Fishing & Forestry | 2 (100.0%) | 0 (0.0%) |
| Construction & Extraction | 22 (100.0%) | 0 (0.0%) |
| Installation, Maintenance & Repair | 2 (100.0%) | 0 (0.0%) |
| Total (Category) | 26 (100.0%) | 0 (0.0%) |
| Total (Overall) | 57 (57.6%) | 42 (42.4%) |
Production, Transportation and Moving Occupations
The most common Production, Transportation and Moving occupations in Cromwell are Material Moving (6 | 6.1%), Production (5 | 5.1%), and Transportation (2 | 2.0%).
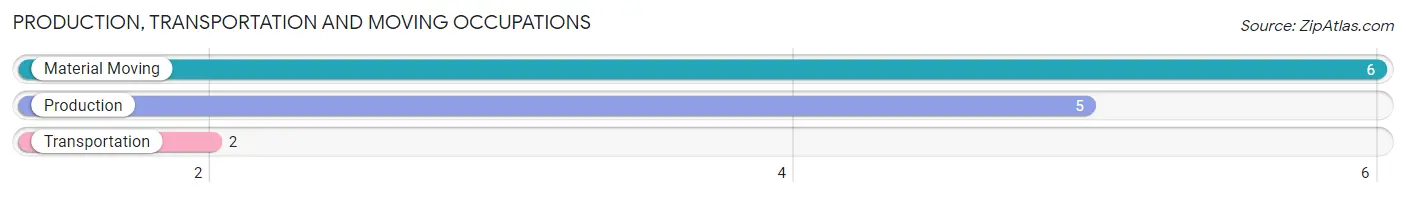
Production, Transportation and Moving Occupations by Sex
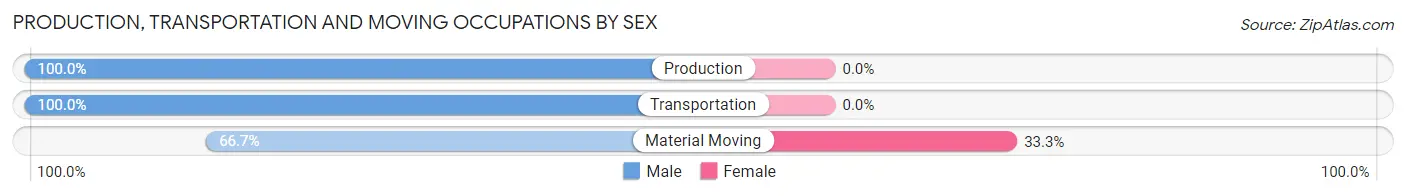
| Occupation | Male | Female |
| Production | 5 (100.0%) | 0 (0.0%) |
| Transportation | 2 (100.0%) | 0 (0.0%) |
| Material Moving | 4 (66.7%) | 2 (33.3%) |
| Total (Category) | 11 (84.6%) | 2 (15.4%) |
| Total (Overall) | 57 (57.6%) | 42 (42.4%) |
Employment Industries by Sex in Cromwell
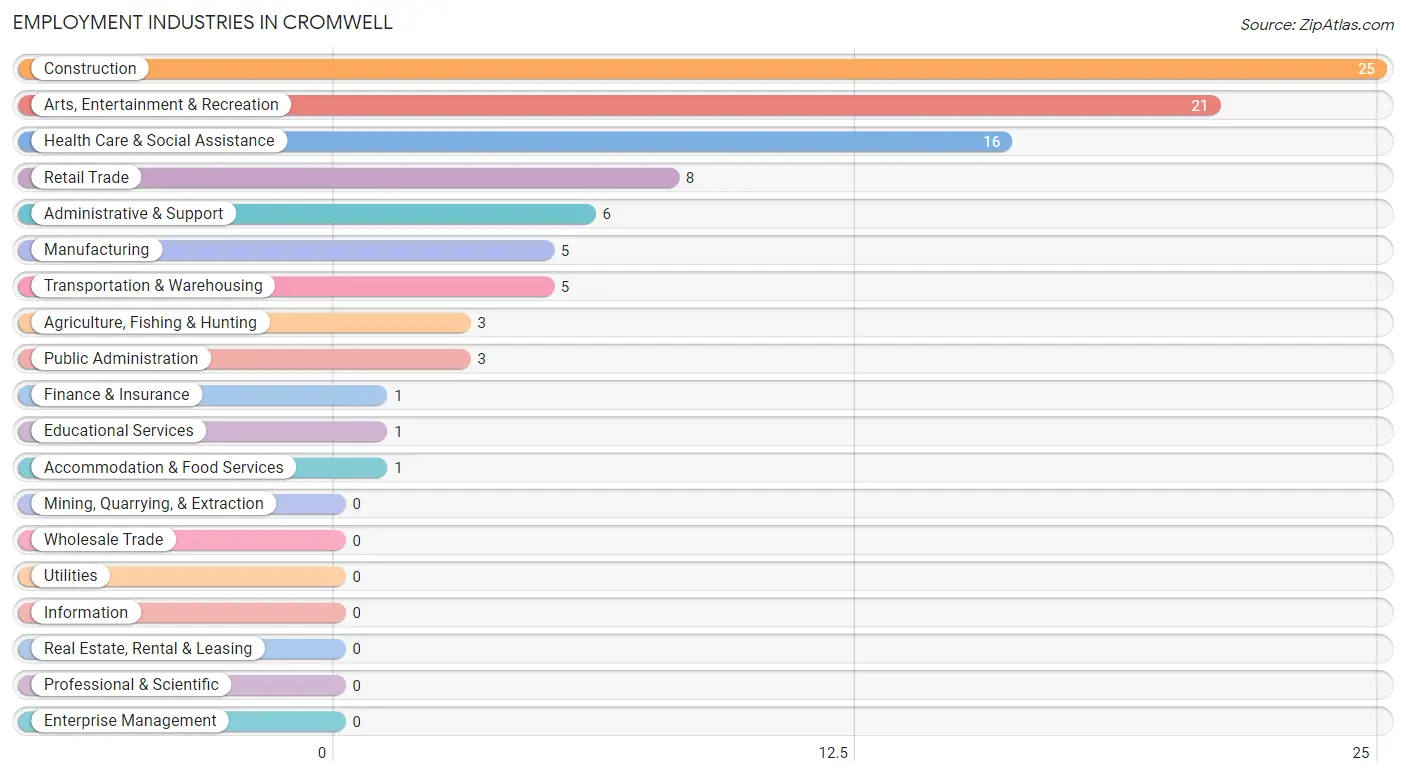
Employment Industries in Cromwell
The major employment industries in Cromwell include Construction (25 | 25.3%), Arts, Entertainment & Recreation (21 | 21.2%), Health Care & Social Assistance (16 | 16.2%), Retail Trade (8 | 8.1%), and Administrative & Support (6 | 6.1%).
Employment Industries by Sex in Cromwell
The Cromwell industries that see more men than women are Construction (100.0%), Manufacturing (100.0%), and Finance & Insurance (100.0%), whereas the industries that tend to have a higher number of women are Educational Services (100.0%), Arts, Entertainment & Recreation (100.0%), and Accommodation & Food Services (100.0%).
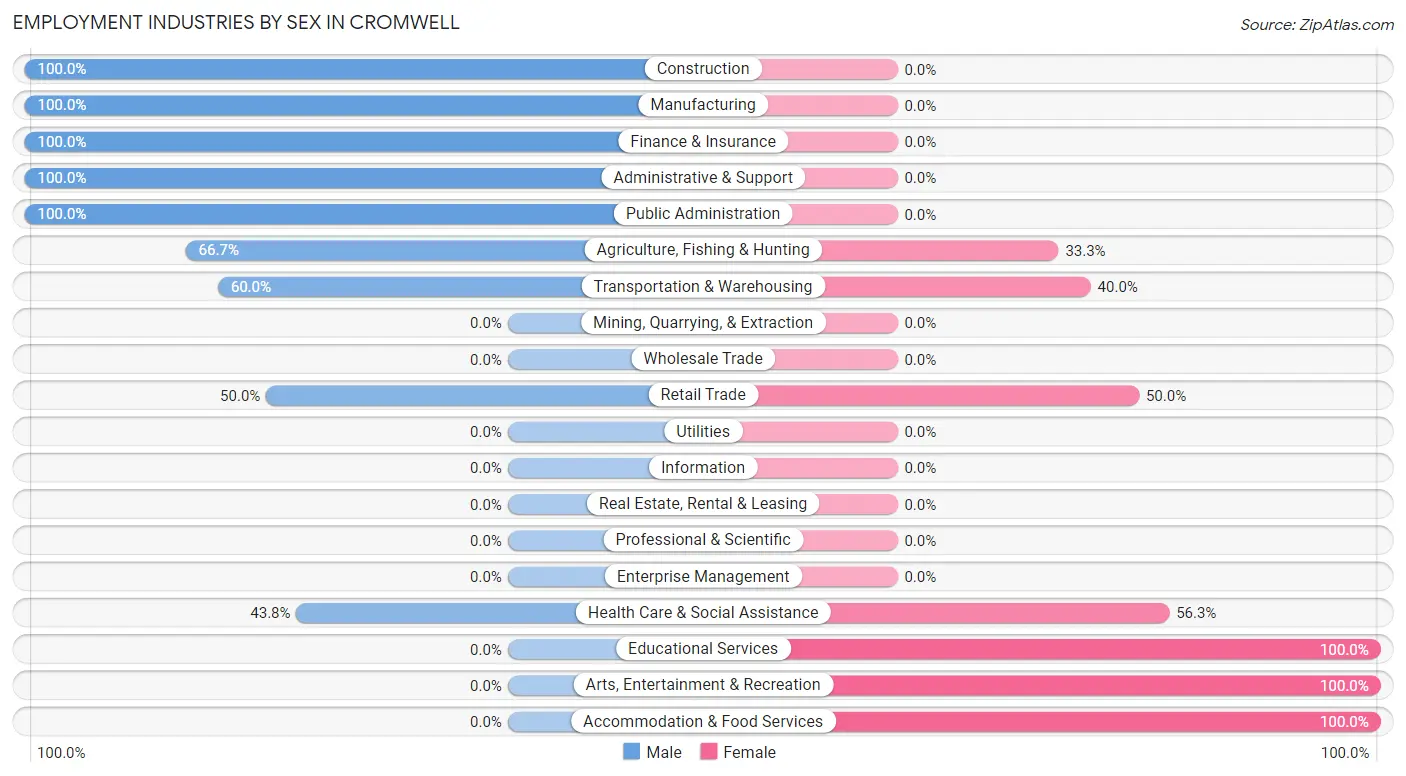
| Industry | Male | Female |
| Agriculture, Fishing & Hunting | 2 (66.7%) | 1 (33.3%) |
| Mining, Quarrying, & Extraction | 0 (0.0%) | 0 (0.0%) |
| Construction | 25 (100.0%) | 0 (0.0%) |
| Manufacturing | 5 (100.0%) | 0 (0.0%) |
| Wholesale Trade | 0 (0.0%) | 0 (0.0%) |
| Retail Trade | 4 (50.0%) | 4 (50.0%) |
| Transportation & Warehousing | 3 (60.0%) | 2 (40.0%) |
| Utilities | 0 (0.0%) | 0 (0.0%) |
| Information | 0 (0.0%) | 0 (0.0%) |
| Finance & Insurance | 1 (100.0%) | 0 (0.0%) |
| Real Estate, Rental & Leasing | 0 (0.0%) | 0 (0.0%) |
| Professional & Scientific | 0 (0.0%) | 0 (0.0%) |
| Enterprise Management | 0 (0.0%) | 0 (0.0%) |
| Administrative & Support | 6 (100.0%) | 0 (0.0%) |
| Educational Services | 0 (0.0%) | 1 (100.0%) |
| Health Care & Social Assistance | 7 (43.8%) | 9 (56.2%) |
| Arts, Entertainment & Recreation | 0 (0.0%) | 21 (100.0%) |
| Accommodation & Food Services | 0 (0.0%) | 1 (100.0%) |
| Public Administration | 3 (100.0%) | 0 (0.0%) |
| Total | 57 (57.6%) | 42 (42.4%) |
Education in Cromwell
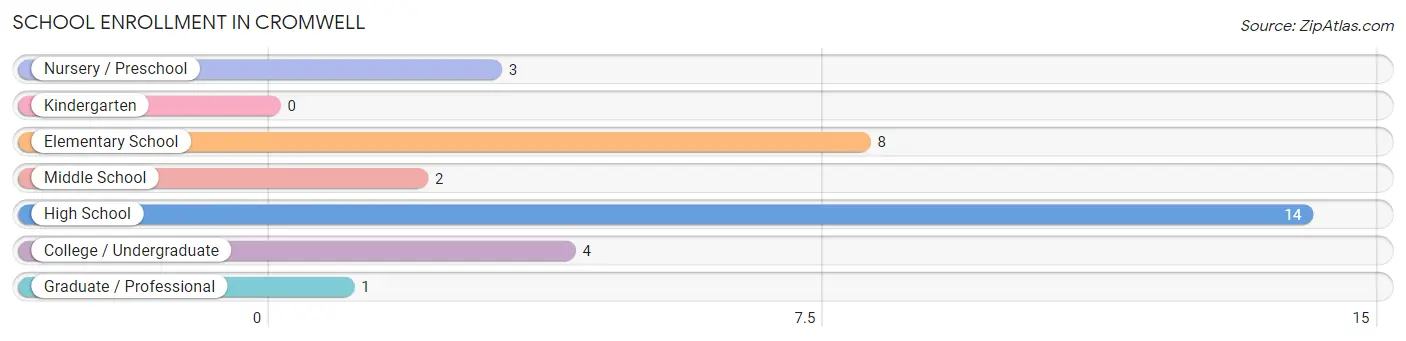
School Enrollment in Cromwell
The most common levels of schooling among the 32 students in Cromwell are high school (14 | 43.8%), elementary school (8 | 25.0%), and college / undergraduate (4 | 12.5%).
| School Level | # Students | % Students |
| Nursery / Preschool | 3 | 9.4% |
| Kindergarten | 0 | 0.0% |
| Elementary School | 8 | 25.0% |
| Middle School | 2 | 6.2% |
| High School | 14 | 43.8% |
| College / Undergraduate | 4 | 12.5% |
| Graduate / Professional | 1 | 3.1% |
| Total | 32 | 100.0% |
School Enrollment by Age by Funding Source in Cromwell
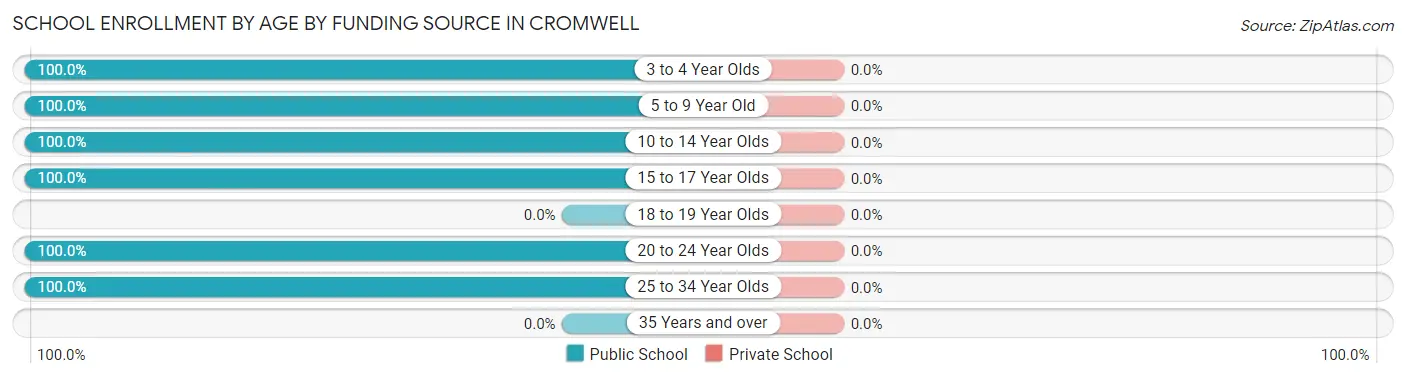
| Age Bracket | Public School | Private School |
| 3 to 4 Year Olds | 1 (100.0%) | 0 (0.0%) |
| 5 to 9 Year Old | 8 (100.0%) | 0 (0.0%) |
| 10 to 14 Year Olds | 4 (100.0%) | 0 (0.0%) |
| 15 to 17 Year Olds | 14 (100.0%) | 0 (0.0%) |
| 18 to 19 Year Olds | 0 (0.0%) | 0 (0.0%) |
| 20 to 24 Year Olds | 2 (100.0%) | 0 (0.0%) |
| 25 to 34 Year Olds | 3 (100.0%) | 0 (0.0%) |
| 35 Years and over | 0 (0.0%) | 0 (0.0%) |
| Total | 32 (100.0%) | 0 (0.0%) |
Educational Attainment by Field of Study in Cromwell
Education (11 | 47.8%), business (5 | 21.7%), science & technology (4 | 17.4%), social sciences (2 | 8.7%), and visual & performing arts (1 | 4.3%) are the most common fields of study among 23 individuals in Cromwell who have obtained a bachelor's degree or higher.
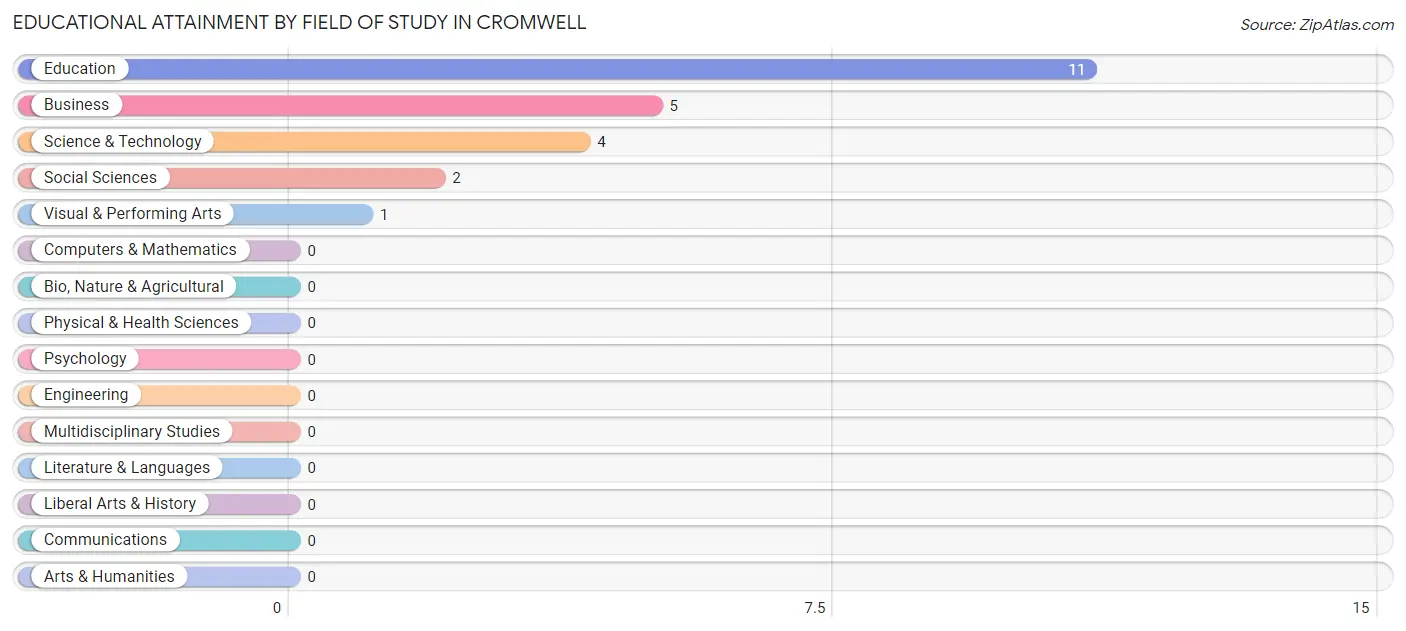
| Field of Study | # Graduates | % Graduates |
| Computers & Mathematics | 0 | 0.0% |
| Bio, Nature & Agricultural | 0 | 0.0% |
| Physical & Health Sciences | 0 | 0.0% |
| Psychology | 0 | 0.0% |
| Social Sciences | 2 | 8.7% |
| Engineering | 0 | 0.0% |
| Multidisciplinary Studies | 0 | 0.0% |
| Science & Technology | 4 | 17.4% |
| Business | 5 | 21.7% |
| Education | 11 | 47.8% |
| Literature & Languages | 0 | 0.0% |
| Liberal Arts & History | 0 | 0.0% |
| Visual & Performing Arts | 1 | 4.3% |
| Communications | 0 | 0.0% |
| Arts & Humanities | 0 | 0.0% |
| Total | 23 | 100.0% |
Transportation & Commute in Cromwell
Vehicle Availability by Sex in Cromwell
The most prevalent vehicle ownership categories in Cromwell are males with 2 vehicles (36, accounting for 63.2%) and females with 2 vehicles (25, making up 90.0%).
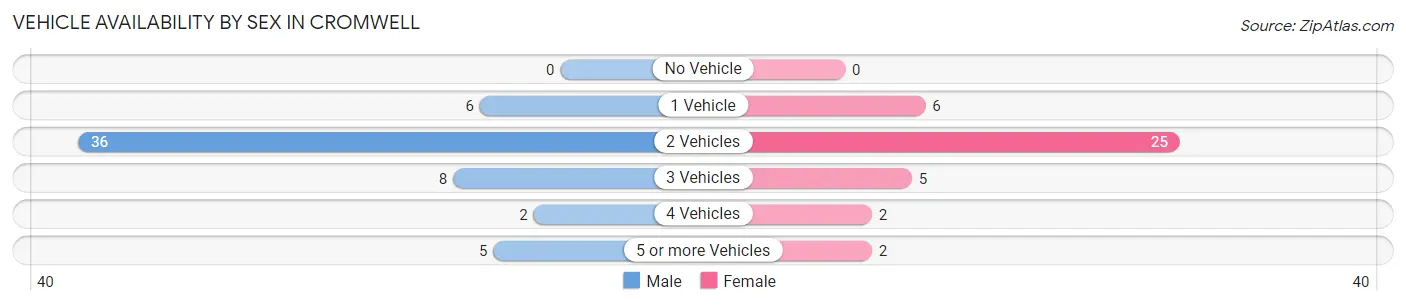
| Vehicles Available | Male | Female |
| No Vehicle | 0 (0.0%) | 0 (0.0%) |
| 1 Vehicle | 6 (10.5%) | 6 (15.0%) |
| 2 Vehicles | 36 (63.2%) | 25 (62.5%) |
| 3 Vehicles | 8 (14.0%) | 5 (12.5%) |
| 4 Vehicles | 2 (3.5%) | 2 (5.0%) |
| 5 or more Vehicles | 5 (8.8%) | 2 (5.0%) |
| Total | 57 (100.0%) | 40 (100.0%) |
Commute Time in Cromwell
The most frequently occuring commute durations in Cromwell are 25 to 29 minutes (29 commuters, 29.9%), 90 or more minutes (20 commuters, 20.6%), and 45 to 59 minutes (18 commuters, 18.6%).
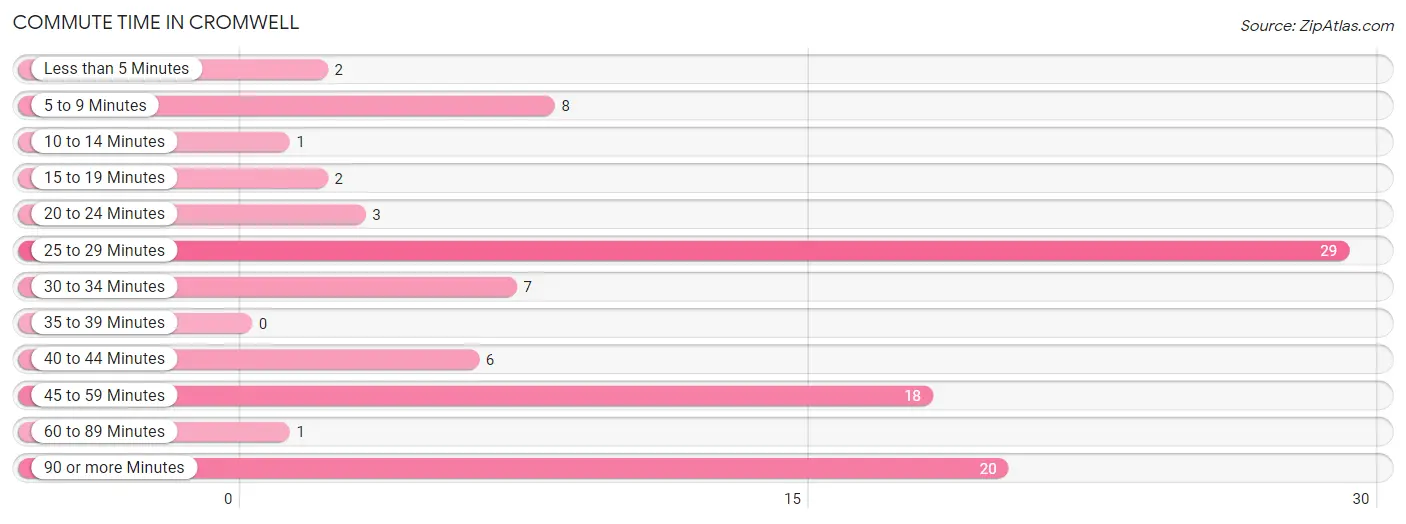
| Commute Time | # Commuters | % Commuters |
| Less than 5 Minutes | 2 | 2.1% |
| 5 to 9 Minutes | 8 | 8.3% |
| 10 to 14 Minutes | 1 | 1.0% |
| 15 to 19 Minutes | 2 | 2.1% |
| 20 to 24 Minutes | 3 | 3.1% |
| 25 to 29 Minutes | 29 | 29.9% |
| 30 to 34 Minutes | 7 | 7.2% |
| 35 to 39 Minutes | 0 | 0.0% |
| 40 to 44 Minutes | 6 | 6.2% |
| 45 to 59 Minutes | 18 | 18.6% |
| 60 to 89 Minutes | 1 | 1.0% |
| 90 or more Minutes | 20 | 20.6% |
Commute Time by Sex in Cromwell
The most common commute times in Cromwell are 90 or more minutes (20 commuters, 35.1%) for males and 25 to 29 minutes (25 commuters, 62.5%) for females.
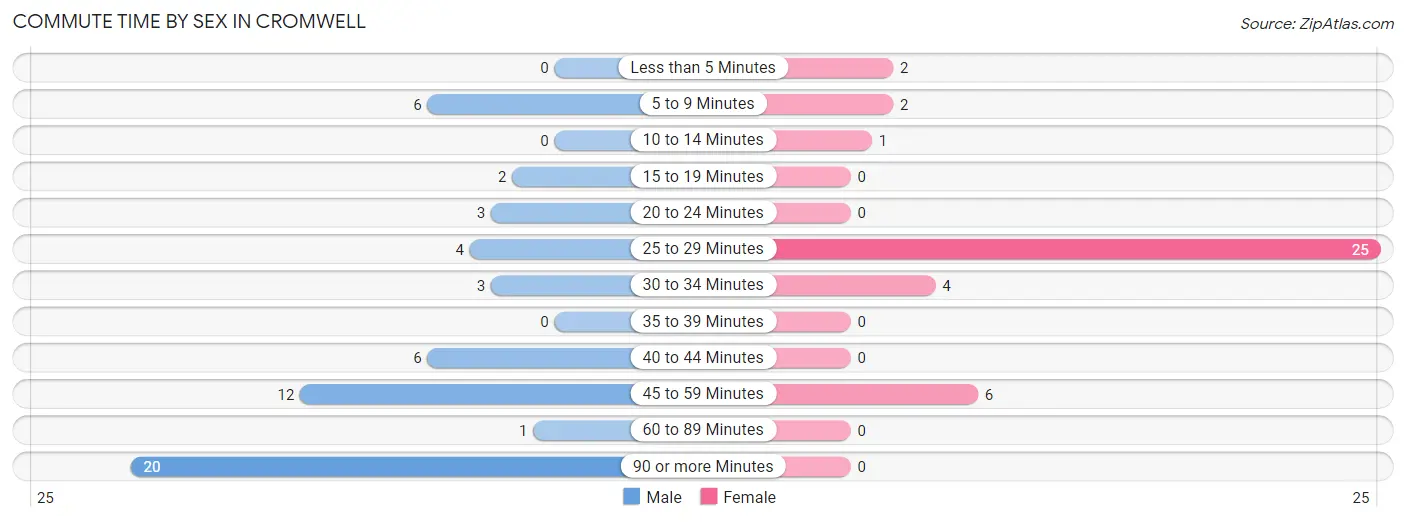
| Commute Time | Male | Female |
| Less than 5 Minutes | 0 (0.0%) | 2 (5.0%) |
| 5 to 9 Minutes | 6 (10.5%) | 2 (5.0%) |
| 10 to 14 Minutes | 0 (0.0%) | 1 (2.5%) |
| 15 to 19 Minutes | 2 (3.5%) | 0 (0.0%) |
| 20 to 24 Minutes | 3 (5.3%) | 0 (0.0%) |
| 25 to 29 Minutes | 4 (7.0%) | 25 (62.5%) |
| 30 to 34 Minutes | 3 (5.3%) | 4 (10.0%) |
| 35 to 39 Minutes | 0 (0.0%) | 0 (0.0%) |
| 40 to 44 Minutes | 6 (10.5%) | 0 (0.0%) |
| 45 to 59 Minutes | 12 (21.0%) | 6 (15.0%) |
| 60 to 89 Minutes | 1 (1.8%) | 0 (0.0%) |
| 90 or more Minutes | 20 (35.1%) | 0 (0.0%) |
Time of Departure to Work by Sex in Cromwell
The most frequent times of departure to work in Cromwell are 5:30 AM to 5:59 AM (20, 35.1%) for males and 12:00 AM to 4:59 AM (13, 32.5%) for females.
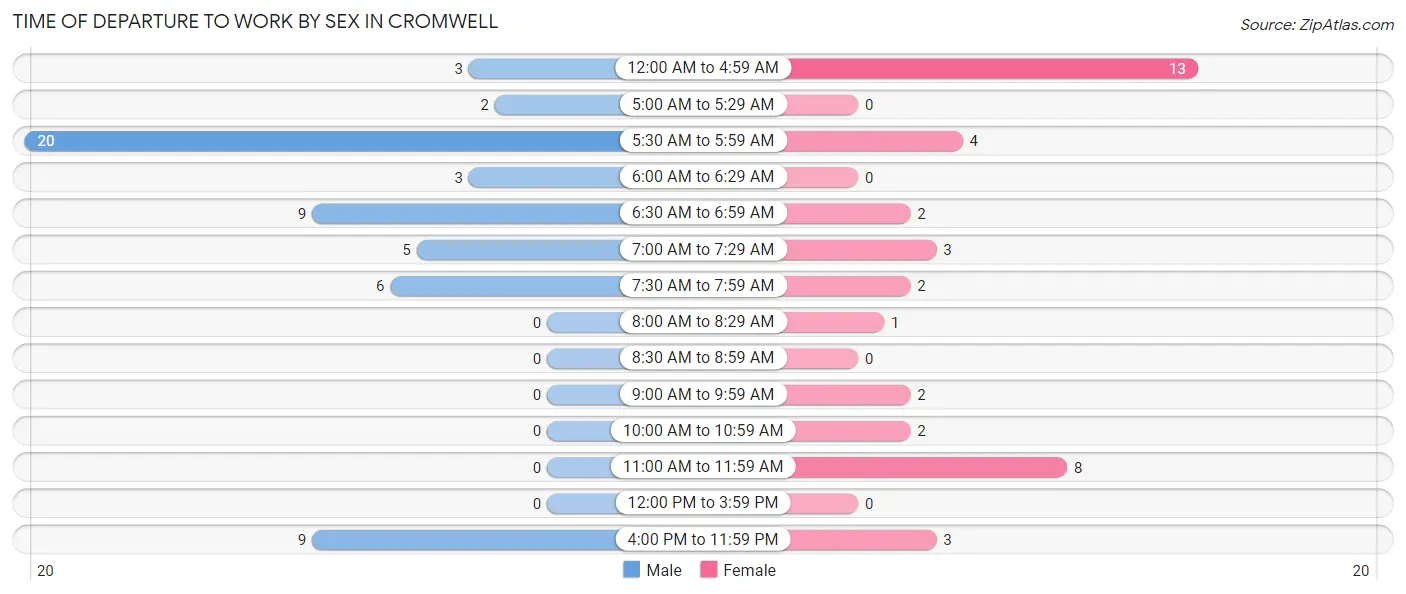
| Time of Departure | Male | Female |
| 12:00 AM to 4:59 AM | 3 (5.3%) | 13 (32.5%) |
| 5:00 AM to 5:29 AM | 2 (3.5%) | 0 (0.0%) |
| 5:30 AM to 5:59 AM | 20 (35.1%) | 4 (10.0%) |
| 6:00 AM to 6:29 AM | 3 (5.3%) | 0 (0.0%) |
| 6:30 AM to 6:59 AM | 9 (15.8%) | 2 (5.0%) |
| 7:00 AM to 7:29 AM | 5 (8.8%) | 3 (7.5%) |
| 7:30 AM to 7:59 AM | 6 (10.5%) | 2 (5.0%) |
| 8:00 AM to 8:29 AM | 0 (0.0%) | 1 (2.5%) |
| 8:30 AM to 8:59 AM | 0 (0.0%) | 0 (0.0%) |
| 9:00 AM to 9:59 AM | 0 (0.0%) | 2 (5.0%) |
| 10:00 AM to 10:59 AM | 0 (0.0%) | 2 (5.0%) |
| 11:00 AM to 11:59 AM | 0 (0.0%) | 8 (20.0%) |
| 12:00 PM to 3:59 PM | 0 (0.0%) | 0 (0.0%) |
| 4:00 PM to 11:59 PM | 9 (15.8%) | 3 (7.5%) |
| Total | 57 (100.0%) | 40 (100.0%) |
Housing Occupancy in Cromwell
Occupancy by Ownership in Cromwell
Of the total 118 dwellings in Cromwell, owner-occupied units account for 70 (59.3%), while renter-occupied units make up 48 (40.7%).
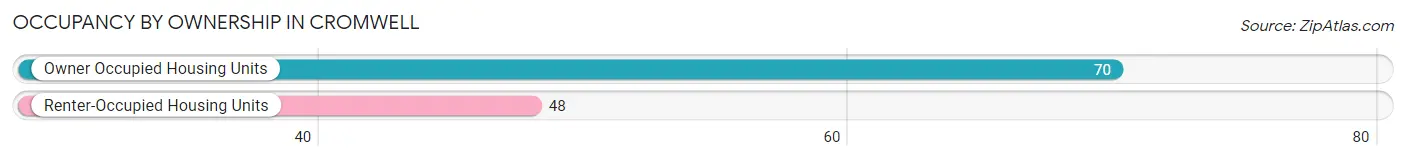
| Occupancy | # Housing Units | % Housing Units |
| Owner Occupied Housing Units | 70 | 59.3% |
| Renter-Occupied Housing Units | 48 | 40.7% |
| Total Occupied Housing Units | 118 | 100.0% |
Occupancy by Household Size in Cromwell
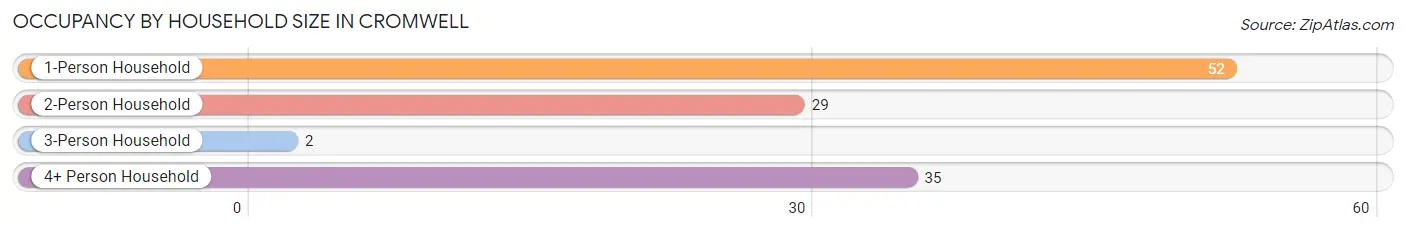
| Household Size | # Housing Units | % Housing Units |
| 1-Person Household | 52 | 44.1% |
| 2-Person Household | 29 | 24.6% |
| 3-Person Household | 2 | 1.7% |
| 4+ Person Household | 35 | 29.7% |
| Total Housing Units | 118 | 100.0% |
Occupancy by Ownership by Household Size in Cromwell
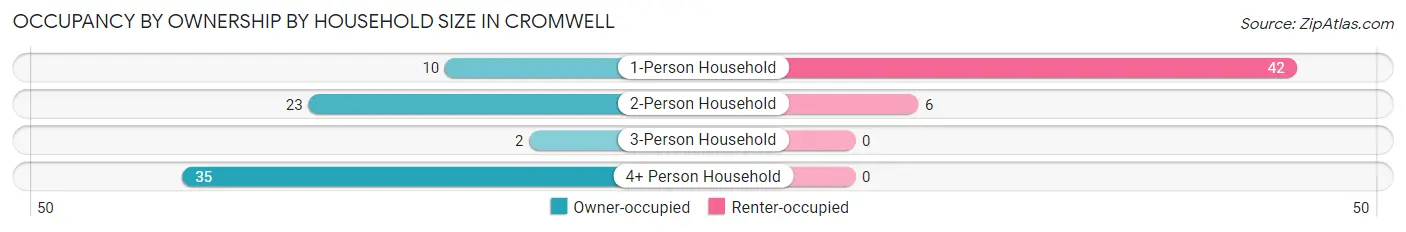
| Household Size | Owner-occupied | Renter-occupied |
| 1-Person Household | 10 (19.2%) | 42 (80.8%) |
| 2-Person Household | 23 (79.3%) | 6 (20.7%) |
| 3-Person Household | 2 (100.0%) | 0 (0.0%) |
| 4+ Person Household | 35 (100.0%) | 0 (0.0%) |
| Total Housing Units | 70 (59.3%) | 48 (40.7%) |
Occupancy by Educational Attainment in Cromwell
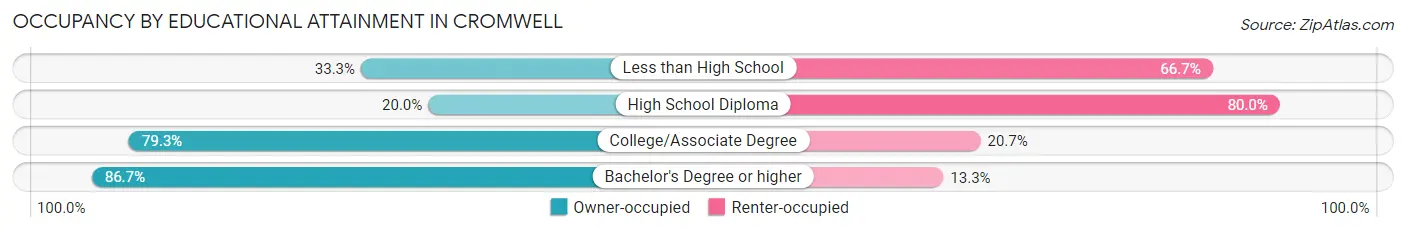
| Household Size | Owner-occupied | Renter-occupied |
| Less than High School | 5 (33.3%) | 10 (66.7%) |
| High School Diploma | 6 (20.0%) | 24 (80.0%) |
| College/Associate Degree | 46 (79.3%) | 12 (20.7%) |
| Bachelor's Degree or higher | 13 (86.7%) | 2 (13.3%) |
Occupancy by Age of Householder in Cromwell
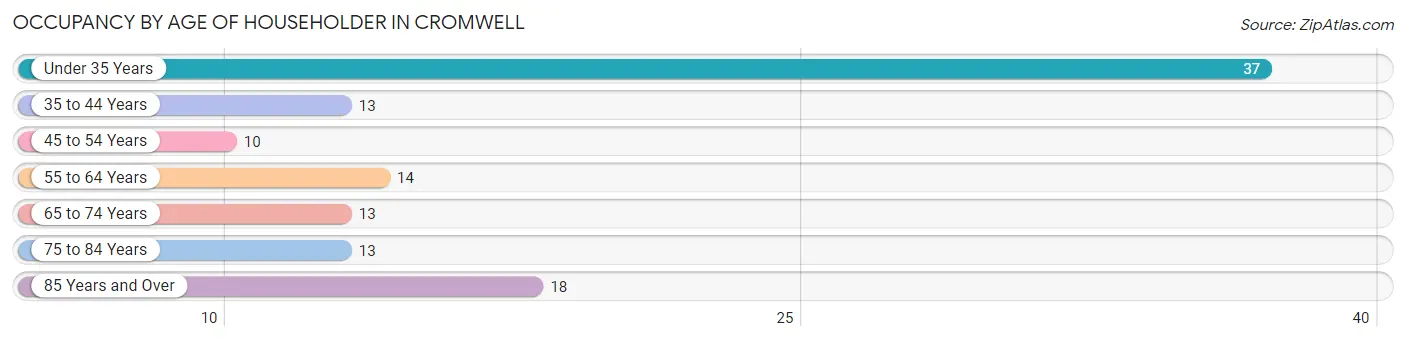
| Age Bracket | # Households | % Households |
| Under 35 Years | 37 | 31.4% |
| 35 to 44 Years | 13 | 11.0% |
| 45 to 54 Years | 10 | 8.5% |
| 55 to 64 Years | 14 | 11.9% |
| 65 to 74 Years | 13 | 11.0% |
| 75 to 84 Years | 13 | 11.0% |
| 85 Years and Over | 18 | 15.2% |
| Total | 118 | 100.0% |
Housing Finances in Cromwell
Median Income by Occupancy in Cromwell
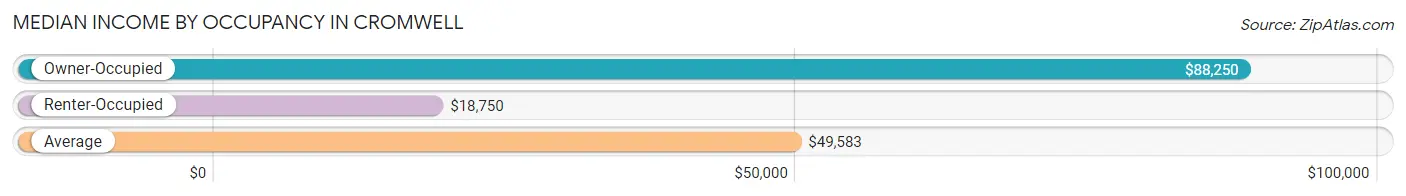
| Occupancy Type | # Households | Median Income |
| Owner-Occupied | 70 (59.3%) | $88,250 |
| Renter-Occupied | 48 (40.7%) | $18,750 |
| Average | 118 (100.0%) | $49,583 |
Occupancy by Householder Income Bracket in Cromwell
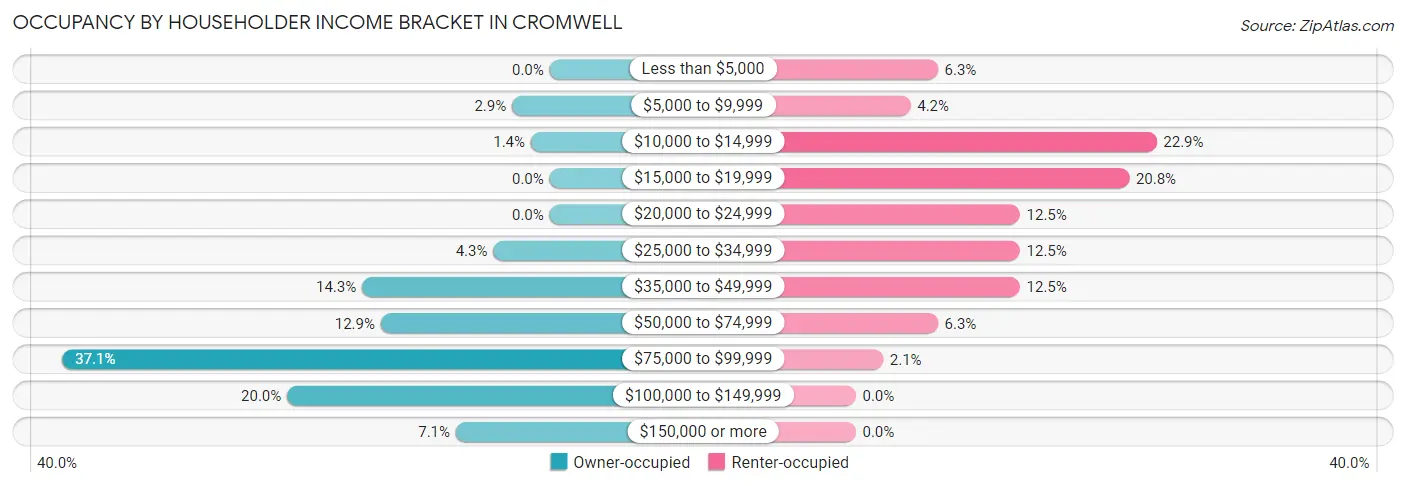
| Income Bracket | Owner-occupied | Renter-occupied |
| Less than $5,000 | 0 (0.0%) | 3 (6.2%) |
| $5,000 to $9,999 | 2 (2.9%) | 2 (4.2%) |
| $10,000 to $14,999 | 1 (1.4%) | 11 (22.9%) |
| $15,000 to $19,999 | 0 (0.0%) | 10 (20.8%) |
| $20,000 to $24,999 | 0 (0.0%) | 6 (12.5%) |
| $25,000 to $34,999 | 3 (4.3%) | 6 (12.5%) |
| $35,000 to $49,999 | 10 (14.3%) | 6 (12.5%) |
| $50,000 to $74,999 | 9 (12.9%) | 3 (6.2%) |
| $75,000 to $99,999 | 26 (37.1%) | 1 (2.1%) |
| $100,000 to $149,999 | 14 (20.0%) | 0 (0.0%) |
| $150,000 or more | 5 (7.1%) | 0 (0.0%) |
| Total | 70 (100.0%) | 48 (100.0%) |
Monthly Housing Cost Tiers in Cromwell
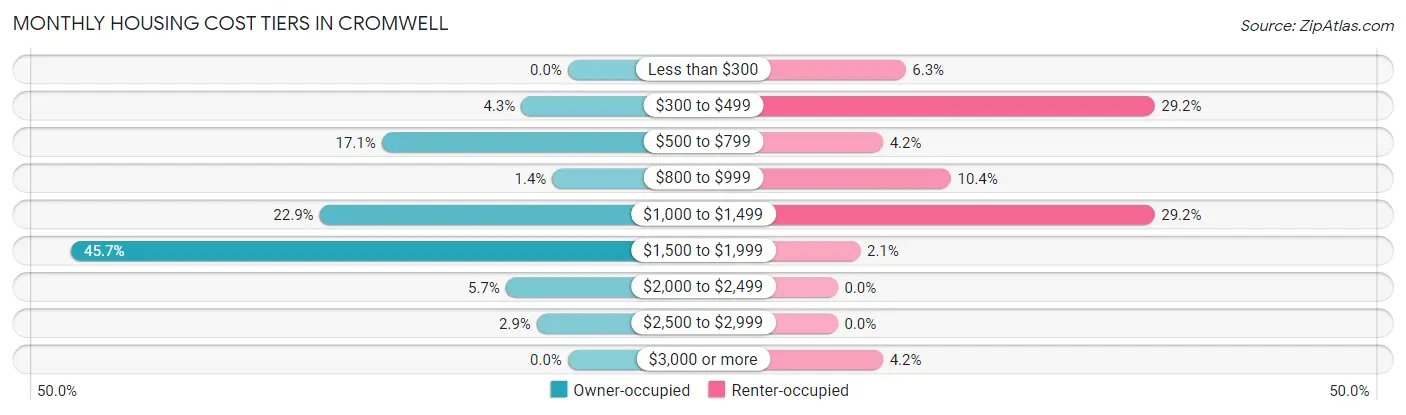
| Monthly Cost | Owner-occupied | Renter-occupied |
| Less than $300 | 0 (0.0%) | 3 (6.2%) |
| $300 to $499 | 3 (4.3%) | 14 (29.2%) |
| $500 to $799 | 12 (17.1%) | 2 (4.2%) |
| $800 to $999 | 1 (1.4%) | 5 (10.4%) |
| $1,000 to $1,499 | 16 (22.9%) | 14 (29.2%) |
| $1,500 to $1,999 | 32 (45.7%) | 1 (2.1%) |
| $2,000 to $2,499 | 4 (5.7%) | 0 (0.0%) |
| $2,500 to $2,999 | 2 (2.9%) | 0 (0.0%) |
| $3,000 or more | 0 (0.0%) | 2 (4.2%) |
| Total | 70 (100.0%) | 48 (100.0%) |
Physical Housing Characteristics in Cromwell
Housing Structures in Cromwell
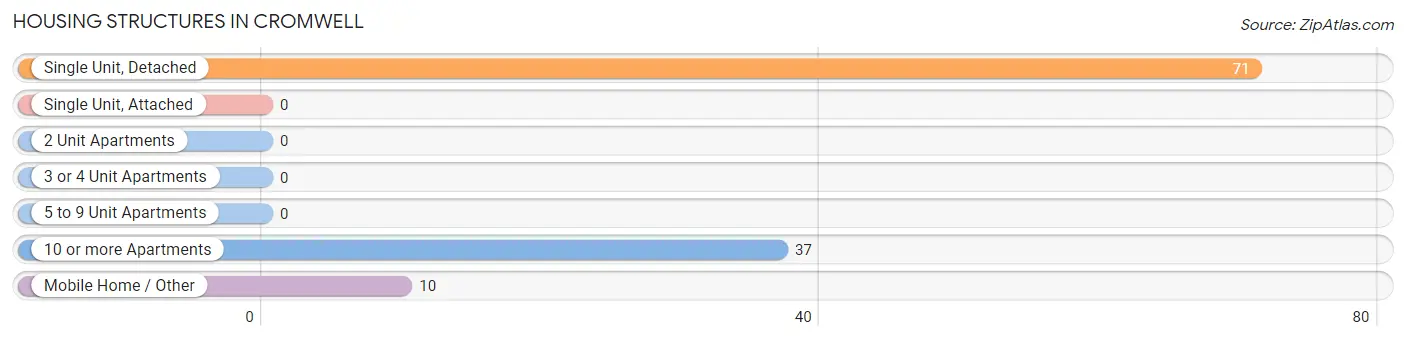
| Structure Type | # Housing Units | % Housing Units |
| Single Unit, Detached | 71 | 60.2% |
| Single Unit, Attached | 0 | 0.0% |
| 2 Unit Apartments | 0 | 0.0% |
| 3 or 4 Unit Apartments | 0 | 0.0% |
| 5 to 9 Unit Apartments | 0 | 0.0% |
| 10 or more Apartments | 37 | 31.4% |
| Mobile Home / Other | 10 | 8.5% |
| Total | 118 | 100.0% |
Housing Structures by Occupancy in Cromwell
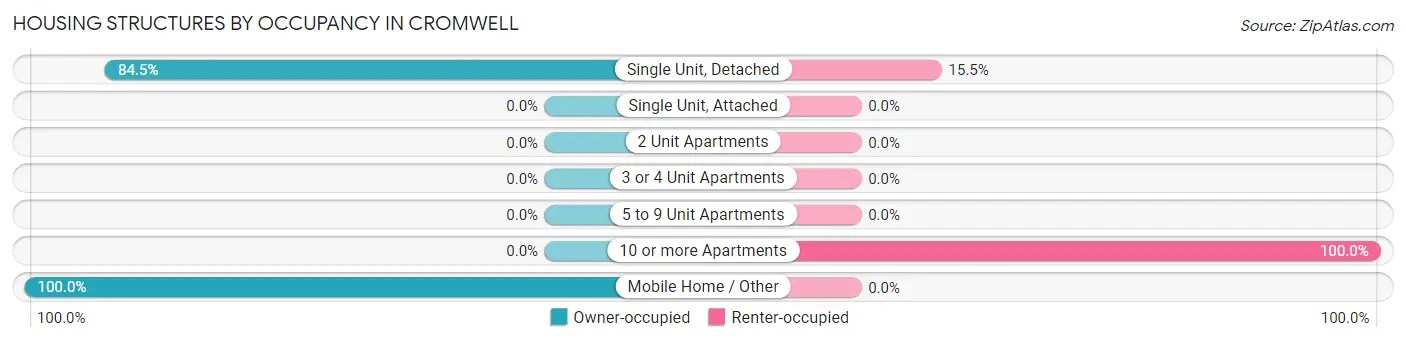
| Structure Type | Owner-occupied | Renter-occupied |
| Single Unit, Detached | 60 (84.5%) | 11 (15.5%) |
| Single Unit, Attached | 0 (0.0%) | 0 (0.0%) |
| 2 Unit Apartments | 0 (0.0%) | 0 (0.0%) |
| 3 or 4 Unit Apartments | 0 (0.0%) | 0 (0.0%) |
| 5 to 9 Unit Apartments | 0 (0.0%) | 0 (0.0%) |
| 10 or more Apartments | 0 (0.0%) | 37 (100.0%) |
| Mobile Home / Other | 10 (100.0%) | 0 (0.0%) |
| Total | 70 (59.3%) | 48 (40.7%) |
Housing Structures by Number of Rooms in Cromwell
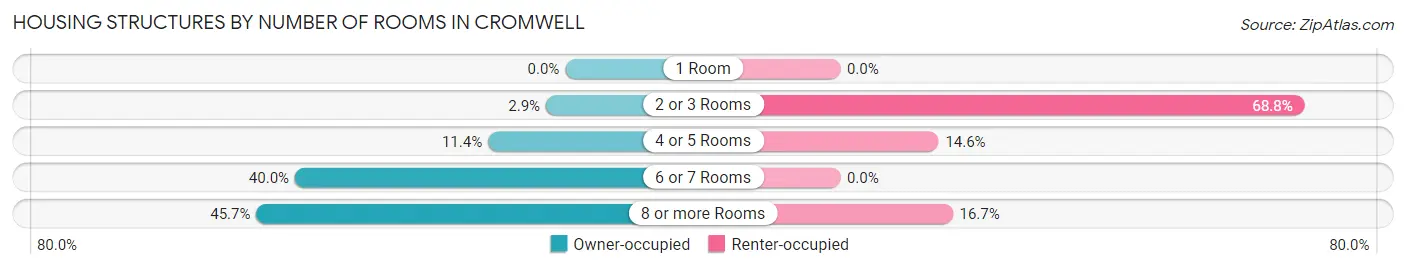
| Number of Rooms | Owner-occupied | Renter-occupied |
| 1 Room | 0 (0.0%) | 0 (0.0%) |
| 2 or 3 Rooms | 2 (2.9%) | 33 (68.8%) |
| 4 or 5 Rooms | 8 (11.4%) | 7 (14.6%) |
| 6 or 7 Rooms | 28 (40.0%) | 0 (0.0%) |
| 8 or more Rooms | 32 (45.7%) | 8 (16.7%) |
| Total | 70 (100.0%) | 48 (100.0%) |
Housing Structure by Heating Type in Cromwell
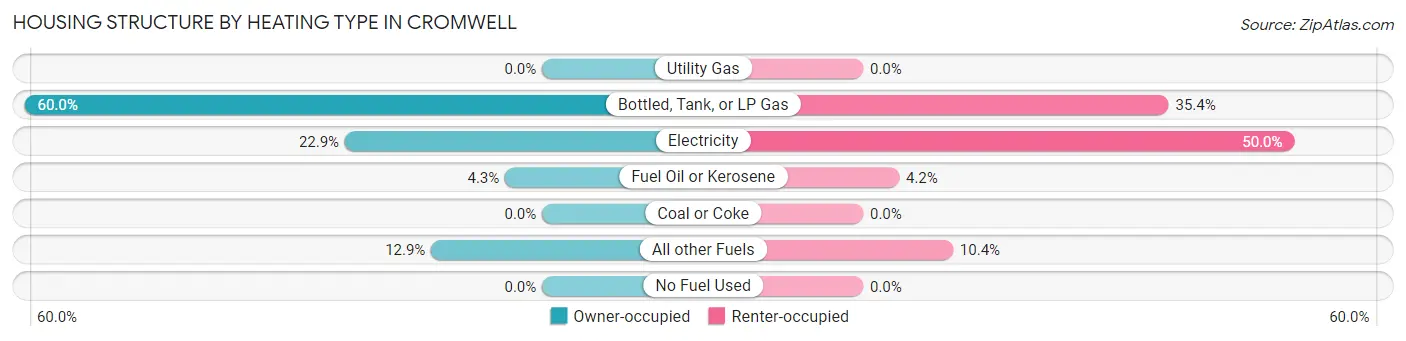
| Heating Type | Owner-occupied | Renter-occupied |
| Utility Gas | 0 (0.0%) | 0 (0.0%) |
| Bottled, Tank, or LP Gas | 42 (60.0%) | 17 (35.4%) |
| Electricity | 16 (22.9%) | 24 (50.0%) |
| Fuel Oil or Kerosene | 3 (4.3%) | 2 (4.2%) |
| Coal or Coke | 0 (0.0%) | 0 (0.0%) |
| All other Fuels | 9 (12.9%) | 5 (10.4%) |
| No Fuel Used | 0 (0.0%) | 0 (0.0%) |
| Total | 70 (100.0%) | 48 (100.0%) |
Household Vehicle Usage in Cromwell
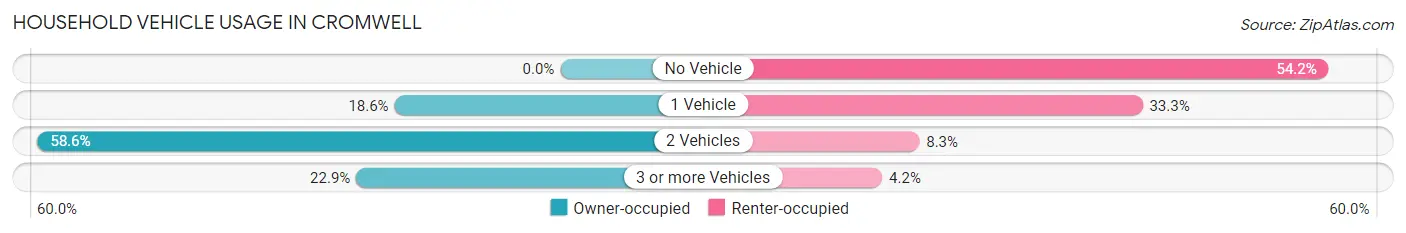
| Vehicles per Household | Owner-occupied | Renter-occupied |
| No Vehicle | 0 (0.0%) | 26 (54.2%) |
| 1 Vehicle | 13 (18.6%) | 16 (33.3%) |
| 2 Vehicles | 41 (58.6%) | 4 (8.3%) |
| 3 or more Vehicles | 16 (22.9%) | 2 (4.2%) |
| Total | 70 (100.0%) | 48 (100.0%) |
Real Estate & Mortgages in Cromwell
Real Estate and Mortgage Overview in Cromwell
| Characteristic | Without Mortgage | With Mortgage |
| Housing Units | 12 | 58 |
| Median Property Value | - | - |
| Median Household Income | $73,750 | $5 |
| Monthly Housing Costs | $550 | $0 |
| Real Estate Taxes | $1,500 | $2 |
Property Value by Mortgage Status in Cromwell
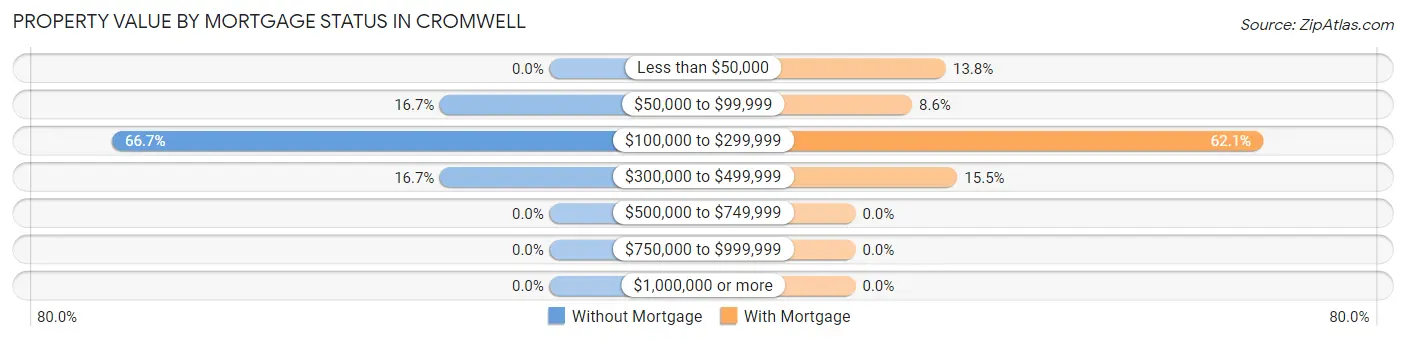
| Property Value | Without Mortgage | With Mortgage |
| Less than $50,000 | 0 (0.0%) | 8 (13.8%) |
| $50,000 to $99,999 | 2 (16.7%) | 5 (8.6%) |
| $100,000 to $299,999 | 8 (66.7%) | 36 (62.1%) |
| $300,000 to $499,999 | 2 (16.7%) | 9 (15.5%) |
| $500,000 to $749,999 | 0 (0.0%) | 0 (0.0%) |
| $750,000 to $999,999 | 0 (0.0%) | 0 (0.0%) |
| $1,000,000 or more | 0 (0.0%) | 0 (0.0%) |
| Total | 12 (100.0%) | 58 (100.0%) |
Household Income by Mortgage Status in Cromwell
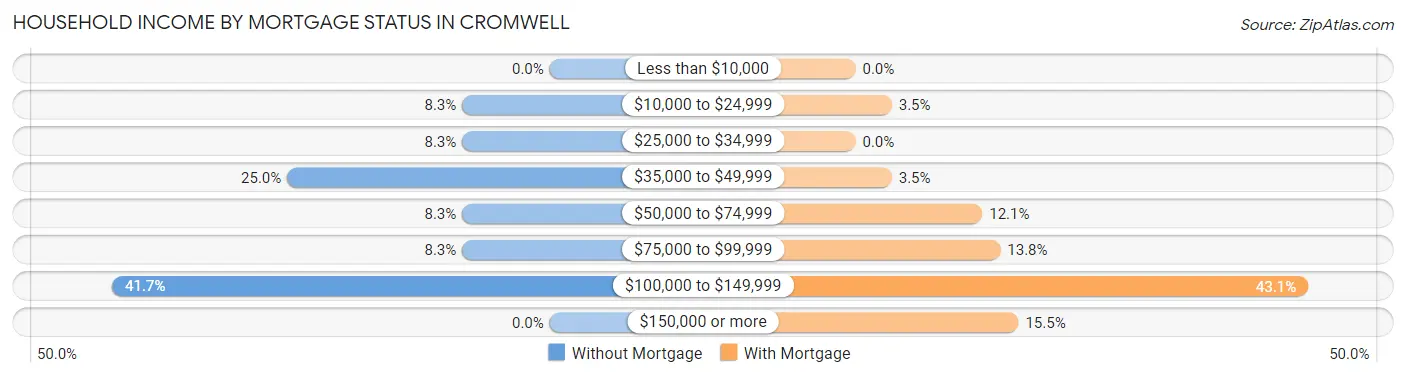
| Household Income | Without Mortgage | With Mortgage |
| Less than $10,000 | 0 (0.0%) | 0 (0.0%) |
| $10,000 to $24,999 | 1 (8.3%) | 2 (3.5%) |
| $25,000 to $34,999 | 1 (8.3%) | 0 (0.0%) |
| $35,000 to $49,999 | 3 (25.0%) | 2 (3.5%) |
| $50,000 to $74,999 | 1 (8.3%) | 7 (12.1%) |
| $75,000 to $99,999 | 1 (8.3%) | 8 (13.8%) |
| $100,000 to $149,999 | 5 (41.7%) | 25 (43.1%) |
| $150,000 or more | 0 (0.0%) | 9 (15.5%) |
| Total | 12 (100.0%) | 58 (100.0%) |
Property Value to Household Income Ratio in Cromwell
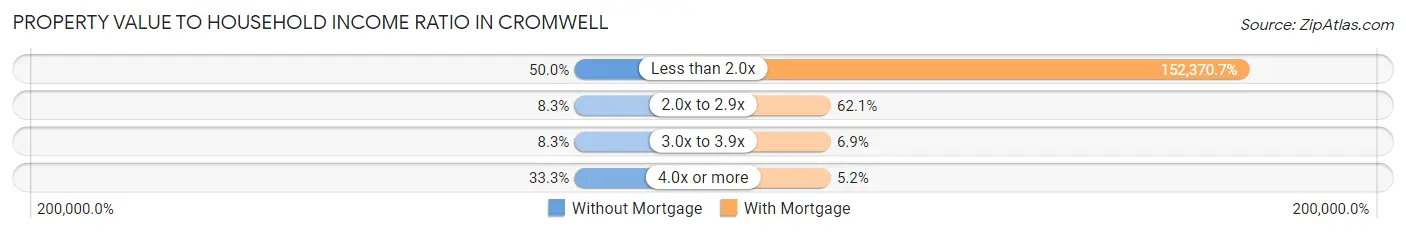
| Value-to-Income Ratio | Without Mortgage | With Mortgage |
| Less than 2.0x | 6 (50.0%) | 88,375 (152,370.7%) |
| 2.0x to 2.9x | 1 (8.3%) | 36 (62.1%) |
| 3.0x to 3.9x | 1 (8.3%) | 4 (6.9%) |
| 4.0x or more | 4 (33.3%) | 3 (5.2%) |
| Total | 12 (100.0%) | 58 (100.0%) |
Real Estate Taxes by Mortgage Status in Cromwell
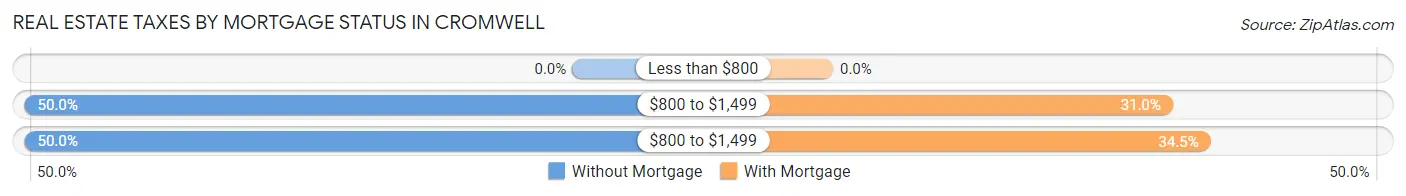
| Property Taxes | Without Mortgage | With Mortgage |
| Less than $800 | 0 (0.0%) | 0 (0.0%) |
| $800 to $1,499 | 6 (50.0%) | 18 (31.0%) |
| $800 to $1,499 | 6 (50.0%) | 20 (34.5%) |
| Total | 12 (100.0%) | 58 (100.0%) |
Health & Disability in Cromwell
Health Insurance Coverage by Age in Cromwell
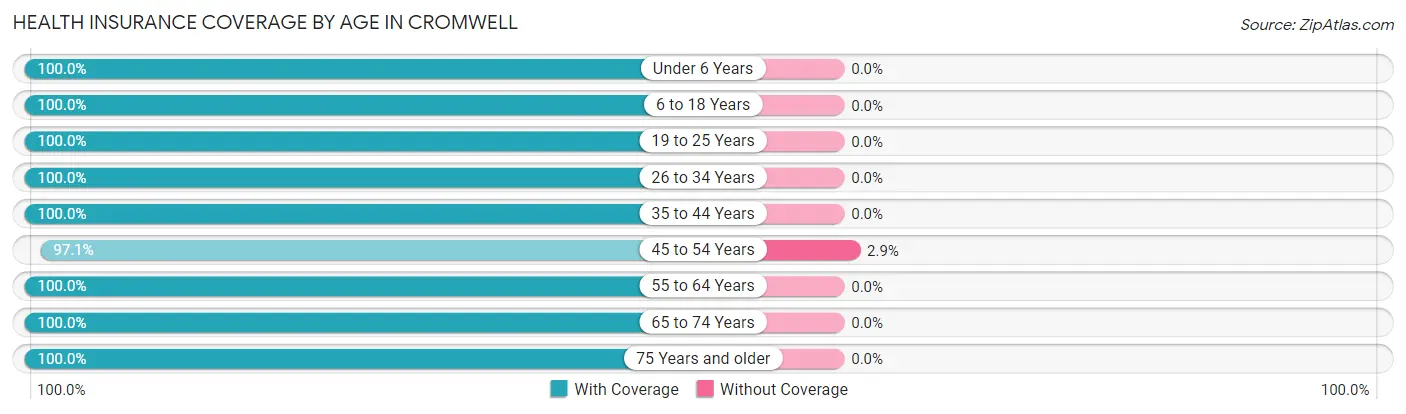
| Age Bracket | With Coverage | Without Coverage |
| Under 6 Years | 108 (100.0%) | 0 (0.0%) |
| 6 to 18 Years | 24 (100.0%) | 0 (0.0%) |
| 19 to 25 Years | 10 (100.0%) | 0 (0.0%) |
| 26 to 34 Years | 57 (100.0%) | 0 (0.0%) |
| 35 to 44 Years | 17 (100.0%) | 0 (0.0%) |
| 45 to 54 Years | 33 (97.1%) | 1 (2.9%) |
| 55 to 64 Years | 17 (100.0%) | 0 (0.0%) |
| 65 to 74 Years | 23 (100.0%) | 0 (0.0%) |
| 75 Years and older | 37 (100.0%) | 0 (0.0%) |
| Total | 326 (99.7%) | 1 (0.3%) |
Health Insurance Coverage by Citizenship Status in Cromwell
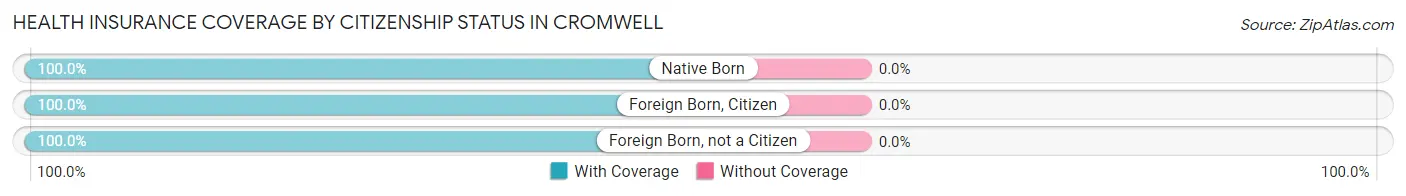
| Citizenship Status | With Coverage | Without Coverage |
| Native Born | 108 (100.0%) | 0 (0.0%) |
| Foreign Born, Citizen | 24 (100.0%) | 0 (0.0%) |
| Foreign Born, not a Citizen | 10 (100.0%) | 0 (0.0%) |
Health Insurance Coverage by Household Income in Cromwell
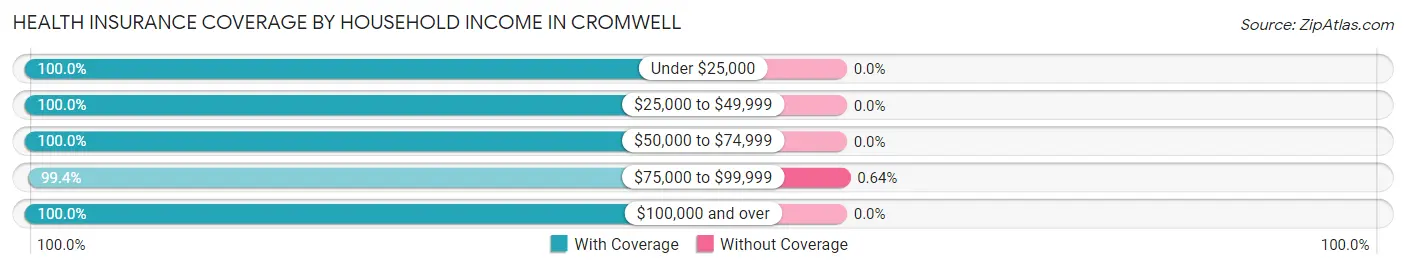
| Household Income | With Coverage | Without Coverage |
| Under $25,000 | 37 (100.0%) | 0 (0.0%) |
| $25,000 to $49,999 | 38 (100.0%) | 0 (0.0%) |
| $50,000 to $74,999 | 25 (100.0%) | 0 (0.0%) |
| $75,000 to $99,999 | 156 (99.4%) | 1 (0.6%) |
| $100,000 and over | 70 (100.0%) | 0 (0.0%) |
Public vs Private Health Insurance Coverage by Age in Cromwell
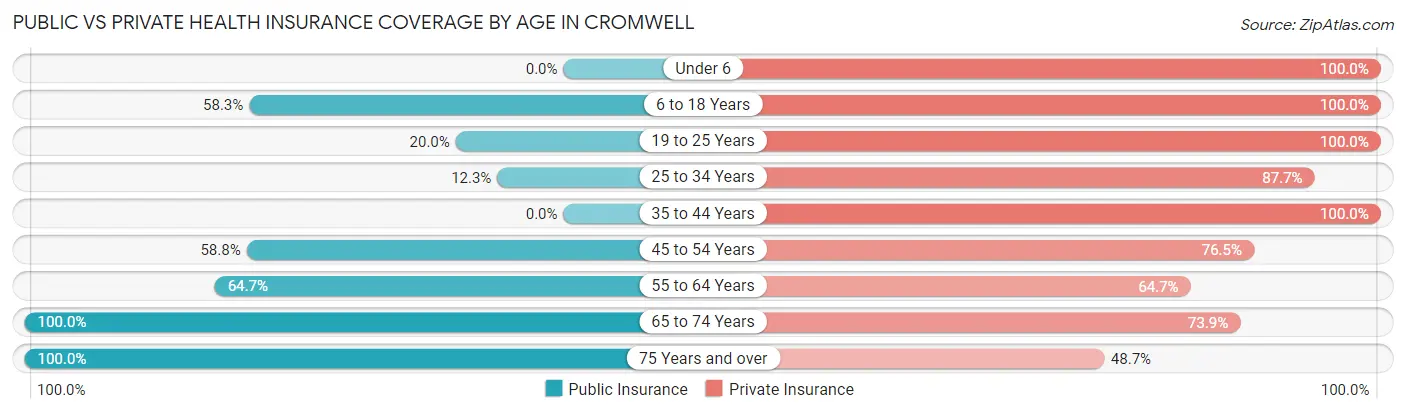
| Age Bracket | Public Insurance | Private Insurance |
| Under 6 | 0 (0.0%) | 108 (100.0%) |
| 6 to 18 Years | 14 (58.3%) | 24 (100.0%) |
| 19 to 25 Years | 2 (20.0%) | 10 (100.0%) |
| 25 to 34 Years | 7 (12.3%) | 50 (87.7%) |
| 35 to 44 Years | 0 (0.0%) | 17 (100.0%) |
| 45 to 54 Years | 20 (58.8%) | 26 (76.5%) |
| 55 to 64 Years | 11 (64.7%) | 11 (64.7%) |
| 65 to 74 Years | 23 (100.0%) | 17 (73.9%) |
| 75 Years and over | 37 (100.0%) | 18 (48.6%) |
| Total | 114 (34.9%) | 281 (85.9%) |
Disability Status by Sex by Age in Cromwell
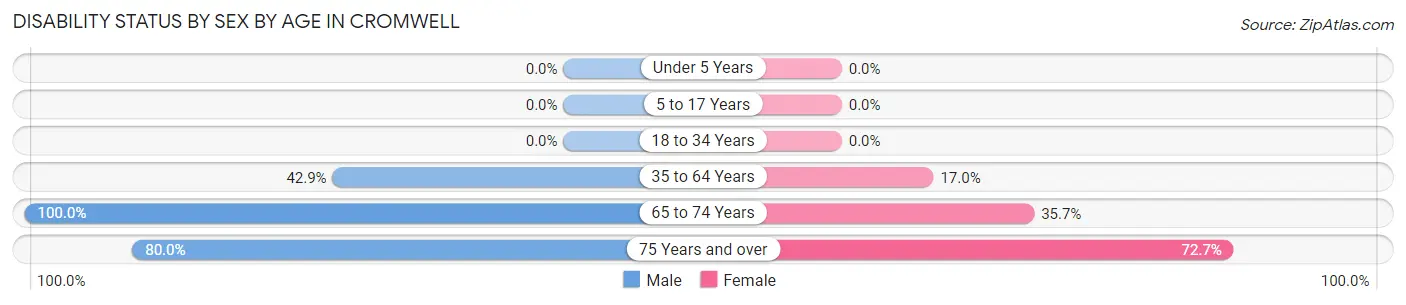
| Age Bracket | Male | Female |
| Under 5 Years | 0 (0.0%) | 0 (0.0%) |
| 5 to 17 Years | 0 (0.0%) | 0 (0.0%) |
| 18 to 34 Years | 0 (0.0%) | 0 (0.0%) |
| 35 to 64 Years | 9 (42.9%) | 8 (17.0%) |
| 65 to 74 Years | 9 (100.0%) | 5 (35.7%) |
| 75 Years and over | 12 (80.0%) | 16 (72.7%) |
Disability Class by Sex by Age in Cromwell
Disability Class: Hearing Difficulty
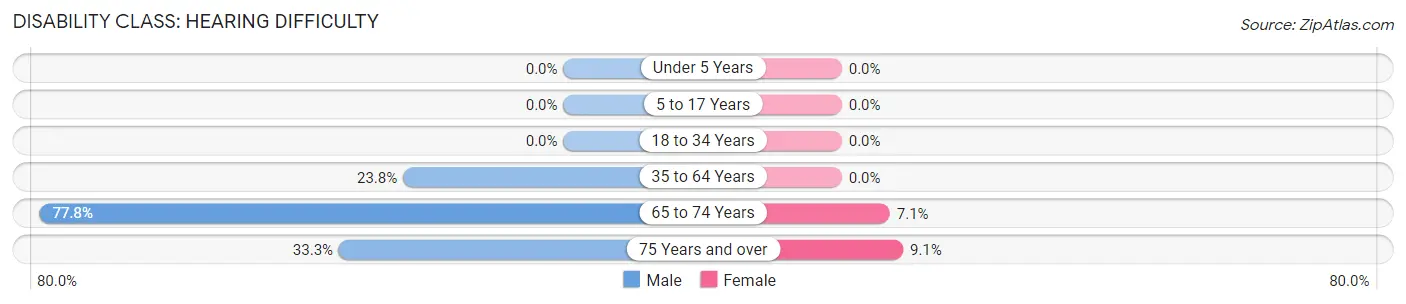
| Age Bracket | Male | Female |
| Under 5 Years | 0 (0.0%) | 0 (0.0%) |
| 5 to 17 Years | 0 (0.0%) | 0 (0.0%) |
| 18 to 34 Years | 0 (0.0%) | 0 (0.0%) |
| 35 to 64 Years | 5 (23.8%) | 0 (0.0%) |
| 65 to 74 Years | 7 (77.8%) | 1 (7.1%) |
| 75 Years and over | 5 (33.3%) | 2 (9.1%) |
Disability Class: Vision Difficulty
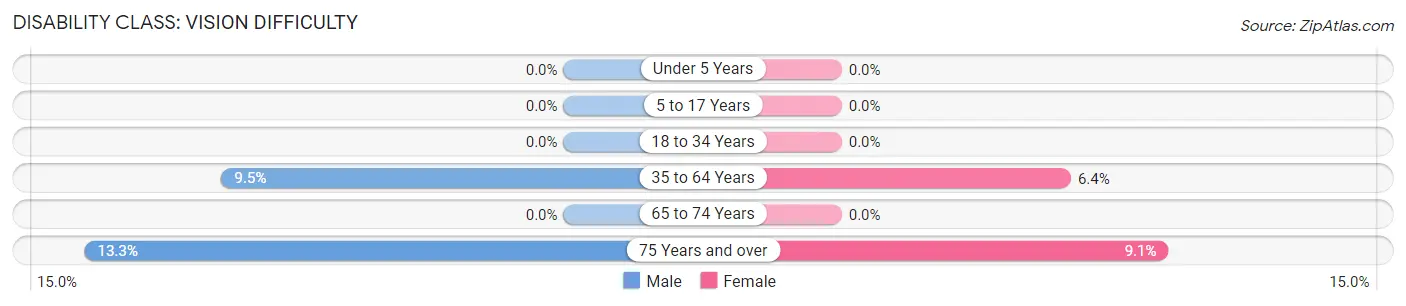
| Age Bracket | Male | Female |
| Under 5 Years | 0 (0.0%) | 0 (0.0%) |
| 5 to 17 Years | 0 (0.0%) | 0 (0.0%) |
| 18 to 34 Years | 0 (0.0%) | 0 (0.0%) |
| 35 to 64 Years | 2 (9.5%) | 3 (6.4%) |
| 65 to 74 Years | 0 (0.0%) | 0 (0.0%) |
| 75 Years and over | 2 (13.3%) | 2 (9.1%) |
Disability Class: Cognitive Difficulty
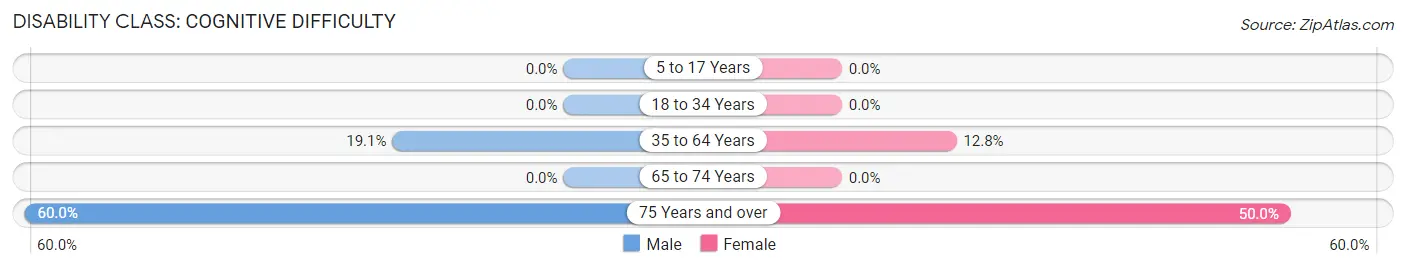
| Age Bracket | Male | Female |
| 5 to 17 Years | 0 (0.0%) | 0 (0.0%) |
| 18 to 34 Years | 0 (0.0%) | 0 (0.0%) |
| 35 to 64 Years | 4 (19.1%) | 6 (12.8%) |
| 65 to 74 Years | 0 (0.0%) | 0 (0.0%) |
| 75 Years and over | 9 (60.0%) | 11 (50.0%) |
Disability Class: Ambulatory Difficulty
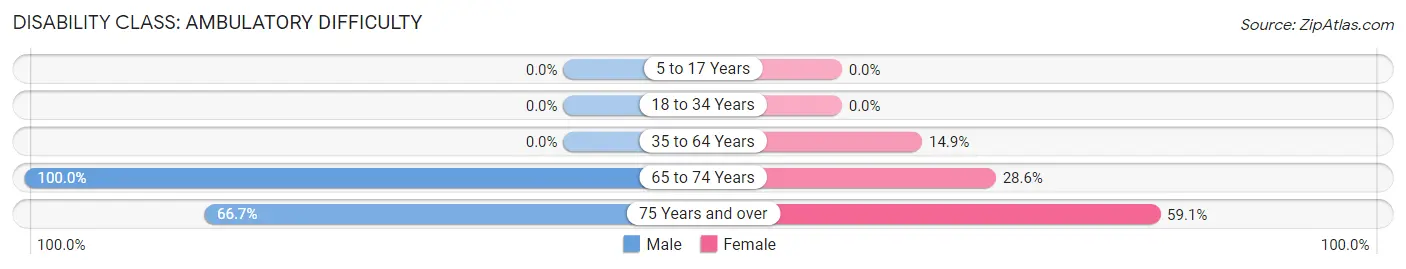
| Age Bracket | Male | Female |
| 5 to 17 Years | 0 (0.0%) | 0 (0.0%) |
| 18 to 34 Years | 0 (0.0%) | 0 (0.0%) |
| 35 to 64 Years | 0 (0.0%) | 7 (14.9%) |
| 65 to 74 Years | 9 (100.0%) | 4 (28.6%) |
| 75 Years and over | 10 (66.7%) | 13 (59.1%) |
Disability Class: Self-Care Difficulty
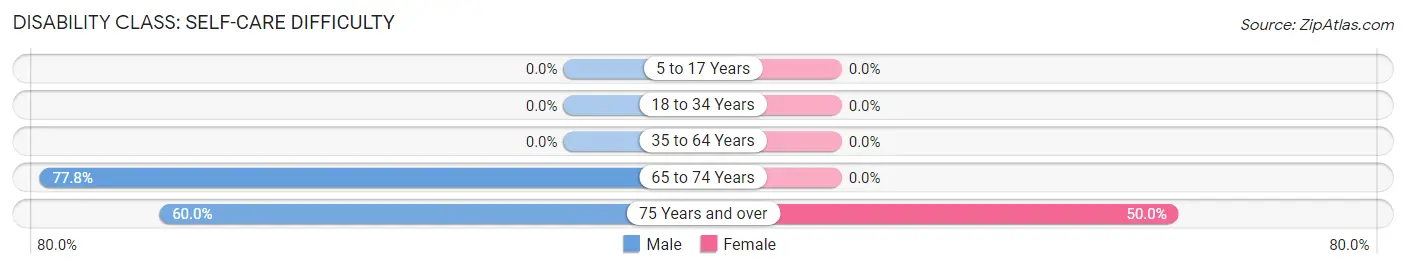
| Age Bracket | Male | Female |
| 5 to 17 Years | 0 (0.0%) | 0 (0.0%) |
| 18 to 34 Years | 0 (0.0%) | 0 (0.0%) |
| 35 to 64 Years | 0 (0.0%) | 0 (0.0%) |
| 65 to 74 Years | 7 (77.8%) | 0 (0.0%) |
| 75 Years and over | 9 (60.0%) | 11 (50.0%) |
Technology Access in Cromwell
Computing Device Access in Cromwell
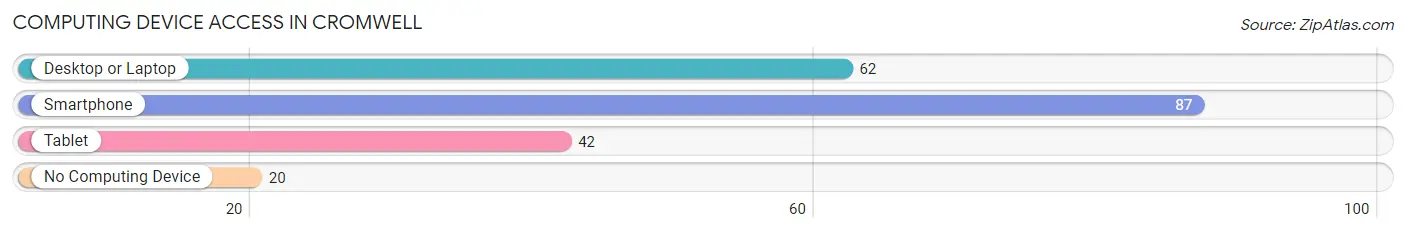
| Device Type | # Households | % Households |
| Desktop or Laptop | 62 | 52.5% |
| Smartphone | 87 | 73.7% |
| Tablet | 42 | 35.6% |
| No Computing Device | 20 | 17.0% |
| Total | 118 | 100.0% |
Internet Access in Cromwell
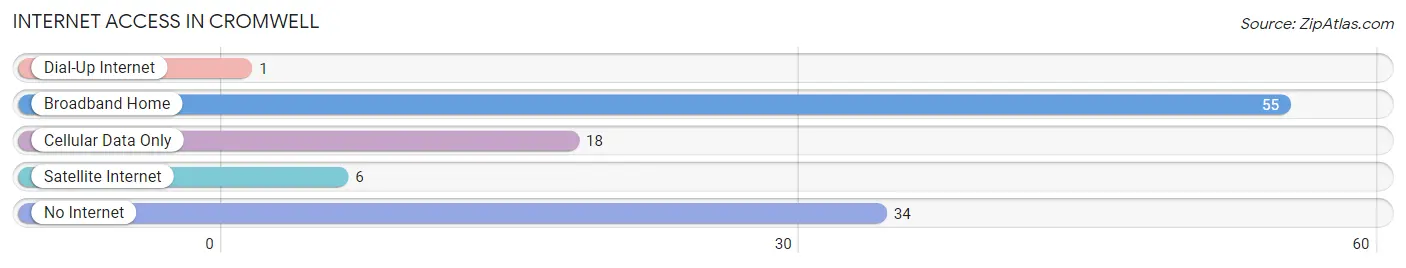
| Internet Type | # Households | % Households |
| Dial-Up Internet | 1 | 0.9% |
| Broadband Home | 55 | 46.6% |
| Cellular Data Only | 18 | 15.2% |
| Satellite Internet | 6 | 5.1% |
| No Internet | 34 | 28.8% |
| Total | 118 | 100.0% |
Cromwell Summary
Cromwell, Minnesota is a small town located in Carlton County, in the northeastern part of the state. It is situated on the banks of the St. Louis River, and is part of the Fond du Lac Indian Reservation. The town was founded in 1887, and has a population of approximately 1,000 people.
Geography
Cromwell is located in the northeastern part of Minnesota, in Carlton County. It is situated on the banks of the St. Louis River, and is part of the Fond du Lac Indian Reservation. The town is surrounded by forests and lakes, and is located about 25 miles from Duluth. The town is located at an elevation of 1,072 feet above sea level.
Economy
Cromwell’s economy is largely based on tourism and the timber industry. The town is home to several resorts and campgrounds, as well as a number of small businesses. The timber industry is also a major employer in the area, with several sawmills and logging companies operating in the area. The town is also home to a number of small manufacturing companies, including a furniture factory and a paper mill.
Demographics
As of the 2010 census, the population of Cromwell was 1,000 people. The racial makeup of the town was 94.2% White, 0.7% African American, 0.7% Native American, 0.3% Asian, 0.1% Pacific Islander, and 3.9% from two or more races. The median household income was $37,500, and the median family income was $45,000. The per capita income was $18,000.
History
Cromwell was founded in 1887 by a group of settlers from Wisconsin. The town was named after a local Native American chief, Chief Cromwell. The town was originally a logging and lumbering center, and the timber industry was the main source of income for the town. In the early 1900s, the town began to attract tourists, and several resorts and campgrounds were established in the area. The town was also home to a number of small manufacturing companies, including a furniture factory and a paper mill.
In the late 20th century, the timber industry began to decline, and the town’s economy shifted to tourism and small businesses. The town is now home to several resorts and campgrounds, as well as a number of small businesses. The town is also home to a number of small manufacturing companies, including a furniture factory and a paper mill.
Cromwell is a small town with a rich history and a vibrant economy. The town is home to a number of resorts and campgrounds, as well as a number of small businesses. The timber industry is still a major employer in the area, and the town is also home to a number of small manufacturing companies. The town has a population of approximately 1,000 people, and is a great place to visit or live.
Common Questions
What is Per Capita Income in Cromwell?
Per Capita income in Cromwell is $21,346.
What is the Median Family Income in Cromwell?
Median Family Income in Cromwell is $88,250.
What is the Median Household income in Cromwell?
Median Household Income in Cromwell is $49,583.
What is Income or Wage Gap in Cromwell?
Income or Wage Gap in Cromwell is 51.9%.
Women in Cromwell earn 48.1 cents for every dollar earned by a man.
What is Inequality or Gini Index in Cromwell?
Inequality or Gini Index in Cromwell is 0.40.
What is the Total Population of Cromwell?
Total Population of Cromwell is 366.
What is the Total Male Population of Cromwell?
Total Male Population of Cromwell is 159.
What is the Total Female Population of Cromwell?
Total Female Population of Cromwell is 207.
What is the Ratio of Males per 100 Females in Cromwell?
There are 76.81 Males per 100 Females in Cromwell.
What is the Ratio of Females per 100 Males in Cromwell?
There are 130.19 Females per 100 Males in Cromwell.
What is the Median Population Age in Cromwell?
Median Population Age in Cromwell is 34.2 Years.
What is the Average Family Size in Cromwell
Average Family Size in Cromwell is 4.3 People.
What is the Average Household Size in Cromwell
Average Household Size in Cromwell is 2.8 People.
How Large is the Labor Force in Cromwell?
There are 99 People in the Labor Forcein in Cromwell.
What is the Percentage of People in the Labor Force in Cromwell?
42.3% of People are in the Labor Force in Cromwell.