Coleraine, MN Map & Demographics
Coleraine Map
Coleraine Overview
$30,873
PER CAPITA INCOME
$71,458
AVG FAMILY INCOME
$65,221
AVG HOUSEHOLD INCOME
21.4%
WAGE / INCOME GAP [ % ]
78.6¢/ $1
WAGE / INCOME GAP [ $ ]
$10,128
FAMILY INCOME DEFICIT
0.40
INEQUALITY / GINI INDEX
1,865
TOTAL POPULATION
1,003
MALE POPULATION
862
FEMALE POPULATION
116.36
MALES / 100 FEMALES
85.94
FEMALES / 100 MALES
39.6
MEDIAN AGE
2.9
AVG FAMILY SIZE
2.7
AVG HOUSEHOLD SIZE
902
LABOR FORCE [ PEOPLE ]
62.4%
PERCENT IN LABOR FORCE
3.7%
UNEMPLOYMENT RATE
Coleraine Zip Codes
Coleraine Area Codes
Income in Coleraine
Income Overview in Coleraine
Per Capita Income in Coleraine is $30,873, while median incomes of families and households are $71,458 and $65,221 respectively.
| Characteristic | Number | Measure |
| Per Capita Income | 1,865 | $30,873 |
| Median Family Income | 535 | $71,458 |
| Mean Family Income | 535 | $82,690 |
| Median Household Income | 675 | $65,221 |
| Mean Household Income | 675 | $78,048 |
| Income Deficit | 535 | $10,128 |
| Wage / Income Gap (%) | 1,865 | 21.36% |
| Wage / Income Gap ($) | 1,865 | 78.64¢ per $1 |
| Gini / Inequality Index | 1,865 | 0.40 |
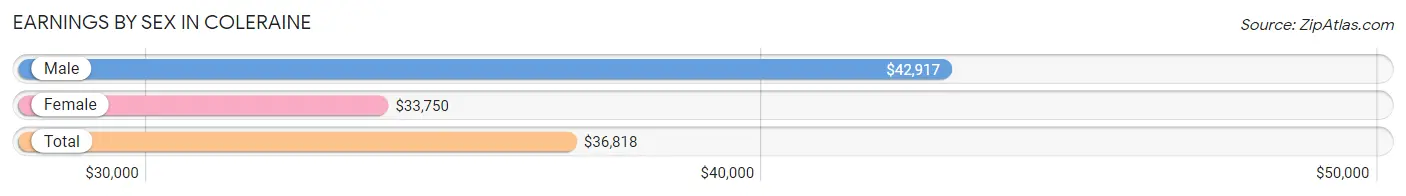
Earnings by Sex in Coleraine
Average Earnings in Coleraine are $36,818, $42,917 for men and $33,750 for women, a difference of 21.4%.
| Sex | Number | Average Earnings |
| Male | 534 (57.3%) | $42,917 |
| Female | 398 (42.7%) | $33,750 |
| Total | 932 (100.0%) | $36,818 |
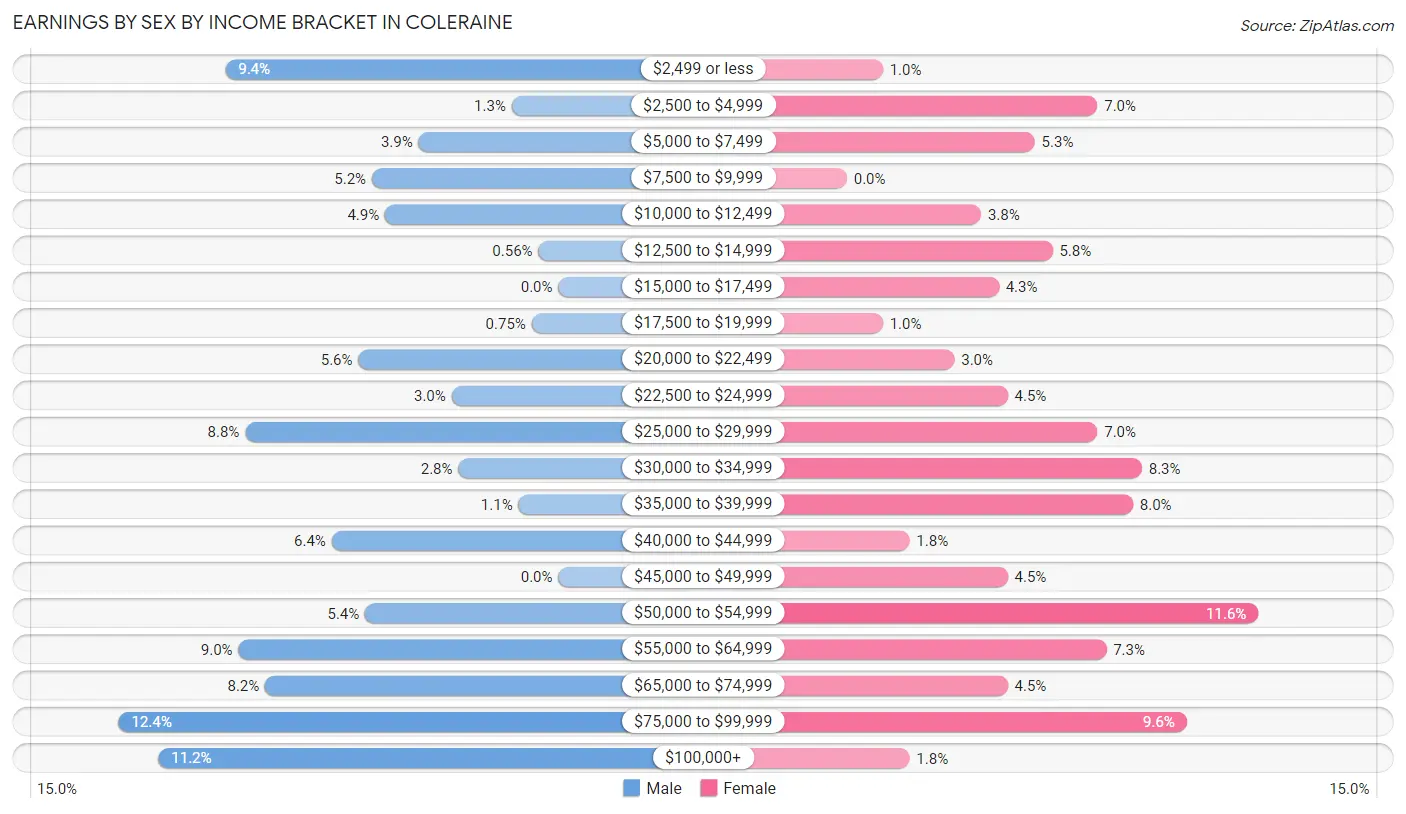
Earnings by Sex by Income Bracket in Coleraine
The most common earnings brackets in Coleraine are $75,000 to $99,999 for men (66 | 12.4%) and $50,000 to $54,999 for women (46 | 11.6%).
| Income | Male | Female |
| $2,499 or less | 50 (9.4%) | 4 (1.0%) |
| $2,500 to $4,999 | 7 (1.3%) | 28 (7.0%) |
| $5,000 to $7,499 | 21 (3.9%) | 21 (5.3%) |
| $7,500 to $9,999 | 28 (5.2%) | 0 (0.0%) |
| $10,000 to $12,499 | 26 (4.9%) | 15 (3.8%) |
| $12,500 to $14,999 | 3 (0.6%) | 23 (5.8%) |
| $15,000 to $17,499 | 0 (0.0%) | 17 (4.3%) |
| $17,500 to $19,999 | 4 (0.7%) | 4 (1.0%) |
| $20,000 to $22,499 | 30 (5.6%) | 12 (3.0%) |
| $22,500 to $24,999 | 16 (3.0%) | 18 (4.5%) |
| $25,000 to $29,999 | 47 (8.8%) | 28 (7.0%) |
| $30,000 to $34,999 | 15 (2.8%) | 33 (8.3%) |
| $35,000 to $39,999 | 6 (1.1%) | 32 (8.0%) |
| $40,000 to $44,999 | 34 (6.4%) | 7 (1.8%) |
| $45,000 to $49,999 | 0 (0.0%) | 18 (4.5%) |
| $50,000 to $54,999 | 29 (5.4%) | 46 (11.6%) |
| $55,000 to $64,999 | 48 (9.0%) | 29 (7.3%) |
| $65,000 to $74,999 | 44 (8.2%) | 18 (4.5%) |
| $75,000 to $99,999 | 66 (12.4%) | 38 (9.6%) |
| $100,000+ | 60 (11.2%) | 7 (1.8%) |
| Total | 534 (100.0%) | 398 (100.0%) |
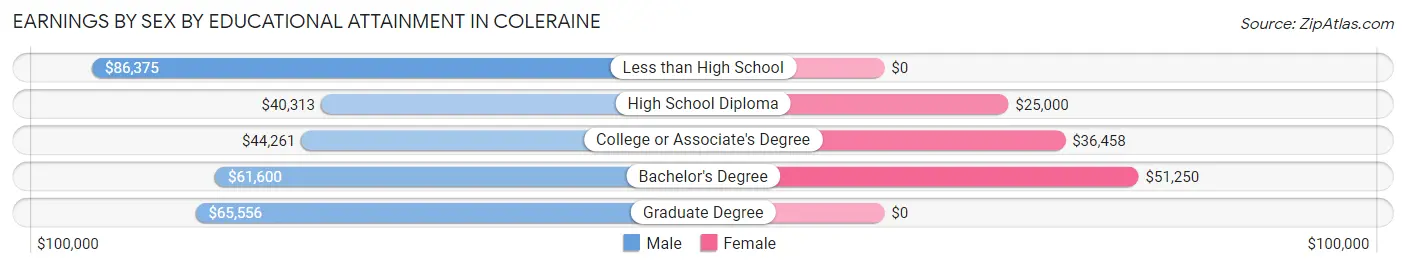
Earnings by Sex by Educational Attainment in Coleraine
Average earnings in Coleraine are $59,375 for men and $36,534 for women, a difference of 38.5%. Men with an educational attainment of less than high school enjoy the highest average annual earnings of $86,375, while those with high school diploma education earn the least with $40,313. Women with an educational attainment of bachelor's degree earn the most with the average annual earnings of $51,250, while those with high school diploma education have the smallest earnings of $25,000.
| Educational Attainment | Male Income | Female Income |
| Less than High School | $86,375 | $0 |
| High School Diploma | $40,313 | $25,000 |
| College or Associate's Degree | $44,261 | $36,458 |
| Bachelor's Degree | $61,600 | $51,250 |
| Graduate Degree | $65,556 | $0 |
| Total | $59,375 | $36,534 |
Family Income in Coleraine
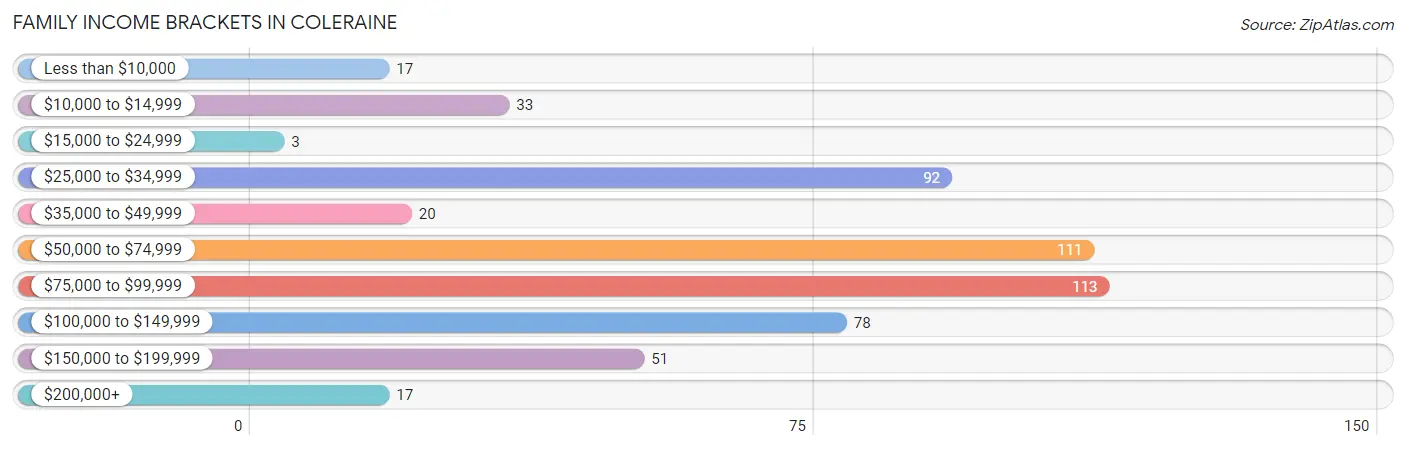
Family Income Brackets in Coleraine
According to the Coleraine family income data, there are 113 families falling into the $75,000 to $99,999 income range, which is the most common income bracket and makes up 21.1% of all families. Conversely, the $15,000 to $24,999 income bracket is the least frequent group with only 3 families (0.6%) belonging to this category.
| Income Bracket | # Families | % Families |
| Less than $10,000 | 17 | 3.2% |
| $10,000 to $14,999 | 33 | 6.2% |
| $15,000 to $24,999 | 3 | 0.6% |
| $25,000 to $34,999 | 92 | 17.2% |
| $35,000 to $49,999 | 20 | 3.7% |
| $50,000 to $74,999 | 111 | 20.7% |
| $75,000 to $99,999 | 113 | 21.1% |
| $100,000 to $149,999 | 78 | 14.6% |
| $150,000 to $199,999 | 51 | 9.5% |
| $200,000+ | 17 | 3.2% |
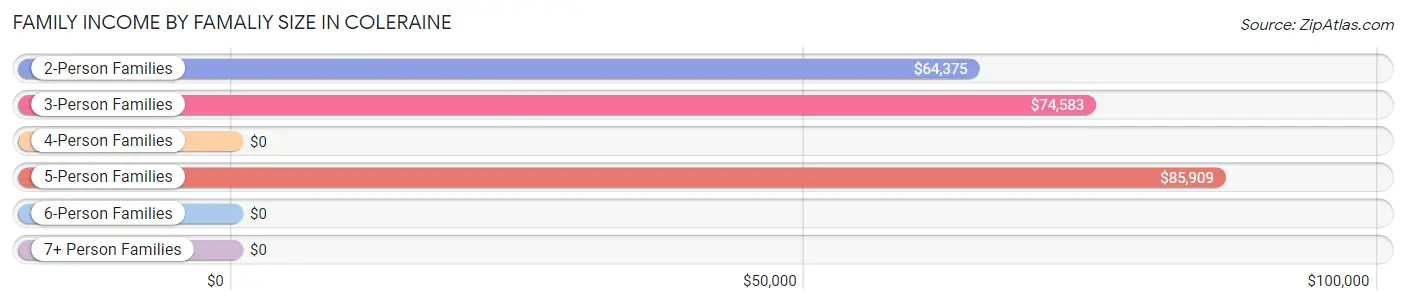
Family Income by Famaliy Size in Coleraine
5-person families (30 | 5.6%) account for the highest median family income in Coleraine with $85,909 per family, while 2-person families (287 | 53.6%) have the highest median income of $32,188 per family member.
| Income Bracket | # Families | Median Income |
| 2-Person Families | 287 (53.6%) | $64,375 |
| 3-Person Families | 155 (29.0%) | $74,583 |
| 4-Person Families | 57 (10.6%) | $0 |
| 5-Person Families | 30 (5.6%) | $85,909 |
| 6-Person Families | 6 (1.1%) | $0 |
| 7+ Person Families | 0 (0.0%) | $0 |
| Total | 535 (100.0%) | $71,458 |
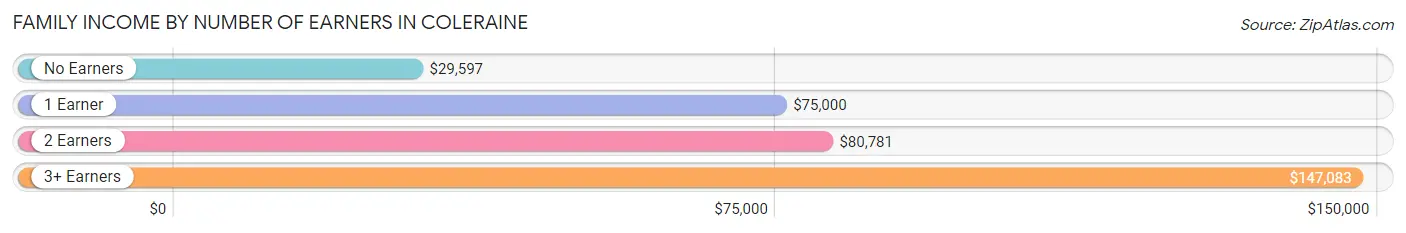
Family Income by Number of Earners in Coleraine
The median family income in Coleraine is $71,458, with families comprising 3+ earners (74) having the highest median family income of $147,083, while families with no earners (159) have the lowest median family income of $29,597, accounting for 13.8% and 29.7% of families, respectively.
| Number of Earners | # Families | Median Income |
| No Earners | 159 (29.7%) | $29,597 |
| 1 Earner | 152 (28.4%) | $75,000 |
| 2 Earners | 150 (28.0%) | $80,781 |
| 3+ Earners | 74 (13.8%) | $147,083 |
| Total | 535 (100.0%) | $71,458 |
Household Income in Coleraine
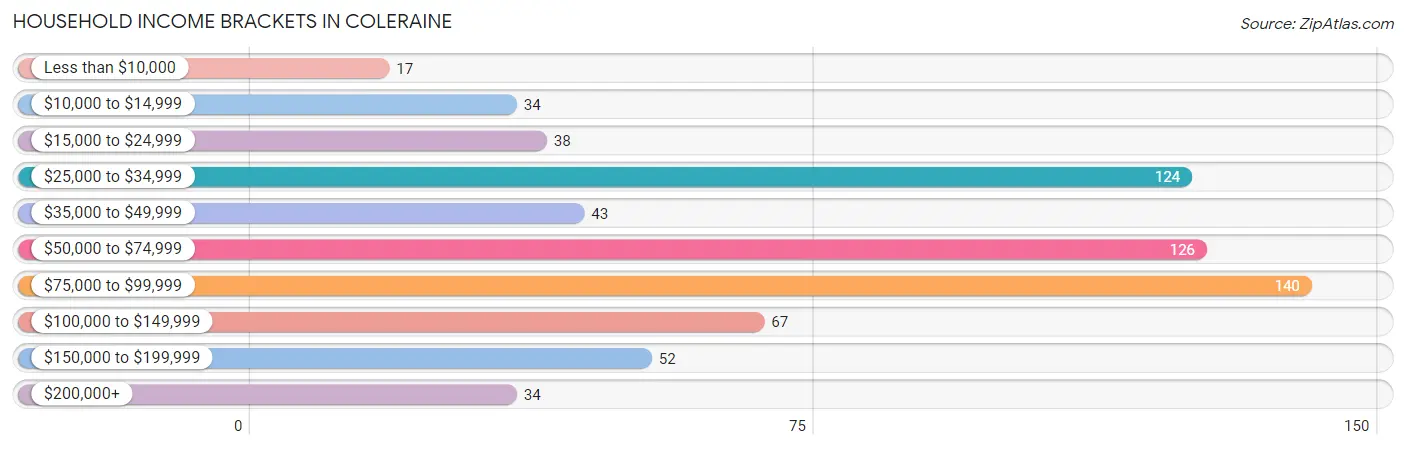
Household Income Brackets in Coleraine
With 140 households falling in the category, the $75,000 to $99,999 income range is the most frequent in Coleraine, accounting for 20.7% of all households. In contrast, only 17 households (2.5%) fall into the less than $10,000 income bracket, making it the least populous group.
| Income Bracket | # Households | % Households |
| Less than $10,000 | 17 | 2.5% |
| $10,000 to $14,999 | 34 | 5.0% |
| $15,000 to $24,999 | 38 | 5.6% |
| $25,000 to $34,999 | 124 | 18.4% |
| $35,000 to $49,999 | 43 | 6.4% |
| $50,000 to $74,999 | 126 | 18.7% |
| $75,000 to $99,999 | 140 | 20.7% |
| $100,000 to $149,999 | 67 | 9.9% |
| $150,000 to $199,999 | 52 | 7.7% |
| $200,000+ | 34 | 5.0% |
Household Income by Householder Age in Coleraine
The median household income in Coleraine is $65,221, with the highest median household income of $85,179 found in the 45 to 64 years age bracket for the primary householder. A total of 170 households (25.2%) fall into this category. Meanwhile, the 15 to 24 years age bracket for the primary householder has the lowest median household income of $0, with 13 households (1.9%) in this group.

| Income Bracket | # Households | Median Income |
| 15 to 24 Years | 13 (1.9%) | $0 |
| 25 to 44 Years | 254 (37.6%) | $73,636 |
| 45 to 64 Years | 170 (25.2%) | $85,179 |
| 65+ Years | 238 (35.3%) | $40,000 |
| Total | 675 (100.0%) | $65,221 |
Poverty in Coleraine
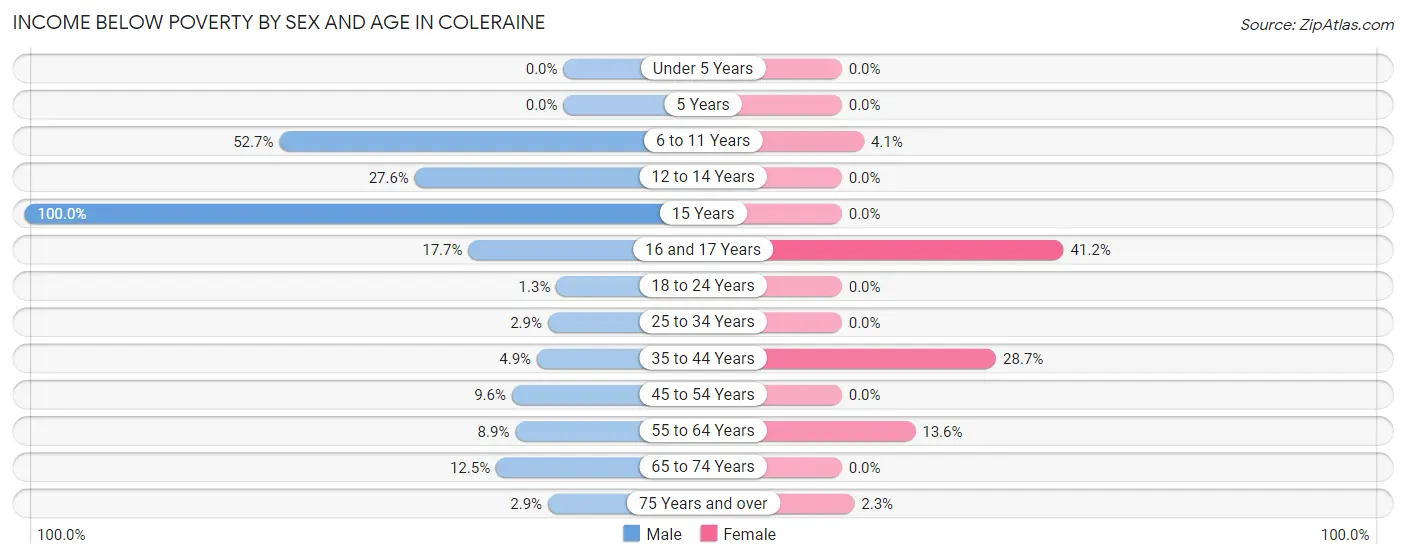
Income Below Poverty by Sex and Age in Coleraine
With 16.0% poverty level for males and 8.2% for females among the residents of Coleraine, 15 year old males and 16 and 17 year old females are the most vulnerable to poverty, with 19 males (100.0%) and 7 females (41.2%) in their respective age groups living below the poverty level.
| Age Bracket | Male | Female |
| Under 5 Years | 0 (0.0%) | 0 (0.0%) |
| 5 Years | 0 (0.0%) | 0 (0.0%) |
| 6 to 11 Years | 77 (52.7%) | 3 (4.1%) |
| 12 to 14 Years | 8 (27.6%) | 0 (0.0%) |
| 15 Years | 19 (100.0%) | 0 (0.0%) |
| 16 and 17 Years | 9 (17.6%) | 7 (41.2%) |
| 18 to 24 Years | 1 (1.3%) | 0 (0.0%) |
| 25 to 34 Years | 3 (2.9%) | 0 (0.0%) |
| 35 to 44 Years | 7 (4.9%) | 51 (28.6%) |
| 45 to 54 Years | 9 (9.6%) | 0 (0.0%) |
| 55 to 64 Years | 10 (8.9%) | 6 (13.6%) |
| 65 to 74 Years | 11 (12.5%) | 0 (0.0%) |
| 75 Years and over | 3 (2.9%) | 3 (2.3%) |
| Total | 157 (16.0%) | 70 (8.2%) |
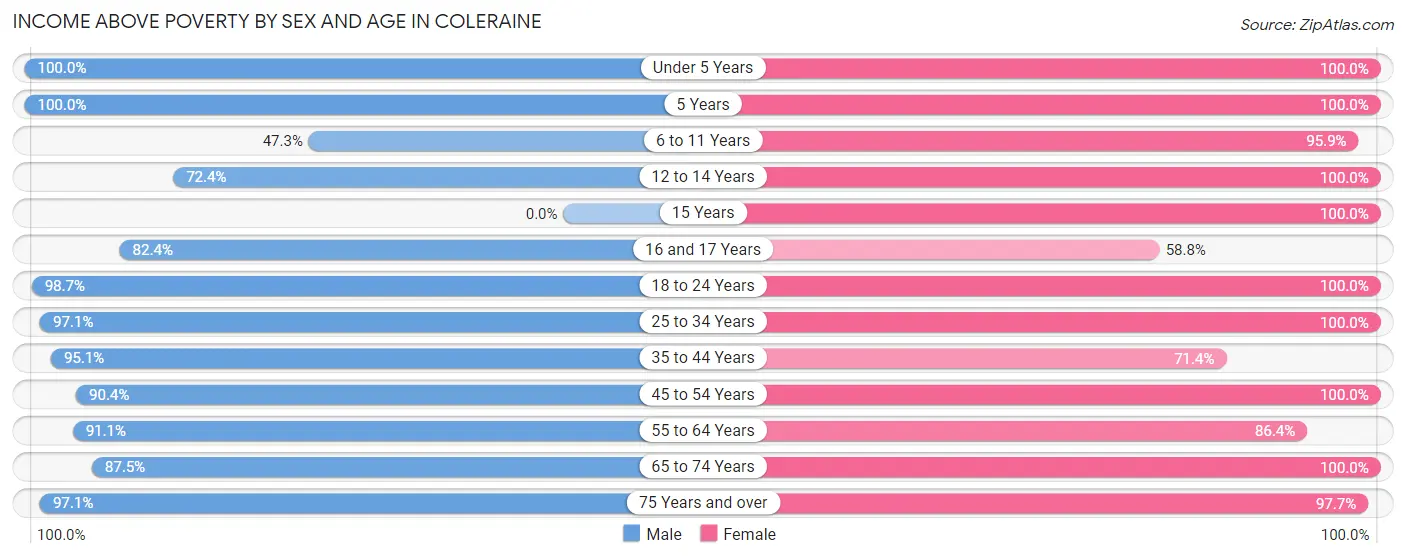
Income Above Poverty by Sex and Age in Coleraine
According to the poverty statistics in Coleraine, males aged under 5 years and females aged under 5 years are the age groups that are most secure financially, with 100.0% of males and 100.0% of females in these age groups living above the poverty line.
| Age Bracket | Male | Female |
| Under 5 Years | 11 (100.0%) | 53 (100.0%) |
| 5 Years | 3 (100.0%) | 9 (100.0%) |
| 6 to 11 Years | 69 (47.3%) | 70 (95.9%) |
| 12 to 14 Years | 21 (72.4%) | 38 (100.0%) |
| 15 Years | 0 (0.0%) | 4 (100.0%) |
| 16 and 17 Years | 42 (82.4%) | 10 (58.8%) |
| 18 to 24 Years | 75 (98.7%) | 74 (100.0%) |
| 25 to 34 Years | 101 (97.1%) | 64 (100.0%) |
| 35 to 44 Years | 136 (95.1%) | 127 (71.4%) |
| 45 to 54 Years | 85 (90.4%) | 74 (100.0%) |
| 55 to 64 Years | 102 (91.1%) | 38 (86.4%) |
| 65 to 74 Years | 77 (87.5%) | 93 (100.0%) |
| 75 Years and over | 102 (97.1%) | 126 (97.7%) |
| Total | 824 (84.0%) | 780 (91.8%) |
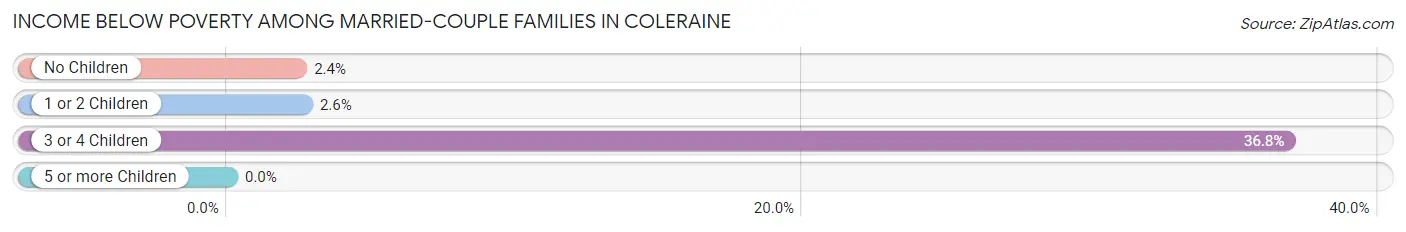
Income Below Poverty Among Married-Couple Families in Coleraine
The poverty statistics for married-couple families in Coleraine show that 4.2% or 16 of the total 383 families live below the poverty line. Families with 3 or 4 children have the highest poverty rate of 36.8%, comprising of 7 families. On the other hand, families with no children have the lowest poverty rate of 2.4%, which includes 6 families.
| Children | Above Poverty | Below Poverty |
| No Children | 243 (97.6%) | 6 (2.4%) |
| 1 or 2 Children | 112 (97.4%) | 3 (2.6%) |
| 3 or 4 Children | 12 (63.2%) | 7 (36.8%) |
| 5 or more Children | 0 (0.0%) | 0 (0.0%) |
| Total | 367 (95.8%) | 16 (4.2%) |
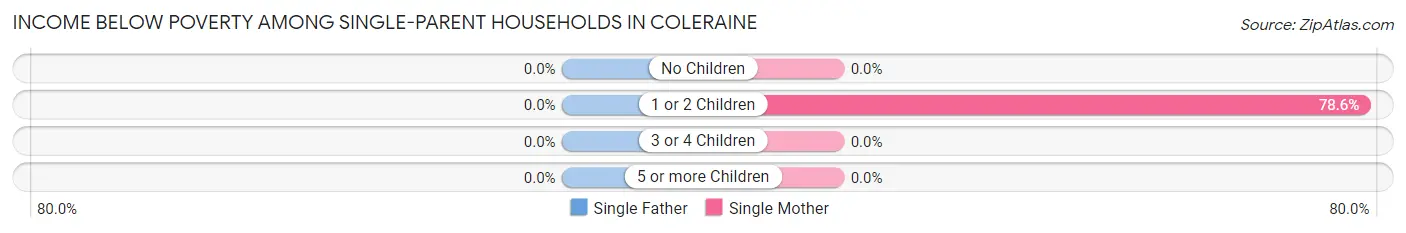
Income Below Poverty Among Single-Parent Households in Coleraine
| Children | Single Father | Single Mother |
| No Children | 0 (0.0%) | 0 (0.0%) |
| 1 or 2 Children | 0 (0.0%) | 44 (78.6%) |
| 3 or 4 Children | 0 (0.0%) | 0 (0.0%) |
| 5 or more Children | 0 (0.0%) | 0 (0.0%) |
| Total | 0 (0.0%) | 44 (55.0%) |
Income Below Poverty Among Married-Couple vs Single-Parent Households in Coleraine
The poverty data for Coleraine shows that 16 of the married-couple family households (4.2%) and 44 of the single-parent households (28.9%) are living below the poverty level. Within the married-couple family households, those with 3 or 4 children have the highest poverty rate, with 7 households (36.8%) falling below the poverty line. Among the single-parent households, those with 1 or 2 children have the highest poverty rate, with 44 household (54.3%) living below poverty.

| Children | Married-Couple Families | Single-Parent Households |
| No Children | 6 (2.4%) | 0 (0.0%) |
| 1 or 2 Children | 3 (2.6%) | 44 (54.3%) |
| 3 or 4 Children | 7 (36.8%) | 0 (0.0%) |
| 5 or more Children | 0 (0.0%) | 0 (0.0%) |
| Total | 16 (4.2%) | 44 (28.9%) |
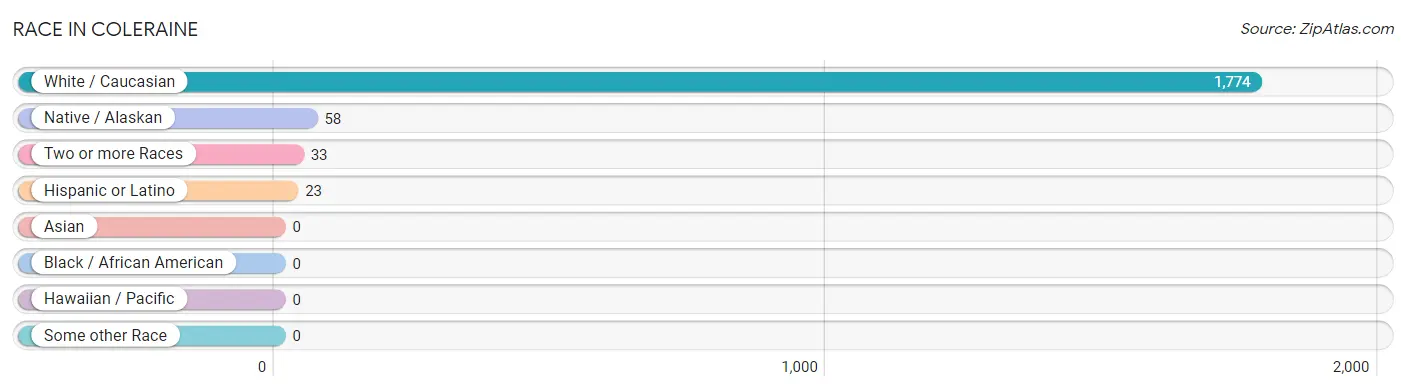
Race in Coleraine
The most populous races in Coleraine are White / Caucasian (1,774 | 95.1%), Native / Alaskan (58 | 3.1%), and Two or more Races (33 | 1.8%).
| Race | # Population | % Population |
| Asian | 0 | 0.0% |
| Black / African American | 0 | 0.0% |
| Hawaiian / Pacific | 0 | 0.0% |
| Hispanic or Latino | 23 | 1.2% |
| Native / Alaskan | 58 | 3.1% |
| White / Caucasian | 1,774 | 95.1% |
| Two or more Races | 33 | 1.8% |
| Some other Race | 0 | 0.0% |
| Total | 1,865 | 100.0% |
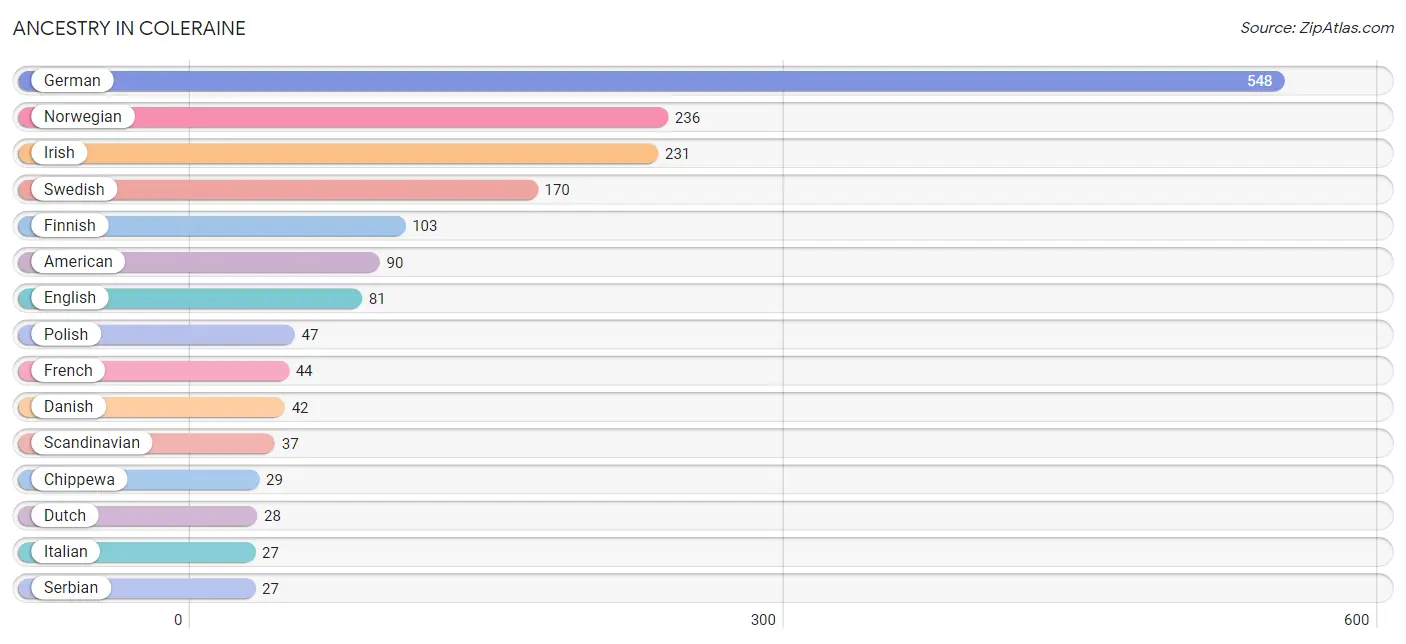
Ancestry in Coleraine
The most populous ancestries reported in Coleraine are German (548 | 29.4%), Norwegian (236 | 12.7%), Irish (231 | 12.4%), Swedish (170 | 9.1%), and Finnish (103 | 5.5%), together accounting for 69.1% of all Coleraine residents.
| Ancestry | # Population | % Population |
| American | 90 | 4.8% |
| Armenian | 7 | 0.4% |
| Australian | 3 | 0.2% |
| Austrian | 4 | 0.2% |
| Chippewa | 29 | 1.5% |
| Danish | 42 | 2.2% |
| Dutch | 28 | 1.5% |
| English | 81 | 4.3% |
| European | 11 | 0.6% |
| Finnish | 103 | 5.5% |
| French | 44 | 2.4% |
| German | 548 | 29.4% |
| Irish | 231 | 12.4% |
| Italian | 27 | 1.5% |
| Mexican | 23 | 1.2% |
| Norwegian | 236 | 12.7% |
| Polish | 47 | 2.5% |
| Scandinavian | 37 | 2.0% |
| Scottish | 23 | 1.2% |
| Serbian | 27 | 1.5% |
| Shoshone | 23 | 1.2% |
| Swedish | 170 | 9.1% |
| Ukrainian | 9 | 0.5% |
| Welsh | 6 | 0.3% |
| Yugoslavian | 4 | 0.2% | View All 25 Rows |
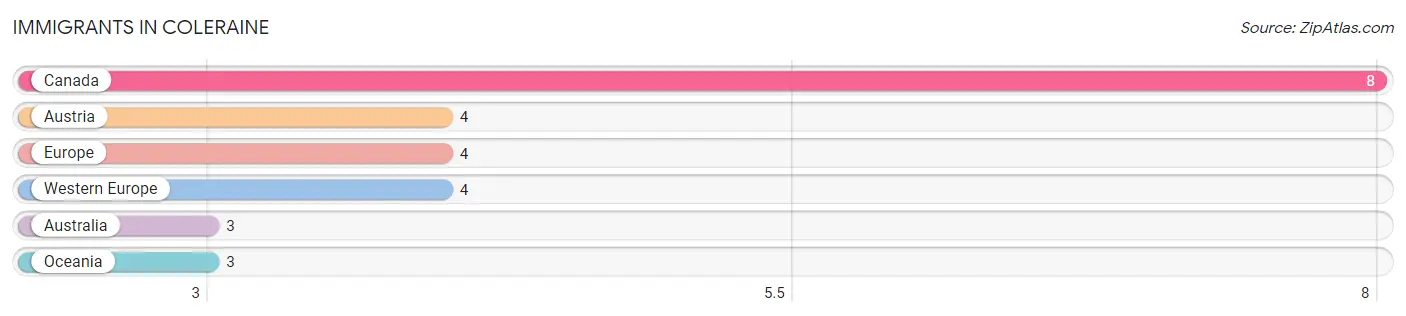
Immigrants in Coleraine
The most numerous immigrant groups reported in Coleraine came from Canada (8 | 0.4%), Austria (4 | 0.2%), Europe (4 | 0.2%), Western Europe (4 | 0.2%), and Australia (3 | 0.2%), together accounting for 1.2% of all Coleraine residents.
| Immigration Origin | # Population | % Population |
| Australia | 3 | 0.2% |
| Austria | 4 | 0.2% |
| Canada | 8 | 0.4% |
| Europe | 4 | 0.2% |
| Oceania | 3 | 0.2% |
| Western Europe | 4 | 0.2% | View All 6 Rows |
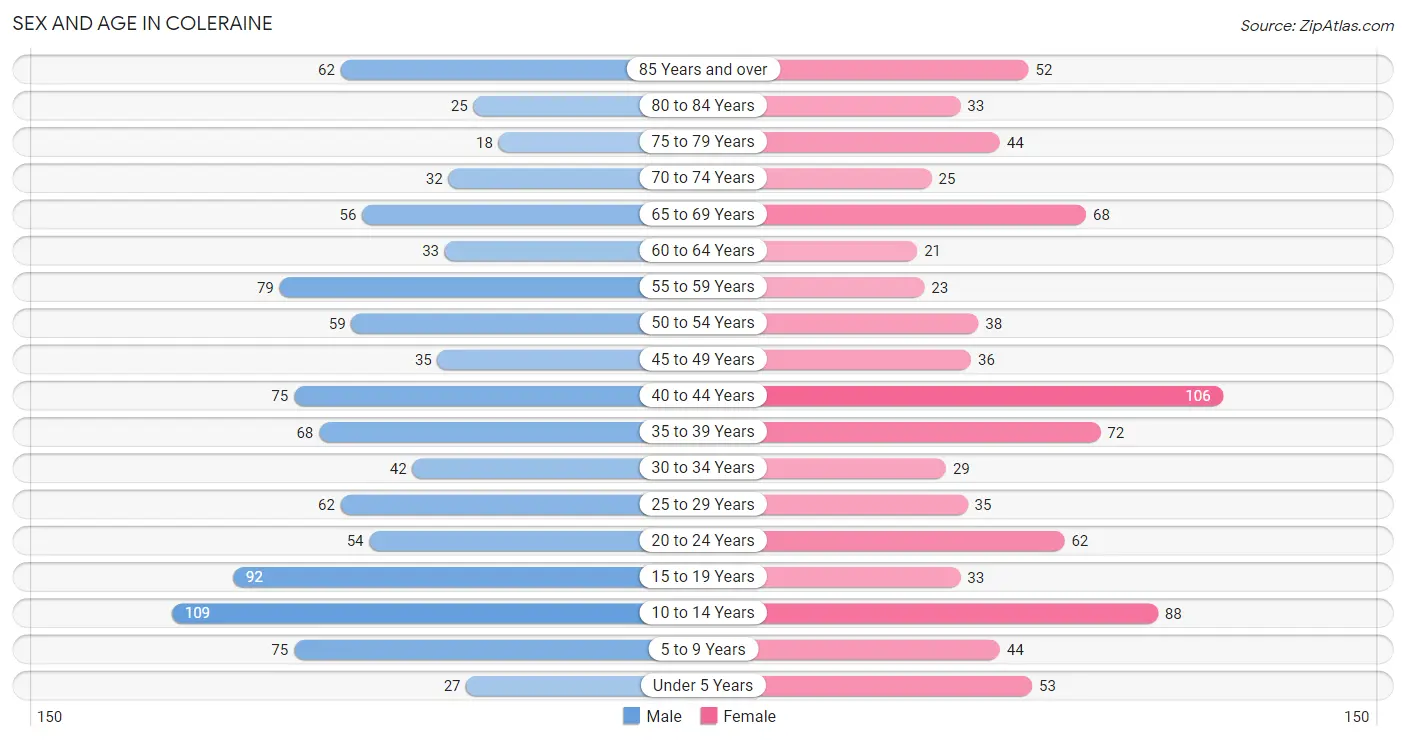
Sex and Age in Coleraine
Sex and Age in Coleraine
The most populous age groups in Coleraine are 10 to 14 Years (109 | 10.9%) for men and 40 to 44 Years (106 | 12.3%) for women.
| Age Bracket | Male | Female |
| Under 5 Years | 27 (2.7%) | 53 (6.1%) |
| 5 to 9 Years | 75 (7.5%) | 44 (5.1%) |
| 10 to 14 Years | 109 (10.9%) | 88 (10.2%) |
| 15 to 19 Years | 92 (9.2%) | 33 (3.8%) |
| 20 to 24 Years | 54 (5.4%) | 62 (7.2%) |
| 25 to 29 Years | 62 (6.2%) | 35 (4.1%) |
| 30 to 34 Years | 42 (4.2%) | 29 (3.4%) |
| 35 to 39 Years | 68 (6.8%) | 72 (8.4%) |
| 40 to 44 Years | 75 (7.5%) | 106 (12.3%) |
| 45 to 49 Years | 35 (3.5%) | 36 (4.2%) |
| 50 to 54 Years | 59 (5.9%) | 38 (4.4%) |
| 55 to 59 Years | 79 (7.9%) | 23 (2.7%) |
| 60 to 64 Years | 33 (3.3%) | 21 (2.4%) |
| 65 to 69 Years | 56 (5.6%) | 68 (7.9%) |
| 70 to 74 Years | 32 (3.2%) | 25 (2.9%) |
| 75 to 79 Years | 18 (1.8%) | 44 (5.1%) |
| 80 to 84 Years | 25 (2.5%) | 33 (3.8%) |
| 85 Years and over | 62 (6.2%) | 52 (6.0%) |
| Total | 1,003 (100.0%) | 862 (100.0%) |
Families and Households in Coleraine
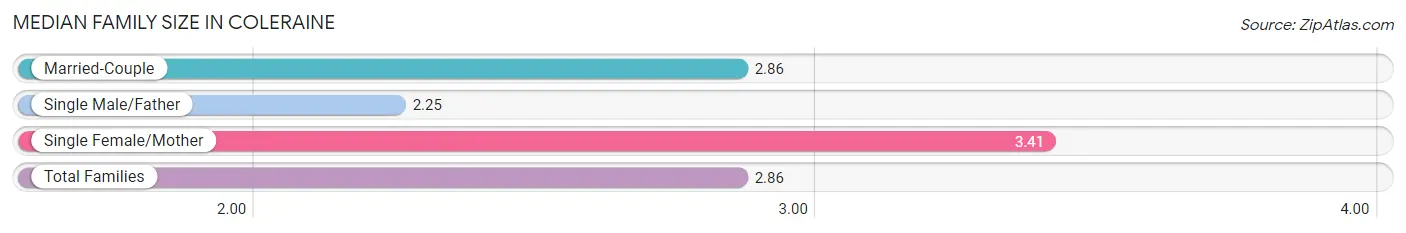
Median Family Size in Coleraine
The median family size in Coleraine is 2.86 persons per family, with single female/mother families (80 | 14.9%) accounting for the largest median family size of 3.41 persons per family. On the other hand, single male/father families (72 | 13.5%) represent the smallest median family size with 2.25 persons per family.
| Family Type | # Families | Family Size |
| Married-Couple | 383 (71.6%) | 2.86 |
| Single Male/Father | 72 (13.5%) | 2.25 |
| Single Female/Mother | 80 (14.9%) | 3.41 |
| Total Families | 535 (100.0%) | 2.86 |
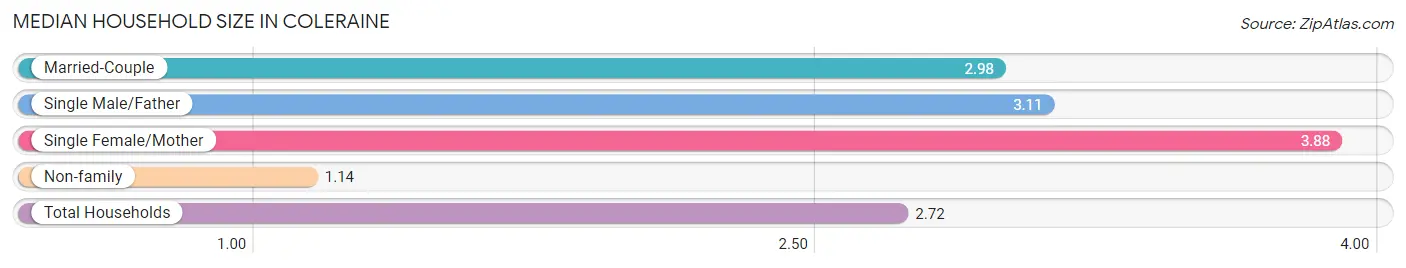
Median Household Size in Coleraine
The median household size in Coleraine is 2.72 persons per household, with single female/mother households (80 | 11.8%) accounting for the largest median household size of 3.88 persons per household. non-family households (140 | 20.7%) represent the smallest median household size with 1.14 persons per household.
| Household Type | # Households | Household Size |
| Married-Couple | 383 (56.7%) | 2.98 |
| Single Male/Father | 72 (10.7%) | 3.11 |
| Single Female/Mother | 80 (11.8%) | 3.88 |
| Non-family | 140 (20.7%) | 1.14 |
| Total Households | 675 (100.0%) | 2.72 |
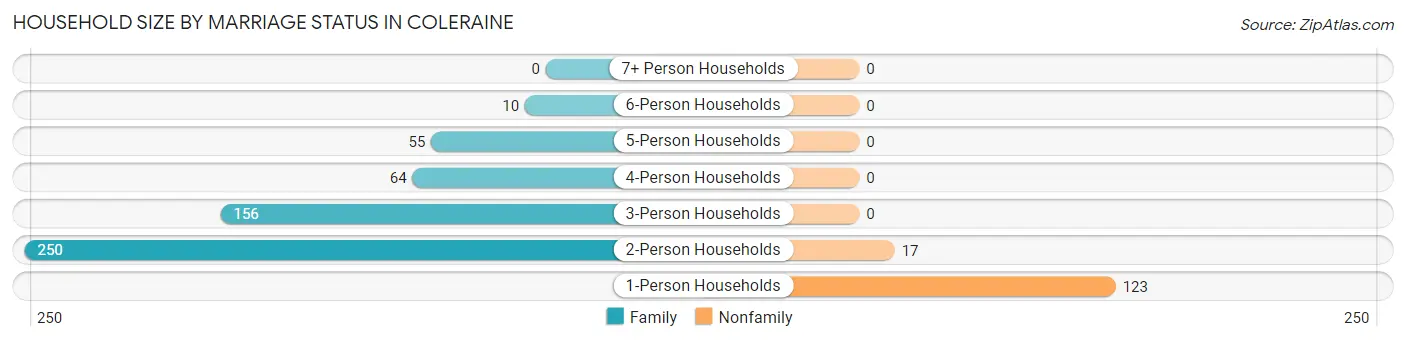
Household Size by Marriage Status in Coleraine
Out of a total of 675 households in Coleraine, 535 (79.3%) are family households, while 140 (20.7%) are nonfamily households. The most numerous type of family households are 2-person households, comprising 250, and the most common type of nonfamily households are 1-person households, comprising 123.
| Household Size | Family Households | Nonfamily Households |
| 1-Person Households | - | 123 (18.2%) |
| 2-Person Households | 250 (37.0%) | 17 (2.5%) |
| 3-Person Households | 156 (23.1%) | 0 (0.0%) |
| 4-Person Households | 64 (9.5%) | 0 (0.0%) |
| 5-Person Households | 55 (8.2%) | 0 (0.0%) |
| 6-Person Households | 10 (1.5%) | 0 (0.0%) |
| 7+ Person Households | 0 (0.0%) | 0 (0.0%) |
| Total | 535 (79.3%) | 140 (20.7%) |
Female Fertility in Coleraine
Fertility by Age in Coleraine
| Age Bracket | Women with Births | Births / 1,000 Women |
| 15 to 19 years | 0 (0.0%) | 0.0 |
| 20 to 34 years | 0 (0.0%) | 0.0 |
| 35 to 50 years | 0 (0.0%) | 0.0 |
| Total | 0 (0.0%) | 0.0 |
Fertility by Age by Marriage Status in Coleraine
| Age Bracket | Married | Unmarried |
| 15 to 19 years | 0 (0.0%) | 0 (0.0%) |
| 20 to 34 years | 0 (0.0%) | 0 (0.0%) |
| 35 to 50 years | 0 (0.0%) | 0 (0.0%) |
| Total | 0 (0.0%) | 0 (0.0%) |
Fertility by Education in Coleraine
| Educational Attainment | Women with Births | Births / 1,000 Women |
| Less than High School | 0 (0.0%) | 0.0 |
| High School Diploma | 0 (0.0%) | 0.0 |
| College or Associate's Degree | 0 (0.0%) | 0.0 |
| Bachelor's Degree | 0 (0.0%) | 0.0 |
| Graduate Degree | 0 (0.0%) | 0.0 |
| Total | 0 (0.0%) | 0.0 |
Fertility by Education by Marriage Status in Coleraine
| Educational Attainment | Married | Unmarried |
| Less than High School | 0 (0.0%) | 0 (0.0%) |
| High School Diploma | 0 (0.0%) | 0 (0.0%) |
| College or Associate's Degree | 0 (0.0%) | 0 (0.0%) |
| Bachelor's Degree | 0 (0.0%) | 0 (0.0%) |
| Graduate Degree | 0 (0.0%) | 0 (0.0%) |
| Total | 0 (0.0%) | 0 (0.0%) |
Employment Characteristics in Coleraine
Employment by Class of Employer in Coleraine
Among the 824 employed individuals in Coleraine, private company employees (491 | 59.6%), not-for-profit organizations (92 | 11.2%), and local government employees (73 | 8.9%) make up the most common classes of employment.
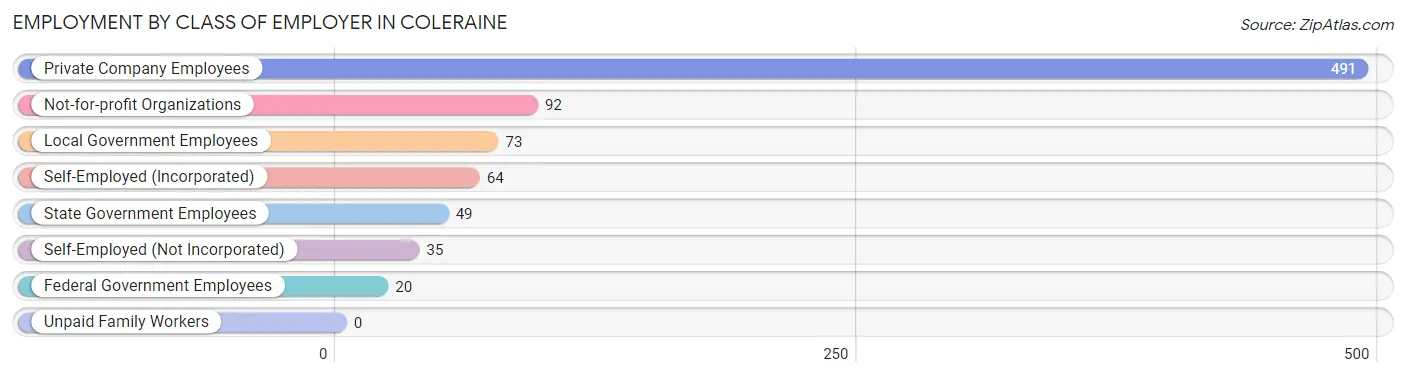
| Employer Class | # Employees | % Employees |
| Private Company Employees | 491 | 59.6% |
| Self-Employed (Incorporated) | 64 | 7.8% |
| Self-Employed (Not Incorporated) | 35 | 4.3% |
| Not-for-profit Organizations | 92 | 11.2% |
| Local Government Employees | 73 | 8.9% |
| State Government Employees | 49 | 5.9% |
| Federal Government Employees | 20 | 2.4% |
| Unpaid Family Workers | 0 | 0.0% |
| Total | 824 | 100.0% |
Employment Status by Age in Coleraine
According to the labor force statistics for Coleraine, out of the total population over 16 years of age (1,446), 62.4% or 902 individuals are in the labor force, with 3.7% or 33 of them unemployed. The age group with the highest labor force participation rate is 20 to 24 years, with 99.1% or 115 individuals in the labor force. Within the labor force, the 25 to 29 years age range has the highest percentage of unemployed individuals, with 19.3% or 16 of them being unemployed.
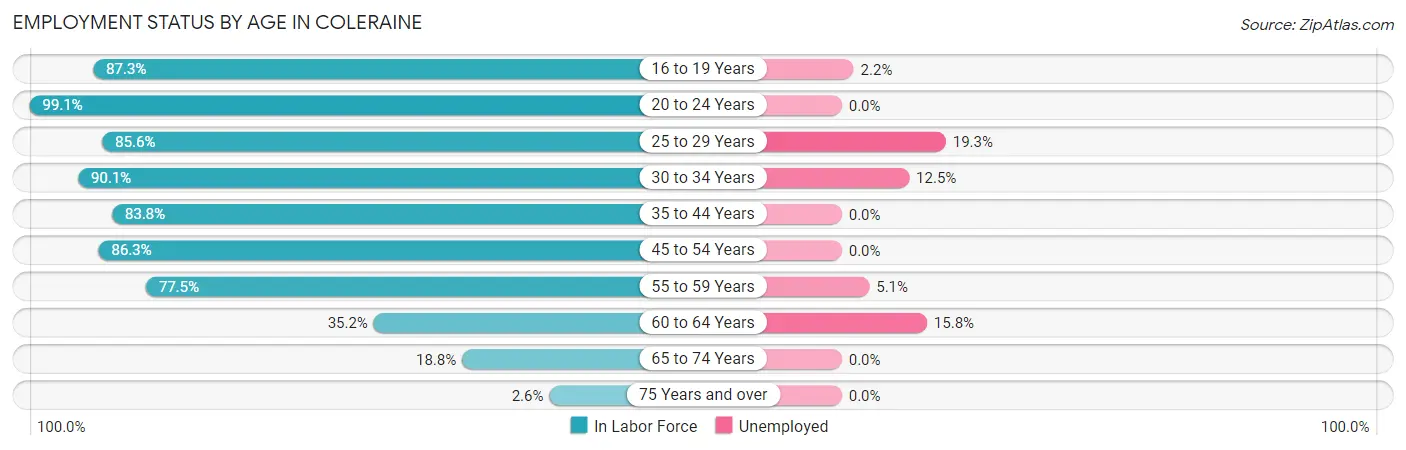
| Age Bracket | In Labor Force | Unemployed |
| 16 to 19 Years | 89 (87.3%) | 2 (2.2%) |
| 20 to 24 Years | 115 (99.1%) | 0 (0.0%) |
| 25 to 29 Years | 83 (85.6%) | 16 (19.3%) |
| 30 to 34 Years | 64 (90.1%) | 8 (12.5%) |
| 35 to 44 Years | 269 (83.8%) | 0 (0.0%) |
| 45 to 54 Years | 145 (86.3%) | 0 (0.0%) |
| 55 to 59 Years | 79 (77.5%) | 4 (5.1%) |
| 60 to 64 Years | 19 (35.2%) | 3 (15.8%) |
| 65 to 74 Years | 34 (18.8%) | 0 (0.0%) |
| 75 Years and over | 6 (2.6%) | 0 (0.0%) |
| Total | 902 (62.4%) | 33 (3.7%) |
Employment Status by Educational Attainment in Coleraine
According to labor force statistics for Coleraine, 81.1% of individuals (659) out of the total population between 25 and 64 years of age (813) are in the labor force, with 4.7% or 31 of them being unemployed. The group with the highest labor force participation rate are those with the educational attainment of bachelor's degree or higher, with 83.0% or 185 individuals in the labor force. Within the labor force, individuals with college / associate degree education have the highest percentage of unemployment, with 7.8% or 24 of them being unemployed.
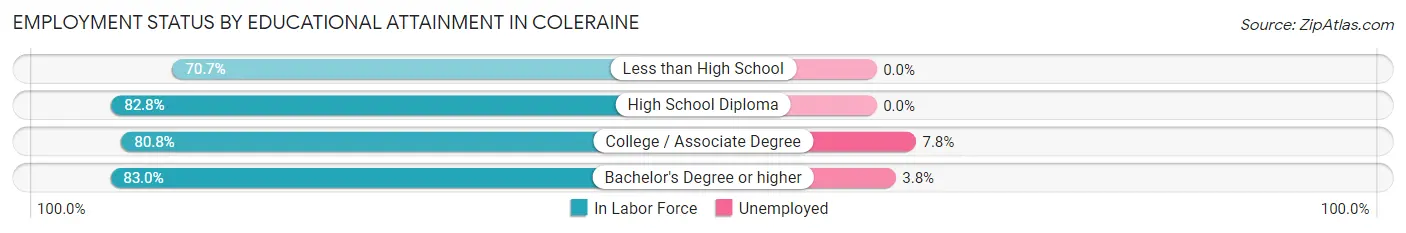
| Educational Attainment | In Labor Force | Unemployed |
| Less than High School | 41 (70.7%) | 0 (0.0%) |
| High School Diploma | 125 (82.8%) | 0 (0.0%) |
| College / Associate Degree | 308 (80.8%) | 30 (7.8%) |
| Bachelor's Degree or higher | 185 (83.0%) | 8 (3.8%) |
| Total | 659 (81.1%) | 38 (4.7%) |
Employment Occupations by Sex in Coleraine
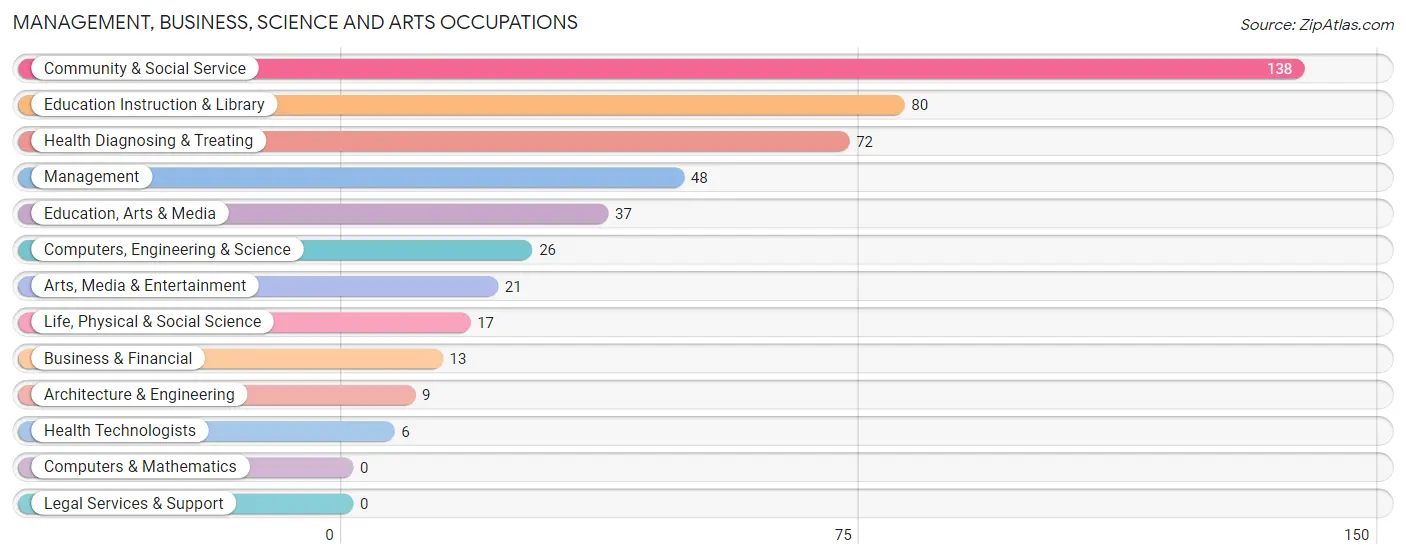
Management, Business, Science and Arts Occupations
The most common Management, Business, Science and Arts occupations in Coleraine are Community & Social Service (138 | 15.9%), Education Instruction & Library (80 | 9.2%), Health Diagnosing & Treating (72 | 8.3%), Management (48 | 5.5%), and Education, Arts & Media (37 | 4.3%).
Management, Business, Science and Arts Occupations by Sex
Within the Management, Business, Science and Arts occupations in Coleraine, the most male-oriented occupations are Computers, Engineering & Science (100.0%), Architecture & Engineering (100.0%), and Life, Physical & Social Science (100.0%), while the most female-oriented occupations are Health Technologists (100.0%), Education Instruction & Library (80.0%), and Health Diagnosing & Treating (79.2%).
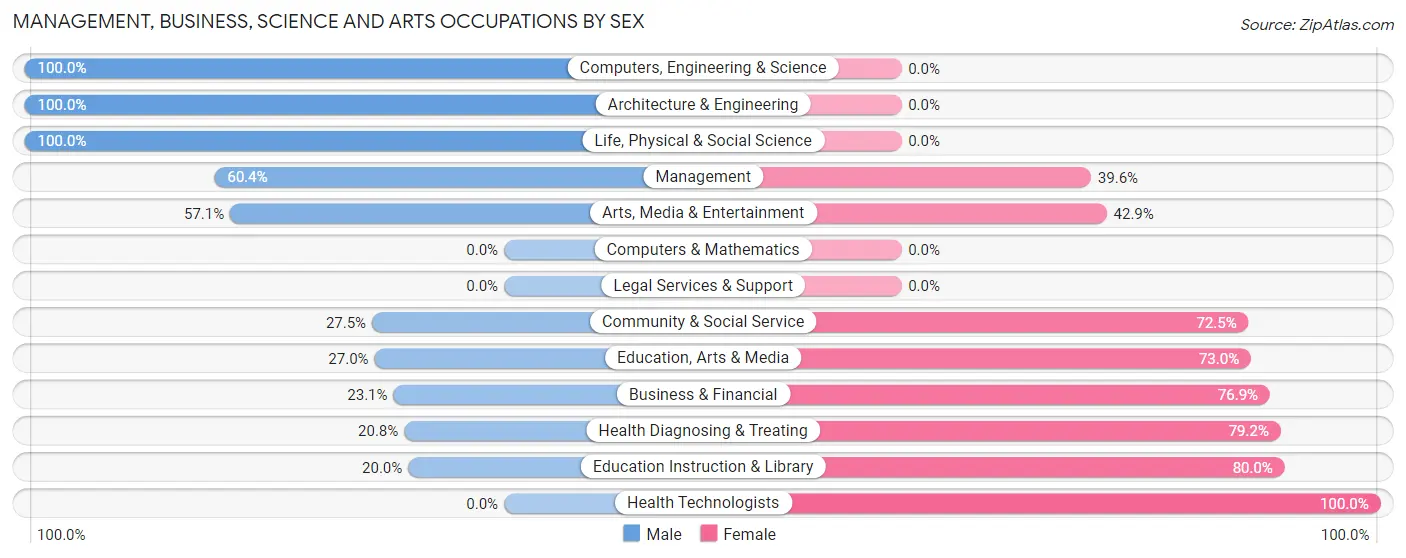
| Occupation | Male | Female |
| Management | 29 (60.4%) | 19 (39.6%) |
| Business & Financial | 3 (23.1%) | 10 (76.9%) |
| Computers, Engineering & Science | 26 (100.0%) | 0 (0.0%) |
| Computers & Mathematics | 0 (0.0%) | 0 (0.0%) |
| Architecture & Engineering | 9 (100.0%) | 0 (0.0%) |
| Life, Physical & Social Science | 17 (100.0%) | 0 (0.0%) |
| Community & Social Service | 38 (27.5%) | 100 (72.5%) |
| Education, Arts & Media | 10 (27.0%) | 27 (73.0%) |
| Legal Services & Support | 0 (0.0%) | 0 (0.0%) |
| Education Instruction & Library | 16 (20.0%) | 64 (80.0%) |
| Arts, Media & Entertainment | 12 (57.1%) | 9 (42.9%) |
| Health Diagnosing & Treating | 15 (20.8%) | 57 (79.2%) |
| Health Technologists | 0 (0.0%) | 6 (100.0%) |
| Total (Category) | 111 (37.4%) | 186 (62.6%) |
| Total (Overall) | 473 (54.6%) | 393 (45.4%) |
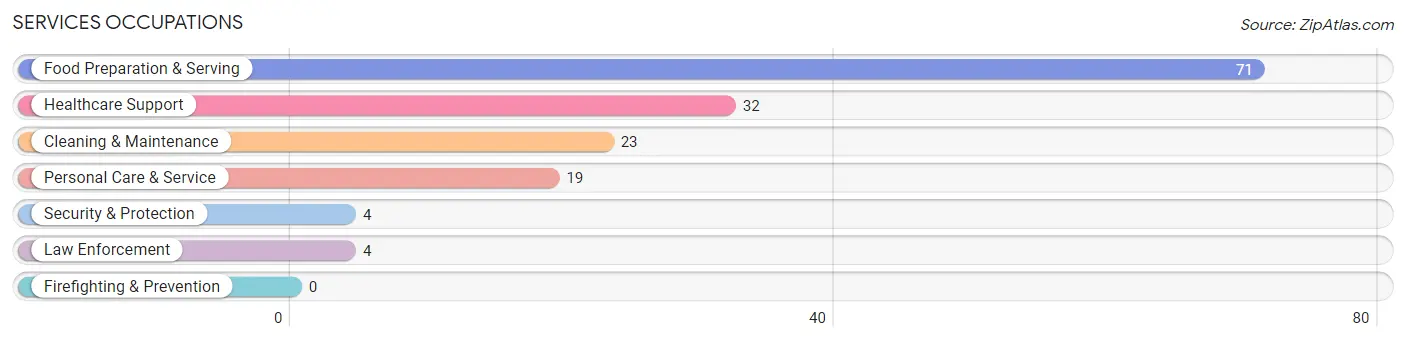
Services Occupations
The most common Services occupations in Coleraine are Food Preparation & Serving (71 | 8.2%), Healthcare Support (32 | 3.7%), Cleaning & Maintenance (23 | 2.7%), Personal Care & Service (19 | 2.2%), and Security & Protection (4 | 0.5%).
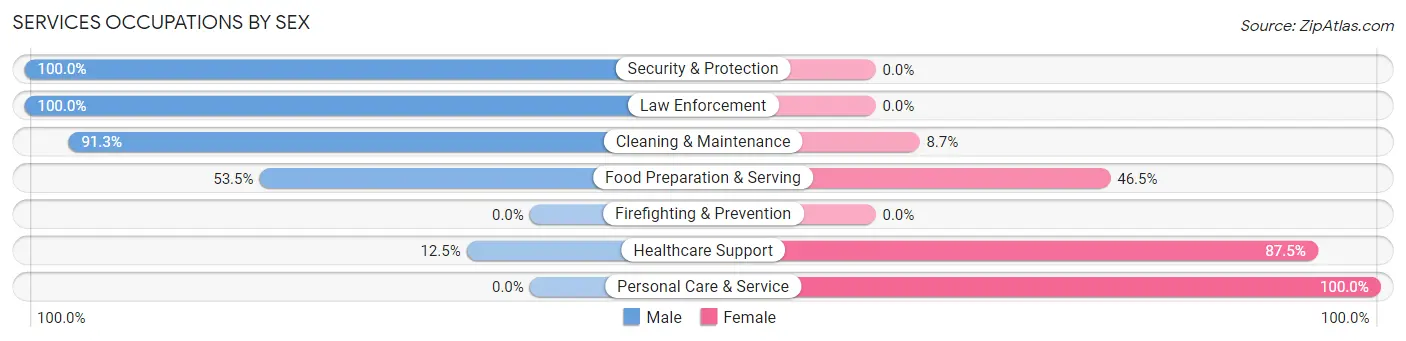
Services Occupations by Sex
Within the Services occupations in Coleraine, the most male-oriented occupations are Security & Protection (100.0%), Law Enforcement (100.0%), and Cleaning & Maintenance (91.3%), while the most female-oriented occupations are Personal Care & Service (100.0%), Healthcare Support (87.5%), and Food Preparation & Serving (46.5%).
| Occupation | Male | Female |
| Healthcare Support | 4 (12.5%) | 28 (87.5%) |
| Security & Protection | 4 (100.0%) | 0 (0.0%) |
| Firefighting & Prevention | 0 (0.0%) | 0 (0.0%) |
| Law Enforcement | 4 (100.0%) | 0 (0.0%) |
| Food Preparation & Serving | 38 (53.5%) | 33 (46.5%) |
| Cleaning & Maintenance | 21 (91.3%) | 2 (8.7%) |
| Personal Care & Service | 0 (0.0%) | 19 (100.0%) |
| Total (Category) | 67 (45.0%) | 82 (55.0%) |
| Total (Overall) | 473 (54.6%) | 393 (45.4%) |
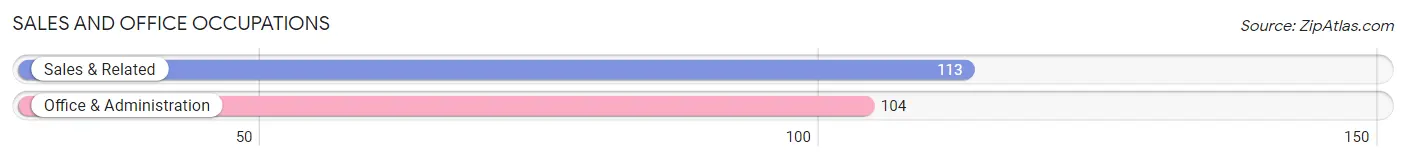
Sales and Office Occupations
The most common Sales and Office occupations in Coleraine are Sales & Related (113 | 13.1%), and Office & Administration (104 | 12.0%).
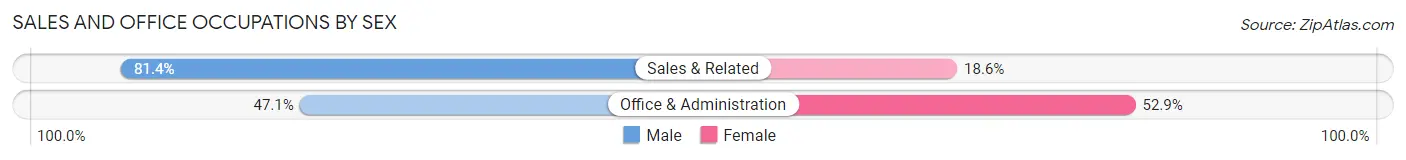
Sales and Office Occupations by Sex
| Occupation | Male | Female |
| Sales & Related | 92 (81.4%) | 21 (18.6%) |
| Office & Administration | 49 (47.1%) | 55 (52.9%) |
| Total (Category) | 141 (65.0%) | 76 (35.0%) |
| Total (Overall) | 473 (54.6%) | 393 (45.4%) |
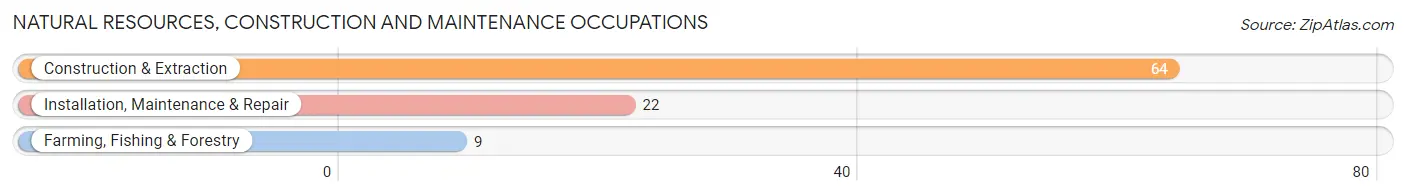
Natural Resources, Construction and Maintenance Occupations
The most common Natural Resources, Construction and Maintenance occupations in Coleraine are Construction & Extraction (64 | 7.4%), Installation, Maintenance & Repair (22 | 2.5%), and Farming, Fishing & Forestry (9 | 1.0%).
Natural Resources, Construction and Maintenance Occupations by Sex
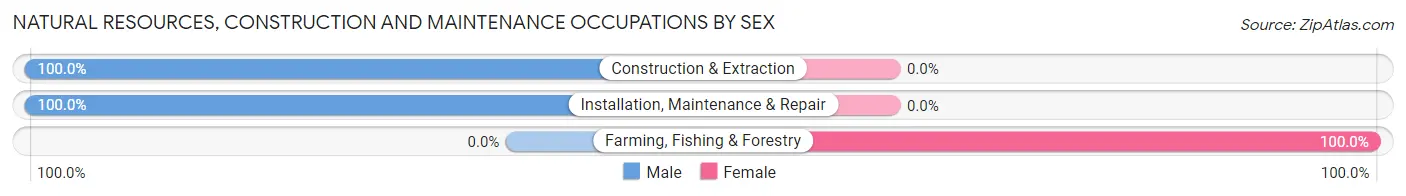
| Occupation | Male | Female |
| Farming, Fishing & Forestry | 0 (0.0%) | 9 (100.0%) |
| Construction & Extraction | 64 (100.0%) | 0 (0.0%) |
| Installation, Maintenance & Repair | 22 (100.0%) | 0 (0.0%) |
| Total (Category) | 86 (90.5%) | 9 (9.5%) |
| Total (Overall) | 473 (54.6%) | 393 (45.4%) |
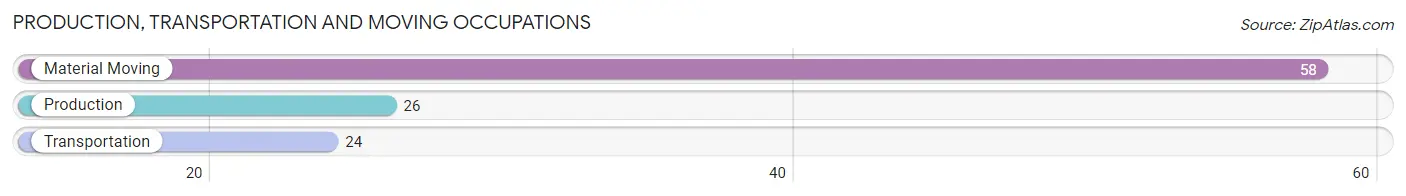
Production, Transportation and Moving Occupations
The most common Production, Transportation and Moving occupations in Coleraine are Material Moving (58 | 6.7%), Production (26 | 3.0%), and Transportation (24 | 2.8%).
Production, Transportation and Moving Occupations by Sex
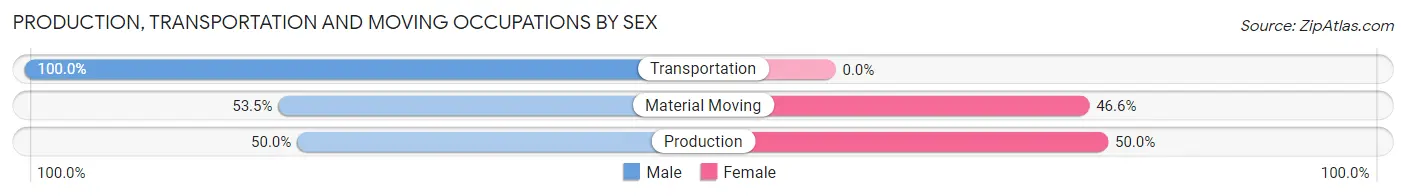
| Occupation | Male | Female |
| Production | 13 (50.0%) | 13 (50.0%) |
| Transportation | 24 (100.0%) | 0 (0.0%) |
| Material Moving | 31 (53.4%) | 27 (46.6%) |
| Total (Category) | 68 (63.0%) | 40 (37.0%) |
| Total (Overall) | 473 (54.6%) | 393 (45.4%) |
Employment Industries by Sex in Coleraine
Employment Industries in Coleraine
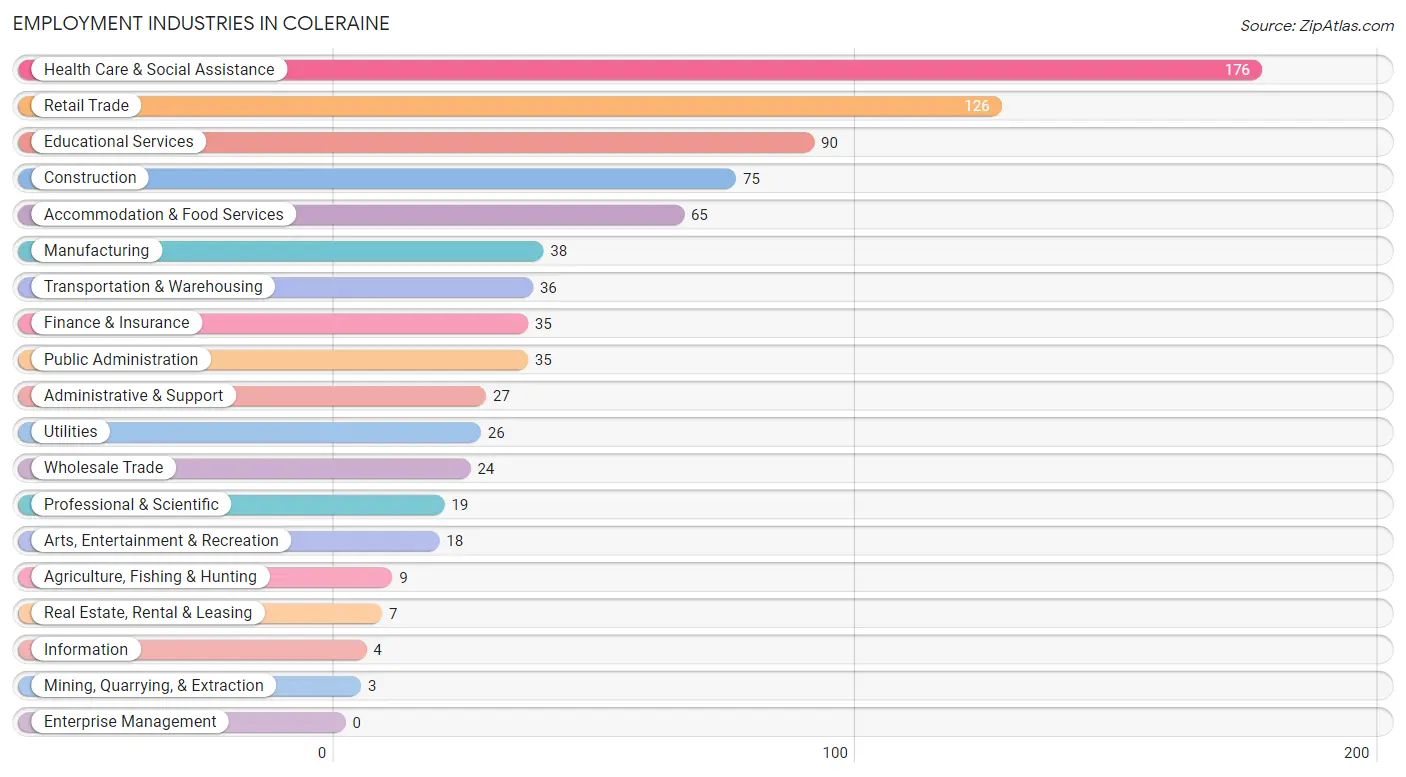
The major employment industries in Coleraine include Health Care & Social Assistance (176 | 20.3%), Retail Trade (126 | 14.5%), Educational Services (90 | 10.4%), Construction (75 | 8.7%), and Accommodation & Food Services (65 | 7.5%).
Employment Industries by Sex in Coleraine
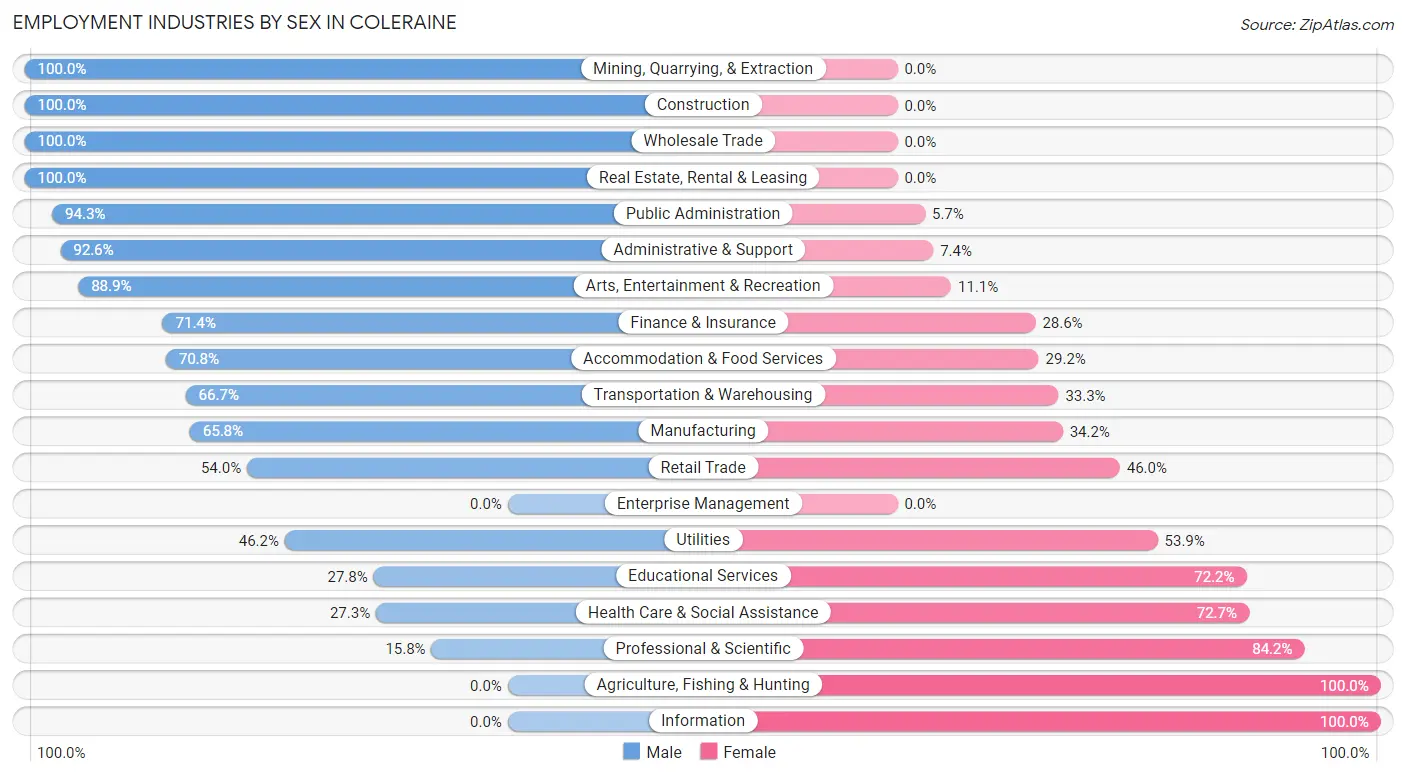
The Coleraine industries that see more men than women are Mining, Quarrying, & Extraction (100.0%), Construction (100.0%), and Wholesale Trade (100.0%), whereas the industries that tend to have a higher number of women are Agriculture, Fishing & Hunting (100.0%), Information (100.0%), and Professional & Scientific (84.2%).
| Industry | Male | Female |
| Agriculture, Fishing & Hunting | 0 (0.0%) | 9 (100.0%) |
| Mining, Quarrying, & Extraction | 3 (100.0%) | 0 (0.0%) |
| Construction | 75 (100.0%) | 0 (0.0%) |
| Manufacturing | 25 (65.8%) | 13 (34.2%) |
| Wholesale Trade | 24 (100.0%) | 0 (0.0%) |
| Retail Trade | 68 (54.0%) | 58 (46.0%) |
| Transportation & Warehousing | 24 (66.7%) | 12 (33.3%) |
| Utilities | 12 (46.2%) | 14 (53.8%) |
| Information | 0 (0.0%) | 4 (100.0%) |
| Finance & Insurance | 25 (71.4%) | 10 (28.6%) |
| Real Estate, Rental & Leasing | 7 (100.0%) | 0 (0.0%) |
| Professional & Scientific | 3 (15.8%) | 16 (84.2%) |
| Enterprise Management | 0 (0.0%) | 0 (0.0%) |
| Administrative & Support | 25 (92.6%) | 2 (7.4%) |
| Educational Services | 25 (27.8%) | 65 (72.2%) |
| Health Care & Social Assistance | 48 (27.3%) | 128 (72.7%) |
| Arts, Entertainment & Recreation | 16 (88.9%) | 2 (11.1%) |
| Accommodation & Food Services | 46 (70.8%) | 19 (29.2%) |
| Public Administration | 33 (94.3%) | 2 (5.7%) |
| Total | 473 (54.6%) | 393 (45.4%) |
Education in Coleraine
School Enrollment in Coleraine
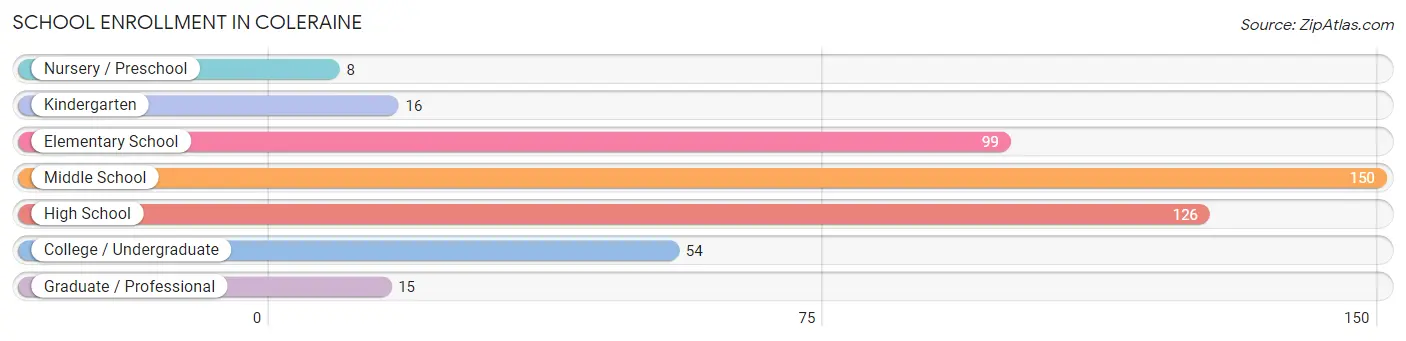
The most common levels of schooling among the 468 students in Coleraine are middle school (150 | 32.1%), high school (126 | 26.9%), and elementary school (99 | 21.1%).
| School Level | # Students | % Students |
| Nursery / Preschool | 8 | 1.7% |
| Kindergarten | 16 | 3.4% |
| Elementary School | 99 | 21.1% |
| Middle School | 150 | 32.1% |
| High School | 126 | 26.9% |
| College / Undergraduate | 54 | 11.5% |
| Graduate / Professional | 15 | 3.2% |
| Total | 468 | 100.0% |
School Enrollment by Age by Funding Source in Coleraine
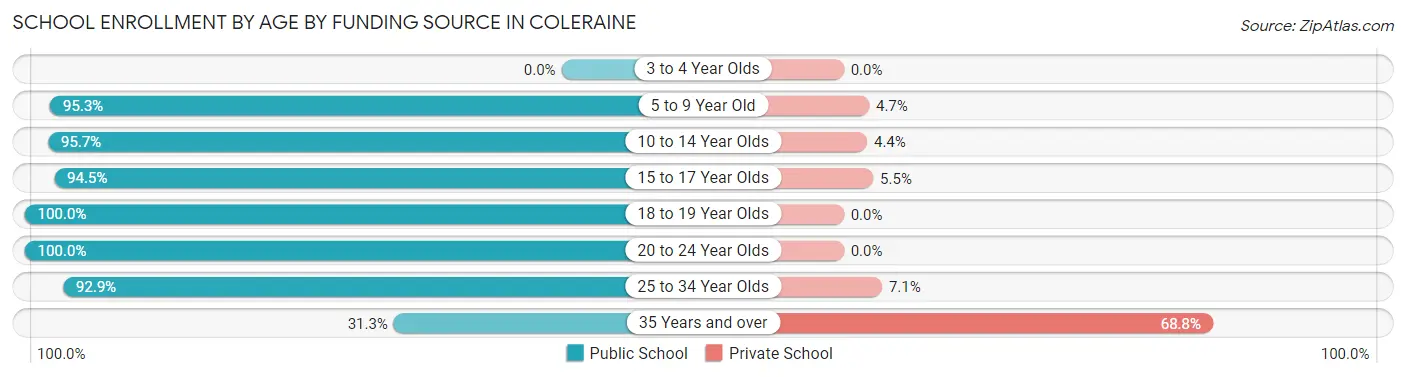
Out of a total of 468 students who are enrolled in schools in Coleraine, 31 (6.6%) attend a private institution, while the remaining 437 (93.4%) are enrolled in public schools. The age group of 35 years and over has the highest likelihood of being enrolled in private schools, with 11 (68.8% in the age bracket) enrolled. Conversely, the age group of 18 to 19 year olds has the lowest likelihood of being enrolled in a private school, with 34 (100.0% in the age bracket) attending a public institution.
| Age Bracket | Public School | Private School |
| 3 to 4 Year Olds | 0 (0.0%) | 0 (0.0%) |
| 5 to 9 Year Old | 101 (95.3%) | 5 (4.7%) |
| 10 to 14 Year Olds | 176 (95.7%) | 8 (4.3%) |
| 15 to 17 Year Olds | 86 (94.5%) | 5 (5.5%) |
| 18 to 19 Year Olds | 34 (100.0%) | 0 (0.0%) |
| 20 to 24 Year Olds | 9 (100.0%) | 0 (0.0%) |
| 25 to 34 Year Olds | 26 (92.9%) | 2 (7.1%) |
| 35 Years and over | 5 (31.2%) | 11 (68.8%) |
| Total | 437 (93.4%) | 31 (6.6%) |
Educational Attainment by Field of Study in Coleraine
Education (87 | 27.4%), business (41 | 12.9%), arts & humanities (35 | 11.0%), social sciences (33 | 10.4%), and science & technology (33 | 10.4%) are the most common fields of study among 318 individuals in Coleraine who have obtained a bachelor's degree or higher.
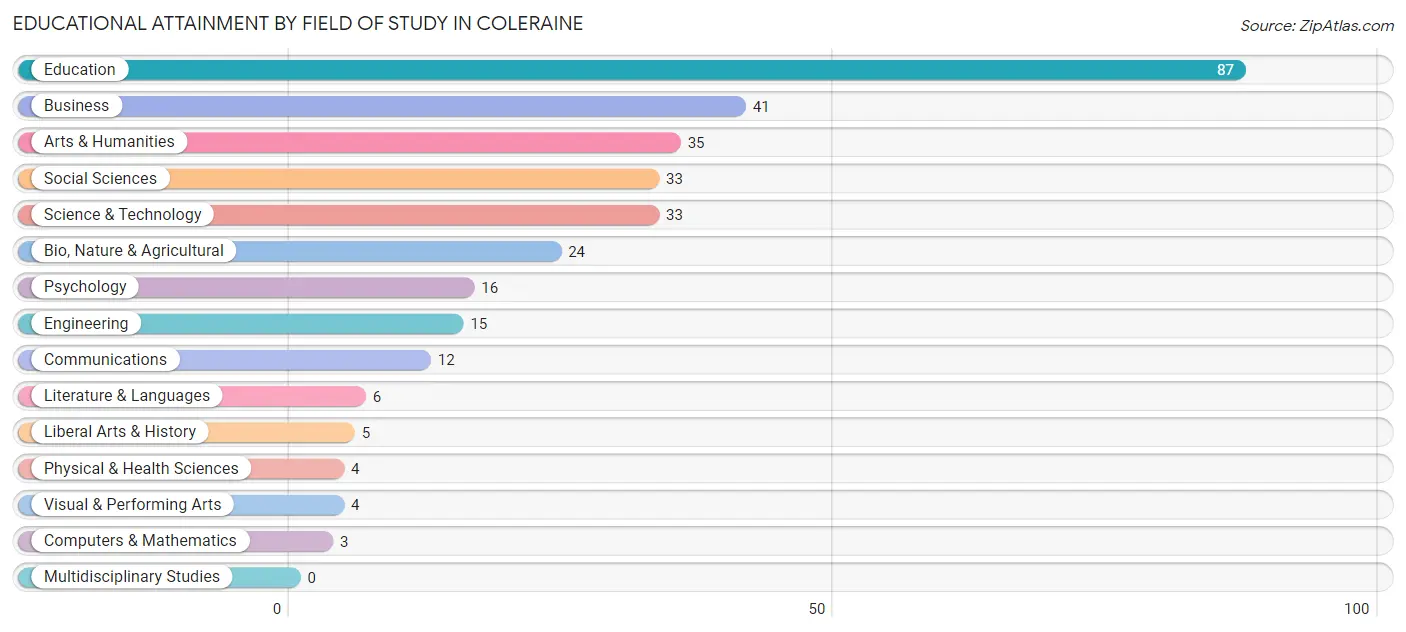
| Field of Study | # Graduates | % Graduates |
| Computers & Mathematics | 3 | 0.9% |
| Bio, Nature & Agricultural | 24 | 7.5% |
| Physical & Health Sciences | 4 | 1.3% |
| Psychology | 16 | 5.0% |
| Social Sciences | 33 | 10.4% |
| Engineering | 15 | 4.7% |
| Multidisciplinary Studies | 0 | 0.0% |
| Science & Technology | 33 | 10.4% |
| Business | 41 | 12.9% |
| Education | 87 | 27.4% |
| Literature & Languages | 6 | 1.9% |
| Liberal Arts & History | 5 | 1.6% |
| Visual & Performing Arts | 4 | 1.3% |
| Communications | 12 | 3.8% |
| Arts & Humanities | 35 | 11.0% |
| Total | 318 | 100.0% |
Transportation & Commute in Coleraine
Vehicle Availability by Sex in Coleraine
The most prevalent vehicle ownership categories in Coleraine are males with 3 vehicles (212, accounting for 45.7%) and females with 3 vehicles (123, making up 59.9%).
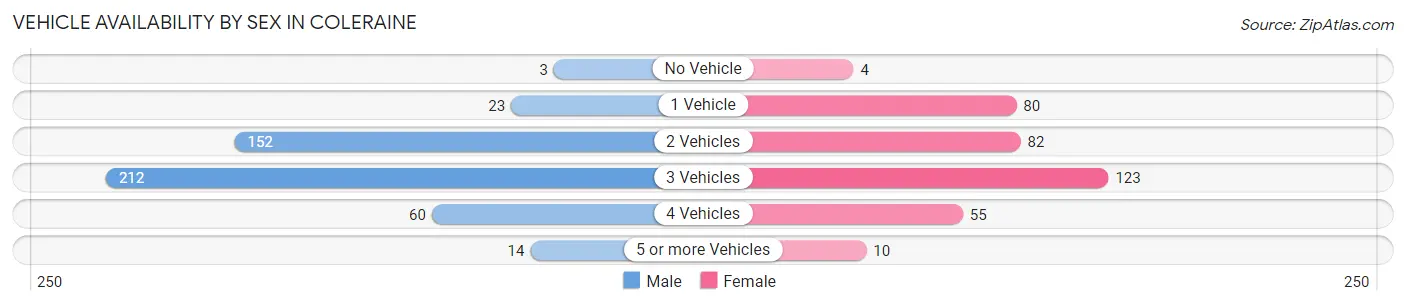
| Vehicles Available | Male | Female |
| No Vehicle | 3 (0.6%) | 4 (1.1%) |
| 1 Vehicle | 23 (5.0%) | 80 (22.6%) |
| 2 Vehicles | 152 (32.8%) | 82 (23.2%) |
| 3 Vehicles | 212 (45.7%) | 123 (34.7%) |
| 4 Vehicles | 60 (12.9%) | 55 (15.5%) |
| 5 or more Vehicles | 14 (3.0%) | 10 (2.8%) |
| Total | 464 (100.0%) | 354 (100.0%) |
Commute Time in Coleraine
The most frequently occuring commute durations in Coleraine are 15 to 19 minutes (231 commuters, 29.2%), 10 to 14 minutes (185 commuters, 23.4%), and less than 5 minutes (80 commuters, 10.1%).
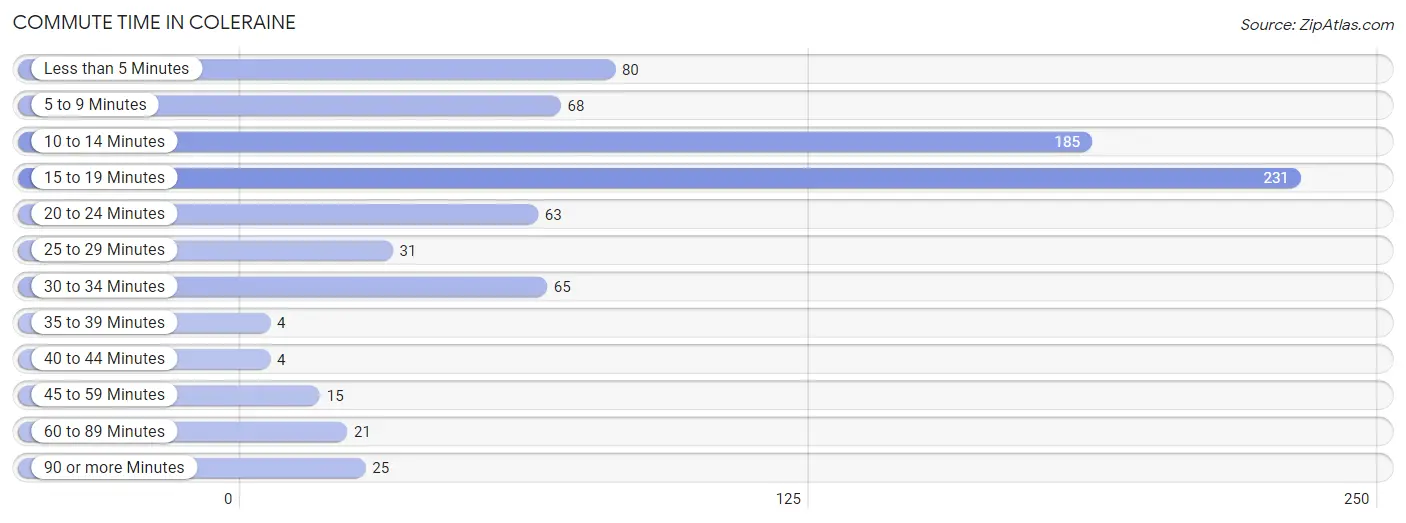
| Commute Time | # Commuters | % Commuters |
| Less than 5 Minutes | 80 | 10.1% |
| 5 to 9 Minutes | 68 | 8.6% |
| 10 to 14 Minutes | 185 | 23.4% |
| 15 to 19 Minutes | 231 | 29.2% |
| 20 to 24 Minutes | 63 | 8.0% |
| 25 to 29 Minutes | 31 | 3.9% |
| 30 to 34 Minutes | 65 | 8.2% |
| 35 to 39 Minutes | 4 | 0.5% |
| 40 to 44 Minutes | 4 | 0.5% |
| 45 to 59 Minutes | 15 | 1.9% |
| 60 to 89 Minutes | 21 | 2.6% |
| 90 or more Minutes | 25 | 3.2% |
Commute Time by Sex in Coleraine
The most common commute times in Coleraine are 15 to 19 minutes (115 commuters, 25.2%) for males and 15 to 19 minutes (116 commuters, 34.6%) for females.
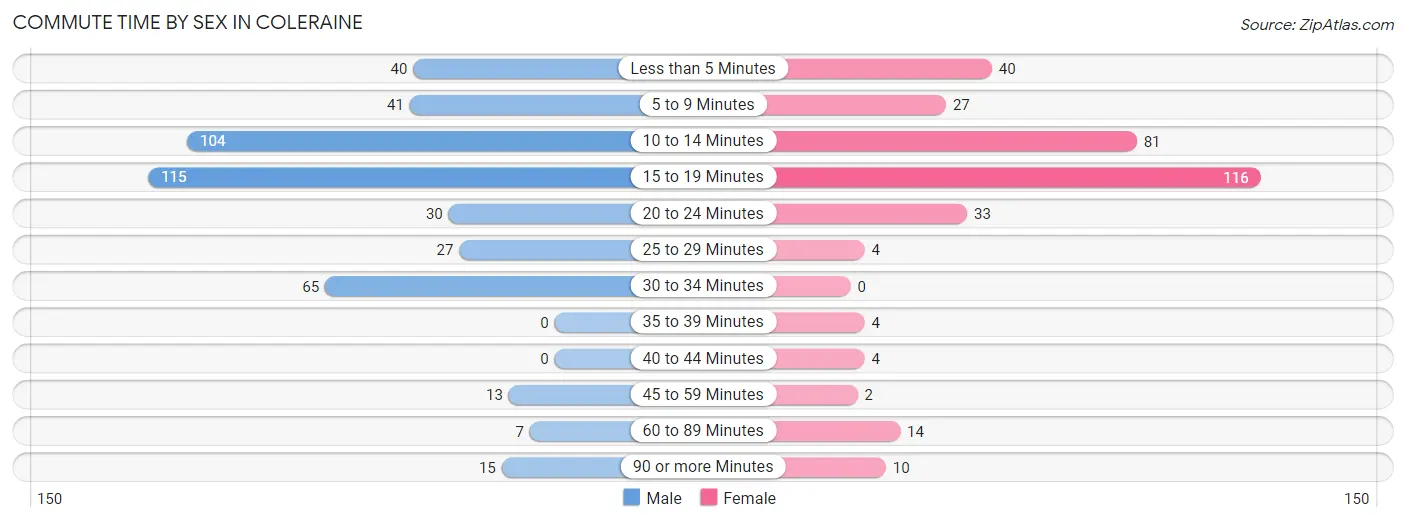
| Commute Time | Male | Female |
| Less than 5 Minutes | 40 (8.7%) | 40 (11.9%) |
| 5 to 9 Minutes | 41 (9.0%) | 27 (8.1%) |
| 10 to 14 Minutes | 104 (22.8%) | 81 (24.2%) |
| 15 to 19 Minutes | 115 (25.2%) | 116 (34.6%) |
| 20 to 24 Minutes | 30 (6.6%) | 33 (9.9%) |
| 25 to 29 Minutes | 27 (5.9%) | 4 (1.2%) |
| 30 to 34 Minutes | 65 (14.2%) | 0 (0.0%) |
| 35 to 39 Minutes | 0 (0.0%) | 4 (1.2%) |
| 40 to 44 Minutes | 0 (0.0%) | 4 (1.2%) |
| 45 to 59 Minutes | 13 (2.8%) | 2 (0.6%) |
| 60 to 89 Minutes | 7 (1.5%) | 14 (4.2%) |
| 90 or more Minutes | 15 (3.3%) | 10 (3.0%) |
Time of Departure to Work by Sex in Coleraine
The most frequent times of departure to work in Coleraine are 8:00 AM to 8:29 AM (114, 24.9%) for males and 7:30 AM to 7:59 AM (69, 20.6%) for females.
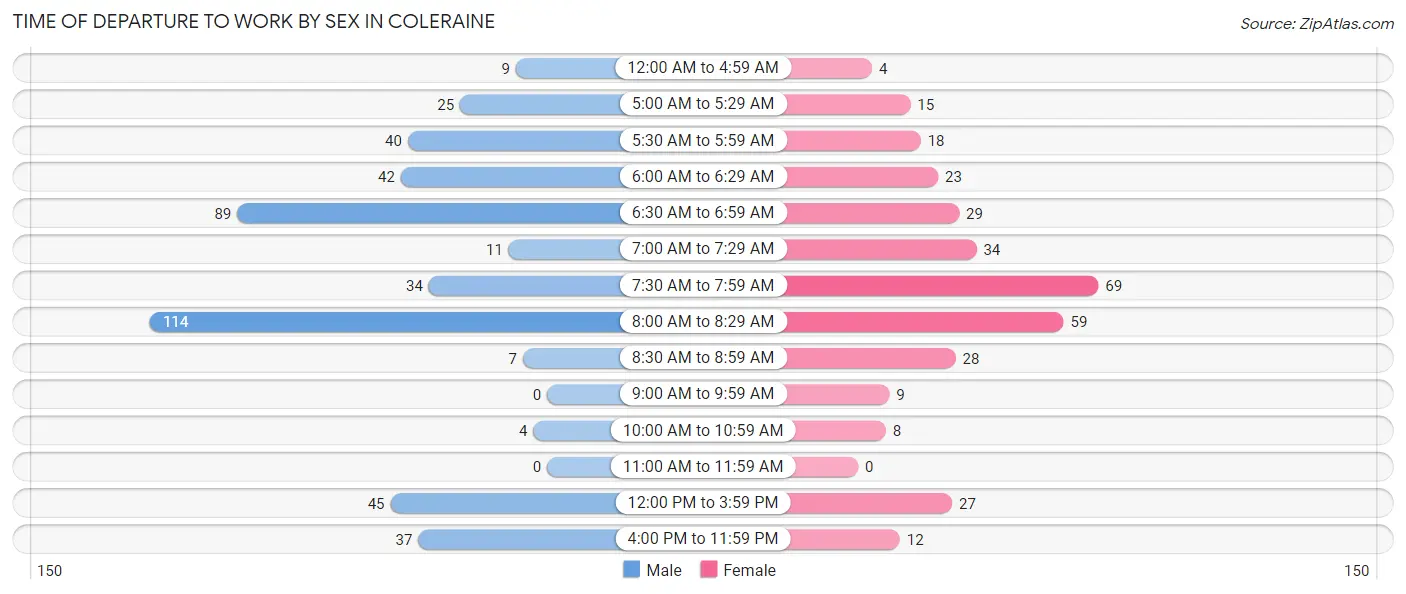
| Time of Departure | Male | Female |
| 12:00 AM to 4:59 AM | 9 (2.0%) | 4 (1.2%) |
| 5:00 AM to 5:29 AM | 25 (5.5%) | 15 (4.5%) |
| 5:30 AM to 5:59 AM | 40 (8.7%) | 18 (5.4%) |
| 6:00 AM to 6:29 AM | 42 (9.2%) | 23 (6.9%) |
| 6:30 AM to 6:59 AM | 89 (19.5%) | 29 (8.7%) |
| 7:00 AM to 7:29 AM | 11 (2.4%) | 34 (10.2%) |
| 7:30 AM to 7:59 AM | 34 (7.4%) | 69 (20.6%) |
| 8:00 AM to 8:29 AM | 114 (24.9%) | 59 (17.6%) |
| 8:30 AM to 8:59 AM | 7 (1.5%) | 28 (8.4%) |
| 9:00 AM to 9:59 AM | 0 (0.0%) | 9 (2.7%) |
| 10:00 AM to 10:59 AM | 4 (0.9%) | 8 (2.4%) |
| 11:00 AM to 11:59 AM | 0 (0.0%) | 0 (0.0%) |
| 12:00 PM to 3:59 PM | 45 (9.9%) | 27 (8.1%) |
| 4:00 PM to 11:59 PM | 37 (8.1%) | 12 (3.6%) |
| Total | 457 (100.0%) | 335 (100.0%) |
Housing Occupancy in Coleraine
Occupancy by Ownership in Coleraine
Of the total 675 dwellings in Coleraine, owner-occupied units account for 562 (83.3%), while renter-occupied units make up 113 (16.7%).
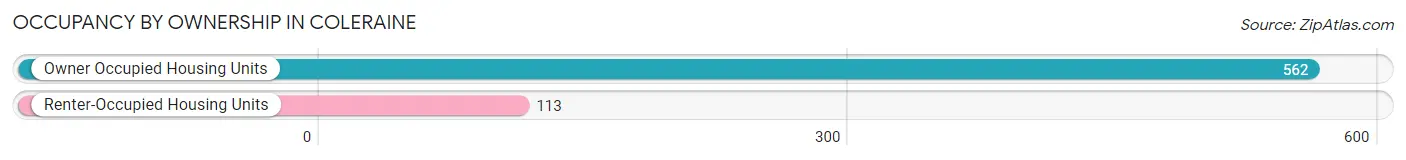
| Occupancy | # Housing Units | % Housing Units |
| Owner Occupied Housing Units | 562 | 83.3% |
| Renter-Occupied Housing Units | 113 | 16.7% |
| Total Occupied Housing Units | 675 | 100.0% |
Occupancy by Household Size in Coleraine
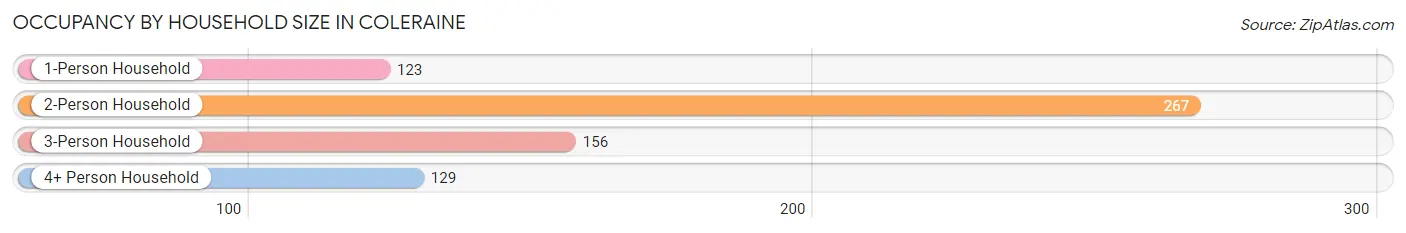
| Household Size | # Housing Units | % Housing Units |
| 1-Person Household | 123 | 18.2% |
| 2-Person Household | 267 | 39.6% |
| 3-Person Household | 156 | 23.1% |
| 4+ Person Household | 129 | 19.1% |
| Total Housing Units | 675 | 100.0% |
Occupancy by Ownership by Household Size in Coleraine
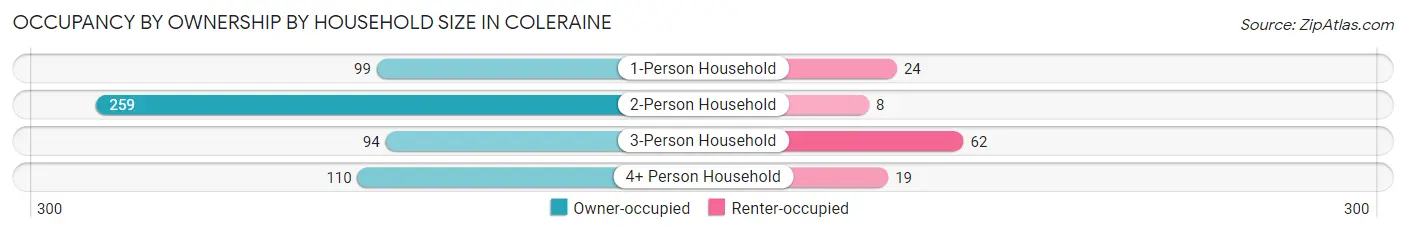
| Household Size | Owner-occupied | Renter-occupied |
| 1-Person Household | 99 (80.5%) | 24 (19.5%) |
| 2-Person Household | 259 (97.0%) | 8 (3.0%) |
| 3-Person Household | 94 (60.3%) | 62 (39.7%) |
| 4+ Person Household | 110 (85.3%) | 19 (14.7%) |
| Total Housing Units | 562 (83.3%) | 113 (16.7%) |
Occupancy by Educational Attainment in Coleraine
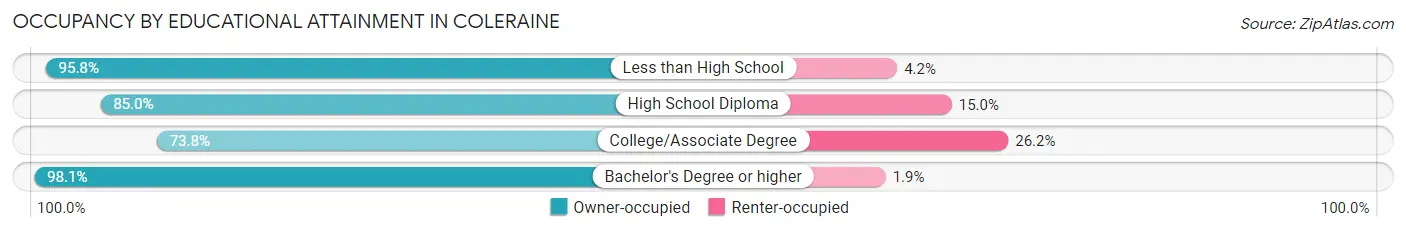
| Household Size | Owner-occupied | Renter-occupied |
| Less than High School | 23 (95.8%) | 1 (4.2%) |
| High School Diploma | 153 (85.0%) | 27 (15.0%) |
| College/Associate Degree | 231 (73.8%) | 82 (26.2%) |
| Bachelor's Degree or higher | 155 (98.1%) | 3 (1.9%) |
Occupancy by Age of Householder in Coleraine
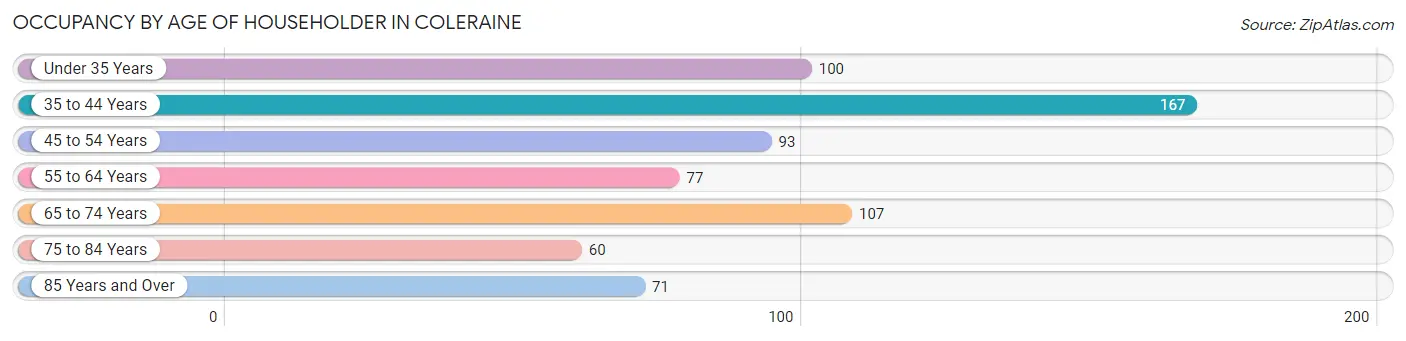
| Age Bracket | # Households | % Households |
| Under 35 Years | 100 | 14.8% |
| 35 to 44 Years | 167 | 24.7% |
| 45 to 54 Years | 93 | 13.8% |
| 55 to 64 Years | 77 | 11.4% |
| 65 to 74 Years | 107 | 15.9% |
| 75 to 84 Years | 60 | 8.9% |
| 85 Years and Over | 71 | 10.5% |
| Total | 675 | 100.0% |
Housing Finances in Coleraine
Median Income by Occupancy in Coleraine
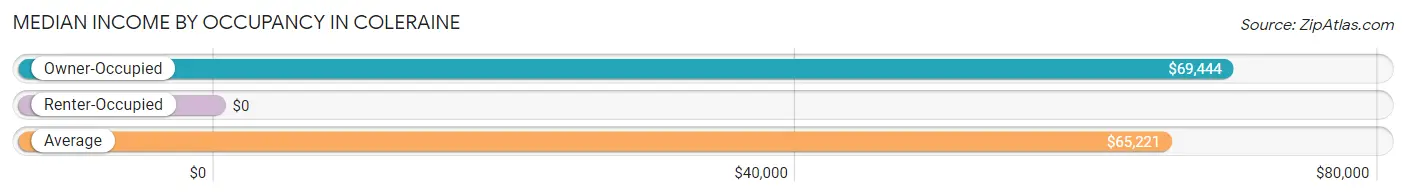
| Occupancy Type | # Households | Median Income |
| Owner-Occupied | 562 (83.3%) | $69,444 |
| Renter-Occupied | 113 (16.7%) | $0 |
| Average | 675 (100.0%) | $65,221 |
Occupancy by Householder Income Bracket in Coleraine
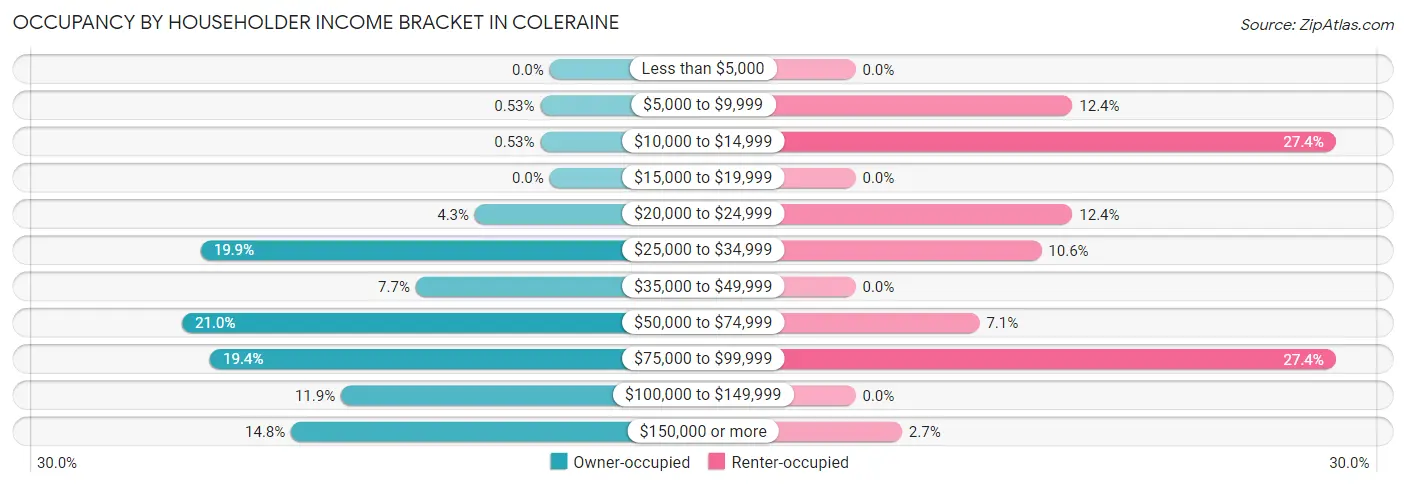
| Income Bracket | Owner-occupied | Renter-occupied |
| Less than $5,000 | 0 (0.0%) | 0 (0.0%) |
| $5,000 to $9,999 | 3 (0.5%) | 14 (12.4%) |
| $10,000 to $14,999 | 3 (0.5%) | 31 (27.4%) |
| $15,000 to $19,999 | 0 (0.0%) | 0 (0.0%) |
| $20,000 to $24,999 | 24 (4.3%) | 14 (12.4%) |
| $25,000 to $34,999 | 112 (19.9%) | 12 (10.6%) |
| $35,000 to $49,999 | 43 (7.6%) | 0 (0.0%) |
| $50,000 to $74,999 | 118 (21.0%) | 8 (7.1%) |
| $75,000 to $99,999 | 109 (19.4%) | 31 (27.4%) |
| $100,000 to $149,999 | 67 (11.9%) | 0 (0.0%) |
| $150,000 or more | 83 (14.8%) | 3 (2.6%) |
| Total | 562 (100.0%) | 113 (100.0%) |
Monthly Housing Cost Tiers in Coleraine
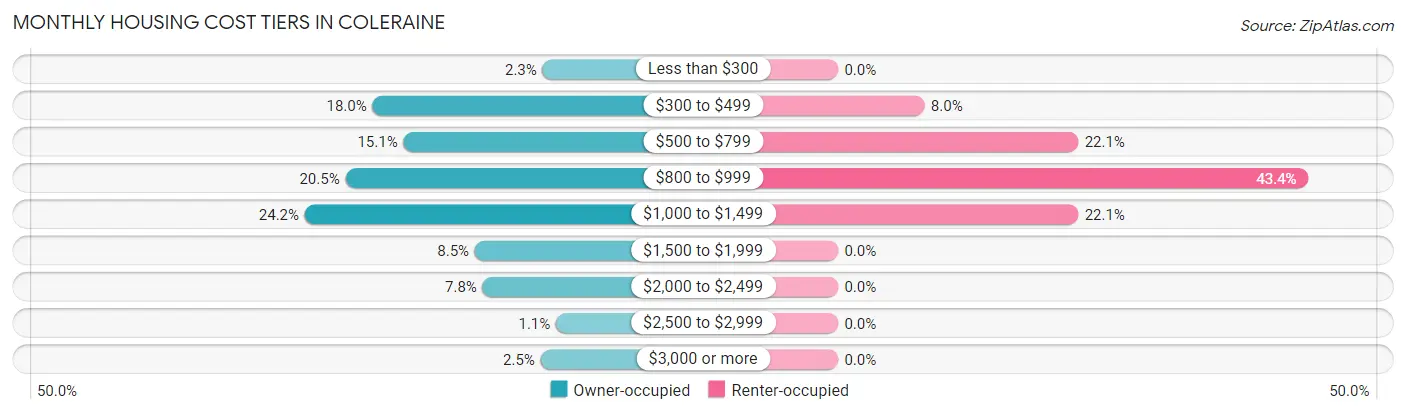
| Monthly Cost | Owner-occupied | Renter-occupied |
| Less than $300 | 13 (2.3%) | 0 (0.0%) |
| $300 to $499 | 101 (18.0%) | 9 (8.0%) |
| $500 to $799 | 85 (15.1%) | 25 (22.1%) |
| $800 to $999 | 115 (20.5%) | 49 (43.4%) |
| $1,000 to $1,499 | 136 (24.2%) | 25 (22.1%) |
| $1,500 to $1,999 | 48 (8.5%) | 0 (0.0%) |
| $2,000 to $2,499 | 44 (7.8%) | 0 (0.0%) |
| $2,500 to $2,999 | 6 (1.1%) | 0 (0.0%) |
| $3,000 or more | 14 (2.5%) | 0 (0.0%) |
| Total | 562 (100.0%) | 113 (100.0%) |
Physical Housing Characteristics in Coleraine
Housing Structures in Coleraine
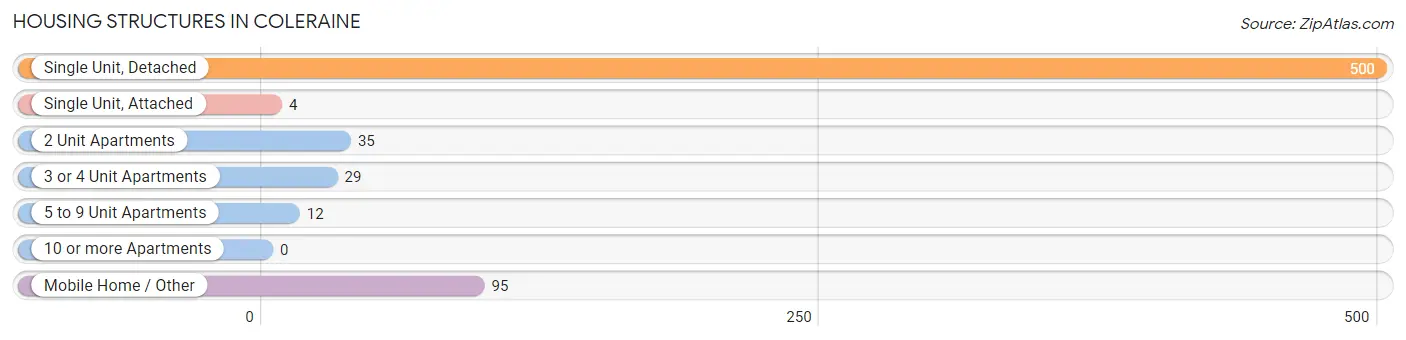
| Structure Type | # Housing Units | % Housing Units |
| Single Unit, Detached | 500 | 74.1% |
| Single Unit, Attached | 4 | 0.6% |
| 2 Unit Apartments | 35 | 5.2% |
| 3 or 4 Unit Apartments | 29 | 4.3% |
| 5 to 9 Unit Apartments | 12 | 1.8% |
| 10 or more Apartments | 0 | 0.0% |
| Mobile Home / Other | 95 | 14.1% |
| Total | 675 | 100.0% |
Housing Structures by Occupancy in Coleraine
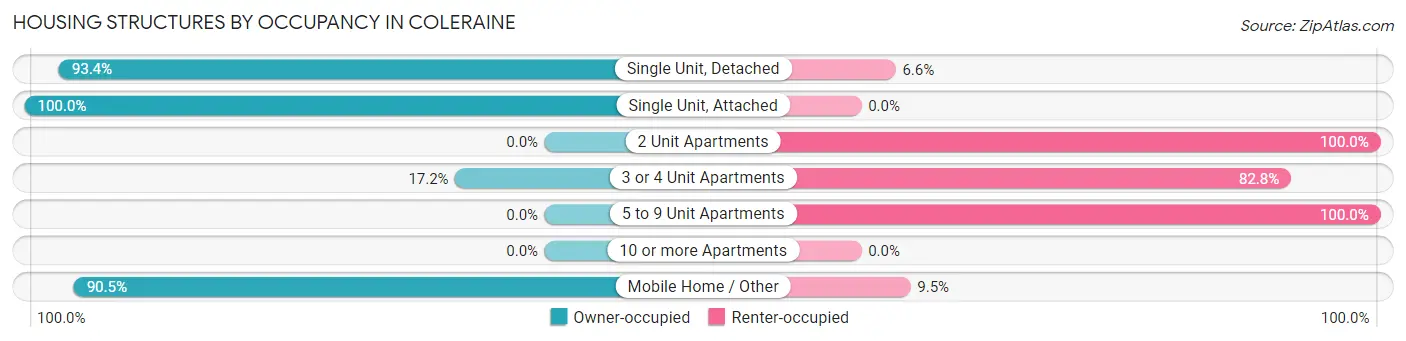
| Structure Type | Owner-occupied | Renter-occupied |
| Single Unit, Detached | 467 (93.4%) | 33 (6.6%) |
| Single Unit, Attached | 4 (100.0%) | 0 (0.0%) |
| 2 Unit Apartments | 0 (0.0%) | 35 (100.0%) |
| 3 or 4 Unit Apartments | 5 (17.2%) | 24 (82.8%) |
| 5 to 9 Unit Apartments | 0 (0.0%) | 12 (100.0%) |
| 10 or more Apartments | 0 (0.0%) | 0 (0.0%) |
| Mobile Home / Other | 86 (90.5%) | 9 (9.5%) |
| Total | 562 (83.3%) | 113 (16.7%) |
Housing Structures by Number of Rooms in Coleraine
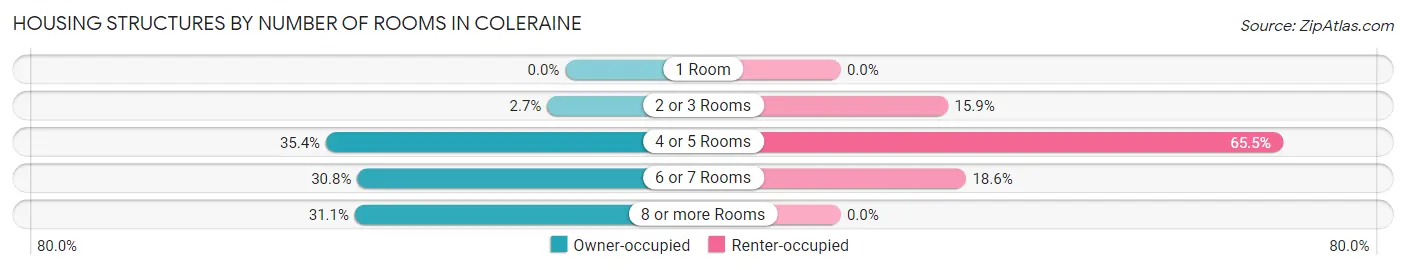
| Number of Rooms | Owner-occupied | Renter-occupied |
| 1 Room | 0 (0.0%) | 0 (0.0%) |
| 2 or 3 Rooms | 15 (2.7%) | 18 (15.9%) |
| 4 or 5 Rooms | 199 (35.4%) | 74 (65.5%) |
| 6 or 7 Rooms | 173 (30.8%) | 21 (18.6%) |
| 8 or more Rooms | 175 (31.1%) | 0 (0.0%) |
| Total | 562 (100.0%) | 113 (100.0%) |
Housing Structure by Heating Type in Coleraine
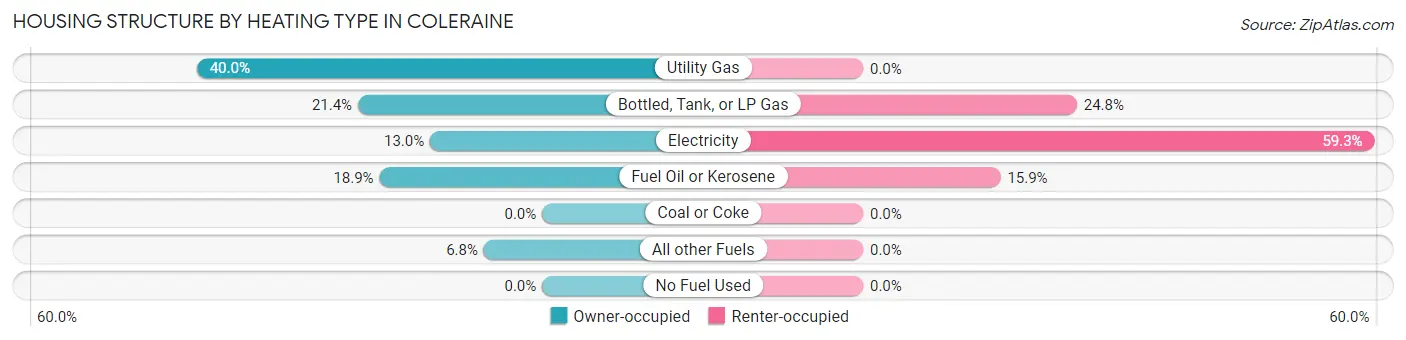
| Heating Type | Owner-occupied | Renter-occupied |
| Utility Gas | 225 (40.0%) | 0 (0.0%) |
| Bottled, Tank, or LP Gas | 120 (21.3%) | 28 (24.8%) |
| Electricity | 73 (13.0%) | 67 (59.3%) |
| Fuel Oil or Kerosene | 106 (18.9%) | 18 (15.9%) |
| Coal or Coke | 0 (0.0%) | 0 (0.0%) |
| All other Fuels | 38 (6.8%) | 0 (0.0%) |
| No Fuel Used | 0 (0.0%) | 0 (0.0%) |
| Total | 562 (100.0%) | 113 (100.0%) |
Household Vehicle Usage in Coleraine
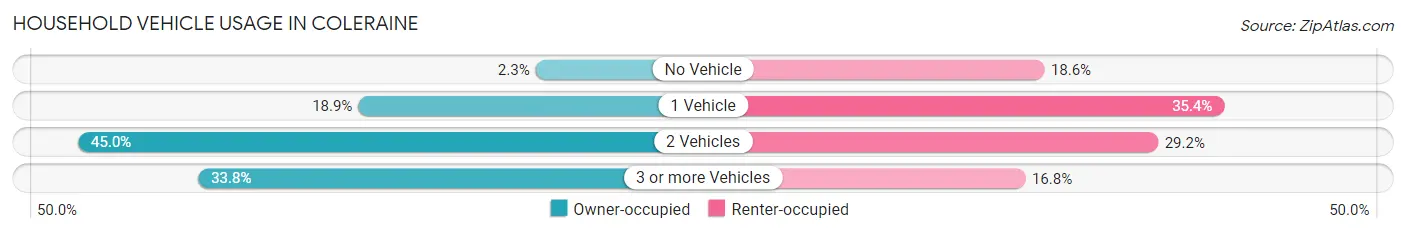
| Vehicles per Household | Owner-occupied | Renter-occupied |
| No Vehicle | 13 (2.3%) | 21 (18.6%) |
| 1 Vehicle | 106 (18.9%) | 40 (35.4%) |
| 2 Vehicles | 253 (45.0%) | 33 (29.2%) |
| 3 or more Vehicles | 190 (33.8%) | 19 (16.8%) |
| Total | 562 (100.0%) | 113 (100.0%) |
Real Estate & Mortgages in Coleraine
Real Estate and Mortgage Overview in Coleraine
| Characteristic | Without Mortgage | With Mortgage |
| Housing Units | 191 | 371 |
| Median Property Value | $162,800 | $193,500 |
| Median Household Income | $66,875 | $56 |
| Monthly Housing Costs | $480 | $14 |
| Real Estate Taxes | $1,823 | $16 |
Property Value by Mortgage Status in Coleraine
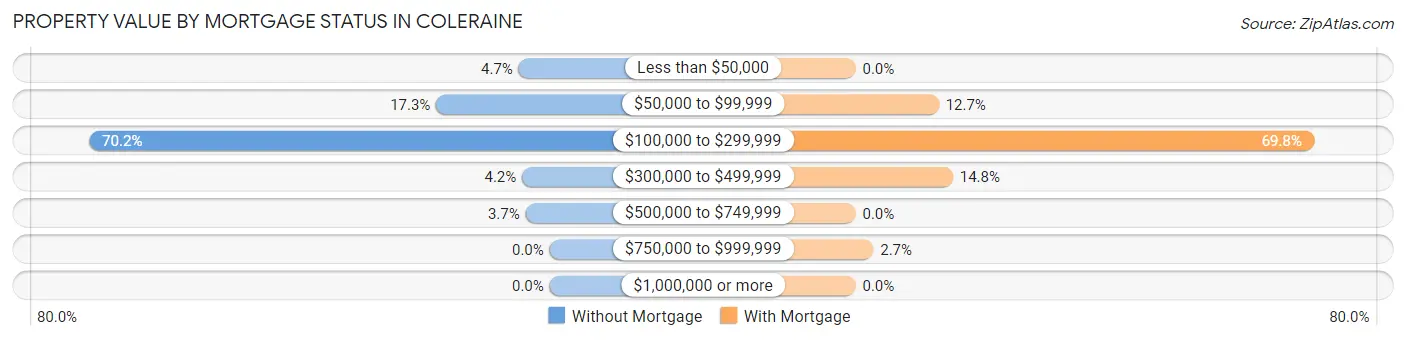
| Property Value | Without Mortgage | With Mortgage |
| Less than $50,000 | 9 (4.7%) | 0 (0.0%) |
| $50,000 to $99,999 | 33 (17.3%) | 47 (12.7%) |
| $100,000 to $299,999 | 134 (70.2%) | 259 (69.8%) |
| $300,000 to $499,999 | 8 (4.2%) | 55 (14.8%) |
| $500,000 to $749,999 | 7 (3.7%) | 0 (0.0%) |
| $750,000 to $999,999 | 0 (0.0%) | 10 (2.7%) |
| $1,000,000 or more | 0 (0.0%) | 0 (0.0%) |
| Total | 191 (100.0%) | 371 (100.0%) |
Household Income by Mortgage Status in Coleraine
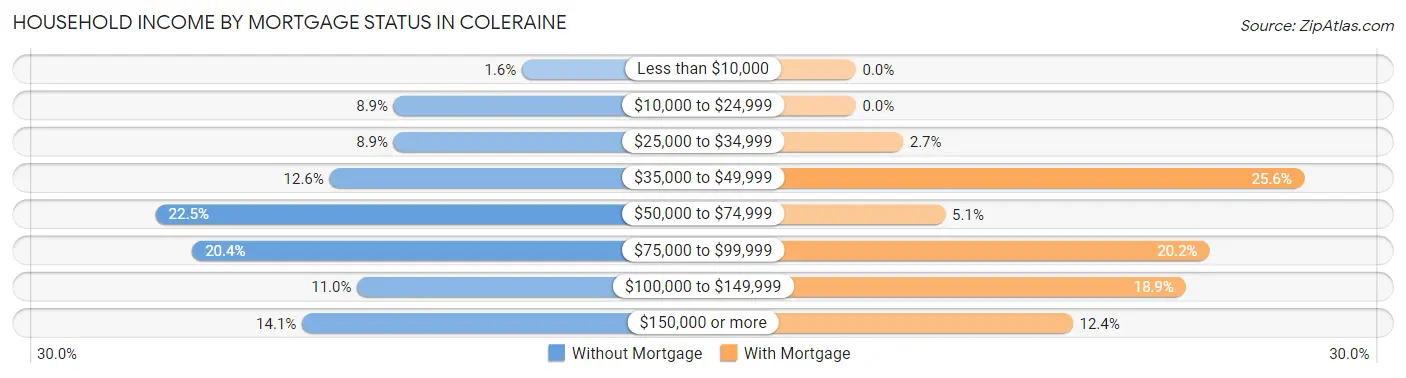
| Household Income | Without Mortgage | With Mortgage |
| Less than $10,000 | 3 (1.6%) | 0 (0.0%) |
| $10,000 to $24,999 | 17 (8.9%) | 0 (0.0%) |
| $25,000 to $34,999 | 17 (8.9%) | 10 (2.7%) |
| $35,000 to $49,999 | 24 (12.6%) | 95 (25.6%) |
| $50,000 to $74,999 | 43 (22.5%) | 19 (5.1%) |
| $75,000 to $99,999 | 39 (20.4%) | 75 (20.2%) |
| $100,000 to $149,999 | 21 (11.0%) | 70 (18.9%) |
| $150,000 or more | 27 (14.1%) | 46 (12.4%) |
| Total | 191 (100.0%) | 371 (100.0%) |
Property Value to Household Income Ratio in Coleraine
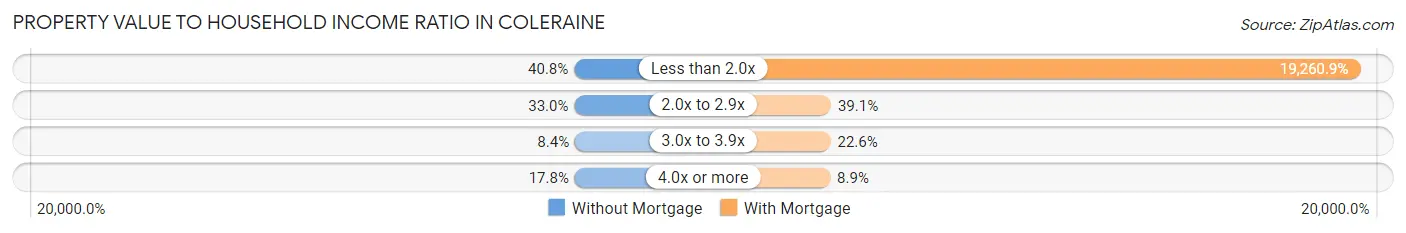
| Value-to-Income Ratio | Without Mortgage | With Mortgage |
| Less than 2.0x | 78 (40.8%) | 71,458 (19,260.9%) |
| 2.0x to 2.9x | 63 (33.0%) | 145 (39.1%) |
| 3.0x to 3.9x | 16 (8.4%) | 84 (22.6%) |
| 4.0x or more | 34 (17.8%) | 33 (8.9%) |
| Total | 191 (100.0%) | 371 (100.0%) |
Real Estate Taxes by Mortgage Status in Coleraine
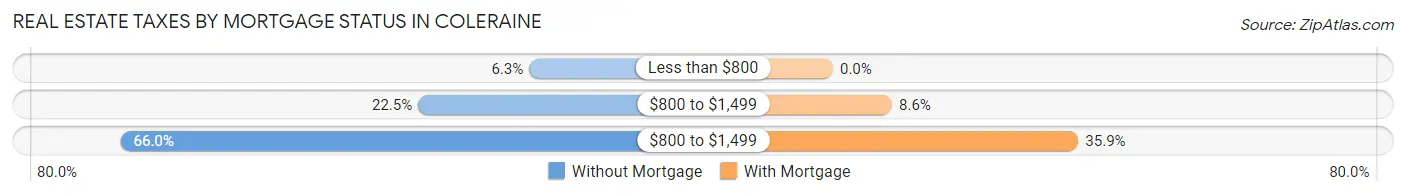
| Property Taxes | Without Mortgage | With Mortgage |
| Less than $800 | 12 (6.3%) | 0 (0.0%) |
| $800 to $1,499 | 43 (22.5%) | 32 (8.6%) |
| $800 to $1,499 | 126 (66.0%) | 133 (35.8%) |
| Total | 191 (100.0%) | 371 (100.0%) |
Health & Disability in Coleraine
Health Insurance Coverage by Age in Coleraine
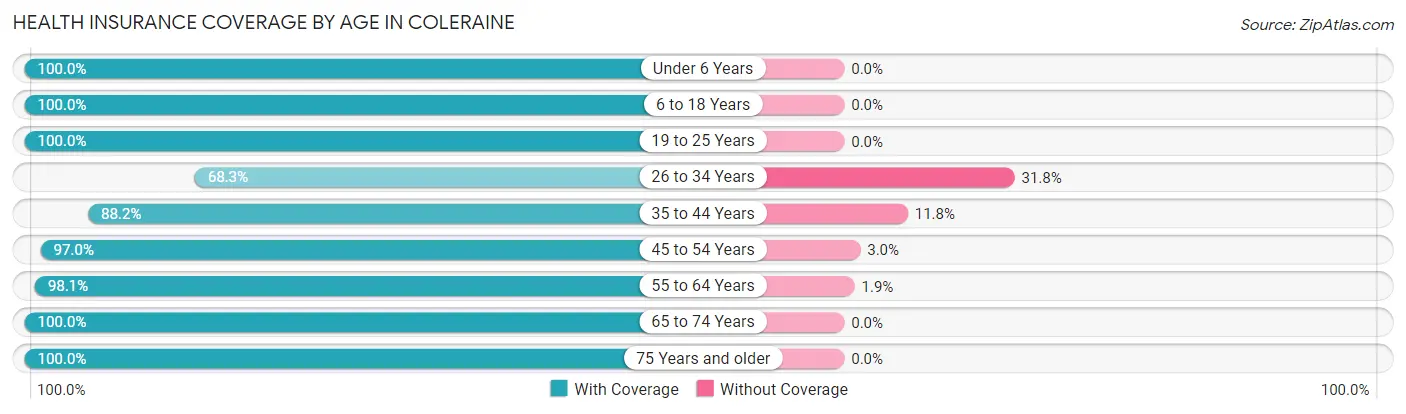
| Age Bracket | With Coverage | Without Coverage |
| Under 6 Years | 92 (100.0%) | 0 (0.0%) |
| 6 to 18 Years | 409 (100.0%) | 0 (0.0%) |
| 19 to 25 Years | 174 (100.0%) | 0 (0.0%) |
| 26 to 34 Years | 86 (68.2%) | 40 (31.8%) |
| 35 to 44 Years | 283 (88.2%) | 38 (11.8%) |
| 45 to 54 Years | 163 (97.0%) | 5 (3.0%) |
| 55 to 64 Years | 153 (98.1%) | 3 (1.9%) |
| 65 to 74 Years | 181 (100.0%) | 0 (0.0%) |
| 75 Years and older | 234 (100.0%) | 0 (0.0%) |
| Total | 1,775 (95.4%) | 86 (4.6%) |
Health Insurance Coverage by Citizenship Status in Coleraine
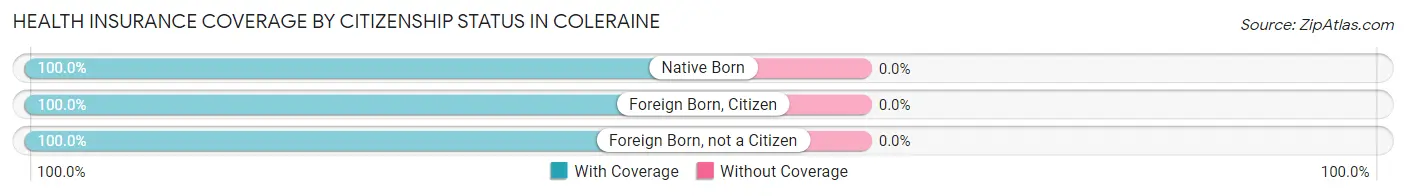
| Citizenship Status | With Coverage | Without Coverage |
| Native Born | 92 (100.0%) | 0 (0.0%) |
| Foreign Born, Citizen | 409 (100.0%) | 0 (0.0%) |
| Foreign Born, not a Citizen | 174 (100.0%) | 0 (0.0%) |
Health Insurance Coverage by Household Income in Coleraine
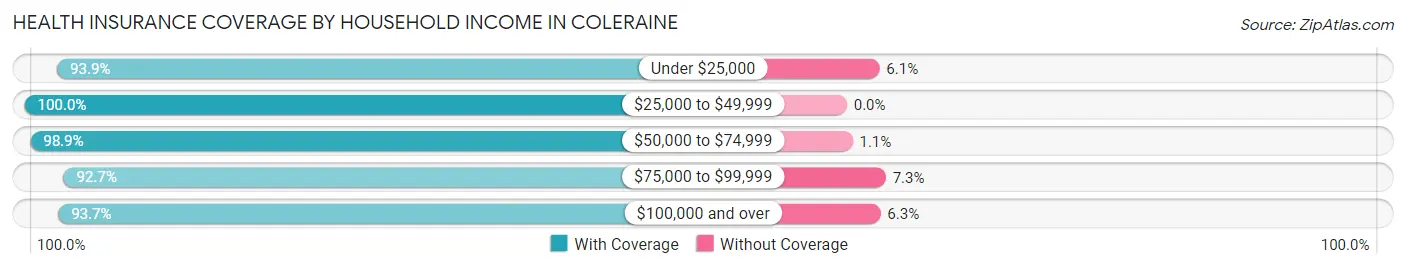
| Household Income | With Coverage | Without Coverage |
| Under $25,000 | 169 (93.9%) | 11 (6.1%) |
| $25,000 to $49,999 | 305 (100.0%) | 0 (0.0%) |
| $50,000 to $74,999 | 277 (98.9%) | 3 (1.1%) |
| $75,000 to $99,999 | 445 (92.7%) | 35 (7.3%) |
| $100,000 and over | 550 (93.7%) | 37 (6.3%) |
Public vs Private Health Insurance Coverage by Age in Coleraine
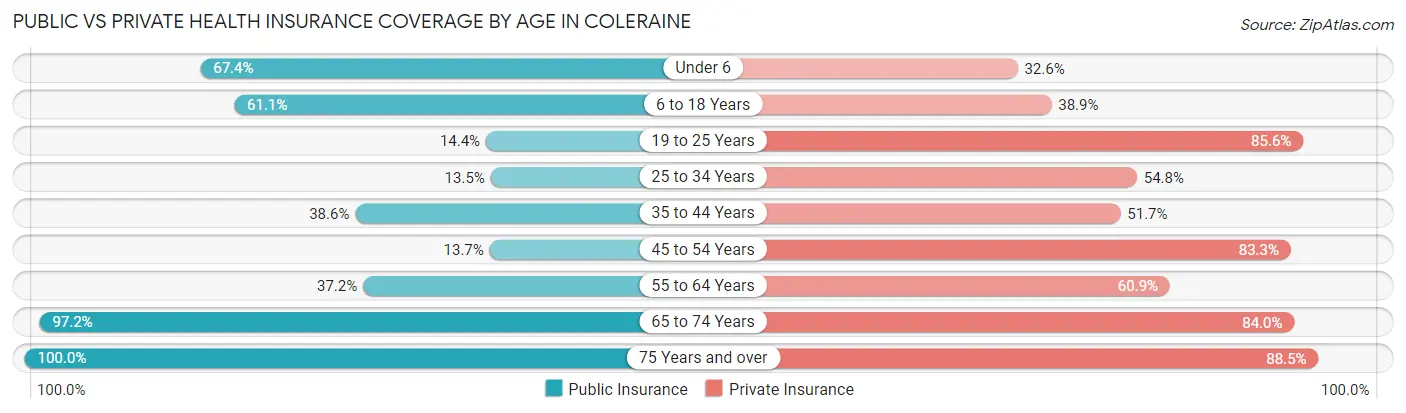
| Age Bracket | Public Insurance | Private Insurance |
| Under 6 | 62 (67.4%) | 30 (32.6%) |
| 6 to 18 Years | 250 (61.1%) | 159 (38.9%) |
| 19 to 25 Years | 25 (14.4%) | 149 (85.6%) |
| 25 to 34 Years | 17 (13.5%) | 69 (54.8%) |
| 35 to 44 Years | 124 (38.6%) | 166 (51.7%) |
| 45 to 54 Years | 23 (13.7%) | 140 (83.3%) |
| 55 to 64 Years | 58 (37.2%) | 95 (60.9%) |
| 65 to 74 Years | 176 (97.2%) | 152 (84.0%) |
| 75 Years and over | 234 (100.0%) | 207 (88.5%) |
| Total | 969 (52.1%) | 1,167 (62.7%) |
Disability Status by Sex by Age in Coleraine
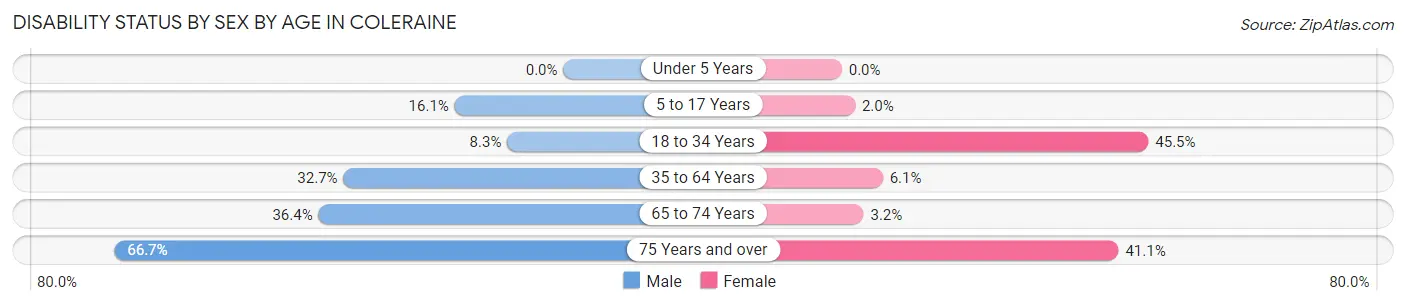
| Age Bracket | Male | Female |
| Under 5 Years | 0 (0.0%) | 0 (0.0%) |
| 5 to 17 Years | 41 (16.1%) | 3 (2.0%) |
| 18 to 34 Years | 15 (8.3%) | 61 (45.5%) |
| 35 to 64 Years | 114 (32.7%) | 18 (6.1%) |
| 65 to 74 Years | 32 (36.4%) | 3 (3.2%) |
| 75 Years and over | 70 (66.7%) | 53 (41.1%) |
Disability Class by Sex by Age in Coleraine
Disability Class: Hearing Difficulty
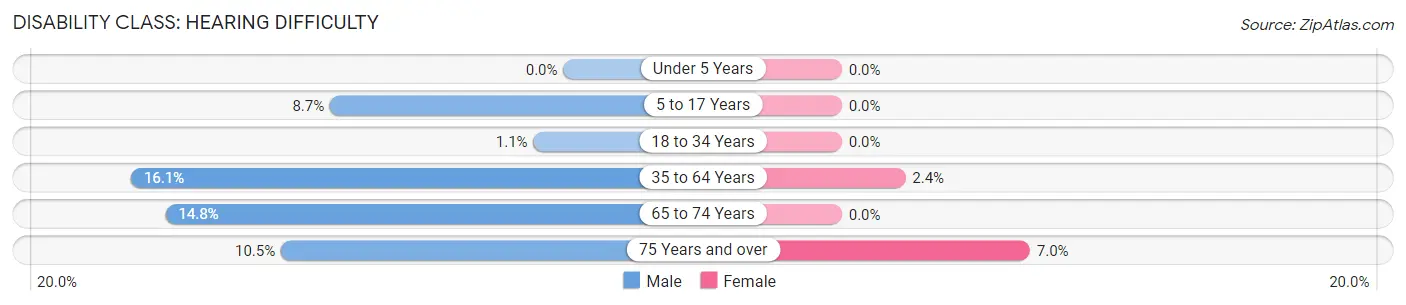
| Age Bracket | Male | Female |
| Under 5 Years | 0 (0.0%) | 0 (0.0%) |
| 5 to 17 Years | 22 (8.7%) | 0 (0.0%) |
| 18 to 34 Years | 2 (1.1%) | 0 (0.0%) |
| 35 to 64 Years | 56 (16.1%) | 7 (2.4%) |
| 65 to 74 Years | 13 (14.8%) | 0 (0.0%) |
| 75 Years and over | 11 (10.5%) | 9 (7.0%) |
Disability Class: Vision Difficulty
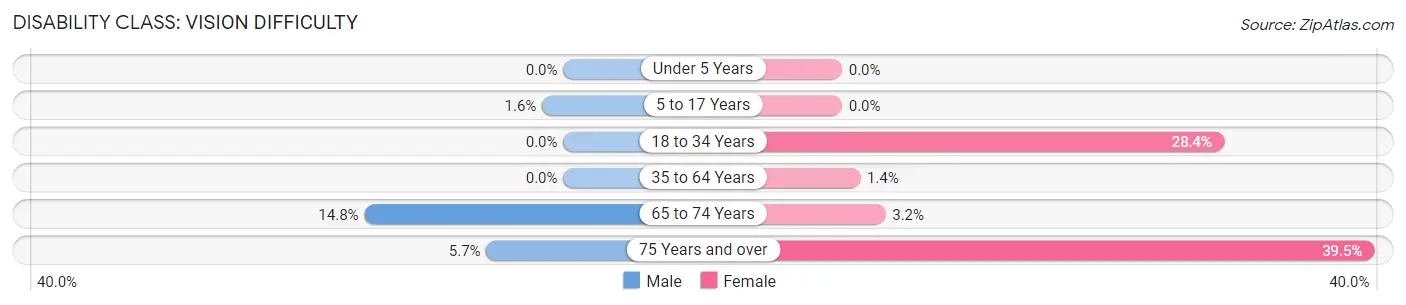
| Age Bracket | Male | Female |
| Under 5 Years | 0 (0.0%) | 0 (0.0%) |
| 5 to 17 Years | 4 (1.6%) | 0 (0.0%) |
| 18 to 34 Years | 0 (0.0%) | 38 (28.4%) |
| 35 to 64 Years | 0 (0.0%) | 4 (1.3%) |
| 65 to 74 Years | 13 (14.8%) | 3 (3.2%) |
| 75 Years and over | 6 (5.7%) | 51 (39.5%) |
Disability Class: Cognitive Difficulty
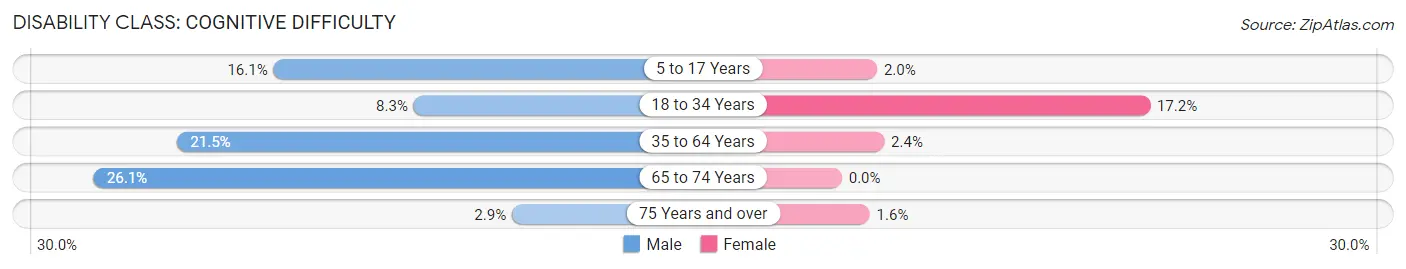
| Age Bracket | Male | Female |
| 5 to 17 Years | 41 (16.1%) | 3 (2.0%) |
| 18 to 34 Years | 15 (8.3%) | 23 (17.2%) |
| 35 to 64 Years | 75 (21.5%) | 7 (2.4%) |
| 65 to 74 Years | 23 (26.1%) | 0 (0.0%) |
| 75 Years and over | 3 (2.9%) | 2 (1.5%) |
Disability Class: Ambulatory Difficulty
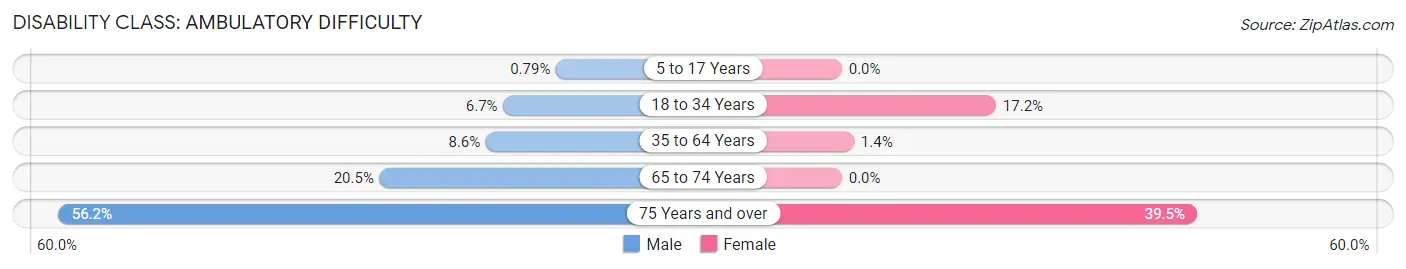
| Age Bracket | Male | Female |
| 5 to 17 Years | 2 (0.8%) | 0 (0.0%) |
| 18 to 34 Years | 12 (6.7%) | 23 (17.2%) |
| 35 to 64 Years | 30 (8.6%) | 4 (1.3%) |
| 65 to 74 Years | 18 (20.4%) | 0 (0.0%) |
| 75 Years and over | 59 (56.2%) | 51 (39.5%) |
Disability Class: Self-Care Difficulty
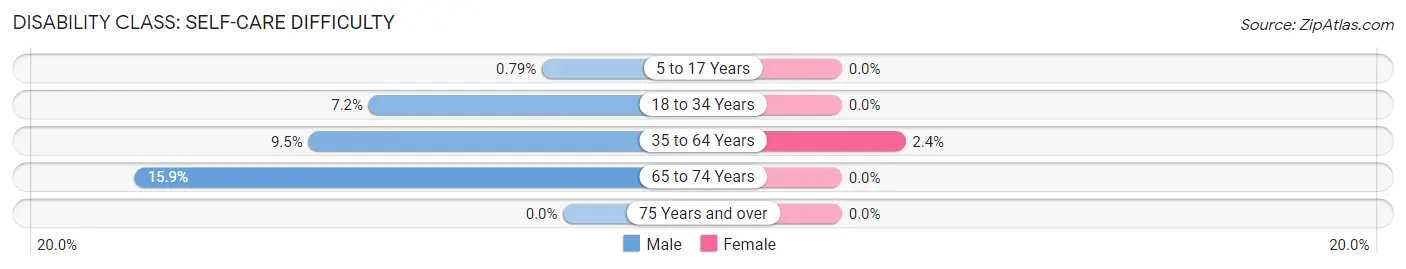
| Age Bracket | Male | Female |
| 5 to 17 Years | 2 (0.8%) | 0 (0.0%) |
| 18 to 34 Years | 13 (7.2%) | 0 (0.0%) |
| 35 to 64 Years | 33 (9.5%) | 7 (2.4%) |
| 65 to 74 Years | 14 (15.9%) | 0 (0.0%) |
| 75 Years and over | 0 (0.0%) | 0 (0.0%) |
Technology Access in Coleraine
Computing Device Access in Coleraine
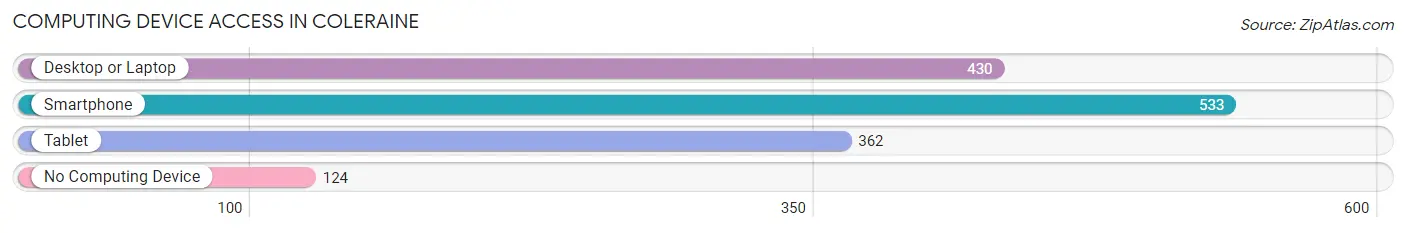
| Device Type | # Households | % Households |
| Desktop or Laptop | 430 | 63.7% |
| Smartphone | 533 | 79.0% |
| Tablet | 362 | 53.6% |
| No Computing Device | 124 | 18.4% |
| Total | 675 | 100.0% |
Internet Access in Coleraine
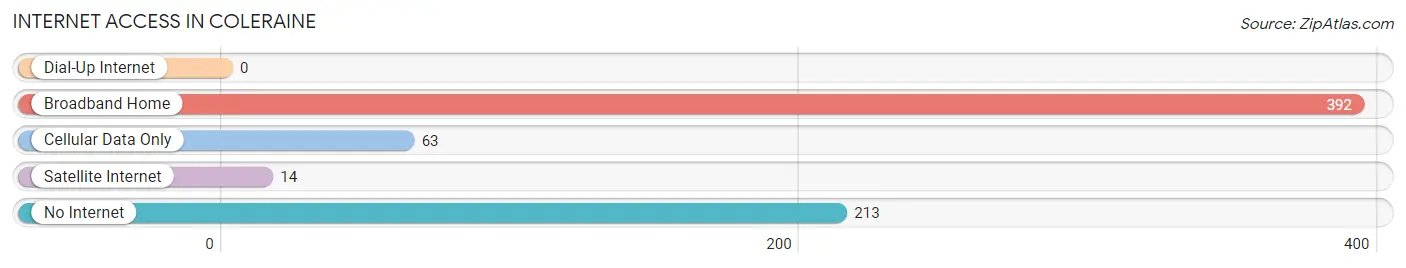
| Internet Type | # Households | % Households |
| Dial-Up Internet | 0 | 0.0% |
| Broadband Home | 392 | 58.1% |
| Cellular Data Only | 63 | 9.3% |
| Satellite Internet | 14 | 2.1% |
| No Internet | 213 | 31.6% |
| Total | 675 | 100.0% |
Coleraine Summary
Coleraine, Minnesota is a small city located in Itasca County, in the northern part of the state. It is situated on the banks of the Mississippi River, and is home to a population of just over 2,000 people. The city is known for its rich history, its unique geography, and its diverse economy.
History
Coleraine was first settled in 1887 by a group of Finnish immigrants. The city was named after the town of Coleraine in Northern Ireland, and the settlers chose the name to honor their homeland. The city was incorporated in 1901, and the first mayor was John A. Johnson.
The city grew rapidly in the early 20th century, and by the 1920s it had become a major center for the logging industry. The city was also home to a number of sawmills, and the lumber industry was a major source of employment for the residents.
In the 1950s, the city began to diversify its economy, and it became a center for manufacturing. The city was home to a number of factories, including a paper mill, a furniture factory, and a canning plant.
Geography
Coleraine is located in the northern part of Minnesota, on the banks of the Mississippi River. The city is situated in a valley, surrounded by hills and forests. The city is located about 30 miles north of Grand Rapids, and about 50 miles south of Duluth.
The city has a total area of 2.2 square miles, and the elevation is 1,072 feet. The climate is humid continental, with cold winters and warm summers. The average annual temperature is around 40 degrees Fahrenheit.
Economy
The economy of Coleraine is diverse and includes a number of industries. The city is home to a number of manufacturing companies, including a paper mill, a furniture factory, and a canning plant. The city is also home to a number of retail stores, restaurants, and other businesses.
The city is also home to a number of tourist attractions, including the Coleraine Historical Museum, the Coleraine Nature Center, and the Coleraine State Park. The city is also home to a number of festivals and events, including the Coleraine Summer Festival and the Coleraine Winter Festival.
Demographics
As of the 2010 census, the population of Coleraine was 2,072. The racial makeup of the city was 97.2% White, 0.7% African American, 0.3% Native American, 0.2% Asian, 0.1% Pacific Islander, 0.4% from other races, and 1.1% from two or more races. Hispanic or Latino of any race were 1.3% of the population.
The median household income in Coleraine was $37,917, and the median family income was $45,938. The per capita income was $19,945. About 11.2% of the population was below the poverty line.
Coleraine is a small city with a rich history, unique geography, and diverse economy. The city is home to a number of manufacturing companies, retail stores, restaurants, and other businesses. The city is also home to a number of tourist attractions, festivals, and events. The population of Coleraine is diverse, and the median household income is slightly below the state average.
Common Questions
What is Per Capita Income in Coleraine?
Per Capita income in Coleraine is $30,873.
What is the Median Family Income in Coleraine?
Median Family Income in Coleraine is $71,458.
What is the Median Household income in Coleraine?
Median Household Income in Coleraine is $65,221.
What is Income or Wage Gap in Coleraine?
Income or Wage Gap in Coleraine is 21.4%.
Women in Coleraine earn 78.6 cents for every dollar earned by a man.
What is Family Income Deficit in Coleraine?
Family Income Deficit in Coleraine is $10,128.
Families that are below poverty line in Coleraine earn $10,128 less on average than the poverty threshold level.
What is Inequality or Gini Index in Coleraine?
Inequality or Gini Index in Coleraine is 0.40.
What is the Total Population of Coleraine?
Total Population of Coleraine is 1,865.
What is the Total Male Population of Coleraine?
Total Male Population of Coleraine is 1,003.
What is the Total Female Population of Coleraine?
Total Female Population of Coleraine is 862.
What is the Ratio of Males per 100 Females in Coleraine?
There are 116.36 Males per 100 Females in Coleraine.
What is the Ratio of Females per 100 Males in Coleraine?
There are 85.94 Females per 100 Males in Coleraine.
What is the Median Population Age in Coleraine?
Median Population Age in Coleraine is 39.6 Years.
What is the Average Family Size in Coleraine
Average Family Size in Coleraine is 2.9 People.
What is the Average Household Size in Coleraine
Average Household Size in Coleraine is 2.7 People.
How Large is the Labor Force in Coleraine?
There are 902 People in the Labor Forcein in Coleraine.
What is the Percentage of People in the Labor Force in Coleraine?
62.4% of People are in the Labor Force in Coleraine.
What is the Unemployment Rate in Coleraine?
Unemployment Rate in Coleraine is 3.7%.