Cohasset, MN Map & Demographics
Cohasset Map
Cohasset Overview
$43,281
PER CAPITA INCOME
$84,306
AVG FAMILY INCOME
$76,989
AVG HOUSEHOLD INCOME
41.2%
WAGE / INCOME GAP [ % ]
58.8¢/ $1
WAGE / INCOME GAP [ $ ]
0.48
INEQUALITY / GINI INDEX
2,683
TOTAL POPULATION
1,280
MALE POPULATION
1,403
FEMALE POPULATION
91.23
MALES / 100 FEMALES
109.61
FEMALES / 100 MALES
41.8
MEDIAN AGE
3.0
AVG FAMILY SIZE
2.5
AVG HOUSEHOLD SIZE
1,251
LABOR FORCE [ PEOPLE ]
59.5%
PERCENT IN LABOR FORCE
10.2%
UNEMPLOYMENT RATE
Cohasset Zip Codes
Cohasset Area Codes
Income in Cohasset
Income Overview in Cohasset
Per Capita Income in Cohasset is $43,281, while median incomes of families and households are $84,306 and $76,989 respectively.
| Characteristic | Number | Measure |
| Per Capita Income | 2,683 | $43,281 |
| Median Family Income | 771 | $84,306 |
| Mean Family Income | 771 | $126,723 |
| Median Household Income | 1,049 | $76,989 |
| Mean Household Income | 1,049 | $108,181 |
| Income Deficit | 771 | $0 |
| Wage / Income Gap (%) | 2,683 | 41.22% |
| Wage / Income Gap ($) | 2,683 | 58.78¢ per $1 |
| Gini / Inequality Index | 2,683 | 0.48 |
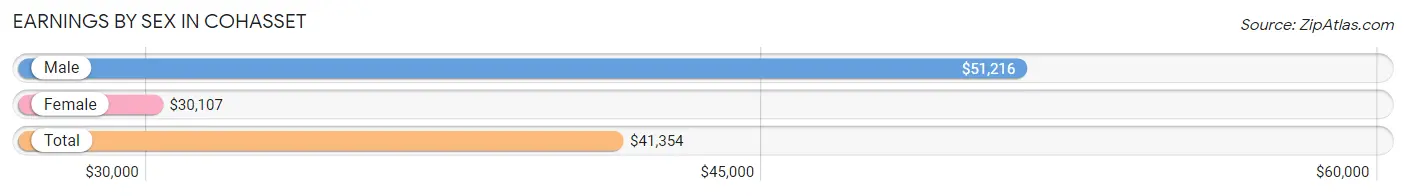
Earnings by Sex in Cohasset
Average Earnings in Cohasset are $41,354, $51,216 for men and $30,107 for women, a difference of 41.2%.
| Sex | Number | Average Earnings |
| Male | 592 (43.4%) | $51,216 |
| Female | 773 (56.6%) | $30,107 |
| Total | 1,365 (100.0%) | $41,354 |
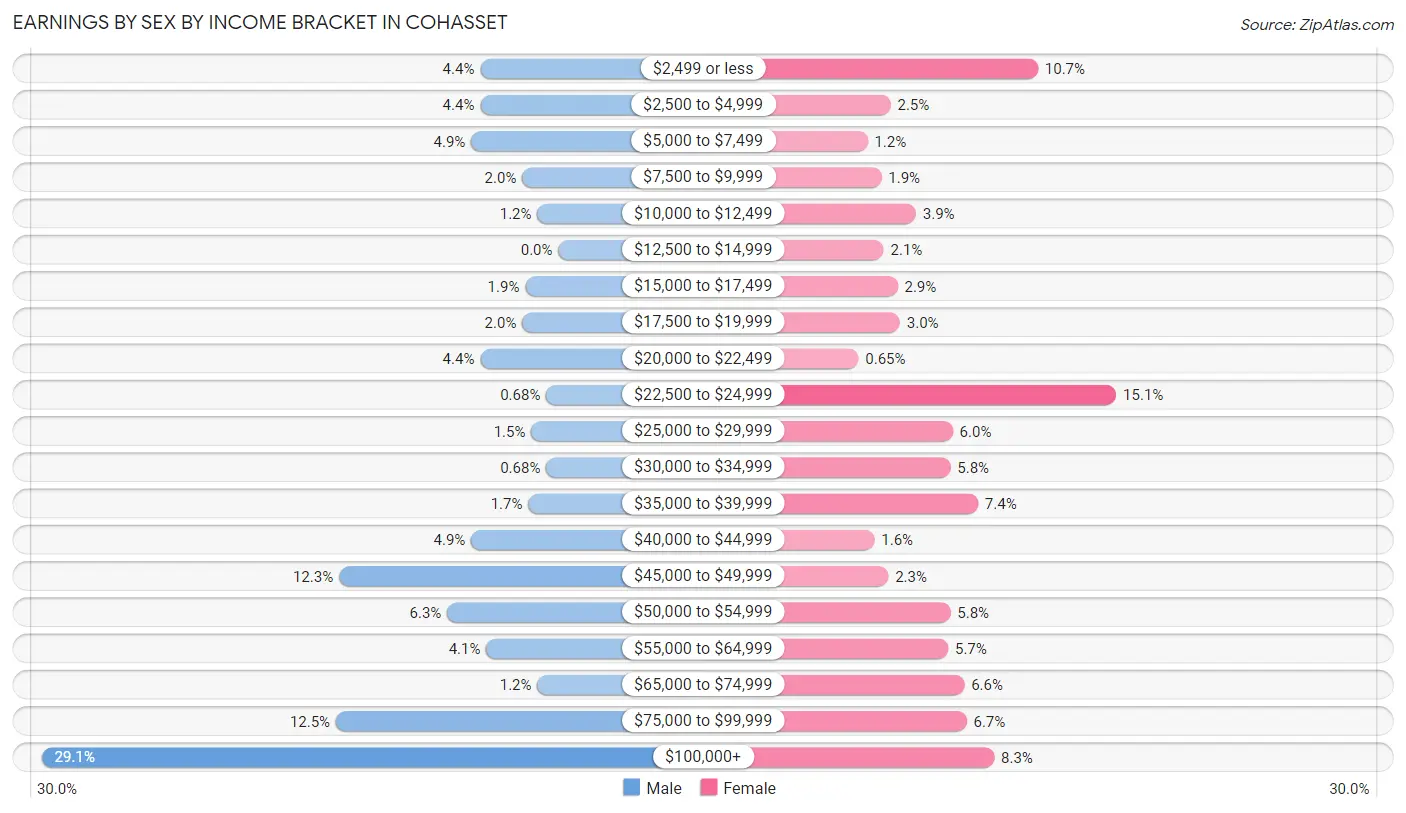
Earnings by Sex by Income Bracket in Cohasset
The most common earnings brackets in Cohasset are $100,000+ for men (172 | 29.0%) and $22,500 to $24,999 for women (117 | 15.1%).
| Income | Male | Female |
| $2,499 or less | 26 (4.4%) | 83 (10.7%) |
| $2,500 to $4,999 | 26 (4.4%) | 19 (2.5%) |
| $5,000 to $7,499 | 29 (4.9%) | 9 (1.2%) |
| $7,500 to $9,999 | 12 (2.0%) | 15 (1.9%) |
| $10,000 to $12,499 | 7 (1.2%) | 30 (3.9%) |
| $12,500 to $14,999 | 0 (0.0%) | 16 (2.1%) |
| $15,000 to $17,499 | 11 (1.9%) | 22 (2.9%) |
| $17,500 to $19,999 | 12 (2.0%) | 23 (3.0%) |
| $20,000 to $22,499 | 26 (4.4%) | 5 (0.6%) |
| $22,500 to $24,999 | 4 (0.7%) | 117 (15.1%) |
| $25,000 to $29,999 | 9 (1.5%) | 46 (5.9%) |
| $30,000 to $34,999 | 4 (0.7%) | 45 (5.8%) |
| $35,000 to $39,999 | 10 (1.7%) | 57 (7.4%) |
| $40,000 to $44,999 | 29 (4.9%) | 12 (1.5%) |
| $45,000 to $49,999 | 73 (12.3%) | 18 (2.3%) |
| $50,000 to $54,999 | 37 (6.2%) | 45 (5.8%) |
| $55,000 to $64,999 | 24 (4.1%) | 44 (5.7%) |
| $65,000 to $74,999 | 7 (1.2%) | 51 (6.6%) |
| $75,000 to $99,999 | 74 (12.5%) | 52 (6.7%) |
| $100,000+ | 172 (29.0%) | 64 (8.3%) |
| Total | 592 (100.0%) | 773 (100.0%) |
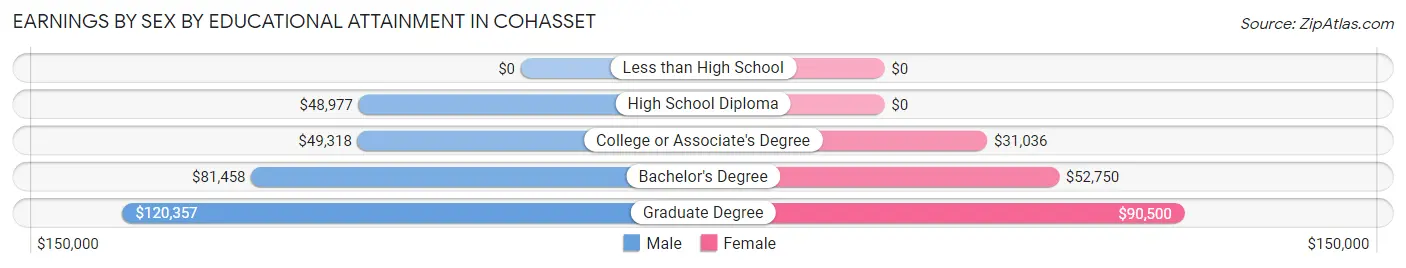
Earnings by Sex by Educational Attainment in Cohasset
Average earnings in Cohasset are $52,162 for men and $38,000 for women, a difference of 27.2%. Men with an educational attainment of graduate degree enjoy the highest average annual earnings of $120,357, while those with high school diploma education earn the least with $48,977. Women with an educational attainment of graduate degree earn the most with the average annual earnings of $90,500, while those with college or associate's degree education have the smallest earnings of $31,036.
| Educational Attainment | Male Income | Female Income |
| Less than High School | - | - |
| High School Diploma | $48,977 | $0 |
| College or Associate's Degree | $49,318 | $31,036 |
| Bachelor's Degree | $81,458 | $52,750 |
| Graduate Degree | $120,357 | $90,500 |
| Total | $52,162 | $38,000 |
Family Income in Cohasset
Family Income Brackets in Cohasset
According to the Cohasset family income data, there are 144 families falling into the $75,000 to $99,999 income range, which is the most common income bracket and makes up 18.7% of all families. Conversely, the $10,000 to $14,999 income bracket is the least frequent group with only 7 families (0.9%) belonging to this category.
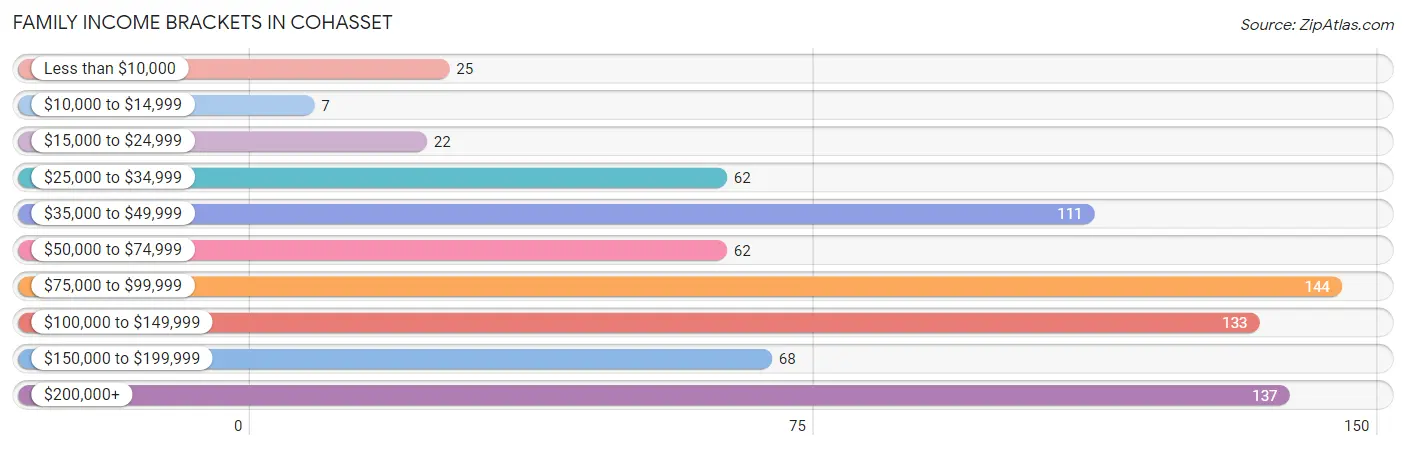
| Income Bracket | # Families | % Families |
| Less than $10,000 | 25 | 3.2% |
| $10,000 to $14,999 | 7 | 0.9% |
| $15,000 to $24,999 | 22 | 2.9% |
| $25,000 to $34,999 | 62 | 8.0% |
| $35,000 to $49,999 | 111 | 14.4% |
| $50,000 to $74,999 | 62 | 8.0% |
| $75,000 to $99,999 | 144 | 18.7% |
| $100,000 to $149,999 | 133 | 17.3% |
| $150,000 to $199,999 | 68 | 8.8% |
| $200,000+ | 137 | 17.8% |
Family Income by Famaliy Size in Cohasset
4-person families (120 | 15.6%) account for the highest median family income in Cohasset with $175,167 per family, while 4-person families (120 | 15.6%) have the highest median income of $43,792 per family member.
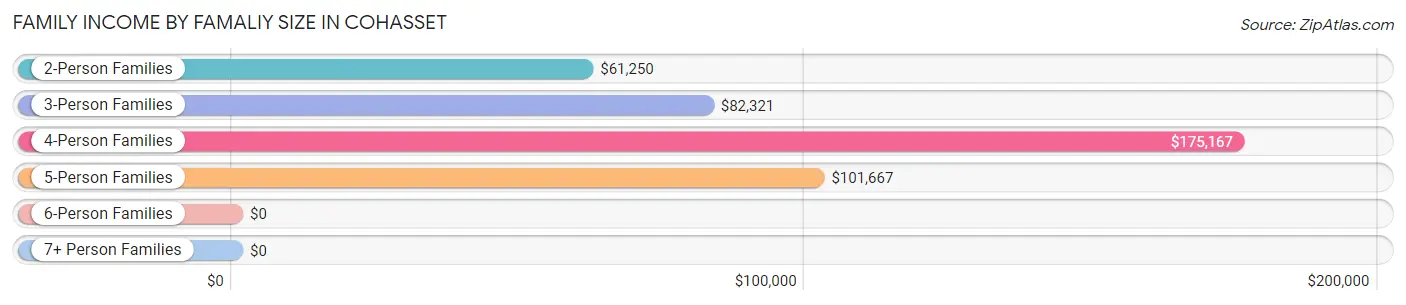
| Income Bracket | # Families | Median Income |
| 2-Person Families | 442 (57.3%) | $61,250 |
| 3-Person Families | 145 (18.8%) | $82,321 |
| 4-Person Families | 120 (15.6%) | $175,167 |
| 5-Person Families | 54 (7.0%) | $101,667 |
| 6-Person Families | 10 (1.3%) | $0 |
| 7+ Person Families | 0 (0.0%) | $0 |
| Total | 771 (100.0%) | $84,306 |
Family Income by Number of Earners in Cohasset
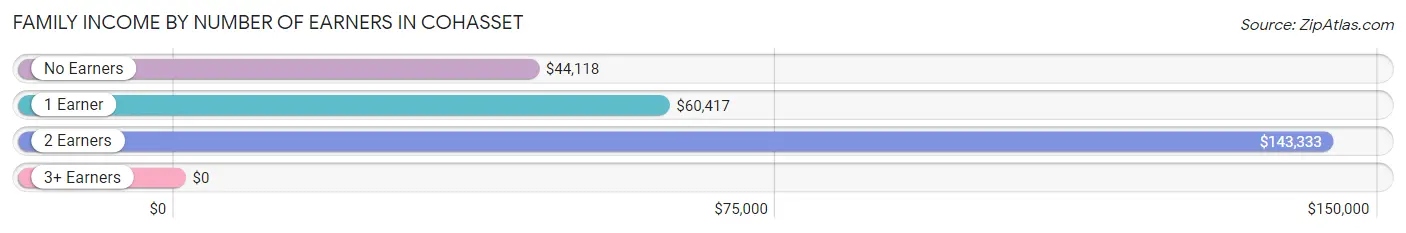
| Number of Earners | # Families | Median Income |
| No Earners | 216 (28.0%) | $44,118 |
| 1 Earner | 169 (21.9%) | $60,417 |
| 2 Earners | 312 (40.5%) | $143,333 |
| 3+ Earners | 74 (9.6%) | $0 |
| Total | 771 (100.0%) | $84,306 |
Household Income in Cohasset
Household Income Brackets in Cohasset
With 200 households falling in the category, the $35,000 to $49,999 income range is the most frequent in Cohasset, accounting for 19.1% of all households. In contrast, only 16 households (1.5%) fall into the $10,000 to $14,999 income bracket, making it the least populous group.
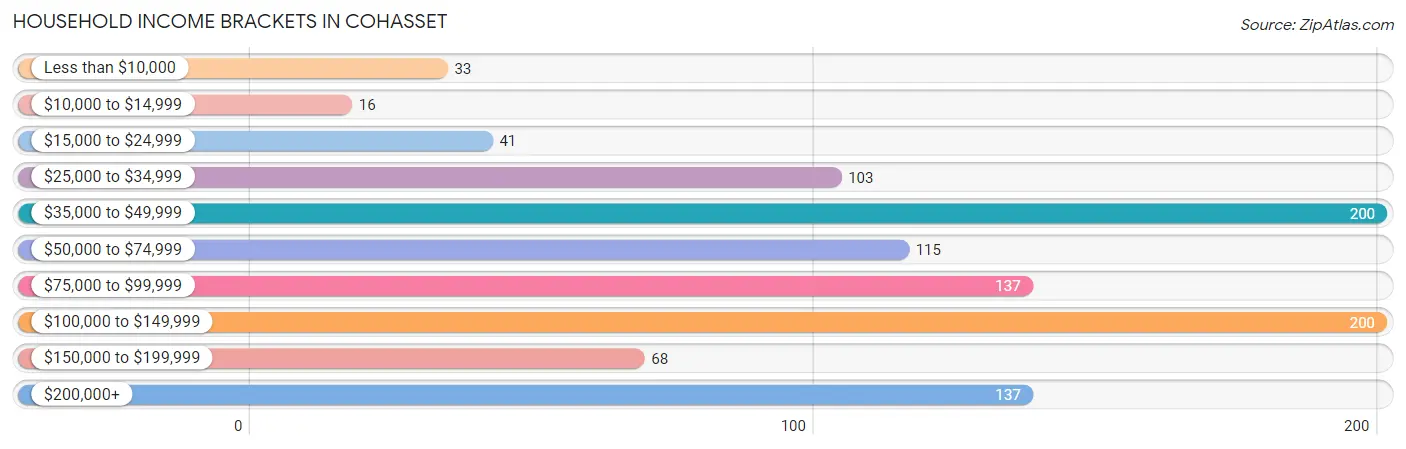
| Income Bracket | # Households | % Households |
| Less than $10,000 | 33 | 3.1% |
| $10,000 to $14,999 | 16 | 1.5% |
| $15,000 to $24,999 | 41 | 3.9% |
| $25,000 to $34,999 | 103 | 9.8% |
| $35,000 to $49,999 | 200 | 19.1% |
| $50,000 to $74,999 | 115 | 11.0% |
| $75,000 to $99,999 | 137 | 13.1% |
| $100,000 to $149,999 | 200 | 19.1% |
| $150,000 to $199,999 | 68 | 6.5% |
| $200,000+ | 137 | 13.1% |
Household Income by Householder Age in Cohasset
The median household income in Cohasset is $76,989, with the highest median household income of $110,707 found in the 45 to 64 years age bracket for the primary householder. A total of 361 households (34.4%) fall into this category. Meanwhile, the 15 to 24 years age bracket for the primary householder has the lowest median household income of $0, with 15 households (1.4%) in this group.
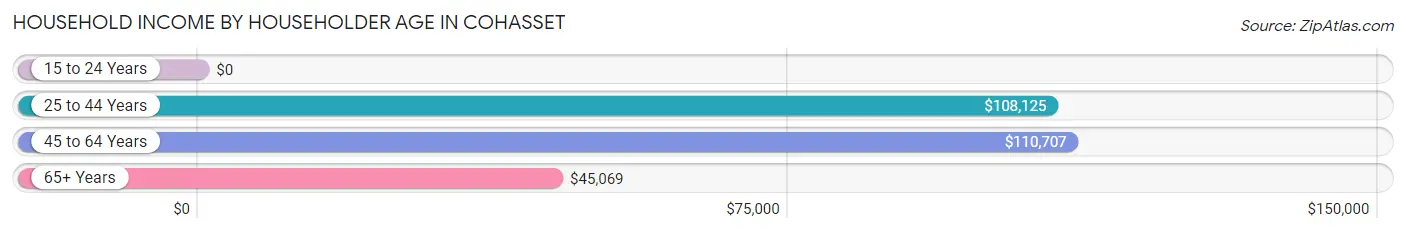
| Income Bracket | # Households | Median Income |
| 15 to 24 Years | 15 (1.4%) | $0 |
| 25 to 44 Years | 274 (26.1%) | $108,125 |
| 45 to 64 Years | 361 (34.4%) | $110,707 |
| 65+ Years | 399 (38.0%) | $45,069 |
| Total | 1,049 (100.0%) | $76,989 |
Poverty in Cohasset
Income Below Poverty by Sex and Age in Cohasset
With 5.7% poverty level for males and 5.1% for females among the residents of Cohasset, 18 to 24 year old males and 15 year old females are the most vulnerable to poverty, with 15 males (65.2%) and 5 females (41.7%) in their respective age groups living below the poverty level.
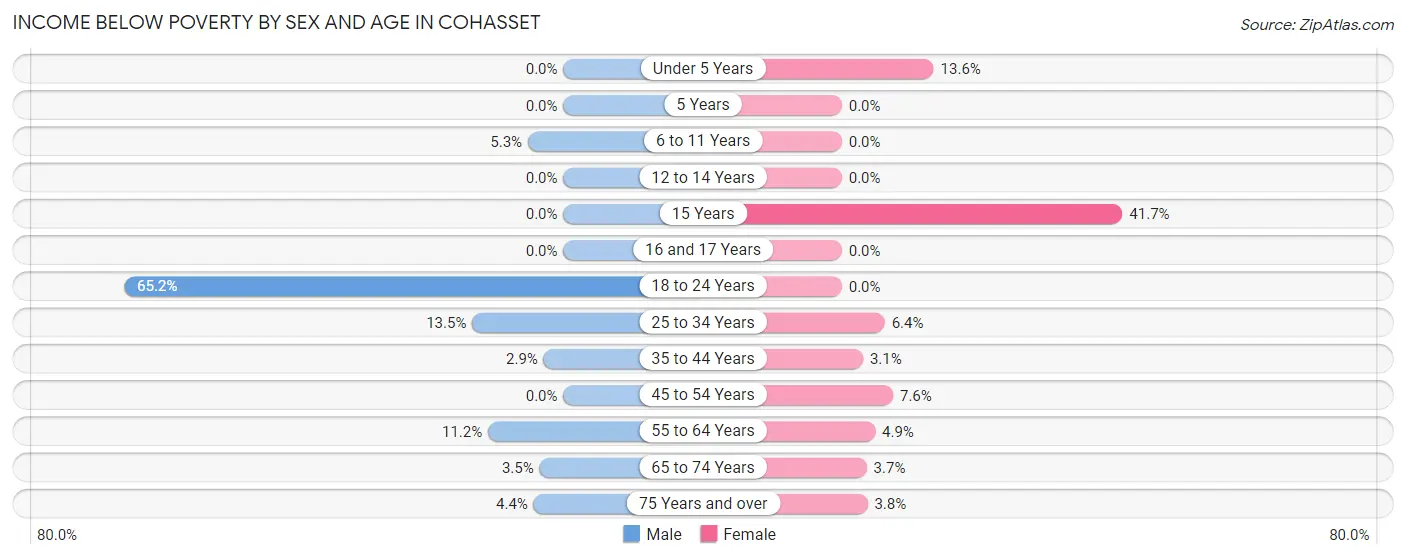
| Age Bracket | Male | Female |
| Under 5 Years | 0 (0.0%) | 21 (13.6%) |
| 5 Years | 0 (0.0%) | 0 (0.0%) |
| 6 to 11 Years | 4 (5.3%) | 0 (0.0%) |
| 12 to 14 Years | 0 (0.0%) | 0 (0.0%) |
| 15 Years | 0 (0.0%) | 5 (41.7%) |
| 16 and 17 Years | 0 (0.0%) | 0 (0.0%) |
| 18 to 24 Years | 15 (65.2%) | 0 (0.0%) |
| 25 to 34 Years | 18 (13.5%) | 10 (6.4%) |
| 35 to 44 Years | 5 (2.9%) | 5 (3.1%) |
| 45 to 54 Years | 0 (0.0%) | 7 (7.6%) |
| 55 to 64 Years | 18 (11.2%) | 12 (4.9%) |
| 65 to 74 Years | 9 (3.5%) | 8 (3.7%) |
| 75 Years and over | 4 (4.4%) | 4 (3.8%) |
| Total | 73 (5.7%) | 72 (5.1%) |
Income Above Poverty by Sex and Age in Cohasset
According to the poverty statistics in Cohasset, males aged under 5 years and females aged 5 years are the age groups that are most secure financially, with 100.0% of males and 100.0% of females in these age groups living above the poverty line.
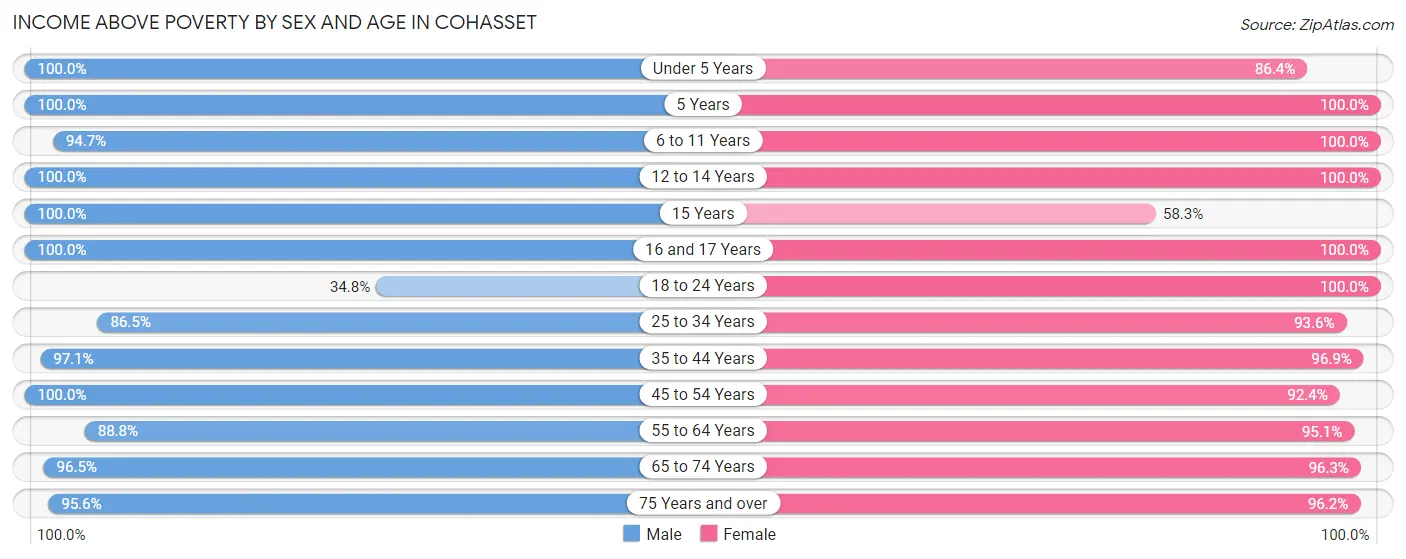
| Age Bracket | Male | Female |
| Under 5 Years | 112 (100.0%) | 133 (86.4%) |
| 5 Years | 35 (100.0%) | 24 (100.0%) |
| 6 to 11 Years | 72 (94.7%) | 55 (100.0%) |
| 12 to 14 Years | 91 (100.0%) | 8 (100.0%) |
| 15 Years | 13 (100.0%) | 7 (58.3%) |
| 16 and 17 Years | 5 (100.0%) | 24 (100.0%) |
| 18 to 24 Years | 8 (34.8%) | 153 (100.0%) |
| 25 to 34 Years | 115 (86.5%) | 147 (93.6%) |
| 35 to 44 Years | 166 (97.1%) | 154 (96.9%) |
| 45 to 54 Years | 115 (100.0%) | 85 (92.4%) |
| 55 to 64 Years | 143 (88.8%) | 231 (95.1%) |
| 65 to 74 Years | 245 (96.5%) | 209 (96.3%) |
| 75 Years and over | 87 (95.6%) | 101 (96.2%) |
| Total | 1,207 (94.3%) | 1,331 (94.9%) |
Income Below Poverty Among Married-Couple Families in Cohasset
The poverty statistics for married-couple families in Cohasset show that 3.0% or 21 of the total 695 families live below the poverty line. Families with no children have the highest poverty rate of 4.7%, comprising of 21 families. On the other hand, families with 1 or 2 children have the lowest poverty rate of 0.0%, which includes 0 families.
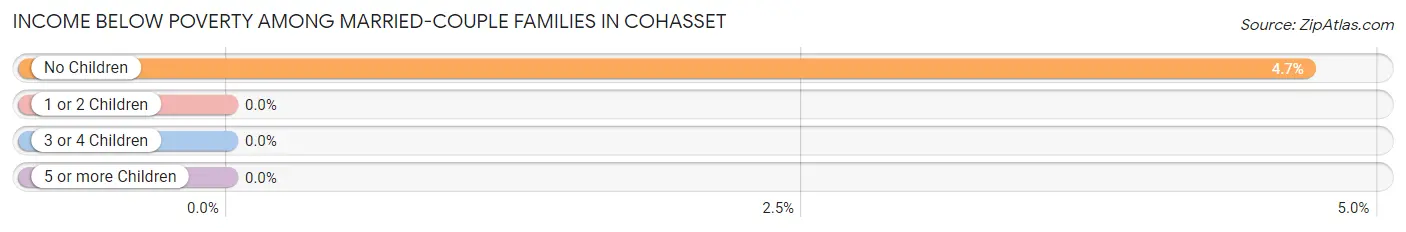
| Children | Above Poverty | Below Poverty |
| No Children | 427 (95.3%) | 21 (4.7%) |
| 1 or 2 Children | 188 (100.0%) | 0 (0.0%) |
| 3 or 4 Children | 59 (100.0%) | 0 (0.0%) |
| 5 or more Children | 0 (0.0%) | 0 (0.0%) |
| Total | 674 (97.0%) | 21 (3.0%) |
Income Below Poverty Among Single-Parent Households in Cohasset
According to the poverty data in Cohasset, 35.7% or 15 single-father households and 11.8% or 4 single-mother households are living below the poverty line. Among single-father households, those with 1 or 2 children have the highest poverty rate, with 15 households (53.6%) experiencing poverty. Likewise, among single-mother households, those with 1 or 2 children have the highest poverty rate, with 4 households (44.4%) falling below the poverty line.
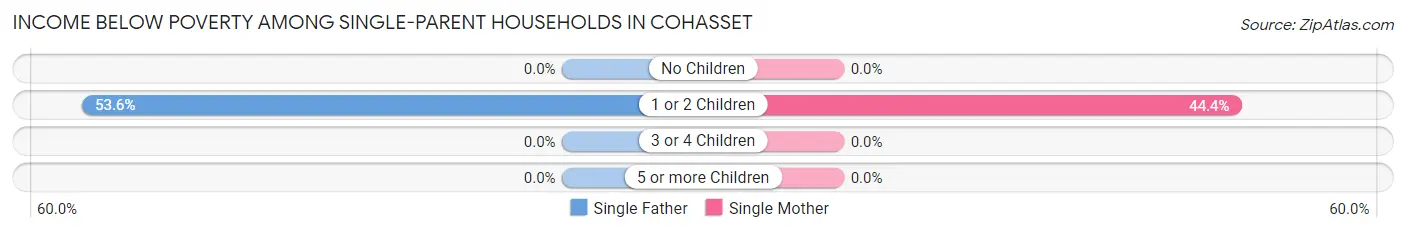
| Children | Single Father | Single Mother |
| No Children | 0 (0.0%) | 0 (0.0%) |
| 1 or 2 Children | 15 (53.6%) | 4 (44.4%) |
| 3 or 4 Children | 0 (0.0%) | 0 (0.0%) |
| 5 or more Children | 0 (0.0%) | 0 (0.0%) |
| Total | 15 (35.7%) | 4 (11.8%) |
Income Below Poverty Among Married-Couple vs Single-Parent Households in Cohasset
The poverty data for Cohasset shows that 21 of the married-couple family households (3.0%) and 19 of the single-parent households (25.0%) are living below the poverty level. Within the married-couple family households, those with no children have the highest poverty rate, with 21 households (4.7%) falling below the poverty line. Among the single-parent households, those with 1 or 2 children have the highest poverty rate, with 19 household (51.3%) living below poverty.
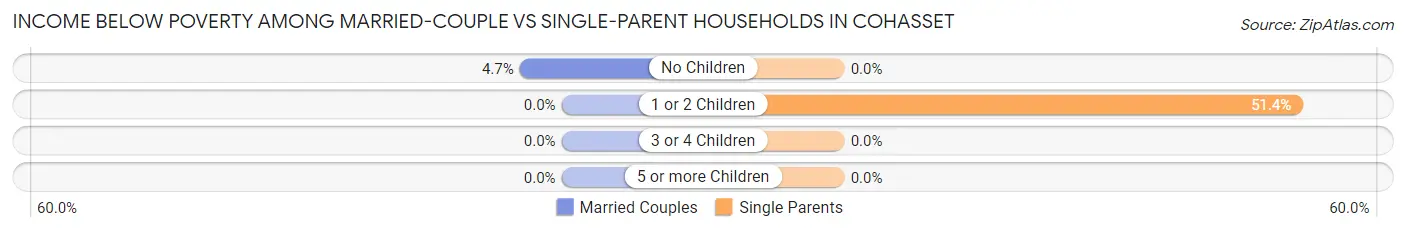
| Children | Married-Couple Families | Single-Parent Households |
| No Children | 21 (4.7%) | 0 (0.0%) |
| 1 or 2 Children | 0 (0.0%) | 19 (51.3%) |
| 3 or 4 Children | 0 (0.0%) | 0 (0.0%) |
| 5 or more Children | 0 (0.0%) | 0 (0.0%) |
| Total | 21 (3.0%) | 19 (25.0%) |
Race in Cohasset
The most populous races in Cohasset are White / Caucasian (2,473 | 92.2%), Two or more Races (101 | 3.8%), and Hispanic or Latino (76 | 2.8%).
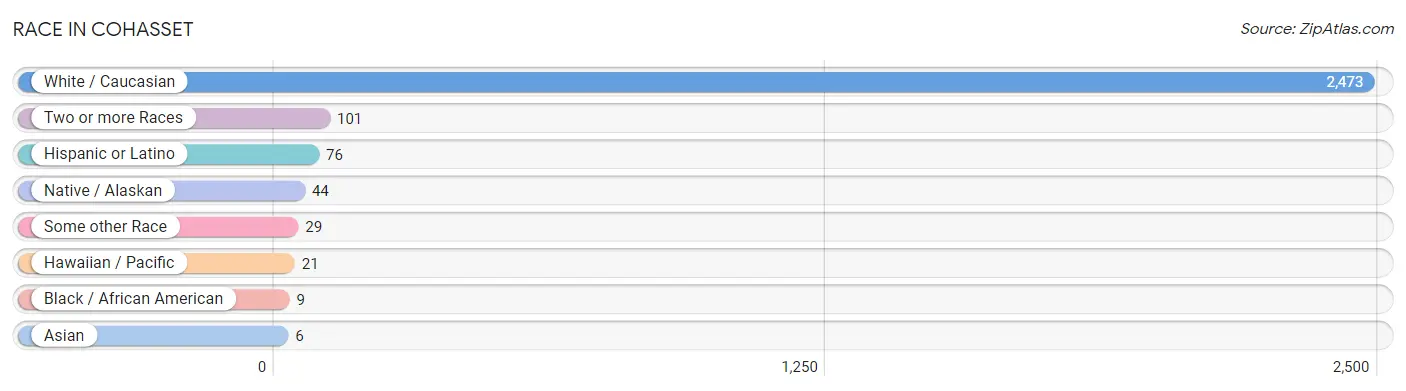
| Race | # Population | % Population |
| Asian | 6 | 0.2% |
| Black / African American | 9 | 0.3% |
| Hawaiian / Pacific | 21 | 0.8% |
| Hispanic or Latino | 76 | 2.8% |
| Native / Alaskan | 44 | 1.6% |
| White / Caucasian | 2,473 | 92.2% |
| Two or more Races | 101 | 3.8% |
| Some other Race | 29 | 1.1% |
| Total | 2,683 | 100.0% |
Ancestry in Cohasset
The most populous ancestries reported in Cohasset are German (709 | 26.4%), Norwegian (352 | 13.1%), Irish (272 | 10.1%), English (212 | 7.9%), and Finnish (170 | 6.3%), together accounting for 63.9% of all Cohasset residents.
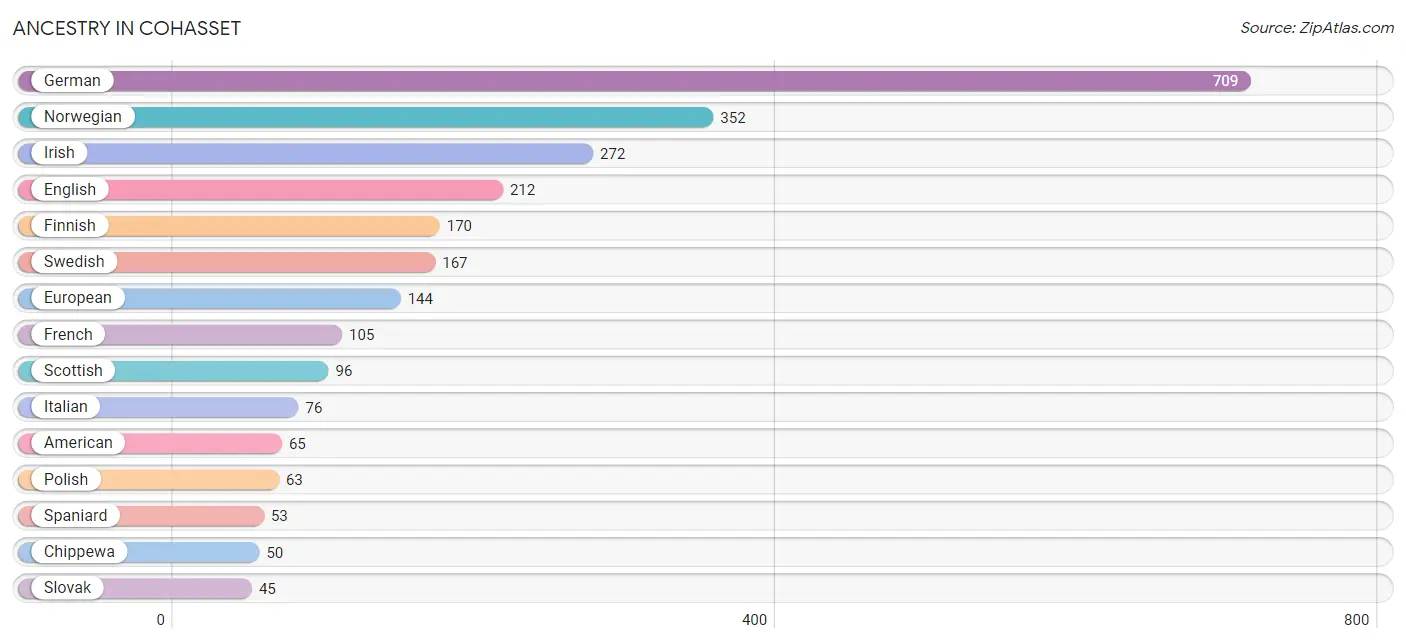
| Ancestry | # Population | % Population |
| American | 65 | 2.4% |
| Austrian | 4 | 0.2% |
| Burmese | 6 | 0.2% |
| Canadian | 5 | 0.2% |
| Cherokee | 18 | 0.7% |
| Chippewa | 50 | 1.9% |
| Croatian | 13 | 0.5% |
| Czech | 28 | 1.0% |
| Danish | 29 | 1.1% |
| Dutch | 25 | 0.9% |
| English | 212 | 7.9% |
| European | 144 | 5.4% |
| Finnish | 170 | 6.3% |
| French | 105 | 3.9% |
| French Canadian | 24 | 0.9% |
| German | 709 | 26.4% |
| Irish | 272 | 10.1% |
| Italian | 76 | 2.8% |
| Native Hawaiian | 21 | 0.8% |
| Northern European | 28 | 1.0% |
| Norwegian | 352 | 13.1% |
| Polish | 63 | 2.4% |
| Russian | 17 | 0.6% |
| Scandinavian | 44 | 1.6% |
| Scotch-Irish | 9 | 0.3% |
| Scottish | 96 | 3.6% |
| Slovak | 45 | 1.7% |
| Spaniard | 53 | 2.0% |
| Swedish | 167 | 6.2% |
| Swiss | 4 | 0.2% |
| Ukrainian | 1 | 0.0% |
| Welsh | 7 | 0.3% | View All 32 Rows |
Immigrants in Cohasset
The most numerous immigrant groups reported in Cohasset came from Asia (6 | 0.2%), Eastern Asia (6 | 0.2%), Korea (6 | 0.2%), Canada (5 | 0.2%), and Eastern Europe (1 | 0.0%), together accounting for 0.9% of all Cohasset residents.
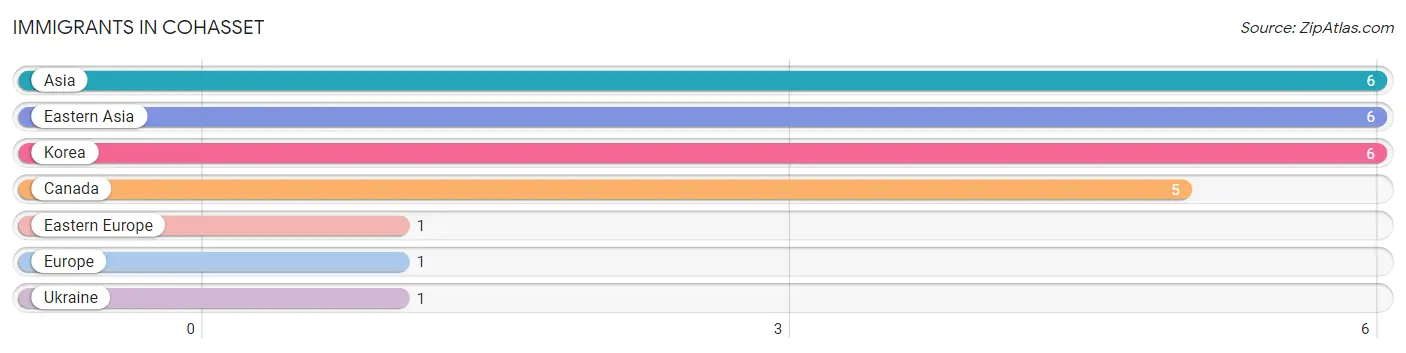
| Immigration Origin | # Population | % Population |
| Asia | 6 | 0.2% |
| Canada | 5 | 0.2% |
| Eastern Asia | 6 | 0.2% |
| Eastern Europe | 1 | 0.0% |
| Europe | 1 | 0.0% |
| Korea | 6 | 0.2% |
| Ukraine | 1 | 0.0% | View All 7 Rows |
Sex and Age in Cohasset
Sex and Age in Cohasset
The most populous age groups in Cohasset are 65 to 69 Years (143 | 11.2%) for men and 60 to 64 Years (174 | 12.4%) for women.
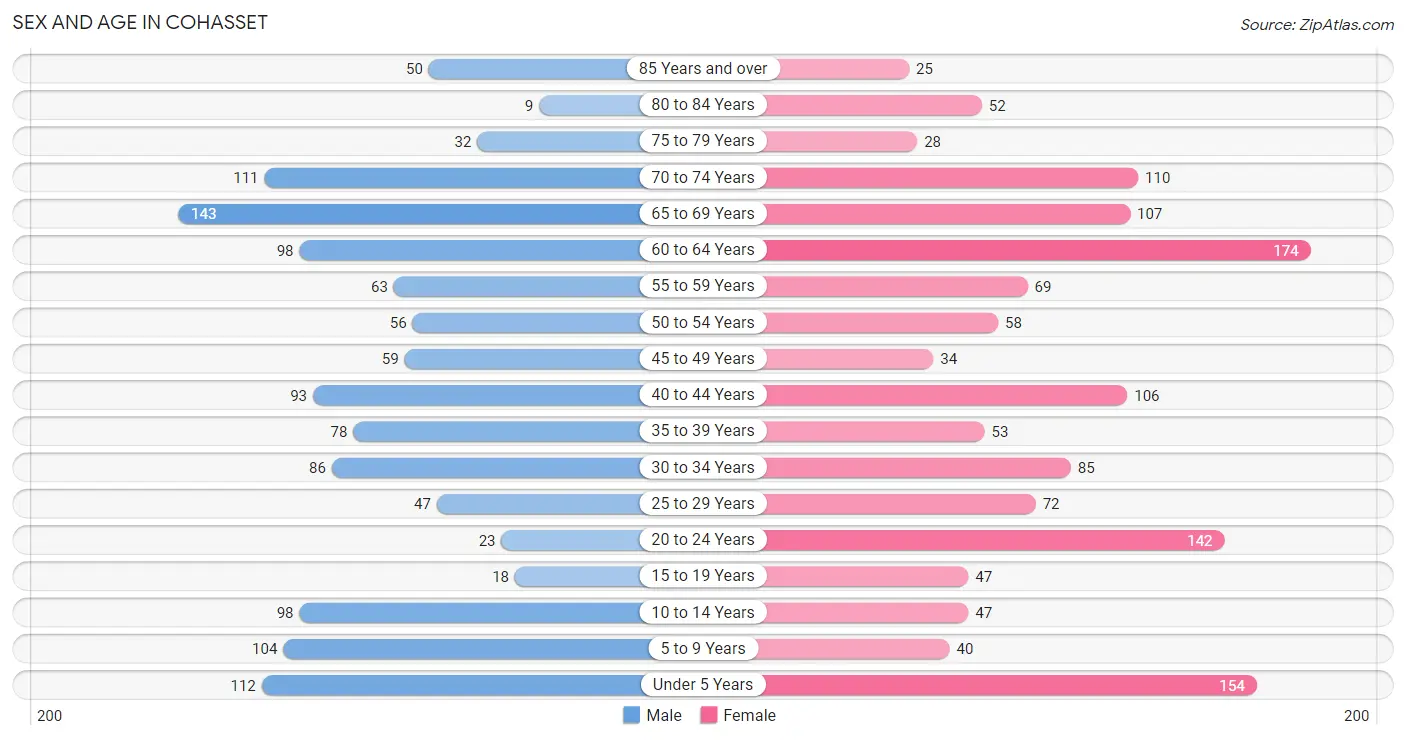
| Age Bracket | Male | Female |
| Under 5 Years | 112 (8.7%) | 154 (11.0%) |
| 5 to 9 Years | 104 (8.1%) | 40 (2.9%) |
| 10 to 14 Years | 98 (7.7%) | 47 (3.4%) |
| 15 to 19 Years | 18 (1.4%) | 47 (3.4%) |
| 20 to 24 Years | 23 (1.8%) | 142 (10.1%) |
| 25 to 29 Years | 47 (3.7%) | 72 (5.1%) |
| 30 to 34 Years | 86 (6.7%) | 85 (6.1%) |
| 35 to 39 Years | 78 (6.1%) | 53 (3.8%) |
| 40 to 44 Years | 93 (7.3%) | 106 (7.6%) |
| 45 to 49 Years | 59 (4.6%) | 34 (2.4%) |
| 50 to 54 Years | 56 (4.4%) | 58 (4.1%) |
| 55 to 59 Years | 63 (4.9%) | 69 (4.9%) |
| 60 to 64 Years | 98 (7.7%) | 174 (12.4%) |
| 65 to 69 Years | 143 (11.2%) | 107 (7.6%) |
| 70 to 74 Years | 111 (8.7%) | 110 (7.8%) |
| 75 to 79 Years | 32 (2.5%) | 28 (2.0%) |
| 80 to 84 Years | 9 (0.7%) | 52 (3.7%) |
| 85 Years and over | 50 (3.9%) | 25 (1.8%) |
| Total | 1,280 (100.0%) | 1,403 (100.0%) |
Families and Households in Cohasset
Median Family Size in Cohasset
The median family size in Cohasset is 2.99 persons per family, with single female/mother families (34 | 4.4%) accounting for the largest median family size of 3.68 persons per family. On the other hand, single male/father families (42 | 5.4%) represent the smallest median family size with 2.55 persons per family.
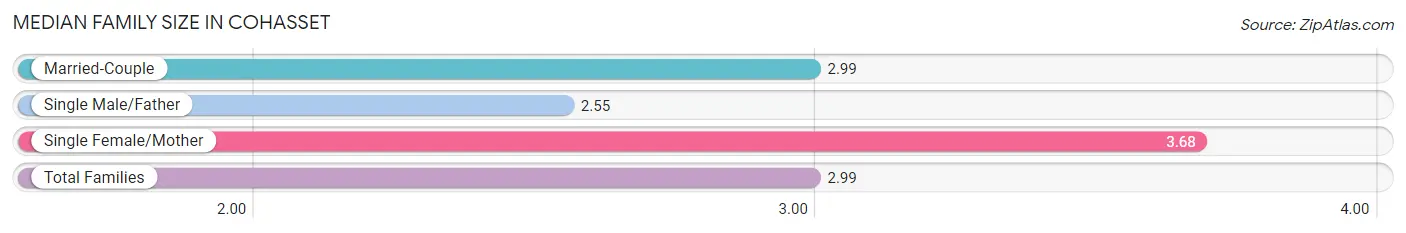
| Family Type | # Families | Family Size |
| Married-Couple | 695 (90.1%) | 2.99 |
| Single Male/Father | 42 (5.4%) | 2.55 |
| Single Female/Mother | 34 (4.4%) | 3.68 |
| Total Families | 771 (100.0%) | 2.99 |
Median Household Size in Cohasset
The median household size in Cohasset is 2.55 persons per household, with single female/mother households (34 | 3.2%) accounting for the largest median household size of 4.09 persons per household. non-family households (278 | 26.5%) represent the smallest median household size with 1.14 persons per household.
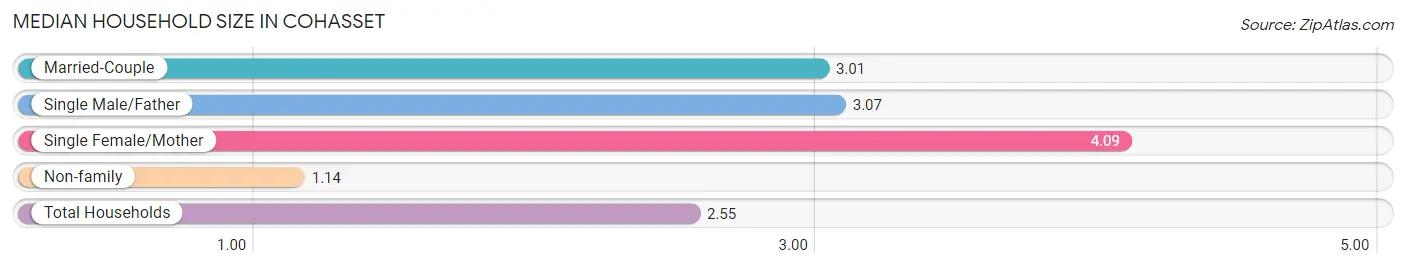
| Household Type | # Households | Household Size |
| Married-Couple | 695 (66.2%) | 3.01 |
| Single Male/Father | 42 (4.0%) | 3.07 |
| Single Female/Mother | 34 (3.2%) | 4.09 |
| Non-family | 278 (26.5%) | 1.14 |
| Total Households | 1,049 (100.0%) | 2.55 |
Household Size by Marriage Status in Cohasset
Out of a total of 1,049 households in Cohasset, 771 (73.5%) are family households, while 278 (26.5%) are nonfamily households. The most numerous type of family households are 2-person households, comprising 421, and the most common type of nonfamily households are 1-person households, comprising 247.
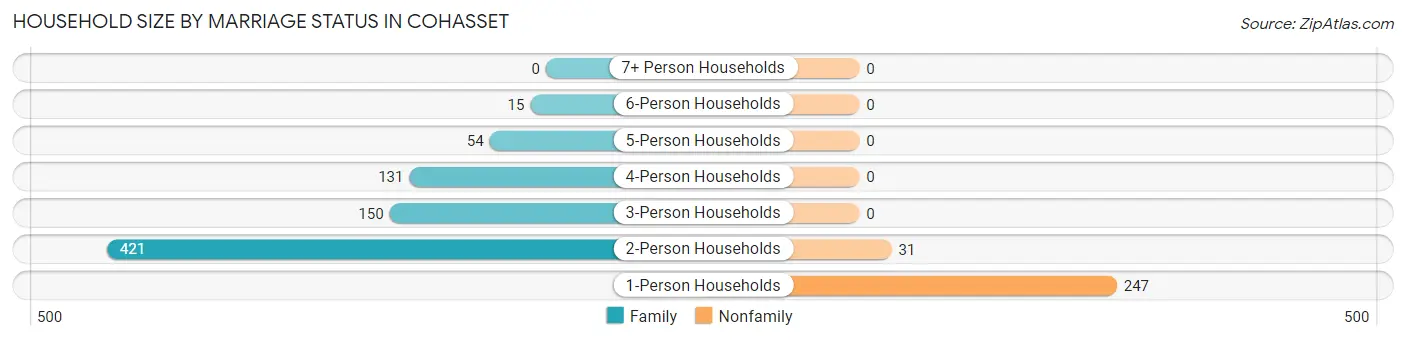
| Household Size | Family Households | Nonfamily Households |
| 1-Person Households | - | 247 (23.5%) |
| 2-Person Households | 421 (40.1%) | 31 (3.0%) |
| 3-Person Households | 150 (14.3%) | 0 (0.0%) |
| 4-Person Households | 131 (12.5%) | 0 (0.0%) |
| 5-Person Households | 54 (5.1%) | 0 (0.0%) |
| 6-Person Households | 15 (1.4%) | 0 (0.0%) |
| 7+ Person Households | 0 (0.0%) | 0 (0.0%) |
| Total | 771 (73.5%) | 278 (26.5%) |
Female Fertility in Cohasset
Fertility by Age in Cohasset
Average fertility rate in Cohasset is 84.0 births per 1,000 women. Women in the age bracket of 20 to 34 years have the highest fertility rate with 154.0 births per 1,000 women. Women in the age bracket of 20 to 34 years acount for 100.0% of all women with births.
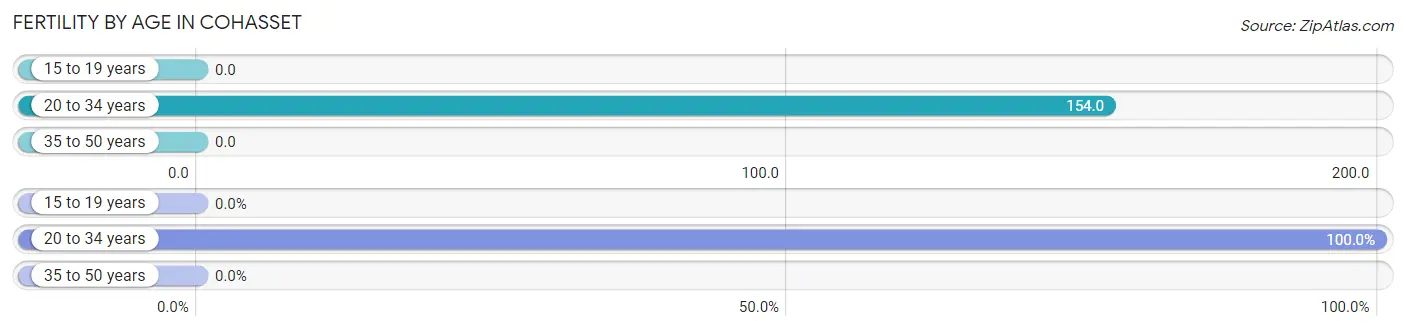
| Age Bracket | Women with Births | Births / 1,000 Women |
| 15 to 19 years | 0 (0.0%) | 0.0 |
| 20 to 34 years | 46 (100.0%) | 154.0 |
| 35 to 50 years | 0 (0.0%) | 0.0 |
| Total | 46 (100.0%) | 84.0 |
Fertility by Age by Marriage Status in Cohasset
67.4% of women with births (46) in Cohasset are married. The highest percentage of unmarried women with births falls into 20 to 34 years age bracket with 32.6% of them unmarried at the time of birth, while the lowest percentage of unmarried women with births belong to 20 to 34 years age bracket with 32.6% of them unmarried.
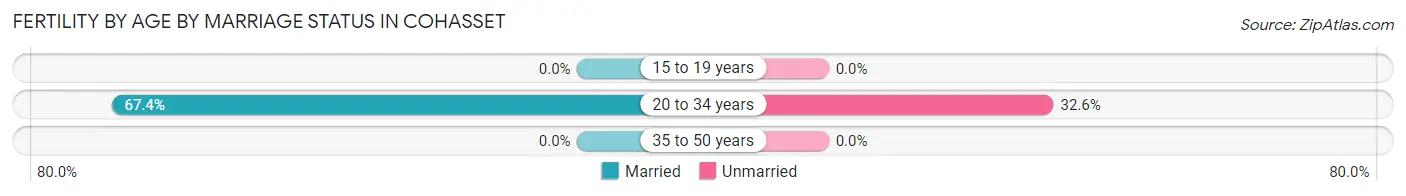
| Age Bracket | Married | Unmarried |
| 15 to 19 years | 0 (0.0%) | 0 (0.0%) |
| 20 to 34 years | 31 (67.4%) | 15 (32.6%) |
| 35 to 50 years | 0 (0.0%) | 0 (0.0%) |
| Total | 31 (67.4%) | 15 (32.6%) |
Fertility by Education in Cohasset
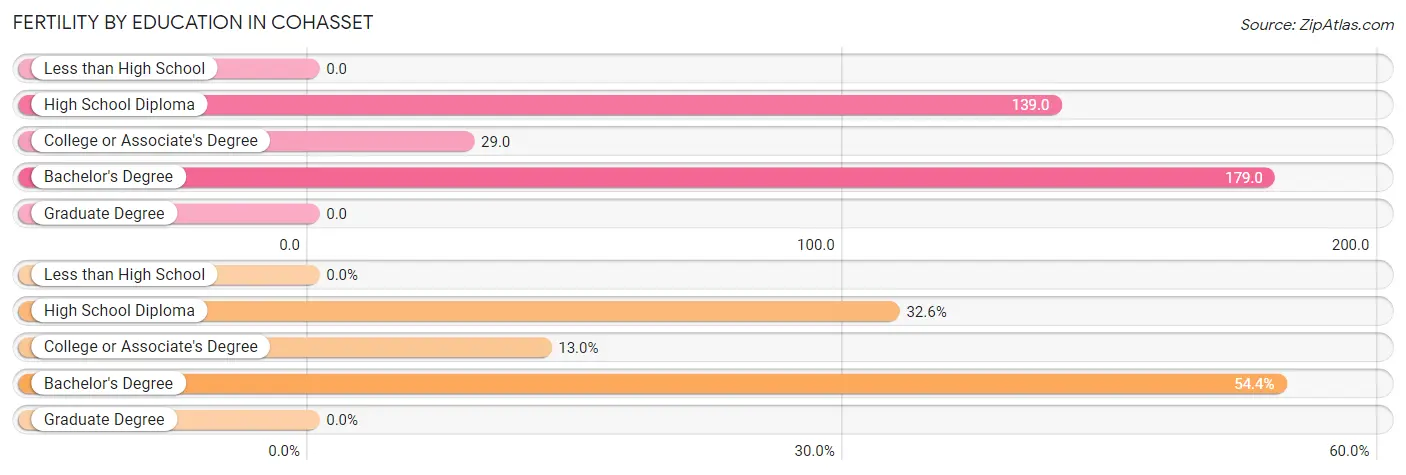
| Educational Attainment | Women with Births | Births / 1,000 Women |
| Less than High School | 0 (0.0%) | 0.0 |
| High School Diploma | 15 (32.6%) | 139.0 |
| College or Associate's Degree | 6 (13.0%) | 29.0 |
| Bachelor's Degree | 25 (54.3%) | 179.0 |
| Graduate Degree | 0 (0.0%) | 0.0 |
| Total | 46 (100.0%) | 84.0 |
Fertility by Education by Marriage Status in Cohasset
32.6% of women with births in Cohasset are unmarried. Women with the educational attainment of college or associate's degree are most likely to be married with 100.0% of them married at childbirth, while women with the educational attainment of high school diploma are least likely to be married with 100.0% of them unmarried at childbirth.
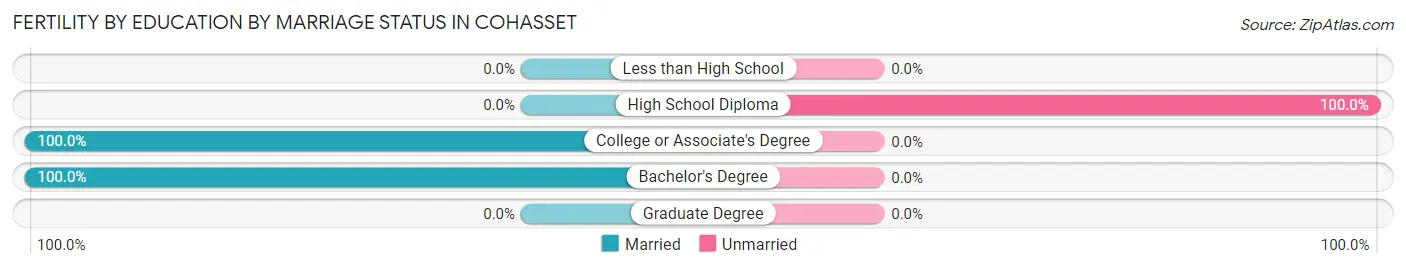
| Educational Attainment | Married | Unmarried |
| Less than High School | 0 (0.0%) | 0 (0.0%) |
| High School Diploma | 0 (0.0%) | 15 (100.0%) |
| College or Associate's Degree | 6 (100.0%) | 0 (0.0%) |
| Bachelor's Degree | 25 (100.0%) | 0 (0.0%) |
| Graduate Degree | 0 (0.0%) | 0 (0.0%) |
| Total | 31 (67.4%) | 15 (32.6%) |
Employment Characteristics in Cohasset
Employment by Class of Employer in Cohasset
Among the 1,087 employed individuals in Cohasset, private company employees (651 | 59.9%), not-for-profit organizations (143 | 13.2%), and local government employees (136 | 12.5%) make up the most common classes of employment.
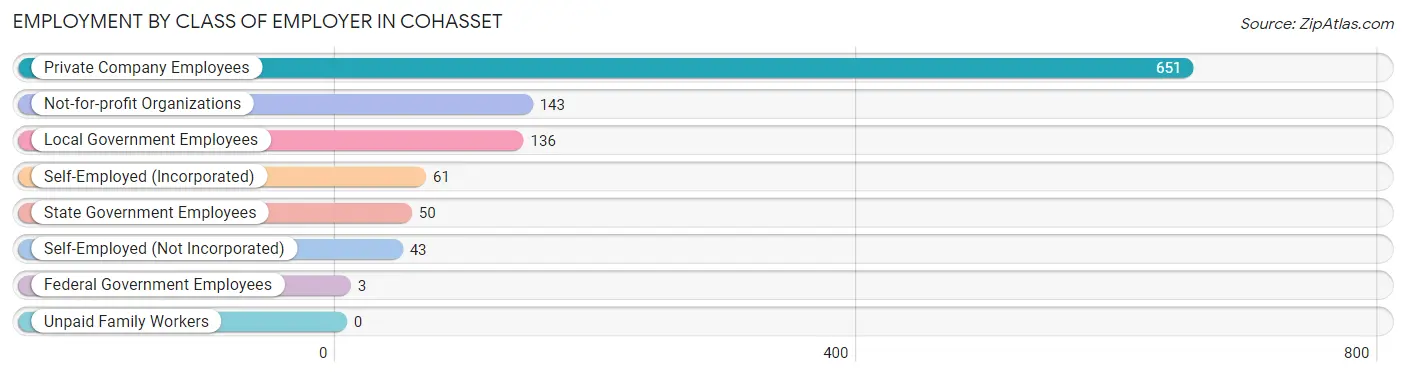
| Employer Class | # Employees | % Employees |
| Private Company Employees | 651 | 59.9% |
| Self-Employed (Incorporated) | 61 | 5.6% |
| Self-Employed (Not Incorporated) | 43 | 4.0% |
| Not-for-profit Organizations | 143 | 13.2% |
| Local Government Employees | 136 | 12.5% |
| State Government Employees | 50 | 4.6% |
| Federal Government Employees | 3 | 0.3% |
| Unpaid Family Workers | 0 | 0.0% |
| Total | 1,087 | 100.0% |
Employment Status by Age in Cohasset
According to the labor force statistics for Cohasset, out of the total population over 16 years of age (2,103), 59.5% or 1,251 individuals are in the labor force, with 10.2% or 128 of them unemployed. The age group with the highest labor force participation rate is 45 to 54 years, with 97.1% or 201 individuals in the labor force. Within the labor force, the 20 to 24 years age range has the highest percentage of unemployed individuals, with 64.4% or 96 of them being unemployed.
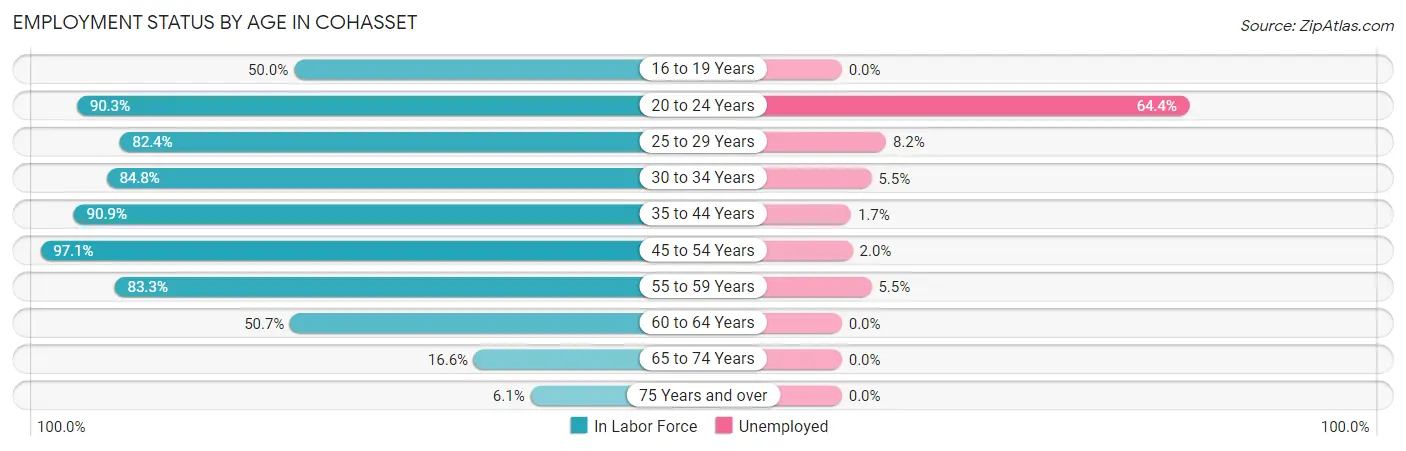
| Age Bracket | In Labor Force | Unemployed |
| 16 to 19 Years | 20 (50.0%) | 0 (0.0%) |
| 20 to 24 Years | 149 (90.3%) | 96 (64.4%) |
| 25 to 29 Years | 98 (82.4%) | 8 (8.2%) |
| 30 to 34 Years | 145 (84.8%) | 8 (5.5%) |
| 35 to 44 Years | 300 (90.9%) | 5 (1.7%) |
| 45 to 54 Years | 201 (97.1%) | 4 (2.0%) |
| 55 to 59 Years | 110 (83.3%) | 6 (5.5%) |
| 60 to 64 Years | 138 (50.7%) | 0 (0.0%) |
| 65 to 74 Years | 78 (16.6%) | 0 (0.0%) |
| 75 Years and over | 12 (6.1%) | 0 (0.0%) |
| Total | 1,251 (59.5%) | 128 (10.2%) |
Employment Status by Educational Attainment in Cohasset
According to labor force statistics for Cohasset, 80.6% of individuals (992) out of the total population between 25 and 64 years of age (1,231) are in the labor force, with 3.1% or 31 of them being unemployed. The group with the highest labor force participation rate are those with the educational attainment of bachelor's degree or higher, with 95.9% or 440 individuals in the labor force. Within the labor force, individuals with college / associate degree education have the highest percentage of unemployment, with 4.7% or 17 of them being unemployed.
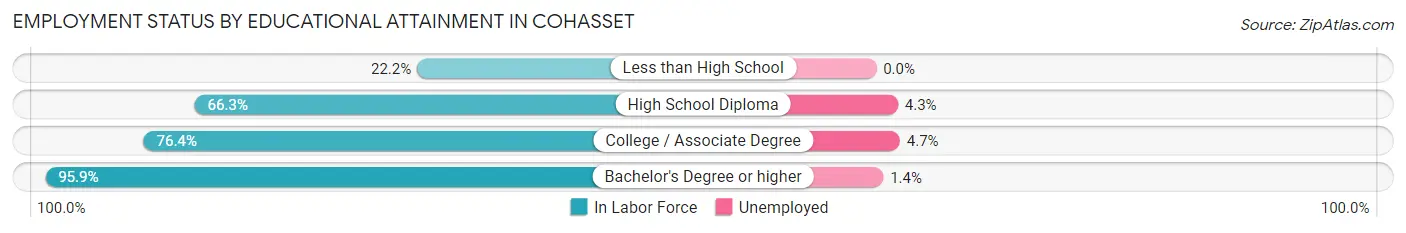
| Educational Attainment | In Labor Force | Unemployed |
| Less than High School | 4 (22.2%) | 0 (0.0%) |
| High School Diploma | 185 (66.3%) | 12 (4.3%) |
| College / Associate Degree | 363 (76.4%) | 22 (4.7%) |
| Bachelor's Degree or higher | 440 (95.9%) | 6 (1.4%) |
| Total | 992 (80.6%) | 38 (3.1%) |
Employment Occupations by Sex in Cohasset
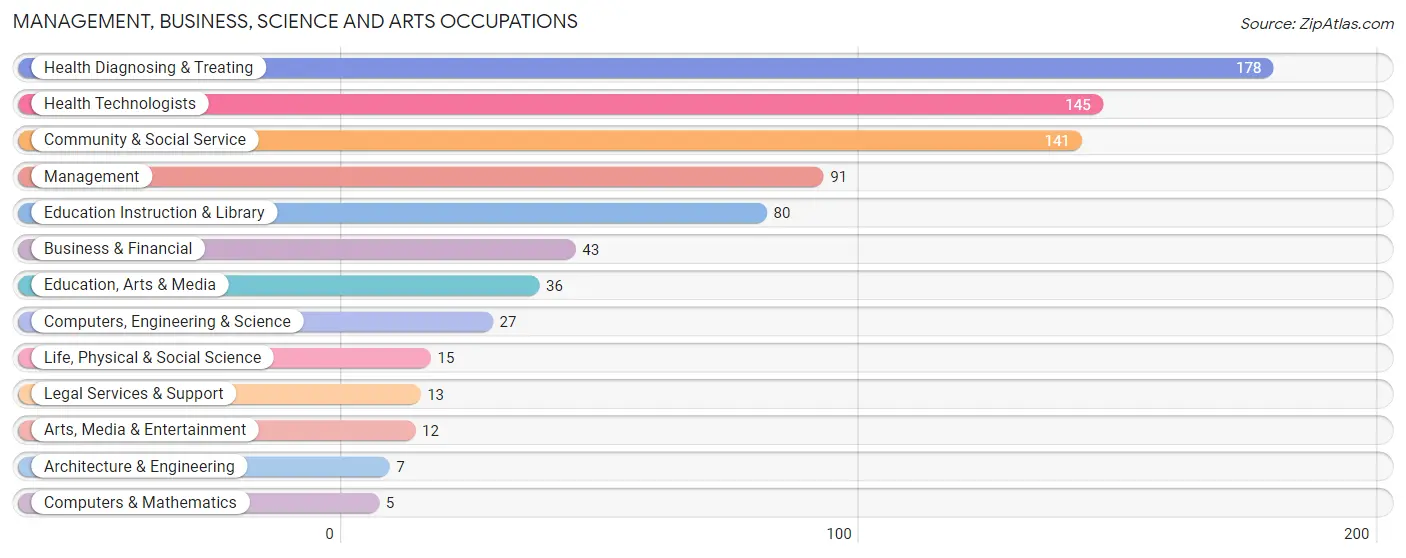
Management, Business, Science and Arts Occupations
The most common Management, Business, Science and Arts occupations in Cohasset are Health Diagnosing & Treating (178 | 15.8%), Health Technologists (145 | 12.9%), Community & Social Service (141 | 12.5%), Management (91 | 8.1%), and Education Instruction & Library (80 | 7.1%).
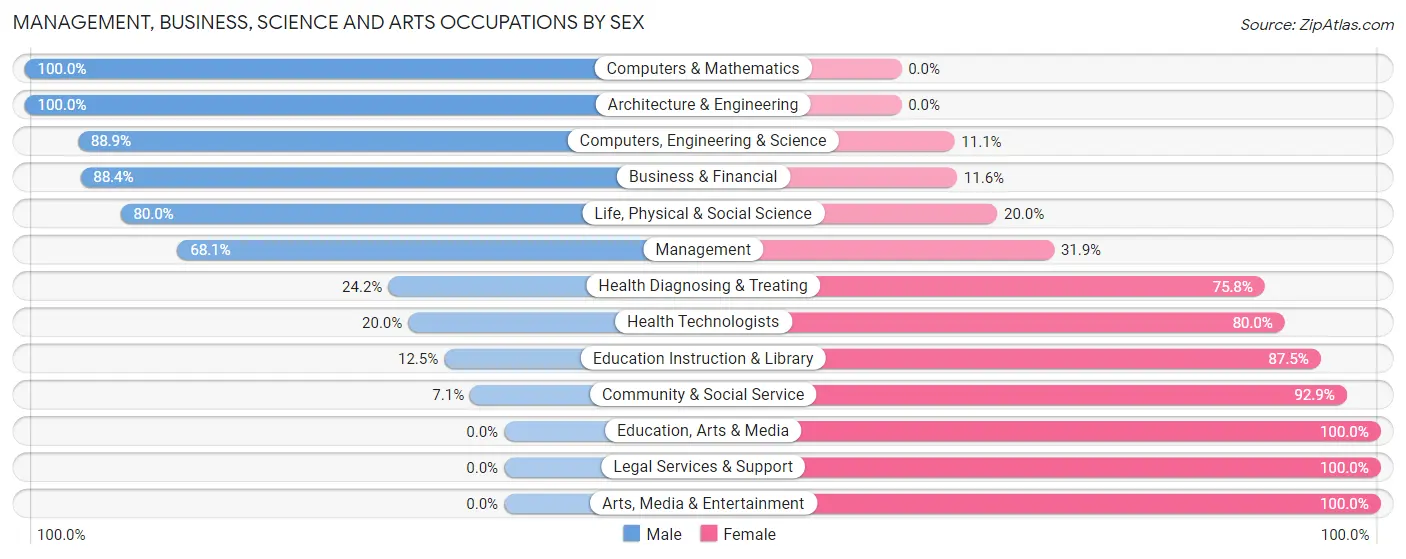
Management, Business, Science and Arts Occupations by Sex
Within the Management, Business, Science and Arts occupations in Cohasset, the most male-oriented occupations are Computers & Mathematics (100.0%), Architecture & Engineering (100.0%), and Computers, Engineering & Science (88.9%), while the most female-oriented occupations are Education, Arts & Media (100.0%), Legal Services & Support (100.0%), and Arts, Media & Entertainment (100.0%).
| Occupation | Male | Female |
| Management | 62 (68.1%) | 29 (31.9%) |
| Business & Financial | 38 (88.4%) | 5 (11.6%) |
| Computers, Engineering & Science | 24 (88.9%) | 3 (11.1%) |
| Computers & Mathematics | 5 (100.0%) | 0 (0.0%) |
| Architecture & Engineering | 7 (100.0%) | 0 (0.0%) |
| Life, Physical & Social Science | 12 (80.0%) | 3 (20.0%) |
| Community & Social Service | 10 (7.1%) | 131 (92.9%) |
| Education, Arts & Media | 0 (0.0%) | 36 (100.0%) |
| Legal Services & Support | 0 (0.0%) | 13 (100.0%) |
| Education Instruction & Library | 10 (12.5%) | 70 (87.5%) |
| Arts, Media & Entertainment | 0 (0.0%) | 12 (100.0%) |
| Health Diagnosing & Treating | 43 (24.2%) | 135 (75.8%) |
| Health Technologists | 29 (20.0%) | 116 (80.0%) |
| Total (Category) | 177 (36.9%) | 303 (63.1%) |
| Total (Overall) | 518 (46.1%) | 606 (53.9%) |
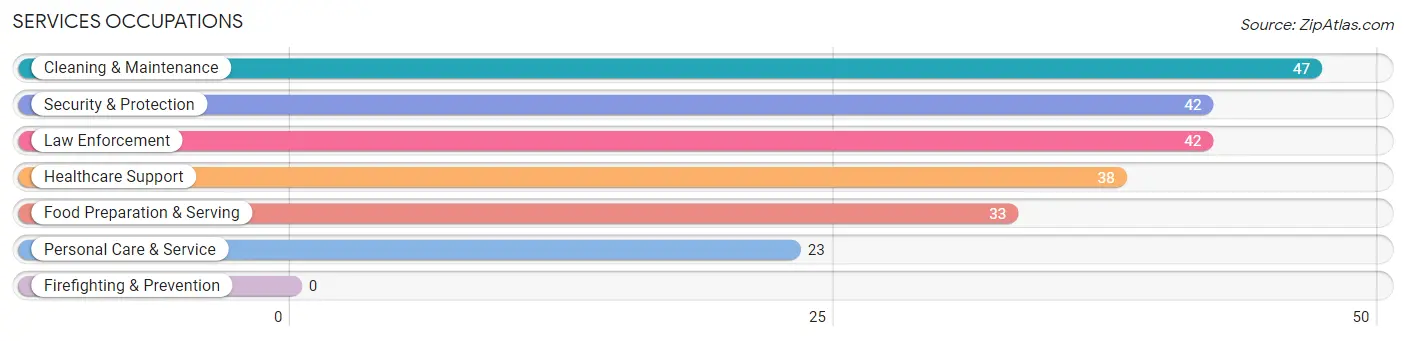
Services Occupations
The most common Services occupations in Cohasset are Cleaning & Maintenance (47 | 4.2%), Security & Protection (42 | 3.7%), Law Enforcement (42 | 3.7%), Healthcare Support (38 | 3.4%), and Food Preparation & Serving (33 | 2.9%).
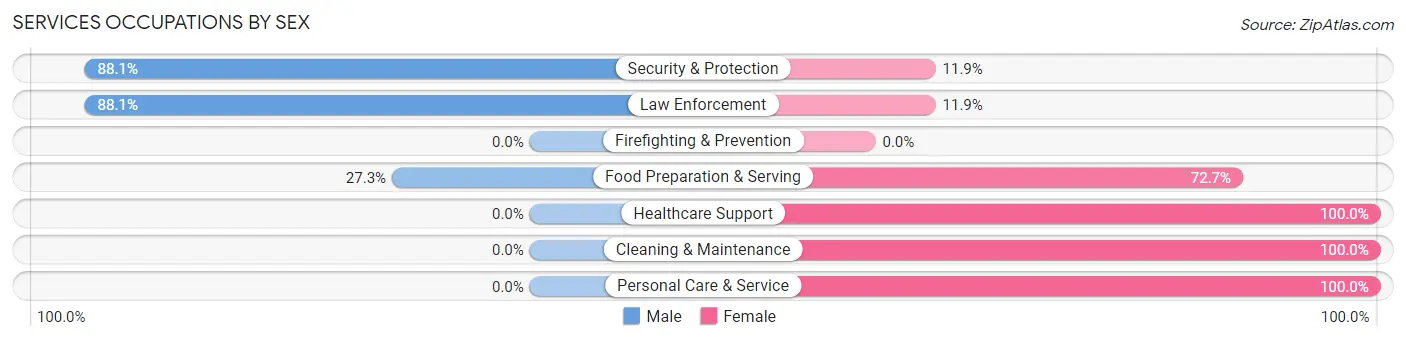
Services Occupations by Sex
Within the Services occupations in Cohasset, the most male-oriented occupations are Security & Protection (88.1%), Law Enforcement (88.1%), and Food Preparation & Serving (27.3%), while the most female-oriented occupations are Healthcare Support (100.0%), Cleaning & Maintenance (100.0%), and Personal Care & Service (100.0%).
| Occupation | Male | Female |
| Healthcare Support | 0 (0.0%) | 38 (100.0%) |
| Security & Protection | 37 (88.1%) | 5 (11.9%) |
| Firefighting & Prevention | 0 (0.0%) | 0 (0.0%) |
| Law Enforcement | 37 (88.1%) | 5 (11.9%) |
| Food Preparation & Serving | 9 (27.3%) | 24 (72.7%) |
| Cleaning & Maintenance | 0 (0.0%) | 47 (100.0%) |
| Personal Care & Service | 0 (0.0%) | 23 (100.0%) |
| Total (Category) | 46 (25.1%) | 137 (74.9%) |
| Total (Overall) | 518 (46.1%) | 606 (53.9%) |
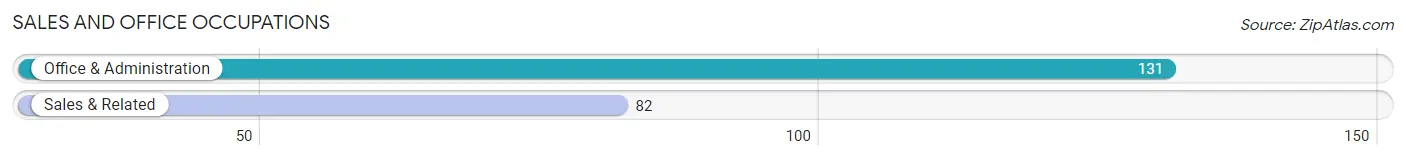
Sales and Office Occupations
The most common Sales and Office occupations in Cohasset are Office & Administration (131 | 11.7%), and Sales & Related (82 | 7.3%).
Sales and Office Occupations by Sex
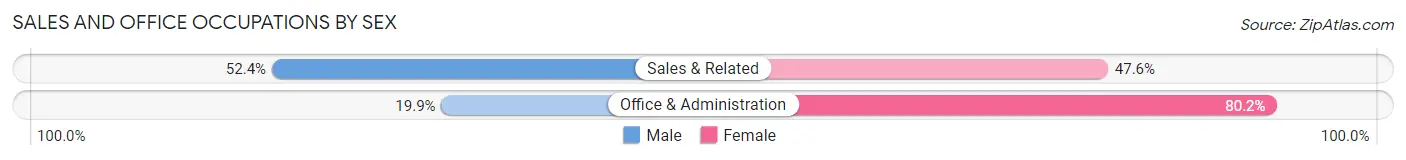
| Occupation | Male | Female |
| Sales & Related | 43 (52.4%) | 39 (47.6%) |
| Office & Administration | 26 (19.9%) | 105 (80.1%) |
| Total (Category) | 69 (32.4%) | 144 (67.6%) |
| Total (Overall) | 518 (46.1%) | 606 (53.9%) |
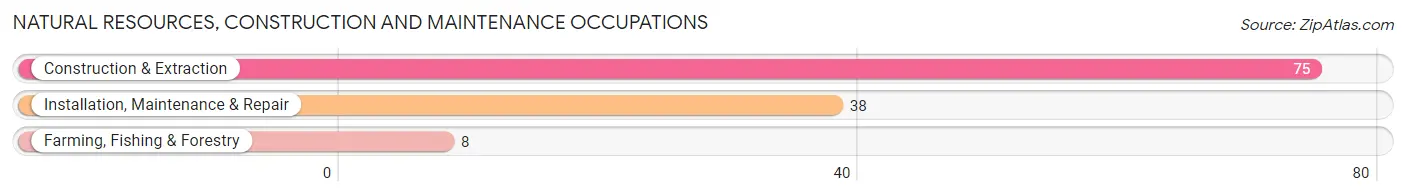
Natural Resources, Construction and Maintenance Occupations
The most common Natural Resources, Construction and Maintenance occupations in Cohasset are Construction & Extraction (75 | 6.7%), Installation, Maintenance & Repair (38 | 3.4%), and Farming, Fishing & Forestry (8 | 0.7%).
Natural Resources, Construction and Maintenance Occupations by Sex
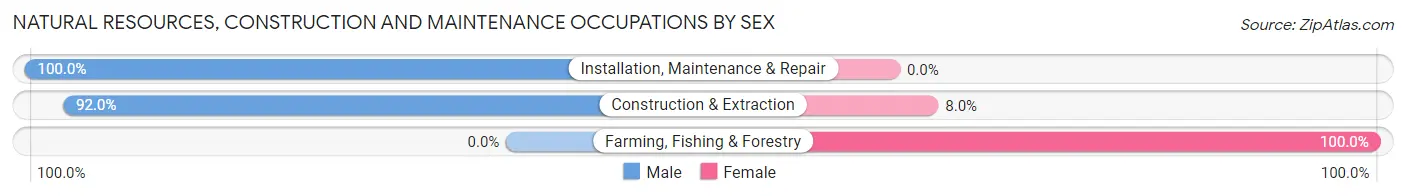
| Occupation | Male | Female |
| Farming, Fishing & Forestry | 0 (0.0%) | 8 (100.0%) |
| Construction & Extraction | 69 (92.0%) | 6 (8.0%) |
| Installation, Maintenance & Repair | 38 (100.0%) | 0 (0.0%) |
| Total (Category) | 107 (88.4%) | 14 (11.6%) |
| Total (Overall) | 518 (46.1%) | 606 (53.9%) |
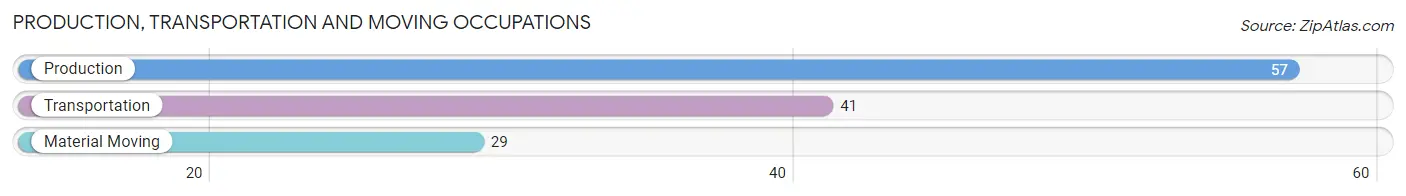
Production, Transportation and Moving Occupations
The most common Production, Transportation and Moving occupations in Cohasset are Production (57 | 5.1%), Transportation (41 | 3.6%), and Material Moving (29 | 2.6%).
Production, Transportation and Moving Occupations by Sex
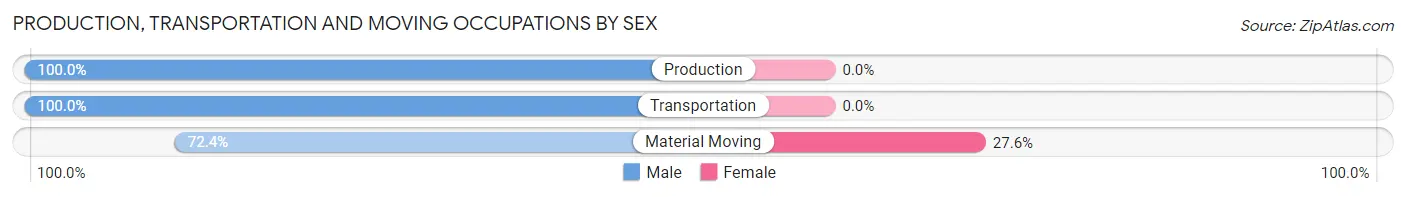
| Occupation | Male | Female |
| Production | 57 (100.0%) | 0 (0.0%) |
| Transportation | 41 (100.0%) | 0 (0.0%) |
| Material Moving | 21 (72.4%) | 8 (27.6%) |
| Total (Category) | 119 (93.7%) | 8 (6.3%) |
| Total (Overall) | 518 (46.1%) | 606 (53.9%) |
Employment Industries by Sex in Cohasset
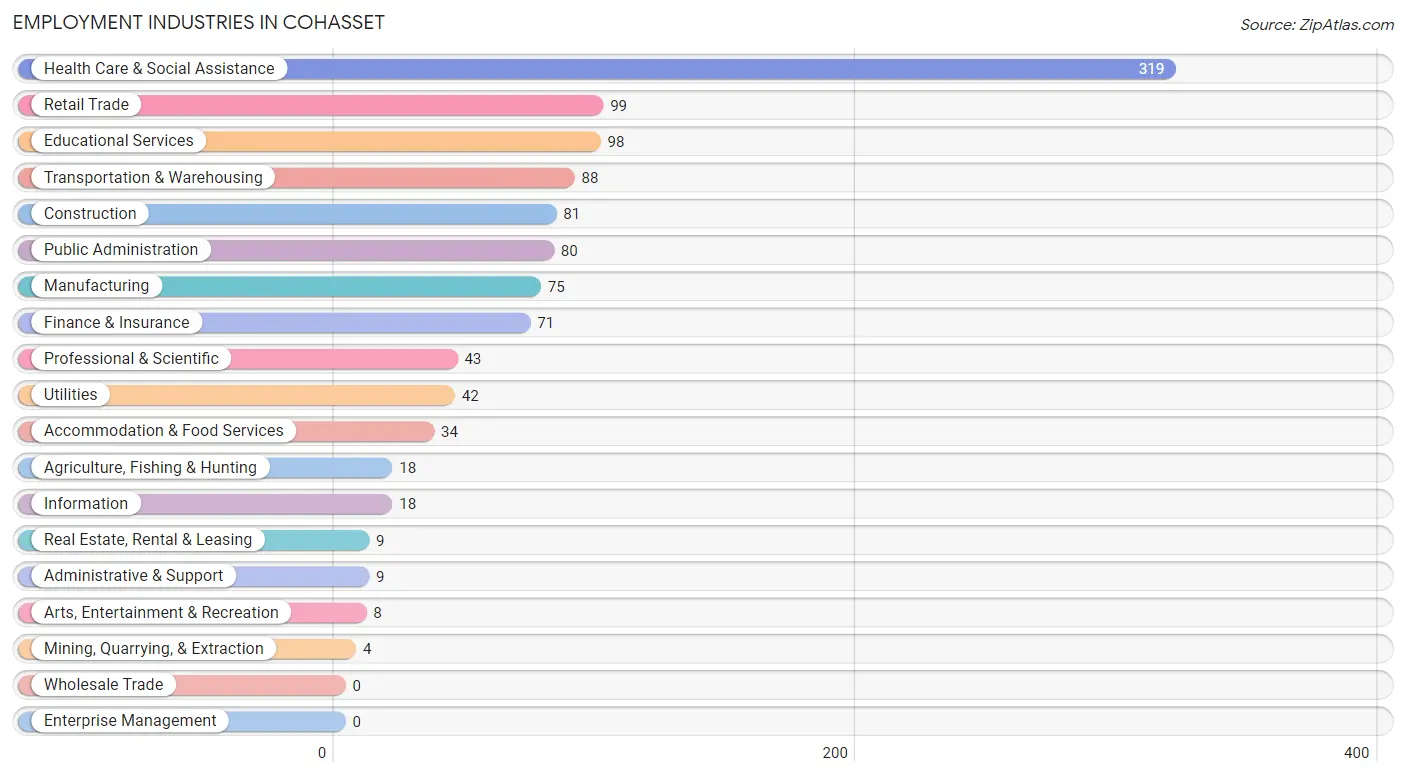
Employment Industries in Cohasset
The major employment industries in Cohasset include Health Care & Social Assistance (319 | 28.4%), Retail Trade (99 | 8.8%), Educational Services (98 | 8.7%), Transportation & Warehousing (88 | 7.8%), and Construction (81 | 7.2%).
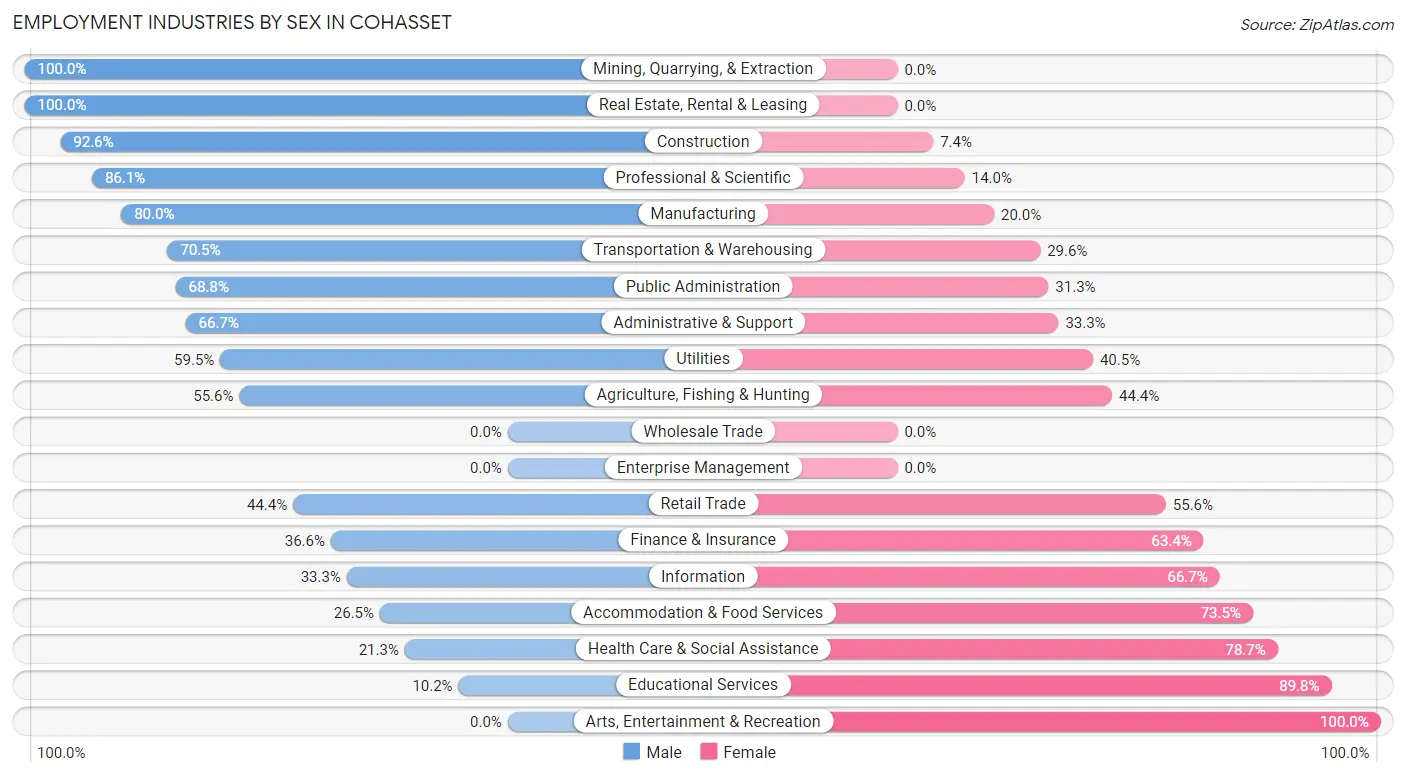
Employment Industries by Sex in Cohasset
The Cohasset industries that see more men than women are Mining, Quarrying, & Extraction (100.0%), Real Estate, Rental & Leasing (100.0%), and Construction (92.6%), whereas the industries that tend to have a higher number of women are Arts, Entertainment & Recreation (100.0%), Educational Services (89.8%), and Health Care & Social Assistance (78.7%).
| Industry | Male | Female |
| Agriculture, Fishing & Hunting | 10 (55.6%) | 8 (44.4%) |
| Mining, Quarrying, & Extraction | 4 (100.0%) | 0 (0.0%) |
| Construction | 75 (92.6%) | 6 (7.4%) |
| Manufacturing | 60 (80.0%) | 15 (20.0%) |
| Wholesale Trade | 0 (0.0%) | 0 (0.0%) |
| Retail Trade | 44 (44.4%) | 55 (55.6%) |
| Transportation & Warehousing | 62 (70.5%) | 26 (29.5%) |
| Utilities | 25 (59.5%) | 17 (40.5%) |
| Information | 6 (33.3%) | 12 (66.7%) |
| Finance & Insurance | 26 (36.6%) | 45 (63.4%) |
| Real Estate, Rental & Leasing | 9 (100.0%) | 0 (0.0%) |
| Professional & Scientific | 37 (86.1%) | 6 (14.0%) |
| Enterprise Management | 0 (0.0%) | 0 (0.0%) |
| Administrative & Support | 6 (66.7%) | 3 (33.3%) |
| Educational Services | 10 (10.2%) | 88 (89.8%) |
| Health Care & Social Assistance | 68 (21.3%) | 251 (78.7%) |
| Arts, Entertainment & Recreation | 0 (0.0%) | 8 (100.0%) |
| Accommodation & Food Services | 9 (26.5%) | 25 (73.5%) |
| Public Administration | 55 (68.8%) | 25 (31.2%) |
| Total | 518 (46.1%) | 606 (53.9%) |
Education in Cohasset
School Enrollment in Cohasset
The most common levels of schooling among the 451 students in Cohasset are middle school (132 | 29.3%), nursery / preschool (105 | 23.3%), and elementary school (86 | 19.1%).
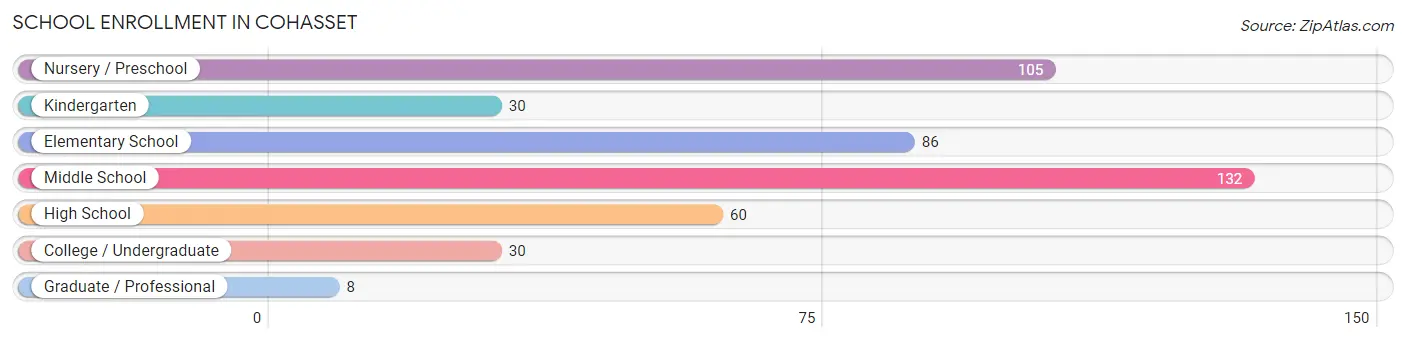
| School Level | # Students | % Students |
| Nursery / Preschool | 105 | 23.3% |
| Kindergarten | 30 | 6.7% |
| Elementary School | 86 | 19.1% |
| Middle School | 132 | 29.3% |
| High School | 60 | 13.3% |
| College / Undergraduate | 30 | 6.7% |
| Graduate / Professional | 8 | 1.8% |
| Total | 451 | 100.0% |
School Enrollment by Age by Funding Source in Cohasset
Out of a total of 451 students who are enrolled in schools in Cohasset, 76 (16.9%) attend a private institution, while the remaining 375 (83.1%) are enrolled in public schools. The age group of 5 to 9 year old has the highest likelihood of being enrolled in private schools, with 53 (36.8% in the age bracket) enrolled. Conversely, the age group of 15 to 17 year olds has the lowest likelihood of being enrolled in a private school, with 54 (100.0% in the age bracket) attending a public institution.
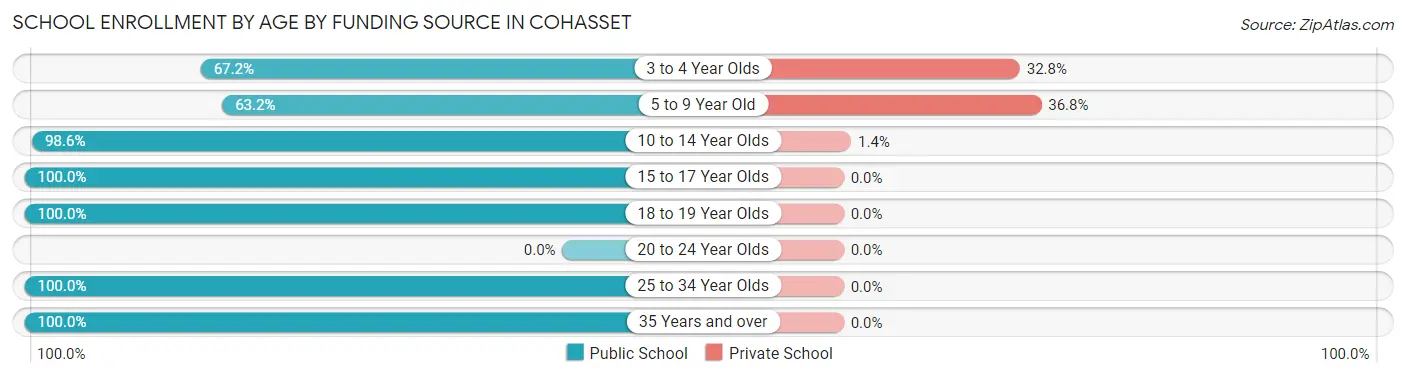
| Age Bracket | Public School | Private School |
| 3 to 4 Year Olds | 43 (67.2%) | 21 (32.8%) |
| 5 to 9 Year Old | 91 (63.2%) | 53 (36.8%) |
| 10 to 14 Year Olds | 143 (98.6%) | 2 (1.4%) |
| 15 to 17 Year Olds | 54 (100.0%) | 0 (0.0%) |
| 18 to 19 Year Olds | 6 (100.0%) | 0 (0.0%) |
| 20 to 24 Year Olds | 0 (0.0%) | 0 (0.0%) |
| 25 to 34 Year Olds | 34 (100.0%) | 0 (0.0%) |
| 35 Years and over | 4 (100.0%) | 0 (0.0%) |
| Total | 375 (83.1%) | 76 (16.9%) |
Educational Attainment by Field of Study in Cohasset
Science & technology (151 | 24.1%), education (115 | 18.4%), bio, nature & agricultural (81 | 12.9%), engineering (62 | 9.9%), and business (60 | 9.6%) are the most common fields of study among 626 individuals in Cohasset who have obtained a bachelor's degree or higher.
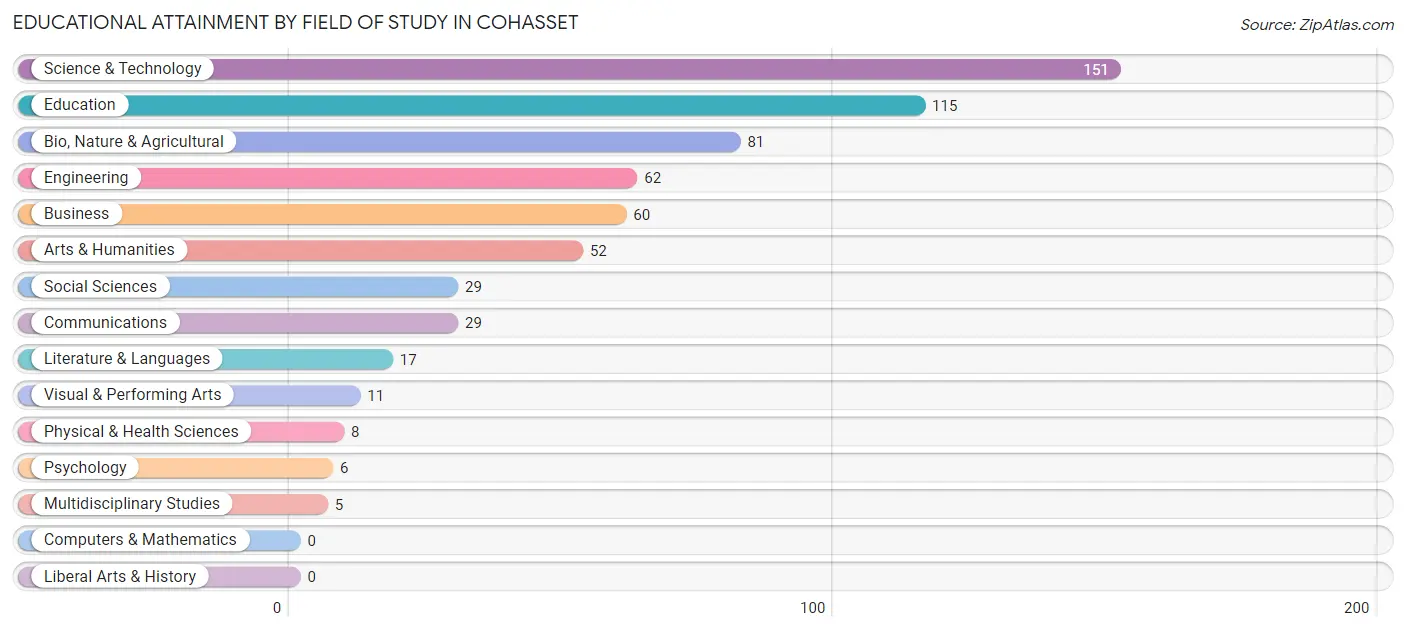
| Field of Study | # Graduates | % Graduates |
| Computers & Mathematics | 0 | 0.0% |
| Bio, Nature & Agricultural | 81 | 12.9% |
| Physical & Health Sciences | 8 | 1.3% |
| Psychology | 6 | 1.0% |
| Social Sciences | 29 | 4.6% |
| Engineering | 62 | 9.9% |
| Multidisciplinary Studies | 5 | 0.8% |
| Science & Technology | 151 | 24.1% |
| Business | 60 | 9.6% |
| Education | 115 | 18.4% |
| Literature & Languages | 17 | 2.7% |
| Liberal Arts & History | 0 | 0.0% |
| Visual & Performing Arts | 11 | 1.8% |
| Communications | 29 | 4.6% |
| Arts & Humanities | 52 | 8.3% |
| Total | 626 | 100.0% |
Transportation & Commute in Cohasset
Vehicle Availability by Sex in Cohasset
The most prevalent vehicle ownership categories in Cohasset are males with 2 vehicles (250, accounting for 48.3%) and females with 2 vehicles (258, making up 43.9%).
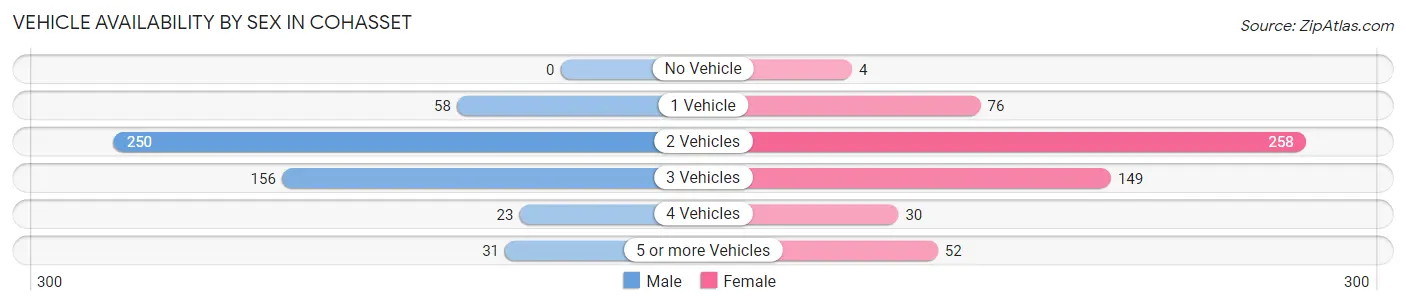
| Vehicles Available | Male | Female |
| No Vehicle | 0 (0.0%) | 4 (0.7%) |
| 1 Vehicle | 58 (11.2%) | 76 (13.4%) |
| 2 Vehicles | 250 (48.3%) | 258 (45.3%) |
| 3 Vehicles | 156 (30.1%) | 149 (26.2%) |
| 4 Vehicles | 23 (4.4%) | 30 (5.3%) |
| 5 or more Vehicles | 31 (6.0%) | 52 (9.1%) |
| Total | 518 (100.0%) | 569 (100.0%) |
Commute Time in Cohasset
The most frequently occuring commute durations in Cohasset are 10 to 14 minutes (308 commuters, 30.8%), 15 to 19 minutes (232 commuters, 23.2%), and 20 to 24 minutes (163 commuters, 16.3%).
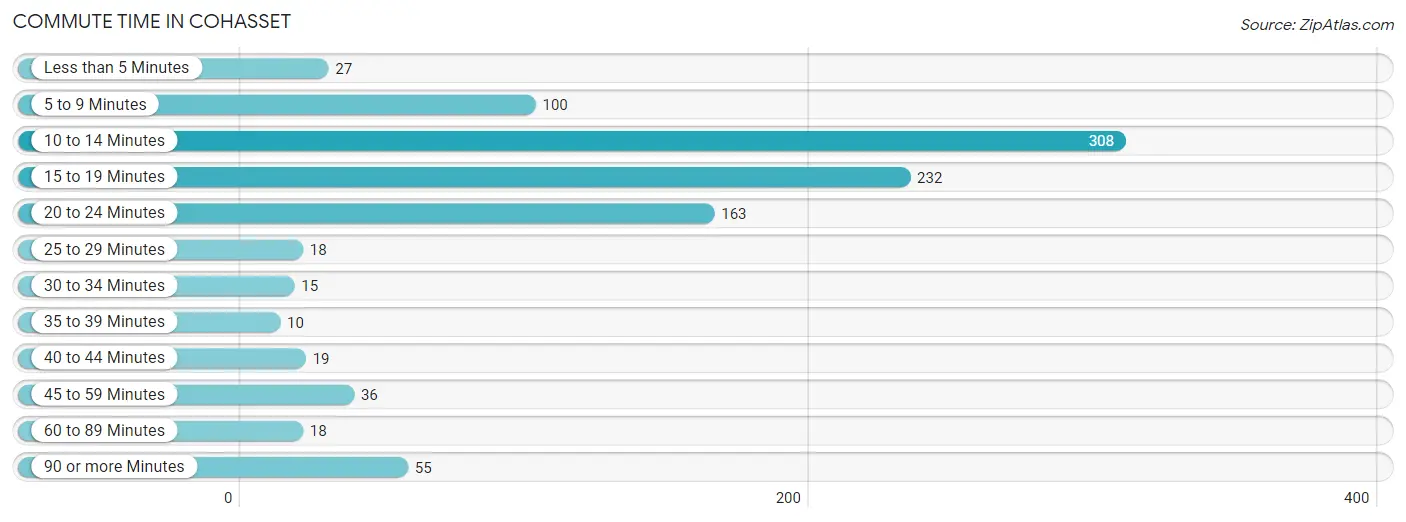
| Commute Time | # Commuters | % Commuters |
| Less than 5 Minutes | 27 | 2.7% |
| 5 to 9 Minutes | 100 | 10.0% |
| 10 to 14 Minutes | 308 | 30.8% |
| 15 to 19 Minutes | 232 | 23.2% |
| 20 to 24 Minutes | 163 | 16.3% |
| 25 to 29 Minutes | 18 | 1.8% |
| 30 to 34 Minutes | 15 | 1.5% |
| 35 to 39 Minutes | 10 | 1.0% |
| 40 to 44 Minutes | 19 | 1.9% |
| 45 to 59 Minutes | 36 | 3.6% |
| 60 to 89 Minutes | 18 | 1.8% |
| 90 or more Minutes | 55 | 5.5% |
Commute Time by Sex in Cohasset
The most common commute times in Cohasset are 10 to 14 minutes (106 commuters, 21.5%) for males and 10 to 14 minutes (202 commuters, 39.8%) for females.
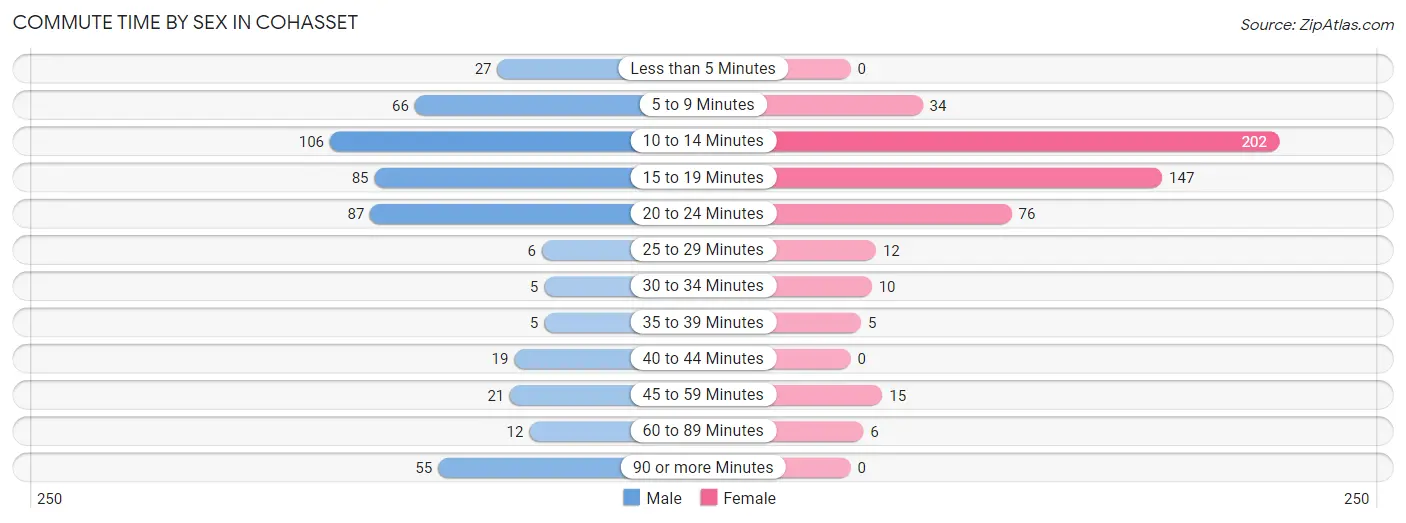
| Commute Time | Male | Female |
| Less than 5 Minutes | 27 (5.5%) | 0 (0.0%) |
| 5 to 9 Minutes | 66 (13.4%) | 34 (6.7%) |
| 10 to 14 Minutes | 106 (21.5%) | 202 (39.8%) |
| 15 to 19 Minutes | 85 (17.2%) | 147 (29.0%) |
| 20 to 24 Minutes | 87 (17.6%) | 76 (15.0%) |
| 25 to 29 Minutes | 6 (1.2%) | 12 (2.4%) |
| 30 to 34 Minutes | 5 (1.0%) | 10 (2.0%) |
| 35 to 39 Minutes | 5 (1.0%) | 5 (1.0%) |
| 40 to 44 Minutes | 19 (3.8%) | 0 (0.0%) |
| 45 to 59 Minutes | 21 (4.3%) | 15 (3.0%) |
| 60 to 89 Minutes | 12 (2.4%) | 6 (1.2%) |
| 90 or more Minutes | 55 (11.1%) | 0 (0.0%) |
Time of Departure to Work by Sex in Cohasset
The most frequent times of departure to work in Cohasset are 7:30 AM to 7:59 AM (98, 19.8%) for males and 7:30 AM to 7:59 AM (100, 19.7%) for females.
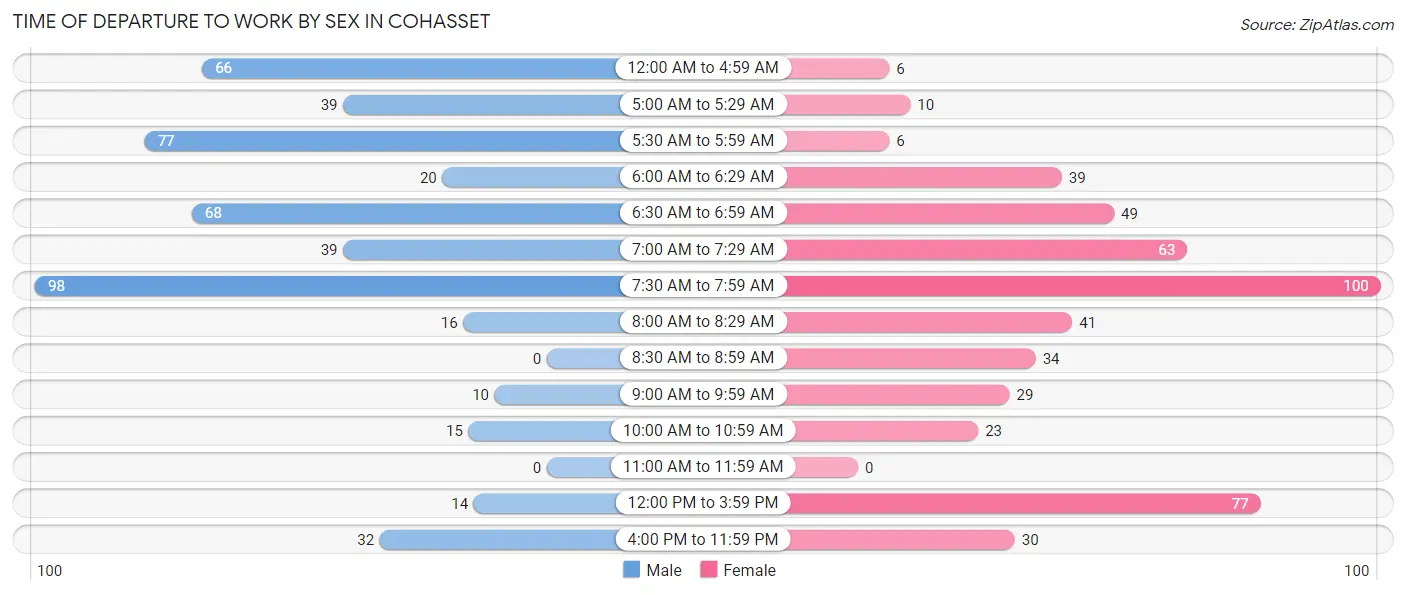
| Time of Departure | Male | Female |
| 12:00 AM to 4:59 AM | 66 (13.4%) | 6 (1.2%) |
| 5:00 AM to 5:29 AM | 39 (7.9%) | 10 (2.0%) |
| 5:30 AM to 5:59 AM | 77 (15.6%) | 6 (1.2%) |
| 6:00 AM to 6:29 AM | 20 (4.1%) | 39 (7.7%) |
| 6:30 AM to 6:59 AM | 68 (13.8%) | 49 (9.7%) |
| 7:00 AM to 7:29 AM | 39 (7.9%) | 63 (12.4%) |
| 7:30 AM to 7:59 AM | 98 (19.8%) | 100 (19.7%) |
| 8:00 AM to 8:29 AM | 16 (3.2%) | 41 (8.1%) |
| 8:30 AM to 8:59 AM | 0 (0.0%) | 34 (6.7%) |
| 9:00 AM to 9:59 AM | 10 (2.0%) | 29 (5.7%) |
| 10:00 AM to 10:59 AM | 15 (3.0%) | 23 (4.5%) |
| 11:00 AM to 11:59 AM | 0 (0.0%) | 0 (0.0%) |
| 12:00 PM to 3:59 PM | 14 (2.8%) | 77 (15.2%) |
| 4:00 PM to 11:59 PM | 32 (6.5%) | 30 (5.9%) |
| Total | 494 (100.0%) | 507 (100.0%) |
Housing Occupancy in Cohasset
Occupancy by Ownership in Cohasset
Of the total 1,049 dwellings in Cohasset, owner-occupied units account for 967 (92.2%), while renter-occupied units make up 82 (7.8%).
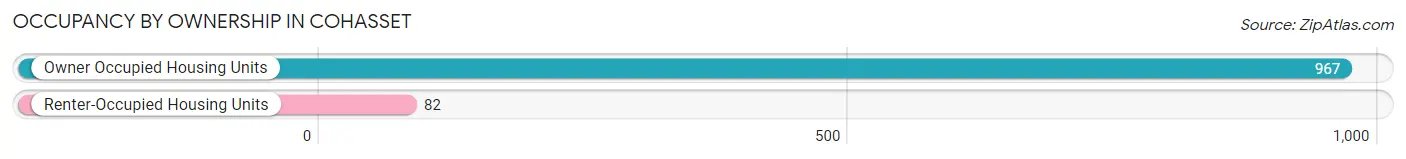
| Occupancy | # Housing Units | % Housing Units |
| Owner Occupied Housing Units | 967 | 92.2% |
| Renter-Occupied Housing Units | 82 | 7.8% |
| Total Occupied Housing Units | 1,049 | 100.0% |
Occupancy by Household Size in Cohasset
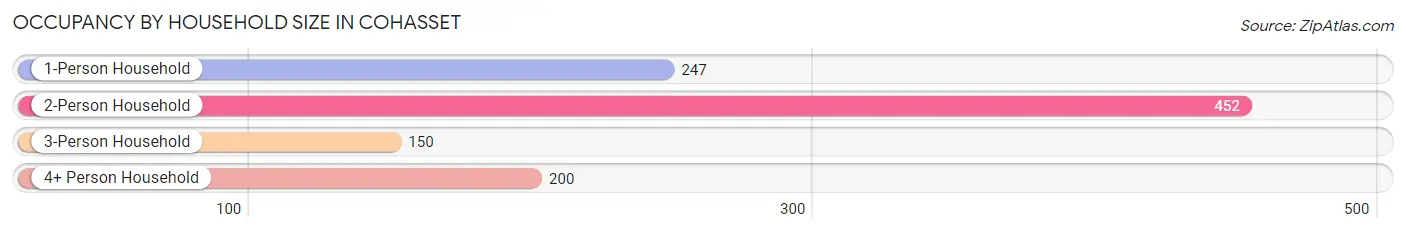
| Household Size | # Housing Units | % Housing Units |
| 1-Person Household | 247 | 23.5% |
| 2-Person Household | 452 | 43.1% |
| 3-Person Household | 150 | 14.3% |
| 4+ Person Household | 200 | 19.1% |
| Total Housing Units | 1,049 | 100.0% |
Occupancy by Ownership by Household Size in Cohasset
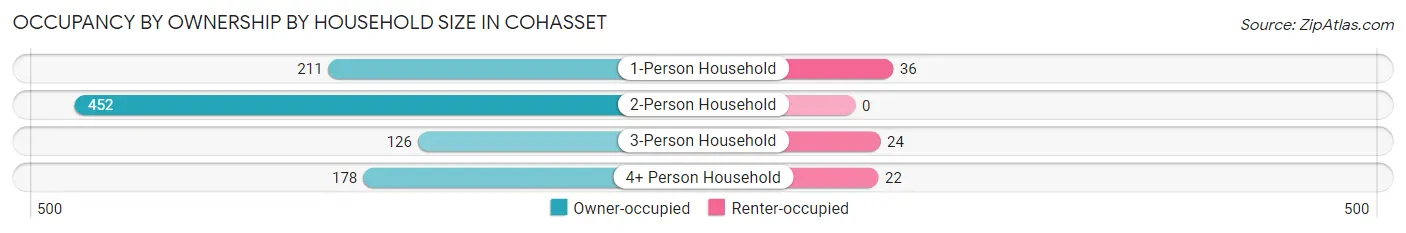
| Household Size | Owner-occupied | Renter-occupied |
| 1-Person Household | 211 (85.4%) | 36 (14.6%) |
| 2-Person Household | 452 (100.0%) | 0 (0.0%) |
| 3-Person Household | 126 (84.0%) | 24 (16.0%) |
| 4+ Person Household | 178 (89.0%) | 22 (11.0%) |
| Total Housing Units | 967 (92.2%) | 82 (7.8%) |
Occupancy by Educational Attainment in Cohasset
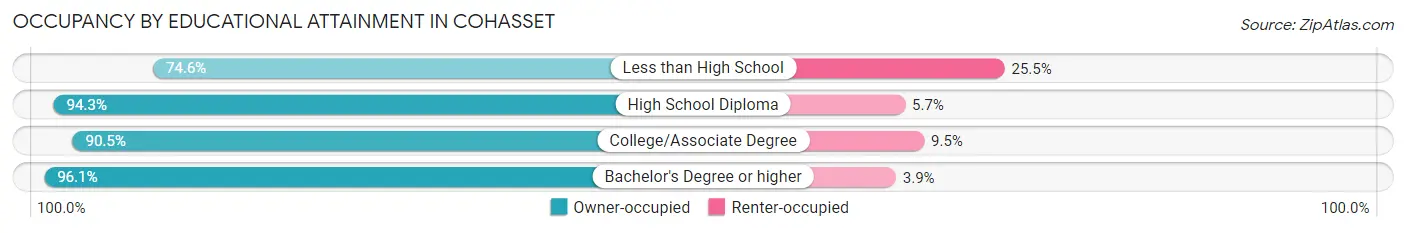
| Household Size | Owner-occupied | Renter-occupied |
| Less than High School | 41 (74.6%) | 14 (25.5%) |
| High School Diploma | 197 (94.3%) | 12 (5.7%) |
| College/Associate Degree | 409 (90.5%) | 43 (9.5%) |
| Bachelor's Degree or higher | 320 (96.1%) | 13 (3.9%) |
Occupancy by Age of Householder in Cohasset
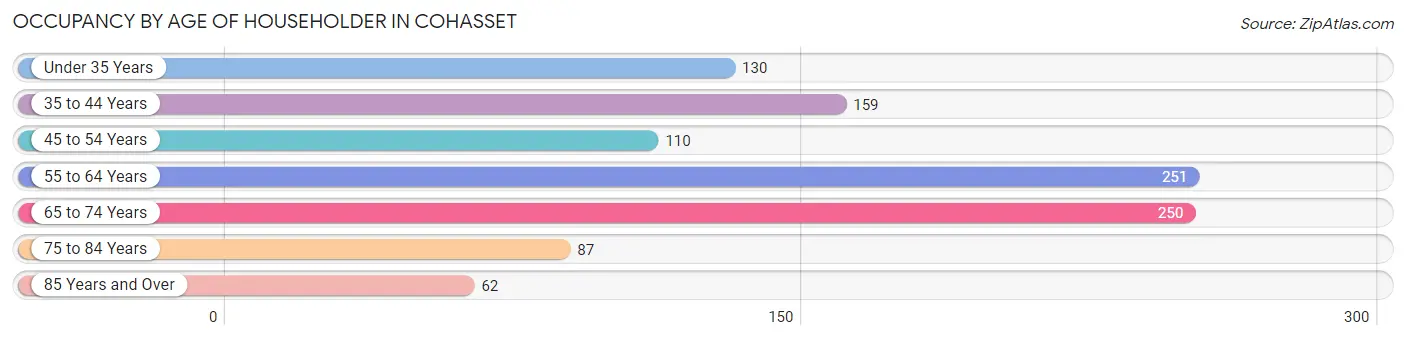
| Age Bracket | # Households | % Households |
| Under 35 Years | 130 | 12.4% |
| 35 to 44 Years | 159 | 15.2% |
| 45 to 54 Years | 110 | 10.5% |
| 55 to 64 Years | 251 | 23.9% |
| 65 to 74 Years | 250 | 23.8% |
| 75 to 84 Years | 87 | 8.3% |
| 85 Years and Over | 62 | 5.9% |
| Total | 1,049 | 100.0% |
Housing Finances in Cohasset
Median Income by Occupancy in Cohasset
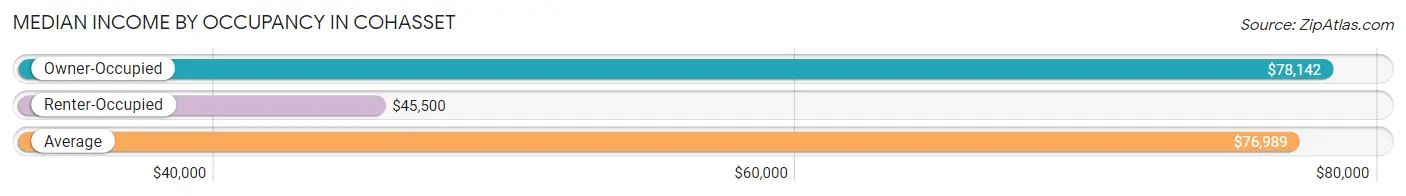
| Occupancy Type | # Households | Median Income |
| Owner-Occupied | 967 (92.2%) | $78,142 |
| Renter-Occupied | 82 (7.8%) | $45,500 |
| Average | 1,049 (100.0%) | $76,989 |
Occupancy by Householder Income Bracket in Cohasset
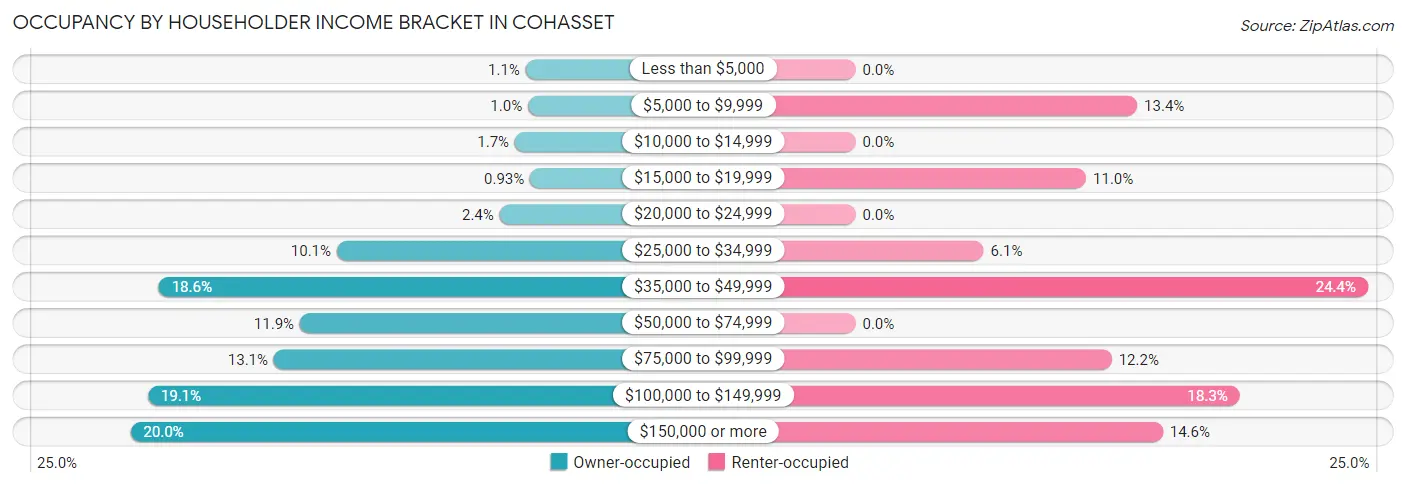
| Income Bracket | Owner-occupied | Renter-occupied |
| Less than $5,000 | 11 (1.1%) | 0 (0.0%) |
| $5,000 to $9,999 | 10 (1.0%) | 11 (13.4%) |
| $10,000 to $14,999 | 16 (1.7%) | 0 (0.0%) |
| $15,000 to $19,999 | 9 (0.9%) | 9 (11.0%) |
| $20,000 to $24,999 | 23 (2.4%) | 0 (0.0%) |
| $25,000 to $34,999 | 98 (10.1%) | 5 (6.1%) |
| $35,000 to $49,999 | 180 (18.6%) | 20 (24.4%) |
| $50,000 to $74,999 | 115 (11.9%) | 0 (0.0%) |
| $75,000 to $99,999 | 127 (13.1%) | 10 (12.2%) |
| $100,000 to $149,999 | 185 (19.1%) | 15 (18.3%) |
| $150,000 or more | 193 (20.0%) | 12 (14.6%) |
| Total | 967 (100.0%) | 82 (100.0%) |
Monthly Housing Cost Tiers in Cohasset
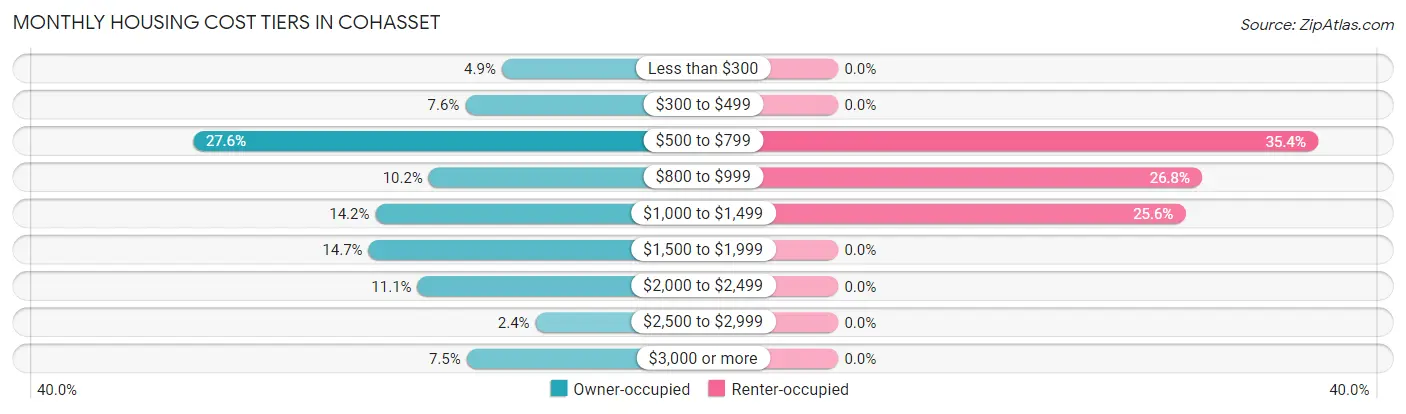
| Monthly Cost | Owner-occupied | Renter-occupied |
| Less than $300 | 47 (4.9%) | 0 (0.0%) |
| $300 to $499 | 73 (7.5%) | 0 (0.0%) |
| $500 to $799 | 267 (27.6%) | 29 (35.4%) |
| $800 to $999 | 99 (10.2%) | 22 (26.8%) |
| $1,000 to $1,499 | 137 (14.2%) | 21 (25.6%) |
| $1,500 to $1,999 | 142 (14.7%) | 0 (0.0%) |
| $2,000 to $2,499 | 107 (11.1%) | 0 (0.0%) |
| $2,500 to $2,999 | 23 (2.4%) | 0 (0.0%) |
| $3,000 or more | 72 (7.4%) | 0 (0.0%) |
| Total | 967 (100.0%) | 82 (100.0%) |
Physical Housing Characteristics in Cohasset
Housing Structures in Cohasset
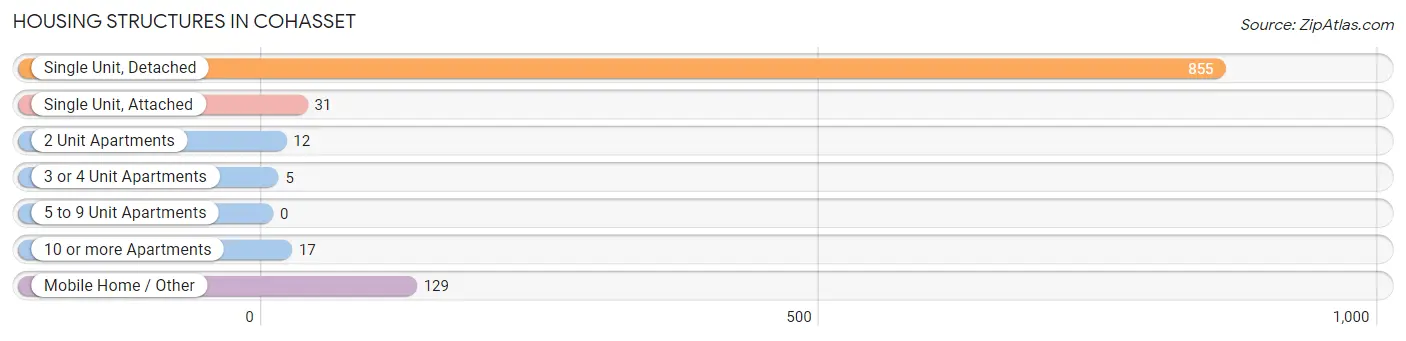
| Structure Type | # Housing Units | % Housing Units |
| Single Unit, Detached | 855 | 81.5% |
| Single Unit, Attached | 31 | 3.0% |
| 2 Unit Apartments | 12 | 1.1% |
| 3 or 4 Unit Apartments | 5 | 0.5% |
| 5 to 9 Unit Apartments | 0 | 0.0% |
| 10 or more Apartments | 17 | 1.6% |
| Mobile Home / Other | 129 | 12.3% |
| Total | 1,049 | 100.0% |
Housing Structures by Occupancy in Cohasset
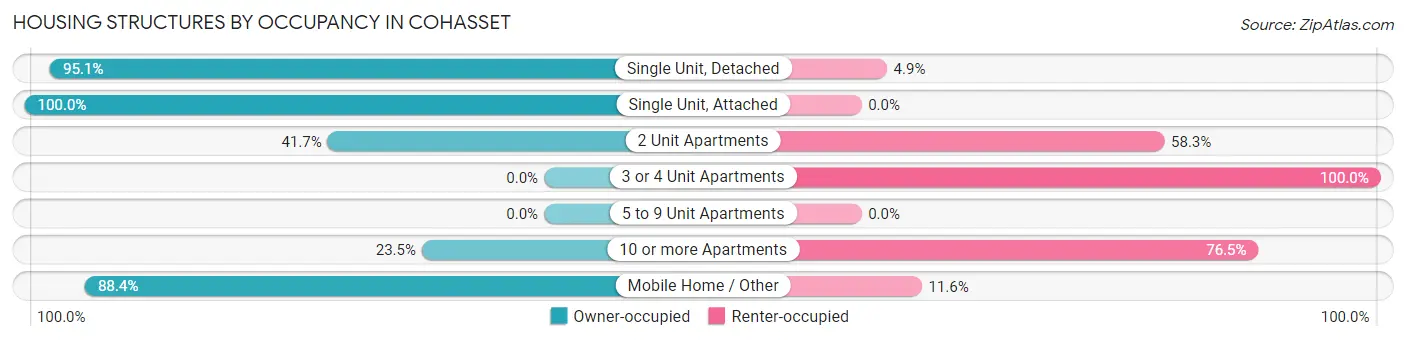
| Structure Type | Owner-occupied | Renter-occupied |
| Single Unit, Detached | 813 (95.1%) | 42 (4.9%) |
| Single Unit, Attached | 31 (100.0%) | 0 (0.0%) |
| 2 Unit Apartments | 5 (41.7%) | 7 (58.3%) |
| 3 or 4 Unit Apartments | 0 (0.0%) | 5 (100.0%) |
| 5 to 9 Unit Apartments | 0 (0.0%) | 0 (0.0%) |
| 10 or more Apartments | 4 (23.5%) | 13 (76.5%) |
| Mobile Home / Other | 114 (88.4%) | 15 (11.6%) |
| Total | 967 (92.2%) | 82 (7.8%) |
Housing Structures by Number of Rooms in Cohasset
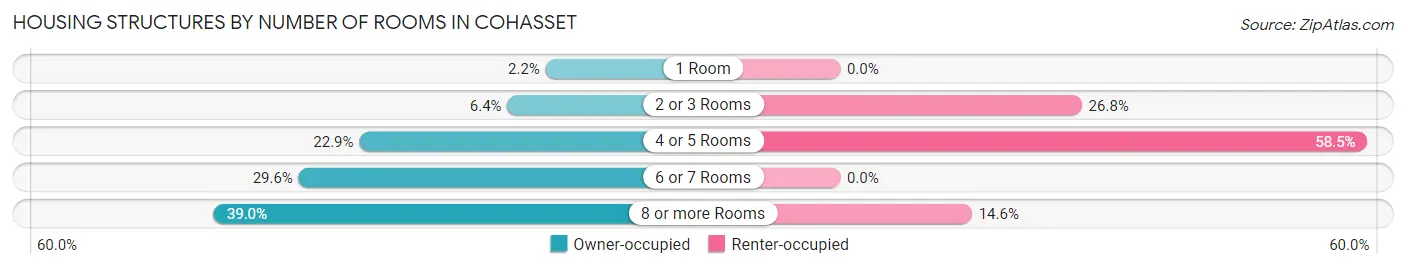
| Number of Rooms | Owner-occupied | Renter-occupied |
| 1 Room | 21 (2.2%) | 0 (0.0%) |
| 2 or 3 Rooms | 62 (6.4%) | 22 (26.8%) |
| 4 or 5 Rooms | 221 (22.9%) | 48 (58.5%) |
| 6 or 7 Rooms | 286 (29.6%) | 0 (0.0%) |
| 8 or more Rooms | 377 (39.0%) | 12 (14.6%) |
| Total | 967 (100.0%) | 82 (100.0%) |
Housing Structure by Heating Type in Cohasset
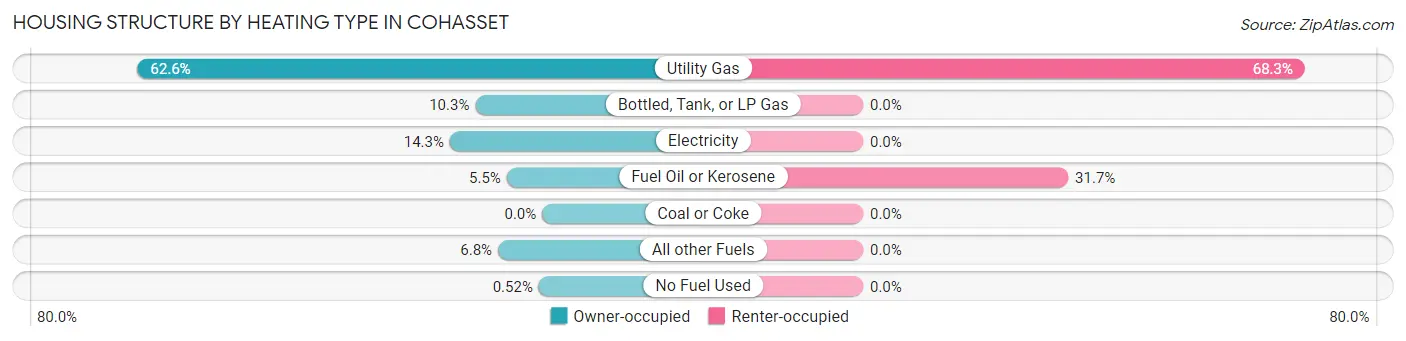
| Heating Type | Owner-occupied | Renter-occupied |
| Utility Gas | 605 (62.6%) | 56 (68.3%) |
| Bottled, Tank, or LP Gas | 100 (10.3%) | 0 (0.0%) |
| Electricity | 138 (14.3%) | 0 (0.0%) |
| Fuel Oil or Kerosene | 53 (5.5%) | 26 (31.7%) |
| Coal or Coke | 0 (0.0%) | 0 (0.0%) |
| All other Fuels | 66 (6.8%) | 0 (0.0%) |
| No Fuel Used | 5 (0.5%) | 0 (0.0%) |
| Total | 967 (100.0%) | 82 (100.0%) |
Household Vehicle Usage in Cohasset
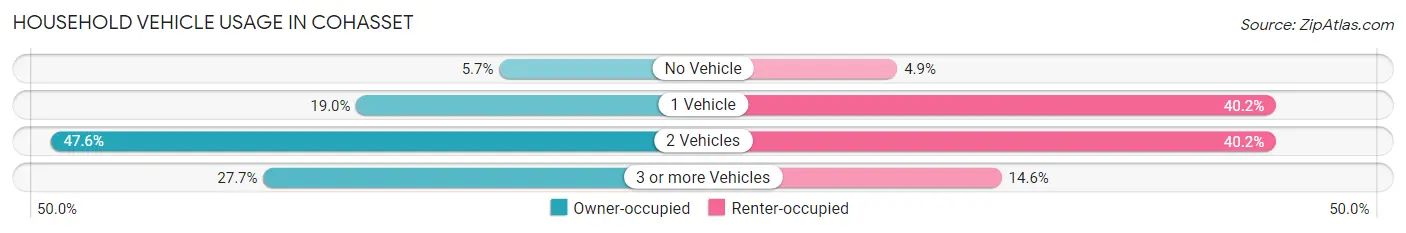
| Vehicles per Household | Owner-occupied | Renter-occupied |
| No Vehicle | 55 (5.7%) | 4 (4.9%) |
| 1 Vehicle | 184 (19.0%) | 33 (40.2%) |
| 2 Vehicles | 460 (47.6%) | 33 (40.2%) |
| 3 or more Vehicles | 268 (27.7%) | 12 (14.6%) |
| Total | 967 (100.0%) | 82 (100.0%) |
Real Estate & Mortgages in Cohasset
Real Estate and Mortgage Overview in Cohasset
| Characteristic | Without Mortgage | With Mortgage |
| Housing Units | 393 | 574 |
| Median Property Value | $229,400 | $319,500 |
| Median Household Income | $59,063 | $155 |
| Monthly Housing Costs | $626 | $72 |
| Real Estate Taxes | $2,397 | $9 |
Property Value by Mortgage Status in Cohasset
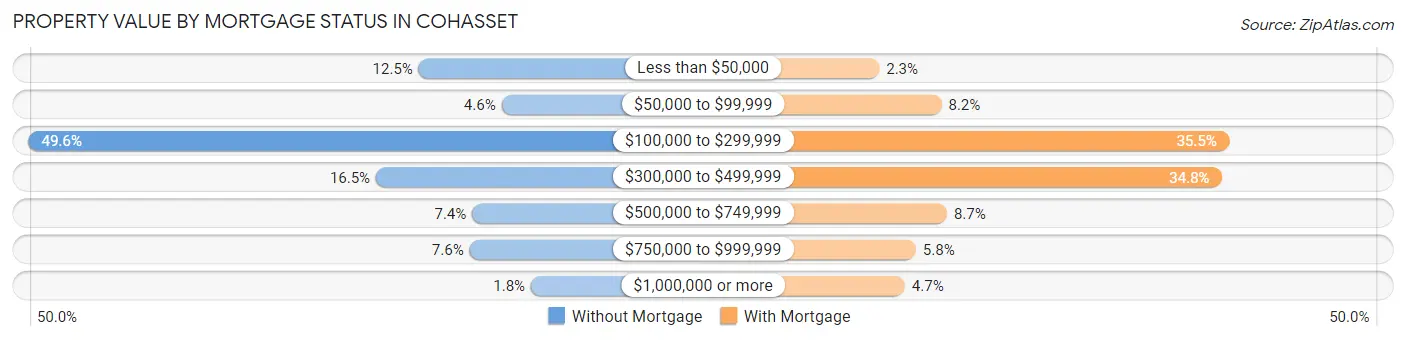
| Property Value | Without Mortgage | With Mortgage |
| Less than $50,000 | 49 (12.5%) | 13 (2.3%) |
| $50,000 to $99,999 | 18 (4.6%) | 47 (8.2%) |
| $100,000 to $299,999 | 195 (49.6%) | 204 (35.5%) |
| $300,000 to $499,999 | 65 (16.5%) | 200 (34.8%) |
| $500,000 to $749,999 | 29 (7.4%) | 50 (8.7%) |
| $750,000 to $999,999 | 30 (7.6%) | 33 (5.8%) |
| $1,000,000 or more | 7 (1.8%) | 27 (4.7%) |
| Total | 393 (100.0%) | 574 (100.0%) |
Household Income by Mortgage Status in Cohasset
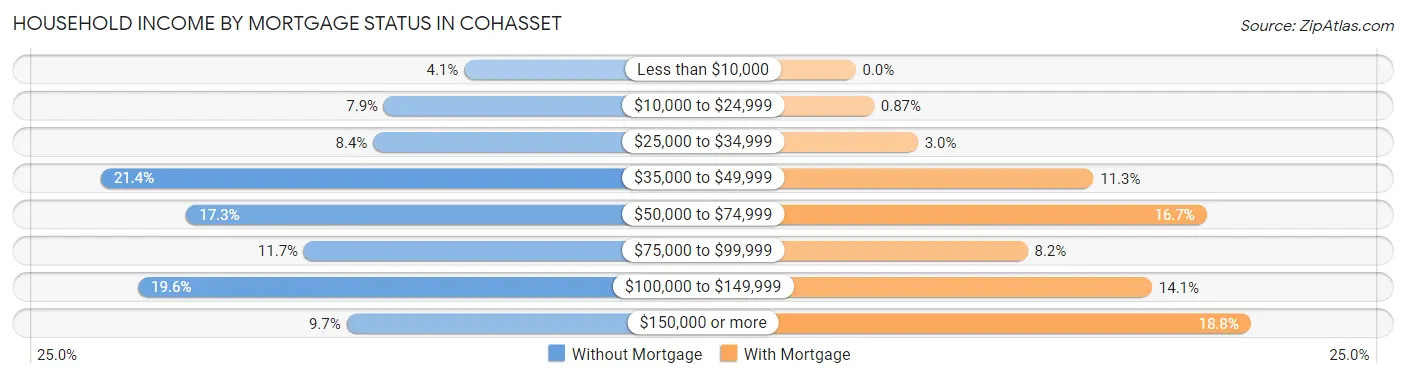
| Household Income | Without Mortgage | With Mortgage |
| Less than $10,000 | 16 (4.1%) | 0 (0.0%) |
| $10,000 to $24,999 | 31 (7.9%) | 5 (0.9%) |
| $25,000 to $34,999 | 33 (8.4%) | 17 (3.0%) |
| $35,000 to $49,999 | 84 (21.4%) | 65 (11.3%) |
| $50,000 to $74,999 | 68 (17.3%) | 96 (16.7%) |
| $75,000 to $99,999 | 46 (11.7%) | 47 (8.2%) |
| $100,000 to $149,999 | 77 (19.6%) | 81 (14.1%) |
| $150,000 or more | 38 (9.7%) | 108 (18.8%) |
| Total | 393 (100.0%) | 574 (100.0%) |
Property Value to Household Income Ratio in Cohasset
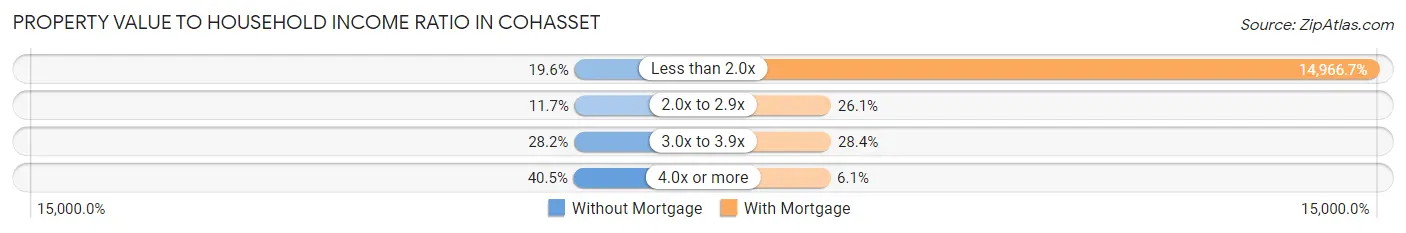
| Value-to-Income Ratio | Without Mortgage | With Mortgage |
| Less than 2.0x | 77 (19.6%) | 85,909 (14,966.7%) |
| 2.0x to 2.9x | 46 (11.7%) | 150 (26.1%) |
| 3.0x to 3.9x | 111 (28.2%) | 163 (28.4%) |
| 4.0x or more | 159 (40.5%) | 35 (6.1%) |
| Total | 393 (100.0%) | 574 (100.0%) |
Real Estate Taxes by Mortgage Status in Cohasset
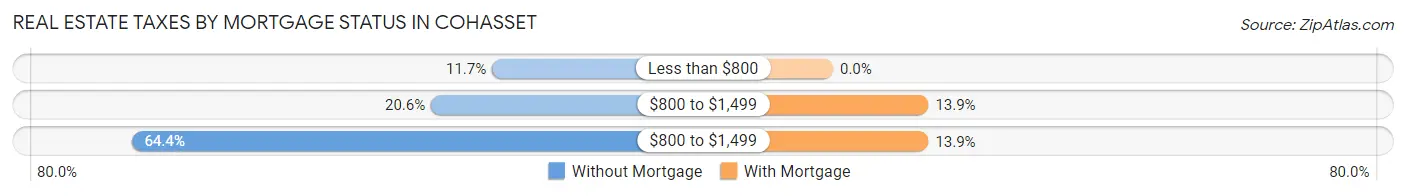
| Property Taxes | Without Mortgage | With Mortgage |
| Less than $800 | 46 (11.7%) | 0 (0.0%) |
| $800 to $1,499 | 81 (20.6%) | 80 (13.9%) |
| $800 to $1,499 | 253 (64.4%) | 80 (13.9%) |
| Total | 393 (100.0%) | 574 (100.0%) |
Health & Disability in Cohasset
Health Insurance Coverage by Age in Cohasset
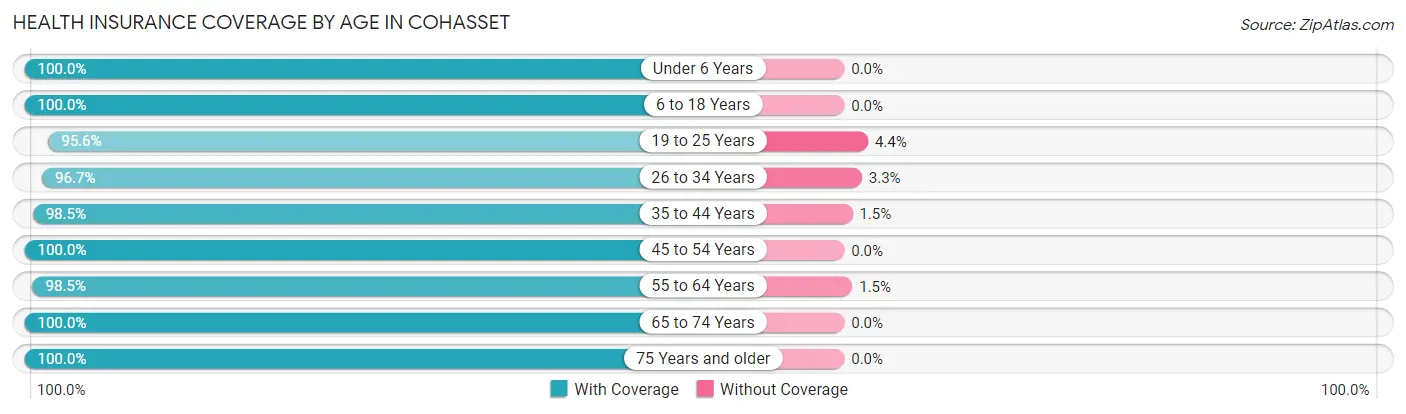
| Age Bracket | With Coverage | Without Coverage |
| Under 6 Years | 325 (100.0%) | 0 (0.0%) |
| 6 to 18 Years | 295 (100.0%) | 0 (0.0%) |
| 19 to 25 Years | 173 (95.6%) | 8 (4.4%) |
| 26 to 34 Years | 265 (96.7%) | 9 (3.3%) |
| 35 to 44 Years | 325 (98.5%) | 5 (1.5%) |
| 45 to 54 Years | 207 (100.0%) | 0 (0.0%) |
| 55 to 64 Years | 398 (98.5%) | 6 (1.5%) |
| 65 to 74 Years | 471 (100.0%) | 0 (0.0%) |
| 75 Years and older | 196 (100.0%) | 0 (0.0%) |
| Total | 2,655 (99.0%) | 28 (1.0%) |
Health Insurance Coverage by Citizenship Status in Cohasset
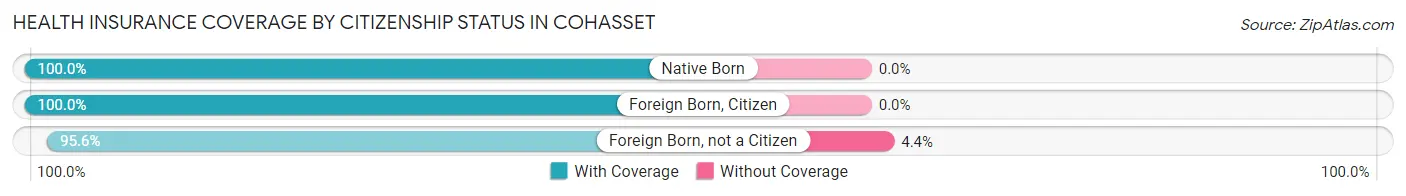
| Citizenship Status | With Coverage | Without Coverage |
| Native Born | 325 (100.0%) | 0 (0.0%) |
| Foreign Born, Citizen | 295 (100.0%) | 0 (0.0%) |
| Foreign Born, not a Citizen | 173 (95.6%) | 8 (4.4%) |
Health Insurance Coverage by Household Income in Cohasset
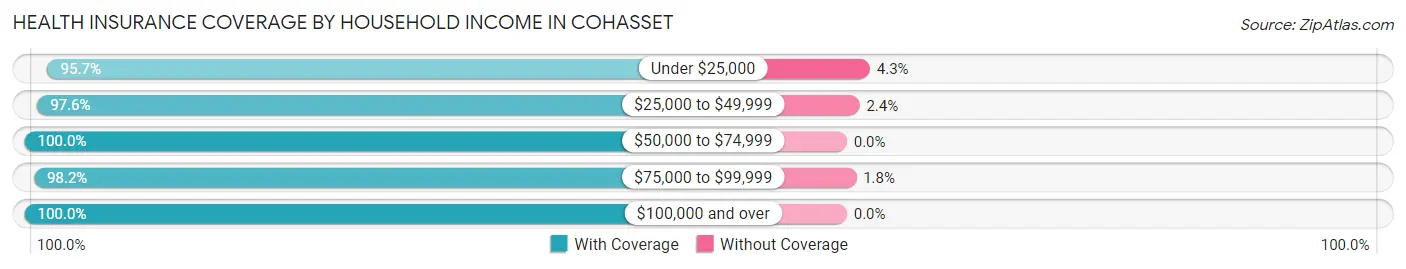
| Household Income | With Coverage | Without Coverage |
| Under $25,000 | 133 (95.7%) | 6 (4.3%) |
| $25,000 to $49,999 | 536 (97.6%) | 13 (2.4%) |
| $50,000 to $74,999 | 226 (100.0%) | 0 (0.0%) |
| $75,000 to $99,999 | 501 (98.2%) | 9 (1.8%) |
| $100,000 and over | 1,254 (100.0%) | 0 (0.0%) |
Public vs Private Health Insurance Coverage by Age in Cohasset
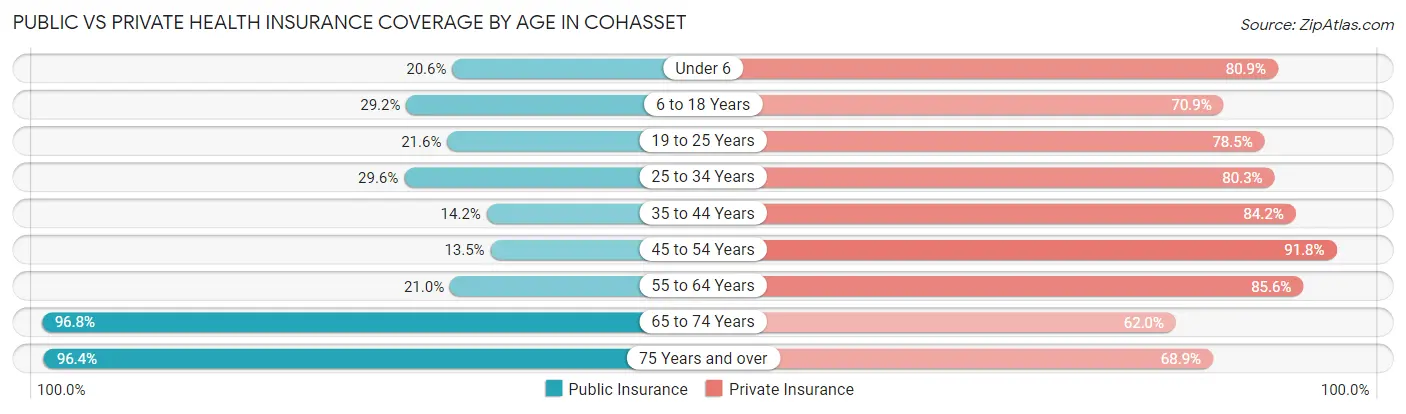
| Age Bracket | Public Insurance | Private Insurance |
| Under 6 | 67 (20.6%) | 263 (80.9%) |
| 6 to 18 Years | 86 (29.1%) | 209 (70.9%) |
| 19 to 25 Years | 39 (21.5%) | 142 (78.4%) |
| 25 to 34 Years | 81 (29.6%) | 220 (80.3%) |
| 35 to 44 Years | 47 (14.2%) | 278 (84.2%) |
| 45 to 54 Years | 28 (13.5%) | 190 (91.8%) |
| 55 to 64 Years | 85 (21.0%) | 346 (85.6%) |
| 65 to 74 Years | 456 (96.8%) | 292 (62.0%) |
| 75 Years and over | 189 (96.4%) | 135 (68.9%) |
| Total | 1,078 (40.2%) | 2,075 (77.3%) |
Disability Status by Sex by Age in Cohasset
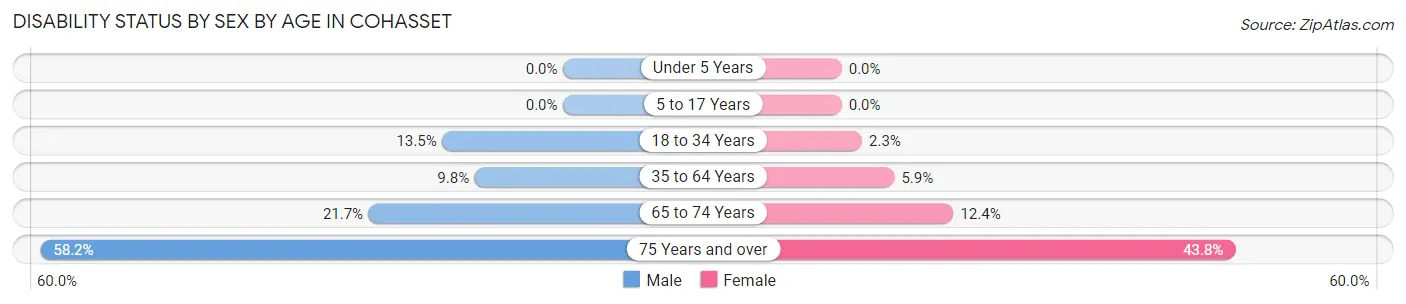
| Age Bracket | Male | Female |
| Under 5 Years | 0 (0.0%) | 0 (0.0%) |
| 5 to 17 Years | 0 (0.0%) | 0 (0.0%) |
| 18 to 34 Years | 21 (13.5%) | 7 (2.3%) |
| 35 to 64 Years | 44 (9.8%) | 29 (5.9%) |
| 65 to 74 Years | 55 (21.6%) | 27 (12.4%) |
| 75 Years and over | 53 (58.2%) | 46 (43.8%) |
Disability Class by Sex by Age in Cohasset
Disability Class: Hearing Difficulty
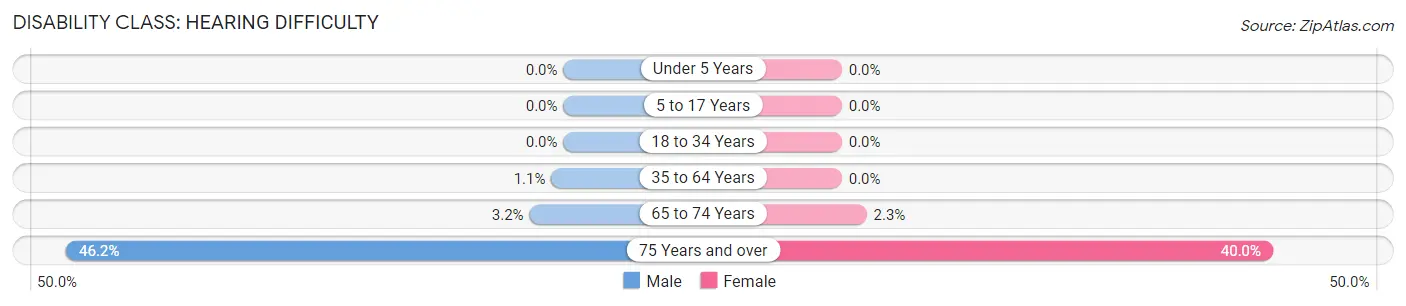
| Age Bracket | Male | Female |
| Under 5 Years | 0 (0.0%) | 0 (0.0%) |
| 5 to 17 Years | 0 (0.0%) | 0 (0.0%) |
| 18 to 34 Years | 0 (0.0%) | 0 (0.0%) |
| 35 to 64 Years | 5 (1.1%) | 0 (0.0%) |
| 65 to 74 Years | 8 (3.2%) | 5 (2.3%) |
| 75 Years and over | 42 (46.2%) | 42 (40.0%) |
Disability Class: Vision Difficulty
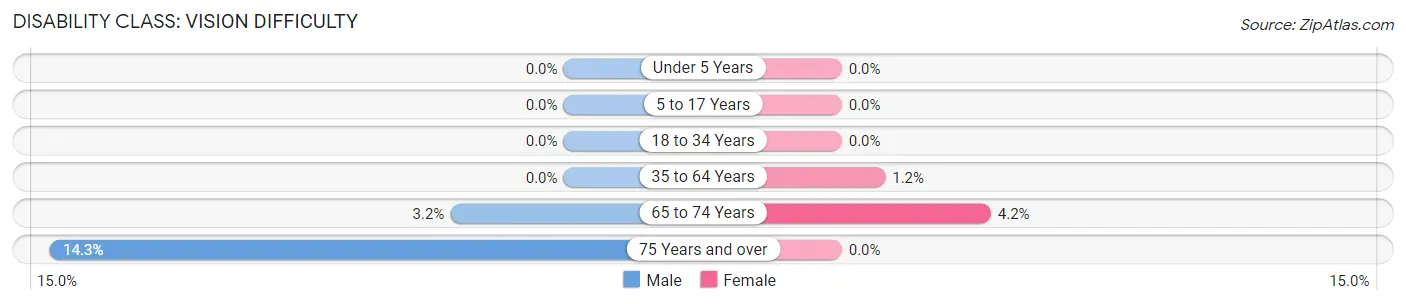
| Age Bracket | Male | Female |
| Under 5 Years | 0 (0.0%) | 0 (0.0%) |
| 5 to 17 Years | 0 (0.0%) | 0 (0.0%) |
| 18 to 34 Years | 0 (0.0%) | 0 (0.0%) |
| 35 to 64 Years | 0 (0.0%) | 6 (1.2%) |
| 65 to 74 Years | 8 (3.2%) | 9 (4.2%) |
| 75 Years and over | 13 (14.3%) | 0 (0.0%) |
Disability Class: Cognitive Difficulty
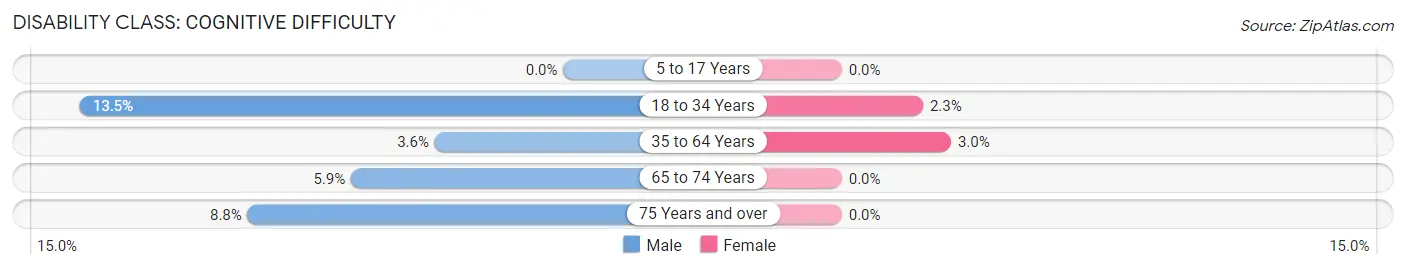
| Age Bracket | Male | Female |
| 5 to 17 Years | 0 (0.0%) | 0 (0.0%) |
| 18 to 34 Years | 21 (13.5%) | 7 (2.3%) |
| 35 to 64 Years | 16 (3.6%) | 15 (3.0%) |
| 65 to 74 Years | 15 (5.9%) | 0 (0.0%) |
| 75 Years and over | 8 (8.8%) | 0 (0.0%) |
Disability Class: Ambulatory Difficulty
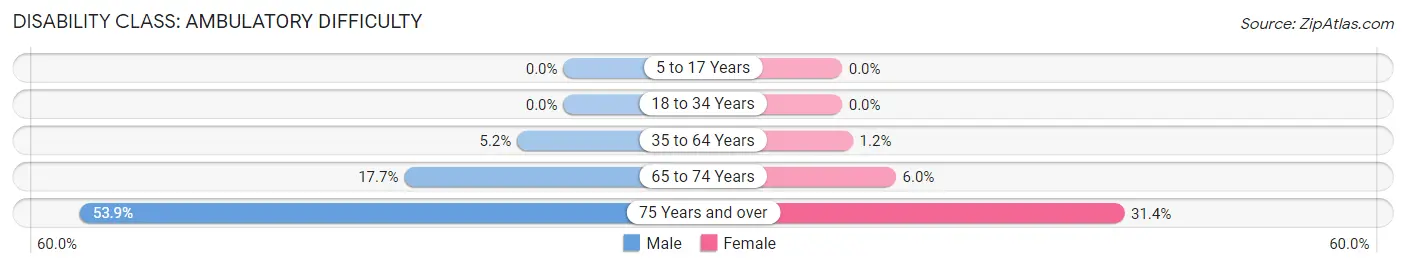
| Age Bracket | Male | Female |
| 5 to 17 Years | 0 (0.0%) | 0 (0.0%) |
| 18 to 34 Years | 0 (0.0%) | 0 (0.0%) |
| 35 to 64 Years | 23 (5.1%) | 6 (1.2%) |
| 65 to 74 Years | 45 (17.7%) | 13 (6.0%) |
| 75 Years and over | 49 (53.8%) | 33 (31.4%) |
Disability Class: Self-Care Difficulty
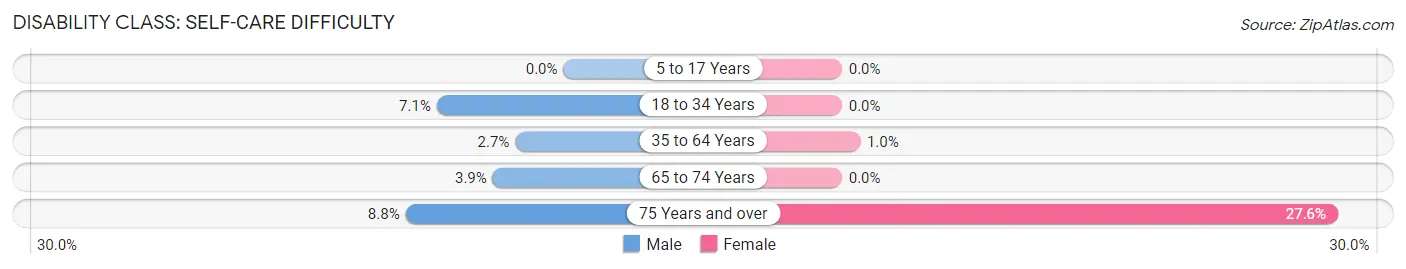
| Age Bracket | Male | Female |
| 5 to 17 Years | 0 (0.0%) | 0 (0.0%) |
| 18 to 34 Years | 11 (7.0%) | 0 (0.0%) |
| 35 to 64 Years | 12 (2.7%) | 5 (1.0%) |
| 65 to 74 Years | 10 (3.9%) | 0 (0.0%) |
| 75 Years and over | 8 (8.8%) | 29 (27.6%) |
Technology Access in Cohasset
Computing Device Access in Cohasset
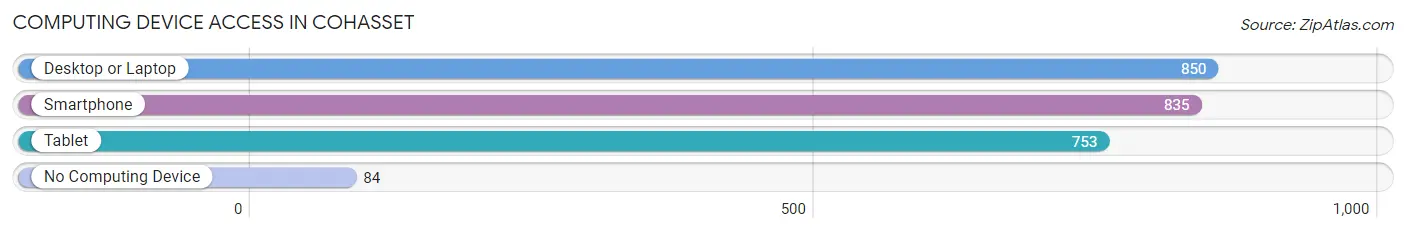
| Device Type | # Households | % Households |
| Desktop or Laptop | 850 | 81.0% |
| Smartphone | 835 | 79.6% |
| Tablet | 753 | 71.8% |
| No Computing Device | 84 | 8.0% |
| Total | 1,049 | 100.0% |
Internet Access in Cohasset
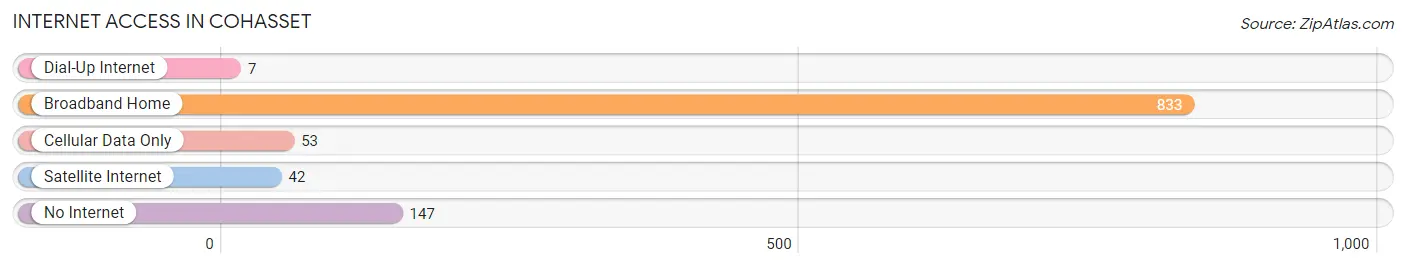
| Internet Type | # Households | % Households |
| Dial-Up Internet | 7 | 0.7% |
| Broadband Home | 833 | 79.4% |
| Cellular Data Only | 53 | 5.1% |
| Satellite Internet | 42 | 4.0% |
| No Internet | 147 | 14.0% |
| Total | 1,049 | 100.0% |
Cohasset Summary
Cohasset, Minnesota is a small city located in Itasca County, in the northern part of the state. It is situated on the banks of the Mississippi River, about 25 miles north of Grand Rapids. The city has a population of about 1,500 people, and is part of the Grand Rapids-Itasca County Metropolitan Statistical Area.
History
Cohasset was first settled in 1887 by a group of Swedish immigrants. The town was named after Cohasset, Massachusetts, which was the hometown of one of the settlers. The town was incorporated in 1901, and the first mayor was elected in 1902.
The town grew slowly, but steadily, over the years. In the early 1900s, the town was home to a number of small businesses, including a sawmill, a creamery, and a general store. The town also had a school, a post office, and a church.
In the 1950s, the town began to experience a period of growth. The population increased from about 500 in 1950 to over 1,000 in 1960. This growth was due in part to the construction of a new highway, which connected Cohasset to Grand Rapids.
Geography
Cohasset is located in the northern part of Minnesota, in Itasca County. The city is situated on the banks of the Mississippi River, about 25 miles north of Grand Rapids. The city is surrounded by forests and lakes, and is part of the Chippewa National Forest.
The city has a total area of 1.3 square miles, all of which is land. The city has a humid continental climate, with cold winters and warm summers. The average annual temperature is around 40 degrees Fahrenheit.
Economy
The economy of Cohasset is largely based on tourism and forestry. The city is home to a number of tourist attractions, including the Chippewa National Forest, the Mississippi River, and the Grand Rapids-Itasca County Metropolitan Statistical Area.
The city is also home to a number of small businesses, including restaurants, retail stores, and service providers. The city is also home to a number of manufacturing companies, including a paper mill and a wood products plant.
Demographics
As of the 2010 census, the population of Cohasset was 1,521. The racial makeup of the city was 97.2% White, 0.7% African American, 0.3% Native American, 0.2% Asian, 0.1% Pacific Islander, 0.3% from other races, and 1.3% from two or more races. Hispanic or Latino of any race were 1.3% of the population.
The median household income in Cohasset was $41,250, and the median family income was $50,000. The per capita income for the city was $20,845. About 11.2% of families and 14.2% of the population were below the poverty line, including 18.2% of those under age 18 and 8.3% of those age 65 or over.
Common Questions
What is Per Capita Income in Cohasset?
Per Capita income in Cohasset is $43,281.
What is the Median Family Income in Cohasset?
Median Family Income in Cohasset is $84,306.
What is the Median Household income in Cohasset?
Median Household Income in Cohasset is $76,989.
What is Income or Wage Gap in Cohasset?
Income or Wage Gap in Cohasset is 41.2%.
Women in Cohasset earn 58.8 cents for every dollar earned by a man.
What is Inequality or Gini Index in Cohasset?
Inequality or Gini Index in Cohasset is 0.48.
What is the Total Population of Cohasset?
Total Population of Cohasset is 2,683.
What is the Total Male Population of Cohasset?
Total Male Population of Cohasset is 1,280.
What is the Total Female Population of Cohasset?
Total Female Population of Cohasset is 1,403.
What is the Ratio of Males per 100 Females in Cohasset?
There are 91.23 Males per 100 Females in Cohasset.
What is the Ratio of Females per 100 Males in Cohasset?
There are 109.61 Females per 100 Males in Cohasset.
What is the Median Population Age in Cohasset?
Median Population Age in Cohasset is 41.8 Years.
What is the Average Family Size in Cohasset
Average Family Size in Cohasset is 3.0 People.
What is the Average Household Size in Cohasset
Average Household Size in Cohasset is 2.5 People.
How Large is the Labor Force in Cohasset?
There are 1,251 People in the Labor Forcein in Cohasset.
What is the Percentage of People in the Labor Force in Cohasset?
59.5% of People are in the Labor Force in Cohasset.
What is the Unemployment Rate in Cohasset?
Unemployment Rate in Cohasset is 10.2%.