Clontarf, MN Map & Demographics
Clontarf Map
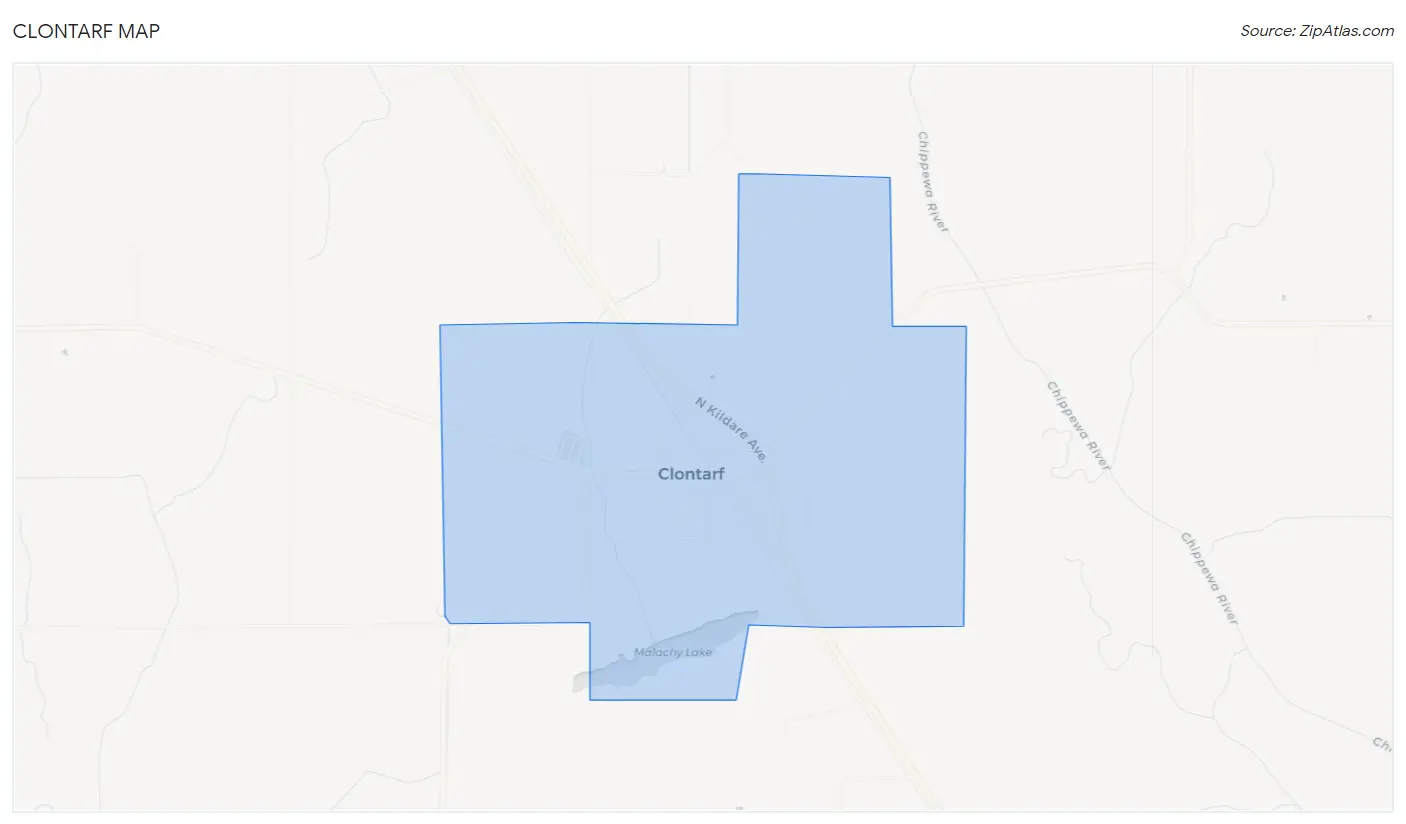
Clontarf Overview
$45,690
PER CAPITA INCOME
$108,750
AVG FAMILY INCOME
$71,875
AVG HOUSEHOLD INCOME
21.5%
WAGE / INCOME GAP [ % ]
78.5¢/ $1
WAGE / INCOME GAP [ $ ]
0.35
INEQUALITY / GINI INDEX
71
TOTAL POPULATION
41
MALE POPULATION
30
FEMALE POPULATION
136.67
MALES / 100 FEMALES
73.17
FEMALES / 100 MALES
42.3
MEDIAN AGE
2.7
AVG FAMILY SIZE
2.0
AVG HOUSEHOLD SIZE
44
LABOR FORCE [ PEOPLE ]
73.3%
PERCENT IN LABOR FORCE
Clontarf Zip Codes
Clontarf Area Codes
Income in Clontarf
Income Overview in Clontarf
Per Capita Income in Clontarf is $45,690, while median incomes of families and households are $108,750 and $71,875 respectively.
| Characteristic | Number | Measure |
| Per Capita Income | 71 | $45,690 |
| Median Family Income | 20 | $108,750 |
| Mean Family Income | 20 | $120,800 |
| Median Household Income | 35 | $71,875 |
| Mean Household Income | 35 | $94,509 |
| Income Deficit | 20 | $0 |
| Wage / Income Gap (%) | 71 | 21.46% |
| Wage / Income Gap ($) | 71 | 78.54¢ per $1 |
| Gini / Inequality Index | 71 | 0.35 |
Earnings by Sex in Clontarf
Average Earnings in Clontarf are $55,972, $57,292 for men and $45,000 for women, a difference of 21.5%.
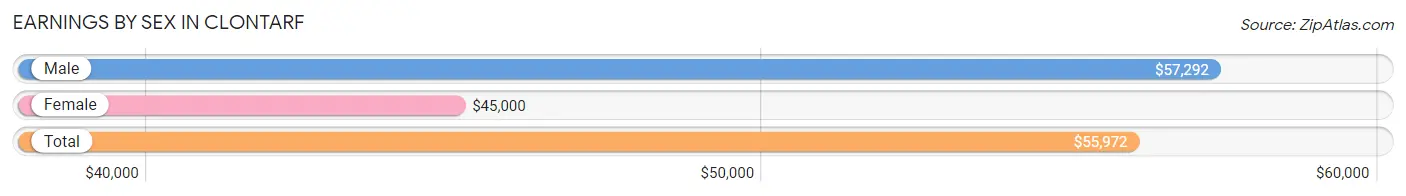
| Sex | Number | Average Earnings |
| Male | 29 (64.4%) | $57,292 |
| Female | 16 (35.6%) | $45,000 |
| Total | 45 (100.0%) | $55,972 |
Earnings by Sex by Income Bracket in Clontarf
The most common earnings brackets in Clontarf are $55,000 to $64,999 for men (9 | 31.0%) and $55,000 to $64,999 for women (5 | 31.2%).
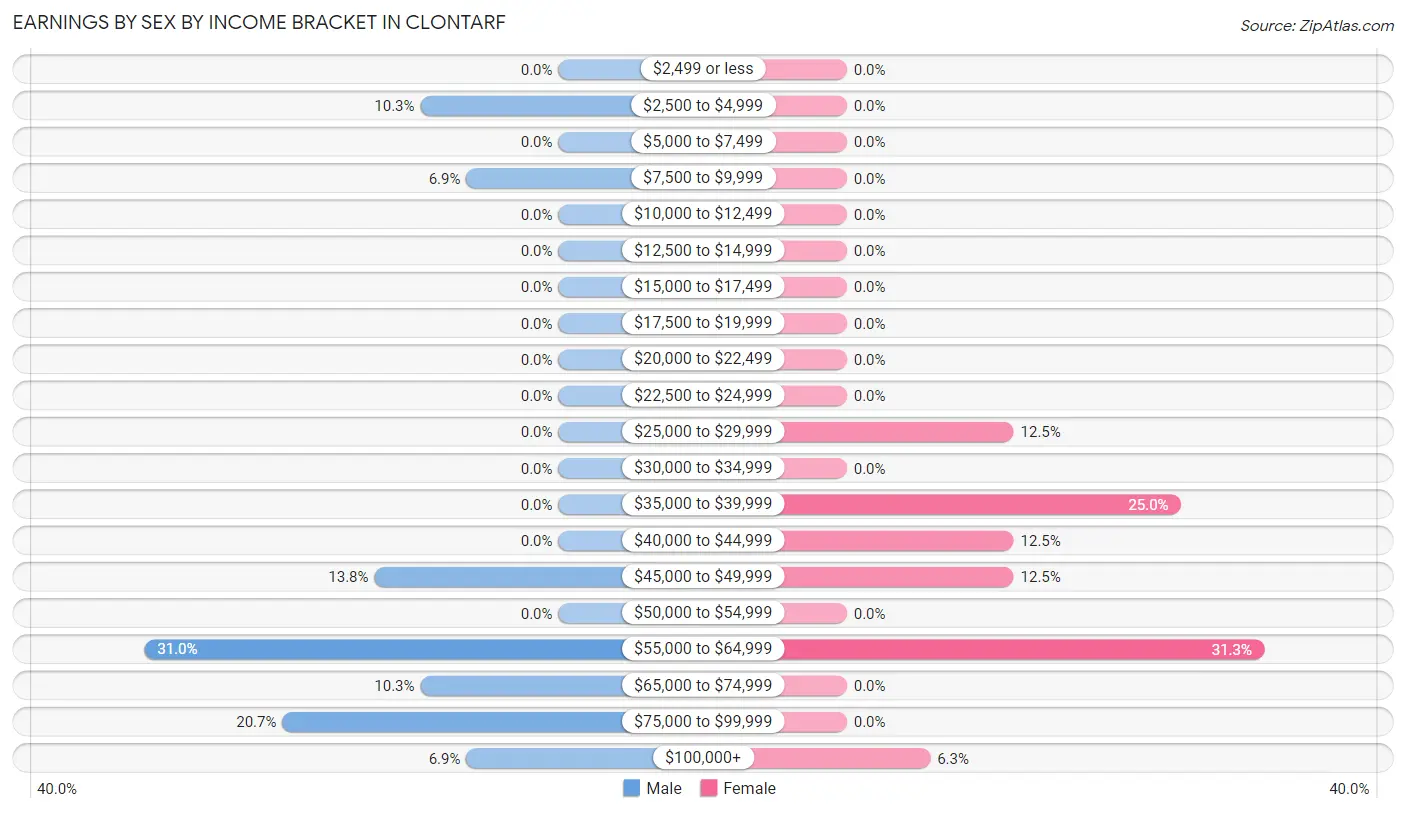
| Income | Male | Female |
| $2,499 or less | 0 (0.0%) | 0 (0.0%) |
| $2,500 to $4,999 | 3 (10.3%) | 0 (0.0%) |
| $5,000 to $7,499 | 0 (0.0%) | 0 (0.0%) |
| $7,500 to $9,999 | 2 (6.9%) | 0 (0.0%) |
| $10,000 to $12,499 | 0 (0.0%) | 0 (0.0%) |
| $12,500 to $14,999 | 0 (0.0%) | 0 (0.0%) |
| $15,000 to $17,499 | 0 (0.0%) | 0 (0.0%) |
| $17,500 to $19,999 | 0 (0.0%) | 0 (0.0%) |
| $20,000 to $22,499 | 0 (0.0%) | 0 (0.0%) |
| $22,500 to $24,999 | 0 (0.0%) | 0 (0.0%) |
| $25,000 to $29,999 | 0 (0.0%) | 2 (12.5%) |
| $30,000 to $34,999 | 0 (0.0%) | 0 (0.0%) |
| $35,000 to $39,999 | 0 (0.0%) | 4 (25.0%) |
| $40,000 to $44,999 | 0 (0.0%) | 2 (12.5%) |
| $45,000 to $49,999 | 4 (13.8%) | 2 (12.5%) |
| $50,000 to $54,999 | 0 (0.0%) | 0 (0.0%) |
| $55,000 to $64,999 | 9 (31.0%) | 5 (31.2%) |
| $65,000 to $74,999 | 3 (10.3%) | 0 (0.0%) |
| $75,000 to $99,999 | 6 (20.7%) | 0 (0.0%) |
| $100,000+ | 2 (6.9%) | 1 (6.2%) |
| Total | 29 (100.0%) | 16 (100.0%) |
Earnings by Sex by Educational Attainment in Clontarf
Average earnings in Clontarf are $63,125 for men and $45,000 for women, a difference of 28.7%. Men with an educational attainment of college or associate's degree enjoy the highest average annual earnings of $67,500, while those with high school diploma education earn the least with $56,250. Women with an educational attainment of college or associate's degree earn the most with the average annual earnings of $44,375, while those with high school diploma education have the smallest earnings of $31,250.
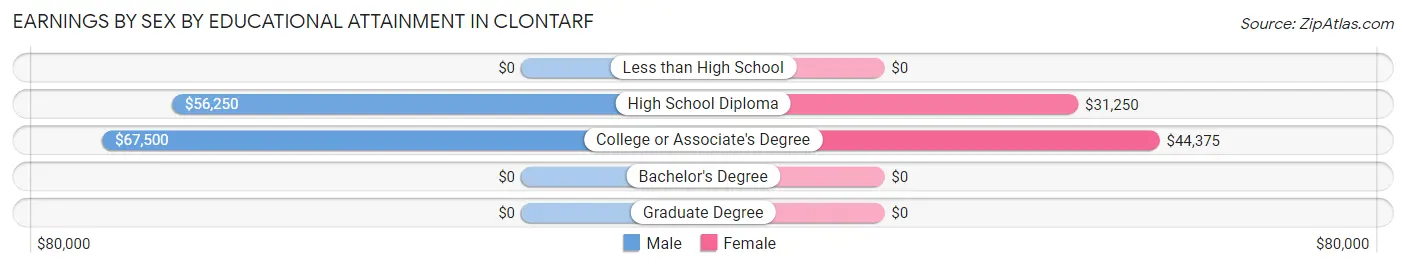
| Educational Attainment | Male Income | Female Income |
| Less than High School | - | - |
| High School Diploma | $56,250 | $31,250 |
| College or Associate's Degree | $67,500 | $44,375 |
| Bachelor's Degree | - | - |
| Graduate Degree | - | - |
| Total | $63,125 | $45,000 |
Family Income in Clontarf
Family Income Brackets in Clontarf
According to the Clontarf family income data, there are 8 families falling into the $100,000 to $149,999 income range, which is the most common income bracket and makes up 40.0% of all families.
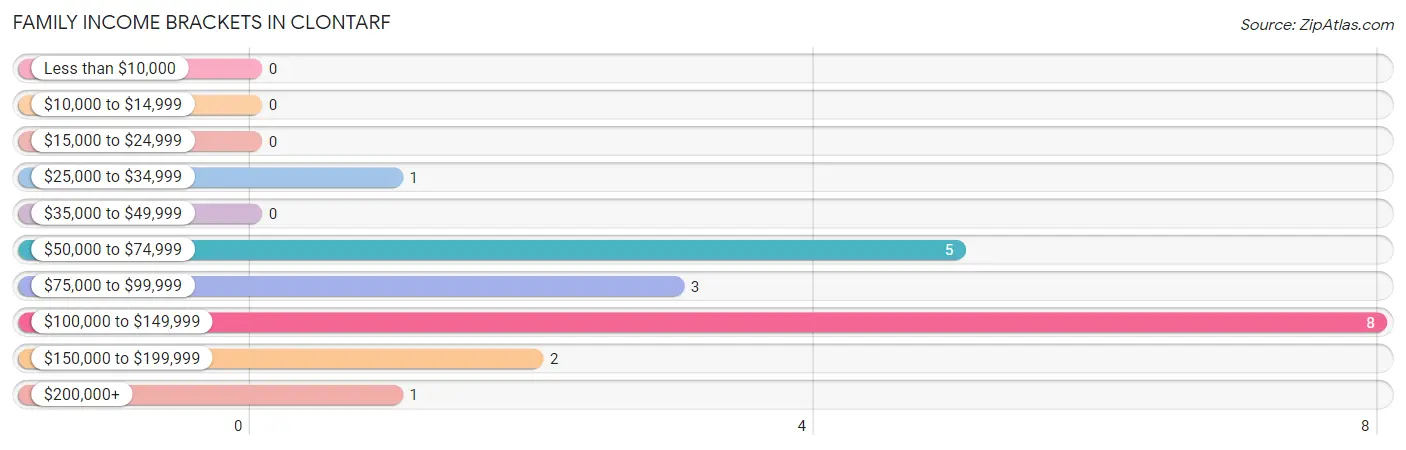
| Income Bracket | # Families | % Families |
| Less than $10,000 | 0 | 0.0% |
| $10,000 to $14,999 | 0 | 0.0% |
| $15,000 to $24,999 | 0 | 0.0% |
| $25,000 to $34,999 | 1 | 5.0% |
| $35,000 to $49,999 | 0 | 0.0% |
| $50,000 to $74,999 | 5 | 25.0% |
| $75,000 to $99,999 | 3 | 15.0% |
| $100,000 to $149,999 | 8 | 40.0% |
| $150,000 to $199,999 | 2 | 10.0% |
| $200,000+ | 1 | 5.0% |
Family Income by Famaliy Size in Clontarf
3-person families (4 | 20.0%) account for the highest median family income in Clontarf with $147,500 per family, while 3-person families (4 | 20.0%) have the highest median income of $49,167 per family member.
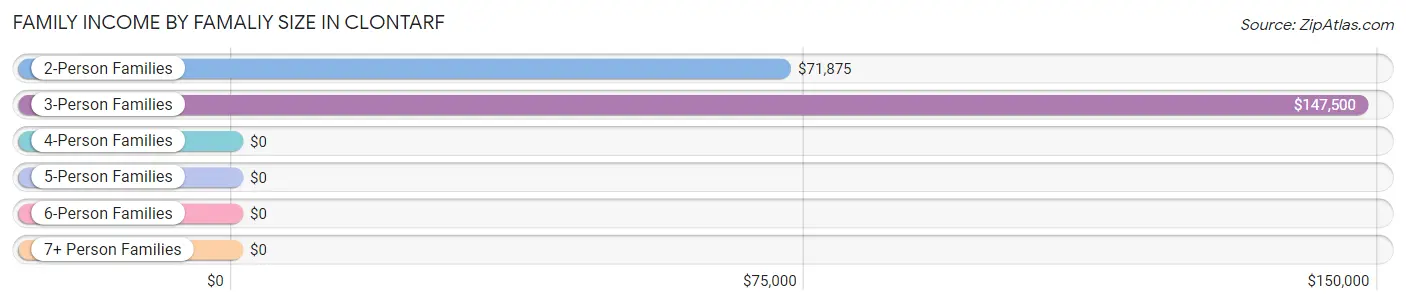
| Income Bracket | # Families | Median Income |
| 2-Person Families | 11 (55.0%) | $71,875 |
| 3-Person Families | 4 (20.0%) | $147,500 |
| 4-Person Families | 1 (5.0%) | $0 |
| 5-Person Families | 4 (20.0%) | $0 |
| 6-Person Families | 0 (0.0%) | $0 |
| 7+ Person Families | 0 (0.0%) | $0 |
| Total | 20 (100.0%) | $108,750 |
Family Income by Number of Earners in Clontarf
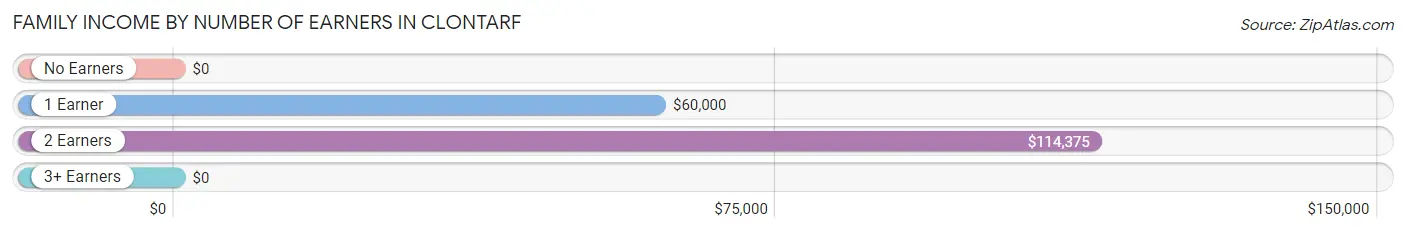
| Number of Earners | # Families | Median Income |
| No Earners | 2 (10.0%) | $0 |
| 1 Earner | 4 (20.0%) | $60,000 |
| 2 Earners | 13 (65.0%) | $114,375 |
| 3+ Earners | 1 (5.0%) | $0 |
| Total | 20 (100.0%) | $108,750 |
Household Income in Clontarf
Household Income Brackets in Clontarf
With 11 households falling in the category, the $50,000 to $74,999 income range is the most frequent in Clontarf, accounting for 31.4% of all households.
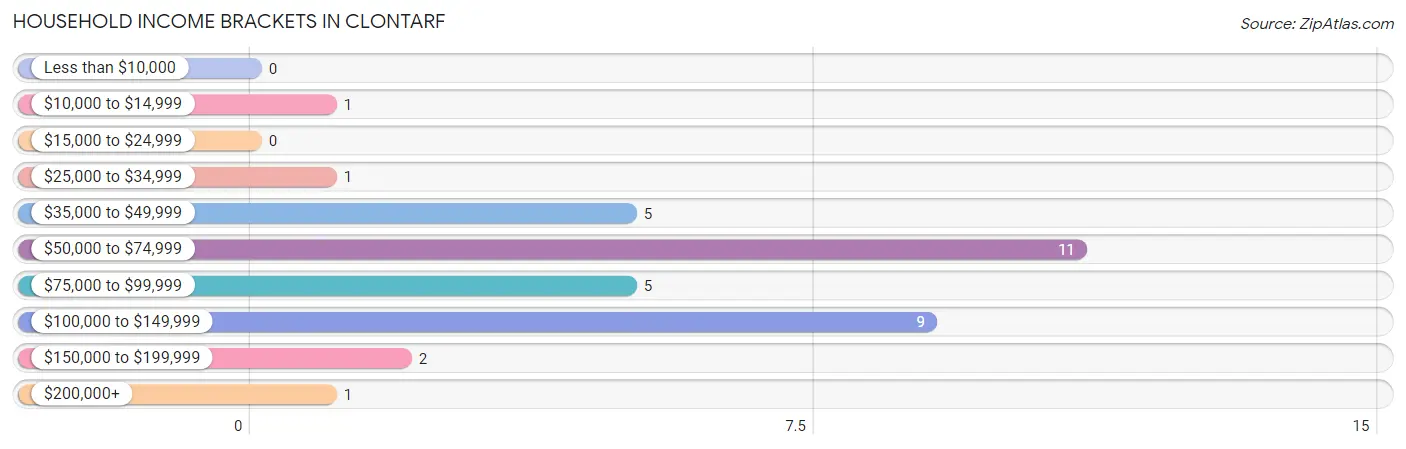
| Income Bracket | # Households | % Households |
| Less than $10,000 | 0 | 0.0% |
| $10,000 to $14,999 | 1 | 2.9% |
| $15,000 to $24,999 | 0 | 0.0% |
| $25,000 to $34,999 | 1 | 2.9% |
| $35,000 to $49,999 | 5 | 14.3% |
| $50,000 to $74,999 | 11 | 31.4% |
| $75,000 to $99,999 | 5 | 14.3% |
| $100,000 to $149,999 | 9 | 25.7% |
| $150,000 to $199,999 | 2 | 5.7% |
| $200,000+ | 1 | 2.9% |
Household Income by Householder Age in Clontarf
The median household income in Clontarf is $71,875, with the highest median household income of $76,875 found in the 45 to 64 years age bracket for the primary householder. A total of 11 households (31.4%) fall into this category.
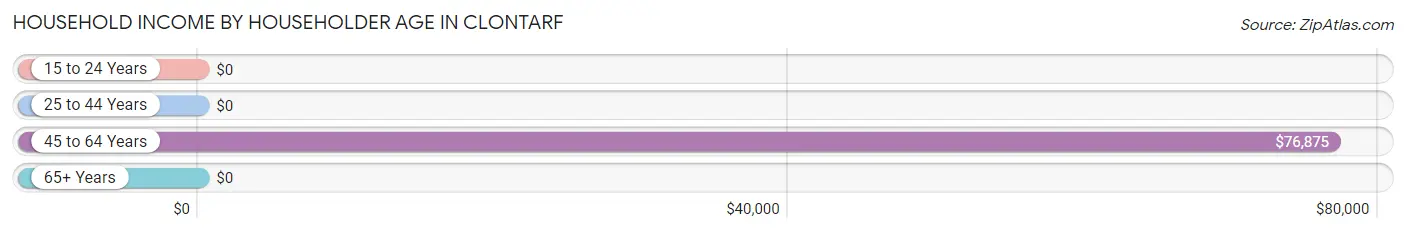
| Income Bracket | # Households | Median Income |
| 15 to 24 Years | 0 (0.0%) | $0 |
| 25 to 44 Years | 15 (42.9%) | $0 |
| 45 to 64 Years | 11 (31.4%) | $76,875 |
| 65+ Years | 9 (25.7%) | $0 |
| Total | 35 (100.0%) | $71,875 |
Poverty in Clontarf
Income Below Poverty by Sex and Age in Clontarf
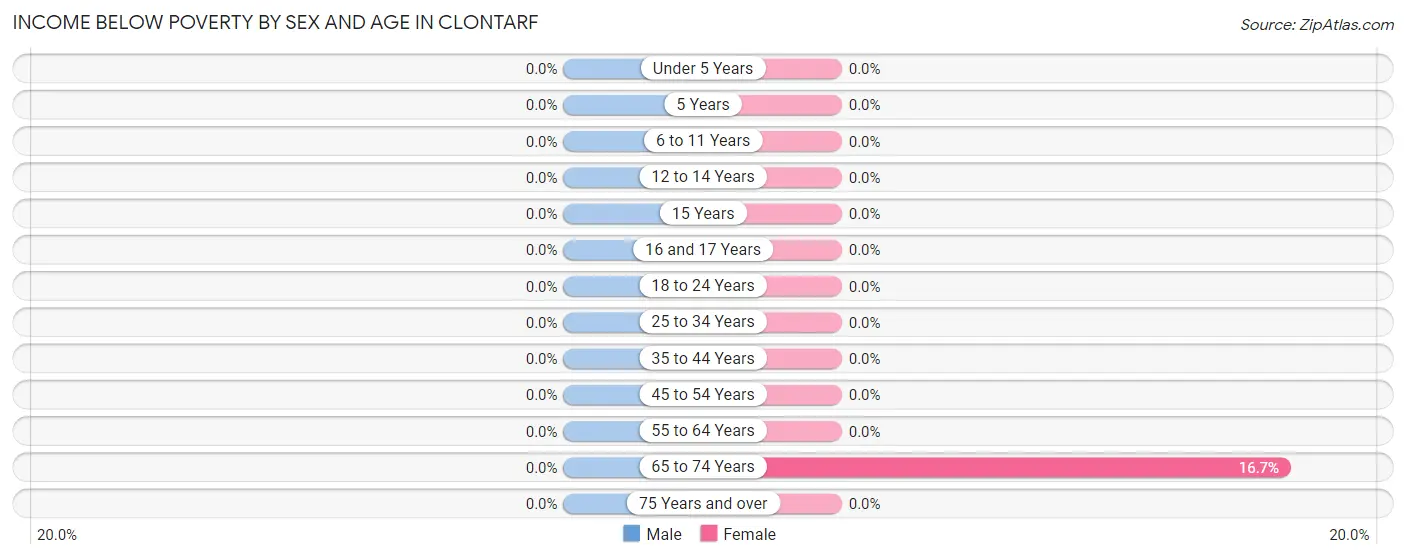
| Age Bracket | Male | Female |
| Under 5 Years | 0 (0.0%) | 0 (0.0%) |
| 5 Years | 0 (0.0%) | 0 (0.0%) |
| 6 to 11 Years | 0 (0.0%) | 0 (0.0%) |
| 12 to 14 Years | 0 (0.0%) | 0 (0.0%) |
| 15 Years | 0 (0.0%) | 0 (0.0%) |
| 16 and 17 Years | 0 (0.0%) | 0 (0.0%) |
| 18 to 24 Years | 0 (0.0%) | 0 (0.0%) |
| 25 to 34 Years | 0 (0.0%) | 0 (0.0%) |
| 35 to 44 Years | 0 (0.0%) | 0 (0.0%) |
| 45 to 54 Years | 0 (0.0%) | 0 (0.0%) |
| 55 to 64 Years | 0 (0.0%) | 0 (0.0%) |
| 65 to 74 Years | 0 (0.0%) | 1 (16.7%) |
| 75 Years and over | 0 (0.0%) | 0 (0.0%) |
| Total | 0 (0.0%) | 1 (3.3%) |
Income Above Poverty by Sex and Age in Clontarf
According to the poverty statistics in Clontarf, males aged 15 years and females aged 6 to 11 years are the age groups that are most secure financially, with 100.0% of males and 100.0% of females in these age groups living above the poverty line.
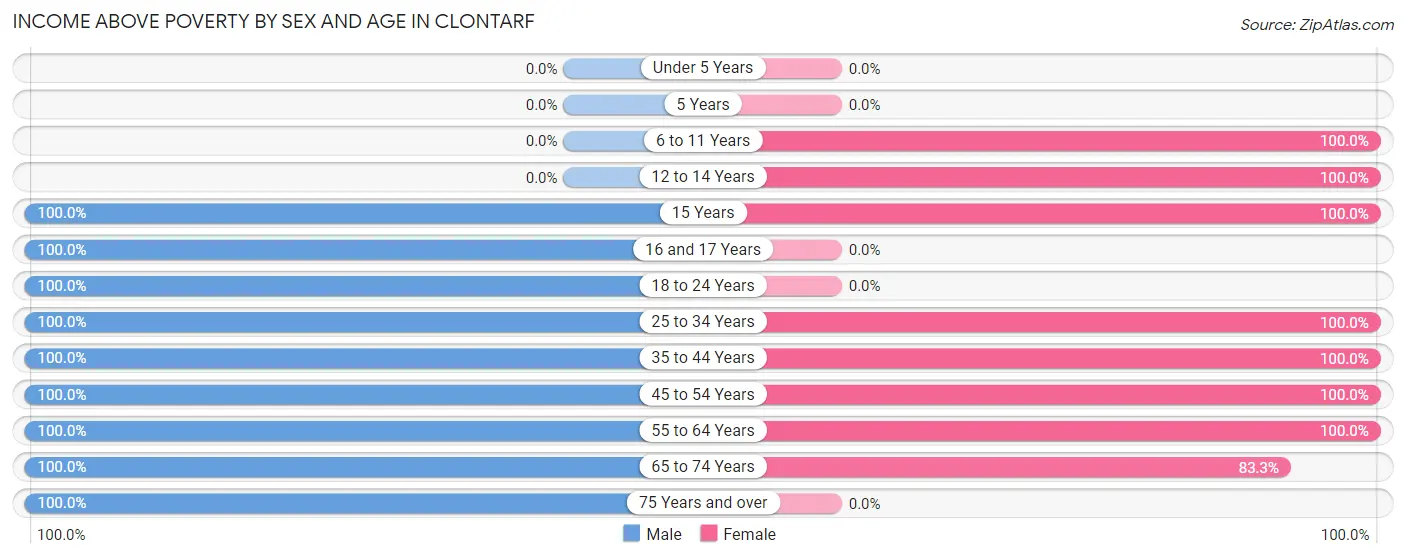
| Age Bracket | Male | Female |
| Under 5 Years | 0 (0.0%) | 0 (0.0%) |
| 5 Years | 0 (0.0%) | 0 (0.0%) |
| 6 to 11 Years | 0 (0.0%) | 6 (100.0%) |
| 12 to 14 Years | 0 (0.0%) | 3 (100.0%) |
| 15 Years | 1 (100.0%) | 1 (100.0%) |
| 16 and 17 Years | 4 (100.0%) | 0 (0.0%) |
| 18 to 24 Years | 1 (100.0%) | 0 (0.0%) |
| 25 to 34 Years | 1 (100.0%) | 1 (100.0%) |
| 35 to 44 Years | 14 (100.0%) | 5 (100.0%) |
| 45 to 54 Years | 6 (100.0%) | 4 (100.0%) |
| 55 to 64 Years | 2 (100.0%) | 4 (100.0%) |
| 65 to 74 Years | 10 (100.0%) | 5 (83.3%) |
| 75 Years and over | 2 (100.0%) | 0 (0.0%) |
| Total | 41 (100.0%) | 29 (96.7%) |
Income Below Poverty Among Married-Couple Families in Clontarf
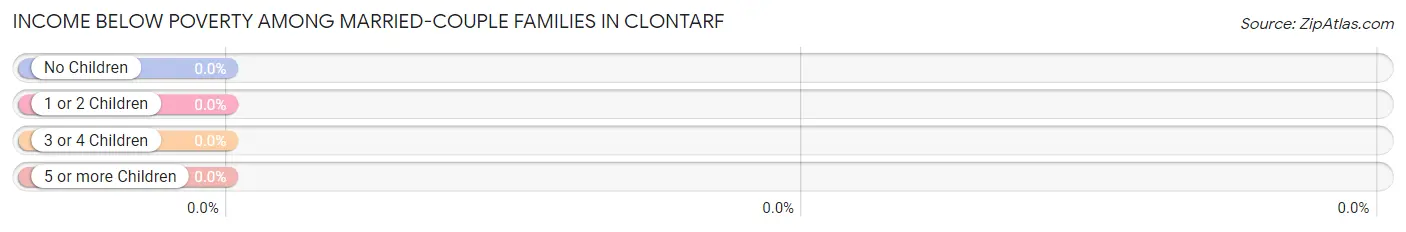
| Children | Above Poverty | Below Poverty |
| No Children | 9 (100.0%) | 0 (0.0%) |
| 1 or 2 Children | 5 (100.0%) | 0 (0.0%) |
| 3 or 4 Children | 4 (100.0%) | 0 (0.0%) |
| 5 or more Children | 0 (0.0%) | 0 (0.0%) |
| Total | 18 (100.0%) | 0 (0.0%) |
Income Below Poverty Among Single-Parent Households in Clontarf
| Children | Single Father | Single Mother |
| No Children | 0 (0.0%) | 0 (0.0%) |
| 1 or 2 Children | 0 (0.0%) | 0 (0.0%) |
| 3 or 4 Children | 0 (0.0%) | 0 (0.0%) |
| 5 or more Children | 0 (0.0%) | 0 (0.0%) |
| Total | 0 (0.0%) | 0 (0.0%) |
Income Below Poverty Among Married-Couple vs Single-Parent Households in Clontarf
| Children | Married-Couple Families | Single-Parent Households |
| No Children | 0 (0.0%) | 0 (0.0%) |
| 1 or 2 Children | 0 (0.0%) | 0 (0.0%) |
| 3 or 4 Children | 0 (0.0%) | 0 (0.0%) |
| 5 or more Children | 0 (0.0%) | 0 (0.0%) |
| Total | 0 (0.0%) | 0 (0.0%) |
Race in Clontarf
The most populous races in Clontarf are , and White / Caucasian (71 | 100.0%).
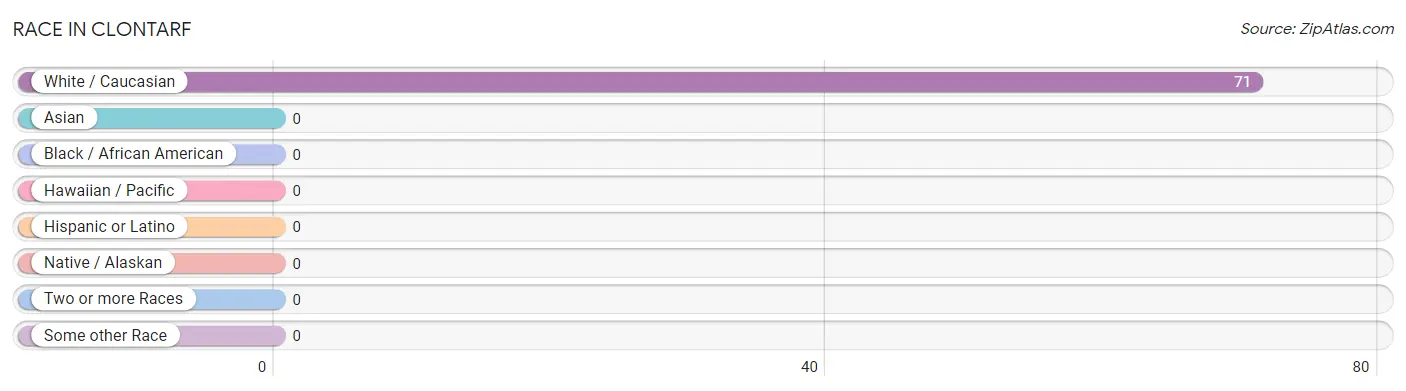
| Race | # Population | % Population |
| Asian | 0 | 0.0% |
| Black / African American | 0 | 0.0% |
| Hawaiian / Pacific | 0 | 0.0% |
| Hispanic or Latino | 0 | 0.0% |
| Native / Alaskan | 0 | 0.0% |
| White / Caucasian | 71 | 100.0% |
| Two or more Races | 0 | 0.0% |
| Some other Race | 0 | 0.0% |
| Total | 71 | 100.0% |
Ancestry in Clontarf
The most populous ancestries reported in Clontarf are German (42 | 59.2%), Norwegian (30 | 42.2%), Irish (17 | 23.9%), Swedish (10 | 14.1%), and American (2 | 2.8%), together accounting for 142.2% of all Clontarf residents.
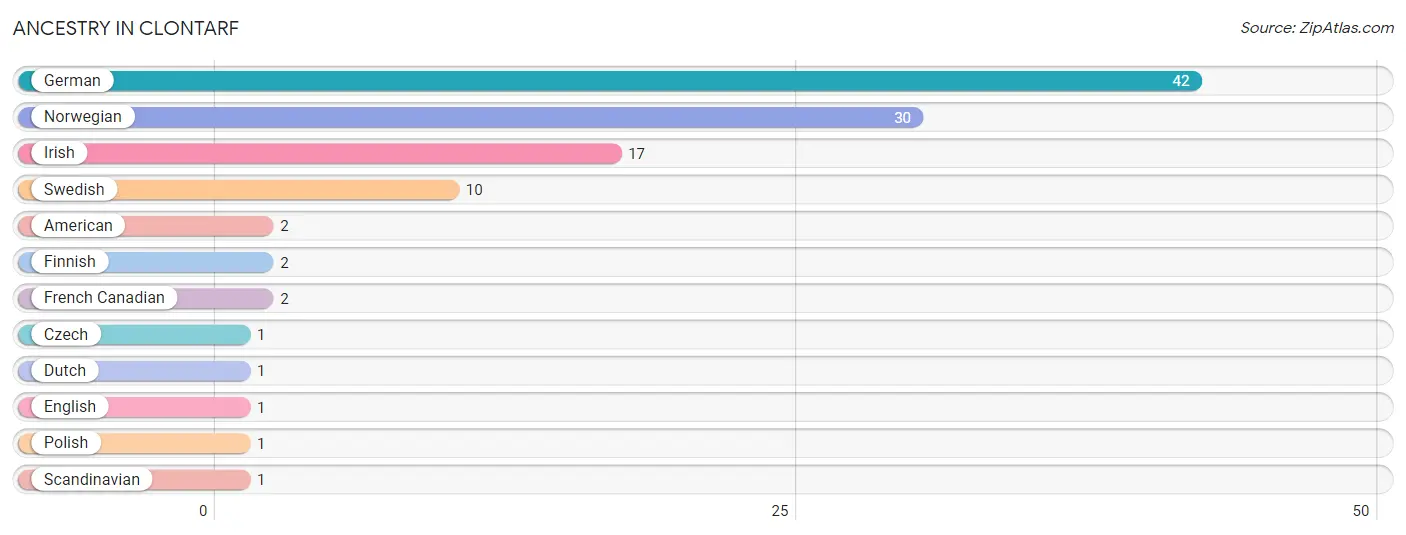
| Ancestry | # Population | % Population |
| American | 2 | 2.8% |
| Czech | 1 | 1.4% |
| Dutch | 1 | 1.4% |
| English | 1 | 1.4% |
| Finnish | 2 | 2.8% |
| French Canadian | 2 | 2.8% |
| German | 42 | 59.2% |
| Irish | 17 | 23.9% |
| Norwegian | 30 | 42.2% |
| Polish | 1 | 1.4% |
| Scandinavian | 1 | 1.4% |
| Swedish | 10 | 14.1% | View All 12 Rows |
Immigrants in Clontarf

| Immigration Origin | # Population | % Population | View All 0 Rows |
Sex and Age in Clontarf
Sex and Age in Clontarf
The most populous age groups in Clontarf are 40 to 44 Years (8 | 19.5%) for men and 10 to 14 Years (6 | 20.0%) for women.
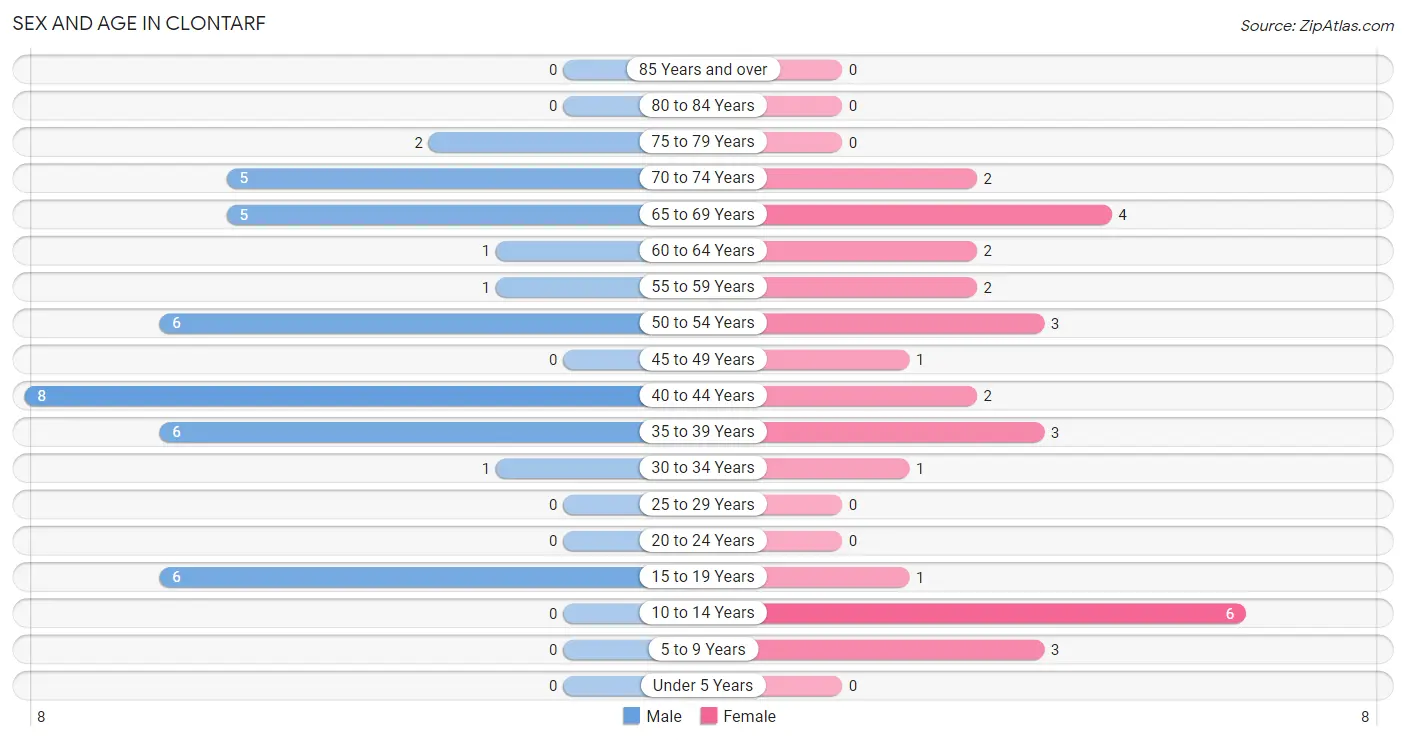
| Age Bracket | Male | Female |
| Under 5 Years | 0 (0.0%) | 0 (0.0%) |
| 5 to 9 Years | 0 (0.0%) | 3 (10.0%) |
| 10 to 14 Years | 0 (0.0%) | 6 (20.0%) |
| 15 to 19 Years | 6 (14.6%) | 1 (3.3%) |
| 20 to 24 Years | 0 (0.0%) | 0 (0.0%) |
| 25 to 29 Years | 0 (0.0%) | 0 (0.0%) |
| 30 to 34 Years | 1 (2.4%) | 1 (3.3%) |
| 35 to 39 Years | 6 (14.6%) | 3 (10.0%) |
| 40 to 44 Years | 8 (19.5%) | 2 (6.7%) |
| 45 to 49 Years | 0 (0.0%) | 1 (3.3%) |
| 50 to 54 Years | 6 (14.6%) | 3 (10.0%) |
| 55 to 59 Years | 1 (2.4%) | 2 (6.7%) |
| 60 to 64 Years | 1 (2.4%) | 2 (6.7%) |
| 65 to 69 Years | 5 (12.2%) | 4 (13.3%) |
| 70 to 74 Years | 5 (12.2%) | 2 (6.7%) |
| 75 to 79 Years | 2 (4.9%) | 0 (0.0%) |
| 80 to 84 Years | 0 (0.0%) | 0 (0.0%) |
| 85 Years and over | 0 (0.0%) | 0 (0.0%) |
| Total | 41 (100.0%) | 30 (100.0%) |
Families and Households in Clontarf
Median Family Size in Clontarf
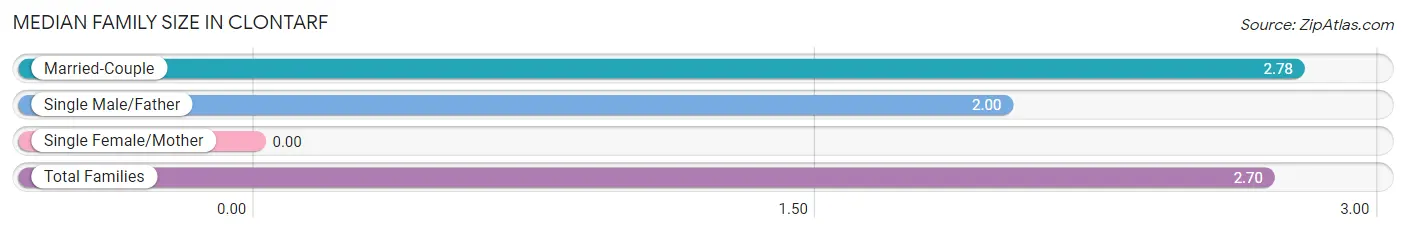
| Family Type | # Families | Family Size |
| Married-Couple | 18 (90.0%) | 2.78 |
| Single Male/Father | 2 (10.0%) | 2.00 |
| Single Female/Mother | 0 (0.0%) | - |
| Total Families | 20 (100.0%) | 2.70 |
Median Household Size in Clontarf
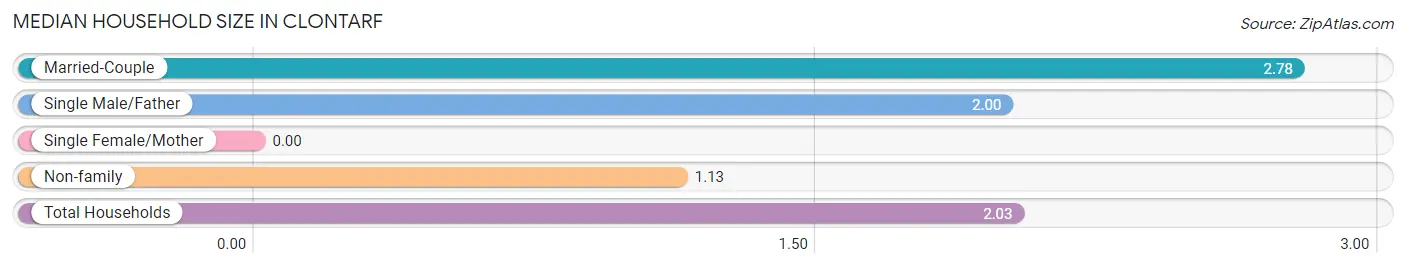
| Household Type | # Households | Household Size |
| Married-Couple | 18 (51.4%) | 2.78 |
| Single Male/Father | 2 (5.7%) | 2.00 |
| Single Female/Mother | 0 (0.0%) | - |
| Non-family | 15 (42.9%) | 1.13 |
| Total Households | 35 (100.0%) | 2.03 |
Household Size by Marriage Status in Clontarf
Out of a total of 35 households in Clontarf, 20 (57.1%) are family households, while 15 (42.9%) are nonfamily households. The most numerous type of family households are 2-person households, comprising 11, and the most common type of nonfamily households are 1-person households, comprising 12.
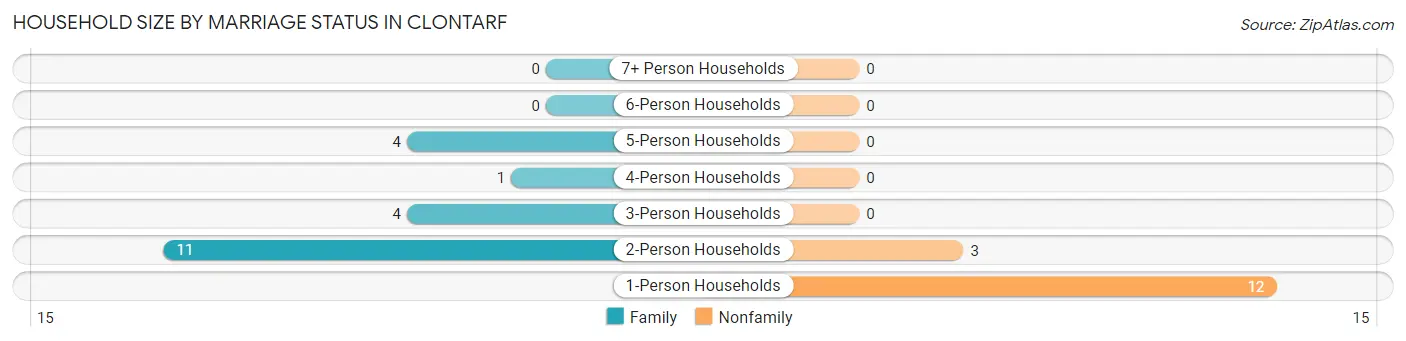
| Household Size | Family Households | Nonfamily Households |
| 1-Person Households | - | 12 (34.3%) |
| 2-Person Households | 11 (31.4%) | 3 (8.6%) |
| 3-Person Households | 4 (11.4%) | 0 (0.0%) |
| 4-Person Households | 1 (2.9%) | 0 (0.0%) |
| 5-Person Households | 4 (11.4%) | 0 (0.0%) |
| 6-Person Households | 0 (0.0%) | 0 (0.0%) |
| 7+ Person Households | 0 (0.0%) | 0 (0.0%) |
| Total | 20 (57.1%) | 15 (42.9%) |
Female Fertility in Clontarf
Fertility by Age in Clontarf
| Age Bracket | Women with Births | Births / 1,000 Women |
| 15 to 19 years | 0 (0.0%) | 0.0 |
| 20 to 34 years | 0 (0.0%) | 0.0 |
| 35 to 50 years | 0 (0.0%) | 0.0 |
| Total | 0 (0.0%) | 0.0 |
Fertility by Age by Marriage Status in Clontarf
| Age Bracket | Married | Unmarried |
| 15 to 19 years | 0 (0.0%) | 0 (0.0%) |
| 20 to 34 years | 0 (0.0%) | 0 (0.0%) |
| 35 to 50 years | 0 (0.0%) | 0 (0.0%) |
| Total | 0 (0.0%) | 0 (0.0%) |
Fertility by Education in Clontarf
| Educational Attainment | Women with Births | Births / 1,000 Women |
| Less than High School | 0 (0.0%) | 0.0 |
| High School Diploma | 0 (0.0%) | 0.0 |
| College or Associate's Degree | 0 (0.0%) | 0.0 |
| Bachelor's Degree | 0 (0.0%) | 0.0 |
| Graduate Degree | 0 (0.0%) | 0.0 |
| Total | 0 (0.0%) | 0.0 |
Fertility by Education by Marriage Status in Clontarf
| Educational Attainment | Married | Unmarried |
| Less than High School | 0 (0.0%) | 0 (0.0%) |
| High School Diploma | 0 (0.0%) | 0 (0.0%) |
| College or Associate's Degree | 0 (0.0%) | 0 (0.0%) |
| Bachelor's Degree | 0 (0.0%) | 0 (0.0%) |
| Graduate Degree | 0 (0.0%) | 0 (0.0%) |
| Total | 0 (0.0%) | 0 (0.0%) |
Employment Characteristics in Clontarf
Employment by Class of Employer in Clontarf
Among the 44 employed individuals in Clontarf, private company employees (36 | 81.8%), self-employed (not incorporated) (3 | 6.8%), and not-for-profit organizations (2 | 4.5%) make up the most common classes of employment.
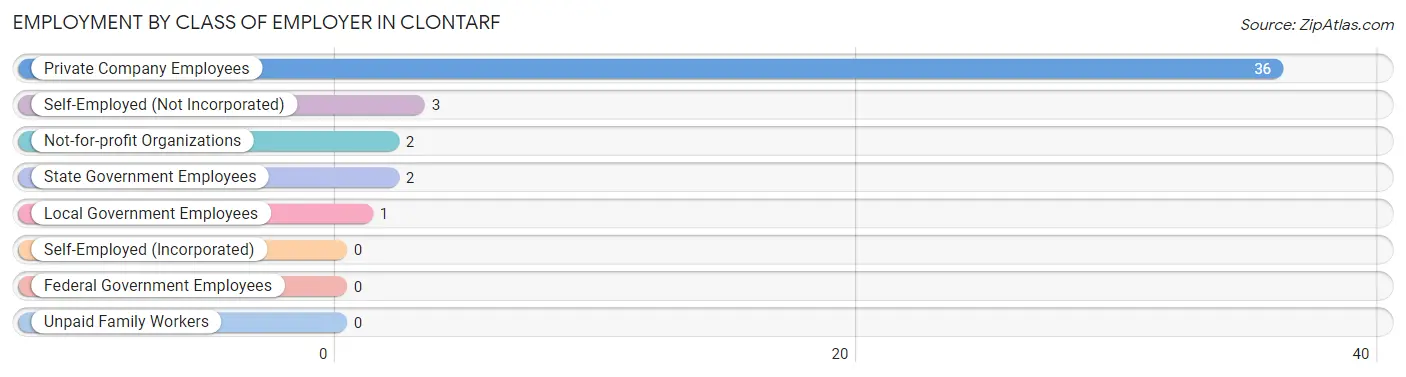
| Employer Class | # Employees | % Employees |
| Private Company Employees | 36 | 81.8% |
| Self-Employed (Incorporated) | 0 | 0.0% |
| Self-Employed (Not Incorporated) | 3 | 6.8% |
| Not-for-profit Organizations | 2 | 4.5% |
| Local Government Employees | 1 | 2.3% |
| State Government Employees | 2 | 4.5% |
| Federal Government Employees | 0 | 0.0% |
| Unpaid Family Workers | 0 | 0.0% |
| Total | 44 | 100.0% |
Employment Status by Age in Clontarf
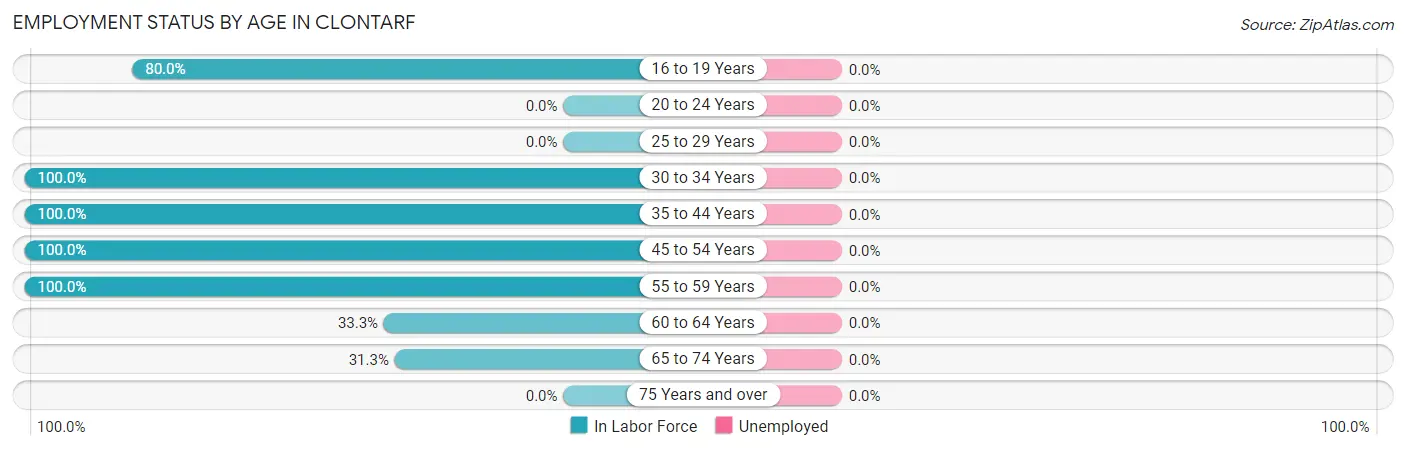
| Age Bracket | In Labor Force | Unemployed |
| 16 to 19 Years | 4 (80.0%) | 0 (0.0%) |
| 20 to 24 Years | 0 (0.0%) | 0 (0.0%) |
| 25 to 29 Years | 0 (0.0%) | 0 (0.0%) |
| 30 to 34 Years | 2 (100.0%) | 0 (0.0%) |
| 35 to 44 Years | 19 (100.0%) | 0 (0.0%) |
| 45 to 54 Years | 10 (100.0%) | 0 (0.0%) |
| 55 to 59 Years | 3 (100.0%) | 0 (0.0%) |
| 60 to 64 Years | 1 (33.3%) | 0 (0.0%) |
| 65 to 74 Years | 5 (31.3%) | 0 (0.0%) |
| 75 Years and over | 0 (0.0%) | 0 (0.0%) |
| Total | 44 (73.3%) | 0 (0.0%) |
Employment Status by Educational Attainment in Clontarf
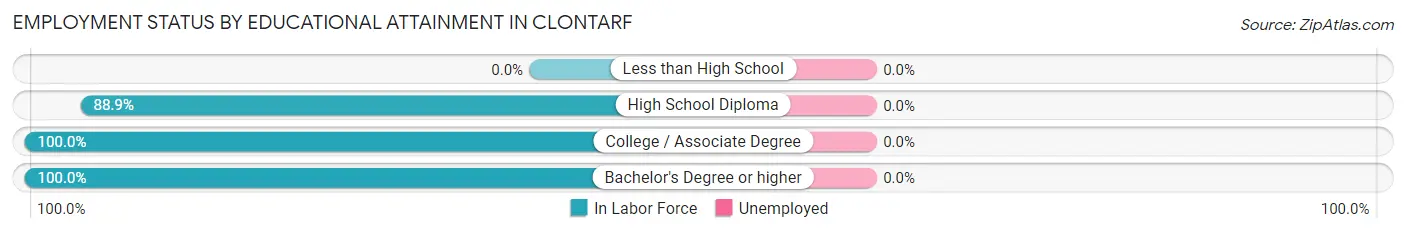
| Educational Attainment | In Labor Force | Unemployed |
| Less than High School | 0 (0.0%) | 0 (0.0%) |
| High School Diploma | 16 (88.9%) | 0 (0.0%) |
| College / Associate Degree | 13 (100.0%) | 0 (0.0%) |
| Bachelor's Degree or higher | 6 (100.0%) | 0 (0.0%) |
| Total | 35 (94.6%) | 0 (0.0%) |
Employment Occupations by Sex in Clontarf
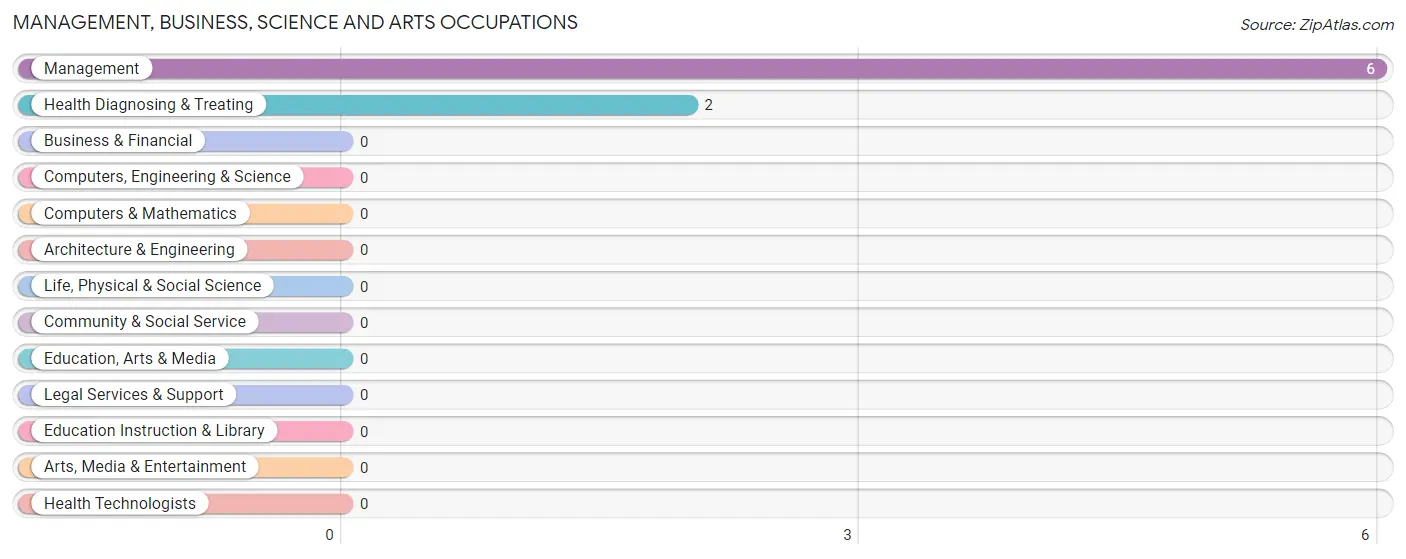
Management, Business, Science and Arts Occupations
The most common Management, Business, Science and Arts occupations in Clontarf are Management (6 | 13.6%), and Health Diagnosing & Treating (2 | 4.5%).
Management, Business, Science and Arts Occupations by Sex
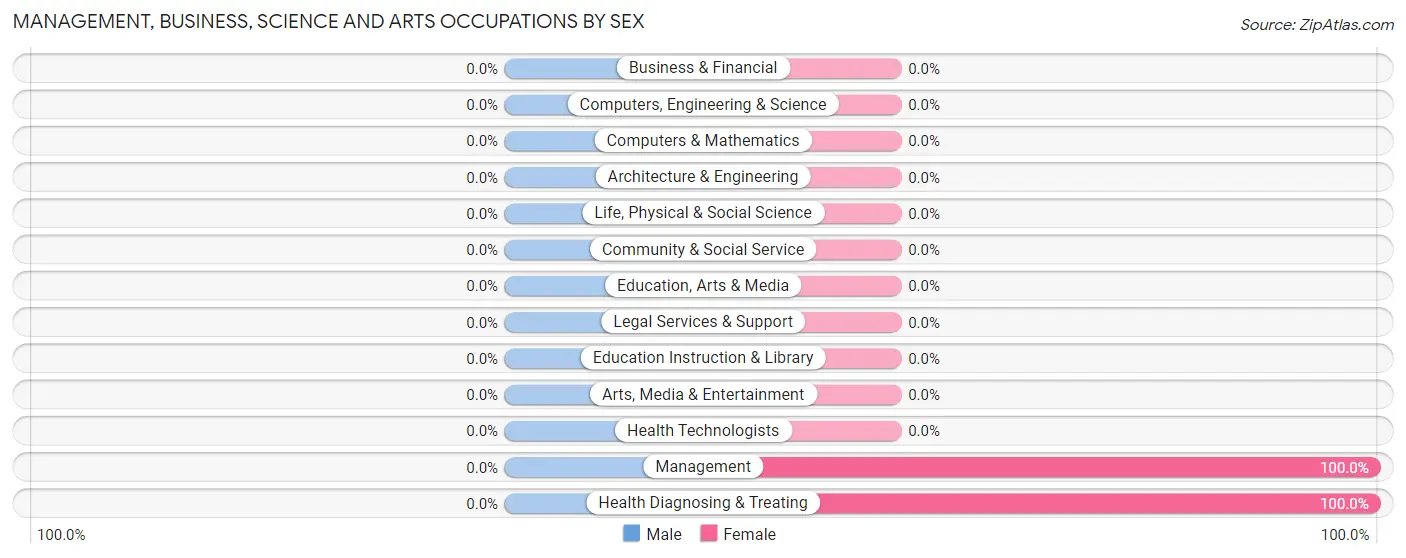
| Occupation | Male | Female |
| Management | 0 (0.0%) | 6 (100.0%) |
| Business & Financial | 0 (0.0%) | 0 (0.0%) |
| Computers, Engineering & Science | 0 (0.0%) | 0 (0.0%) |
| Computers & Mathematics | 0 (0.0%) | 0 (0.0%) |
| Architecture & Engineering | 0 (0.0%) | 0 (0.0%) |
| Life, Physical & Social Science | 0 (0.0%) | 0 (0.0%) |
| Community & Social Service | 0 (0.0%) | 0 (0.0%) |
| Education, Arts & Media | 0 (0.0%) | 0 (0.0%) |
| Legal Services & Support | 0 (0.0%) | 0 (0.0%) |
| Education Instruction & Library | 0 (0.0%) | 0 (0.0%) |
| Arts, Media & Entertainment | 0 (0.0%) | 0 (0.0%) |
| Health Diagnosing & Treating | 0 (0.0%) | 2 (100.0%) |
| Health Technologists | 0 (0.0%) | 0 (0.0%) |
| Total (Category) | 0 (0.0%) | 8 (100.0%) |
| Total (Overall) | 29 (65.9%) | 15 (34.1%) |
Services Occupations
The most common Services occupations in Clontarf are Food Preparation & Serving (1 | 2.3%), and Cleaning & Maintenance (1 | 2.3%).
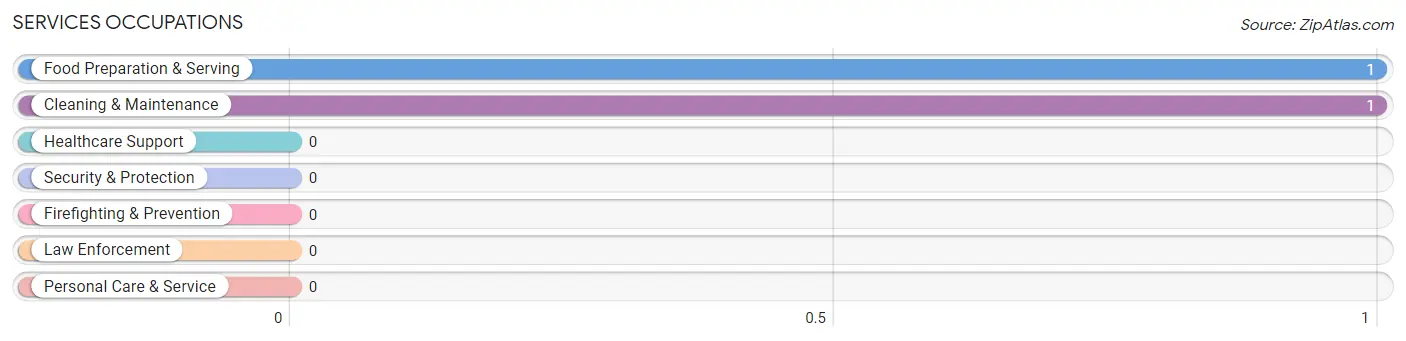
Services Occupations by Sex
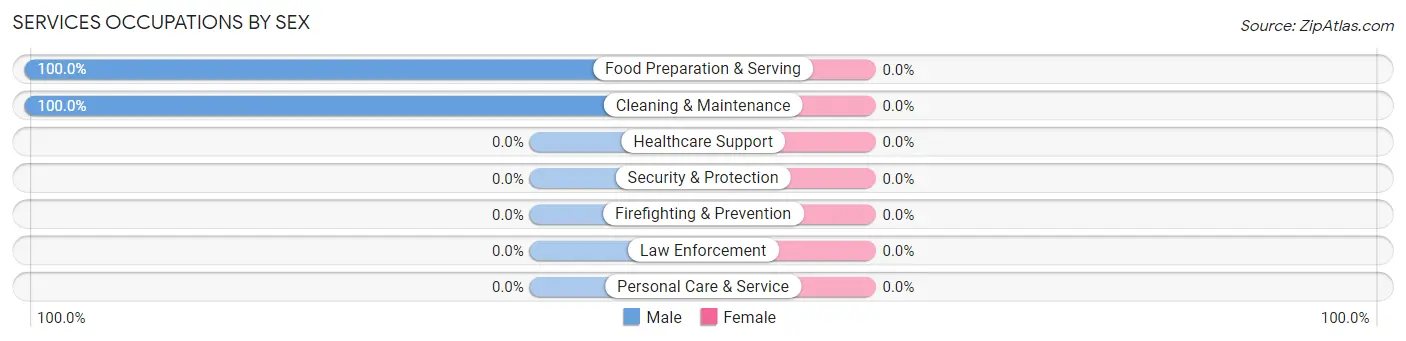
| Occupation | Male | Female |
| Healthcare Support | 0 (0.0%) | 0 (0.0%) |
| Security & Protection | 0 (0.0%) | 0 (0.0%) |
| Firefighting & Prevention | 0 (0.0%) | 0 (0.0%) |
| Law Enforcement | 0 (0.0%) | 0 (0.0%) |
| Food Preparation & Serving | 1 (100.0%) | 0 (0.0%) |
| Cleaning & Maintenance | 1 (100.0%) | 0 (0.0%) |
| Personal Care & Service | 0 (0.0%) | 0 (0.0%) |
| Total (Category) | 2 (100.0%) | 0 (0.0%) |
| Total (Overall) | 29 (65.9%) | 15 (34.1%) |
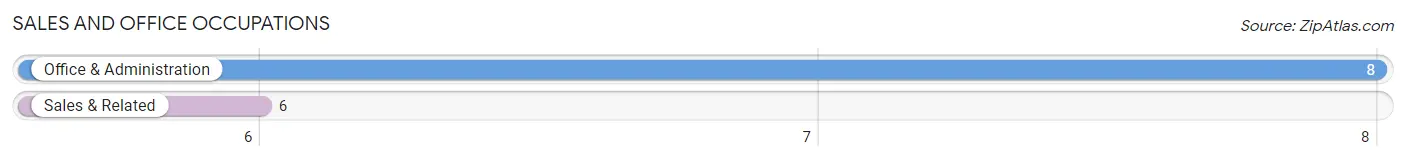
Sales and Office Occupations
The most common Sales and Office occupations in Clontarf are Office & Administration (8 | 18.2%), and Sales & Related (6 | 13.6%).
Sales and Office Occupations by Sex
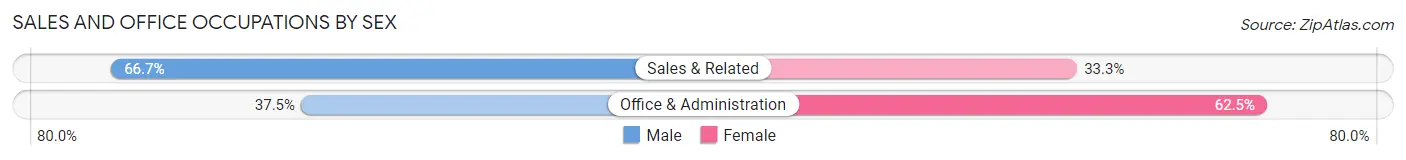
| Occupation | Male | Female |
| Sales & Related | 4 (66.7%) | 2 (33.3%) |
| Office & Administration | 3 (37.5%) | 5 (62.5%) |
| Total (Category) | 7 (50.0%) | 7 (50.0%) |
| Total (Overall) | 29 (65.9%) | 15 (34.1%) |
Natural Resources, Construction and Maintenance Occupations
Natural Resources, Construction and Maintenance Occupations by Sex
| Occupation | Male | Female |
| Farming, Fishing & Forestry | 0 (0.0%) | 0 (0.0%) |
| Construction & Extraction | 0 (0.0%) | 0 (0.0%) |
| Installation, Maintenance & Repair | 0 (0.0%) | 0 (0.0%) |
| Total (Category) | 0 (0.0%) | 0 (0.0%) |
| Total (Overall) | 29 (65.9%) | 15 (34.1%) |
Production, Transportation and Moving Occupations
The most common Production, Transportation and Moving occupations in Clontarf are Production (9 | 20.4%), Transportation (9 | 20.4%), and Material Moving (2 | 4.5%).
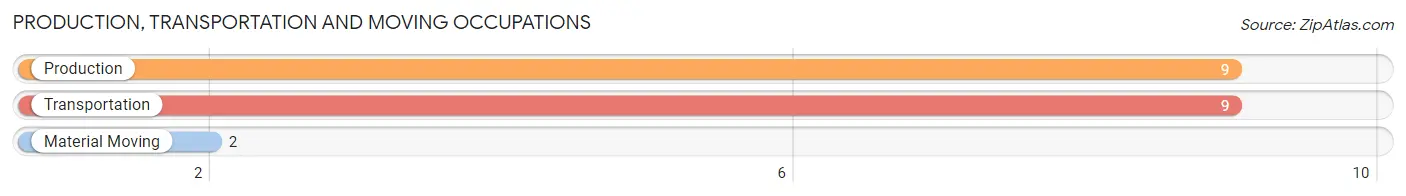
Production, Transportation and Moving Occupations by Sex
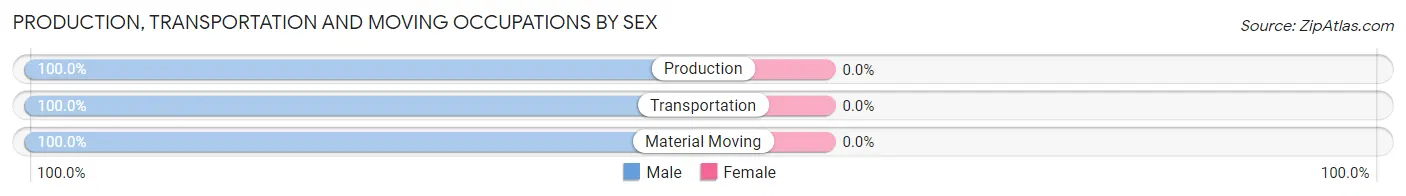
| Occupation | Male | Female |
| Production | 9 (100.0%) | 0 (0.0%) |
| Transportation | 9 (100.0%) | 0 (0.0%) |
| Material Moving | 2 (100.0%) | 0 (0.0%) |
| Total (Category) | 20 (100.0%) | 0 (0.0%) |
| Total (Overall) | 29 (65.9%) | 15 (34.1%) |
Employment Industries by Sex in Clontarf
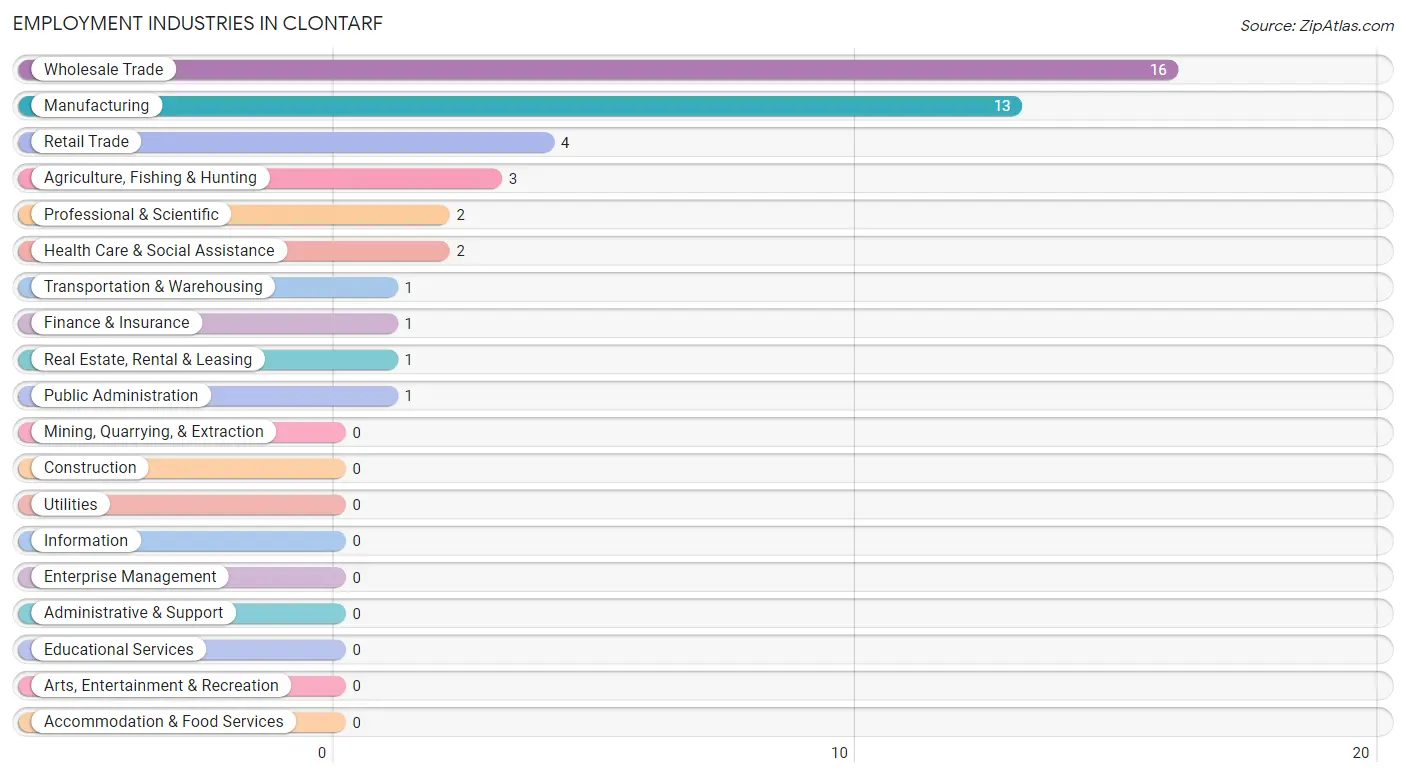
Employment Industries in Clontarf
The major employment industries in Clontarf include Wholesale Trade (16 | 36.4%), Manufacturing (13 | 29.5%), Retail Trade (4 | 9.1%), Agriculture, Fishing & Hunting (3 | 6.8%), and Professional & Scientific (2 | 4.5%).
Employment Industries by Sex in Clontarf
The Clontarf industries that see more men than women are Transportation & Warehousing (100.0%), Public Administration (100.0%), and Manufacturing (92.3%), whereas the industries that tend to have a higher number of women are Agriculture, Fishing & Hunting (100.0%), Finance & Insurance (100.0%), and Real Estate, Rental & Leasing (100.0%).
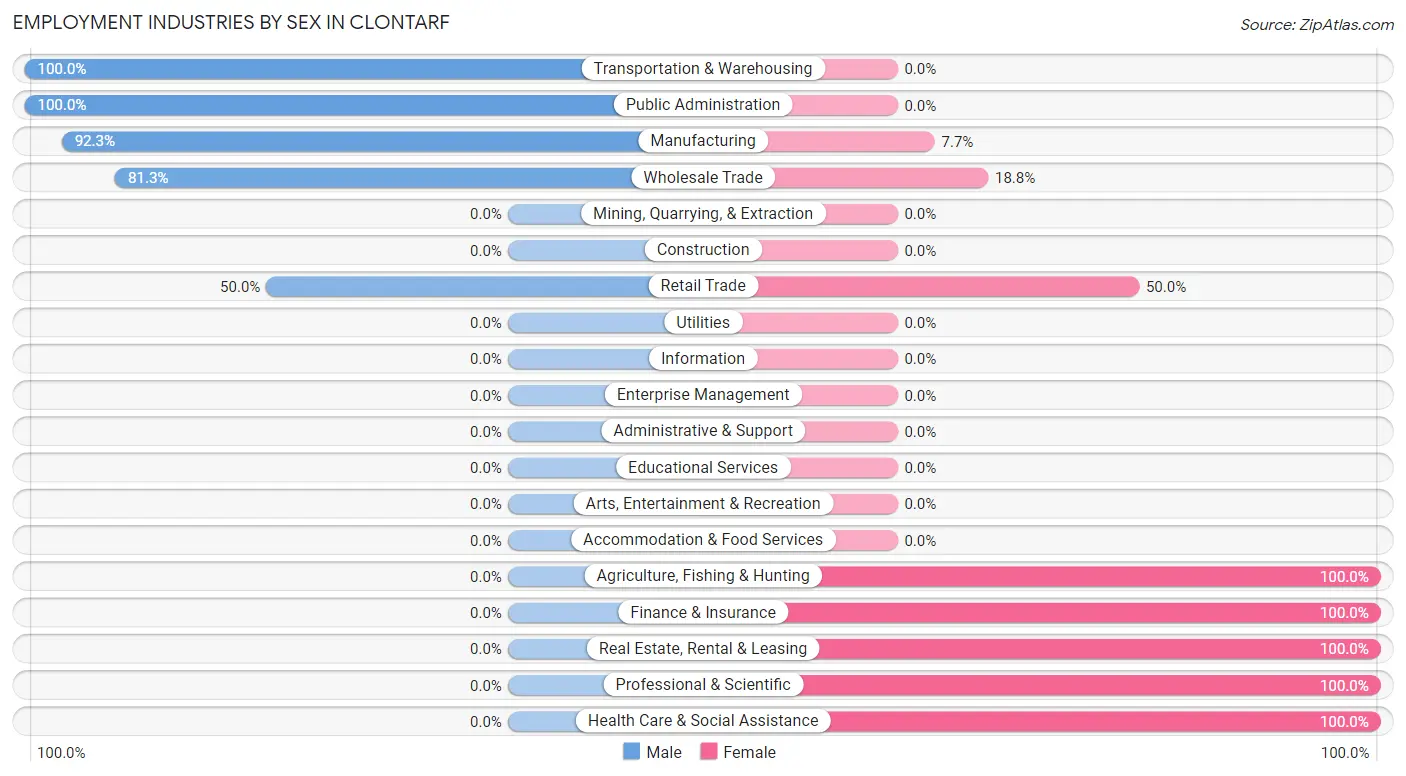
| Industry | Male | Female |
| Agriculture, Fishing & Hunting | 0 (0.0%) | 3 (100.0%) |
| Mining, Quarrying, & Extraction | 0 (0.0%) | 0 (0.0%) |
| Construction | 0 (0.0%) | 0 (0.0%) |
| Manufacturing | 12 (92.3%) | 1 (7.7%) |
| Wholesale Trade | 13 (81.2%) | 3 (18.8%) |
| Retail Trade | 2 (50.0%) | 2 (50.0%) |
| Transportation & Warehousing | 1 (100.0%) | 0 (0.0%) |
| Utilities | 0 (0.0%) | 0 (0.0%) |
| Information | 0 (0.0%) | 0 (0.0%) |
| Finance & Insurance | 0 (0.0%) | 1 (100.0%) |
| Real Estate, Rental & Leasing | 0 (0.0%) | 1 (100.0%) |
| Professional & Scientific | 0 (0.0%) | 2 (100.0%) |
| Enterprise Management | 0 (0.0%) | 0 (0.0%) |
| Administrative & Support | 0 (0.0%) | 0 (0.0%) |
| Educational Services | 0 (0.0%) | 0 (0.0%) |
| Health Care & Social Assistance | 0 (0.0%) | 2 (100.0%) |
| Arts, Entertainment & Recreation | 0 (0.0%) | 0 (0.0%) |
| Accommodation & Food Services | 0 (0.0%) | 0 (0.0%) |
| Public Administration | 1 (100.0%) | 0 (0.0%) |
| Total | 29 (65.9%) | 15 (34.1%) |
Education in Clontarf
School Enrollment in Clontarf
The most common levels of schooling among the 16 students in Clontarf are high school (6 | 37.5%), kindergarten (3 | 18.8%), and elementary school (3 | 18.8%).
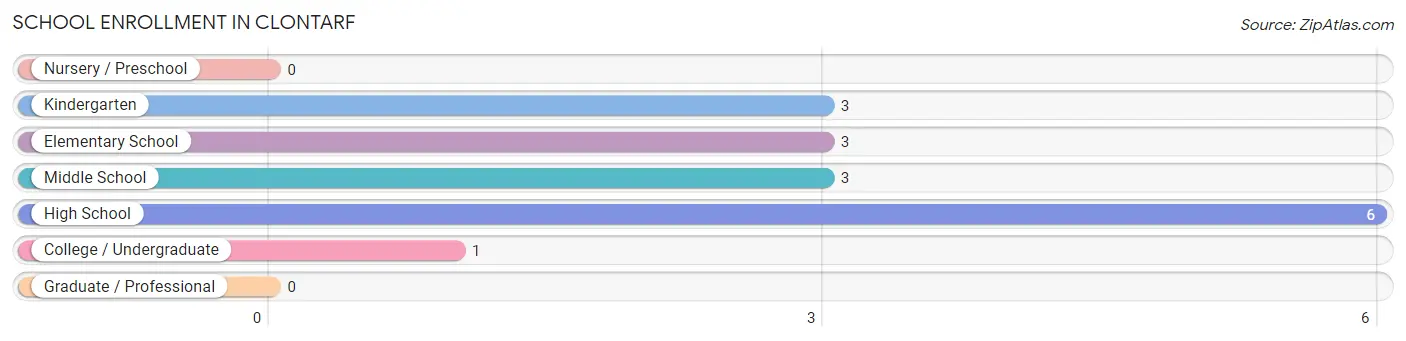
| School Level | # Students | % Students |
| Nursery / Preschool | 0 | 0.0% |
| Kindergarten | 3 | 18.8% |
| Elementary School | 3 | 18.8% |
| Middle School | 3 | 18.8% |
| High School | 6 | 37.5% |
| College / Undergraduate | 1 | 6.2% |
| Graduate / Professional | 0 | 0.0% |
| Total | 16 | 100.0% |
School Enrollment by Age by Funding Source in Clontarf
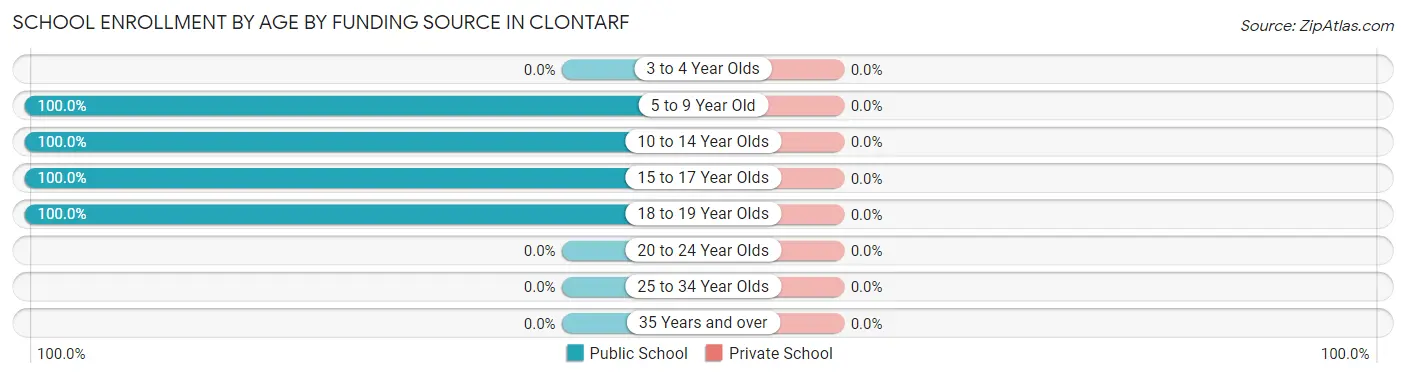
| Age Bracket | Public School | Private School |
| 3 to 4 Year Olds | 0 (0.0%) | 0 (0.0%) |
| 5 to 9 Year Old | 3 (100.0%) | 0 (0.0%) |
| 10 to 14 Year Olds | 6 (100.0%) | 0 (0.0%) |
| 15 to 17 Year Olds | 6 (100.0%) | 0 (0.0%) |
| 18 to 19 Year Olds | 1 (100.0%) | 0 (0.0%) |
| 20 to 24 Year Olds | 0 (0.0%) | 0 (0.0%) |
| 25 to 34 Year Olds | 0 (0.0%) | 0 (0.0%) |
| 35 Years and over | 0 (0.0%) | 0 (0.0%) |
| Total | 16 (100.0%) | 0 (0.0%) |
Educational Attainment by Field of Study in Clontarf
Business (3 | 30.0%), education (3 | 30.0%), social sciences (2 | 20.0%), science & technology (1 | 10.0%), and arts & humanities (1 | 10.0%) are the most common fields of study among 10 individuals in Clontarf who have obtained a bachelor's degree or higher.
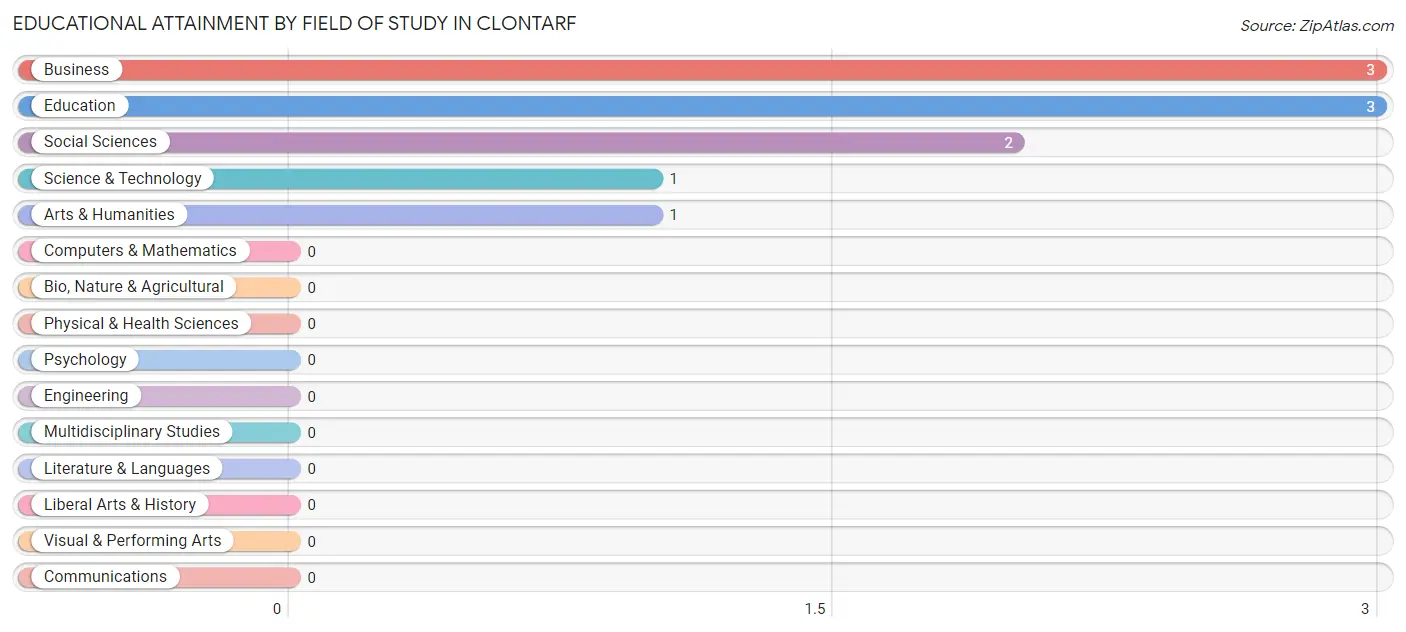
| Field of Study | # Graduates | % Graduates |
| Computers & Mathematics | 0 | 0.0% |
| Bio, Nature & Agricultural | 0 | 0.0% |
| Physical & Health Sciences | 0 | 0.0% |
| Psychology | 0 | 0.0% |
| Social Sciences | 2 | 20.0% |
| Engineering | 0 | 0.0% |
| Multidisciplinary Studies | 0 | 0.0% |
| Science & Technology | 1 | 10.0% |
| Business | 3 | 30.0% |
| Education | 3 | 30.0% |
| Literature & Languages | 0 | 0.0% |
| Liberal Arts & History | 0 | 0.0% |
| Visual & Performing Arts | 0 | 0.0% |
| Communications | 0 | 0.0% |
| Arts & Humanities | 1 | 10.0% |
| Total | 10 | 100.0% |
Transportation & Commute in Clontarf
Vehicle Availability by Sex in Clontarf
The most prevalent vehicle ownership categories in Clontarf are males with 2 vehicles (14, accounting for 48.3%) and females with 2 vehicles (5, making up 93.3%).
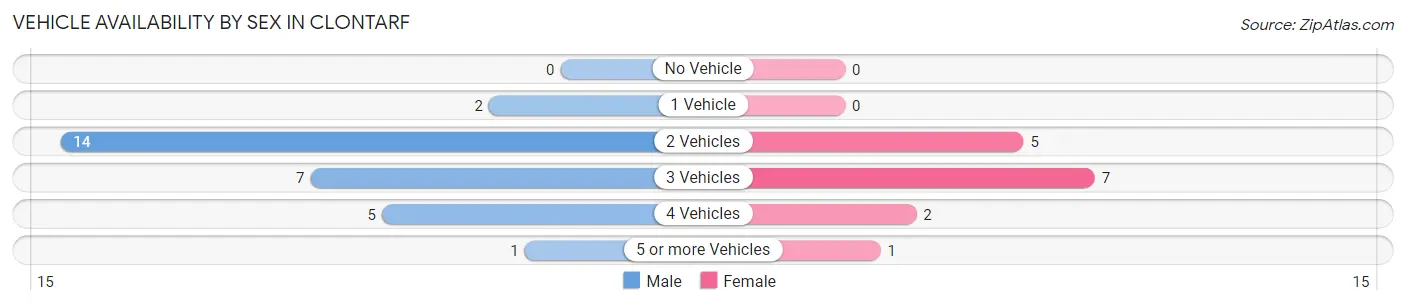
| Vehicles Available | Male | Female |
| No Vehicle | 0 (0.0%) | 0 (0.0%) |
| 1 Vehicle | 2 (6.9%) | 0 (0.0%) |
| 2 Vehicles | 14 (48.3%) | 5 (33.3%) |
| 3 Vehicles | 7 (24.1%) | 7 (46.7%) |
| 4 Vehicles | 5 (17.2%) | 2 (13.3%) |
| 5 or more Vehicles | 1 (3.5%) | 1 (6.7%) |
| Total | 29 (100.0%) | 15 (100.0%) |
Commute Time in Clontarf
The most frequently occuring commute durations in Clontarf are 20 to 24 minutes (10 commuters, 22.7%), less than 5 minutes (7 commuters, 15.9%), and 10 to 14 minutes (7 commuters, 15.9%).
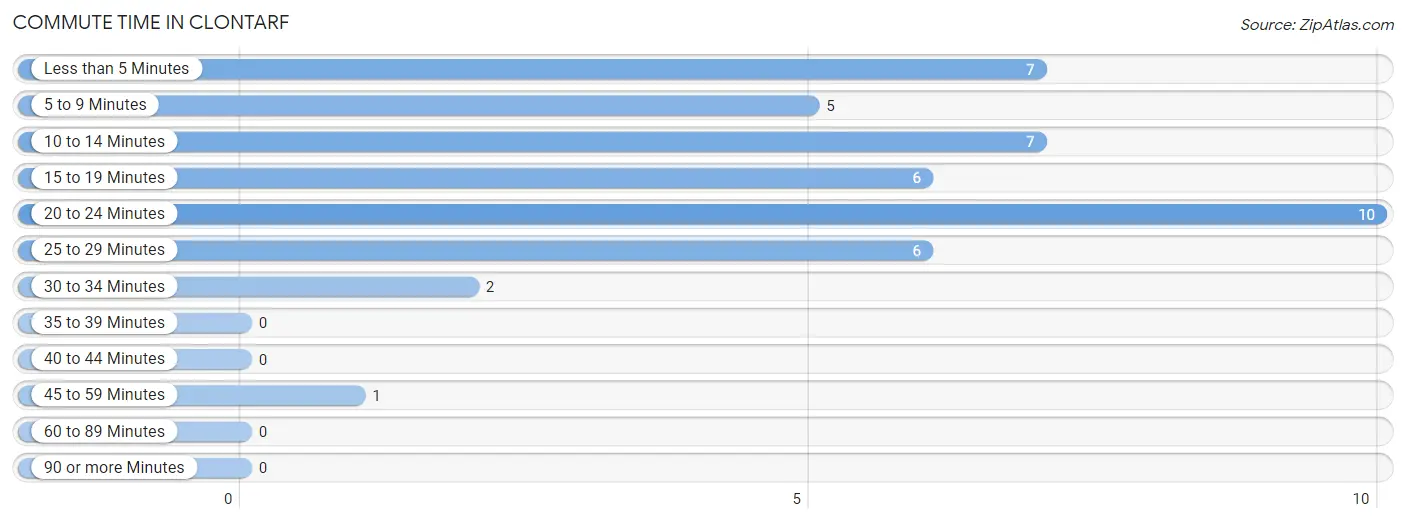
| Commute Time | # Commuters | % Commuters |
| Less than 5 Minutes | 7 | 15.9% |
| 5 to 9 Minutes | 5 | 11.4% |
| 10 to 14 Minutes | 7 | 15.9% |
| 15 to 19 Minutes | 6 | 13.6% |
| 20 to 24 Minutes | 10 | 22.7% |
| 25 to 29 Minutes | 6 | 13.6% |
| 30 to 34 Minutes | 2 | 4.5% |
| 35 to 39 Minutes | 0 | 0.0% |
| 40 to 44 Minutes | 0 | 0.0% |
| 45 to 59 Minutes | 1 | 2.3% |
| 60 to 89 Minutes | 0 | 0.0% |
| 90 or more Minutes | 0 | 0.0% |
Commute Time by Sex in Clontarf
The most common commute times in Clontarf are less than 5 minutes (6 commuters, 20.7%) for males and 20 to 24 minutes (4 commuters, 26.7%) for females.
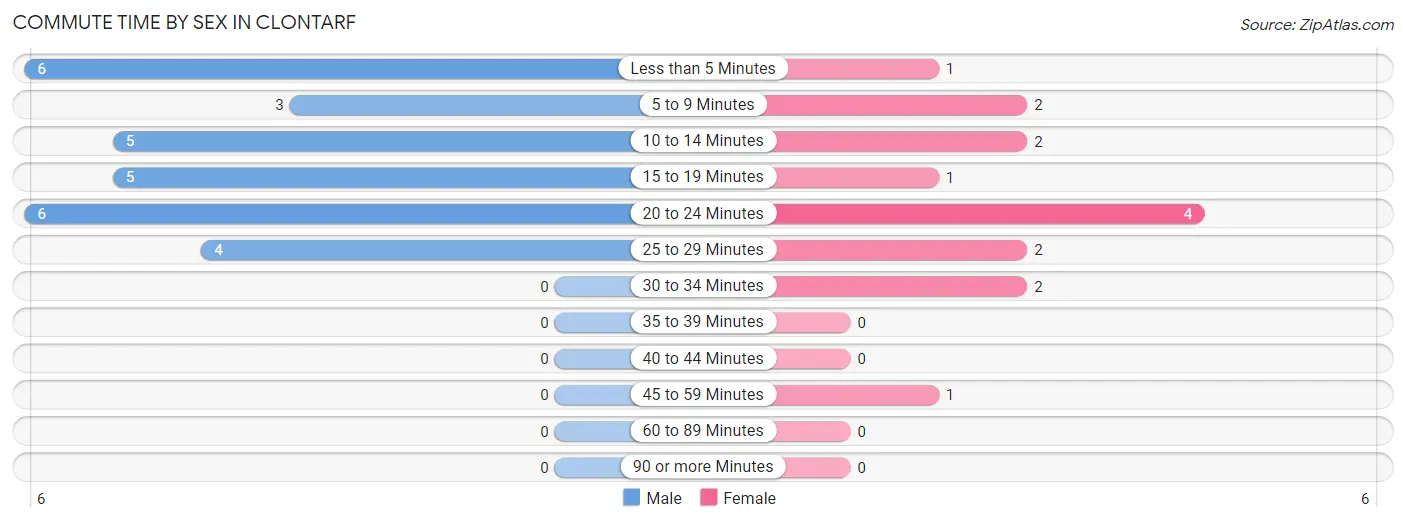
| Commute Time | Male | Female |
| Less than 5 Minutes | 6 (20.7%) | 1 (6.7%) |
| 5 to 9 Minutes | 3 (10.3%) | 2 (13.3%) |
| 10 to 14 Minutes | 5 (17.2%) | 2 (13.3%) |
| 15 to 19 Minutes | 5 (17.2%) | 1 (6.7%) |
| 20 to 24 Minutes | 6 (20.7%) | 4 (26.7%) |
| 25 to 29 Minutes | 4 (13.8%) | 2 (13.3%) |
| 30 to 34 Minutes | 0 (0.0%) | 2 (13.3%) |
| 35 to 39 Minutes | 0 (0.0%) | 0 (0.0%) |
| 40 to 44 Minutes | 0 (0.0%) | 0 (0.0%) |
| 45 to 59 Minutes | 0 (0.0%) | 1 (6.7%) |
| 60 to 89 Minutes | 0 (0.0%) | 0 (0.0%) |
| 90 or more Minutes | 0 (0.0%) | 0 (0.0%) |
Time of Departure to Work by Sex in Clontarf
The most frequent times of departure to work in Clontarf are 6:00 AM to 6:29 AM (10, 34.5%) for males and 7:30 AM to 7:59 AM (6, 40.0%) for females.
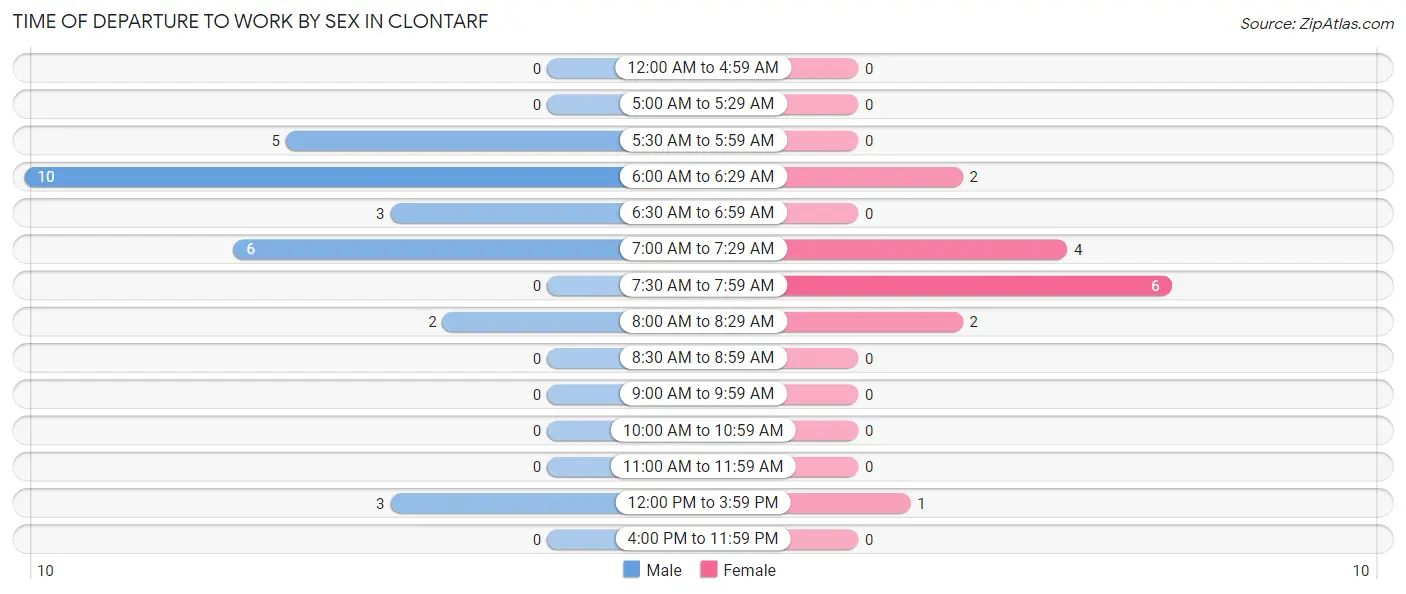
| Time of Departure | Male | Female |
| 12:00 AM to 4:59 AM | 0 (0.0%) | 0 (0.0%) |
| 5:00 AM to 5:29 AM | 0 (0.0%) | 0 (0.0%) |
| 5:30 AM to 5:59 AM | 5 (17.2%) | 0 (0.0%) |
| 6:00 AM to 6:29 AM | 10 (34.5%) | 2 (13.3%) |
| 6:30 AM to 6:59 AM | 3 (10.3%) | 0 (0.0%) |
| 7:00 AM to 7:29 AM | 6 (20.7%) | 4 (26.7%) |
| 7:30 AM to 7:59 AM | 0 (0.0%) | 6 (40.0%) |
| 8:00 AM to 8:29 AM | 2 (6.9%) | 2 (13.3%) |
| 8:30 AM to 8:59 AM | 0 (0.0%) | 0 (0.0%) |
| 9:00 AM to 9:59 AM | 0 (0.0%) | 0 (0.0%) |
| 10:00 AM to 10:59 AM | 0 (0.0%) | 0 (0.0%) |
| 11:00 AM to 11:59 AM | 0 (0.0%) | 0 (0.0%) |
| 12:00 PM to 3:59 PM | 3 (10.3%) | 1 (6.7%) |
| 4:00 PM to 11:59 PM | 0 (0.0%) | 0 (0.0%) |
| Total | 29 (100.0%) | 15 (100.0%) |
Housing Occupancy in Clontarf
Occupancy by Ownership in Clontarf
Of the total 35 dwellings in Clontarf, owner-occupied units account for 27 (77.1%), while renter-occupied units make up 8 (22.9%).
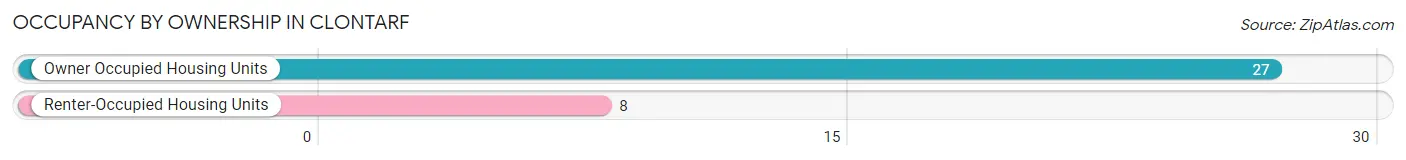
| Occupancy | # Housing Units | % Housing Units |
| Owner Occupied Housing Units | 27 | 77.1% |
| Renter-Occupied Housing Units | 8 | 22.9% |
| Total Occupied Housing Units | 35 | 100.0% |
Occupancy by Household Size in Clontarf
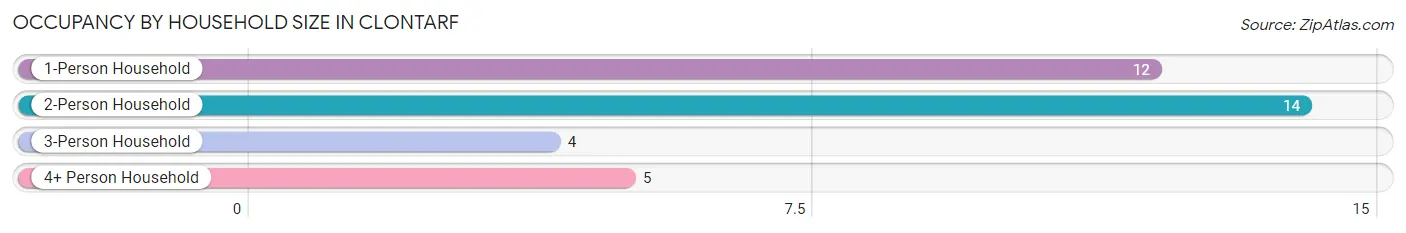
| Household Size | # Housing Units | % Housing Units |
| 1-Person Household | 12 | 34.3% |
| 2-Person Household | 14 | 40.0% |
| 3-Person Household | 4 | 11.4% |
| 4+ Person Household | 5 | 14.3% |
| Total Housing Units | 35 | 100.0% |
Occupancy by Ownership by Household Size in Clontarf
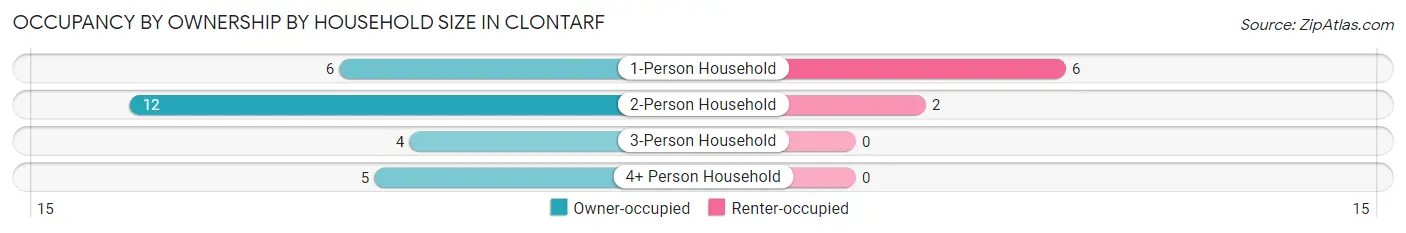
| Household Size | Owner-occupied | Renter-occupied |
| 1-Person Household | 6 (50.0%) | 6 (50.0%) |
| 2-Person Household | 12 (85.7%) | 2 (14.3%) |
| 3-Person Household | 4 (100.0%) | 0 (0.0%) |
| 4+ Person Household | 5 (100.0%) | 0 (0.0%) |
| Total Housing Units | 27 (77.1%) | 8 (22.9%) |
Occupancy by Educational Attainment in Clontarf
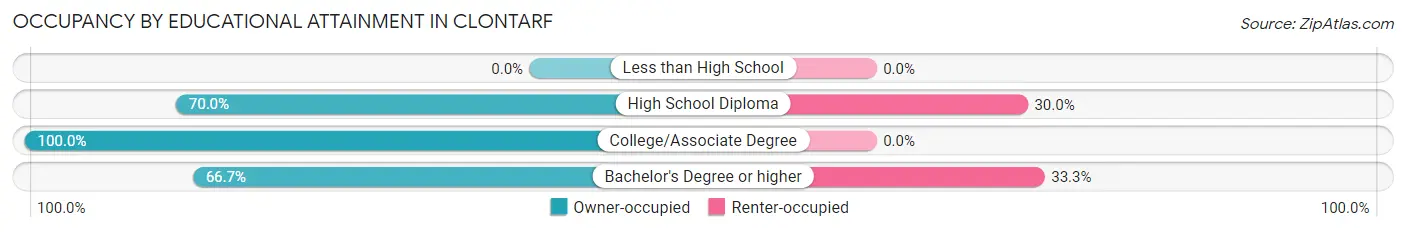
| Household Size | Owner-occupied | Renter-occupied |
| Less than High School | 0 (0.0%) | 0 (0.0%) |
| High School Diploma | 14 (70.0%) | 6 (30.0%) |
| College/Associate Degree | 9 (100.0%) | 0 (0.0%) |
| Bachelor's Degree or higher | 4 (66.7%) | 2 (33.3%) |
Occupancy by Age of Householder in Clontarf
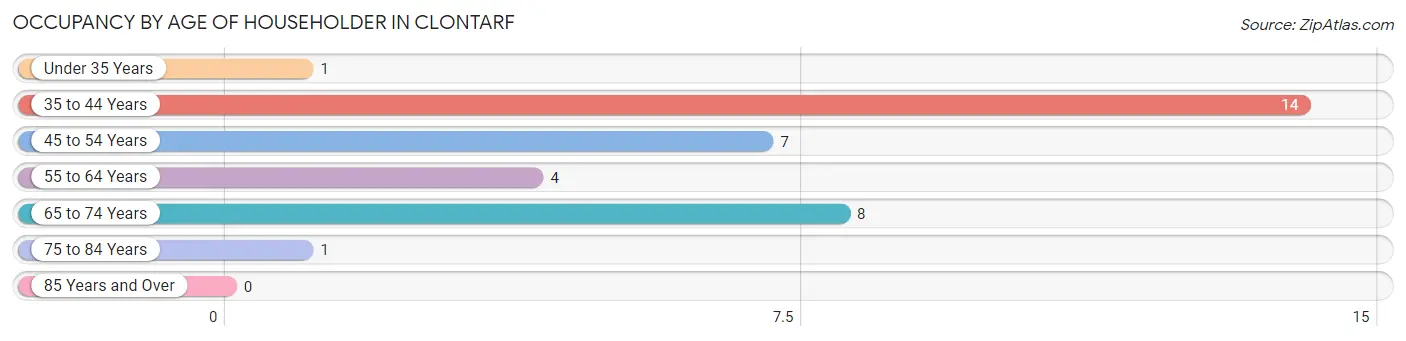
| Age Bracket | # Households | % Households |
| Under 35 Years | 1 | 2.9% |
| 35 to 44 Years | 14 | 40.0% |
| 45 to 54 Years | 7 | 20.0% |
| 55 to 64 Years | 4 | 11.4% |
| 65 to 74 Years | 8 | 22.9% |
| 75 to 84 Years | 1 | 2.9% |
| 85 Years and Over | 0 | 0.0% |
| Total | 35 | 100.0% |
Housing Finances in Clontarf
Median Income by Occupancy in Clontarf
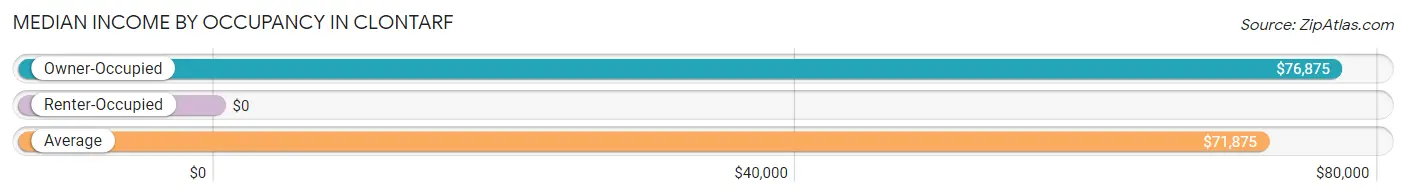
| Occupancy Type | # Households | Median Income |
| Owner-Occupied | 27 (77.1%) | $76,875 |
| Renter-Occupied | 8 (22.9%) | $0 |
| Average | 35 (100.0%) | $71,875 |
Occupancy by Householder Income Bracket in Clontarf
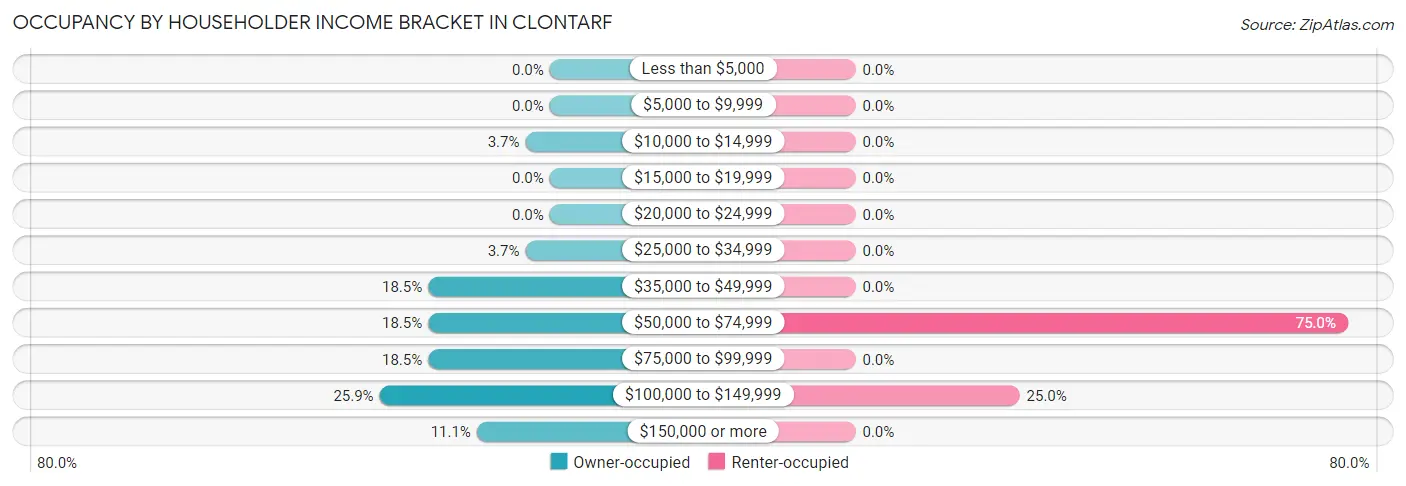
| Income Bracket | Owner-occupied | Renter-occupied |
| Less than $5,000 | 0 (0.0%) | 0 (0.0%) |
| $5,000 to $9,999 | 0 (0.0%) | 0 (0.0%) |
| $10,000 to $14,999 | 1 (3.7%) | 0 (0.0%) |
| $15,000 to $19,999 | 0 (0.0%) | 0 (0.0%) |
| $20,000 to $24,999 | 0 (0.0%) | 0 (0.0%) |
| $25,000 to $34,999 | 1 (3.7%) | 0 (0.0%) |
| $35,000 to $49,999 | 5 (18.5%) | 0 (0.0%) |
| $50,000 to $74,999 | 5 (18.5%) | 6 (75.0%) |
| $75,000 to $99,999 | 5 (18.5%) | 0 (0.0%) |
| $100,000 to $149,999 | 7 (25.9%) | 2 (25.0%) |
| $150,000 or more | 3 (11.1%) | 0 (0.0%) |
| Total | 27 (100.0%) | 8 (100.0%) |
Monthly Housing Cost Tiers in Clontarf
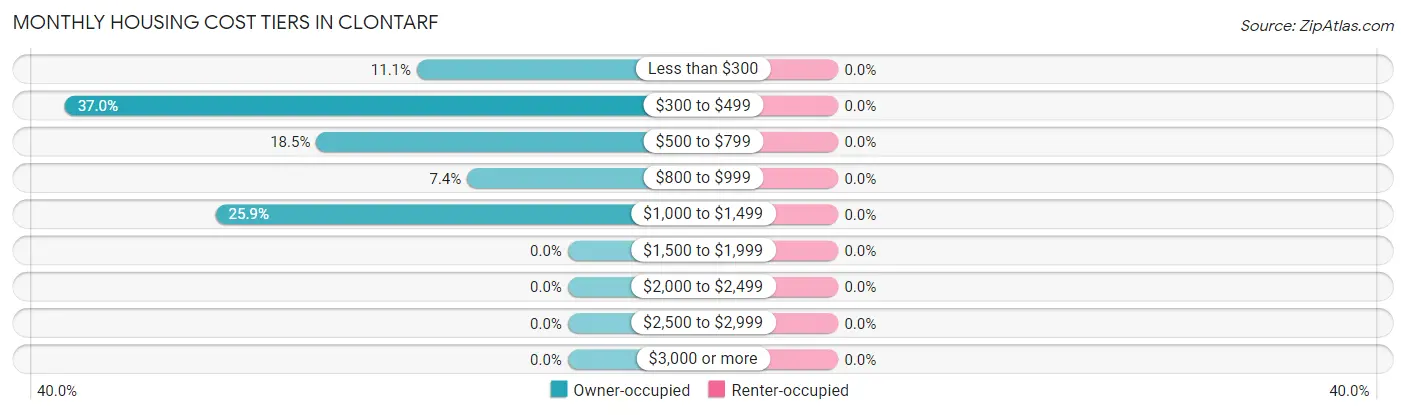
| Monthly Cost | Owner-occupied | Renter-occupied |
| Less than $300 | 3 (11.1%) | 0 (0.0%) |
| $300 to $499 | 10 (37.0%) | 0 (0.0%) |
| $500 to $799 | 5 (18.5%) | 0 (0.0%) |
| $800 to $999 | 2 (7.4%) | 0 (0.0%) |
| $1,000 to $1,499 | 7 (25.9%) | 0 (0.0%) |
| $1,500 to $1,999 | 0 (0.0%) | 0 (0.0%) |
| $2,000 to $2,499 | 0 (0.0%) | 0 (0.0%) |
| $2,500 to $2,999 | 0 (0.0%) | 0 (0.0%) |
| $3,000 or more | 0 (0.0%) | 0 (0.0%) |
| Total | 27 (100.0%) | 8 (100.0%) |
Physical Housing Characteristics in Clontarf
Housing Structures in Clontarf
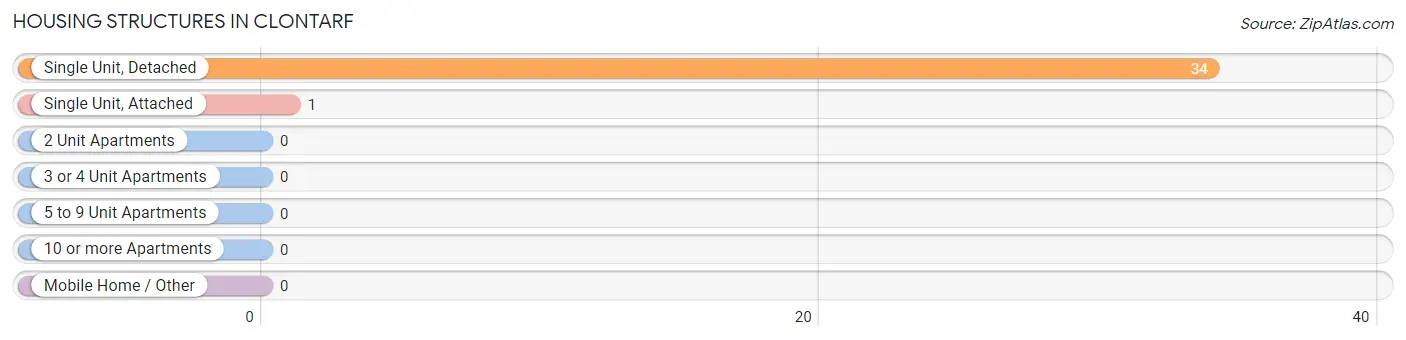
| Structure Type | # Housing Units | % Housing Units |
| Single Unit, Detached | 34 | 97.1% |
| Single Unit, Attached | 1 | 2.9% |
| 2 Unit Apartments | 0 | 0.0% |
| 3 or 4 Unit Apartments | 0 | 0.0% |
| 5 to 9 Unit Apartments | 0 | 0.0% |
| 10 or more Apartments | 0 | 0.0% |
| Mobile Home / Other | 0 | 0.0% |
| Total | 35 | 100.0% |
Housing Structures by Occupancy in Clontarf
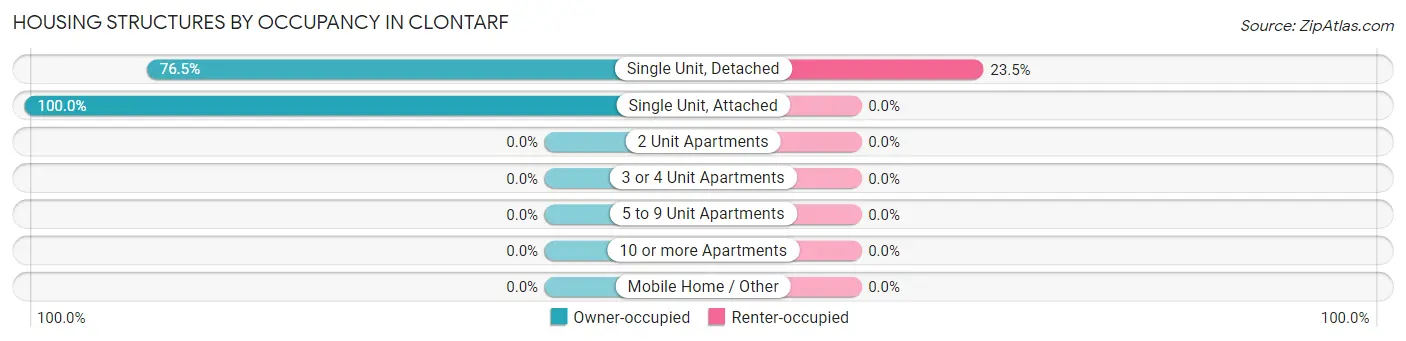
| Structure Type | Owner-occupied | Renter-occupied |
| Single Unit, Detached | 26 (76.5%) | 8 (23.5%) |
| Single Unit, Attached | 1 (100.0%) | 0 (0.0%) |
| 2 Unit Apartments | 0 (0.0%) | 0 (0.0%) |
| 3 or 4 Unit Apartments | 0 (0.0%) | 0 (0.0%) |
| 5 to 9 Unit Apartments | 0 (0.0%) | 0 (0.0%) |
| 10 or more Apartments | 0 (0.0%) | 0 (0.0%) |
| Mobile Home / Other | 0 (0.0%) | 0 (0.0%) |
| Total | 27 (77.1%) | 8 (22.9%) |
Housing Structures by Number of Rooms in Clontarf
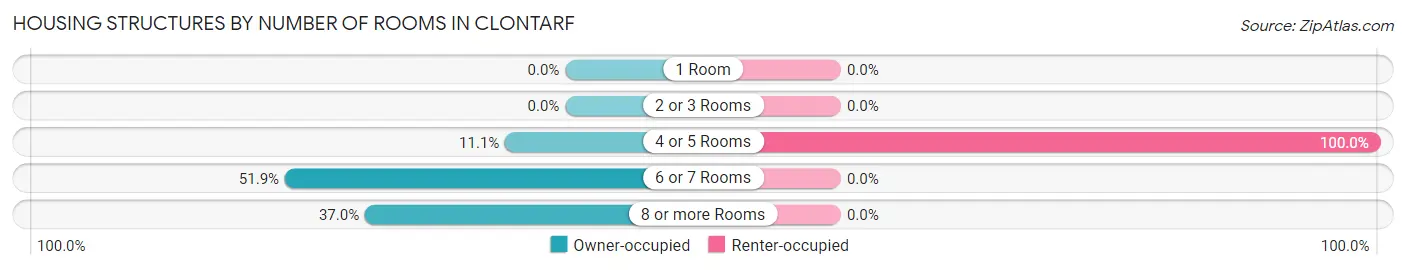
| Number of Rooms | Owner-occupied | Renter-occupied |
| 1 Room | 0 (0.0%) | 0 (0.0%) |
| 2 or 3 Rooms | 0 (0.0%) | 0 (0.0%) |
| 4 or 5 Rooms | 3 (11.1%) | 8 (100.0%) |
| 6 or 7 Rooms | 14 (51.8%) | 0 (0.0%) |
| 8 or more Rooms | 10 (37.0%) | 0 (0.0%) |
| Total | 27 (100.0%) | 8 (100.0%) |
Housing Structure by Heating Type in Clontarf
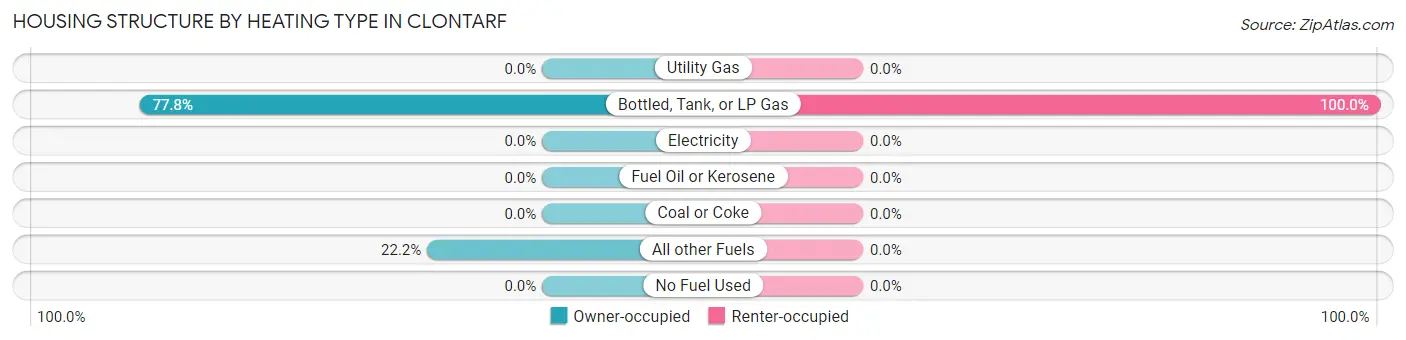
| Heating Type | Owner-occupied | Renter-occupied |
| Utility Gas | 0 (0.0%) | 0 (0.0%) |
| Bottled, Tank, or LP Gas | 21 (77.8%) | 8 (100.0%) |
| Electricity | 0 (0.0%) | 0 (0.0%) |
| Fuel Oil or Kerosene | 0 (0.0%) | 0 (0.0%) |
| Coal or Coke | 0 (0.0%) | 0 (0.0%) |
| All other Fuels | 6 (22.2%) | 0 (0.0%) |
| No Fuel Used | 0 (0.0%) | 0 (0.0%) |
| Total | 27 (100.0%) | 8 (100.0%) |
Household Vehicle Usage in Clontarf
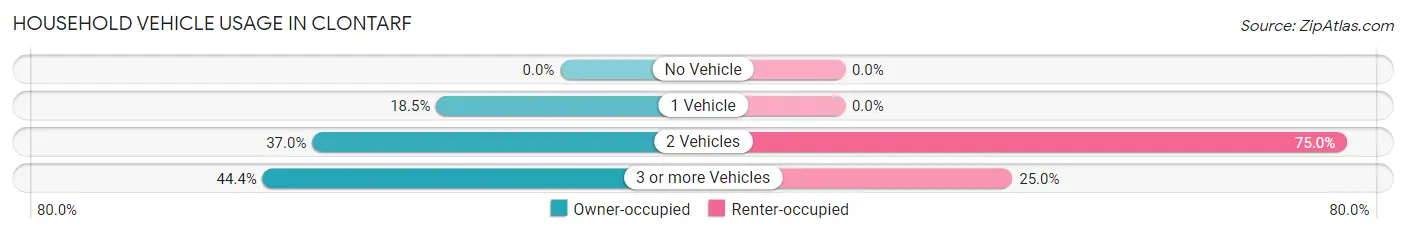
| Vehicles per Household | Owner-occupied | Renter-occupied |
| No Vehicle | 0 (0.0%) | 0 (0.0%) |
| 1 Vehicle | 5 (18.5%) | 0 (0.0%) |
| 2 Vehicles | 10 (37.0%) | 6 (75.0%) |
| 3 or more Vehicles | 12 (44.4%) | 2 (25.0%) |
| Total | 27 (100.0%) | 8 (100.0%) |
Real Estate & Mortgages in Clontarf
Real Estate and Mortgage Overview in Clontarf
| Characteristic | Without Mortgage | With Mortgage |
| Housing Units | 16 | 11 |
| Median Property Value | $95,000 | $82,500 |
| Median Household Income | $71,250 | $1 |
| Monthly Housing Costs | $400 | $0 |
| Real Estate Taxes | $1,500 | $0 |
Property Value by Mortgage Status in Clontarf
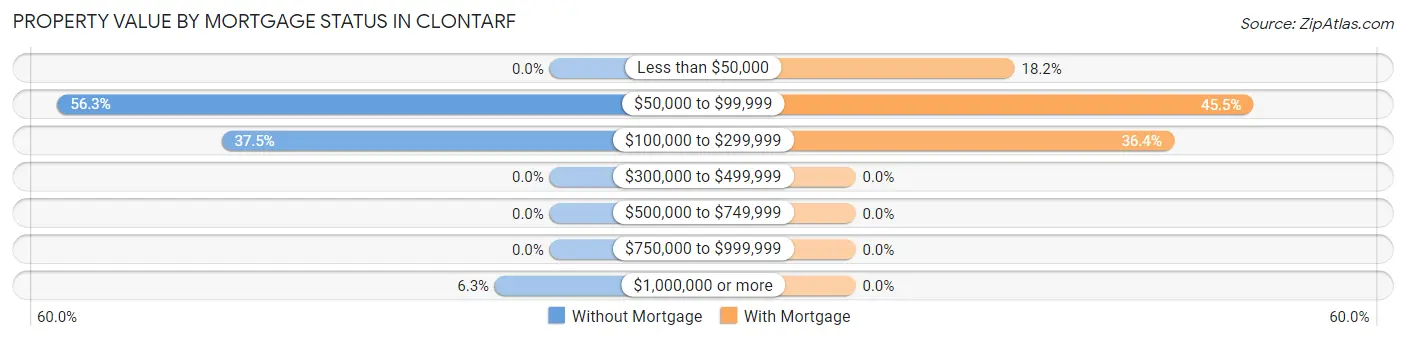
| Property Value | Without Mortgage | With Mortgage |
| Less than $50,000 | 0 (0.0%) | 2 (18.2%) |
| $50,000 to $99,999 | 9 (56.2%) | 5 (45.5%) |
| $100,000 to $299,999 | 6 (37.5%) | 4 (36.4%) |
| $300,000 to $499,999 | 0 (0.0%) | 0 (0.0%) |
| $500,000 to $749,999 | 0 (0.0%) | 0 (0.0%) |
| $750,000 to $999,999 | 0 (0.0%) | 0 (0.0%) |
| $1,000,000 or more | 1 (6.2%) | 0 (0.0%) |
| Total | 16 (100.0%) | 11 (100.0%) |
Household Income by Mortgage Status in Clontarf
| Household Income | Without Mortgage | With Mortgage |
| Less than $10,000 | 0 (0.0%) | 0 (0.0%) |
| $10,000 to $24,999 | 0 (0.0%) | 0 (0.0%) |
| $25,000 to $34,999 | 1 (6.2%) | 1 (9.1%) |
| $35,000 to $49,999 | 3 (18.8%) | 0 (0.0%) |
| $50,000 to $74,999 | 5 (31.2%) | 2 (18.2%) |
| $75,000 to $99,999 | 3 (18.8%) | 0 (0.0%) |
| $100,000 to $149,999 | 2 (12.5%) | 2 (18.2%) |
| $150,000 or more | 2 (12.5%) | 5 (45.5%) |
| Total | 16 (100.0%) | 11 (100.0%) |
Property Value to Household Income Ratio in Clontarf
| Value-to-Income Ratio | Without Mortgage | With Mortgage |
| Less than 2.0x | 11 (68.8%) | 132,750 (1,206,818.2%) |
| 2.0x to 2.9x | 3 (18.8%) | 10 (90.9%) |
| 3.0x to 3.9x | 1 (6.2%) | 0 (0.0%) |
| 4.0x or more | 1 (6.2%) | 1 (9.1%) |
| Total | 16 (100.0%) | 11 (100.0%) |
Real Estate Taxes by Mortgage Status in Clontarf
| Property Taxes | Without Mortgage | With Mortgage |
| Less than $800 | 2 (12.5%) | 0 (0.0%) |
| $800 to $1,499 | 6 (37.5%) | 1 (9.1%) |
| $800 to $1,499 | 8 (50.0%) | 5 (45.5%) |
| Total | 16 (100.0%) | 11 (100.0%) |
Health & Disability in Clontarf
Health Insurance Coverage by Age in Clontarf
| Age Bracket | With Coverage | Without Coverage |
| Under 6 Years | 0 (0.0%) | 0 (0.0%) |
| 6 to 18 Years | 15 (100.0%) | 0 (0.0%) |
| 19 to 25 Years | 1 (100.0%) | 0 (0.0%) |
| 26 to 34 Years | 2 (100.0%) | 0 (0.0%) |
| 35 to 44 Years | 19 (100.0%) | 0 (0.0%) |
| 45 to 54 Years | 10 (100.0%) | 0 (0.0%) |
| 55 to 64 Years | 6 (100.0%) | 0 (0.0%) |
| 65 to 74 Years | 16 (100.0%) | 0 (0.0%) |
| 75 Years and older | 2 (100.0%) | 0 (0.0%) |
| Total | 71 (100.0%) | 0 (0.0%) |
Health Insurance Coverage by Citizenship Status in Clontarf
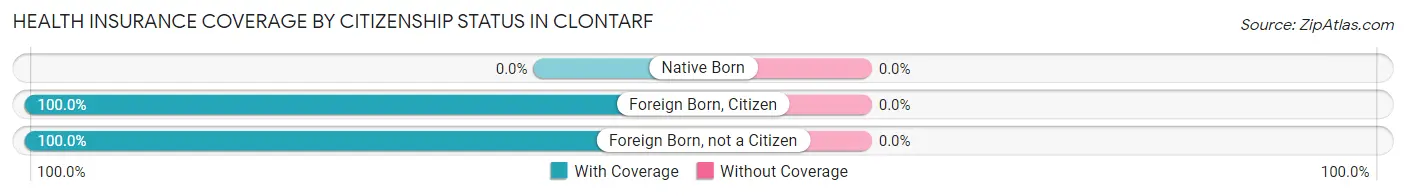
| Citizenship Status | With Coverage | Without Coverage |
| Native Born | 0 (0.0%) | 0 (0.0%) |
| Foreign Born, Citizen | 15 (100.0%) | 0 (0.0%) |
| Foreign Born, not a Citizen | 1 (100.0%) | 0 (0.0%) |
Health Insurance Coverage by Household Income in Clontarf
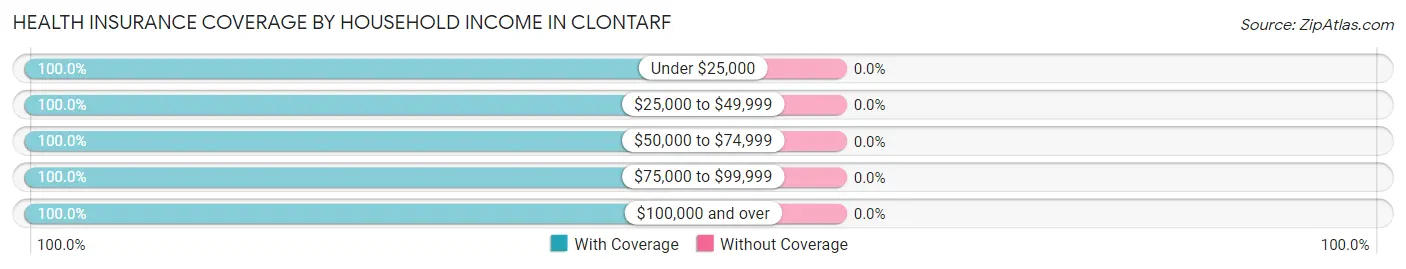
| Household Income | With Coverage | Without Coverage |
| Under $25,000 | 1 (100.0%) | 0 (0.0%) |
| $25,000 to $49,999 | 8 (100.0%) | 0 (0.0%) |
| $50,000 to $74,999 | 16 (100.0%) | 0 (0.0%) |
| $75,000 to $99,999 | 10 (100.0%) | 0 (0.0%) |
| $100,000 and over | 36 (100.0%) | 0 (0.0%) |
Public vs Private Health Insurance Coverage by Age in Clontarf
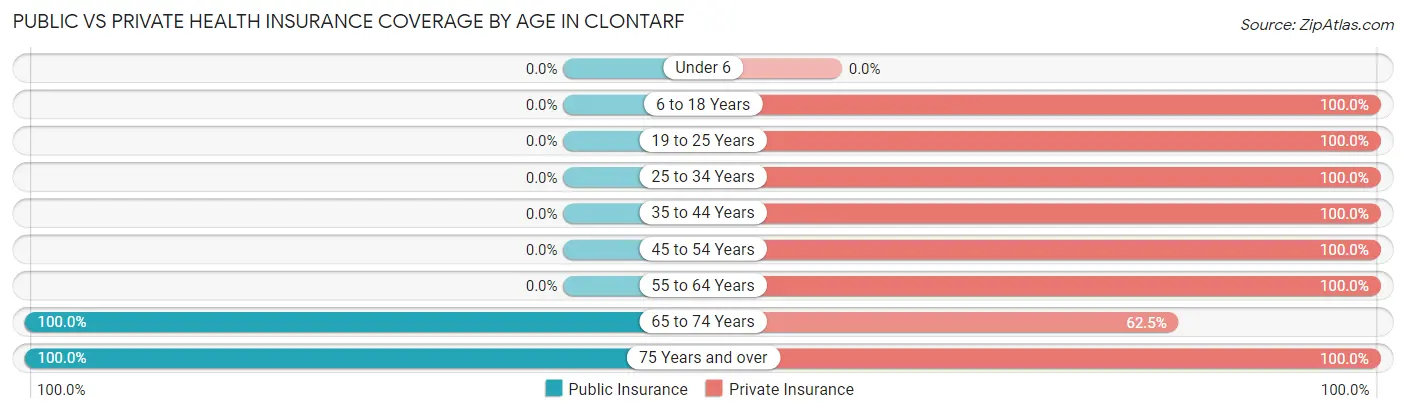
| Age Bracket | Public Insurance | Private Insurance |
| Under 6 | 0 (0.0%) | 0 (0.0%) |
| 6 to 18 Years | 0 (0.0%) | 15 (100.0%) |
| 19 to 25 Years | 0 (0.0%) | 1 (100.0%) |
| 25 to 34 Years | 0 (0.0%) | 2 (100.0%) |
| 35 to 44 Years | 0 (0.0%) | 19 (100.0%) |
| 45 to 54 Years | 0 (0.0%) | 10 (100.0%) |
| 55 to 64 Years | 0 (0.0%) | 6 (100.0%) |
| 65 to 74 Years | 16 (100.0%) | 10 (62.5%) |
| 75 Years and over | 2 (100.0%) | 2 (100.0%) |
| Total | 18 (25.4%) | 65 (91.5%) |
Disability Status by Sex by Age in Clontarf
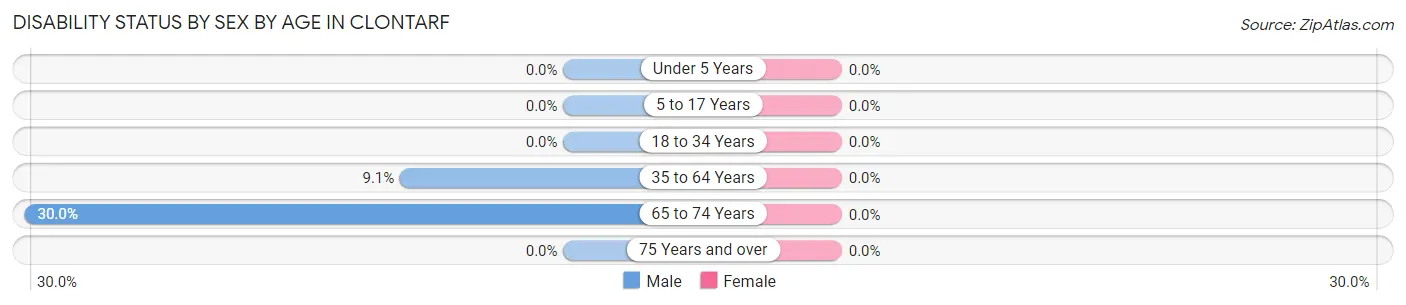
| Age Bracket | Male | Female |
| Under 5 Years | 0 (0.0%) | 0 (0.0%) |
| 5 to 17 Years | 0 (0.0%) | 0 (0.0%) |
| 18 to 34 Years | 0 (0.0%) | 0 (0.0%) |
| 35 to 64 Years | 2 (9.1%) | 0 (0.0%) |
| 65 to 74 Years | 3 (30.0%) | 0 (0.0%) |
| 75 Years and over | 0 (0.0%) | 0 (0.0%) |
Disability Class by Sex by Age in Clontarf
Disability Class: Hearing Difficulty
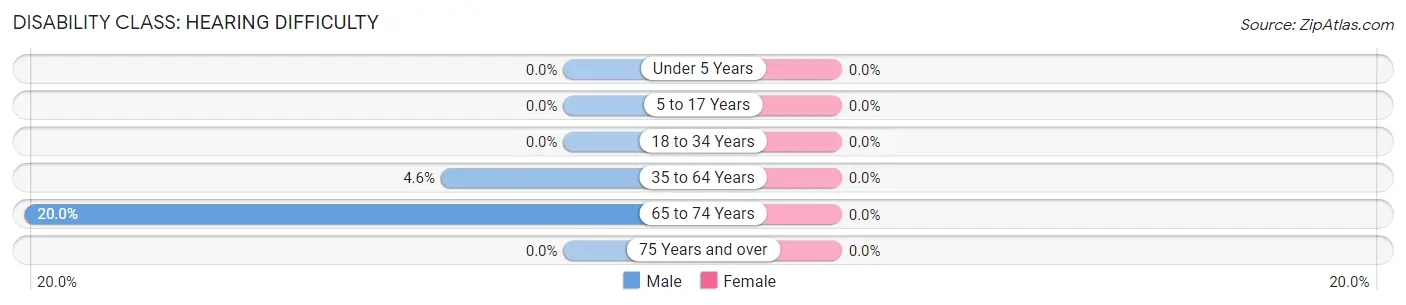
| Age Bracket | Male | Female |
| Under 5 Years | 0 (0.0%) | 0 (0.0%) |
| 5 to 17 Years | 0 (0.0%) | 0 (0.0%) |
| 18 to 34 Years | 0 (0.0%) | 0 (0.0%) |
| 35 to 64 Years | 1 (4.5%) | 0 (0.0%) |
| 65 to 74 Years | 2 (20.0%) | 0 (0.0%) |
| 75 Years and over | 0 (0.0%) | 0 (0.0%) |
Disability Class: Vision Difficulty
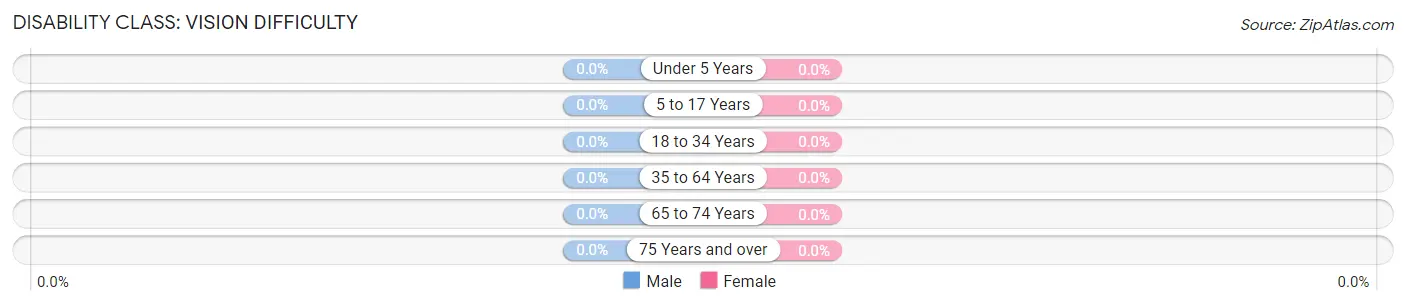
| Age Bracket | Male | Female |
| Under 5 Years | 0 (0.0%) | 0 (0.0%) |
| 5 to 17 Years | 0 (0.0%) | 0 (0.0%) |
| 18 to 34 Years | 0 (0.0%) | 0 (0.0%) |
| 35 to 64 Years | 0 (0.0%) | 0 (0.0%) |
| 65 to 74 Years | 0 (0.0%) | 0 (0.0%) |
| 75 Years and over | 0 (0.0%) | 0 (0.0%) |
Disability Class: Cognitive Difficulty
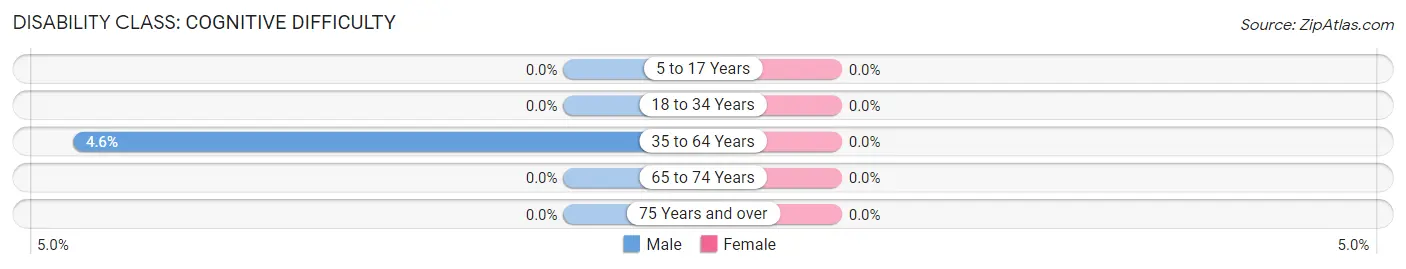
| Age Bracket | Male | Female |
| 5 to 17 Years | 0 (0.0%) | 0 (0.0%) |
| 18 to 34 Years | 0 (0.0%) | 0 (0.0%) |
| 35 to 64 Years | 1 (4.5%) | 0 (0.0%) |
| 65 to 74 Years | 0 (0.0%) | 0 (0.0%) |
| 75 Years and over | 0 (0.0%) | 0 (0.0%) |
Disability Class: Ambulatory Difficulty
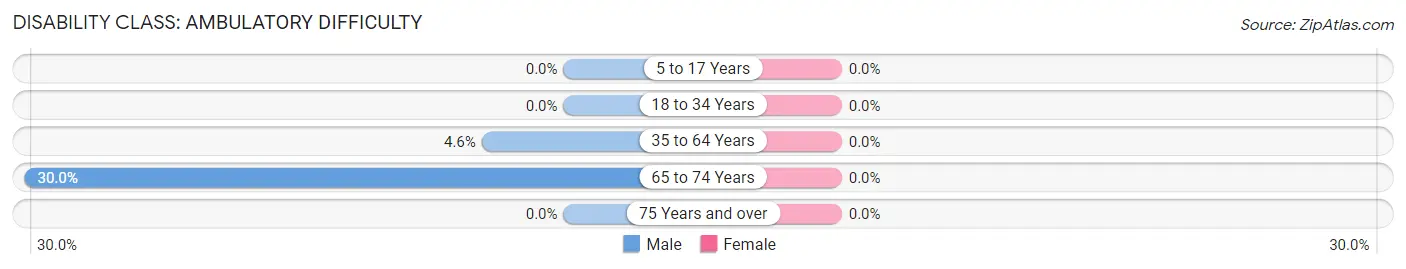
| Age Bracket | Male | Female |
| 5 to 17 Years | 0 (0.0%) | 0 (0.0%) |
| 18 to 34 Years | 0 (0.0%) | 0 (0.0%) |
| 35 to 64 Years | 1 (4.5%) | 0 (0.0%) |
| 65 to 74 Years | 3 (30.0%) | 0 (0.0%) |
| 75 Years and over | 0 (0.0%) | 0 (0.0%) |
Disability Class: Self-Care Difficulty
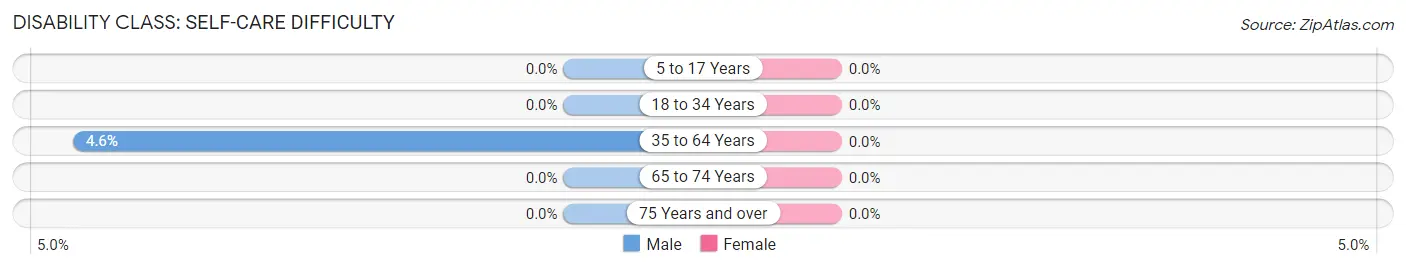
| Age Bracket | Male | Female |
| 5 to 17 Years | 0 (0.0%) | 0 (0.0%) |
| 18 to 34 Years | 0 (0.0%) | 0 (0.0%) |
| 35 to 64 Years | 1 (4.5%) | 0 (0.0%) |
| 65 to 74 Years | 0 (0.0%) | 0 (0.0%) |
| 75 Years and over | 0 (0.0%) | 0 (0.0%) |
Technology Access in Clontarf
Computing Device Access in Clontarf
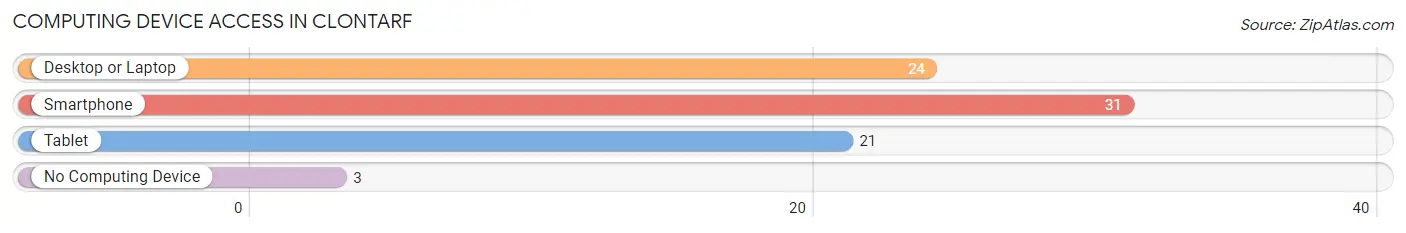
| Device Type | # Households | % Households |
| Desktop or Laptop | 24 | 68.6% |
| Smartphone | 31 | 88.6% |
| Tablet | 21 | 60.0% |
| No Computing Device | 3 | 8.6% |
| Total | 35 | 100.0% |
Internet Access in Clontarf
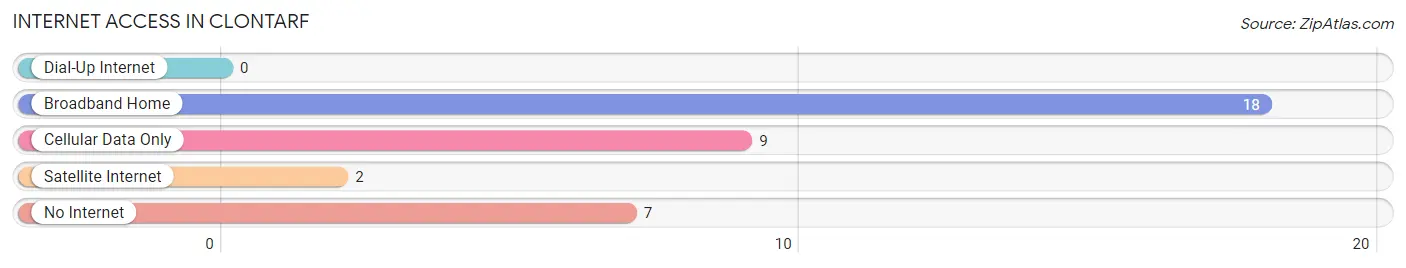
| Internet Type | # Households | % Households |
| Dial-Up Internet | 0 | 0.0% |
| Broadband Home | 18 | 51.4% |
| Cellular Data Only | 9 | 25.7% |
| Satellite Internet | 2 | 5.7% |
| No Internet | 7 | 20.0% |
| Total | 35 | 100.0% |
Clontarf Summary
Clontarf, Minnesota is a small city located in the southwestern corner of the state, just north of the Iowa border. It is part of the larger Mankato-North Mankato Metropolitan Statistical Area, and is home to a population of just over 1,000 people. The city is known for its rural charm and its close proximity to the Minnesota River.
History
Clontarf was founded in 1856 by a group of settlers from Ireland. The city was named after the Battle of Clontarf, which took place in Ireland in 1014. The settlers were looking for a place to call home and found the area to be ideal for farming. The city was officially incorporated in 1872.
In the early 1900s, Clontarf was a thriving agricultural community. The city was home to several grain elevators, a creamery, and a cheese factory. The city also had a number of small businesses, including a blacksmith shop, a general store, and a hotel.
In the 1950s, the city began to experience a decline in population as many of its residents moved away in search of better job opportunities. The city’s population has remained relatively stable since then, with a slight increase in recent years.
Geography
Clontarf is located in the southwestern corner of Minnesota, just north of the Iowa border. The city is situated on the Minnesota River, which provides a scenic backdrop for the city. The city is surrounded by rolling hills and farmland, and is home to several small lakes.
The city has a total area of 1.2 square miles, all of which is land. The city has a humid continental climate, with cold winters and hot, humid summers.
Economy
Clontarf’s economy is largely based on agriculture. The city is home to several grain elevators, a creamery, and a cheese factory. The city also has a number of small businesses, including a general store, a hardware store, and a hotel.
The city is also home to a number of manufacturing companies, including a plastics manufacturer and a metal fabrication company. The city is also home to a number of small businesses, including a bakery, a florist, and a furniture store.
Demographics
As of the 2010 census, Clontarf had a population of 1,072. The racial makeup of the city was 97.3% White, 0.7% African American, 0.3% Native American, 0.2% Asian, 0.1% Pacific Islander, 0.3% from other races, and 1.2% from two or more races. Hispanic or Latino of any race were 1.2% of the population.
The median income for a household in the city was $41,250, and the median income for a family was $50,000. The per capita income for the city was $20,845. About 8.3% of families and 10.2% of the population were below the poverty line, including 14.3% of those under age 18 and 8.3% of those age 65 or over.
Conclusion
Clontarf, Minnesota is a small city located in the southwestern corner of the state, just north of the Iowa border. It is part of the larger Mankato-North Mankato Metropolitan Statistical Area, and is home to a population of just over 1,000 people. The city is known for its rural charm and its close proximity to the Minnesota River. The city’s economy is largely based on agriculture, and it is home to several small businesses. The city has a humid continental climate, with cold winters and hot, humid summers. The population of Clontarf is predominantly white, with a small percentage of African American, Native American, Asian, and Pacific Islander residents. The median income for a household in the city is $41,250, and the per capita income is $20,845.
Common Questions
What is Per Capita Income in Clontarf?
Per Capita income in Clontarf is $45,690.
What is the Median Family Income in Clontarf?
Median Family Income in Clontarf is $108,750.
What is the Median Household income in Clontarf?
Median Household Income in Clontarf is $71,875.
What is Income or Wage Gap in Clontarf?
Income or Wage Gap in Clontarf is 21.5%.
Women in Clontarf earn 78.5 cents for every dollar earned by a man.
What is Inequality or Gini Index in Clontarf?
Inequality or Gini Index in Clontarf is 0.35.
What is the Total Population of Clontarf?
Total Population of Clontarf is 71.
What is the Total Male Population of Clontarf?
Total Male Population of Clontarf is 41.
What is the Total Female Population of Clontarf?
Total Female Population of Clontarf is 30.
What is the Ratio of Males per 100 Females in Clontarf?
There are 136.67 Males per 100 Females in Clontarf.
What is the Ratio of Females per 100 Males in Clontarf?
There are 73.17 Females per 100 Males in Clontarf.
What is the Median Population Age in Clontarf?
Median Population Age in Clontarf is 42.3 Years.
What is the Average Family Size in Clontarf
Average Family Size in Clontarf is 2.7 People.
What is the Average Household Size in Clontarf
Average Household Size in Clontarf is 2.0 People.
How Large is the Labor Force in Clontarf?
There are 44 People in the Labor Forcein in Clontarf.
What is the Percentage of People in the Labor Force in Clontarf?
73.3% of People are in the Labor Force in Clontarf.