Clear Lake, MN Map & Demographics
Clear Lake Map
Clear Lake Overview
$39,077
PER CAPITA INCOME
$106,382
AVG FAMILY INCOME
$105,724
AVG HOUSEHOLD INCOME
28.9%
WAGE / INCOME GAP [ % ]
71.1¢/ $1
WAGE / INCOME GAP [ $ ]
0.27
INEQUALITY / GINI INDEX
698
TOTAL POPULATION
367
MALE POPULATION
331
FEMALE POPULATION
110.88
MALES / 100 FEMALES
90.19
FEMALES / 100 MALES
32.5
MEDIAN AGE
3.2
AVG FAMILY SIZE
2.9
AVG HOUSEHOLD SIZE
443
LABOR FORCE [ PEOPLE ]
87.4%
PERCENT IN LABOR FORCE
6.1%
UNEMPLOYMENT RATE
Clear Lake Zip Codes
Income in Clear Lake
Income Overview in Clear Lake
Per Capita Income in Clear Lake is $39,077, while median incomes of families and households are $106,382 and $105,724 respectively.
| Characteristic | Number | Measure |
| Per Capita Income | 698 | $39,077 |
| Median Family Income | 189 | $106,382 |
| Mean Family Income | 189 | $117,935 |
| Median Household Income | 243 | $105,724 |
| Mean Household Income | 243 | $110,020 |
| Income Deficit | 189 | $0 |
| Wage / Income Gap (%) | 698 | 28.87% |
| Wage / Income Gap ($) | 698 | 71.13¢ per $1 |
| Gini / Inequality Index | 698 | 0.27 |
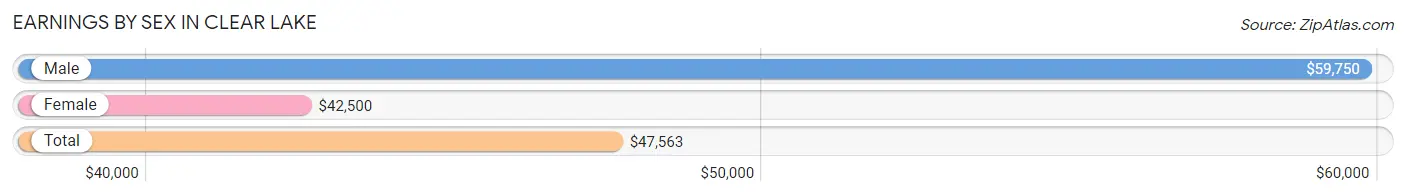
Earnings by Sex in Clear Lake
Average Earnings in Clear Lake are $47,563, $59,750 for men and $42,500 for women, a difference of 28.9%.
| Sex | Number | Average Earnings |
| Male | 229 (51.5%) | $59,750 |
| Female | 216 (48.5%) | $42,500 |
| Total | 445 (100.0%) | $47,563 |
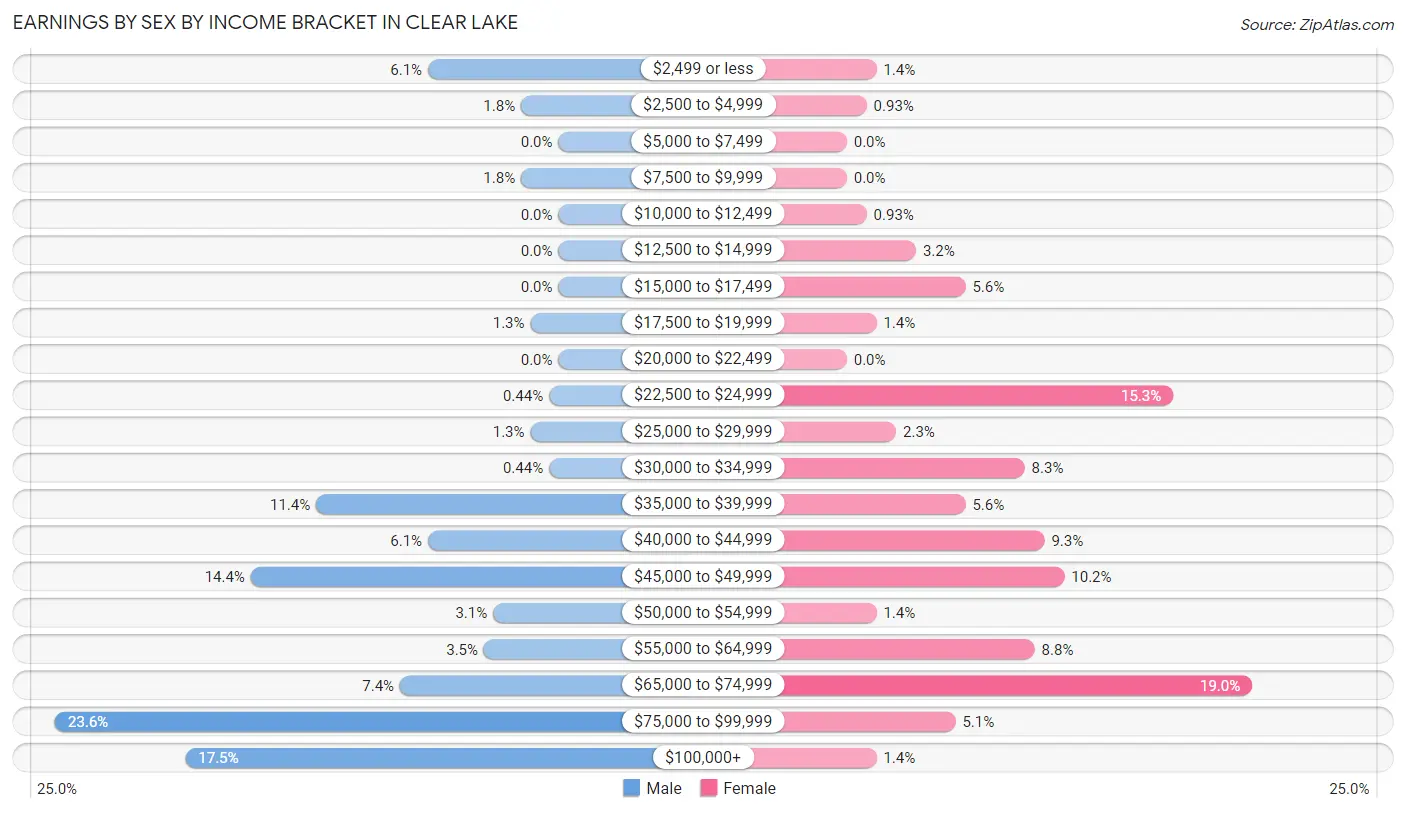
Earnings by Sex by Income Bracket in Clear Lake
The most common earnings brackets in Clear Lake are $75,000 to $99,999 for men (54 | 23.6%) and $65,000 to $74,999 for women (41 | 19.0%).
| Income | Male | Female |
| $2,499 or less | 14 (6.1%) | 3 (1.4%) |
| $2,500 to $4,999 | 4 (1.8%) | 2 (0.9%) |
| $5,000 to $7,499 | 0 (0.0%) | 0 (0.0%) |
| $7,500 to $9,999 | 4 (1.8%) | 0 (0.0%) |
| $10,000 to $12,499 | 0 (0.0%) | 2 (0.9%) |
| $12,500 to $14,999 | 0 (0.0%) | 7 (3.2%) |
| $15,000 to $17,499 | 0 (0.0%) | 12 (5.6%) |
| $17,500 to $19,999 | 3 (1.3%) | 3 (1.4%) |
| $20,000 to $22,499 | 0 (0.0%) | 0 (0.0%) |
| $22,500 to $24,999 | 1 (0.4%) | 33 (15.3%) |
| $25,000 to $29,999 | 3 (1.3%) | 5 (2.3%) |
| $30,000 to $34,999 | 1 (0.4%) | 18 (8.3%) |
| $35,000 to $39,999 | 26 (11.4%) | 12 (5.6%) |
| $40,000 to $44,999 | 14 (6.1%) | 20 (9.3%) |
| $45,000 to $49,999 | 33 (14.4%) | 22 (10.2%) |
| $50,000 to $54,999 | 7 (3.1%) | 3 (1.4%) |
| $55,000 to $64,999 | 8 (3.5%) | 19 (8.8%) |
| $65,000 to $74,999 | 17 (7.4%) | 41 (19.0%) |
| $75,000 to $99,999 | 54 (23.6%) | 11 (5.1%) |
| $100,000+ | 40 (17.5%) | 3 (1.4%) |
| Total | 229 (100.0%) | 216 (100.0%) |
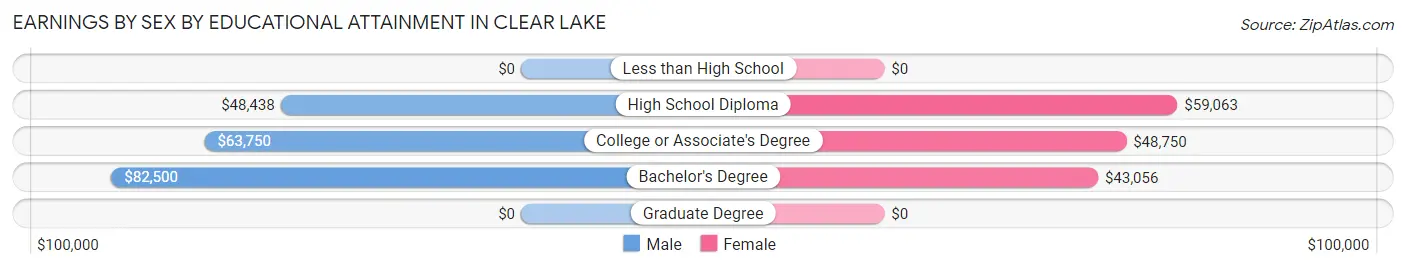
Earnings by Sex by Educational Attainment in Clear Lake
Average earnings in Clear Lake are $71,042 for men and $45,417 for women, a difference of 36.1%. Men with an educational attainment of bachelor's degree enjoy the highest average annual earnings of $82,500, while those with high school diploma education earn the least with $48,438. Women with an educational attainment of high school diploma earn the most with the average annual earnings of $59,063, while those with bachelor's degree education have the smallest earnings of $43,056.
| Educational Attainment | Male Income | Female Income |
| Less than High School | - | - |
| High School Diploma | $48,438 | $59,063 |
| College or Associate's Degree | $63,750 | $48,750 |
| Bachelor's Degree | $82,500 | $43,056 |
| Graduate Degree | - | - |
| Total | $71,042 | $45,417 |
Family Income in Clear Lake
Family Income Brackets in Clear Lake
According to the Clear Lake family income data, there are 67 families falling into the $100,000 to $149,999 income range, which is the most common income bracket and makes up 35.4% of all families.
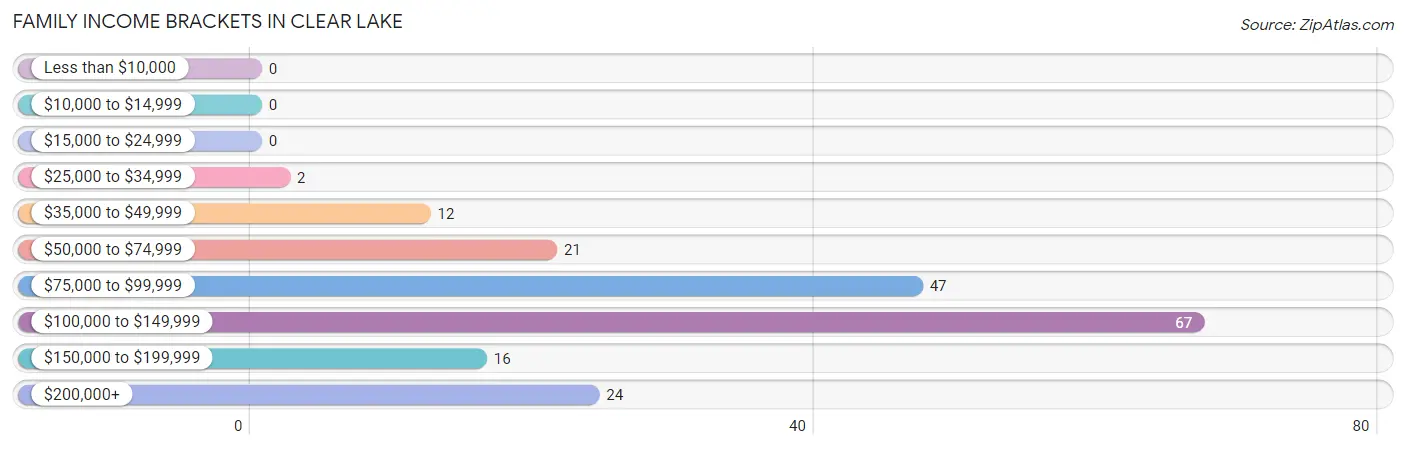
| Income Bracket | # Families | % Families |
| Less than $10,000 | 0 | 0.0% |
| $10,000 to $14,999 | 0 | 0.0% |
| $15,000 to $24,999 | 0 | 0.0% |
| $25,000 to $34,999 | 2 | 1.1% |
| $35,000 to $49,999 | 12 | 6.3% |
| $50,000 to $74,999 | 21 | 11.1% |
| $75,000 to $99,999 | 47 | 24.9% |
| $100,000 to $149,999 | 67 | 35.4% |
| $150,000 to $199,999 | 16 | 8.5% |
| $200,000+ | 24 | 12.7% |
Family Income by Famaliy Size in Clear Lake
5-person families (22 | 11.6%) account for the highest median family income in Clear Lake with $136,875 per family, while 2-person families (80 | 42.3%) have the highest median income of $44,464 per family member.
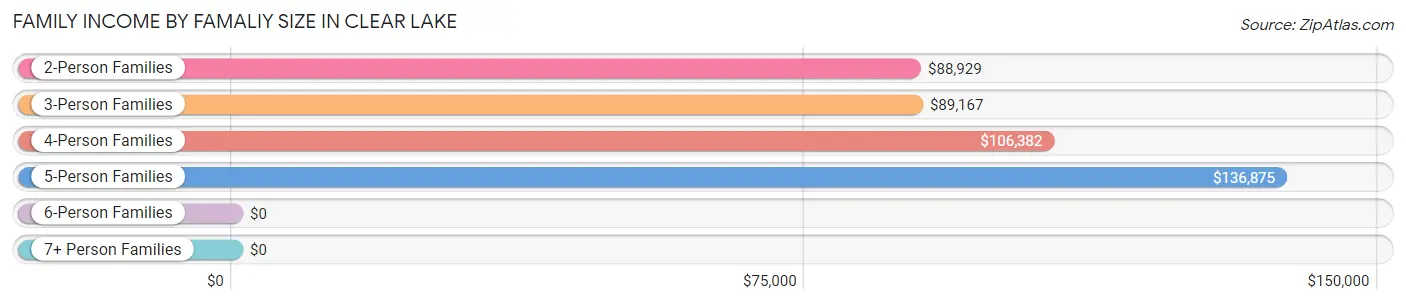
| Income Bracket | # Families | Median Income |
| 2-Person Families | 80 (42.3%) | $88,929 |
| 3-Person Families | 34 (18.0%) | $89,167 |
| 4-Person Families | 51 (27.0%) | $106,382 |
| 5-Person Families | 22 (11.6%) | $136,875 |
| 6-Person Families | 2 (1.1%) | $0 |
| 7+ Person Families | 0 (0.0%) | $0 |
| Total | 189 (100.0%) | $106,382 |
Family Income by Number of Earners in Clear Lake
The median family income in Clear Lake is $106,382, with families comprising 3+ earners (18) having the highest median family income of $133,500, while families with no earners (6) have the lowest median family income of $66,250, accounting for 9.5% and 3.2% of families, respectively.
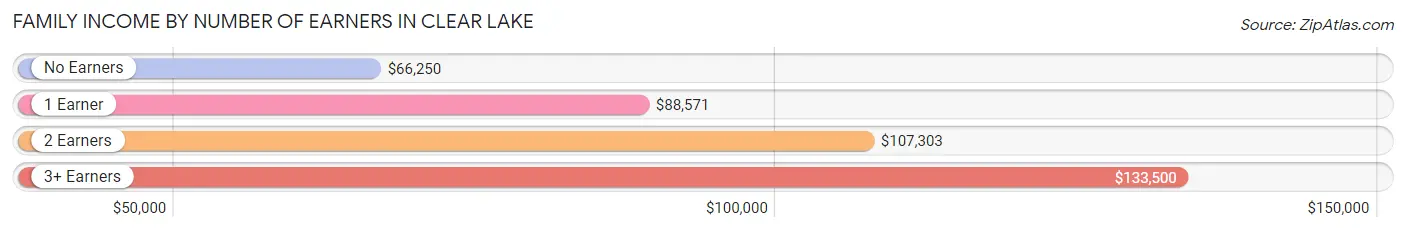
| Number of Earners | # Families | Median Income |
| No Earners | 6 (3.2%) | $66,250 |
| 1 Earner | 38 (20.1%) | $88,571 |
| 2 Earners | 127 (67.2%) | $107,303 |
| 3+ Earners | 18 (9.5%) | $133,500 |
| Total | 189 (100.0%) | $106,382 |
Household Income in Clear Lake
Household Income Brackets in Clear Lake
With 89 households falling in the category, the $100,000 to $149,999 income range is the most frequent in Clear Lake, accounting for 36.6% of all households.
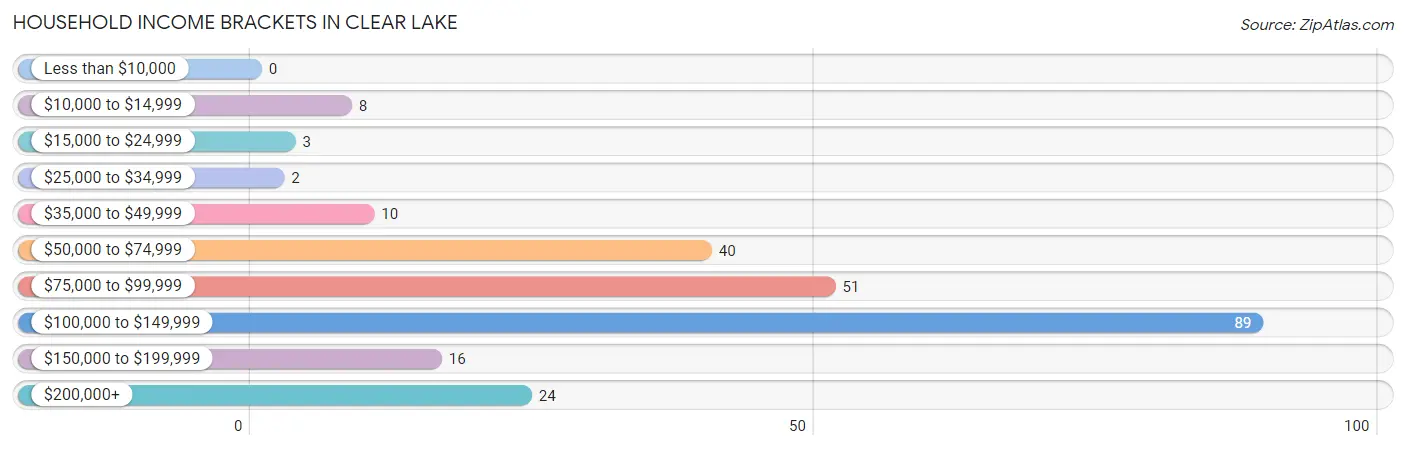
| Income Bracket | # Households | % Households |
| Less than $10,000 | 0 | 0.0% |
| $10,000 to $14,999 | 8 | 3.3% |
| $15,000 to $24,999 | 3 | 1.2% |
| $25,000 to $34,999 | 2 | 0.8% |
| $35,000 to $49,999 | 10 | 4.1% |
| $50,000 to $74,999 | 40 | 16.5% |
| $75,000 to $99,999 | 51 | 21.0% |
| $100,000 to $149,999 | 89 | 36.6% |
| $150,000 to $199,999 | 16 | 6.6% |
| $200,000+ | 24 | 9.9% |
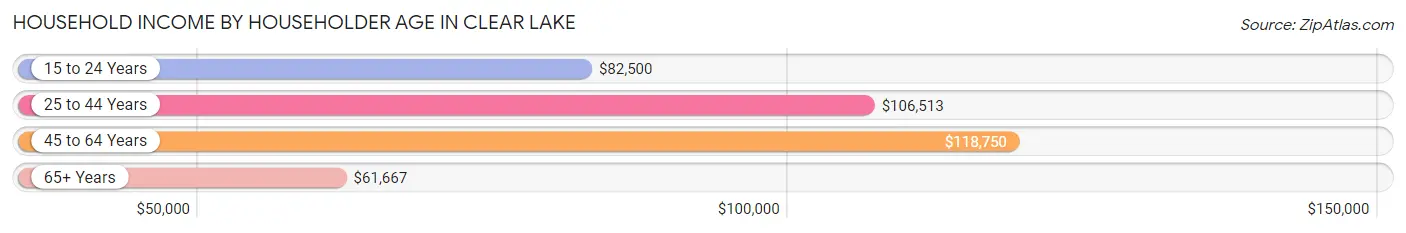
Household Income by Householder Age in Clear Lake
The median household income in Clear Lake is $105,724, with the highest median household income of $118,750 found in the 45 to 64 years age bracket for the primary householder. A total of 72 households (29.6%) fall into this category. Meanwhile, the 65+ years age bracket for the primary householder has the lowest median household income of $61,667, with 20 households (8.2%) in this group.
| Income Bracket | # Households | Median Income |
| 15 to 24 Years | 8 (3.3%) | $82,500 |
| 25 to 44 Years | 143 (58.9%) | $106,513 |
| 45 to 64 Years | 72 (29.6%) | $118,750 |
| 65+ Years | 20 (8.2%) | $61,667 |
| Total | 243 (100.0%) | $105,724 |
Poverty in Clear Lake
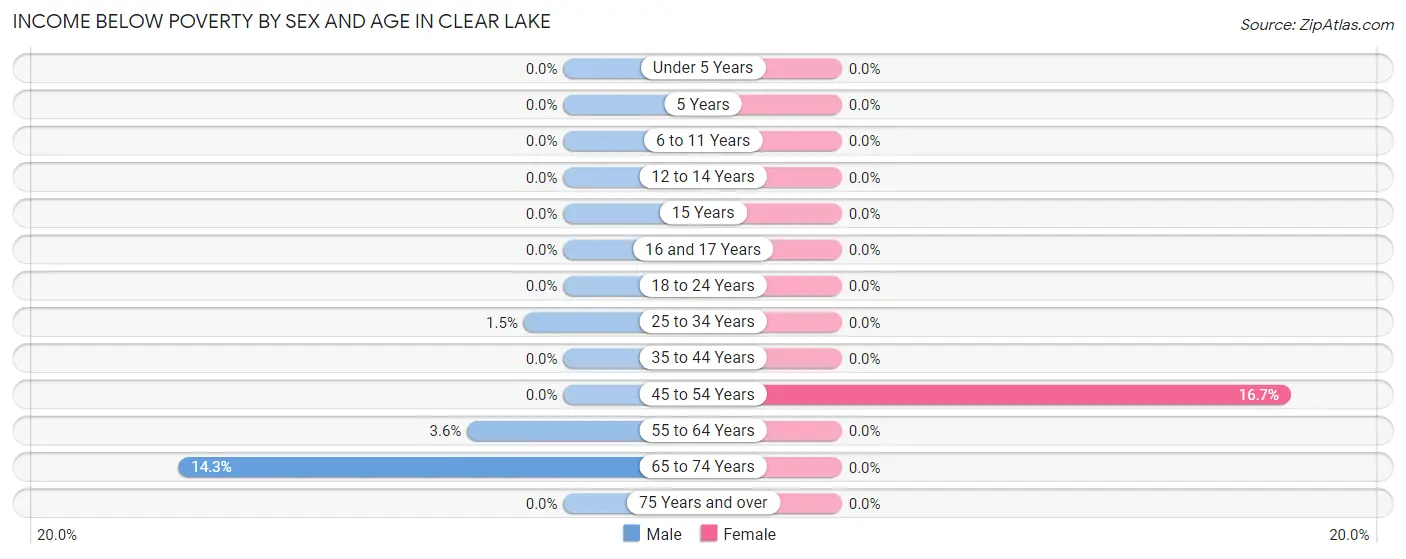
Income Below Poverty by Sex and Age in Clear Lake
With 1.1% poverty level for males and 1.8% for females among the residents of Clear Lake, 65 to 74 year old males and 45 to 54 year old females are the most vulnerable to poverty, with 2 males (14.3%) and 6 females (16.7%) in their respective age groups living below the poverty level.
| Age Bracket | Male | Female |
| Under 5 Years | 0 (0.0%) | 0 (0.0%) |
| 5 Years | 0 (0.0%) | 0 (0.0%) |
| 6 to 11 Years | 0 (0.0%) | 0 (0.0%) |
| 12 to 14 Years | 0 (0.0%) | 0 (0.0%) |
| 15 Years | 0 (0.0%) | 0 (0.0%) |
| 16 and 17 Years | 0 (0.0%) | 0 (0.0%) |
| 18 to 24 Years | 0 (0.0%) | 0 (0.0%) |
| 25 to 34 Years | 1 (1.5%) | 0 (0.0%) |
| 35 to 44 Years | 0 (0.0%) | 0 (0.0%) |
| 45 to 54 Years | 0 (0.0%) | 6 (16.7%) |
| 55 to 64 Years | 1 (3.6%) | 0 (0.0%) |
| 65 to 74 Years | 2 (14.3%) | 0 (0.0%) |
| 75 Years and over | 0 (0.0%) | 0 (0.0%) |
| Total | 4 (1.1%) | 6 (1.8%) |
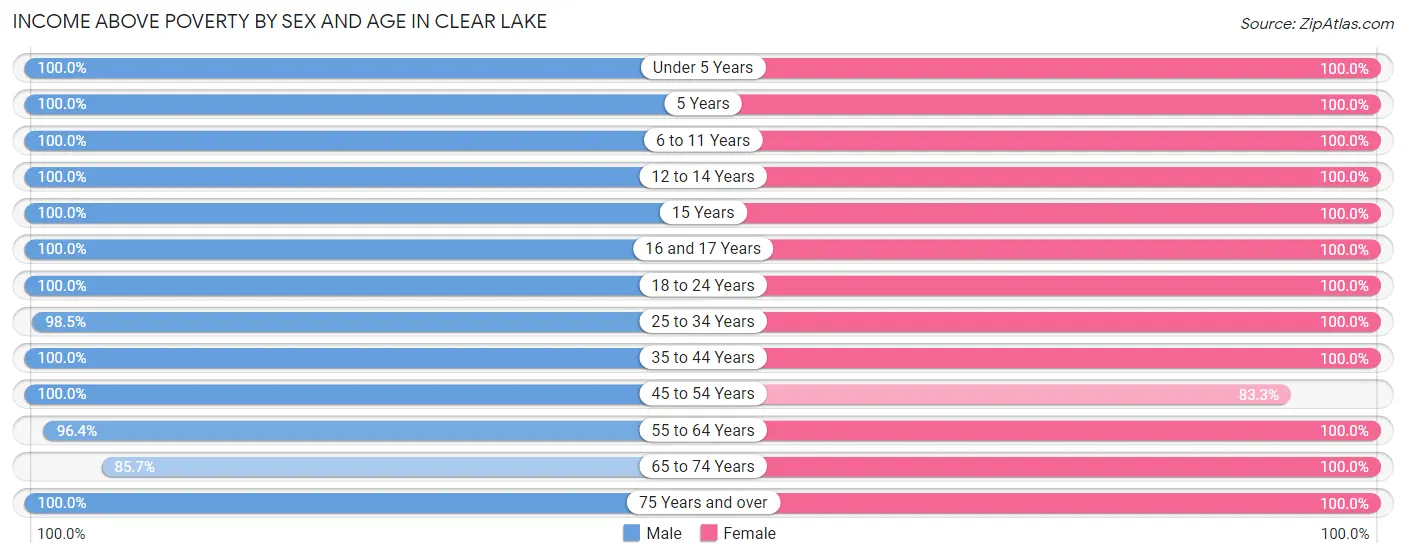
Income Above Poverty by Sex and Age in Clear Lake
According to the poverty statistics in Clear Lake, males aged under 5 years and females aged under 5 years are the age groups that are most secure financially, with 100.0% of males and 100.0% of females in these age groups living above the poverty line.
| Age Bracket | Male | Female |
| Under 5 Years | 44 (100.0%) | 28 (100.0%) |
| 5 Years | 10 (100.0%) | 4 (100.0%) |
| 6 to 11 Years | 41 (100.0%) | 28 (100.0%) |
| 12 to 14 Years | 8 (100.0%) | 10 (100.0%) |
| 15 Years | 13 (100.0%) | 5 (100.0%) |
| 16 and 17 Years | 15 (100.0%) | 4 (100.0%) |
| 18 to 24 Years | 13 (100.0%) | 21 (100.0%) |
| 25 to 34 Years | 67 (98.5%) | 97 (100.0%) |
| 35 to 44 Years | 55 (100.0%) | 58 (100.0%) |
| 45 to 54 Years | 55 (100.0%) | 30 (83.3%) |
| 55 to 64 Years | 27 (96.4%) | 26 (100.0%) |
| 65 to 74 Years | 12 (85.7%) | 10 (100.0%) |
| 75 Years and over | 3 (100.0%) | 4 (100.0%) |
| Total | 363 (98.9%) | 325 (98.2%) |
Income Below Poverty Among Married-Couple Families in Clear Lake
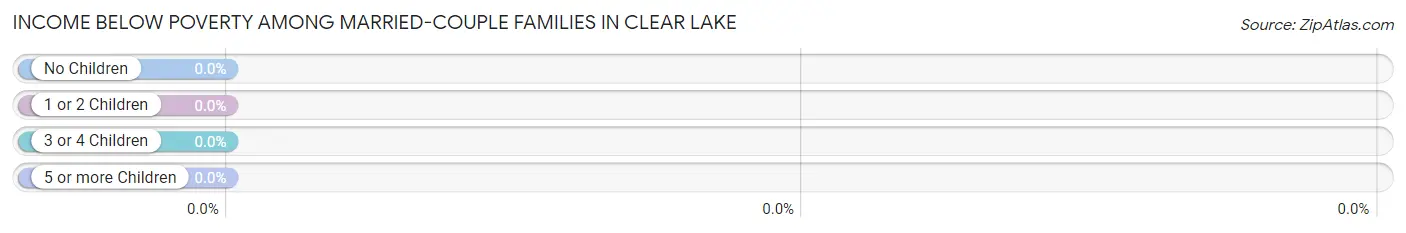
| Children | Above Poverty | Below Poverty |
| No Children | 68 (100.0%) | 0 (0.0%) |
| 1 or 2 Children | 67 (100.0%) | 0 (0.0%) |
| 3 or 4 Children | 16 (100.0%) | 0 (0.0%) |
| 5 or more Children | 0 (0.0%) | 0 (0.0%) |
| Total | 151 (100.0%) | 0 (0.0%) |
Income Below Poverty Among Single-Parent Households in Clear Lake
| Children | Single Father | Single Mother |
| No Children | 0 (0.0%) | 0 (0.0%) |
| 1 or 2 Children | 0 (0.0%) | 0 (0.0%) |
| 3 or 4 Children | 0 (0.0%) | 0 (0.0%) |
| 5 or more Children | 0 (0.0%) | 0 (0.0%) |
| Total | 0 (0.0%) | 0 (0.0%) |
Income Below Poverty Among Married-Couple vs Single-Parent Households in Clear Lake
| Children | Married-Couple Families | Single-Parent Households |
| No Children | 0 (0.0%) | 0 (0.0%) |
| 1 or 2 Children | 0 (0.0%) | 0 (0.0%) |
| 3 or 4 Children | 0 (0.0%) | 0 (0.0%) |
| 5 or more Children | 0 (0.0%) | 0 (0.0%) |
| Total | 0 (0.0%) | 0 (0.0%) |
Race in Clear Lake
The most populous races in Clear Lake are White / Caucasian (696 | 99.7%), and Two or more Races (2 | 0.3%).
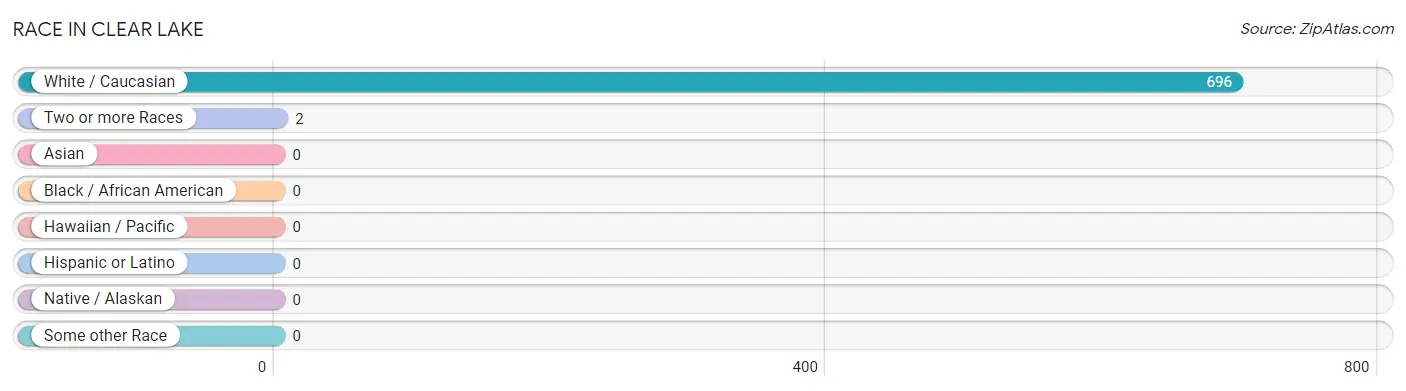
| Race | # Population | % Population |
| Asian | 0 | 0.0% |
| Black / African American | 0 | 0.0% |
| Hawaiian / Pacific | 0 | 0.0% |
| Hispanic or Latino | 0 | 0.0% |
| Native / Alaskan | 0 | 0.0% |
| White / Caucasian | 696 | 99.7% |
| Two or more Races | 2 | 0.3% |
| Some other Race | 0 | 0.0% |
| Total | 698 | 100.0% |
Ancestry in Clear Lake
The most populous ancestries reported in Clear Lake are German (317 | 45.4%), Norwegian (139 | 19.9%), Polish (112 | 16.1%), Irish (72 | 10.3%), and Swedish (34 | 4.9%), together accounting for 96.6% of all Clear Lake residents.
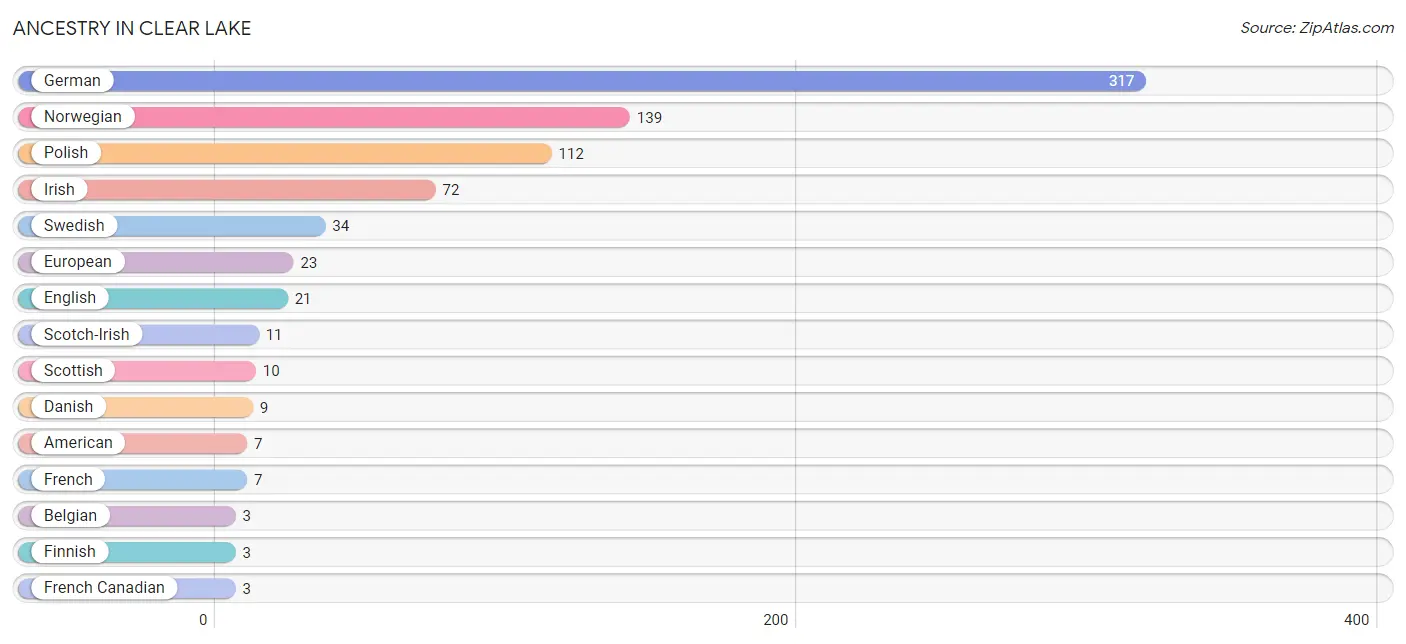
| Ancestry | # Population | % Population |
| American | 7 | 1.0% |
| Belgian | 3 | 0.4% |
| Croatian | 2 | 0.3% |
| Czech | 1 | 0.1% |
| Danish | 9 | 1.3% |
| Dutch | 2 | 0.3% |
| English | 21 | 3.0% |
| European | 23 | 3.3% |
| Finnish | 3 | 0.4% |
| French | 7 | 1.0% |
| French Canadian | 3 | 0.4% |
| German | 317 | 45.4% |
| Icelander | 1 | 0.1% |
| Irish | 72 | 10.3% |
| Mexican American Indian | 2 | 0.3% |
| Norwegian | 139 | 19.9% |
| Polish | 112 | 16.1% |
| Russian | 3 | 0.4% |
| Scotch-Irish | 11 | 1.6% |
| Scottish | 10 | 1.4% |
| Swedish | 34 | 4.9% |
| Turkish | 2 | 0.3% | View All 22 Rows |
Immigrants in Clear Lake

| Immigration Origin | # Population | % Population | View All 0 Rows |
Sex and Age in Clear Lake
Sex and Age in Clear Lake
The most populous age groups in Clear Lake are 50 to 54 Years (46 | 12.5%) for men and 25 to 29 Years (52 | 15.7%) for women.
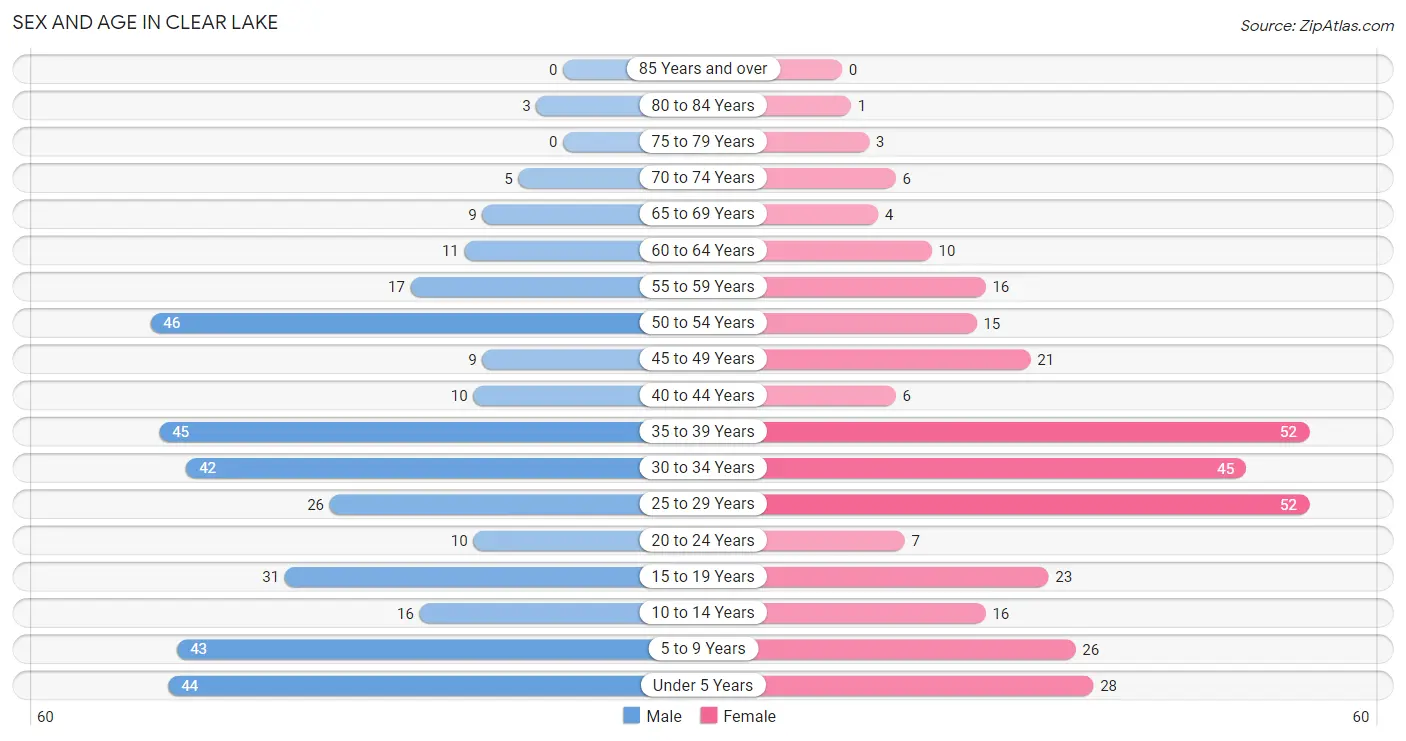
| Age Bracket | Male | Female |
| Under 5 Years | 44 (12.0%) | 28 (8.5%) |
| 5 to 9 Years | 43 (11.7%) | 26 (7.9%) |
| 10 to 14 Years | 16 (4.4%) | 16 (4.8%) |
| 15 to 19 Years | 31 (8.5%) | 23 (7.0%) |
| 20 to 24 Years | 10 (2.7%) | 7 (2.1%) |
| 25 to 29 Years | 26 (7.1%) | 52 (15.7%) |
| 30 to 34 Years | 42 (11.4%) | 45 (13.6%) |
| 35 to 39 Years | 45 (12.3%) | 52 (15.7%) |
| 40 to 44 Years | 10 (2.7%) | 6 (1.8%) |
| 45 to 49 Years | 9 (2.5%) | 21 (6.3%) |
| 50 to 54 Years | 46 (12.5%) | 15 (4.5%) |
| 55 to 59 Years | 17 (4.6%) | 16 (4.8%) |
| 60 to 64 Years | 11 (3.0%) | 10 (3.0%) |
| 65 to 69 Years | 9 (2.5%) | 4 (1.2%) |
| 70 to 74 Years | 5 (1.4%) | 6 (1.8%) |
| 75 to 79 Years | 0 (0.0%) | 3 (0.9%) |
| 80 to 84 Years | 3 (0.8%) | 1 (0.3%) |
| 85 Years and over | 0 (0.0%) | 0 (0.0%) |
| Total | 367 (100.0%) | 331 (100.0%) |
Families and Households in Clear Lake
Median Family Size in Clear Lake
The median family size in Clear Lake is 3.21 persons per family, with married-couple families (151 | 79.9%) accounting for the largest median family size of 3.33 persons per family. On the other hand, single male/father families (18 | 9.5%) represent the smallest median family size with 2.11 persons per family.
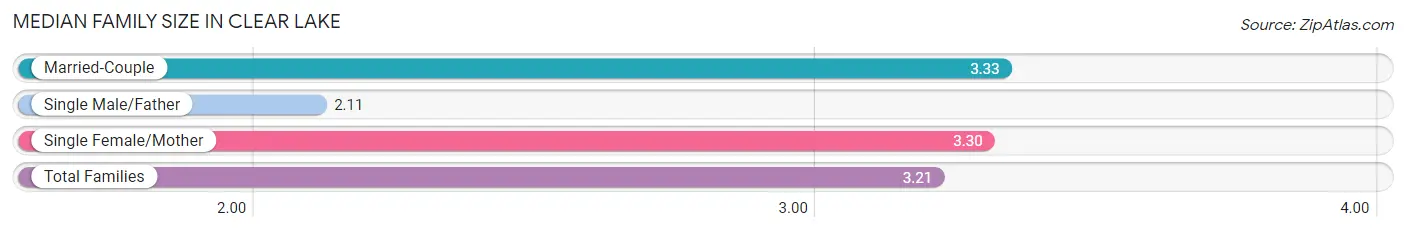
| Family Type | # Families | Family Size |
| Married-Couple | 151 (79.9%) | 3.33 |
| Single Male/Father | 18 (9.5%) | 2.11 |
| Single Female/Mother | 20 (10.6%) | 3.30 |
| Total Families | 189 (100.0%) | 3.21 |
Median Household Size in Clear Lake
The median household size in Clear Lake is 2.87 persons per household, with single female/mother households (20 | 8.2%) accounting for the largest median household size of 3.85 persons per household. non-family households (54 | 22.2%) represent the smallest median household size with 1.28 persons per household.
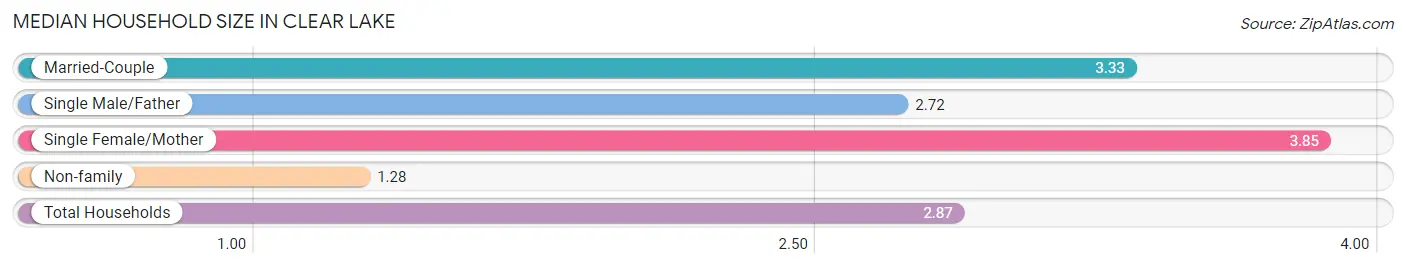
| Household Type | # Households | Household Size |
| Married-Couple | 151 (62.1%) | 3.33 |
| Single Male/Father | 18 (7.4%) | 2.72 |
| Single Female/Mother | 20 (8.2%) | 3.85 |
| Non-family | 54 (22.2%) | 1.28 |
| Total Households | 243 (100.0%) | 2.87 |
Household Size by Marriage Status in Clear Lake
Out of a total of 243 households in Clear Lake, 189 (77.8%) are family households, while 54 (22.2%) are nonfamily households. The most numerous type of family households are 2-person households, comprising 68, and the most common type of nonfamily households are 1-person households, comprising 38.
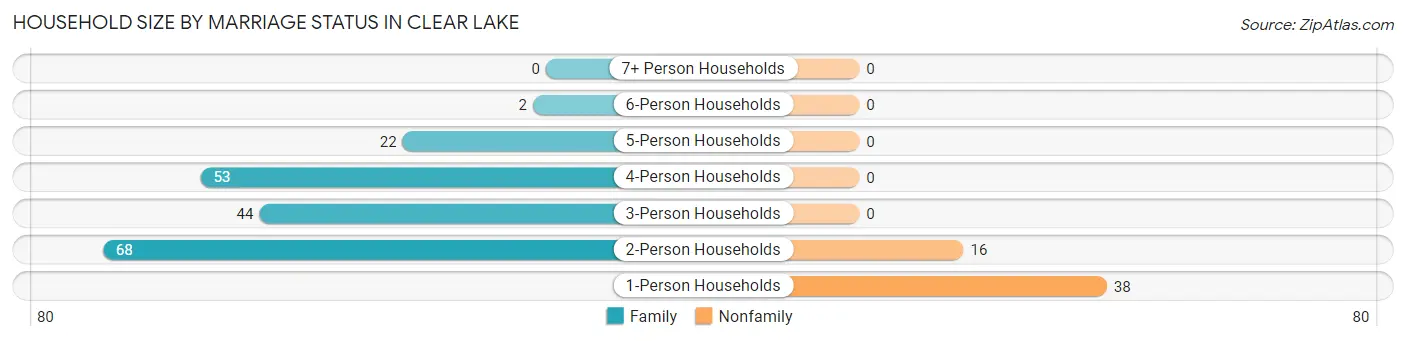
| Household Size | Family Households | Nonfamily Households |
| 1-Person Households | - | 38 (15.6%) |
| 2-Person Households | 68 (28.0%) | 16 (6.6%) |
| 3-Person Households | 44 (18.1%) | 0 (0.0%) |
| 4-Person Households | 53 (21.8%) | 0 (0.0%) |
| 5-Person Households | 22 (9.0%) | 0 (0.0%) |
| 6-Person Households | 2 (0.8%) | 0 (0.0%) |
| 7+ Person Households | 0 (0.0%) | 0 (0.0%) |
| Total | 189 (77.8%) | 54 (22.2%) |
Female Fertility in Clear Lake
Fertility by Age in Clear Lake
Average fertility rate in Clear Lake is 29.0 births per 1,000 women. Women in the age bracket of 20 to 34 years have the highest fertility rate with 58.0 births per 1,000 women. Women in the age bracket of 20 to 34 years acount for 100.0% of all women with births.
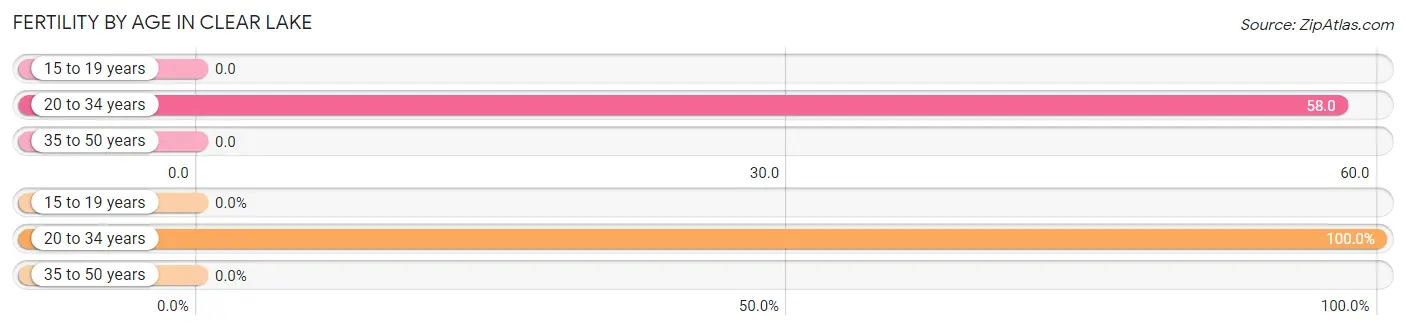
| Age Bracket | Women with Births | Births / 1,000 Women |
| 15 to 19 years | 0 (0.0%) | 0.0 |
| 20 to 34 years | 6 (100.0%) | 58.0 |
| 35 to 50 years | 0 (0.0%) | 0.0 |
| Total | 6 (100.0%) | 29.0 |
Fertility by Age by Marriage Status in Clear Lake
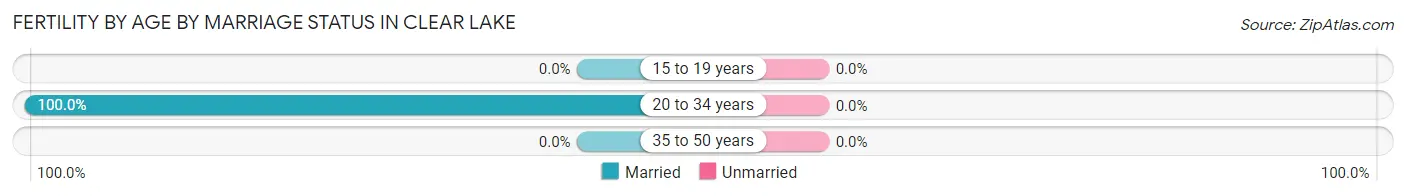
| Age Bracket | Married | Unmarried |
| 15 to 19 years | 0 (0.0%) | 0 (0.0%) |
| 20 to 34 years | 6 (100.0%) | 0 (0.0%) |
| 35 to 50 years | 0 (0.0%) | 0 (0.0%) |
| Total | 6 (100.0%) | 0 (0.0%) |
Fertility by Education in Clear Lake
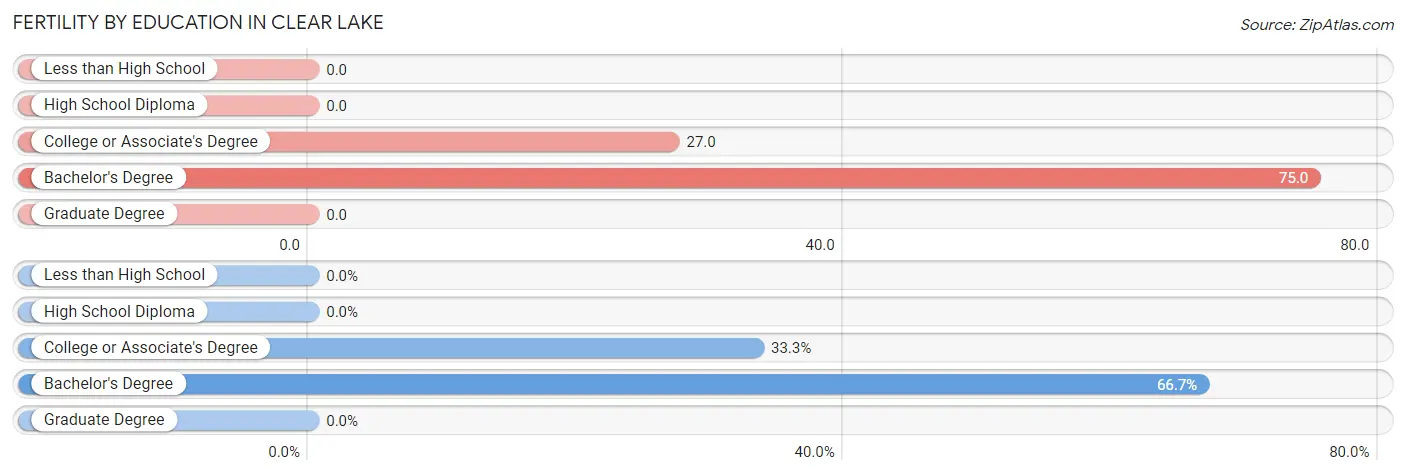
| Educational Attainment | Women with Births | Births / 1,000 Women |
| Less than High School | 0 (0.0%) | 0.0 |
| High School Diploma | 0 (0.0%) | 0.0 |
| College or Associate's Degree | 2 (33.3%) | 27.0 |
| Bachelor's Degree | 4 (66.7%) | 75.0 |
| Graduate Degree | 0 (0.0%) | 0.0 |
| Total | 6 (100.0%) | 29.0 |
Fertility by Education by Marriage Status in Clear Lake
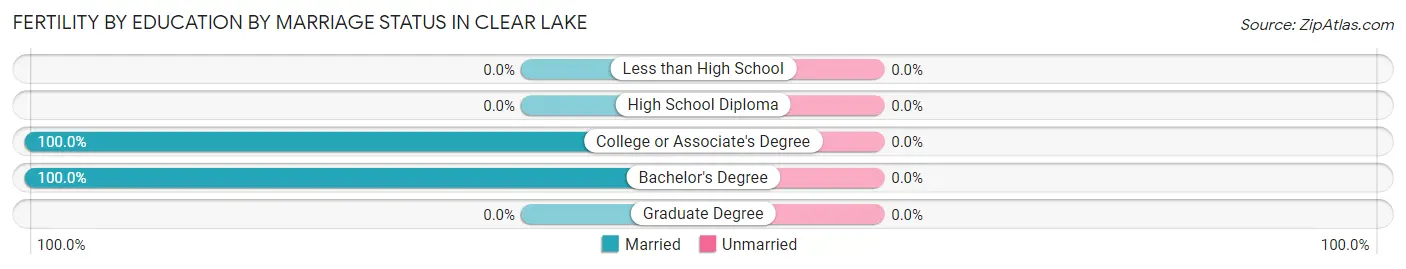
| Educational Attainment | Married | Unmarried |
| Less than High School | 0 (0.0%) | 0 (0.0%) |
| High School Diploma | 0 (0.0%) | 0 (0.0%) |
| College or Associate's Degree | 2 (100.0%) | 0 (0.0%) |
| Bachelor's Degree | 4 (100.0%) | 0 (0.0%) |
| Graduate Degree | 0 (0.0%) | 0 (0.0%) |
| Total | 6 (100.0%) | 0 (0.0%) |
Employment Characteristics in Clear Lake
Employment by Class of Employer in Clear Lake
Among the 415 employed individuals in Clear Lake, private company employees (316 | 76.1%), not-for-profit organizations (35 | 8.4%), and self-employed (incorporated) (23 | 5.5%) make up the most common classes of employment.
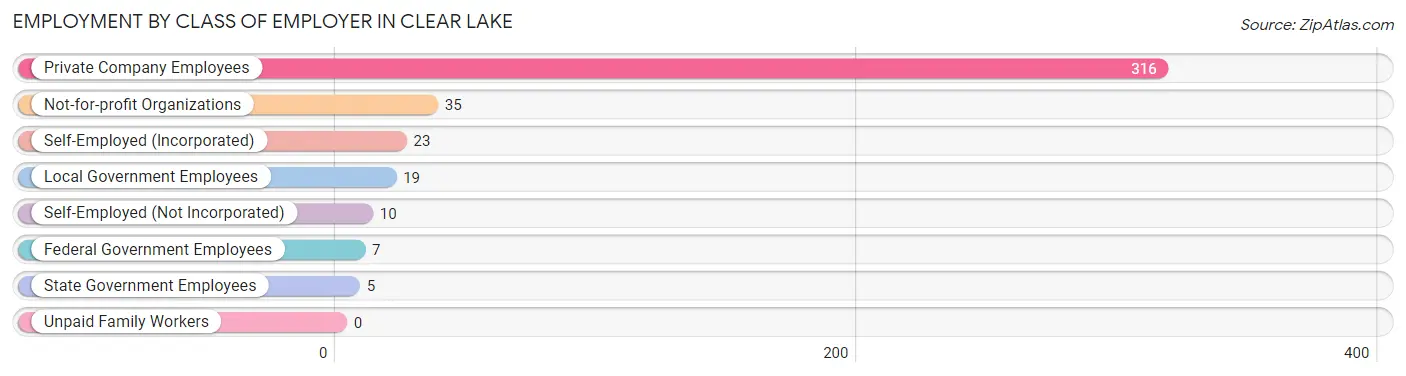
| Employer Class | # Employees | % Employees |
| Private Company Employees | 316 | 76.1% |
| Self-Employed (Incorporated) | 23 | 5.5% |
| Self-Employed (Not Incorporated) | 10 | 2.4% |
| Not-for-profit Organizations | 35 | 8.4% |
| Local Government Employees | 19 | 4.6% |
| State Government Employees | 5 | 1.2% |
| Federal Government Employees | 7 | 1.7% |
| Unpaid Family Workers | 0 | 0.0% |
| Total | 415 | 100.0% |
Employment Status by Age in Clear Lake
According to the labor force statistics for Clear Lake, out of the total population over 16 years of age (507), 87.4% or 443 individuals are in the labor force, with 6.1% or 27 of them unemployed. The age group with the highest labor force participation rate is 20 to 24 years, with 100.0% or 17 individuals in the labor force. Within the labor force, the 20 to 24 years age range has the highest percentage of unemployed individuals, with 23.5% or 4 of them being unemployed.
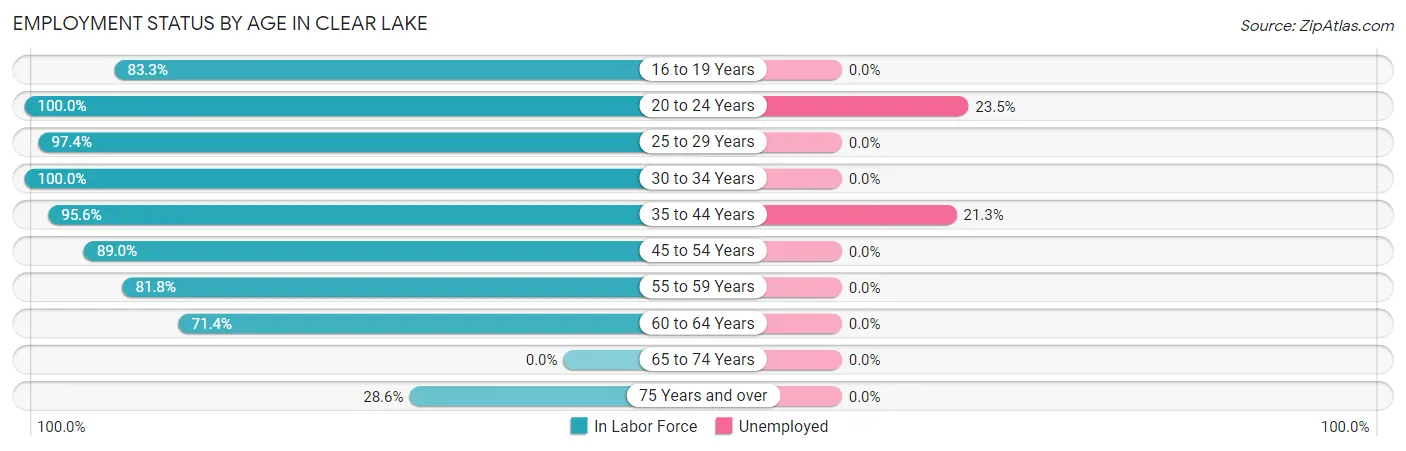
| Age Bracket | In Labor Force | Unemployed |
| 16 to 19 Years | 30 (83.3%) | 0 (0.0%) |
| 20 to 24 Years | 17 (100.0%) | 4 (23.5%) |
| 25 to 29 Years | 76 (97.4%) | 0 (0.0%) |
| 30 to 34 Years | 87 (100.0%) | 0 (0.0%) |
| 35 to 44 Years | 108 (95.6%) | 23 (21.3%) |
| 45 to 54 Years | 81 (89.0%) | 0 (0.0%) |
| 55 to 59 Years | 27 (81.8%) | 0 (0.0%) |
| 60 to 64 Years | 15 (71.4%) | 0 (0.0%) |
| 65 to 74 Years | 0 (0.0%) | 0 (0.0%) |
| 75 Years and over | 2 (28.6%) | 0 (0.0%) |
| Total | 443 (87.4%) | 27 (6.1%) |
Employment Status by Educational Attainment in Clear Lake
According to labor force statistics for Clear Lake, 93.1% of individuals (394) out of the total population between 25 and 64 years of age (423) are in the labor force, with 5.8% or 23 of them being unemployed. The group with the highest labor force participation rate are those with the educational attainment of less than high school, with 100.0% or 23 individuals in the labor force. Within the labor force, individuals with college / associate degree education have the highest percentage of unemployment, with 12.5% or 23 of them being unemployed.
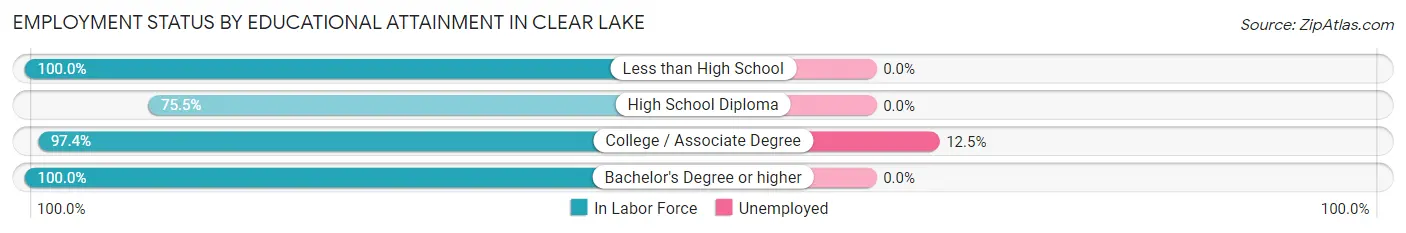
| Educational Attainment | In Labor Force | Unemployed |
| Less than High School | 23 (100.0%) | 0 (0.0%) |
| High School Diploma | 74 (75.5%) | 0 (0.0%) |
| College / Associate Degree | 184 (97.4%) | 24 (12.5%) |
| Bachelor's Degree or higher | 113 (100.0%) | 0 (0.0%) |
| Total | 394 (93.1%) | 25 (5.8%) |
Employment Occupations by Sex in Clear Lake
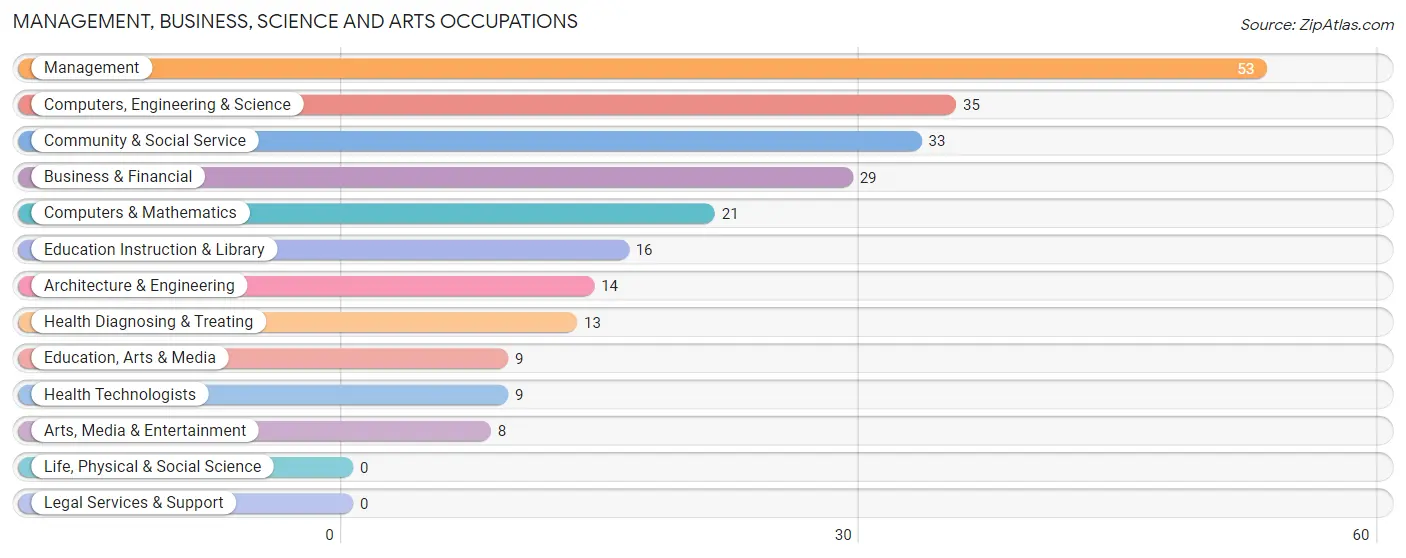
Management, Business, Science and Arts Occupations
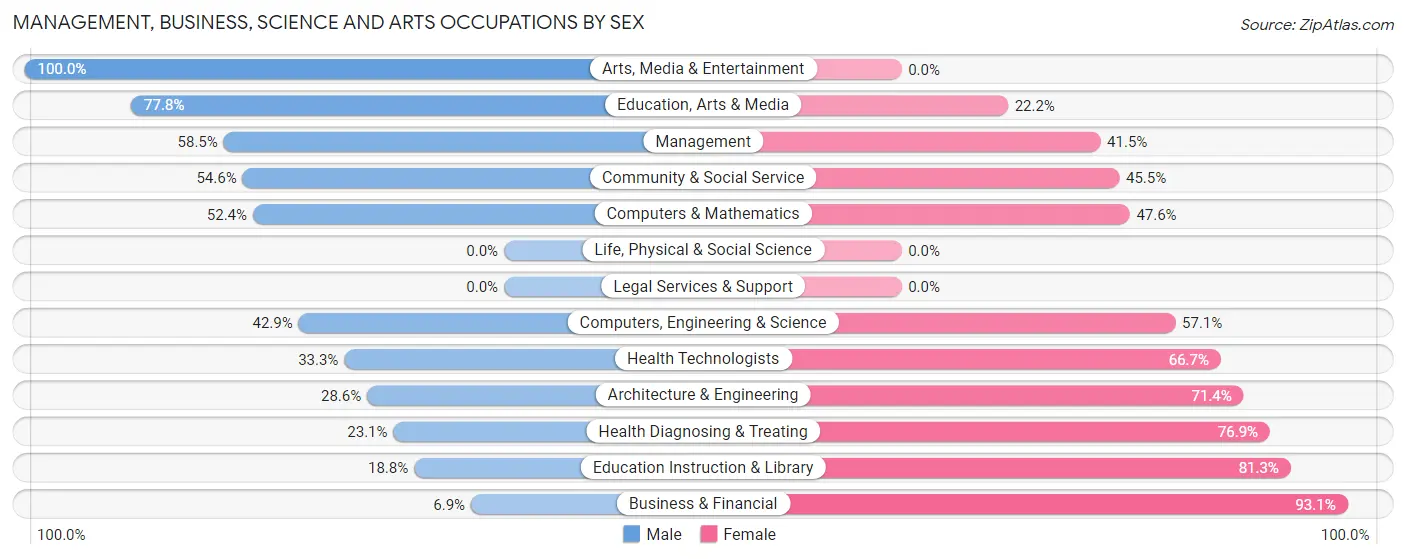
The most common Management, Business, Science and Arts occupations in Clear Lake are Management (53 | 12.7%), Computers, Engineering & Science (35 | 8.4%), Community & Social Service (33 | 7.9%), Business & Financial (29 | 7.0%), and Computers & Mathematics (21 | 5.1%).
Management, Business, Science and Arts Occupations by Sex
Within the Management, Business, Science and Arts occupations in Clear Lake, the most male-oriented occupations are Arts, Media & Entertainment (100.0%), Education, Arts & Media (77.8%), and Management (58.5%), while the most female-oriented occupations are Business & Financial (93.1%), Education Instruction & Library (81.2%), and Health Diagnosing & Treating (76.9%).
| Occupation | Male | Female |
| Management | 31 (58.5%) | 22 (41.5%) |
| Business & Financial | 2 (6.9%) | 27 (93.1%) |
| Computers, Engineering & Science | 15 (42.9%) | 20 (57.1%) |
| Computers & Mathematics | 11 (52.4%) | 10 (47.6%) |
| Architecture & Engineering | 4 (28.6%) | 10 (71.4%) |
| Life, Physical & Social Science | 0 (0.0%) | 0 (0.0%) |
| Community & Social Service | 18 (54.5%) | 15 (45.5%) |
| Education, Arts & Media | 7 (77.8%) | 2 (22.2%) |
| Legal Services & Support | 0 (0.0%) | 0 (0.0%) |
| Education Instruction & Library | 3 (18.8%) | 13 (81.2%) |
| Arts, Media & Entertainment | 8 (100.0%) | 0 (0.0%) |
| Health Diagnosing & Treating | 3 (23.1%) | 10 (76.9%) |
| Health Technologists | 3 (33.3%) | 6 (66.7%) |
| Total (Category) | 69 (42.3%) | 94 (57.7%) |
| Total (Overall) | 201 (48.3%) | 215 (51.7%) |
Services Occupations
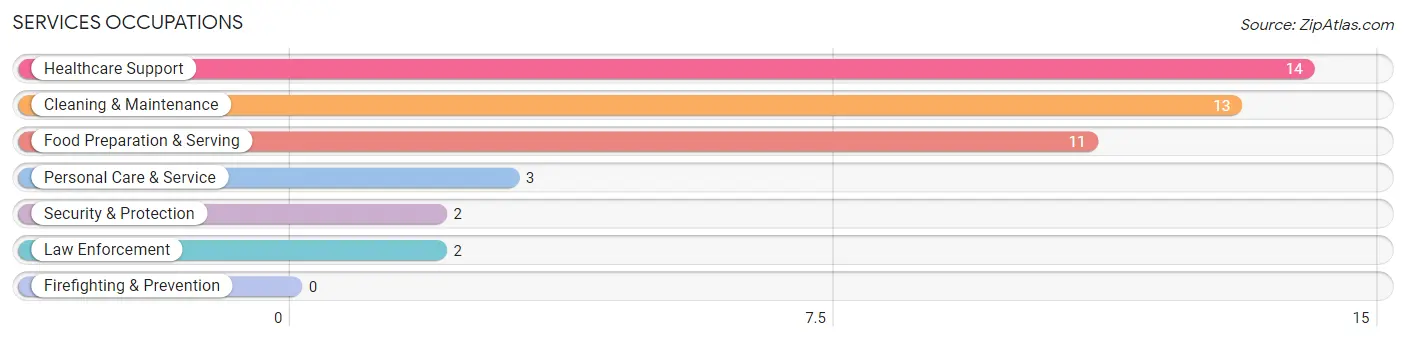
The most common Services occupations in Clear Lake are Healthcare Support (14 | 3.4%), Cleaning & Maintenance (13 | 3.1%), Food Preparation & Serving (11 | 2.6%), Personal Care & Service (3 | 0.7%), and Security & Protection (2 | 0.5%).
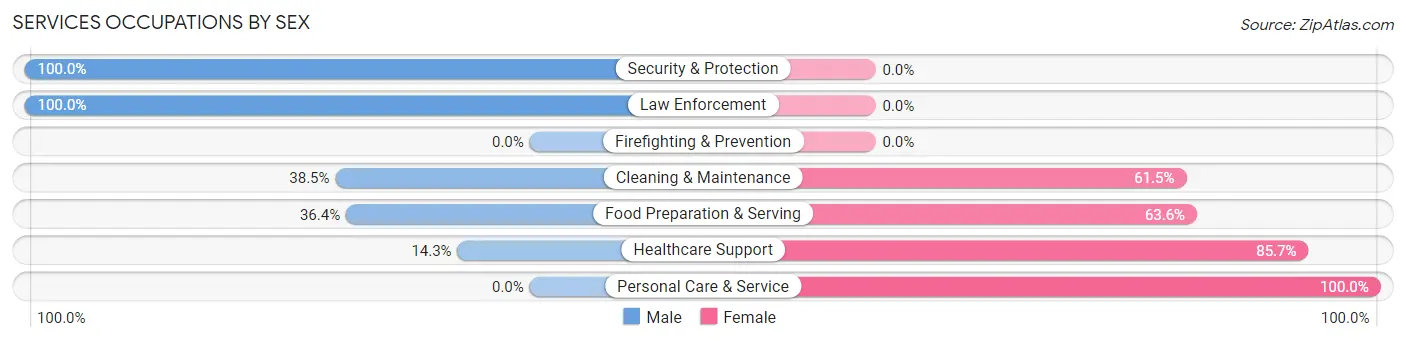
Services Occupations by Sex
Within the Services occupations in Clear Lake, the most male-oriented occupations are Security & Protection (100.0%), Law Enforcement (100.0%), and Cleaning & Maintenance (38.5%), while the most female-oriented occupations are Personal Care & Service (100.0%), Healthcare Support (85.7%), and Food Preparation & Serving (63.6%).
| Occupation | Male | Female |
| Healthcare Support | 2 (14.3%) | 12 (85.7%) |
| Security & Protection | 2 (100.0%) | 0 (0.0%) |
| Firefighting & Prevention | 0 (0.0%) | 0 (0.0%) |
| Law Enforcement | 2 (100.0%) | 0 (0.0%) |
| Food Preparation & Serving | 4 (36.4%) | 7 (63.6%) |
| Cleaning & Maintenance | 5 (38.5%) | 8 (61.5%) |
| Personal Care & Service | 0 (0.0%) | 3 (100.0%) |
| Total (Category) | 13 (30.2%) | 30 (69.8%) |
| Total (Overall) | 201 (48.3%) | 215 (51.7%) |
Sales and Office Occupations
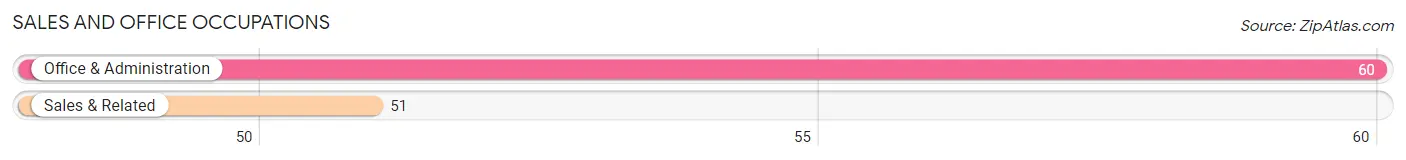
The most common Sales and Office occupations in Clear Lake are Office & Administration (60 | 14.4%), and Sales & Related (51 | 12.3%).
Sales and Office Occupations by Sex
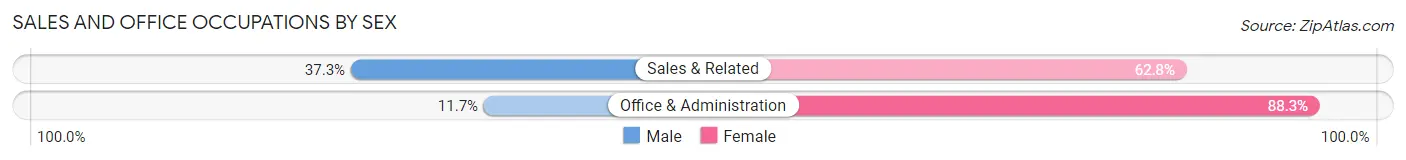
| Occupation | Male | Female |
| Sales & Related | 19 (37.2%) | 32 (62.7%) |
| Office & Administration | 7 (11.7%) | 53 (88.3%) |
| Total (Category) | 26 (23.4%) | 85 (76.6%) |
| Total (Overall) | 201 (48.3%) | 215 (51.7%) |
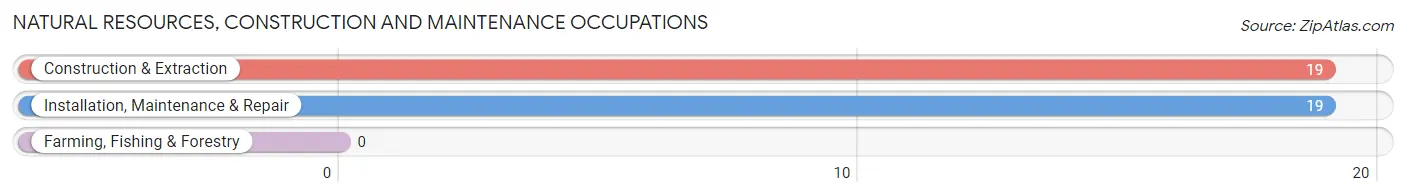
Natural Resources, Construction and Maintenance Occupations
The most common Natural Resources, Construction and Maintenance occupations in Clear Lake are Construction & Extraction (19 | 4.6%), and Installation, Maintenance & Repair (19 | 4.6%).
Natural Resources, Construction and Maintenance Occupations by Sex
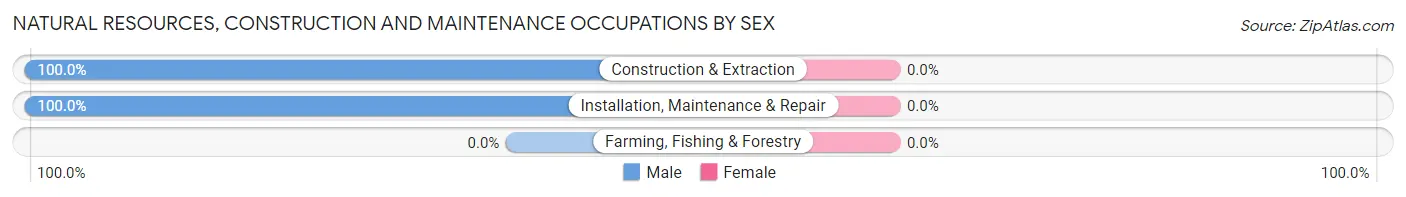
| Occupation | Male | Female |
| Farming, Fishing & Forestry | 0 (0.0%) | 0 (0.0%) |
| Construction & Extraction | 19 (100.0%) | 0 (0.0%) |
| Installation, Maintenance & Repair | 19 (100.0%) | 0 (0.0%) |
| Total (Category) | 38 (100.0%) | 0 (0.0%) |
| Total (Overall) | 201 (48.3%) | 215 (51.7%) |
Production, Transportation and Moving Occupations
The most common Production, Transportation and Moving occupations in Clear Lake are Production (38 | 9.1%), Transportation (15 | 3.6%), and Material Moving (8 | 1.9%).
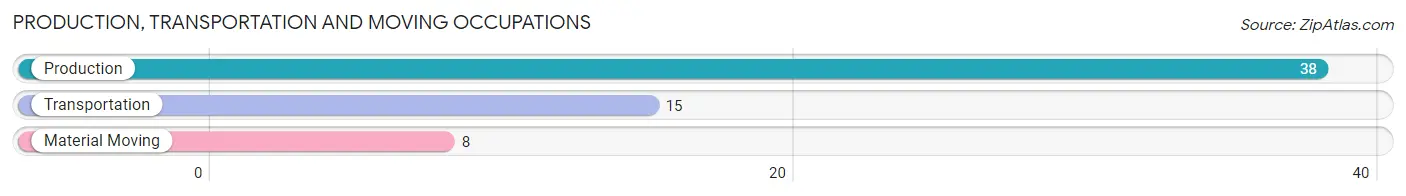
Production, Transportation and Moving Occupations by Sex
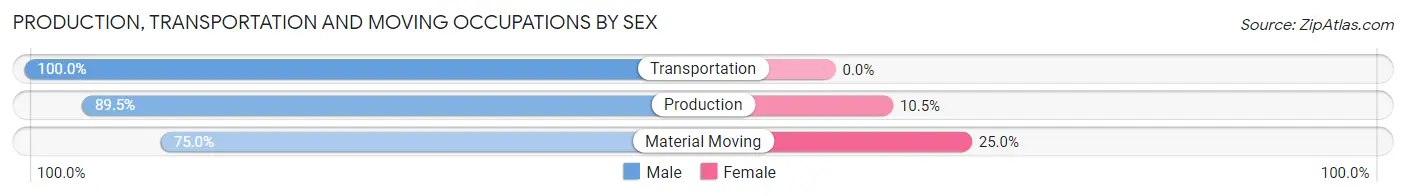
| Occupation | Male | Female |
| Production | 34 (89.5%) | 4 (10.5%) |
| Transportation | 15 (100.0%) | 0 (0.0%) |
| Material Moving | 6 (75.0%) | 2 (25.0%) |
| Total (Category) | 55 (90.2%) | 6 (9.8%) |
| Total (Overall) | 201 (48.3%) | 215 (51.7%) |
Employment Industries by Sex in Clear Lake
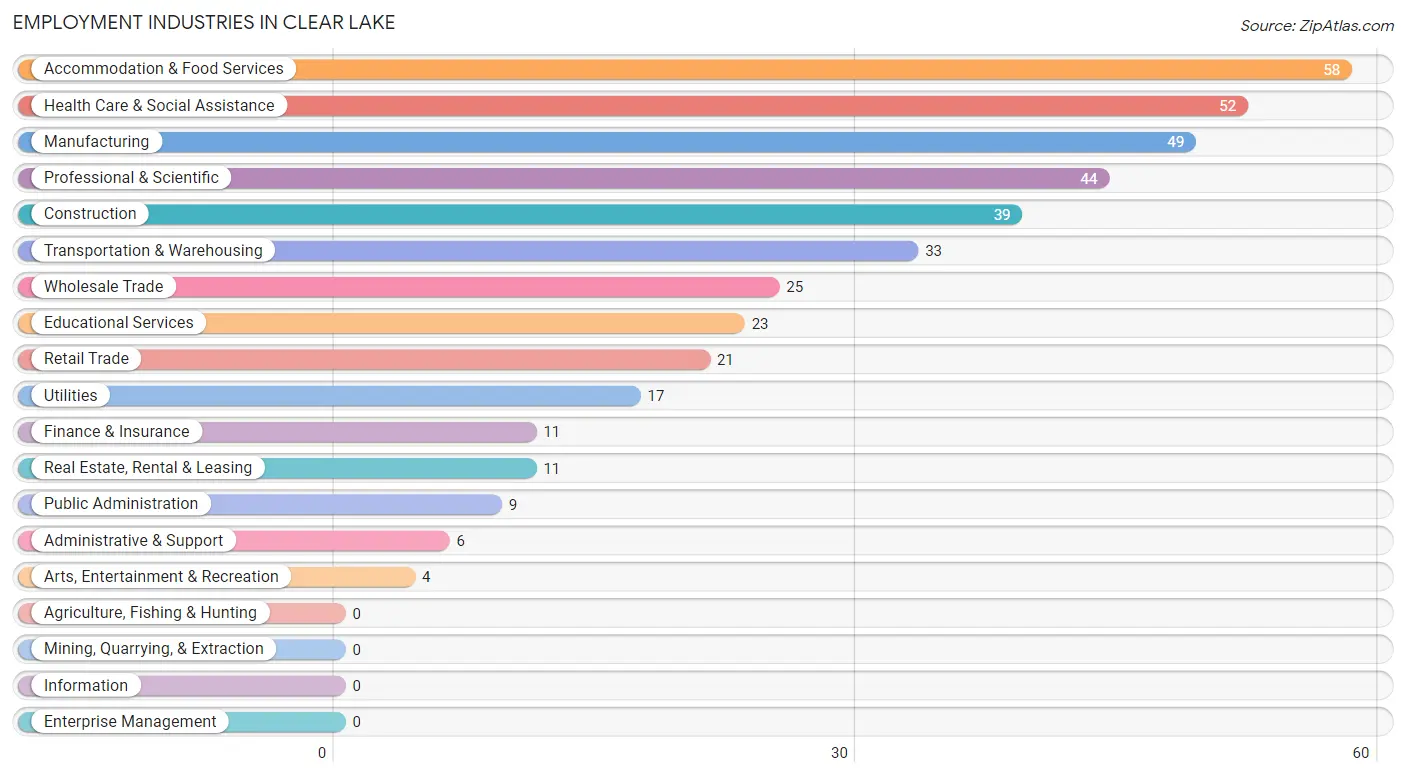
Employment Industries in Clear Lake
The major employment industries in Clear Lake include Accommodation & Food Services (58 | 13.9%), Health Care & Social Assistance (52 | 12.5%), Manufacturing (49 | 11.8%), Professional & Scientific (44 | 10.6%), and Construction (39 | 9.4%).
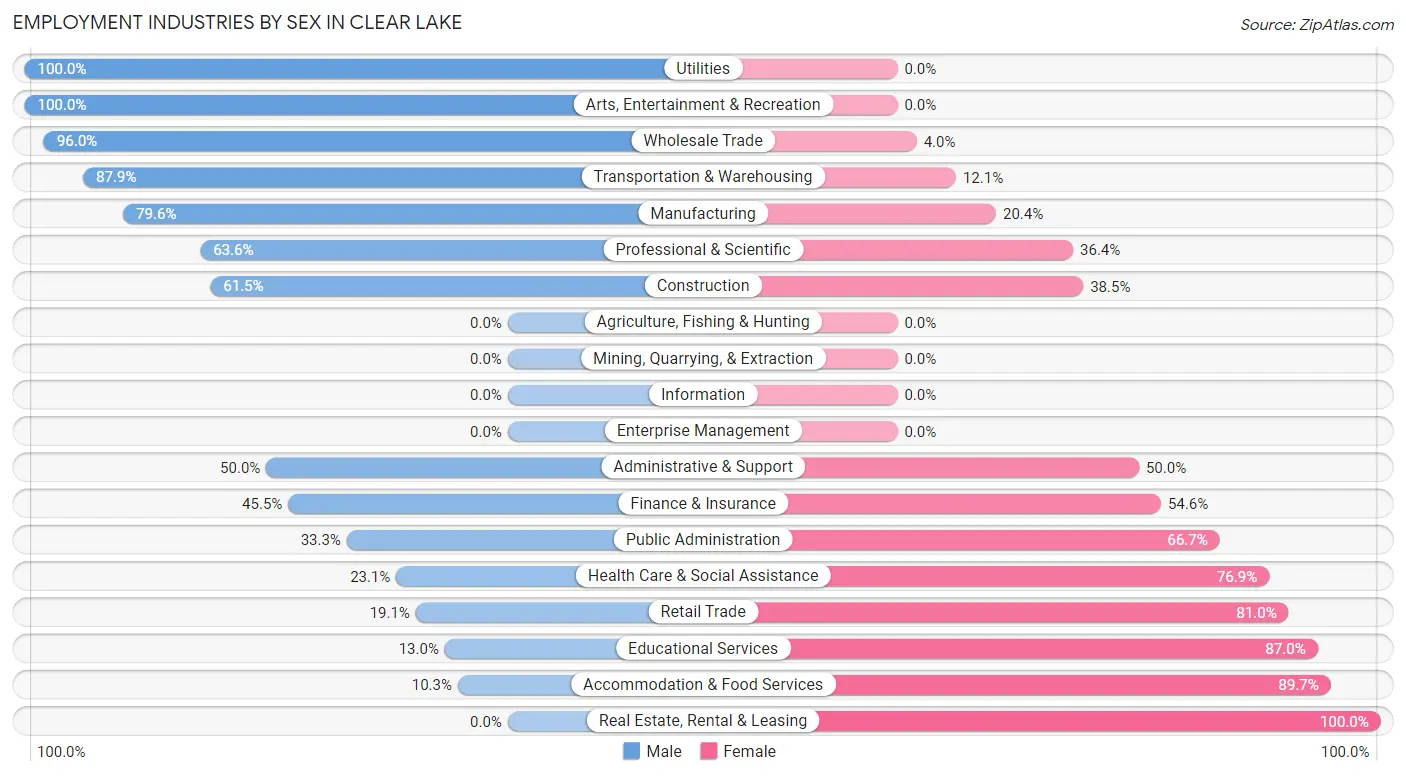
Employment Industries by Sex in Clear Lake
The Clear Lake industries that see more men than women are Utilities (100.0%), Arts, Entertainment & Recreation (100.0%), and Wholesale Trade (96.0%), whereas the industries that tend to have a higher number of women are Real Estate, Rental & Leasing (100.0%), Accommodation & Food Services (89.7%), and Educational Services (87.0%).
| Industry | Male | Female |
| Agriculture, Fishing & Hunting | 0 (0.0%) | 0 (0.0%) |
| Mining, Quarrying, & Extraction | 0 (0.0%) | 0 (0.0%) |
| Construction | 24 (61.5%) | 15 (38.5%) |
| Manufacturing | 39 (79.6%) | 10 (20.4%) |
| Wholesale Trade | 24 (96.0%) | 1 (4.0%) |
| Retail Trade | 4 (19.1%) | 17 (80.9%) |
| Transportation & Warehousing | 29 (87.9%) | 4 (12.1%) |
| Utilities | 17 (100.0%) | 0 (0.0%) |
| Information | 0 (0.0%) | 0 (0.0%) |
| Finance & Insurance | 5 (45.5%) | 6 (54.5%) |
| Real Estate, Rental & Leasing | 0 (0.0%) | 11 (100.0%) |
| Professional & Scientific | 28 (63.6%) | 16 (36.4%) |
| Enterprise Management | 0 (0.0%) | 0 (0.0%) |
| Administrative & Support | 3 (50.0%) | 3 (50.0%) |
| Educational Services | 3 (13.0%) | 20 (87.0%) |
| Health Care & Social Assistance | 12 (23.1%) | 40 (76.9%) |
| Arts, Entertainment & Recreation | 4 (100.0%) | 0 (0.0%) |
| Accommodation & Food Services | 6 (10.3%) | 52 (89.7%) |
| Public Administration | 3 (33.3%) | 6 (66.7%) |
| Total | 201 (48.3%) | 215 (51.7%) |
Education in Clear Lake
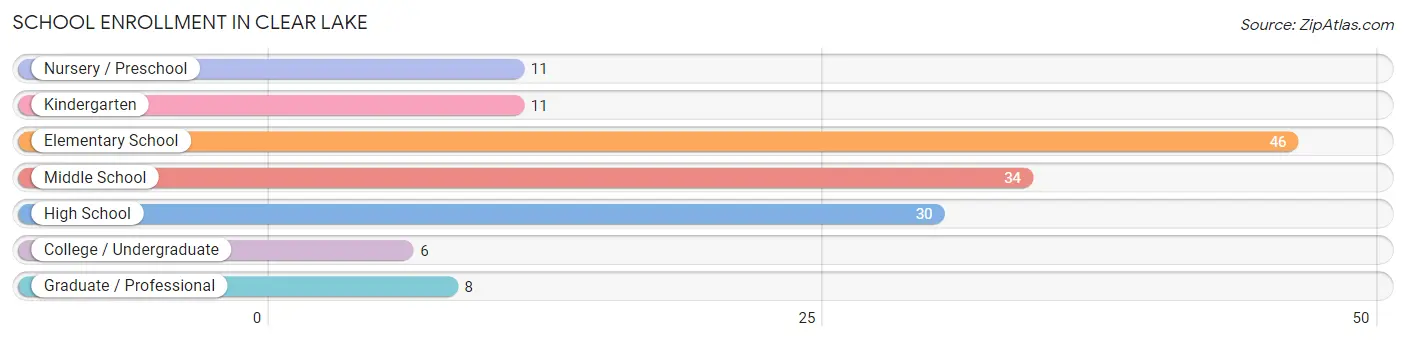
School Enrollment in Clear Lake
The most common levels of schooling among the 146 students in Clear Lake are elementary school (46 | 31.5%), middle school (34 | 23.3%), and high school (30 | 20.5%).
| School Level | # Students | % Students |
| Nursery / Preschool | 11 | 7.5% |
| Kindergarten | 11 | 7.5% |
| Elementary School | 46 | 31.5% |
| Middle School | 34 | 23.3% |
| High School | 30 | 20.5% |
| College / Undergraduate | 6 | 4.1% |
| Graduate / Professional | 8 | 5.5% |
| Total | 146 | 100.0% |
School Enrollment by Age by Funding Source in Clear Lake
Out of a total of 146 students who are enrolled in schools in Clear Lake, 11 (7.5%) attend a private institution, while the remaining 135 (92.5%) are enrolled in public schools. The age group of 18 to 19 year olds has the highest likelihood of being enrolled in private schools, with 2 (100.0% in the age bracket) enrolled. Conversely, the age group of 3 to 4 year olds has the lowest likelihood of being enrolled in a private school, with 3 (100.0% in the age bracket) attending a public institution.
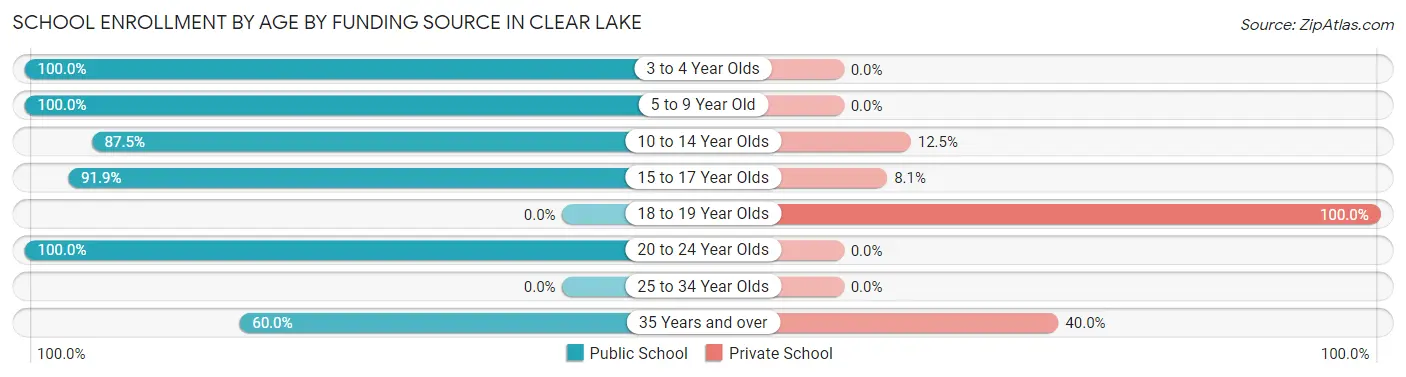
| Age Bracket | Public School | Private School |
| 3 to 4 Year Olds | 3 (100.0%) | 0 (0.0%) |
| 5 to 9 Year Old | 60 (100.0%) | 0 (0.0%) |
| 10 to 14 Year Olds | 28 (87.5%) | 4 (12.5%) |
| 15 to 17 Year Olds | 34 (91.9%) | 3 (8.1%) |
| 18 to 19 Year Olds | 0 (0.0%) | 2 (100.0%) |
| 20 to 24 Year Olds | 7 (100.0%) | 0 (0.0%) |
| 25 to 34 Year Olds | 0 (0.0%) | 0 (0.0%) |
| 35 Years and over | 3 (60.0%) | 2 (40.0%) |
| Total | 135 (92.5%) | 11 (7.5%) |
Educational Attainment by Field of Study in Clear Lake
Science & technology (23 | 18.2%), business (23 | 18.2%), engineering (18 | 14.3%), education (12 | 9.5%), and social sciences (11 | 8.7%) are the most common fields of study among 126 individuals in Clear Lake who have obtained a bachelor's degree or higher.
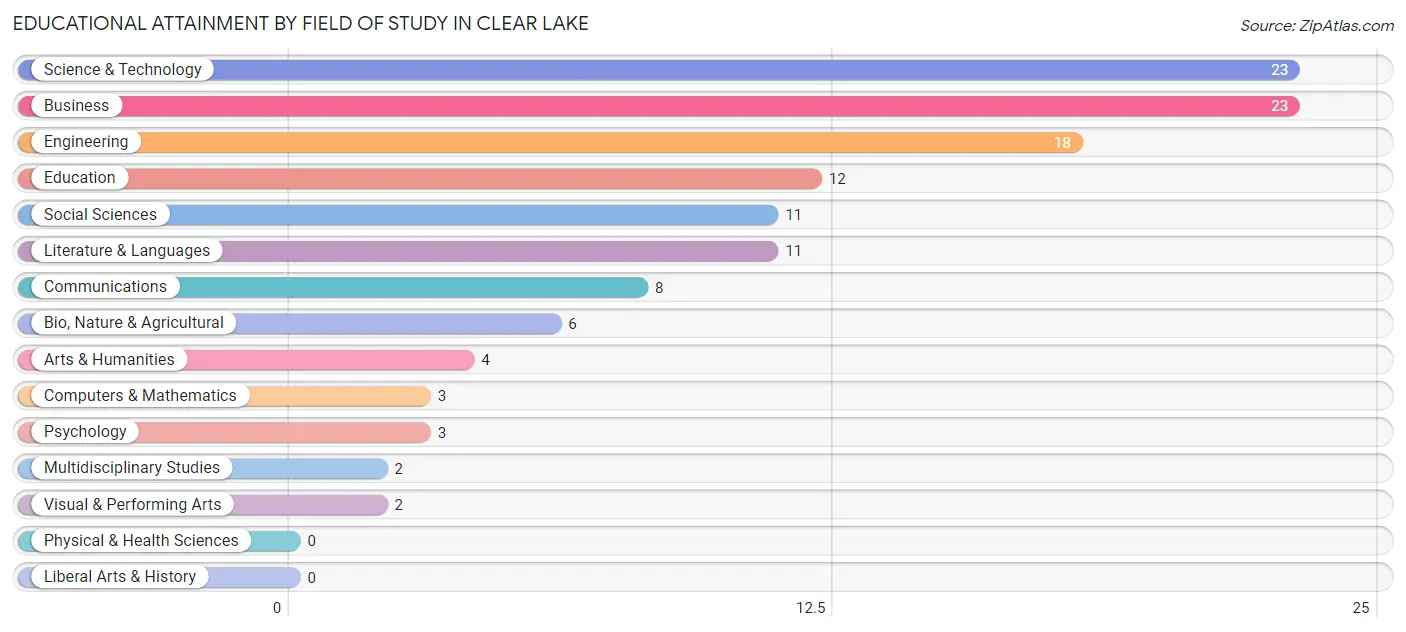
| Field of Study | # Graduates | % Graduates |
| Computers & Mathematics | 3 | 2.4% |
| Bio, Nature & Agricultural | 6 | 4.8% |
| Physical & Health Sciences | 0 | 0.0% |
| Psychology | 3 | 2.4% |
| Social Sciences | 11 | 8.7% |
| Engineering | 18 | 14.3% |
| Multidisciplinary Studies | 2 | 1.6% |
| Science & Technology | 23 | 18.2% |
| Business | 23 | 18.2% |
| Education | 12 | 9.5% |
| Literature & Languages | 11 | 8.7% |
| Liberal Arts & History | 0 | 0.0% |
| Visual & Performing Arts | 2 | 1.6% |
| Communications | 8 | 6.4% |
| Arts & Humanities | 4 | 3.2% |
| Total | 126 | 100.0% |
Transportation & Commute in Clear Lake
Vehicle Availability by Sex in Clear Lake
The most prevalent vehicle ownership categories in Clear Lake are males with 2 vehicles (98, accounting for 49.0%) and females with 2 vehicles (85, making up 45.6%).
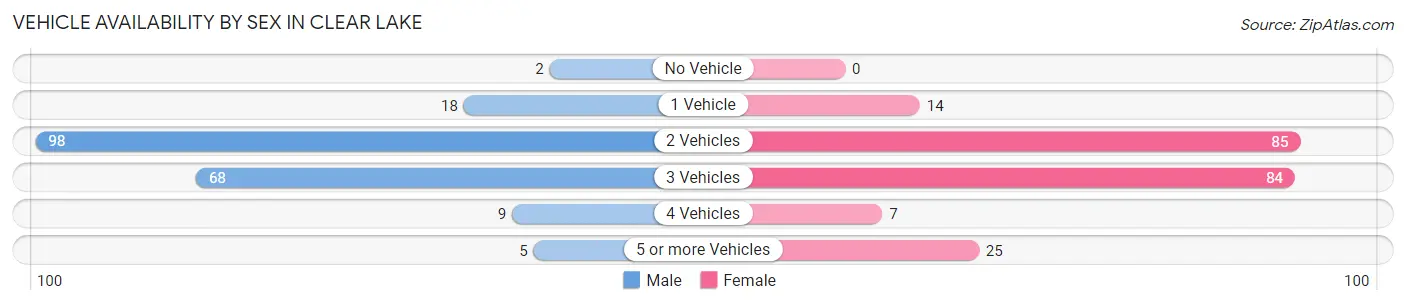
| Vehicles Available | Male | Female |
| No Vehicle | 2 (1.0%) | 0 (0.0%) |
| 1 Vehicle | 18 (9.0%) | 14 (6.5%) |
| 2 Vehicles | 98 (49.0%) | 85 (39.5%) |
| 3 Vehicles | 68 (34.0%) | 84 (39.1%) |
| 4 Vehicles | 9 (4.5%) | 7 (3.3%) |
| 5 or more Vehicles | 5 (2.5%) | 25 (11.6%) |
| Total | 200 (100.0%) | 215 (100.0%) |
Commute Time in Clear Lake
The most frequently occuring commute durations in Clear Lake are 20 to 24 minutes (79 commuters, 23.3%), 30 to 34 minutes (42 commuters, 12.4%), and 35 to 39 minutes (37 commuters, 10.9%).
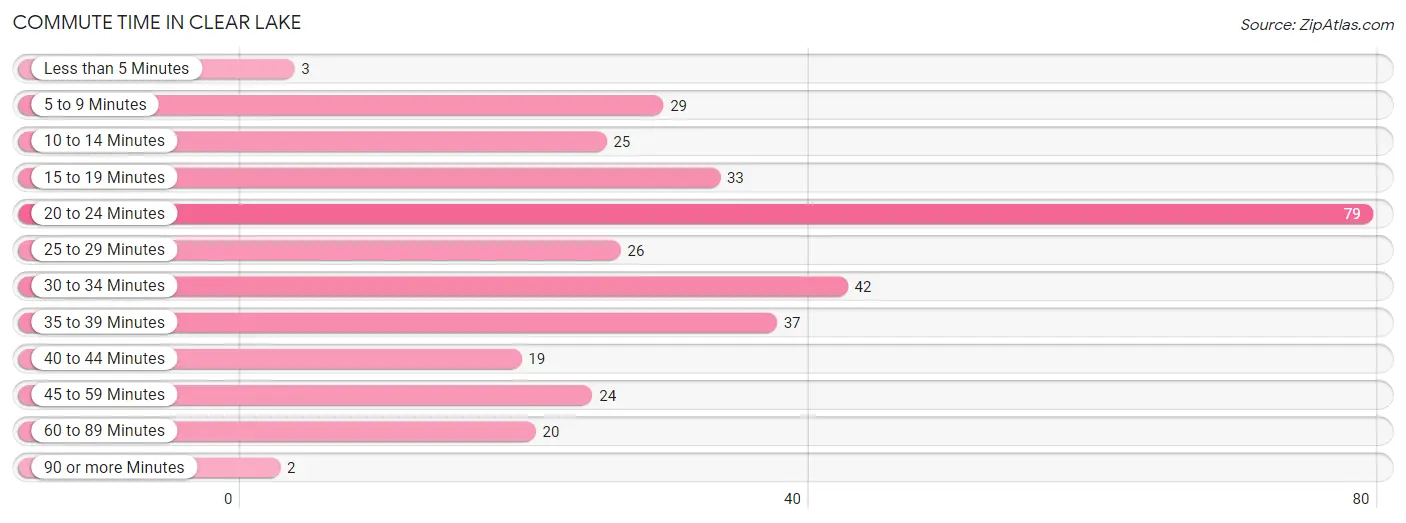
| Commute Time | # Commuters | % Commuters |
| Less than 5 Minutes | 3 | 0.9% |
| 5 to 9 Minutes | 29 | 8.6% |
| 10 to 14 Minutes | 25 | 7.4% |
| 15 to 19 Minutes | 33 | 9.7% |
| 20 to 24 Minutes | 79 | 23.3% |
| 25 to 29 Minutes | 26 | 7.7% |
| 30 to 34 Minutes | 42 | 12.4% |
| 35 to 39 Minutes | 37 | 10.9% |
| 40 to 44 Minutes | 19 | 5.6% |
| 45 to 59 Minutes | 24 | 7.1% |
| 60 to 89 Minutes | 20 | 5.9% |
| 90 or more Minutes | 2 | 0.6% |
Commute Time by Sex in Clear Lake
The most common commute times in Clear Lake are 20 to 24 minutes (27 commuters, 16.3%) for males and 20 to 24 minutes (52 commuters, 30.1%) for females.
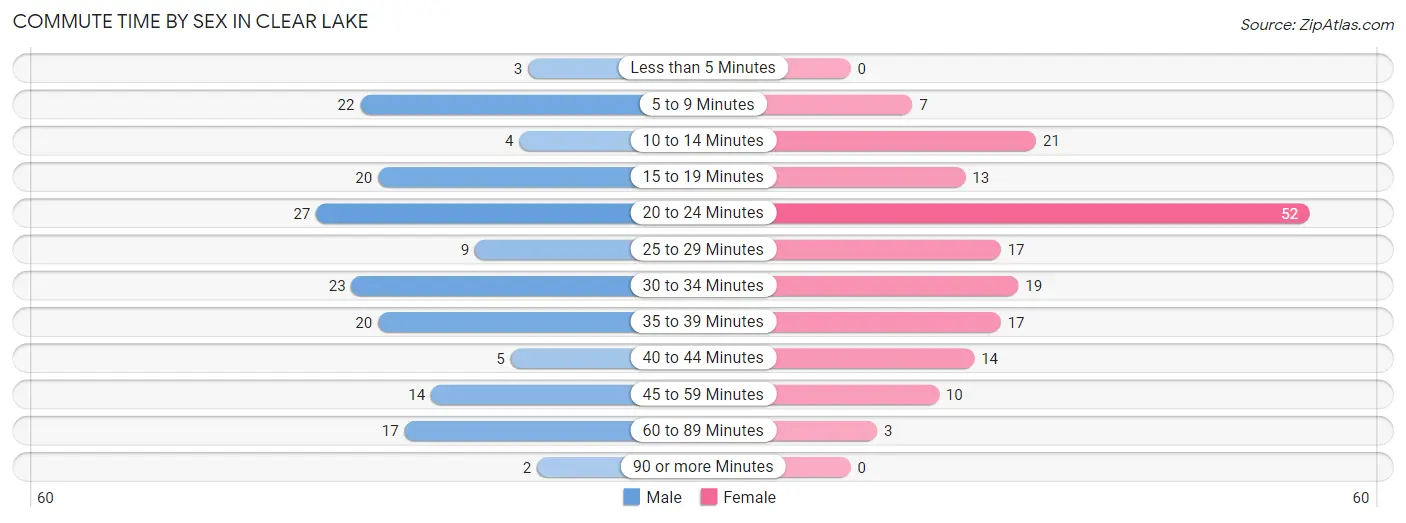
| Commute Time | Male | Female |
| Less than 5 Minutes | 3 (1.8%) | 0 (0.0%) |
| 5 to 9 Minutes | 22 (13.3%) | 7 (4.1%) |
| 10 to 14 Minutes | 4 (2.4%) | 21 (12.1%) |
| 15 to 19 Minutes | 20 (12.0%) | 13 (7.5%) |
| 20 to 24 Minutes | 27 (16.3%) | 52 (30.1%) |
| 25 to 29 Minutes | 9 (5.4%) | 17 (9.8%) |
| 30 to 34 Minutes | 23 (13.9%) | 19 (11.0%) |
| 35 to 39 Minutes | 20 (12.0%) | 17 (9.8%) |
| 40 to 44 Minutes | 5 (3.0%) | 14 (8.1%) |
| 45 to 59 Minutes | 14 (8.4%) | 10 (5.8%) |
| 60 to 89 Minutes | 17 (10.2%) | 3 (1.7%) |
| 90 or more Minutes | 2 (1.2%) | 0 (0.0%) |
Time of Departure to Work by Sex in Clear Lake
The most frequent times of departure to work in Clear Lake are 5:30 AM to 5:59 AM (32, 19.3%) for males and 7:00 AM to 7:29 AM (43, 24.9%) for females.
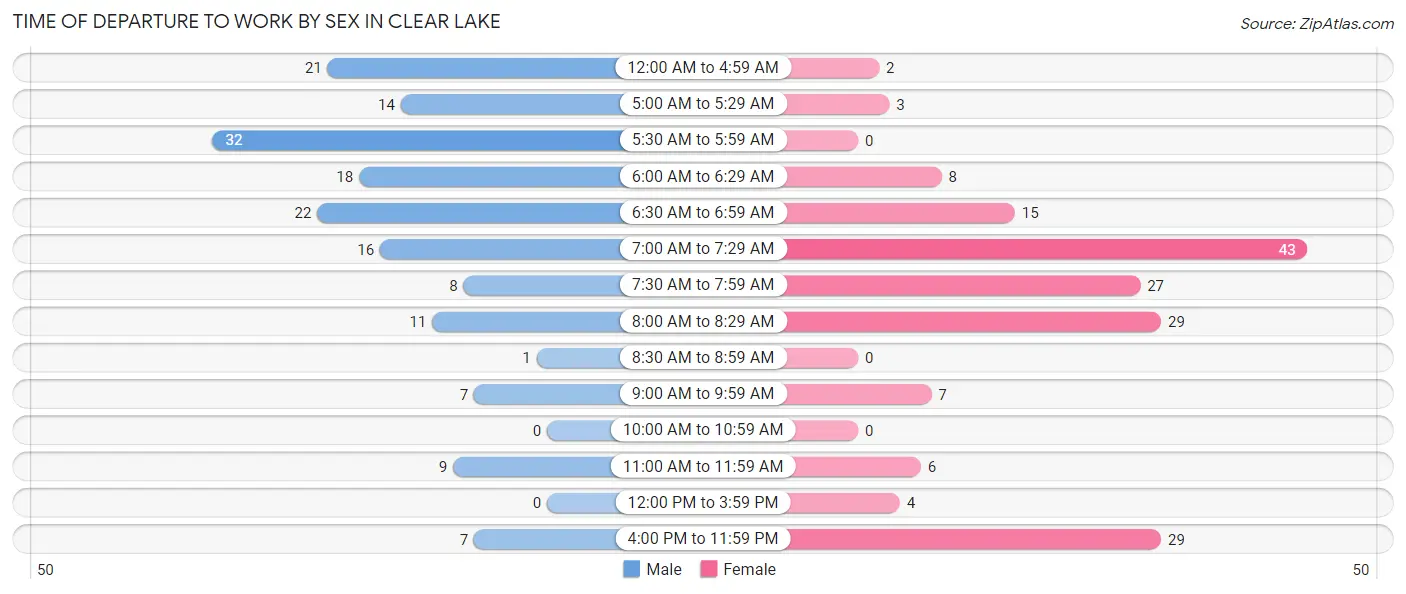
| Time of Departure | Male | Female |
| 12:00 AM to 4:59 AM | 21 (12.7%) | 2 (1.2%) |
| 5:00 AM to 5:29 AM | 14 (8.4%) | 3 (1.7%) |
| 5:30 AM to 5:59 AM | 32 (19.3%) | 0 (0.0%) |
| 6:00 AM to 6:29 AM | 18 (10.8%) | 8 (4.6%) |
| 6:30 AM to 6:59 AM | 22 (13.3%) | 15 (8.7%) |
| 7:00 AM to 7:29 AM | 16 (9.6%) | 43 (24.9%) |
| 7:30 AM to 7:59 AM | 8 (4.8%) | 27 (15.6%) |
| 8:00 AM to 8:29 AM | 11 (6.6%) | 29 (16.8%) |
| 8:30 AM to 8:59 AM | 1 (0.6%) | 0 (0.0%) |
| 9:00 AM to 9:59 AM | 7 (4.2%) | 7 (4.1%) |
| 10:00 AM to 10:59 AM | 0 (0.0%) | 0 (0.0%) |
| 11:00 AM to 11:59 AM | 9 (5.4%) | 6 (3.5%) |
| 12:00 PM to 3:59 PM | 0 (0.0%) | 4 (2.3%) |
| 4:00 PM to 11:59 PM | 7 (4.2%) | 29 (16.8%) |
| Total | 166 (100.0%) | 173 (100.0%) |
Housing Occupancy in Clear Lake
Occupancy by Ownership in Clear Lake
Of the total 243 dwellings in Clear Lake, owner-occupied units account for 209 (86.0%), while renter-occupied units make up 34 (14.0%).
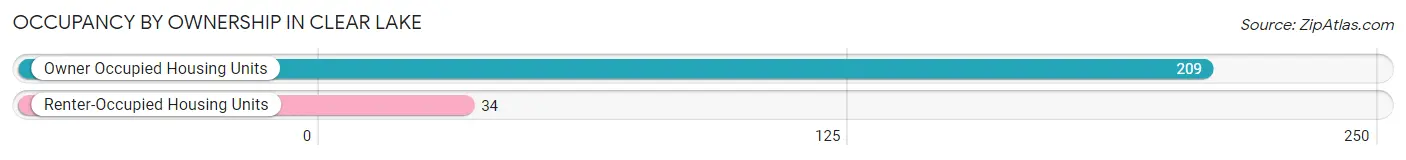
| Occupancy | # Housing Units | % Housing Units |
| Owner Occupied Housing Units | 209 | 86.0% |
| Renter-Occupied Housing Units | 34 | 14.0% |
| Total Occupied Housing Units | 243 | 100.0% |
Occupancy by Household Size in Clear Lake
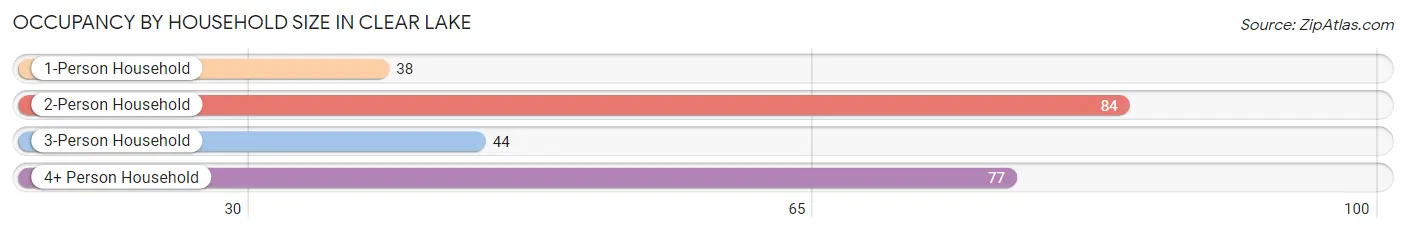
| Household Size | # Housing Units | % Housing Units |
| 1-Person Household | 38 | 15.6% |
| 2-Person Household | 84 | 34.6% |
| 3-Person Household | 44 | 18.1% |
| 4+ Person Household | 77 | 31.7% |
| Total Housing Units | 243 | 100.0% |
Occupancy by Ownership by Household Size in Clear Lake
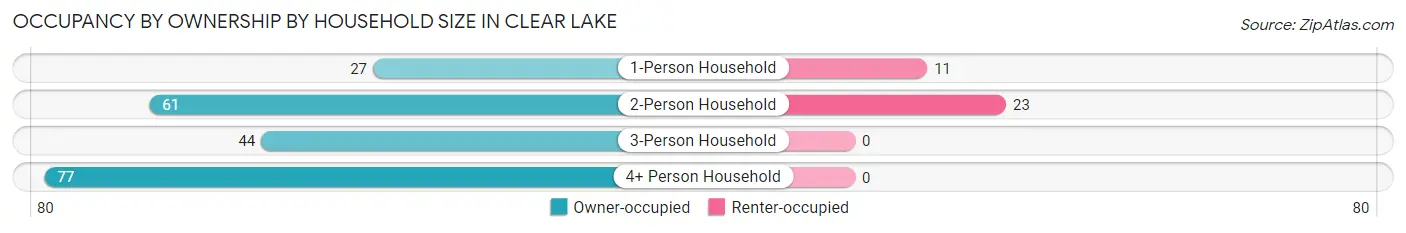
| Household Size | Owner-occupied | Renter-occupied |
| 1-Person Household | 27 (71.1%) | 11 (28.9%) |
| 2-Person Household | 61 (72.6%) | 23 (27.4%) |
| 3-Person Household | 44 (100.0%) | 0 (0.0%) |
| 4+ Person Household | 77 (100.0%) | 0 (0.0%) |
| Total Housing Units | 209 (86.0%) | 34 (14.0%) |
Occupancy by Educational Attainment in Clear Lake
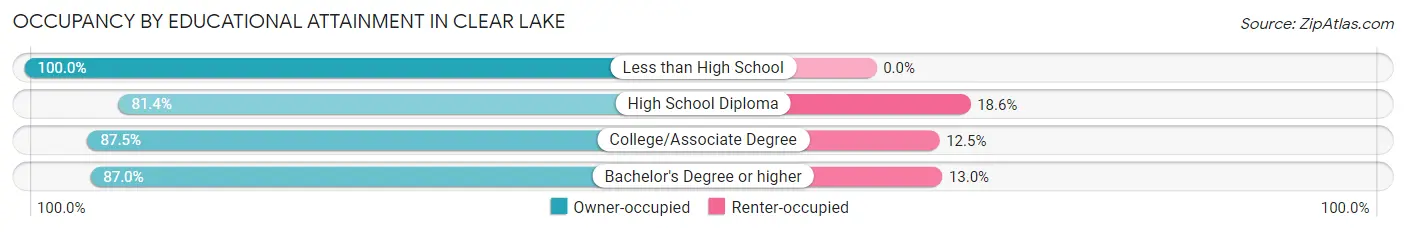
| Household Size | Owner-occupied | Renter-occupied |
| Less than High School | 3 (100.0%) | 0 (0.0%) |
| High School Diploma | 48 (81.4%) | 11 (18.6%) |
| College/Associate Degree | 98 (87.5%) | 14 (12.5%) |
| Bachelor's Degree or higher | 60 (87.0%) | 9 (13.0%) |
Occupancy by Age of Householder in Clear Lake
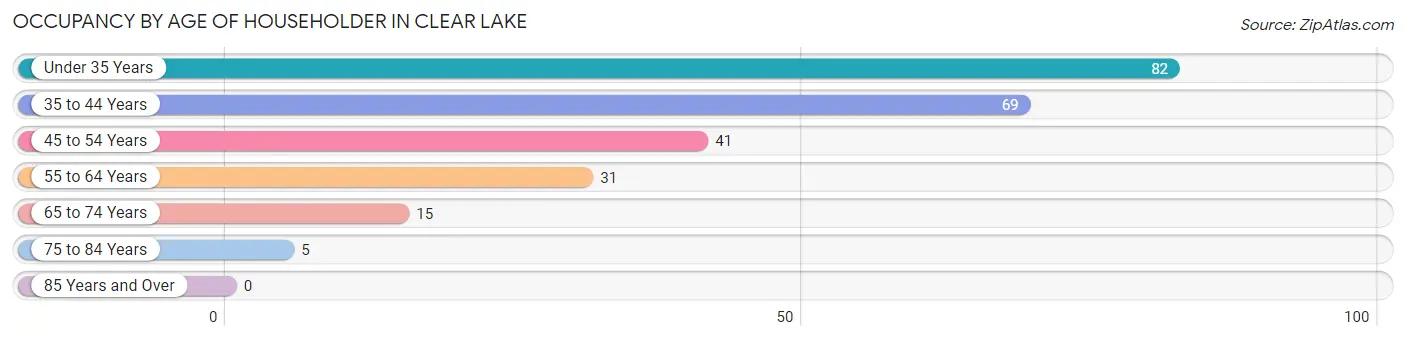
| Age Bracket | # Households | % Households |
| Under 35 Years | 82 | 33.7% |
| 35 to 44 Years | 69 | 28.4% |
| 45 to 54 Years | 41 | 16.9% |
| 55 to 64 Years | 31 | 12.8% |
| 65 to 74 Years | 15 | 6.2% |
| 75 to 84 Years | 5 | 2.1% |
| 85 Years and Over | 0 | 0.0% |
| Total | 243 | 100.0% |
Housing Finances in Clear Lake
Median Income by Occupancy in Clear Lake

| Occupancy Type | # Households | Median Income |
| Owner-Occupied | 209 (86.0%) | $106,250 |
| Renter-Occupied | 34 (14.0%) | $0 |
| Average | 243 (100.0%) | $105,724 |
Occupancy by Householder Income Bracket in Clear Lake
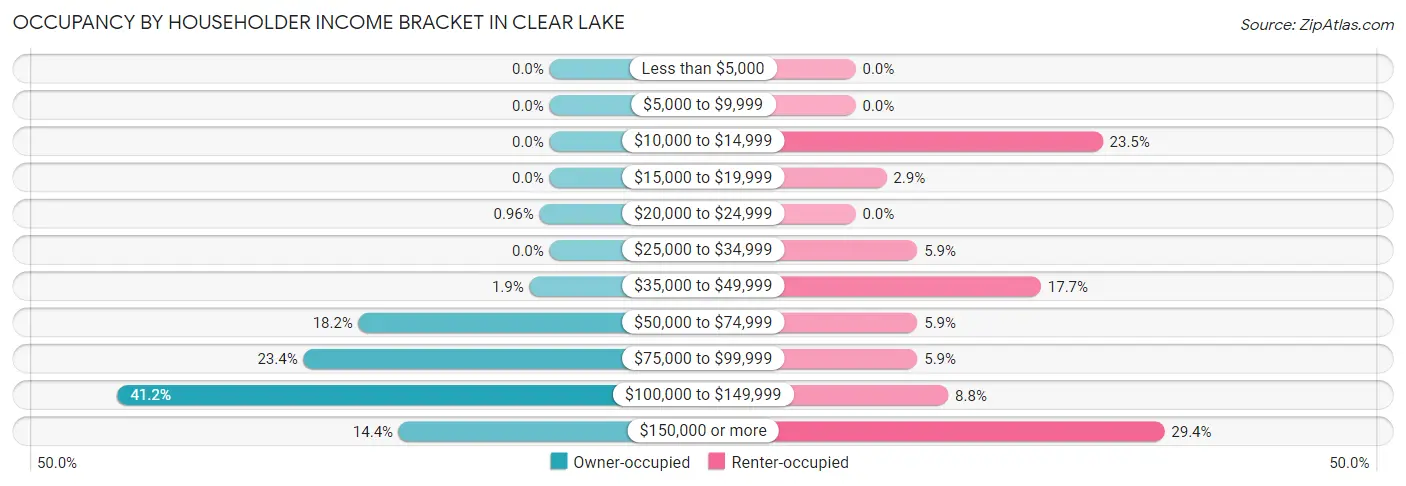
| Income Bracket | Owner-occupied | Renter-occupied |
| Less than $5,000 | 0 (0.0%) | 0 (0.0%) |
| $5,000 to $9,999 | 0 (0.0%) | 0 (0.0%) |
| $10,000 to $14,999 | 0 (0.0%) | 8 (23.5%) |
| $15,000 to $19,999 | 0 (0.0%) | 1 (2.9%) |
| $20,000 to $24,999 | 2 (1.0%) | 0 (0.0%) |
| $25,000 to $34,999 | 0 (0.0%) | 2 (5.9%) |
| $35,000 to $49,999 | 4 (1.9%) | 6 (17.6%) |
| $50,000 to $74,999 | 38 (18.2%) | 2 (5.9%) |
| $75,000 to $99,999 | 49 (23.4%) | 2 (5.9%) |
| $100,000 to $149,999 | 86 (41.1%) | 3 (8.8%) |
| $150,000 or more | 30 (14.3%) | 10 (29.4%) |
| Total | 209 (100.0%) | 34 (100.0%) |
Monthly Housing Cost Tiers in Clear Lake
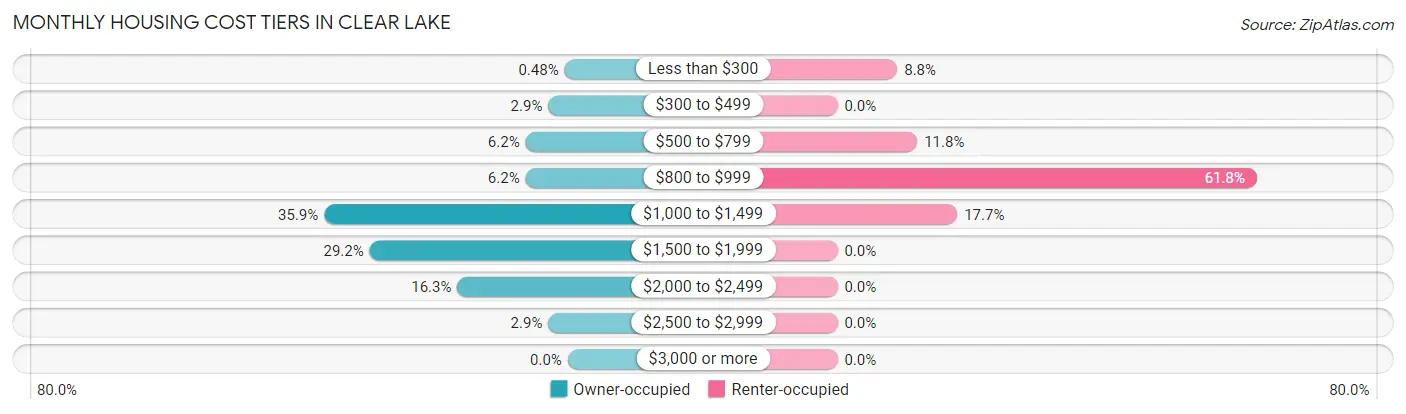
| Monthly Cost | Owner-occupied | Renter-occupied |
| Less than $300 | 1 (0.5%) | 3 (8.8%) |
| $300 to $499 | 6 (2.9%) | 0 (0.0%) |
| $500 to $799 | 13 (6.2%) | 4 (11.8%) |
| $800 to $999 | 13 (6.2%) | 21 (61.8%) |
| $1,000 to $1,499 | 75 (35.9%) | 6 (17.6%) |
| $1,500 to $1,999 | 61 (29.2%) | 0 (0.0%) |
| $2,000 to $2,499 | 34 (16.3%) | 0 (0.0%) |
| $2,500 to $2,999 | 6 (2.9%) | 0 (0.0%) |
| $3,000 or more | 0 (0.0%) | 0 (0.0%) |
| Total | 209 (100.0%) | 34 (100.0%) |
Physical Housing Characteristics in Clear Lake
Housing Structures in Clear Lake
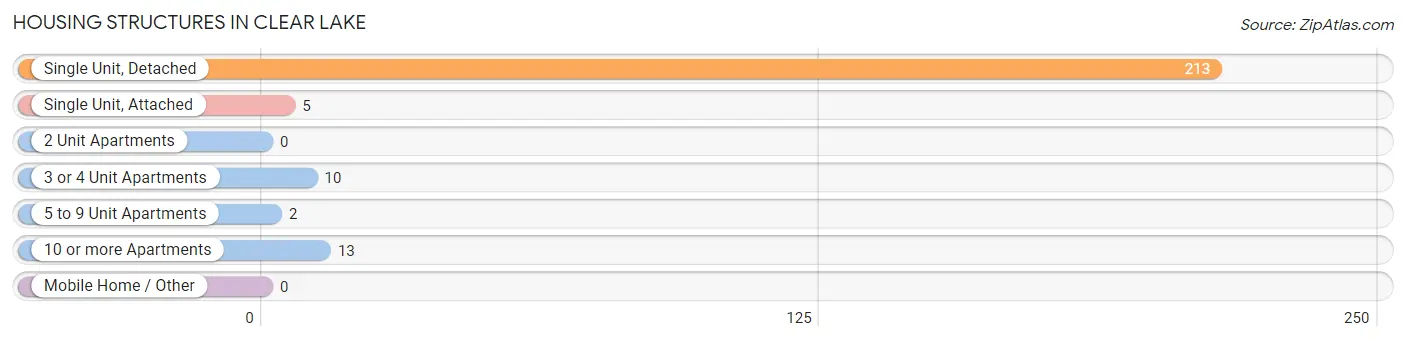
| Structure Type | # Housing Units | % Housing Units |
| Single Unit, Detached | 213 | 87.6% |
| Single Unit, Attached | 5 | 2.1% |
| 2 Unit Apartments | 0 | 0.0% |
| 3 or 4 Unit Apartments | 10 | 4.1% |
| 5 to 9 Unit Apartments | 2 | 0.8% |
| 10 or more Apartments | 13 | 5.3% |
| Mobile Home / Other | 0 | 0.0% |
| Total | 243 | 100.0% |
Housing Structures by Occupancy in Clear Lake
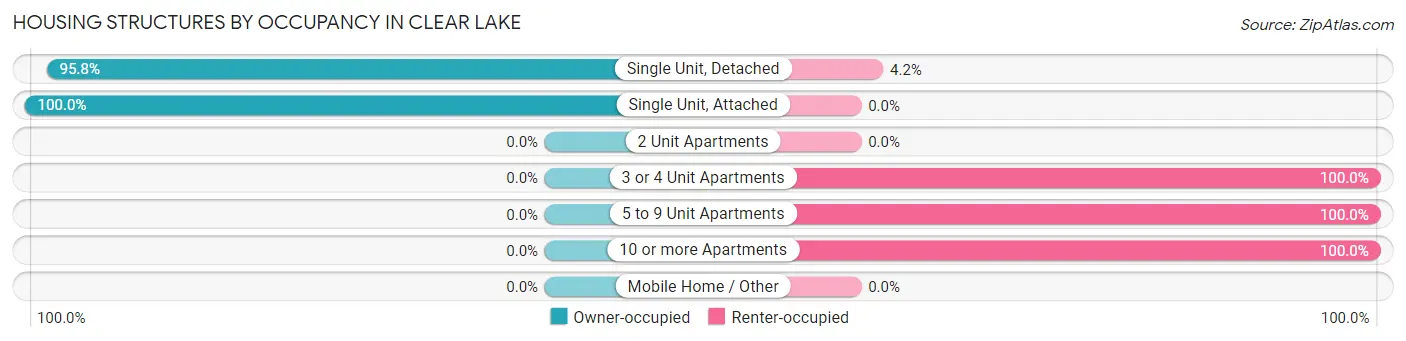
| Structure Type | Owner-occupied | Renter-occupied |
| Single Unit, Detached | 204 (95.8%) | 9 (4.2%) |
| Single Unit, Attached | 5 (100.0%) | 0 (0.0%) |
| 2 Unit Apartments | 0 (0.0%) | 0 (0.0%) |
| 3 or 4 Unit Apartments | 0 (0.0%) | 10 (100.0%) |
| 5 to 9 Unit Apartments | 0 (0.0%) | 2 (100.0%) |
| 10 or more Apartments | 0 (0.0%) | 13 (100.0%) |
| Mobile Home / Other | 0 (0.0%) | 0 (0.0%) |
| Total | 209 (86.0%) | 34 (14.0%) |
Housing Structures by Number of Rooms in Clear Lake
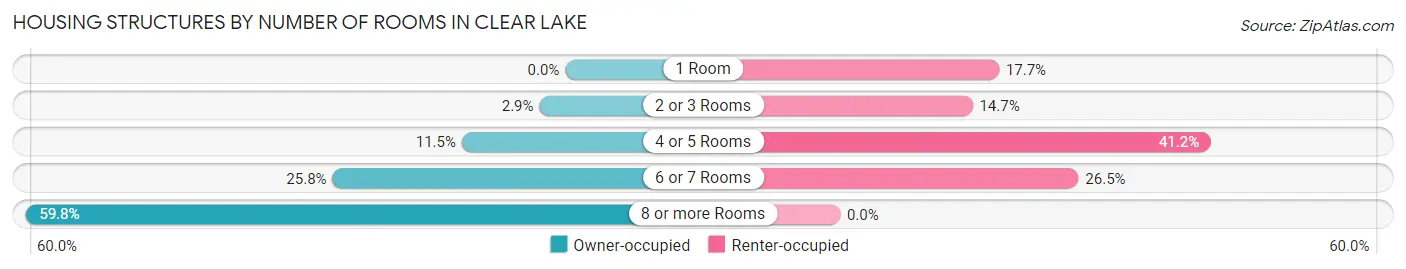
| Number of Rooms | Owner-occupied | Renter-occupied |
| 1 Room | 0 (0.0%) | 6 (17.6%) |
| 2 or 3 Rooms | 6 (2.9%) | 5 (14.7%) |
| 4 or 5 Rooms | 24 (11.5%) | 14 (41.2%) |
| 6 or 7 Rooms | 54 (25.8%) | 9 (26.5%) |
| 8 or more Rooms | 125 (59.8%) | 0 (0.0%) |
| Total | 209 (100.0%) | 34 (100.0%) |
Housing Structure by Heating Type in Clear Lake
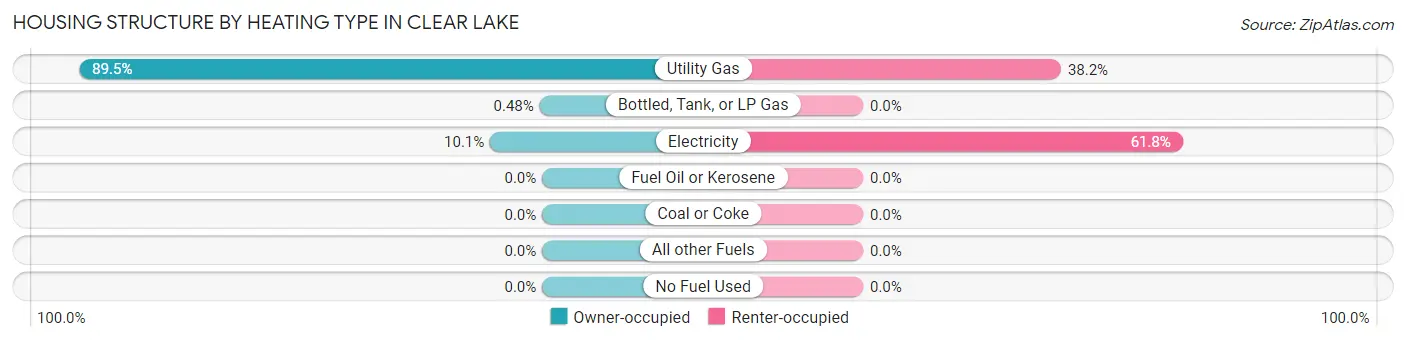
| Heating Type | Owner-occupied | Renter-occupied |
| Utility Gas | 187 (89.5%) | 13 (38.2%) |
| Bottled, Tank, or LP Gas | 1 (0.5%) | 0 (0.0%) |
| Electricity | 21 (10.1%) | 21 (61.8%) |
| Fuel Oil or Kerosene | 0 (0.0%) | 0 (0.0%) |
| Coal or Coke | 0 (0.0%) | 0 (0.0%) |
| All other Fuels | 0 (0.0%) | 0 (0.0%) |
| No Fuel Used | 0 (0.0%) | 0 (0.0%) |
| Total | 209 (100.0%) | 34 (100.0%) |
Household Vehicle Usage in Clear Lake
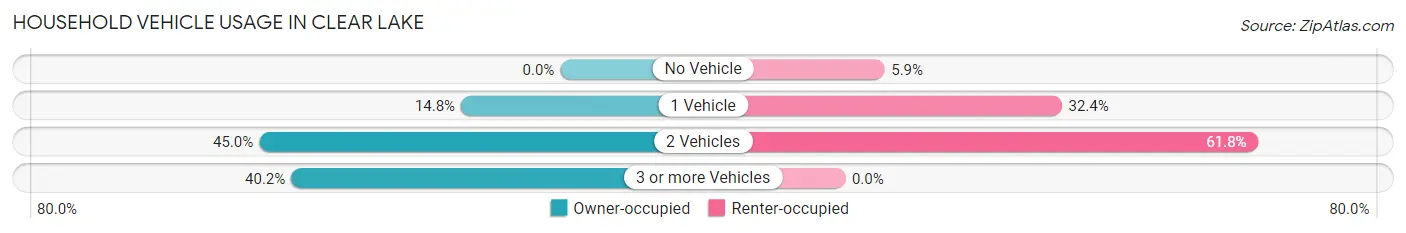
| Vehicles per Household | Owner-occupied | Renter-occupied |
| No Vehicle | 0 (0.0%) | 2 (5.9%) |
| 1 Vehicle | 31 (14.8%) | 11 (32.4%) |
| 2 Vehicles | 94 (45.0%) | 21 (61.8%) |
| 3 or more Vehicles | 84 (40.2%) | 0 (0.0%) |
| Total | 209 (100.0%) | 34 (100.0%) |
Real Estate & Mortgages in Clear Lake
Real Estate and Mortgage Overview in Clear Lake
| Characteristic | Without Mortgage | With Mortgage |
| Housing Units | 29 | 180 |
| Median Property Value | $253,600 | $248,800 |
| Median Household Income | $83,250 | $29 |
| Monthly Housing Costs | $693 | $0 |
| Real Estate Taxes | $2,813 | $1 |
Property Value by Mortgage Status in Clear Lake
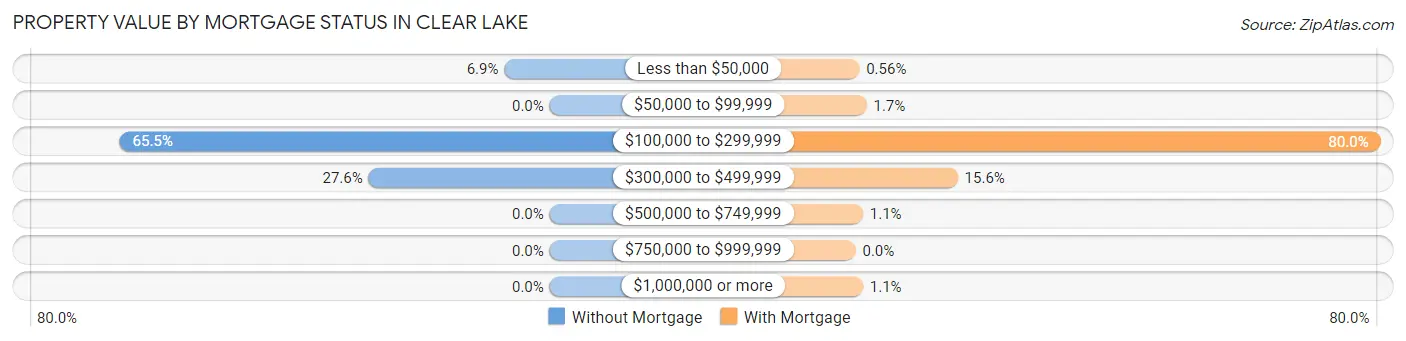
| Property Value | Without Mortgage | With Mortgage |
| Less than $50,000 | 2 (6.9%) | 1 (0.6%) |
| $50,000 to $99,999 | 0 (0.0%) | 3 (1.7%) |
| $100,000 to $299,999 | 19 (65.5%) | 144 (80.0%) |
| $300,000 to $499,999 | 8 (27.6%) | 28 (15.6%) |
| $500,000 to $749,999 | 0 (0.0%) | 2 (1.1%) |
| $750,000 to $999,999 | 0 (0.0%) | 0 (0.0%) |
| $1,000,000 or more | 0 (0.0%) | 2 (1.1%) |
| Total | 29 (100.0%) | 180 (100.0%) |
Household Income by Mortgage Status in Clear Lake
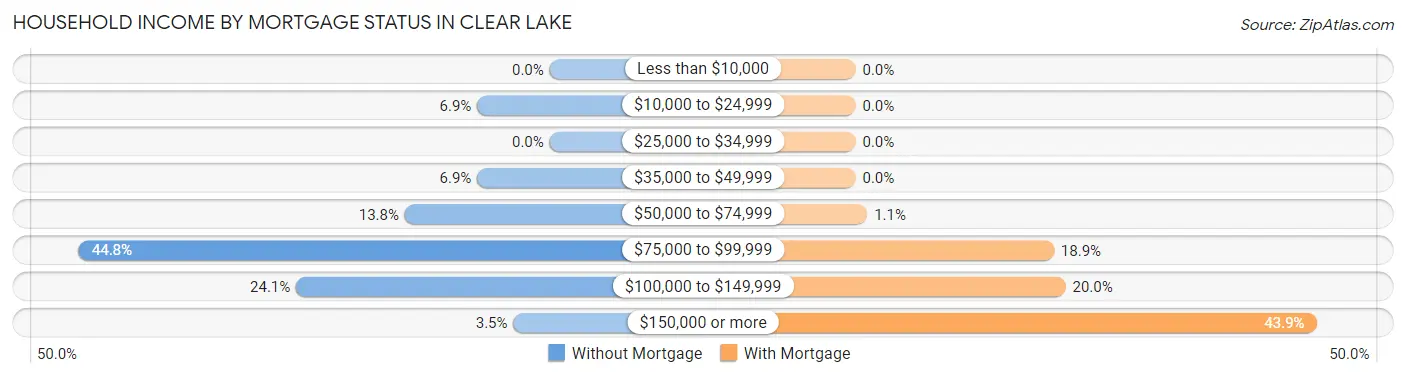
| Household Income | Without Mortgage | With Mortgage |
| Less than $10,000 | 0 (0.0%) | 0 (0.0%) |
| $10,000 to $24,999 | 2 (6.9%) | 0 (0.0%) |
| $25,000 to $34,999 | 0 (0.0%) | 0 (0.0%) |
| $35,000 to $49,999 | 2 (6.9%) | 0 (0.0%) |
| $50,000 to $74,999 | 4 (13.8%) | 2 (1.1%) |
| $75,000 to $99,999 | 13 (44.8%) | 34 (18.9%) |
| $100,000 to $149,999 | 7 (24.1%) | 36 (20.0%) |
| $150,000 or more | 1 (3.5%) | 79 (43.9%) |
| Total | 29 (100.0%) | 180 (100.0%) |
Property Value to Household Income Ratio in Clear Lake
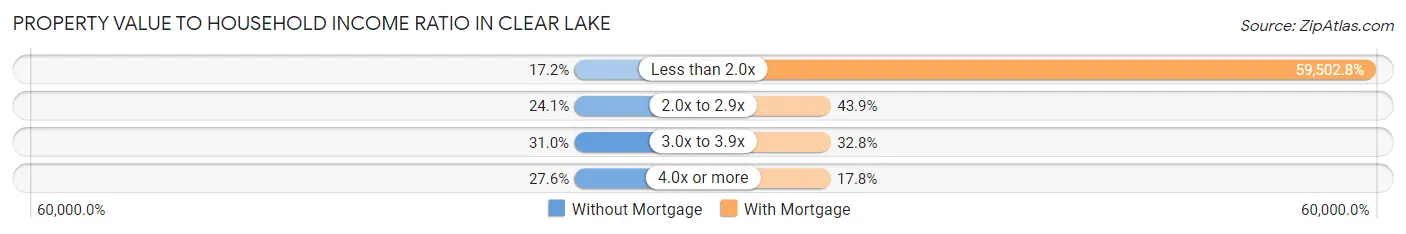
| Value-to-Income Ratio | Without Mortgage | With Mortgage |
| Less than 2.0x | 5 (17.2%) | 107,105 (59,502.8%) |
| 2.0x to 2.9x | 7 (24.1%) | 79 (43.9%) |
| 3.0x to 3.9x | 9 (31.0%) | 59 (32.8%) |
| 4.0x or more | 8 (27.6%) | 32 (17.8%) |
| Total | 29 (100.0%) | 180 (100.0%) |
Real Estate Taxes by Mortgage Status in Clear Lake
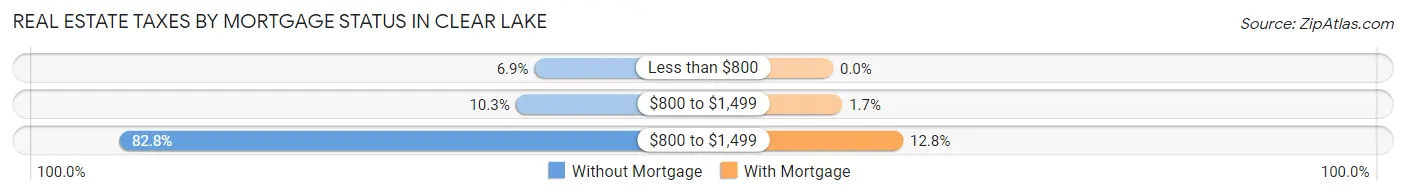
| Property Taxes | Without Mortgage | With Mortgage |
| Less than $800 | 2 (6.9%) | 0 (0.0%) |
| $800 to $1,499 | 3 (10.3%) | 3 (1.7%) |
| $800 to $1,499 | 24 (82.8%) | 23 (12.8%) |
| Total | 29 (100.0%) | 180 (100.0%) |
Health & Disability in Clear Lake
Health Insurance Coverage by Age in Clear Lake
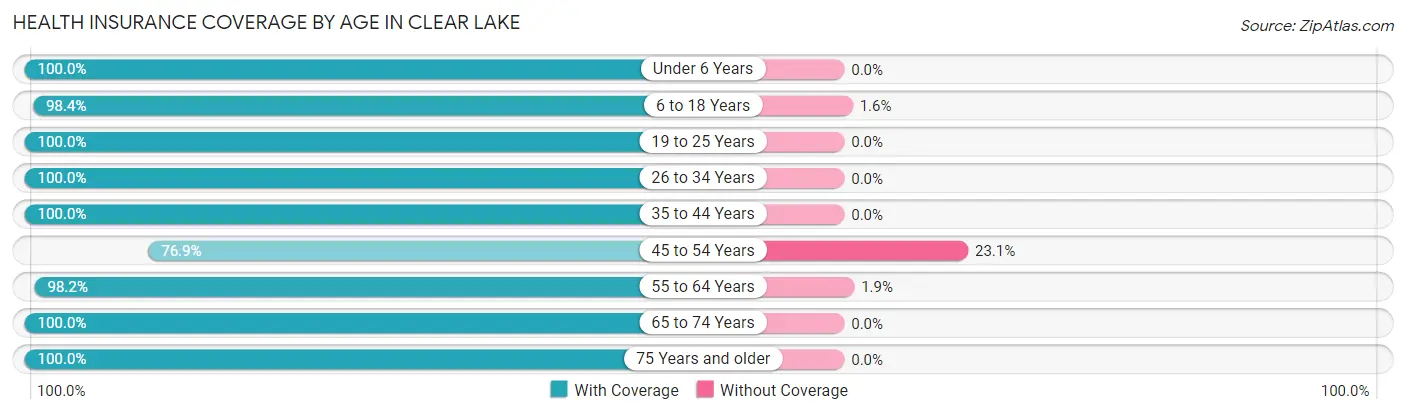
| Age Bracket | With Coverage | Without Coverage |
| Under 6 Years | 86 (100.0%) | 0 (0.0%) |
| 6 to 18 Years | 125 (98.4%) | 2 (1.6%) |
| 19 to 25 Years | 42 (100.0%) | 0 (0.0%) |
| 26 to 34 Years | 154 (100.0%) | 0 (0.0%) |
| 35 to 44 Years | 113 (100.0%) | 0 (0.0%) |
| 45 to 54 Years | 70 (76.9%) | 21 (23.1%) |
| 55 to 64 Years | 53 (98.2%) | 1 (1.8%) |
| 65 to 74 Years | 24 (100.0%) | 0 (0.0%) |
| 75 Years and older | 7 (100.0%) | 0 (0.0%) |
| Total | 674 (96.6%) | 24 (3.4%) |
Health Insurance Coverage by Citizenship Status in Clear Lake
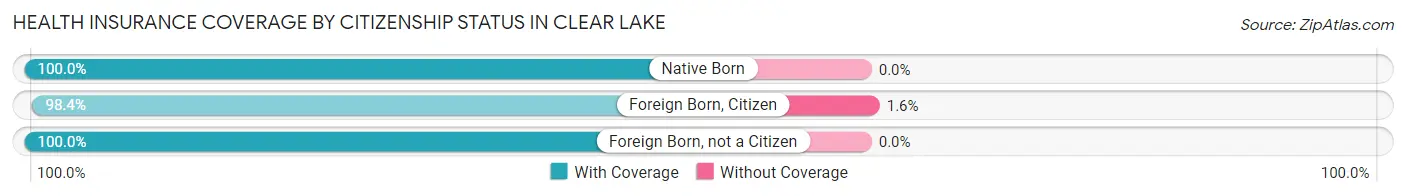
| Citizenship Status | With Coverage | Without Coverage |
| Native Born | 86 (100.0%) | 0 (0.0%) |
| Foreign Born, Citizen | 125 (98.4%) | 2 (1.6%) |
| Foreign Born, not a Citizen | 42 (100.0%) | 0 (0.0%) |
Health Insurance Coverage by Household Income in Clear Lake
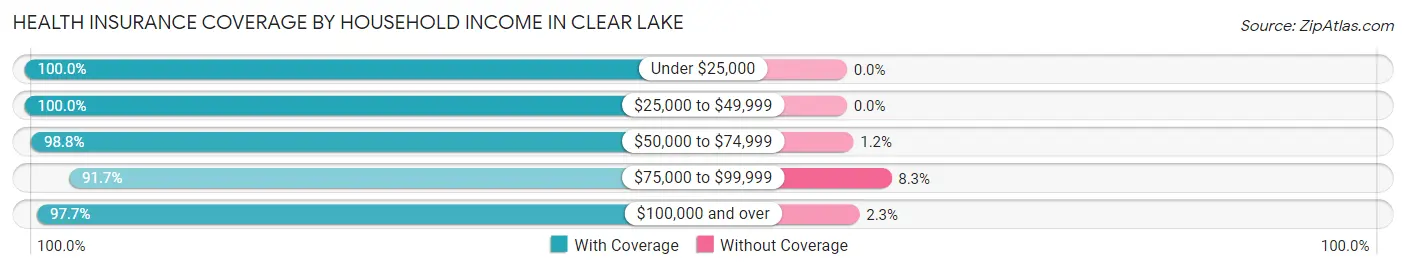
| Household Income | With Coverage | Without Coverage |
| Under $25,000 | 11 (100.0%) | 0 (0.0%) |
| $25,000 to $49,999 | 22 (100.0%) | 0 (0.0%) |
| $50,000 to $74,999 | 81 (98.8%) | 1 (1.2%) |
| $75,000 to $99,999 | 143 (91.7%) | 13 (8.3%) |
| $100,000 and over | 417 (97.7%) | 10 (2.3%) |
Public vs Private Health Insurance Coverage by Age in Clear Lake
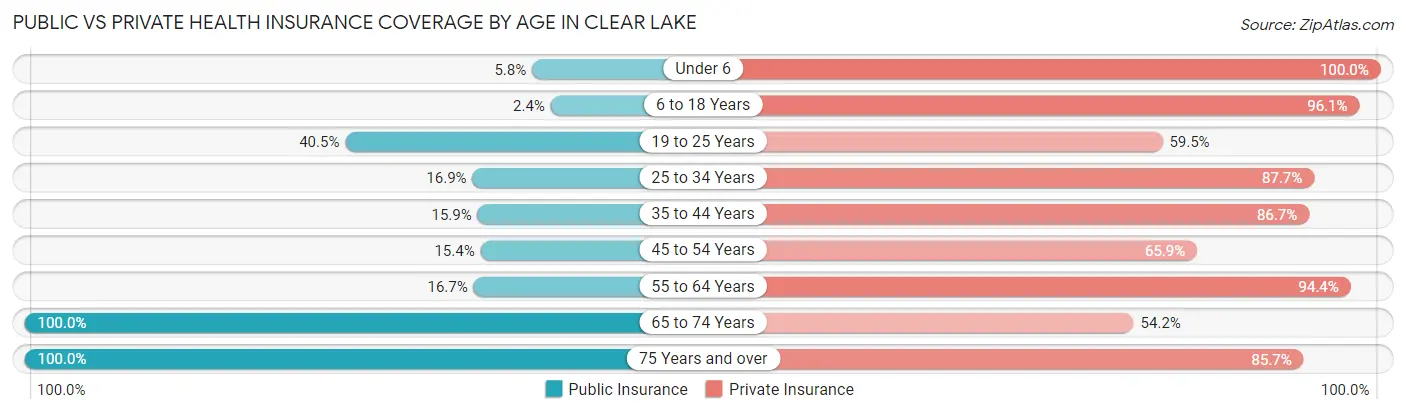
| Age Bracket | Public Insurance | Private Insurance |
| Under 6 | 5 (5.8%) | 86 (100.0%) |
| 6 to 18 Years | 3 (2.4%) | 122 (96.1%) |
| 19 to 25 Years | 17 (40.5%) | 25 (59.5%) |
| 25 to 34 Years | 26 (16.9%) | 135 (87.7%) |
| 35 to 44 Years | 18 (15.9%) | 98 (86.7%) |
| 45 to 54 Years | 14 (15.4%) | 60 (65.9%) |
| 55 to 64 Years | 9 (16.7%) | 51 (94.4%) |
| 65 to 74 Years | 24 (100.0%) | 13 (54.2%) |
| 75 Years and over | 7 (100.0%) | 6 (85.7%) |
| Total | 123 (17.6%) | 596 (85.4%) |
Disability Status by Sex by Age in Clear Lake
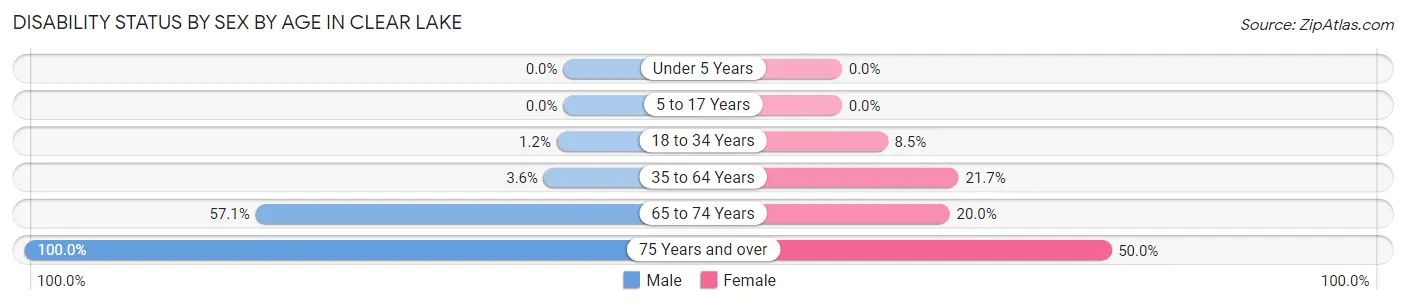
| Age Bracket | Male | Female |
| Under 5 Years | 0 (0.0%) | 0 (0.0%) |
| 5 to 17 Years | 0 (0.0%) | 0 (0.0%) |
| 18 to 34 Years | 1 (1.2%) | 10 (8.5%) |
| 35 to 64 Years | 5 (3.6%) | 26 (21.7%) |
| 65 to 74 Years | 8 (57.1%) | 2 (20.0%) |
| 75 Years and over | 3 (100.0%) | 2 (50.0%) |
Disability Class by Sex by Age in Clear Lake
Disability Class: Hearing Difficulty
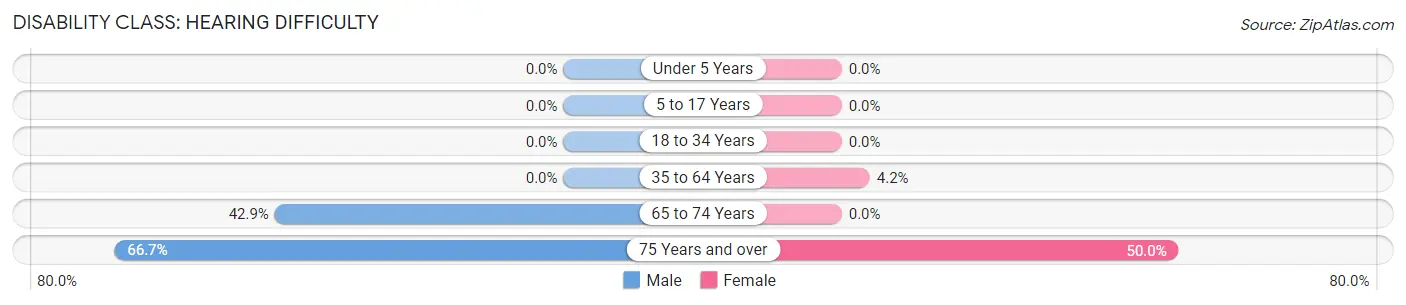
| Age Bracket | Male | Female |
| Under 5 Years | 0 (0.0%) | 0 (0.0%) |
| 5 to 17 Years | 0 (0.0%) | 0 (0.0%) |
| 18 to 34 Years | 0 (0.0%) | 0 (0.0%) |
| 35 to 64 Years | 0 (0.0%) | 5 (4.2%) |
| 65 to 74 Years | 6 (42.9%) | 0 (0.0%) |
| 75 Years and over | 2 (66.7%) | 2 (50.0%) |
Disability Class: Vision Difficulty
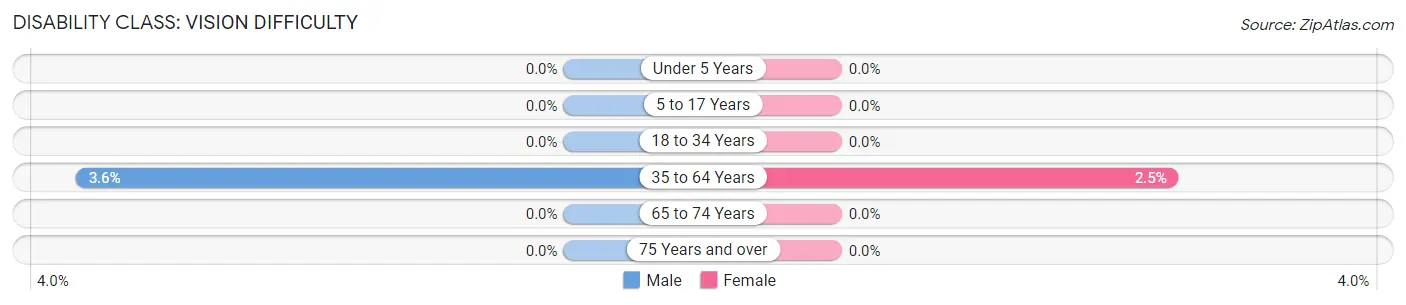
| Age Bracket | Male | Female |
| Under 5 Years | 0 (0.0%) | 0 (0.0%) |
| 5 to 17 Years | 0 (0.0%) | 0 (0.0%) |
| 18 to 34 Years | 0 (0.0%) | 0 (0.0%) |
| 35 to 64 Years | 5 (3.6%) | 3 (2.5%) |
| 65 to 74 Years | 0 (0.0%) | 0 (0.0%) |
| 75 Years and over | 0 (0.0%) | 0 (0.0%) |
Disability Class: Cognitive Difficulty
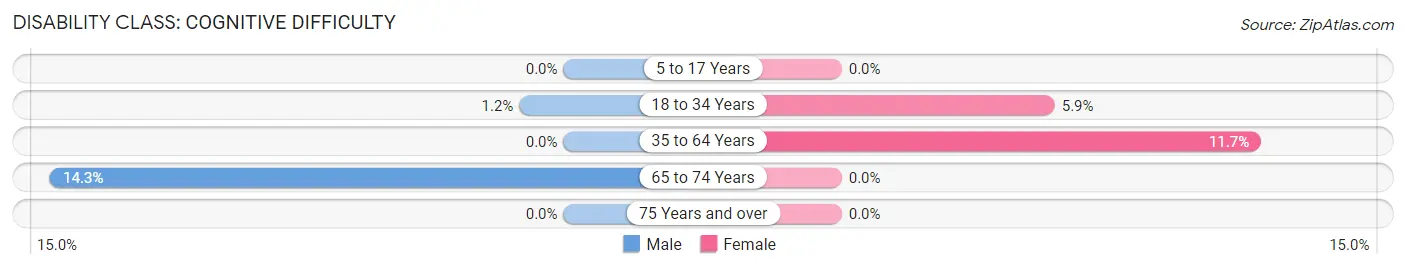
| Age Bracket | Male | Female |
| 5 to 17 Years | 0 (0.0%) | 0 (0.0%) |
| 18 to 34 Years | 1 (1.2%) | 7 (5.9%) |
| 35 to 64 Years | 0 (0.0%) | 14 (11.7%) |
| 65 to 74 Years | 2 (14.3%) | 0 (0.0%) |
| 75 Years and over | 0 (0.0%) | 0 (0.0%) |
Disability Class: Ambulatory Difficulty
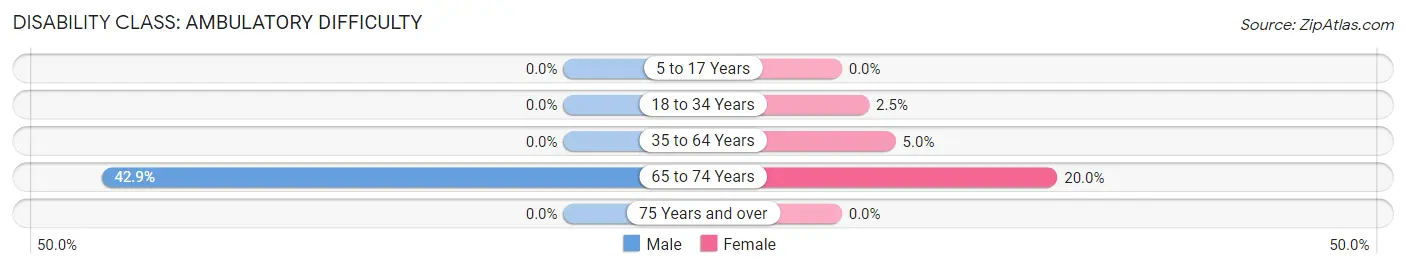
| Age Bracket | Male | Female |
| 5 to 17 Years | 0 (0.0%) | 0 (0.0%) |
| 18 to 34 Years | 0 (0.0%) | 3 (2.5%) |
| 35 to 64 Years | 0 (0.0%) | 6 (5.0%) |
| 65 to 74 Years | 6 (42.9%) | 2 (20.0%) |
| 75 Years and over | 0 (0.0%) | 0 (0.0%) |
Disability Class: Self-Care Difficulty
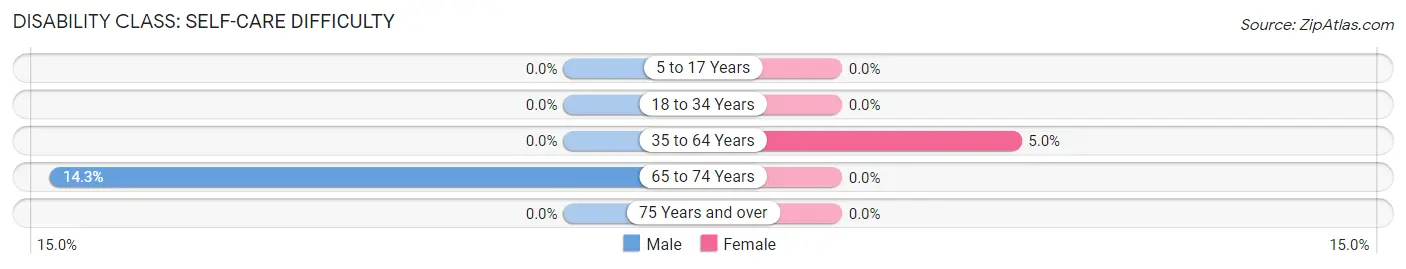
| Age Bracket | Male | Female |
| 5 to 17 Years | 0 (0.0%) | 0 (0.0%) |
| 18 to 34 Years | 0 (0.0%) | 0 (0.0%) |
| 35 to 64 Years | 0 (0.0%) | 6 (5.0%) |
| 65 to 74 Years | 2 (14.3%) | 0 (0.0%) |
| 75 Years and over | 0 (0.0%) | 0 (0.0%) |
Technology Access in Clear Lake
Computing Device Access in Clear Lake
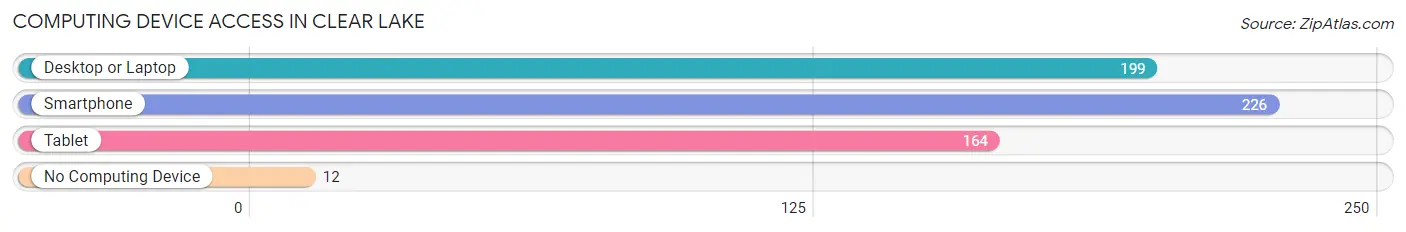
| Device Type | # Households | % Households |
| Desktop or Laptop | 199 | 81.9% |
| Smartphone | 226 | 93.0% |
| Tablet | 164 | 67.5% |
| No Computing Device | 12 | 4.9% |
| Total | 243 | 100.0% |
Internet Access in Clear Lake
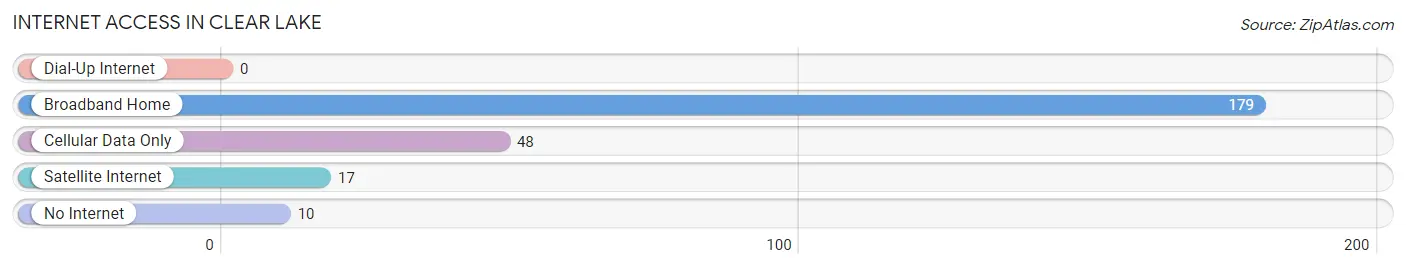
| Internet Type | # Households | % Households |
| Dial-Up Internet | 0 | 0.0% |
| Broadband Home | 179 | 73.7% |
| Cellular Data Only | 48 | 19.8% |
| Satellite Internet | 17 | 7.0% |
| No Internet | 10 | 4.1% |
| Total | 243 | 100.0% |
Clear Lake Summary
History
Clear Lake is a small city located in Sherburne County, Minnesota. It is situated on the north shore of Clear Lake, a natural lake that is part of the Mississippi River watershed. The city was founded in 1856 by settlers from New England and was originally known as Clear Lake Station. The city was incorporated in 1887 and has since grown to a population of over 1,000 people.
The area around Clear Lake has a long history of human habitation. Archaeological evidence suggests that the area was inhabited by Native Americans as early as 8,000 years ago. The first European settlers arrived in the area in the early 1800s and began to establish farms and homesteads. The area was known for its abundance of wild game and fish, and the settlers quickly took advantage of the natural resources.
In 1856, the first post office was established in Clear Lake Station, and the town was officially incorporated in 1887. The city was named after the nearby lake, which was named for its clear, blue-green waters.
Geography
Clear Lake is located in Sherburne County, Minnesota, on the north shore of Clear Lake. The city is situated on the banks of the Mississippi River, and is surrounded by rolling hills and wooded areas. The city is located approximately 25 miles north of Minneapolis and is part of the Twin Cities metropolitan area.
The city has a total area of 1.2 square miles, all of which is land. The terrain is mostly flat, with some rolling hills in the surrounding area. The climate is humid continental, with cold winters and warm summers.
Economy
Clear Lake’s economy is largely based on tourism and recreation. The city is home to several resorts and campgrounds, as well as a variety of outdoor activities such as fishing, boating, and swimming. The city is also home to several small businesses, including restaurants, retail stores, and service providers.
The city is also home to several manufacturing companies, including a plastics manufacturer and a metal fabrication company. The city is also home to a number of agricultural operations, including dairy farms, grain farms, and vegetable farms.
Demographics
As of the 2010 census, the population of Clear Lake was 1,072. The racial makeup of the city was 97.2% White, 0.7% African American, 0.3% Native American, 0.3% Asian, 0.1% Pacific Islander, 0.3% from other races, and 1.2% from two or more races. Hispanic or Latino of any race were 1.2% of the population.
The median household income in Clear Lake was $50,938, and the median family income was $60,000. The per capita income for the city was $25,938. About 8.2% of families and 10.2% of the population were below the poverty line, including 14.2% of those under age 18 and 6.2% of those age 65 or over.
Common Questions
What is Per Capita Income in Clear Lake?
Per Capita income in Clear Lake is $39,077.
What is the Median Family Income in Clear Lake?
Median Family Income in Clear Lake is $106,382.
What is the Median Household income in Clear Lake?
Median Household Income in Clear Lake is $105,724.
What is Income or Wage Gap in Clear Lake?
Income or Wage Gap in Clear Lake is 28.9%.
Women in Clear Lake earn 71.1 cents for every dollar earned by a man.
What is Inequality or Gini Index in Clear Lake?
Inequality or Gini Index in Clear Lake is 0.27.
What is the Total Population of Clear Lake?
Total Population of Clear Lake is 698.
What is the Total Male Population of Clear Lake?
Total Male Population of Clear Lake is 367.
What is the Total Female Population of Clear Lake?
Total Female Population of Clear Lake is 331.
What is the Ratio of Males per 100 Females in Clear Lake?
There are 110.88 Males per 100 Females in Clear Lake.
What is the Ratio of Females per 100 Males in Clear Lake?
There are 90.19 Females per 100 Males in Clear Lake.
What is the Median Population Age in Clear Lake?
Median Population Age in Clear Lake is 32.5 Years.
What is the Average Family Size in Clear Lake
Average Family Size in Clear Lake is 3.2 People.
What is the Average Household Size in Clear Lake
Average Household Size in Clear Lake is 2.9 People.
How Large is the Labor Force in Clear Lake?
There are 443 People in the Labor Forcein in Clear Lake.
What is the Percentage of People in the Labor Force in Clear Lake?
87.4% of People are in the Labor Force in Clear Lake.
What is the Unemployment Rate in Clear Lake?
Unemployment Rate in Clear Lake is 6.1%.