Chatfield, MN Map & Demographics
Chatfield Map
Chatfield Overview
$40,695
PER CAPITA INCOME
$103,516
AVG FAMILY INCOME
$88,772
AVG HOUSEHOLD INCOME
1.3%
WAGE / INCOME GAP [ % ]
98.7¢/ $1
WAGE / INCOME GAP [ $ ]
$4,593
FAMILY INCOME DEFICIT
0.39
INEQUALITY / GINI INDEX
2,758
TOTAL POPULATION
1,364
MALE POPULATION
1,394
FEMALE POPULATION
97.85
MALES / 100 FEMALES
102.20
FEMALES / 100 MALES
38.8
MEDIAN AGE
3.0
AVG FAMILY SIZE
2.5
AVG HOUSEHOLD SIZE
1,559
LABOR FORCE [ PEOPLE ]
71.8%
PERCENT IN LABOR FORCE
1.9%
UNEMPLOYMENT RATE
Chatfield Zip Codes
Chatfield Area Codes
Income in Chatfield
Income Overview in Chatfield
Per Capita Income in Chatfield is $40,695, while median incomes of families and households are $103,516 and $88,772 respectively.
| Characteristic | Number | Measure |
| Per Capita Income | 2,758 | $40,695 |
| Median Family Income | 749 | $103,516 |
| Mean Family Income | 749 | $123,637 |
| Median Household Income | 1,051 | $88,772 |
| Mean Household Income | 1,051 | $105,055 |
| Income Deficit | 749 | $4,593 |
| Wage / Income Gap (%) | 2,758 | 1.34% |
| Wage / Income Gap ($) | 2,758 | 98.66¢ per $1 |
| Gini / Inequality Index | 2,758 | 0.39 |
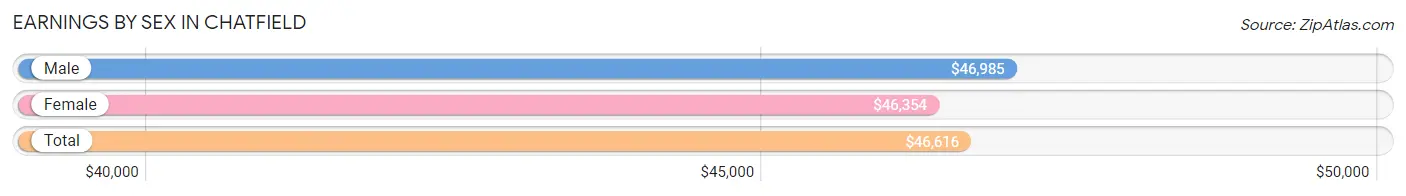
Earnings by Sex in Chatfield
Average Earnings in Chatfield are $46,616, $46,985 for men and $46,354 for women, a difference of 1.3%.
| Sex | Number | Average Earnings |
| Male | 904 (53.8%) | $46,985 |
| Female | 776 (46.2%) | $46,354 |
| Total | 1,680 (100.0%) | $46,616 |
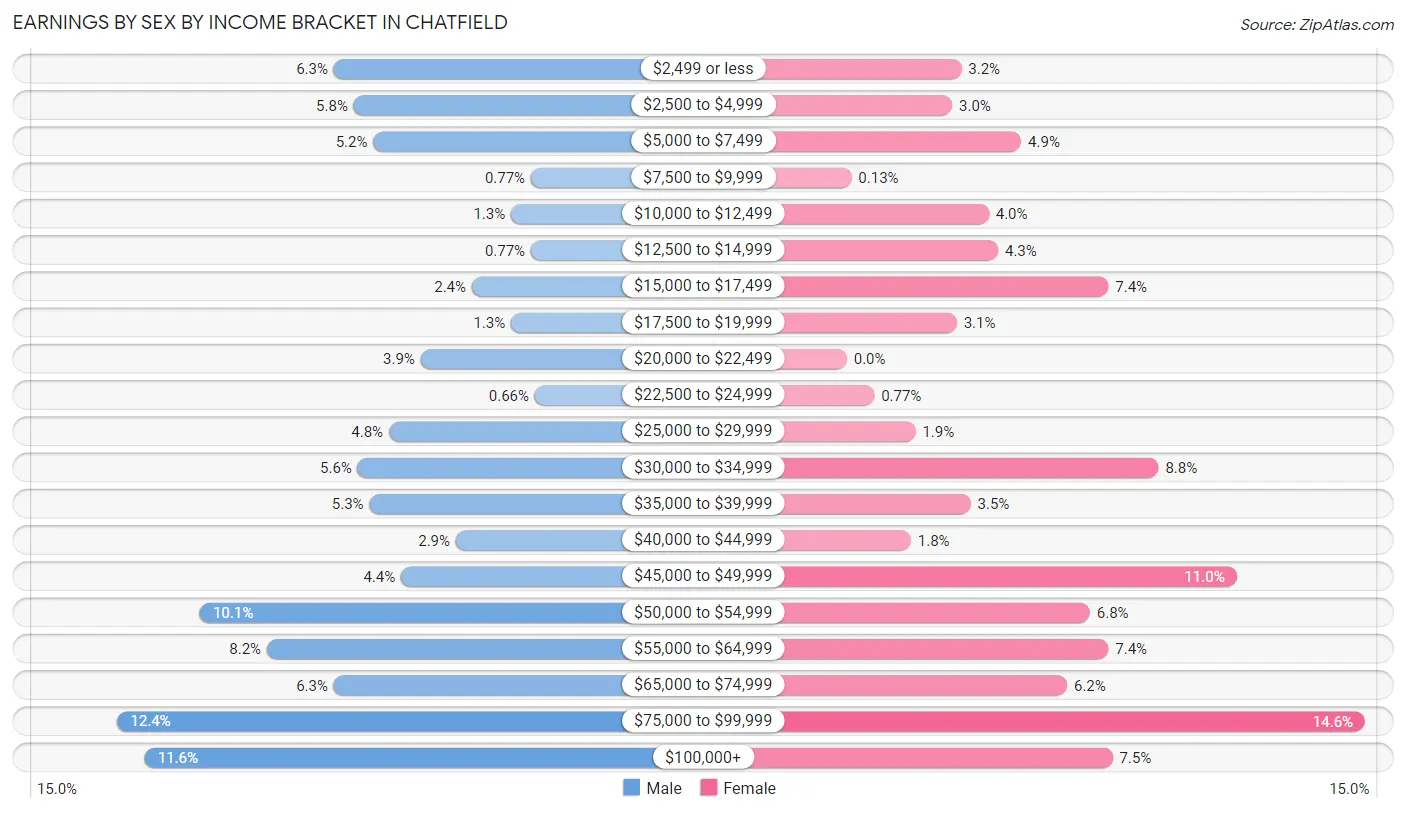
Earnings by Sex by Income Bracket in Chatfield
The most common earnings brackets in Chatfield are $75,000 to $99,999 for men (112 | 12.4%) and $75,000 to $99,999 for women (113 | 14.6%).
| Income | Male | Female |
| $2,499 or less | 57 (6.3%) | 25 (3.2%) |
| $2,500 to $4,999 | 52 (5.8%) | 23 (3.0%) |
| $5,000 to $7,499 | 47 (5.2%) | 38 (4.9%) |
| $7,500 to $9,999 | 7 (0.8%) | 1 (0.1%) |
| $10,000 to $12,499 | 12 (1.3%) | 31 (4.0%) |
| $12,500 to $14,999 | 7 (0.8%) | 33 (4.3%) |
| $15,000 to $17,499 | 22 (2.4%) | 57 (7.3%) |
| $17,500 to $19,999 | 12 (1.3%) | 24 (3.1%) |
| $20,000 to $22,499 | 35 (3.9%) | 0 (0.0%) |
| $22,500 to $24,999 | 6 (0.7%) | 6 (0.8%) |
| $25,000 to $29,999 | 43 (4.8%) | 15 (1.9%) |
| $30,000 to $34,999 | 51 (5.6%) | 68 (8.8%) |
| $35,000 to $39,999 | 48 (5.3%) | 27 (3.5%) |
| $40,000 to $44,999 | 26 (2.9%) | 14 (1.8%) |
| $45,000 to $49,999 | 40 (4.4%) | 85 (11.0%) |
| $50,000 to $54,999 | 91 (10.1%) | 53 (6.8%) |
| $55,000 to $64,999 | 74 (8.2%) | 57 (7.3%) |
| $65,000 to $74,999 | 57 (6.3%) | 48 (6.2%) |
| $75,000 to $99,999 | 112 (12.4%) | 113 (14.6%) |
| $100,000+ | 105 (11.6%) | 58 (7.5%) |
| Total | 904 (100.0%) | 776 (100.0%) |
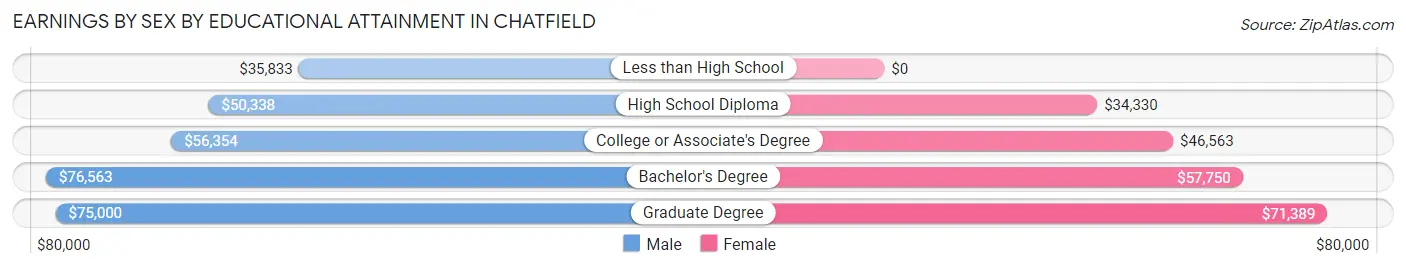
Earnings by Sex by Educational Attainment in Chatfield
Average earnings in Chatfield are $54,279 for men and $48,716 for women, a difference of 10.2%. Men with an educational attainment of bachelor's degree enjoy the highest average annual earnings of $76,563, while those with less than high school education earn the least with $35,833. Women with an educational attainment of graduate degree earn the most with the average annual earnings of $71,389, while those with high school diploma education have the smallest earnings of $34,330.
| Educational Attainment | Male Income | Female Income |
| Less than High School | $35,833 | $0 |
| High School Diploma | $50,338 | $34,330 |
| College or Associate's Degree | $56,354 | $46,563 |
| Bachelor's Degree | $76,563 | $57,750 |
| Graduate Degree | $75,000 | $71,389 |
| Total | $54,279 | $48,716 |
Family Income in Chatfield
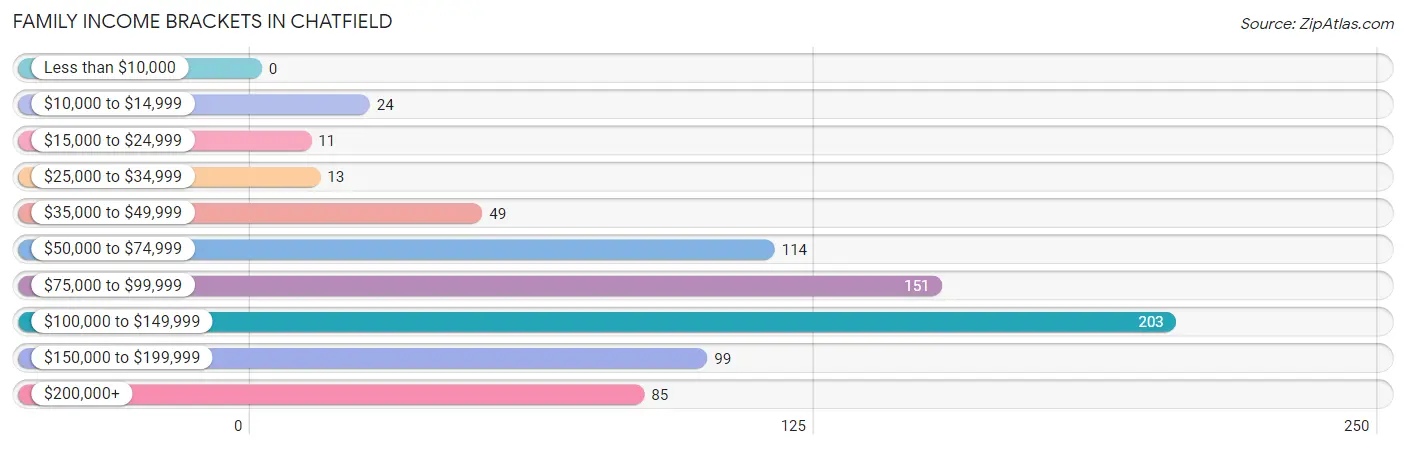
Family Income Brackets in Chatfield
According to the Chatfield family income data, there are 203 families falling into the $100,000 to $149,999 income range, which is the most common income bracket and makes up 27.1% of all families.
| Income Bracket | # Families | % Families |
| Less than $10,000 | 0 | 0.0% |
| $10,000 to $14,999 | 24 | 3.2% |
| $15,000 to $24,999 | 11 | 1.5% |
| $25,000 to $34,999 | 13 | 1.7% |
| $35,000 to $49,999 | 49 | 6.5% |
| $50,000 to $74,999 | 114 | 15.2% |
| $75,000 to $99,999 | 151 | 20.2% |
| $100,000 to $149,999 | 203 | 27.1% |
| $150,000 to $199,999 | 99 | 13.2% |
| $200,000+ | 85 | 11.3% |
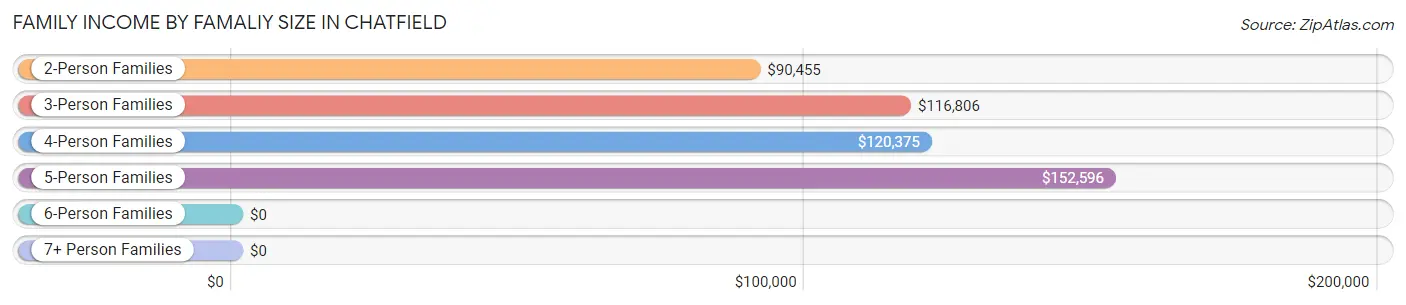
Family Income by Famaliy Size in Chatfield
5-person families (79 | 10.5%) account for the highest median family income in Chatfield with $152,596 per family, while 2-person families (396 | 52.9%) have the highest median income of $45,228 per family member.
| Income Bracket | # Families | Median Income |
| 2-Person Families | 396 (52.9%) | $90,455 |
| 3-Person Families | 130 (17.4%) | $116,806 |
| 4-Person Families | 121 (16.2%) | $120,375 |
| 5-Person Families | 79 (10.5%) | $152,596 |
| 6-Person Families | 11 (1.5%) | $0 |
| 7+ Person Families | 12 (1.6%) | $0 |
| Total | 749 (100.0%) | $103,516 |
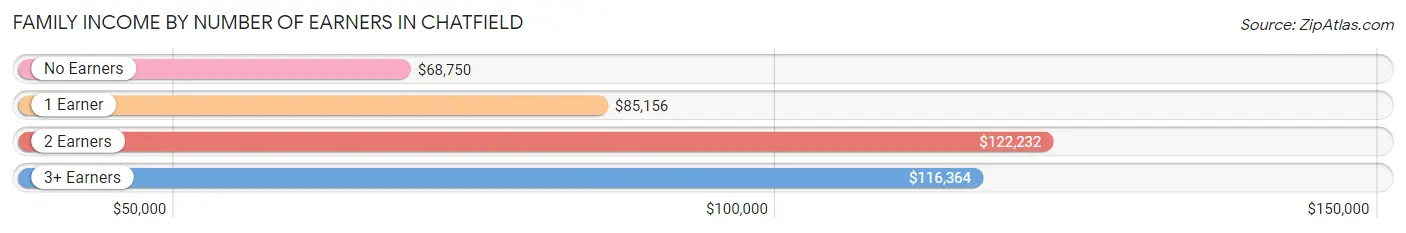
Family Income by Number of Earners in Chatfield
The median family income in Chatfield is $103,516, with families comprising 2 earners (431) having the highest median family income of $122,232, while families with no earners (95) have the lowest median family income of $68,750, accounting for 57.5% and 12.7% of families, respectively.
| Number of Earners | # Families | Median Income |
| No Earners | 95 (12.7%) | $68,750 |
| 1 Earner | 111 (14.8%) | $85,156 |
| 2 Earners | 431 (57.5%) | $122,232 |
| 3+ Earners | 112 (14.9%) | $116,364 |
| Total | 749 (100.0%) | $103,516 |
Household Income in Chatfield
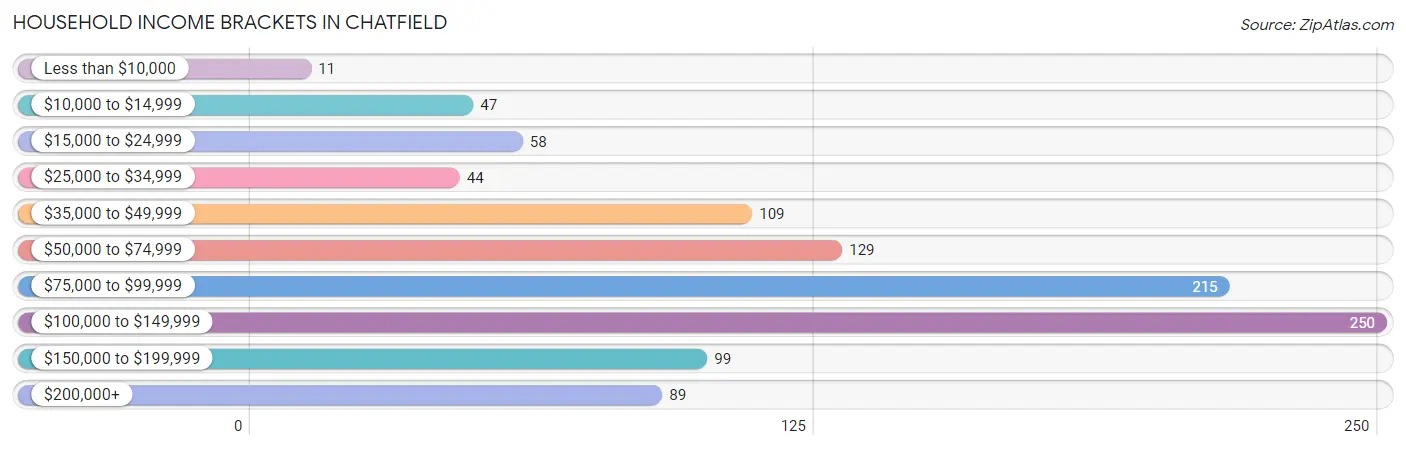
Household Income Brackets in Chatfield
With 250 households falling in the category, the $100,000 to $149,999 income range is the most frequent in Chatfield, accounting for 23.8% of all households. In contrast, only 11 households (1.1%) fall into the less than $10,000 income bracket, making it the least populous group.
| Income Bracket | # Households | % Households |
| Less than $10,000 | 11 | 1.0% |
| $10,000 to $14,999 | 47 | 4.5% |
| $15,000 to $24,999 | 58 | 5.5% |
| $25,000 to $34,999 | 44 | 4.2% |
| $35,000 to $49,999 | 109 | 10.4% |
| $50,000 to $74,999 | 129 | 12.3% |
| $75,000 to $99,999 | 215 | 20.5% |
| $100,000 to $149,999 | 250 | 23.8% |
| $150,000 to $199,999 | 99 | 9.4% |
| $200,000+ | 89 | 8.5% |
Household Income by Householder Age in Chatfield
The median household income in Chatfield is $88,772, with the highest median household income of $108,750 found in the 25 to 44 years age bracket for the primary householder. A total of 386 households (36.7%) fall into this category. Meanwhile, the 15 to 24 years age bracket for the primary householder has the lowest median household income of $42,188, with 35 households (3.3%) in this group.
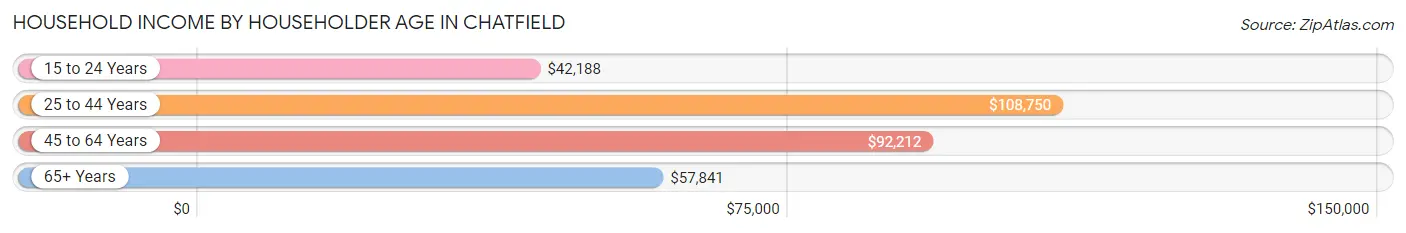
| Income Bracket | # Households | Median Income |
| 15 to 24 Years | 35 (3.3%) | $42,188 |
| 25 to 44 Years | 386 (36.7%) | $108,750 |
| 45 to 64 Years | 347 (33.0%) | $92,212 |
| 65+ Years | 283 (26.9%) | $57,841 |
| Total | 1,051 (100.0%) | $88,772 |
Poverty in Chatfield
Income Below Poverty by Sex and Age in Chatfield
With 0.8% poverty level for males and 5.8% for females among the residents of Chatfield, 5 year old males and 75 year old and over females are the most vulnerable to poverty, with 4 males (26.7%) and 40 females (27.0%) in their respective age groups living below the poverty level.
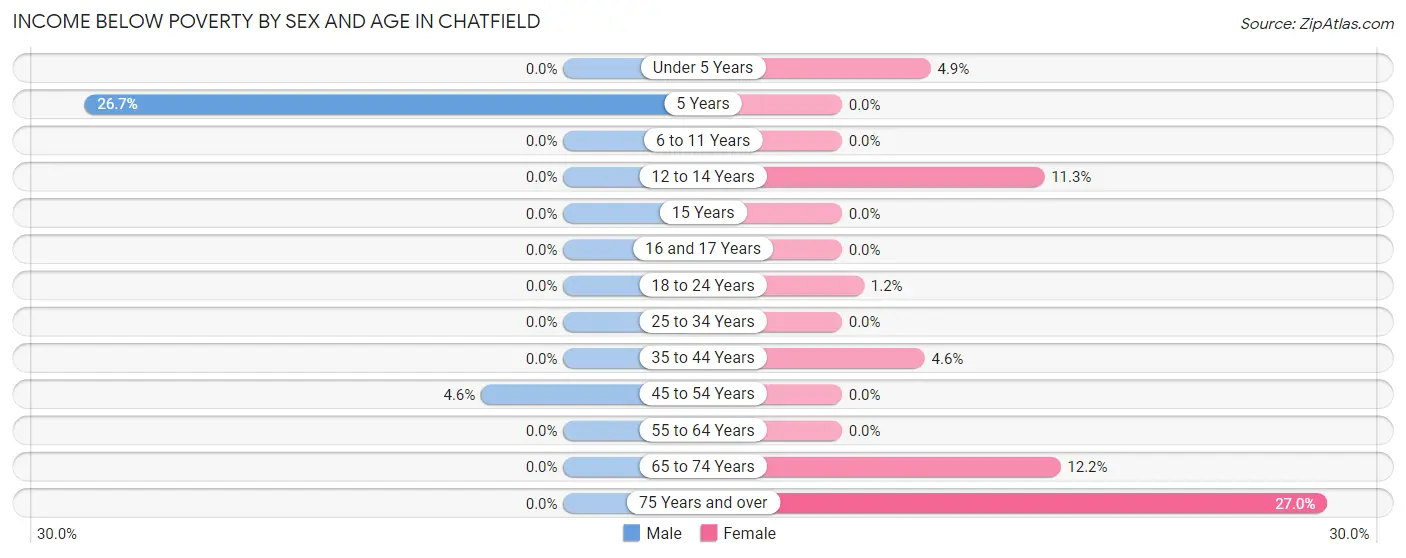
| Age Bracket | Male | Female |
| Under 5 Years | 0 (0.0%) | 4 (4.9%) |
| 5 Years | 4 (26.7%) | 0 (0.0%) |
| 6 to 11 Years | 0 (0.0%) | 0 (0.0%) |
| 12 to 14 Years | 0 (0.0%) | 8 (11.3%) |
| 15 Years | 0 (0.0%) | 0 (0.0%) |
| 16 and 17 Years | 0 (0.0%) | 0 (0.0%) |
| 18 to 24 Years | 0 (0.0%) | 1 (1.2%) |
| 25 to 34 Years | 0 (0.0%) | 0 (0.0%) |
| 35 to 44 Years | 0 (0.0%) | 10 (4.6%) |
| 45 to 54 Years | 7 (4.6%) | 0 (0.0%) |
| 55 to 64 Years | 0 (0.0%) | 0 (0.0%) |
| 65 to 74 Years | 0 (0.0%) | 14 (12.2%) |
| 75 Years and over | 0 (0.0%) | 40 (27.0%) |
| Total | 11 (0.8%) | 77 (5.8%) |
Income Above Poverty by Sex and Age in Chatfield
According to the poverty statistics in Chatfield, males aged under 5 years and females aged 5 years are the age groups that are most secure financially, with 100.0% of males and 100.0% of females in these age groups living above the poverty line.
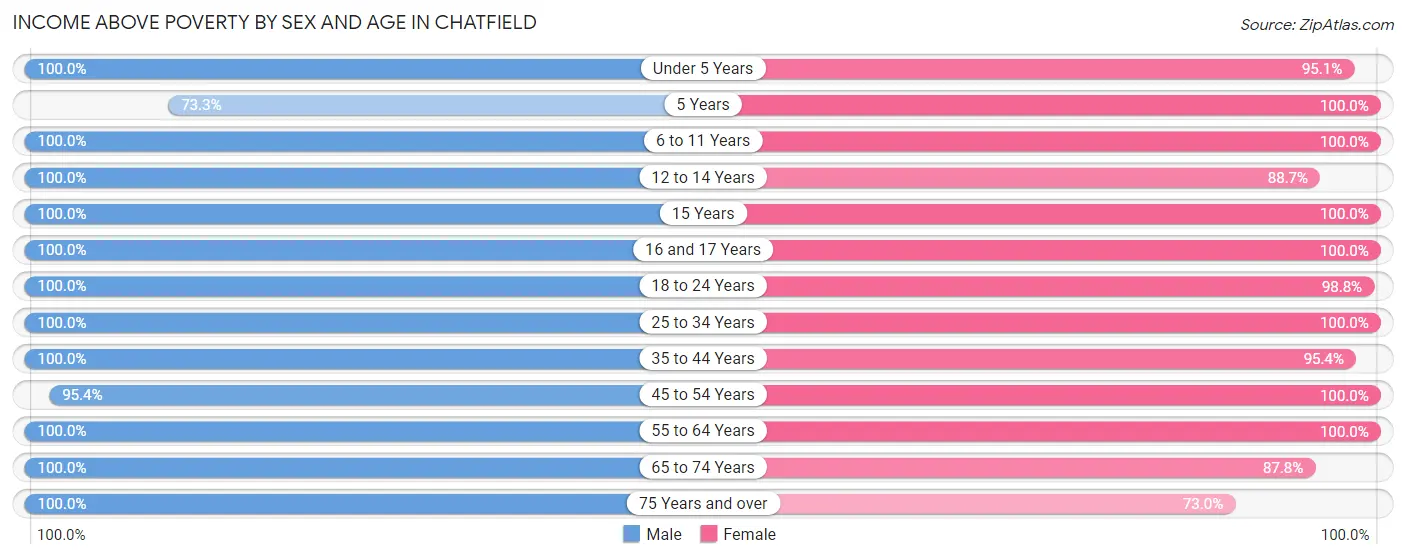
| Age Bracket | Male | Female |
| Under 5 Years | 47 (100.0%) | 77 (95.1%) |
| 5 Years | 11 (73.3%) | 16 (100.0%) |
| 6 to 11 Years | 117 (100.0%) | 58 (100.0%) |
| 12 to 14 Years | 87 (100.0%) | 63 (88.7%) |
| 15 Years | 23 (100.0%) | 37 (100.0%) |
| 16 and 17 Years | 66 (100.0%) | 42 (100.0%) |
| 18 to 24 Years | 139 (100.0%) | 80 (98.8%) |
| 25 to 34 Years | 196 (100.0%) | 124 (100.0%) |
| 35 to 44 Years | 191 (100.0%) | 207 (95.4%) |
| 45 to 54 Years | 146 (95.4%) | 200 (100.0%) |
| 55 to 64 Years | 121 (100.0%) | 130 (100.0%) |
| 65 to 74 Years | 87 (100.0%) | 101 (87.8%) |
| 75 Years and over | 78 (100.0%) | 108 (73.0%) |
| Total | 1,309 (99.2%) | 1,243 (94.2%) |
Income Below Poverty Among Married-Couple Families in Chatfield
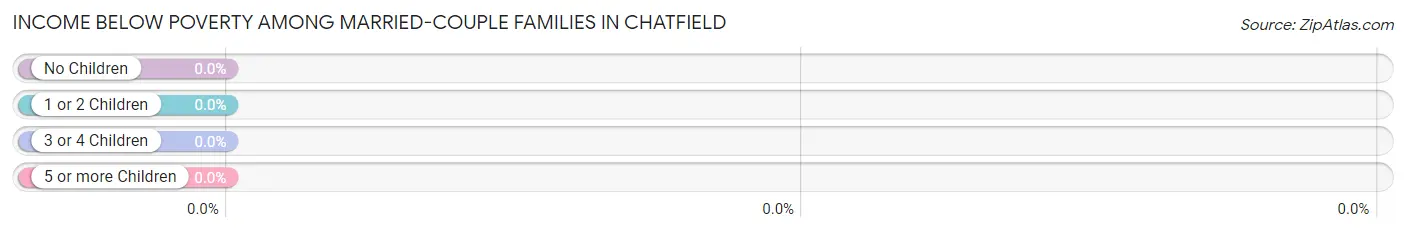
| Children | Above Poverty | Below Poverty |
| No Children | 350 (100.0%) | 0 (0.0%) |
| 1 or 2 Children | 159 (100.0%) | 0 (0.0%) |
| 3 or 4 Children | 62 (100.0%) | 0 (0.0%) |
| 5 or more Children | 12 (100.0%) | 0 (0.0%) |
| Total | 583 (100.0%) | 0 (0.0%) |
Income Below Poverty Among Single-Parent Households in Chatfield
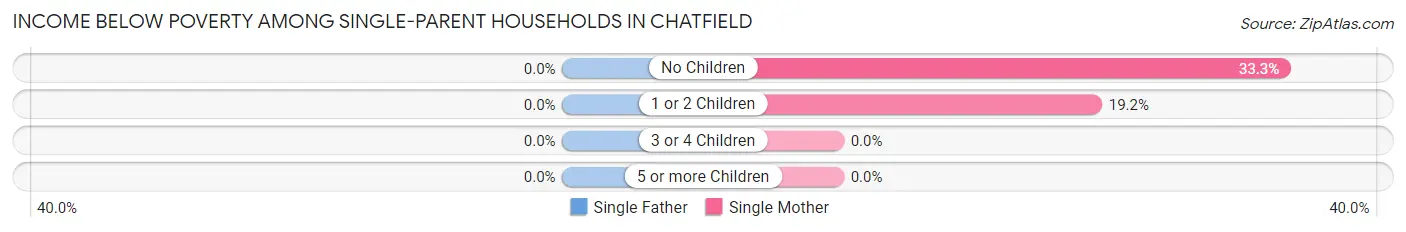
| Children | Single Father | Single Mother |
| No Children | 0 (0.0%) | 20 (33.3%) |
| 1 or 2 Children | 0 (0.0%) | 10 (19.2%) |
| 3 or 4 Children | 0 (0.0%) | 0 (0.0%) |
| 5 or more Children | 0 (0.0%) | 0 (0.0%) |
| Total | 0 (0.0%) | 30 (24.2%) |
Income Below Poverty Among Married-Couple vs Single-Parent Households in Chatfield
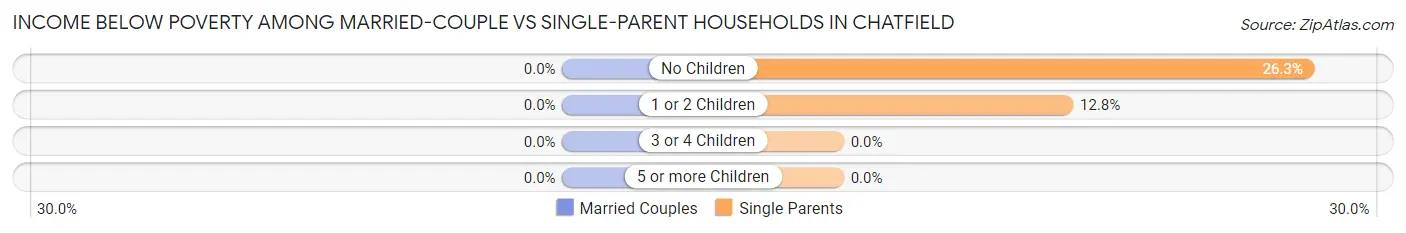
| Children | Married-Couple Families | Single-Parent Households |
| No Children | 0 (0.0%) | 20 (26.3%) |
| 1 or 2 Children | 0 (0.0%) | 10 (12.8%) |
| 3 or 4 Children | 0 (0.0%) | 0 (0.0%) |
| 5 or more Children | 0 (0.0%) | 0 (0.0%) |
| Total | 0 (0.0%) | 30 (18.1%) |
Race in Chatfield
The most populous races in Chatfield are White / Caucasian (2,626 | 95.2%), Two or more Races (81 | 2.9%), and Asian (48 | 1.7%).
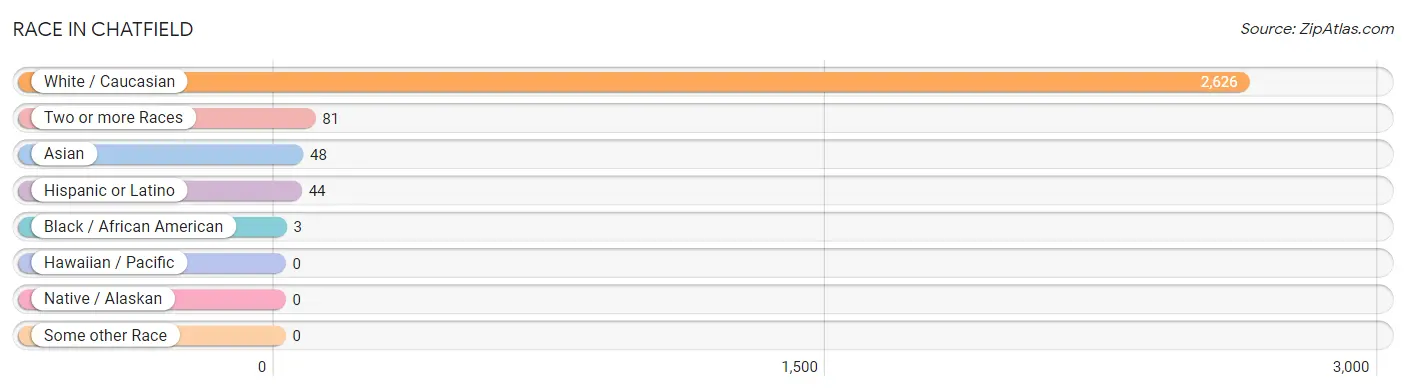
| Race | # Population | % Population |
| Asian | 48 | 1.7% |
| Black / African American | 3 | 0.1% |
| Hawaiian / Pacific | 0 | 0.0% |
| Hispanic or Latino | 44 | 1.6% |
| Native / Alaskan | 0 | 0.0% |
| White / Caucasian | 2,626 | 95.2% |
| Two or more Races | 81 | 2.9% |
| Some other Race | 0 | 0.0% |
| Total | 2,758 | 100.0% |
Ancestry in Chatfield
The most populous ancestries reported in Chatfield are German (1,032 | 37.4%), Norwegian (533 | 19.3%), Irish (373 | 13.5%), English (237 | 8.6%), and American (178 | 6.5%), together accounting for 85.3% of all Chatfield residents.
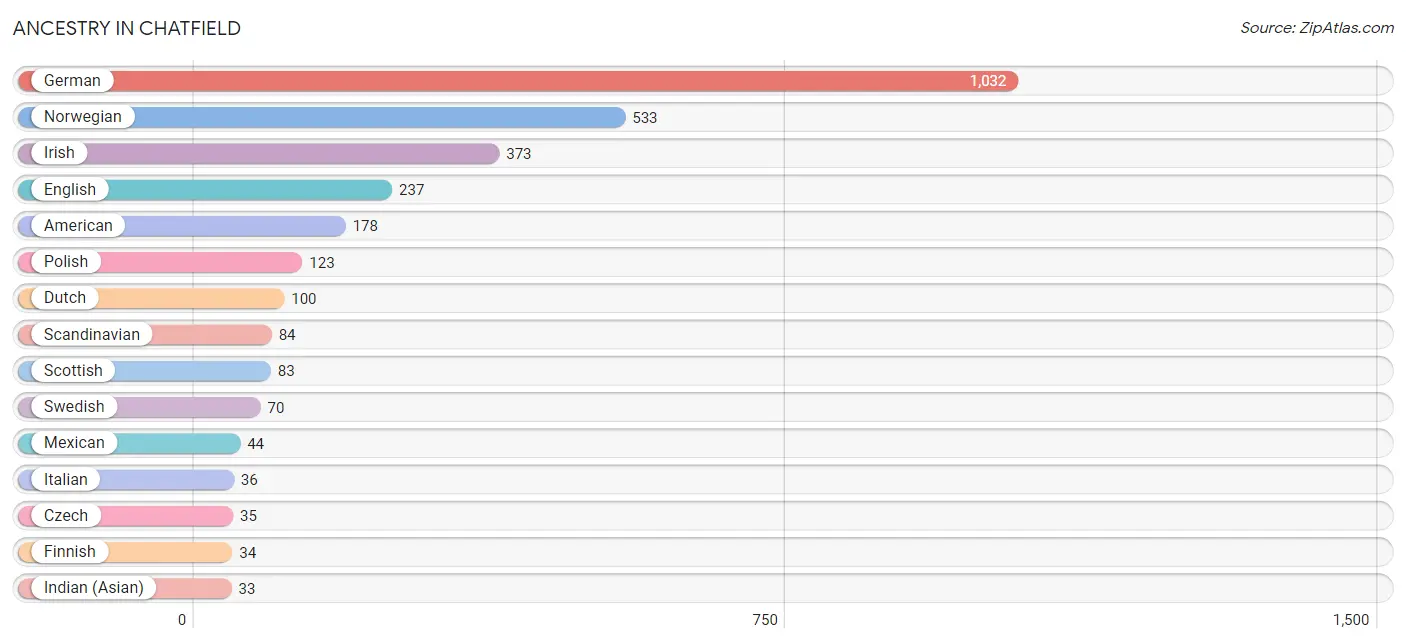
| Ancestry | # Population | % Population |
| American | 178 | 6.5% |
| Belgian | 7 | 0.3% |
| British | 3 | 0.1% |
| Cherokee | 1 | 0.0% |
| Czech | 35 | 1.3% |
| Danish | 31 | 1.1% |
| Dutch | 100 | 3.6% |
| Eastern European | 26 | 0.9% |
| English | 237 | 8.6% |
| European | 19 | 0.7% |
| Finnish | 34 | 1.2% |
| French | 19 | 0.7% |
| French Canadian | 5 | 0.2% |
| German | 1,032 | 37.4% |
| Indian (Asian) | 33 | 1.2% |
| Irish | 373 | 13.5% |
| Italian | 36 | 1.3% |
| Jamaican | 8 | 0.3% |
| Korean | 9 | 0.3% |
| Liberian | 3 | 0.1% |
| Luxembourger | 5 | 0.2% |
| Mexican | 44 | 1.6% |
| Norwegian | 533 | 19.3% |
| Polish | 123 | 4.5% |
| Russian | 12 | 0.4% |
| Scandinavian | 84 | 3.0% |
| Scottish | 83 | 3.0% |
| Slovene | 9 | 0.3% |
| Sri Lankan | 6 | 0.2% |
| Subsaharan African | 3 | 0.1% |
| Swedish | 70 | 2.5% |
| Swiss | 5 | 0.2% |
| Welsh | 5 | 0.2% | View All 33 Rows |
Immigrants in Chatfield
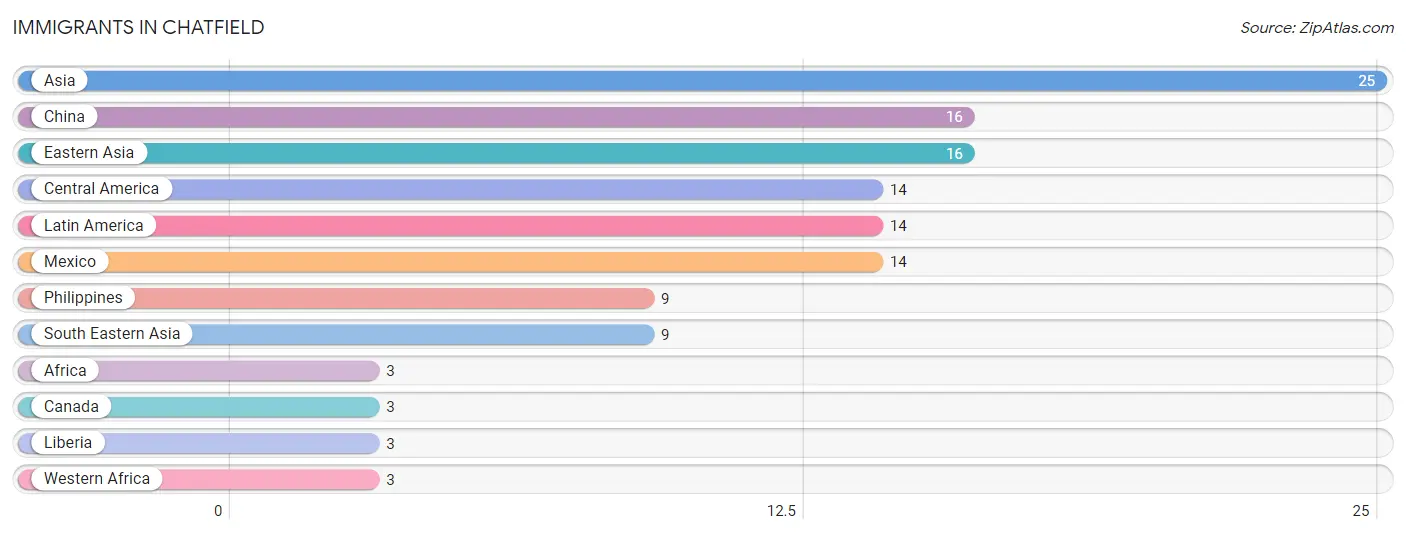
The most numerous immigrant groups reported in Chatfield came from Asia (25 | 0.9%), China (16 | 0.6%), Eastern Asia (16 | 0.6%), Central America (14 | 0.5%), and Latin America (14 | 0.5%), together accounting for 3.1% of all Chatfield residents.
| Immigration Origin | # Population | % Population |
| Africa | 3 | 0.1% |
| Asia | 25 | 0.9% |
| Canada | 3 | 0.1% |
| Central America | 14 | 0.5% |
| China | 16 | 0.6% |
| Eastern Asia | 16 | 0.6% |
| Latin America | 14 | 0.5% |
| Liberia | 3 | 0.1% |
| Mexico | 14 | 0.5% |
| Philippines | 9 | 0.3% |
| South Eastern Asia | 9 | 0.3% |
| Western Africa | 3 | 0.1% | View All 12 Rows |
Sex and Age in Chatfield
Sex and Age in Chatfield
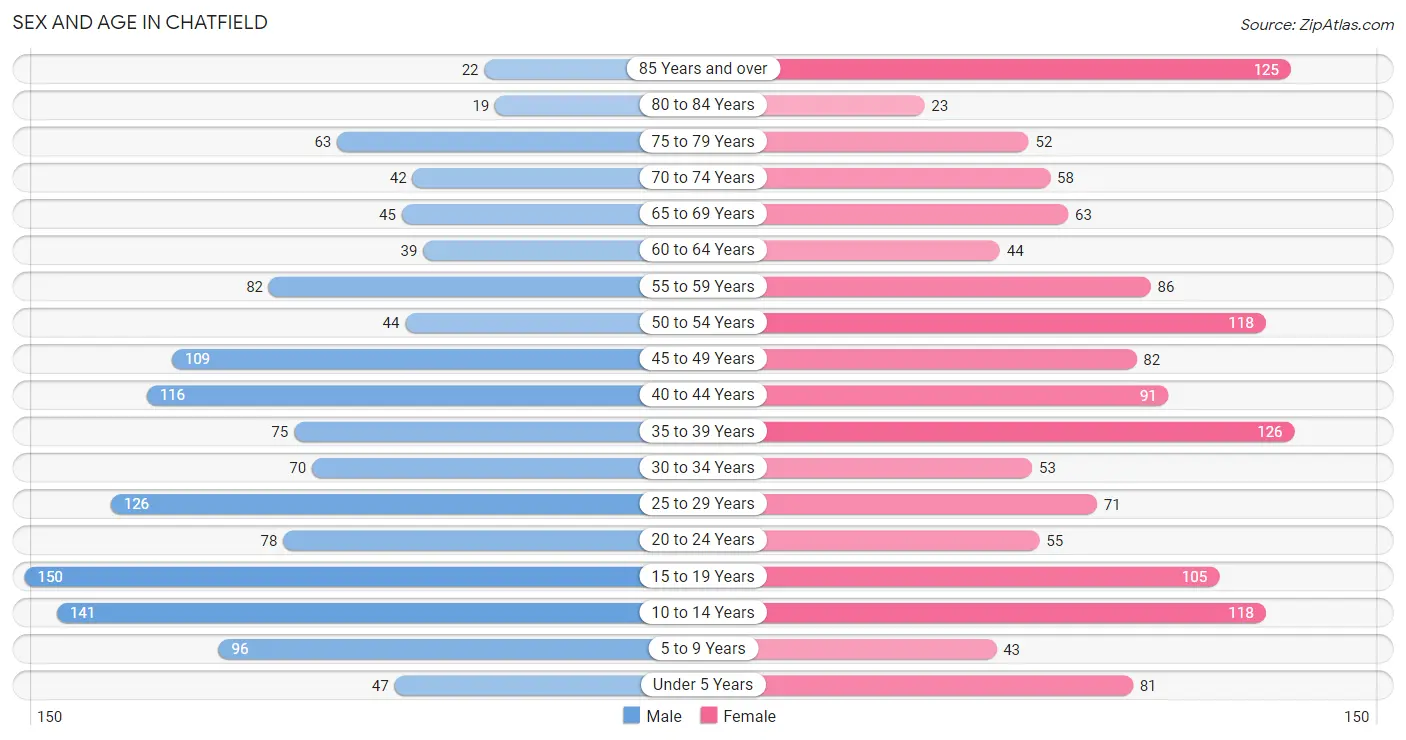
The most populous age groups in Chatfield are 15 to 19 Years (150 | 11.0%) for men and 35 to 39 Years (126 | 9.0%) for women.
| Age Bracket | Male | Female |
| Under 5 Years | 47 (3.5%) | 81 (5.8%) |
| 5 to 9 Years | 96 (7.0%) | 43 (3.1%) |
| 10 to 14 Years | 141 (10.3%) | 118 (8.5%) |
| 15 to 19 Years | 150 (11.0%) | 105 (7.5%) |
| 20 to 24 Years | 78 (5.7%) | 55 (4.0%) |
| 25 to 29 Years | 126 (9.2%) | 71 (5.1%) |
| 30 to 34 Years | 70 (5.1%) | 53 (3.8%) |
| 35 to 39 Years | 75 (5.5%) | 126 (9.0%) |
| 40 to 44 Years | 116 (8.5%) | 91 (6.5%) |
| 45 to 49 Years | 109 (8.0%) | 82 (5.9%) |
| 50 to 54 Years | 44 (3.2%) | 118 (8.5%) |
| 55 to 59 Years | 82 (6.0%) | 86 (6.2%) |
| 60 to 64 Years | 39 (2.9%) | 44 (3.2%) |
| 65 to 69 Years | 45 (3.3%) | 63 (4.5%) |
| 70 to 74 Years | 42 (3.1%) | 58 (4.2%) |
| 75 to 79 Years | 63 (4.6%) | 52 (3.7%) |
| 80 to 84 Years | 19 (1.4%) | 23 (1.7%) |
| 85 Years and over | 22 (1.6%) | 125 (9.0%) |
| Total | 1,364 (100.0%) | 1,394 (100.0%) |
Families and Households in Chatfield
Median Family Size in Chatfield
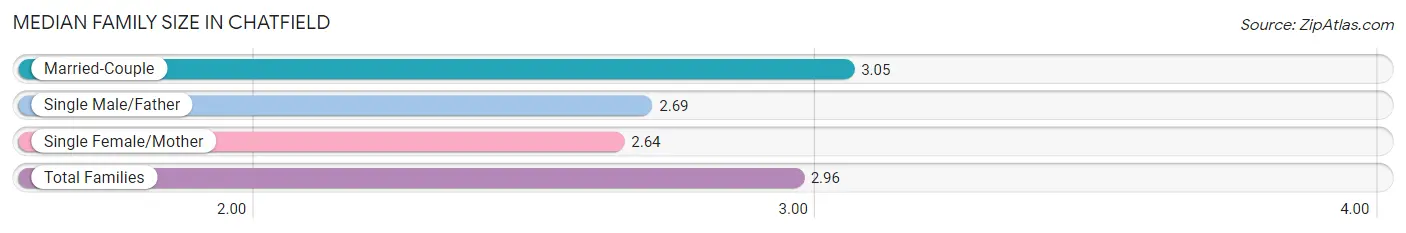
The median family size in Chatfield is 2.96 persons per family, with married-couple families (583 | 77.8%) accounting for the largest median family size of 3.05 persons per family. On the other hand, single female/mother families (124 | 16.6%) represent the smallest median family size with 2.64 persons per family.
| Family Type | # Families | Family Size |
| Married-Couple | 583 (77.8%) | 3.05 |
| Single Male/Father | 42 (5.6%) | 2.69 |
| Single Female/Mother | 124 (16.6%) | 2.64 |
| Total Families | 749 (100.0%) | 2.96 |
Median Household Size in Chatfield
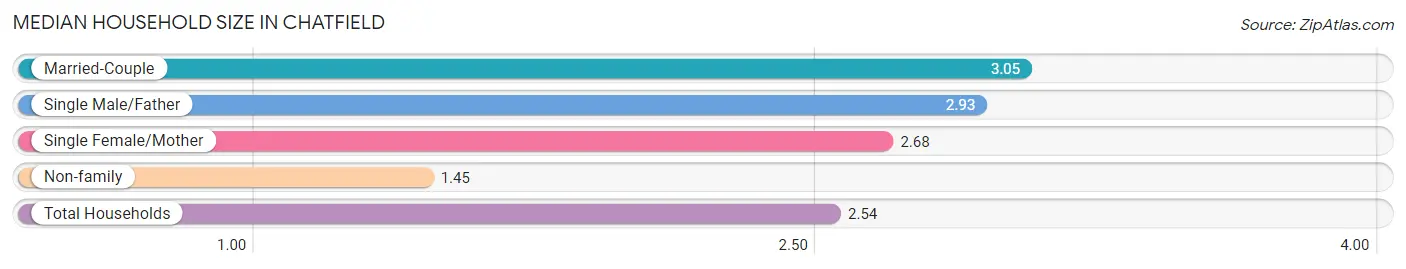
The median household size in Chatfield is 2.54 persons per household, with married-couple households (583 | 55.5%) accounting for the largest median household size of 3.05 persons per household. non-family households (302 | 28.7%) represent the smallest median household size with 1.45 persons per household.
| Household Type | # Households | Household Size |
| Married-Couple | 583 (55.5%) | 3.05 |
| Single Male/Father | 42 (4.0%) | 2.93 |
| Single Female/Mother | 124 (11.8%) | 2.68 |
| Non-family | 302 (28.7%) | 1.45 |
| Total Households | 1,051 (100.0%) | 2.54 |
Household Size by Marriage Status in Chatfield
Out of a total of 1,051 households in Chatfield, 749 (71.3%) are family households, while 302 (28.7%) are nonfamily households. The most numerous type of family households are 2-person households, comprising 391, and the most common type of nonfamily households are 1-person households, comprising 209.
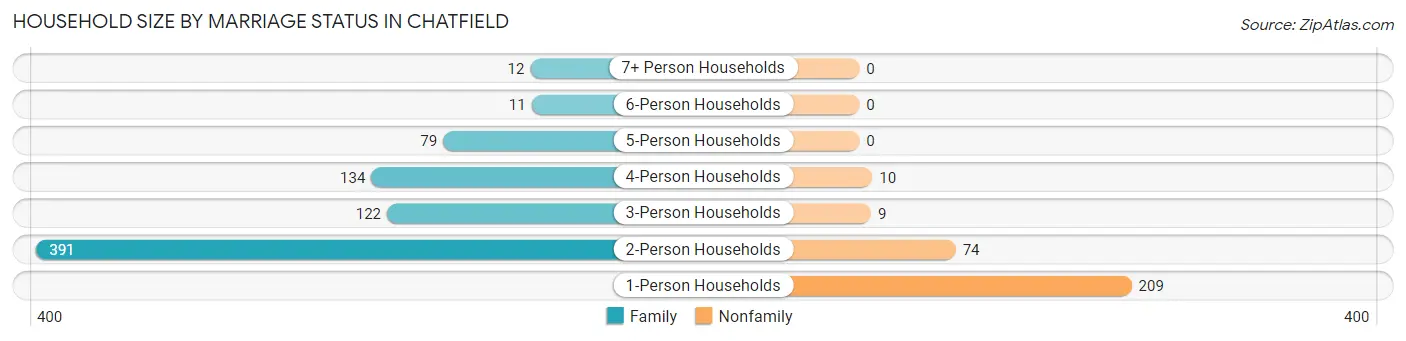
| Household Size | Family Households | Nonfamily Households |
| 1-Person Households | - | 209 (19.9%) |
| 2-Person Households | 391 (37.2%) | 74 (7.0%) |
| 3-Person Households | 122 (11.6%) | 9 (0.9%) |
| 4-Person Households | 134 (12.8%) | 10 (0.9%) |
| 5-Person Households | 79 (7.5%) | 0 (0.0%) |
| 6-Person Households | 11 (1.1%) | 0 (0.0%) |
| 7+ Person Households | 12 (1.1%) | 0 (0.0%) |
| Total | 749 (71.3%) | 302 (28.7%) |
Female Fertility in Chatfield
Fertility by Age in Chatfield
Average fertility rate in Chatfield is 45.0 births per 1,000 women. Women in the age bracket of 20 to 34 years have the highest fertility rate with 95.0 births per 1,000 women. Women in the age bracket of 20 to 34 years acount for 63.0% of all women with births.
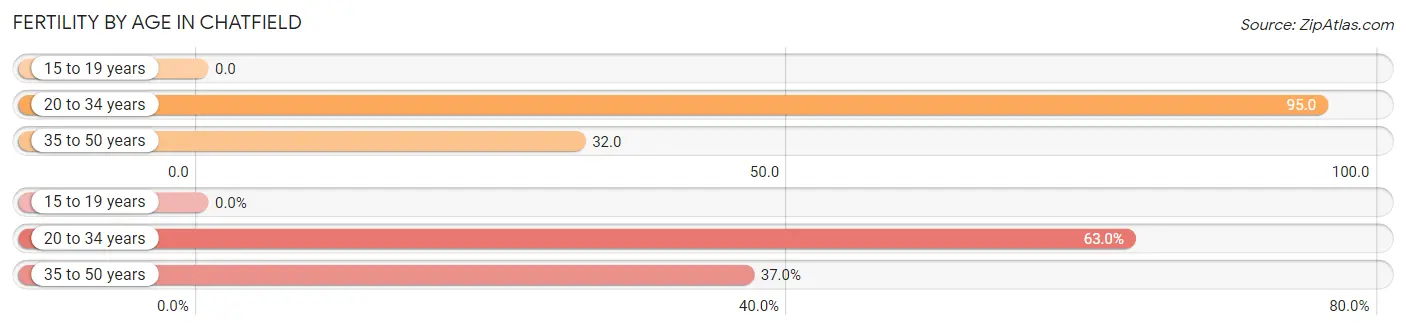
| Age Bracket | Women with Births | Births / 1,000 Women |
| 15 to 19 years | 0 (0.0%) | 0.0 |
| 20 to 34 years | 17 (63.0%) | 95.0 |
| 35 to 50 years | 10 (37.0%) | 32.0 |
| Total | 27 (100.0%) | 45.0 |
Fertility by Age by Marriage Status in Chatfield
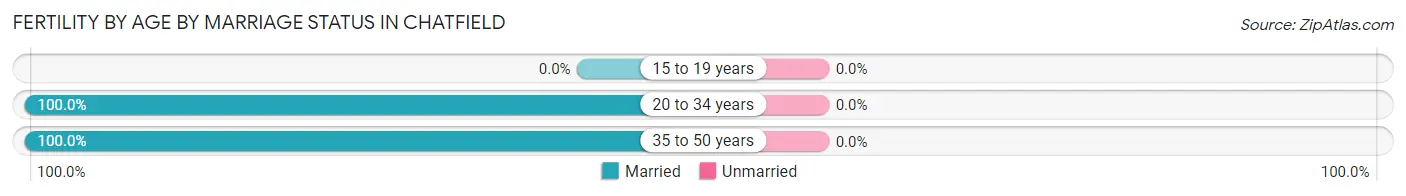
| Age Bracket | Married | Unmarried |
| 15 to 19 years | 0 (0.0%) | 0 (0.0%) |
| 20 to 34 years | 17 (100.0%) | 0 (0.0%) |
| 35 to 50 years | 10 (100.0%) | 0 (0.0%) |
| Total | 27 (100.0%) | 0 (0.0%) |
Fertility by Education in Chatfield
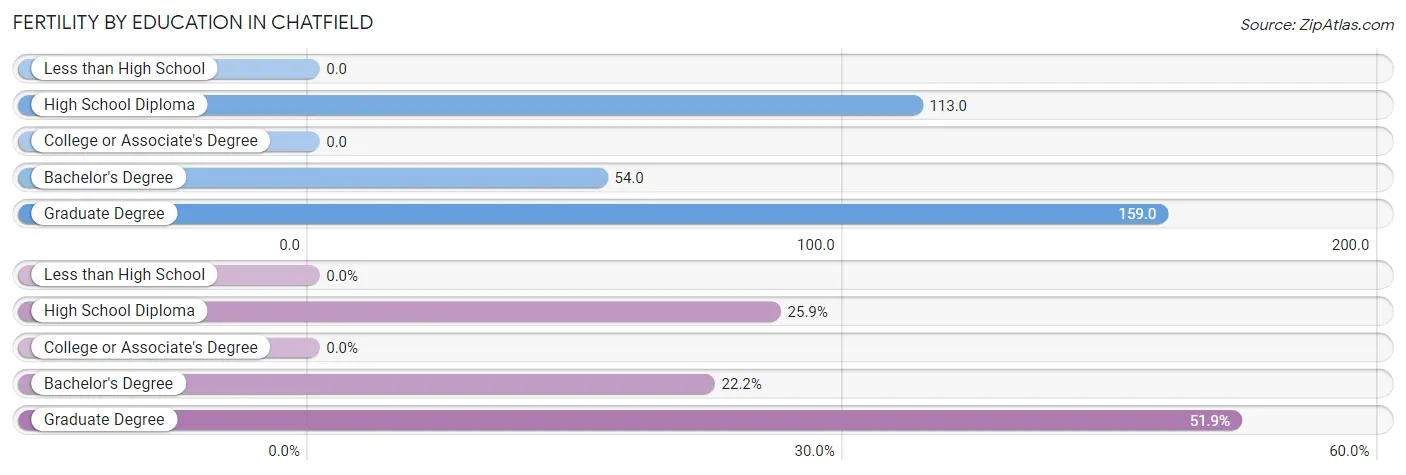
| Educational Attainment | Women with Births | Births / 1,000 Women |
| Less than High School | 0 (0.0%) | 0.0 |
| High School Diploma | 7 (25.9%) | 113.0 |
| College or Associate's Degree | 0 (0.0%) | 0.0 |
| Bachelor's Degree | 6 (22.2%) | 54.0 |
| Graduate Degree | 14 (51.8%) | 159.0 |
| Total | 27 (100.0%) | 45.0 |
Fertility by Education by Marriage Status in Chatfield
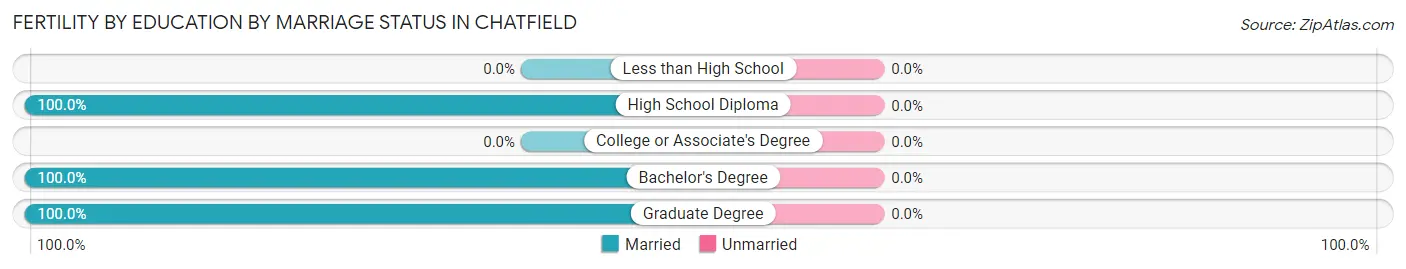
| Educational Attainment | Married | Unmarried |
| Less than High School | 0 (0.0%) | 0 (0.0%) |
| High School Diploma | 7 (100.0%) | 0 (0.0%) |
| College or Associate's Degree | 0 (0.0%) | 0 (0.0%) |
| Bachelor's Degree | 6 (100.0%) | 0 (0.0%) |
| Graduate Degree | 14 (100.0%) | 0 (0.0%) |
| Total | 27 (100.0%) | 0 (0.0%) |
Employment Characteristics in Chatfield
Employment by Class of Employer in Chatfield
Among the 1,514 employed individuals in Chatfield, private company employees (792 | 52.3%), not-for-profit organizations (369 | 24.4%), and local government employees (166 | 11.0%) make up the most common classes of employment.
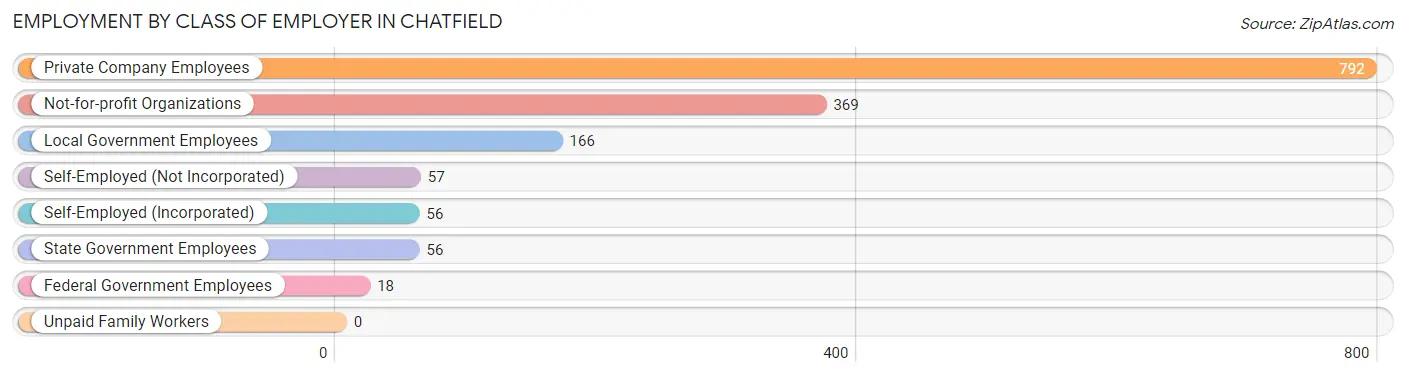
| Employer Class | # Employees | % Employees |
| Private Company Employees | 792 | 52.3% |
| Self-Employed (Incorporated) | 56 | 3.7% |
| Self-Employed (Not Incorporated) | 57 | 3.8% |
| Not-for-profit Organizations | 369 | 24.4% |
| Local Government Employees | 166 | 11.0% |
| State Government Employees | 56 | 3.7% |
| Federal Government Employees | 18 | 1.2% |
| Unpaid Family Workers | 0 | 0.0% |
| Total | 1,514 | 100.0% |
Employment Status by Age in Chatfield
According to the labor force statistics for Chatfield, out of the total population over 16 years of age (2,172), 71.8% or 1,559 individuals are in the labor force, with 1.9% or 30 of them unemployed. The age group with the highest labor force participation rate is 20 to 24 years, with 100.0% or 133 individuals in the labor force. Within the labor force, the 25 to 29 years age range has the highest percentage of unemployed individuals, with 10.3% or 19 of them being unemployed.
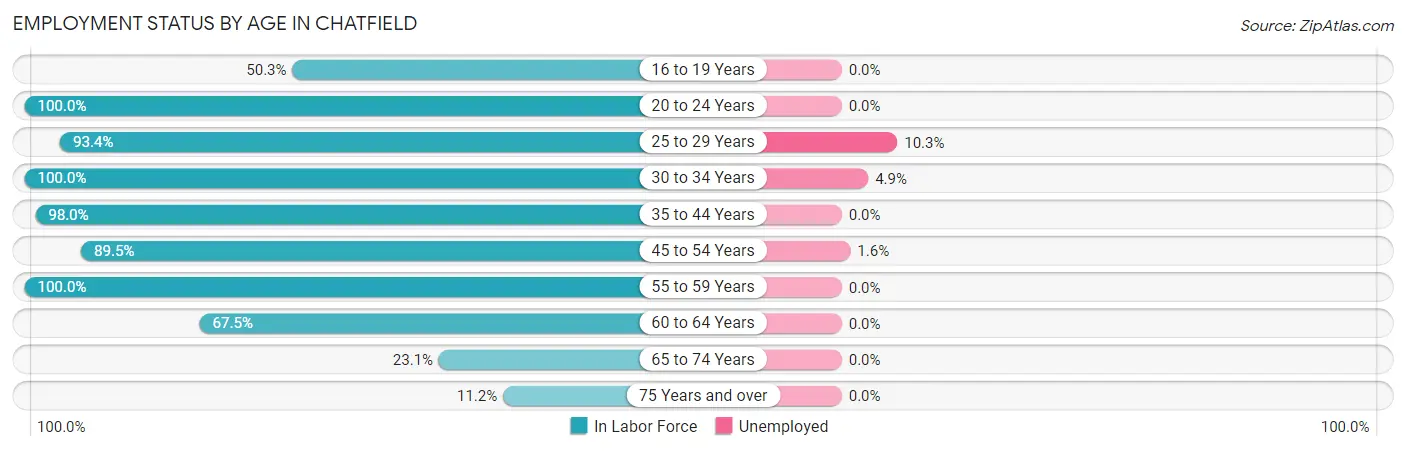
| Age Bracket | In Labor Force | Unemployed |
| 16 to 19 Years | 98 (50.3%) | 0 (0.0%) |
| 20 to 24 Years | 133 (100.0%) | 0 (0.0%) |
| 25 to 29 Years | 184 (93.4%) | 19 (10.3%) |
| 30 to 34 Years | 123 (100.0%) | 6 (4.9%) |
| 35 to 44 Years | 400 (98.0%) | 0 (0.0%) |
| 45 to 54 Years | 316 (89.5%) | 5 (1.6%) |
| 55 to 59 Years | 168 (100.0%) | 0 (0.0%) |
| 60 to 64 Years | 56 (67.5%) | 0 (0.0%) |
| 65 to 74 Years | 48 (23.1%) | 0 (0.0%) |
| 75 Years and over | 34 (11.2%) | 0 (0.0%) |
| Total | 1,559 (71.8%) | 30 (1.9%) |
Employment Status by Educational Attainment in Chatfield
According to labor force statistics for Chatfield, 93.6% of individuals (1,247) out of the total population between 25 and 64 years of age (1,332) are in the labor force, with 2.4% or 30 of them being unemployed. The group with the highest labor force participation rate are those with the educational attainment of college / associate degree, with 96.3% or 522 individuals in the labor force. Within the labor force, individuals with college / associate degree education have the highest percentage of unemployment, with 4.8% or 25 of them being unemployed.
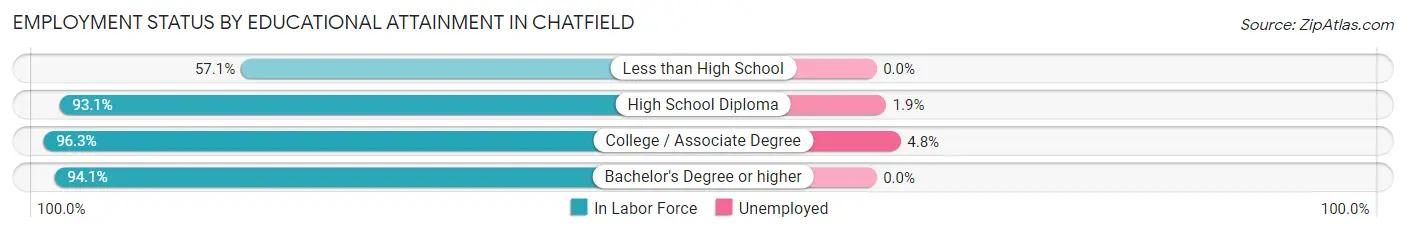
| Educational Attainment | In Labor Force | Unemployed |
| Less than High School | 24 (57.1%) | 0 (0.0%) |
| High School Diploma | 268 (93.1%) | 5 (1.9%) |
| College / Associate Degree | 522 (96.3%) | 26 (4.8%) |
| Bachelor's Degree or higher | 433 (94.1%) | 0 (0.0%) |
| Total | 1,247 (93.6%) | 32 (2.4%) |
Employment Occupations by Sex in Chatfield
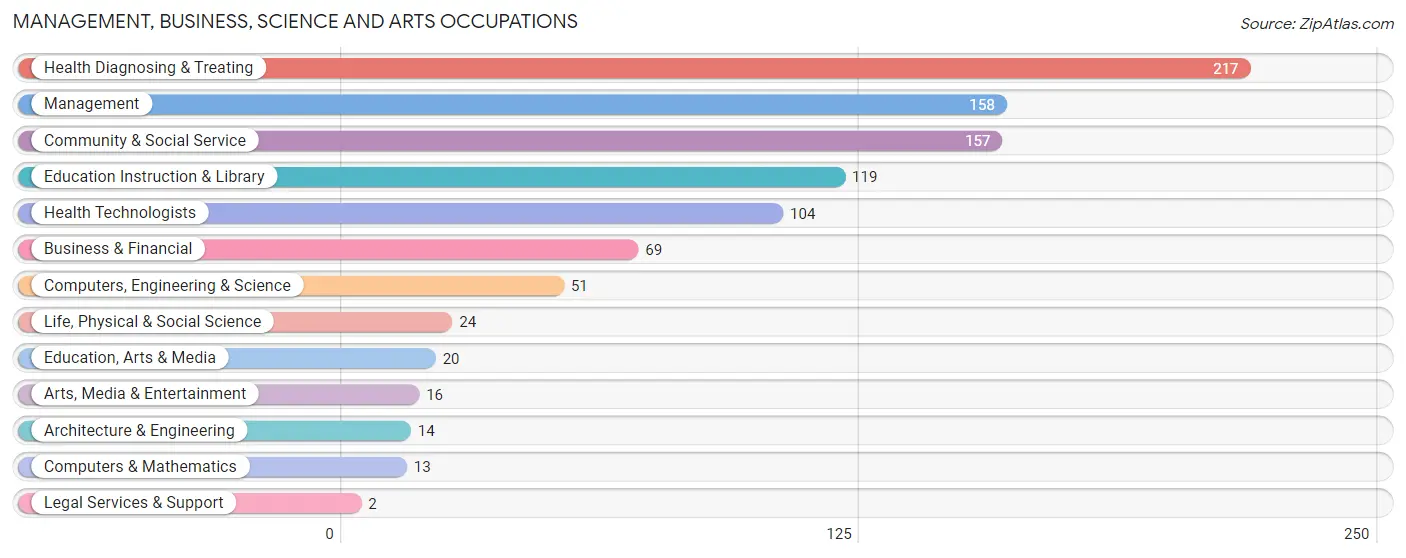
Management, Business, Science and Arts Occupations
The most common Management, Business, Science and Arts occupations in Chatfield are Health Diagnosing & Treating (217 | 14.2%), Management (158 | 10.3%), Community & Social Service (157 | 10.3%), Education Instruction & Library (119 | 7.8%), and Health Technologists (104 | 6.8%).
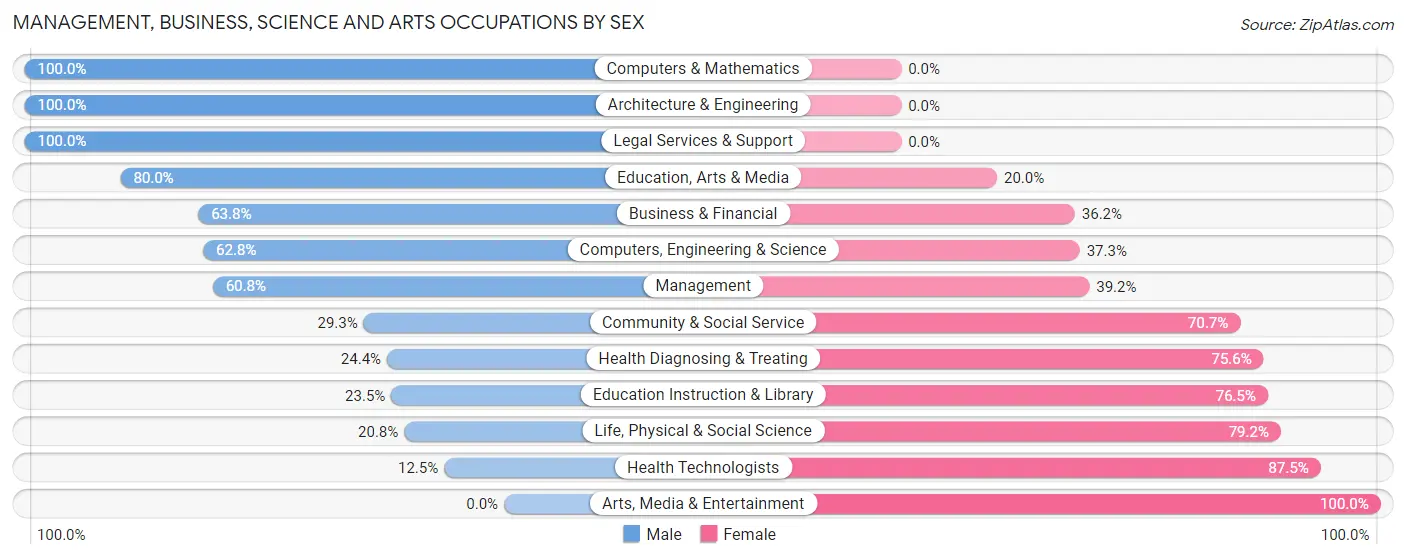
Management, Business, Science and Arts Occupations by Sex
Within the Management, Business, Science and Arts occupations in Chatfield, the most male-oriented occupations are Computers & Mathematics (100.0%), Architecture & Engineering (100.0%), and Legal Services & Support (100.0%), while the most female-oriented occupations are Arts, Media & Entertainment (100.0%), Health Technologists (87.5%), and Life, Physical & Social Science (79.2%).
| Occupation | Male | Female |
| Management | 96 (60.8%) | 62 (39.2%) |
| Business & Financial | 44 (63.8%) | 25 (36.2%) |
| Computers, Engineering & Science | 32 (62.7%) | 19 (37.2%) |
| Computers & Mathematics | 13 (100.0%) | 0 (0.0%) |
| Architecture & Engineering | 14 (100.0%) | 0 (0.0%) |
| Life, Physical & Social Science | 5 (20.8%) | 19 (79.2%) |
| Community & Social Service | 46 (29.3%) | 111 (70.7%) |
| Education, Arts & Media | 16 (80.0%) | 4 (20.0%) |
| Legal Services & Support | 2 (100.0%) | 0 (0.0%) |
| Education Instruction & Library | 28 (23.5%) | 91 (76.5%) |
| Arts, Media & Entertainment | 0 (0.0%) | 16 (100.0%) |
| Health Diagnosing & Treating | 53 (24.4%) | 164 (75.6%) |
| Health Technologists | 13 (12.5%) | 91 (87.5%) |
| Total (Category) | 271 (41.6%) | 381 (58.4%) |
| Total (Overall) | 809 (52.9%) | 721 (47.1%) |
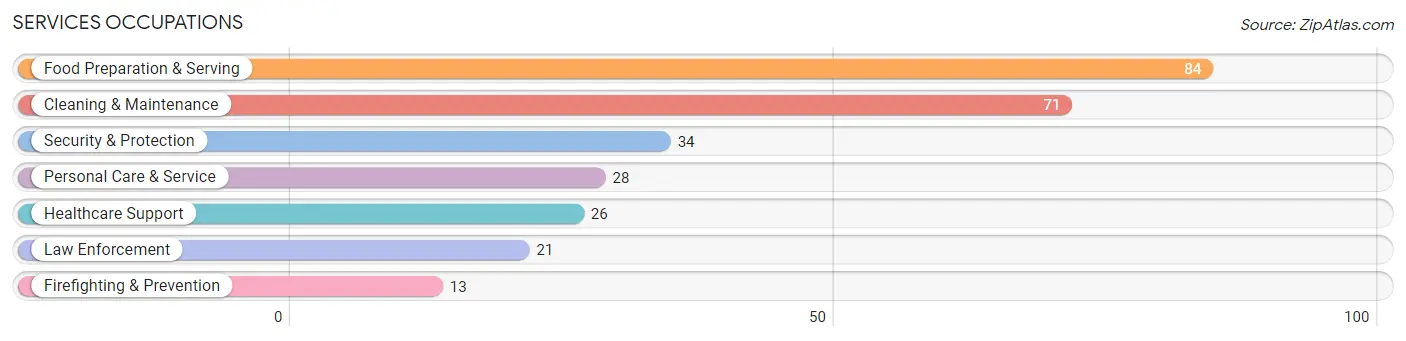
Services Occupations
The most common Services occupations in Chatfield are Food Preparation & Serving (84 | 5.5%), Cleaning & Maintenance (71 | 4.6%), Security & Protection (34 | 2.2%), Personal Care & Service (28 | 1.8%), and Healthcare Support (26 | 1.7%).
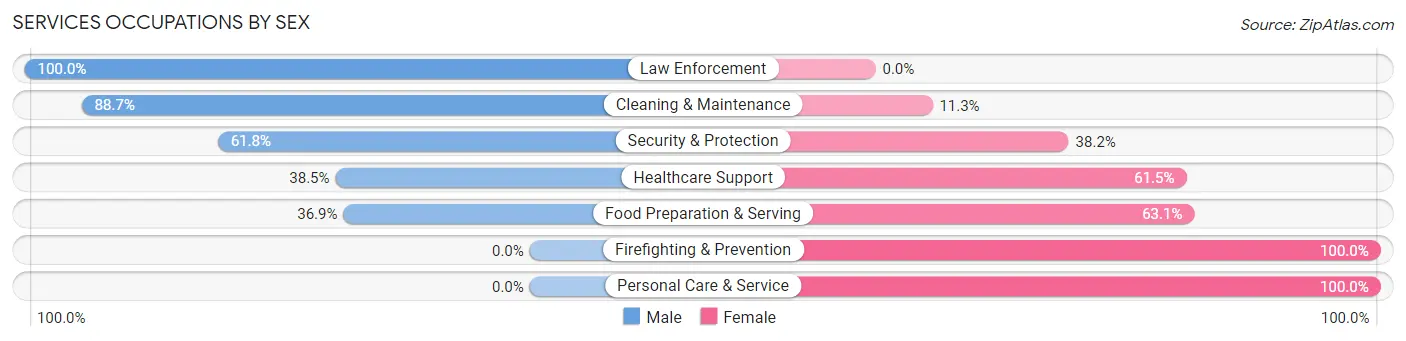
Services Occupations by Sex
Within the Services occupations in Chatfield, the most male-oriented occupations are Law Enforcement (100.0%), Cleaning & Maintenance (88.7%), and Security & Protection (61.8%), while the most female-oriented occupations are Firefighting & Prevention (100.0%), Personal Care & Service (100.0%), and Food Preparation & Serving (63.1%).
| Occupation | Male | Female |
| Healthcare Support | 10 (38.5%) | 16 (61.5%) |
| Security & Protection | 21 (61.8%) | 13 (38.2%) |
| Firefighting & Prevention | 0 (0.0%) | 13 (100.0%) |
| Law Enforcement | 21 (100.0%) | 0 (0.0%) |
| Food Preparation & Serving | 31 (36.9%) | 53 (63.1%) |
| Cleaning & Maintenance | 63 (88.7%) | 8 (11.3%) |
| Personal Care & Service | 0 (0.0%) | 28 (100.0%) |
| Total (Category) | 125 (51.4%) | 118 (48.6%) |
| Total (Overall) | 809 (52.9%) | 721 (47.1%) |
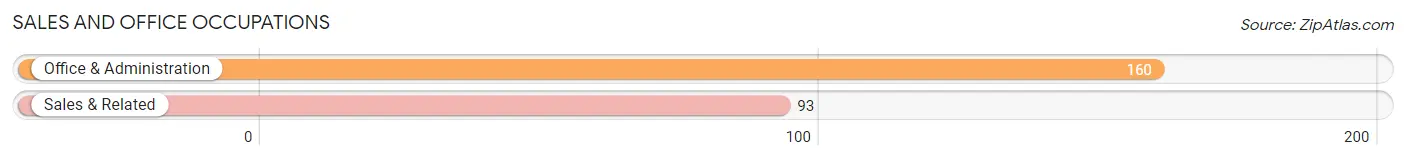
Sales and Office Occupations
The most common Sales and Office occupations in Chatfield are Office & Administration (160 | 10.5%), and Sales & Related (93 | 6.1%).
Sales and Office Occupations by Sex
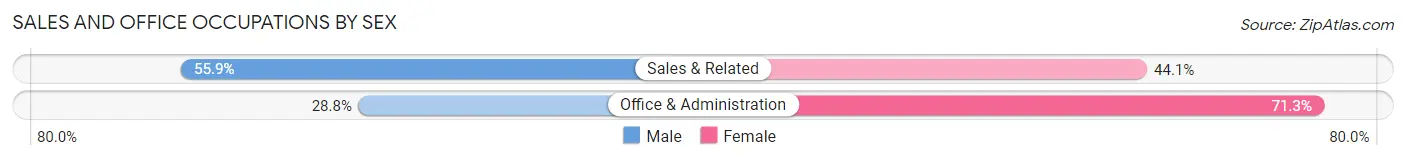
| Occupation | Male | Female |
| Sales & Related | 52 (55.9%) | 41 (44.1%) |
| Office & Administration | 46 (28.7%) | 114 (71.3%) |
| Total (Category) | 98 (38.7%) | 155 (61.3%) |
| Total (Overall) | 809 (52.9%) | 721 (47.1%) |
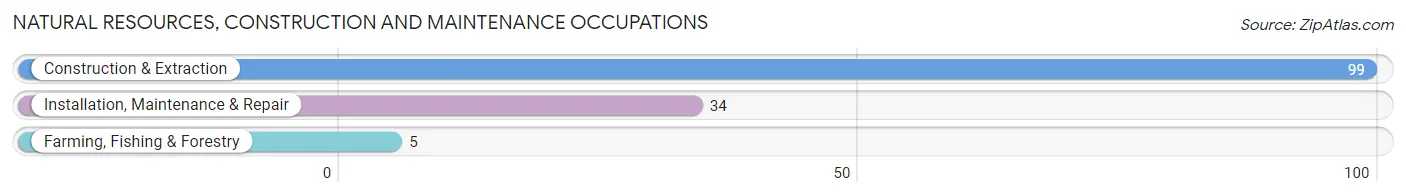
Natural Resources, Construction and Maintenance Occupations
The most common Natural Resources, Construction and Maintenance occupations in Chatfield are Construction & Extraction (99 | 6.5%), Installation, Maintenance & Repair (34 | 2.2%), and Farming, Fishing & Forestry (5 | 0.3%).
Natural Resources, Construction and Maintenance Occupations by Sex
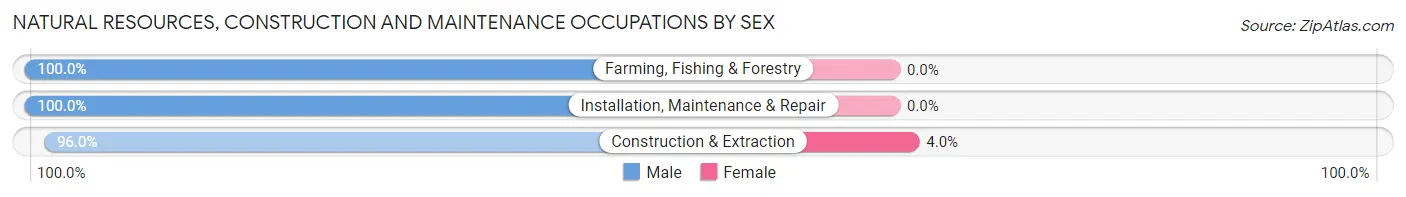
| Occupation | Male | Female |
| Farming, Fishing & Forestry | 5 (100.0%) | 0 (0.0%) |
| Construction & Extraction | 95 (96.0%) | 4 (4.0%) |
| Installation, Maintenance & Repair | 34 (100.0%) | 0 (0.0%) |
| Total (Category) | 134 (97.1%) | 4 (2.9%) |
| Total (Overall) | 809 (52.9%) | 721 (47.1%) |
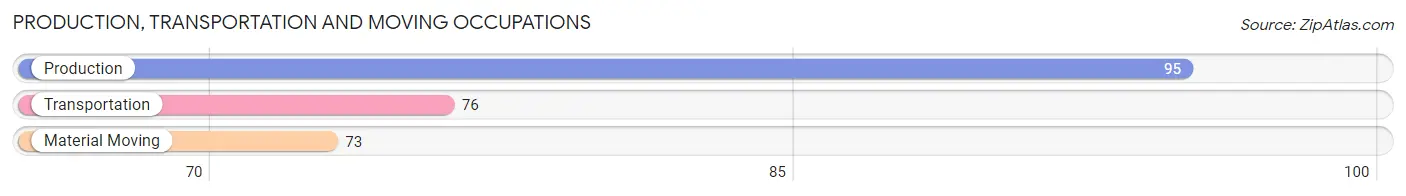
Production, Transportation and Moving Occupations
The most common Production, Transportation and Moving occupations in Chatfield are Production (95 | 6.2%), Transportation (76 | 5.0%), and Material Moving (73 | 4.8%).
Production, Transportation and Moving Occupations by Sex
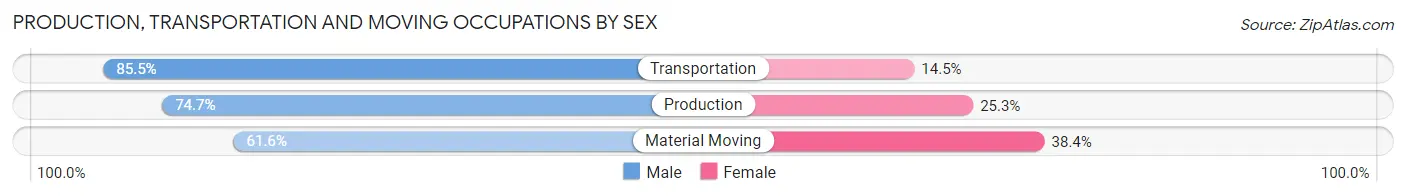
| Occupation | Male | Female |
| Production | 71 (74.7%) | 24 (25.3%) |
| Transportation | 65 (85.5%) | 11 (14.5%) |
| Material Moving | 45 (61.6%) | 28 (38.4%) |
| Total (Category) | 181 (74.2%) | 63 (25.8%) |
| Total (Overall) | 809 (52.9%) | 721 (47.1%) |
Employment Industries by Sex in Chatfield
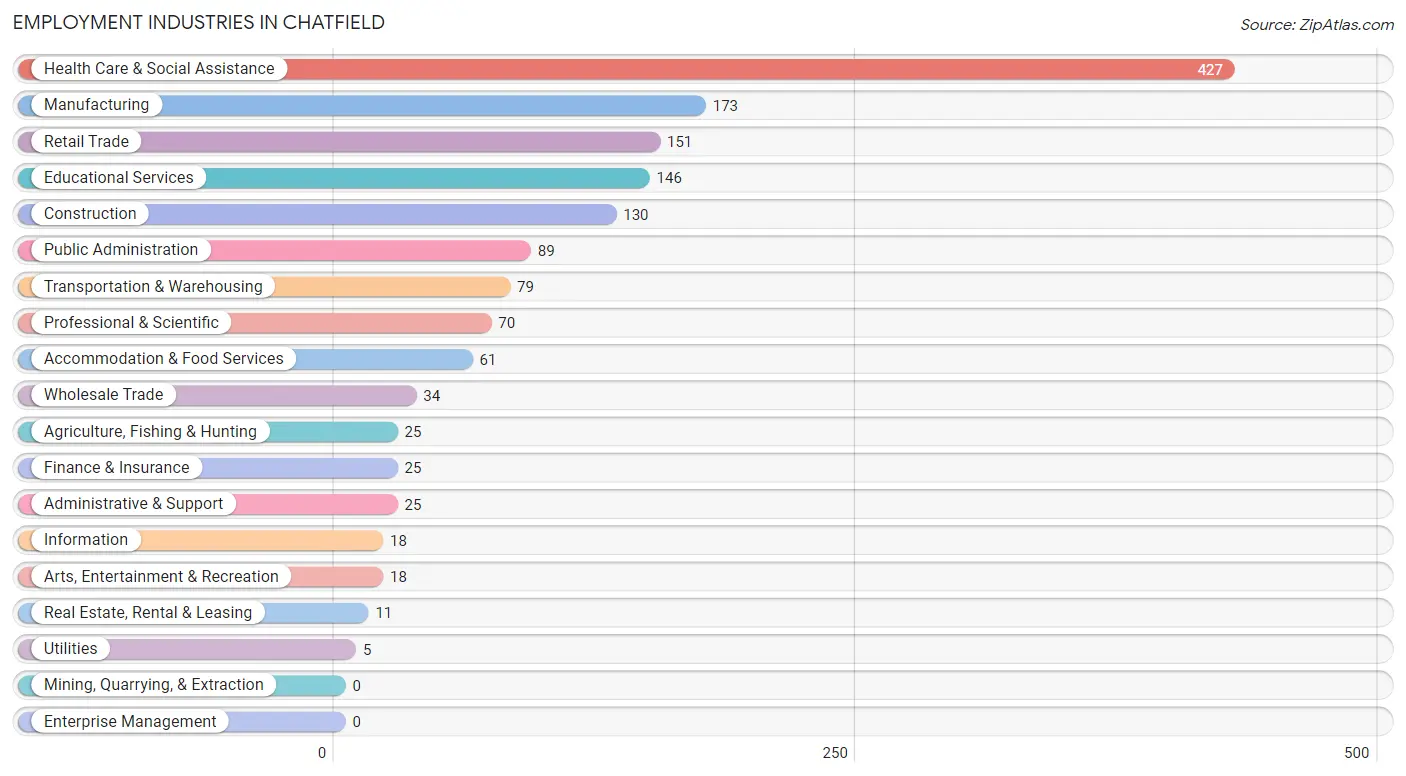
Employment Industries in Chatfield
The major employment industries in Chatfield include Health Care & Social Assistance (427 | 27.9%), Manufacturing (173 | 11.3%), Retail Trade (151 | 9.9%), Educational Services (146 | 9.5%), and Construction (130 | 8.5%).
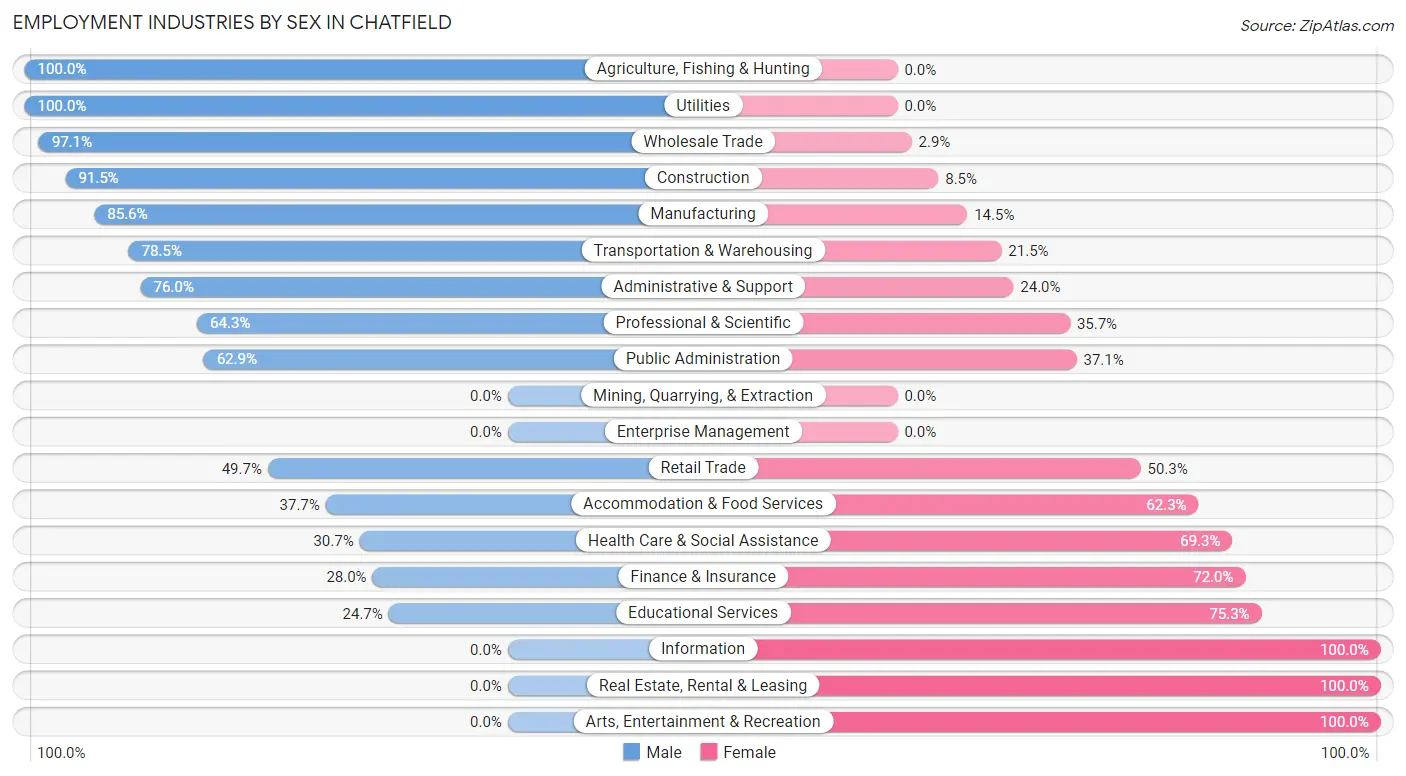
Employment Industries by Sex in Chatfield
The Chatfield industries that see more men than women are Agriculture, Fishing & Hunting (100.0%), Utilities (100.0%), and Wholesale Trade (97.1%), whereas the industries that tend to have a higher number of women are Information (100.0%), Real Estate, Rental & Leasing (100.0%), and Arts, Entertainment & Recreation (100.0%).
| Industry | Male | Female |
| Agriculture, Fishing & Hunting | 25 (100.0%) | 0 (0.0%) |
| Mining, Quarrying, & Extraction | 0 (0.0%) | 0 (0.0%) |
| Construction | 119 (91.5%) | 11 (8.5%) |
| Manufacturing | 148 (85.6%) | 25 (14.4%) |
| Wholesale Trade | 33 (97.1%) | 1 (2.9%) |
| Retail Trade | 75 (49.7%) | 76 (50.3%) |
| Transportation & Warehousing | 62 (78.5%) | 17 (21.5%) |
| Utilities | 5 (100.0%) | 0 (0.0%) |
| Information | 0 (0.0%) | 18 (100.0%) |
| Finance & Insurance | 7 (28.0%) | 18 (72.0%) |
| Real Estate, Rental & Leasing | 0 (0.0%) | 11 (100.0%) |
| Professional & Scientific | 45 (64.3%) | 25 (35.7%) |
| Enterprise Management | 0 (0.0%) | 0 (0.0%) |
| Administrative & Support | 19 (76.0%) | 6 (24.0%) |
| Educational Services | 36 (24.7%) | 110 (75.3%) |
| Health Care & Social Assistance | 131 (30.7%) | 296 (69.3%) |
| Arts, Entertainment & Recreation | 0 (0.0%) | 18 (100.0%) |
| Accommodation & Food Services | 23 (37.7%) | 38 (62.3%) |
| Public Administration | 56 (62.9%) | 33 (37.1%) |
| Total | 809 (52.9%) | 721 (47.1%) |
Education in Chatfield
School Enrollment in Chatfield
The most common levels of schooling among the 728 students in Chatfield are high school (221 | 30.4%), middle school (209 | 28.7%), and college / undergraduate (125 | 17.2%).
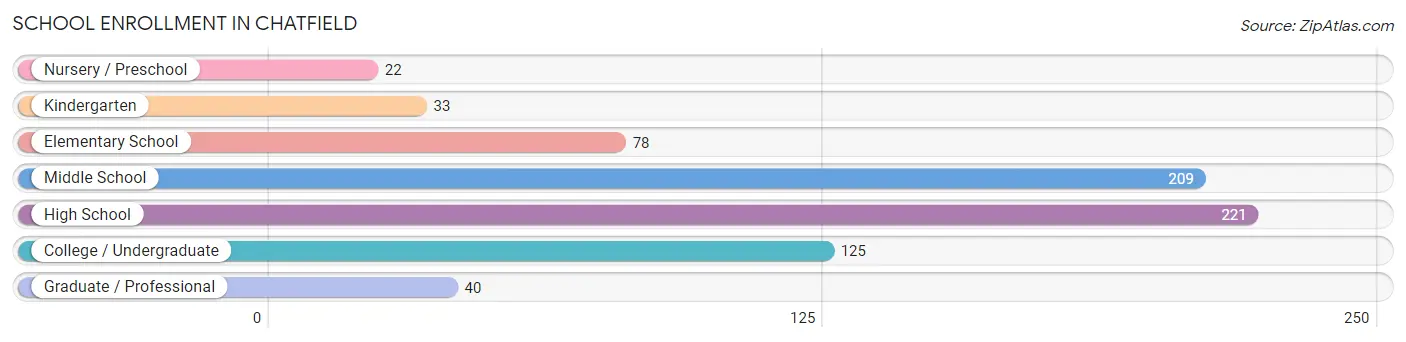
| School Level | # Students | % Students |
| Nursery / Preschool | 22 | 3.0% |
| Kindergarten | 33 | 4.5% |
| Elementary School | 78 | 10.7% |
| Middle School | 209 | 28.7% |
| High School | 221 | 30.4% |
| College / Undergraduate | 125 | 17.2% |
| Graduate / Professional | 40 | 5.5% |
| Total | 728 | 100.0% |
School Enrollment by Age by Funding Source in Chatfield
Out of a total of 728 students who are enrolled in schools in Chatfield, 60 (8.2%) attend a private institution, while the remaining 668 (91.8%) are enrolled in public schools. The age group of 35 years and over has the highest likelihood of being enrolled in private schools, with 24 (50.0% in the age bracket) enrolled. Conversely, the age group of 3 to 4 year olds has the lowest likelihood of being enrolled in a private school, with 6 (100.0% in the age bracket) attending a public institution.
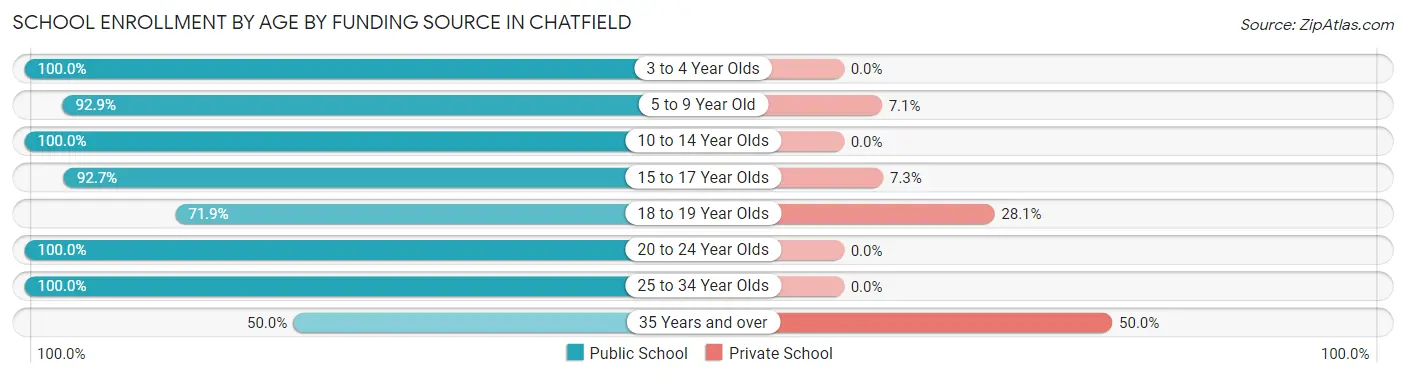
| Age Bracket | Public School | Private School |
| 3 to 4 Year Olds | 6 (100.0%) | 0 (0.0%) |
| 5 to 9 Year Old | 118 (92.9%) | 9 (7.1%) |
| 10 to 14 Year Olds | 250 (100.0%) | 0 (0.0%) |
| 15 to 17 Year Olds | 139 (92.7%) | 11 (7.3%) |
| 18 to 19 Year Olds | 41 (71.9%) | 16 (28.1%) |
| 20 to 24 Year Olds | 65 (100.0%) | 0 (0.0%) |
| 25 to 34 Year Olds | 25 (100.0%) | 0 (0.0%) |
| 35 Years and over | 24 (50.0%) | 24 (50.0%) |
| Total | 668 (91.8%) | 60 (8.2%) |
Educational Attainment by Field of Study in Chatfield
Education (191 | 29.6%), science & technology (100 | 15.5%), business (82 | 12.7%), bio, nature & agricultural (57 | 8.8%), and social sciences (38 | 5.9%) are the most common fields of study among 645 individuals in Chatfield who have obtained a bachelor's degree or higher.
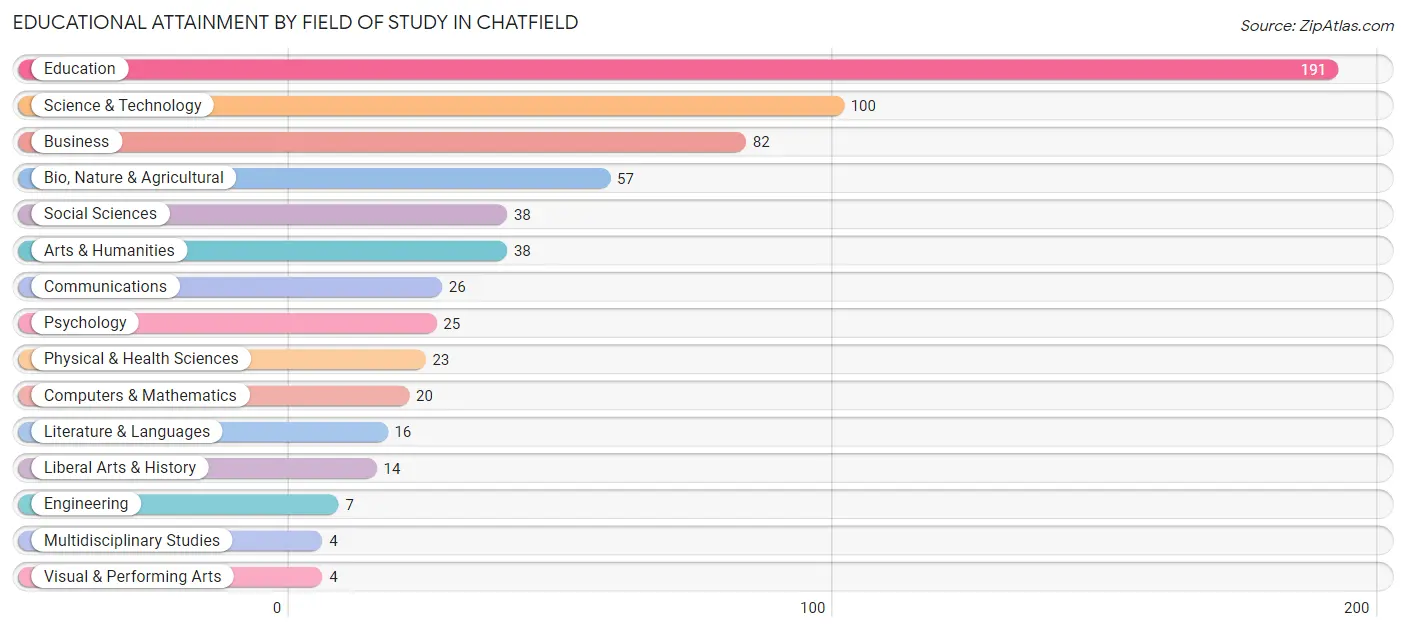
| Field of Study | # Graduates | % Graduates |
| Computers & Mathematics | 20 | 3.1% |
| Bio, Nature & Agricultural | 57 | 8.8% |
| Physical & Health Sciences | 23 | 3.6% |
| Psychology | 25 | 3.9% |
| Social Sciences | 38 | 5.9% |
| Engineering | 7 | 1.1% |
| Multidisciplinary Studies | 4 | 0.6% |
| Science & Technology | 100 | 15.5% |
| Business | 82 | 12.7% |
| Education | 191 | 29.6% |
| Literature & Languages | 16 | 2.5% |
| Liberal Arts & History | 14 | 2.2% |
| Visual & Performing Arts | 4 | 0.6% |
| Communications | 26 | 4.0% |
| Arts & Humanities | 38 | 5.9% |
| Total | 645 | 100.0% |
Transportation & Commute in Chatfield
Vehicle Availability by Sex in Chatfield
The most prevalent vehicle ownership categories in Chatfield are males with 2 vehicles (420, accounting for 52.2%) and females with 2 vehicles (357, making up 59.2%).
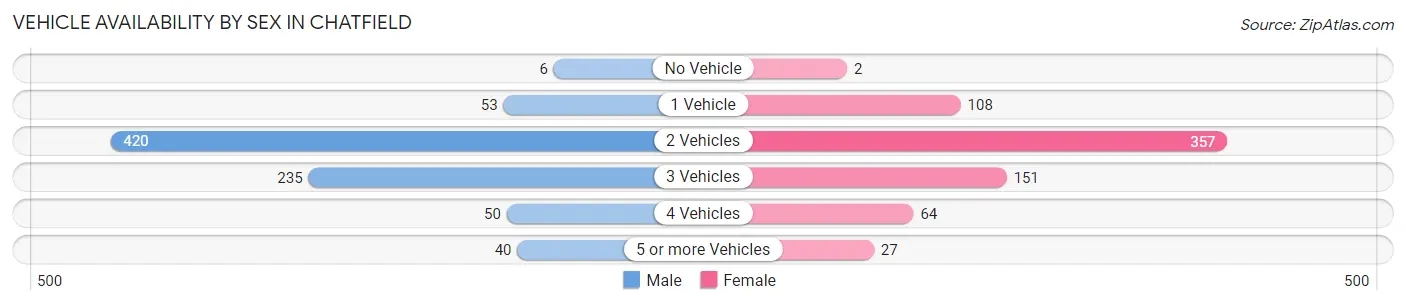
| Vehicles Available | Male | Female |
| No Vehicle | 6 (0.7%) | 2 (0.3%) |
| 1 Vehicle | 53 (6.6%) | 108 (15.2%) |
| 2 Vehicles | 420 (52.2%) | 357 (50.3%) |
| 3 Vehicles | 235 (29.2%) | 151 (21.3%) |
| 4 Vehicles | 50 (6.2%) | 64 (9.0%) |
| 5 or more Vehicles | 40 (5.0%) | 27 (3.8%) |
| Total | 804 (100.0%) | 709 (100.0%) |
Commute Time in Chatfield
The most frequently occuring commute durations in Chatfield are 30 to 34 minutes (399 commuters, 27.6%), 5 to 9 minutes (243 commuters, 16.8%), and 25 to 29 minutes (191 commuters, 13.2%).
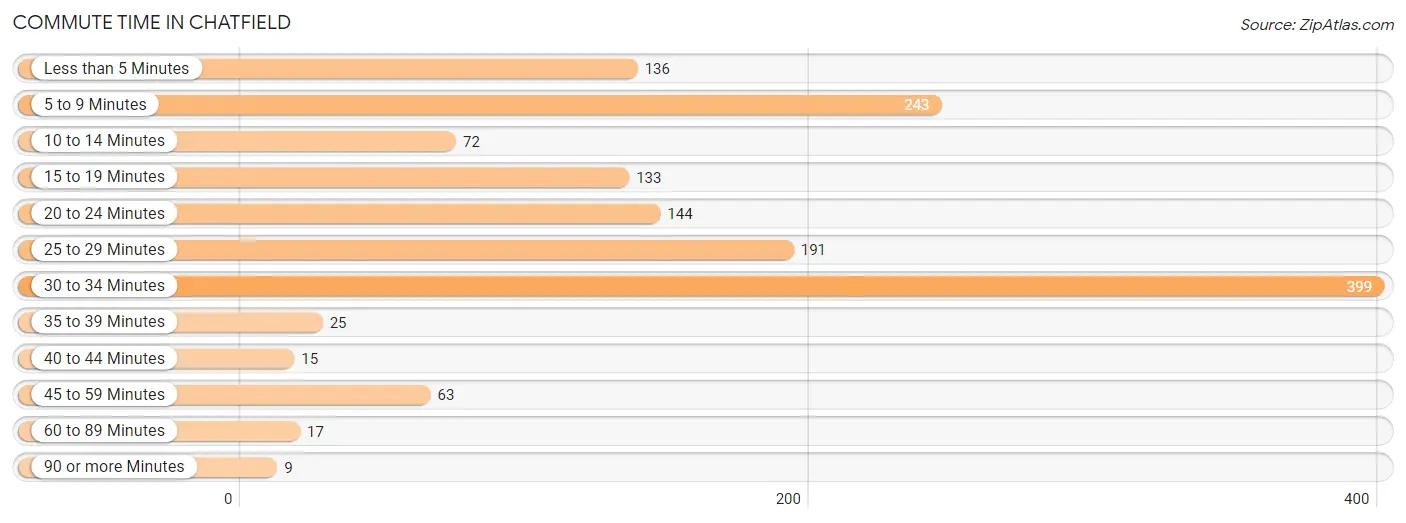
| Commute Time | # Commuters | % Commuters |
| Less than 5 Minutes | 136 | 9.4% |
| 5 to 9 Minutes | 243 | 16.8% |
| 10 to 14 Minutes | 72 | 5.0% |
| 15 to 19 Minutes | 133 | 9.2% |
| 20 to 24 Minutes | 144 | 10.0% |
| 25 to 29 Minutes | 191 | 13.2% |
| 30 to 34 Minutes | 399 | 27.6% |
| 35 to 39 Minutes | 25 | 1.7% |
| 40 to 44 Minutes | 15 | 1.0% |
| 45 to 59 Minutes | 63 | 4.3% |
| 60 to 89 Minutes | 17 | 1.2% |
| 90 or more Minutes | 9 | 0.6% |
Commute Time by Sex in Chatfield
The most common commute times in Chatfield are 30 to 34 minutes (253 commuters, 32.4%) for males and 30 to 34 minutes (146 commuters, 21.9%) for females.
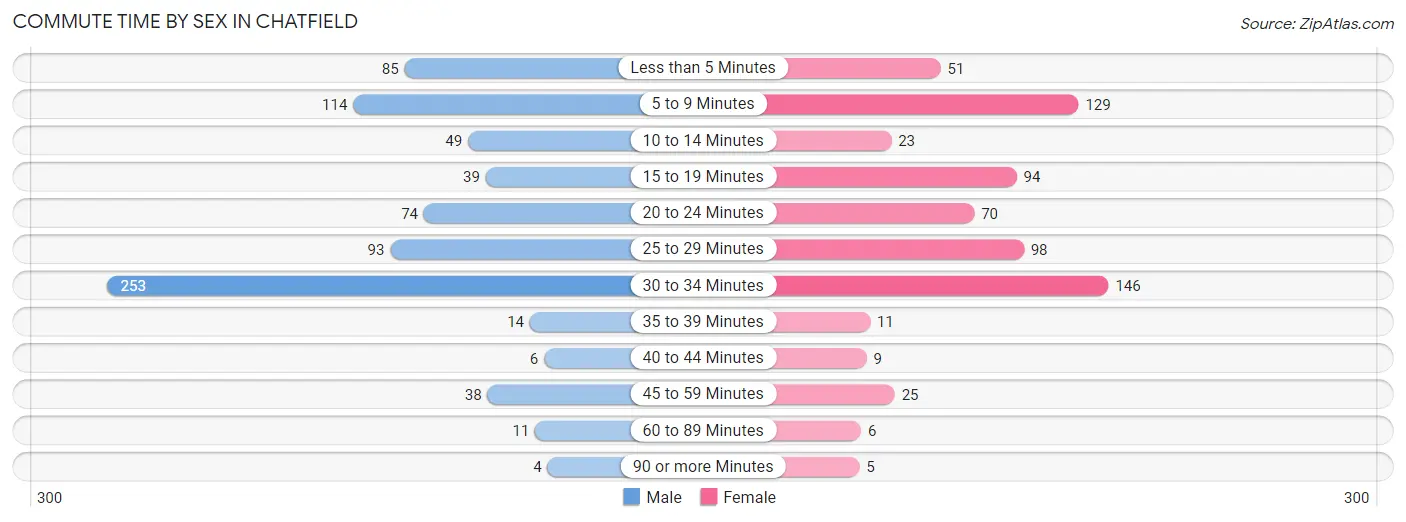
| Commute Time | Male | Female |
| Less than 5 Minutes | 85 (10.9%) | 51 (7.6%) |
| 5 to 9 Minutes | 114 (14.6%) | 129 (19.3%) |
| 10 to 14 Minutes | 49 (6.3%) | 23 (3.5%) |
| 15 to 19 Minutes | 39 (5.0%) | 94 (14.1%) |
| 20 to 24 Minutes | 74 (9.5%) | 70 (10.5%) |
| 25 to 29 Minutes | 93 (11.9%) | 98 (14.7%) |
| 30 to 34 Minutes | 253 (32.4%) | 146 (21.9%) |
| 35 to 39 Minutes | 14 (1.8%) | 11 (1.7%) |
| 40 to 44 Minutes | 6 (0.8%) | 9 (1.3%) |
| 45 to 59 Minutes | 38 (4.9%) | 25 (3.7%) |
| 60 to 89 Minutes | 11 (1.4%) | 6 (0.9%) |
| 90 or more Minutes | 4 (0.5%) | 5 (0.7%) |
Time of Departure to Work by Sex in Chatfield
The most frequent times of departure to work in Chatfield are 7:00 AM to 7:29 AM (229, 29.4%) for males and 7:30 AM to 7:59 AM (129, 19.3%) for females.
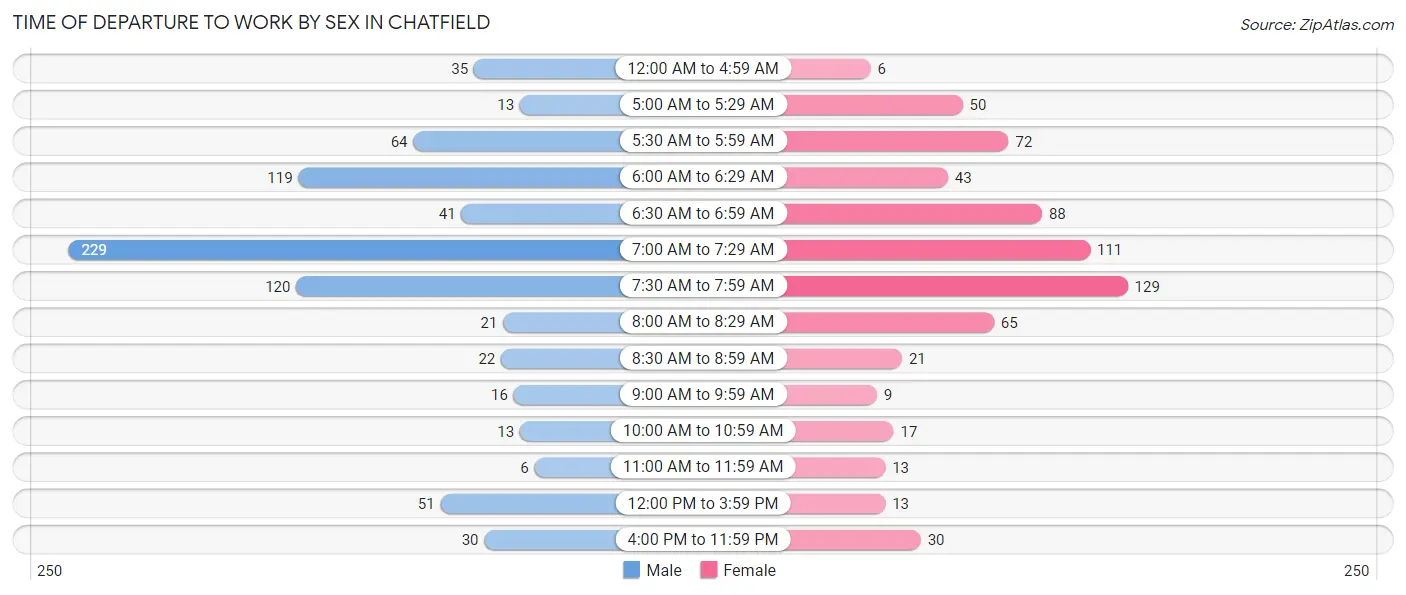
| Time of Departure | Male | Female |
| 12:00 AM to 4:59 AM | 35 (4.5%) | 6 (0.9%) |
| 5:00 AM to 5:29 AM | 13 (1.7%) | 50 (7.5%) |
| 5:30 AM to 5:59 AM | 64 (8.2%) | 72 (10.8%) |
| 6:00 AM to 6:29 AM | 119 (15.3%) | 43 (6.5%) |
| 6:30 AM to 6:59 AM | 41 (5.3%) | 88 (13.2%) |
| 7:00 AM to 7:29 AM | 229 (29.4%) | 111 (16.6%) |
| 7:30 AM to 7:59 AM | 120 (15.4%) | 129 (19.3%) |
| 8:00 AM to 8:29 AM | 21 (2.7%) | 65 (9.8%) |
| 8:30 AM to 8:59 AM | 22 (2.8%) | 21 (3.2%) |
| 9:00 AM to 9:59 AM | 16 (2.1%) | 9 (1.3%) |
| 10:00 AM to 10:59 AM | 13 (1.7%) | 17 (2.5%) |
| 11:00 AM to 11:59 AM | 6 (0.8%) | 13 (1.9%) |
| 12:00 PM to 3:59 PM | 51 (6.5%) | 13 (1.9%) |
| 4:00 PM to 11:59 PM | 30 (3.8%) | 30 (4.5%) |
| Total | 780 (100.0%) | 667 (100.0%) |
Housing Occupancy in Chatfield
Occupancy by Ownership in Chatfield
Of the total 1,051 dwellings in Chatfield, owner-occupied units account for 879 (83.6%), while renter-occupied units make up 172 (16.4%).
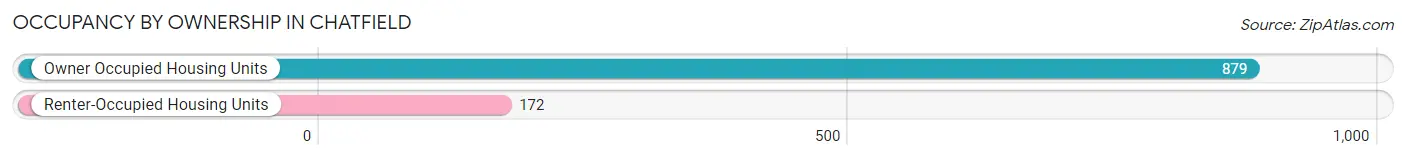
| Occupancy | # Housing Units | % Housing Units |
| Owner Occupied Housing Units | 879 | 83.6% |
| Renter-Occupied Housing Units | 172 | 16.4% |
| Total Occupied Housing Units | 1,051 | 100.0% |
Occupancy by Household Size in Chatfield
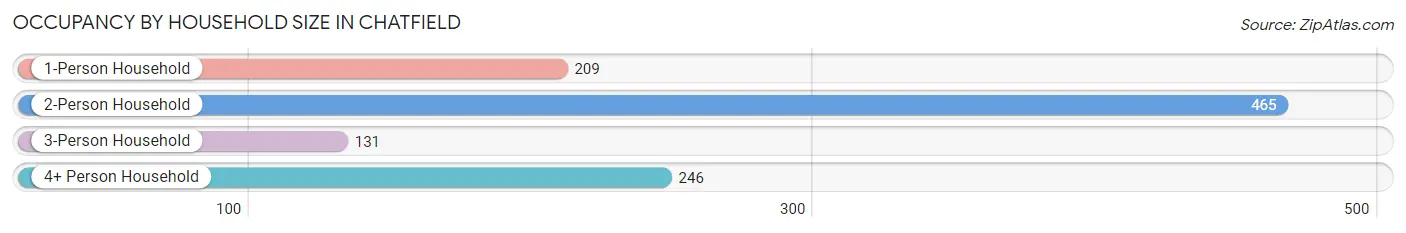
| Household Size | # Housing Units | % Housing Units |
| 1-Person Household | 209 | 19.9% |
| 2-Person Household | 465 | 44.2% |
| 3-Person Household | 131 | 12.5% |
| 4+ Person Household | 246 | 23.4% |
| Total Housing Units | 1,051 | 100.0% |
Occupancy by Ownership by Household Size in Chatfield
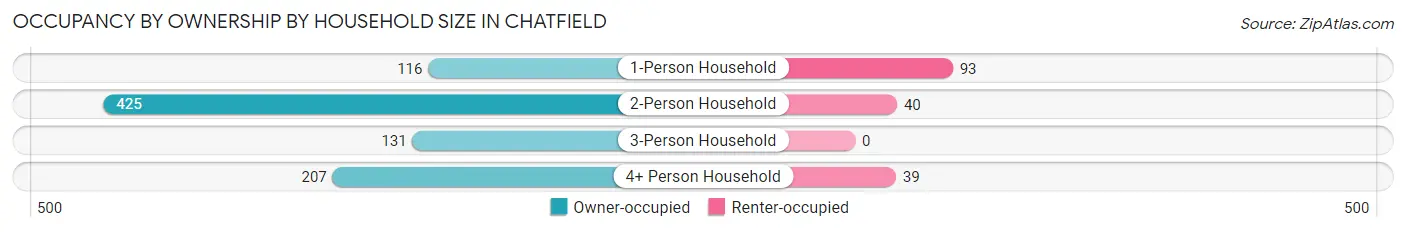
| Household Size | Owner-occupied | Renter-occupied |
| 1-Person Household | 116 (55.5%) | 93 (44.5%) |
| 2-Person Household | 425 (91.4%) | 40 (8.6%) |
| 3-Person Household | 131 (100.0%) | 0 (0.0%) |
| 4+ Person Household | 207 (84.2%) | 39 (15.9%) |
| Total Housing Units | 879 (83.6%) | 172 (16.4%) |
Occupancy by Educational Attainment in Chatfield
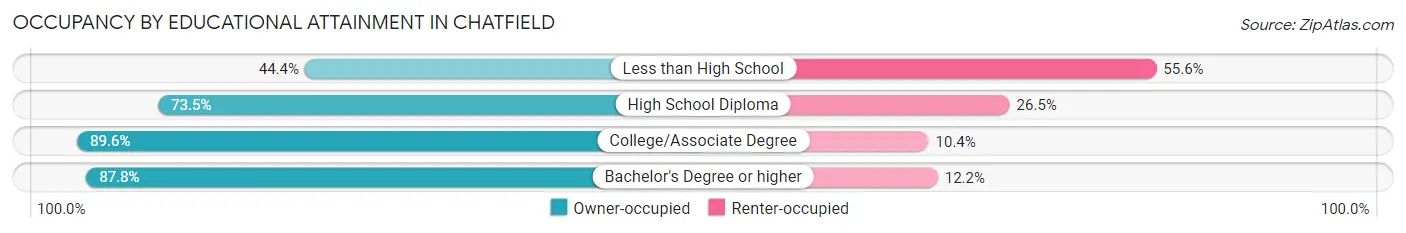
| Household Size | Owner-occupied | Renter-occupied |
| Less than High School | 20 (44.4%) | 25 (55.6%) |
| High School Diploma | 164 (73.5%) | 59 (26.5%) |
| College/Associate Degree | 379 (89.6%) | 44 (10.4%) |
| Bachelor's Degree or higher | 316 (87.8%) | 44 (12.2%) |
Occupancy by Age of Householder in Chatfield
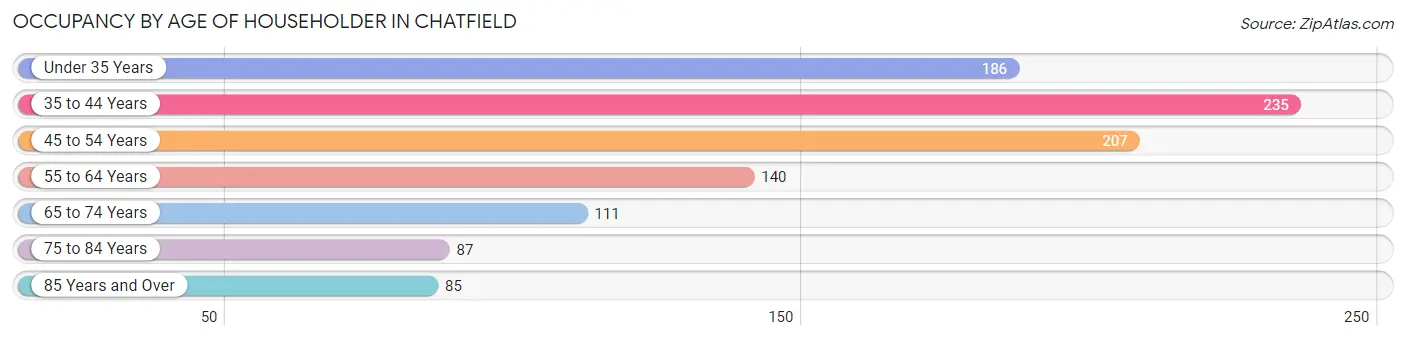
| Age Bracket | # Households | % Households |
| Under 35 Years | 186 | 17.7% |
| 35 to 44 Years | 235 | 22.4% |
| 45 to 54 Years | 207 | 19.7% |
| 55 to 64 Years | 140 | 13.3% |
| 65 to 74 Years | 111 | 10.6% |
| 75 to 84 Years | 87 | 8.3% |
| 85 Years and Over | 85 | 8.1% |
| Total | 1,051 | 100.0% |
Housing Finances in Chatfield
Median Income by Occupancy in Chatfield
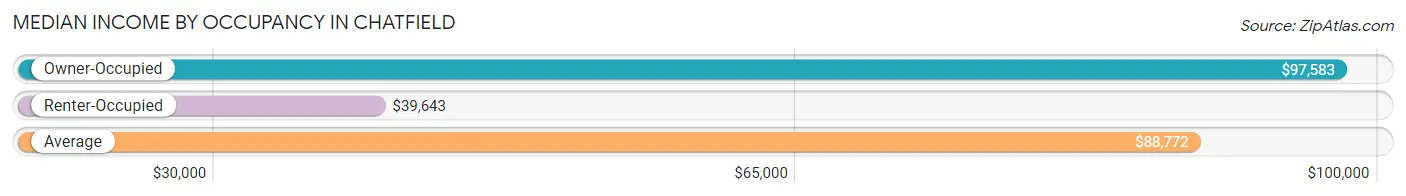
| Occupancy Type | # Households | Median Income |
| Owner-Occupied | 879 (83.6%) | $97,583 |
| Renter-Occupied | 172 (16.4%) | $39,643 |
| Average | 1,051 (100.0%) | $88,772 |
Occupancy by Householder Income Bracket in Chatfield
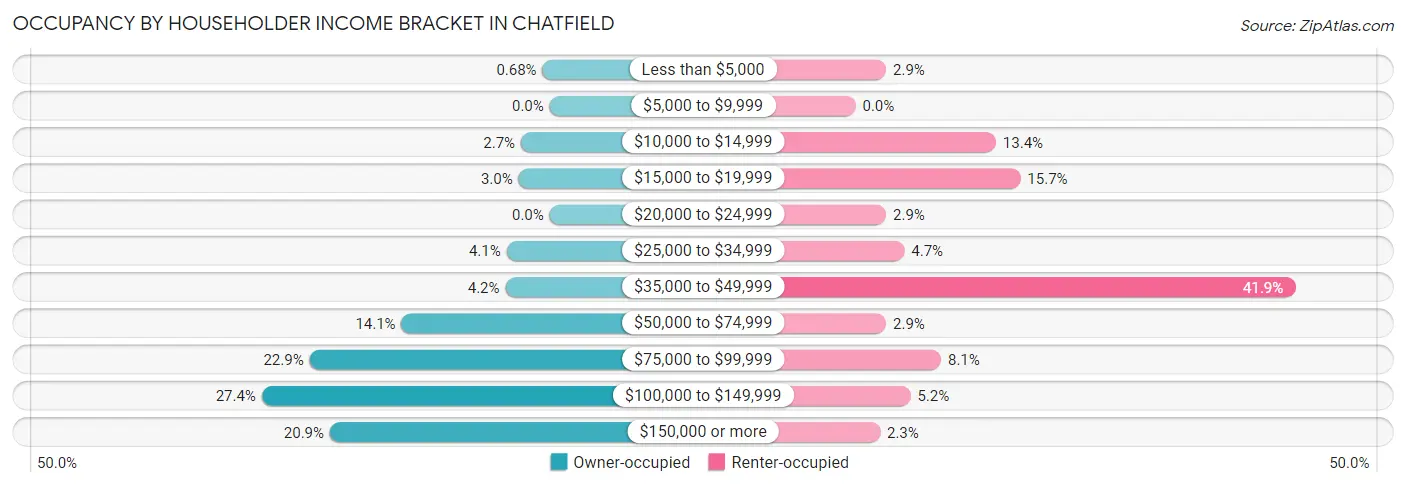
| Income Bracket | Owner-occupied | Renter-occupied |
| Less than $5,000 | 6 (0.7%) | 5 (2.9%) |
| $5,000 to $9,999 | 0 (0.0%) | 0 (0.0%) |
| $10,000 to $14,999 | 24 (2.7%) | 23 (13.4%) |
| $15,000 to $19,999 | 26 (3.0%) | 27 (15.7%) |
| $20,000 to $24,999 | 0 (0.0%) | 5 (2.9%) |
| $25,000 to $34,999 | 36 (4.1%) | 8 (4.6%) |
| $35,000 to $49,999 | 37 (4.2%) | 72 (41.9%) |
| $50,000 to $74,999 | 124 (14.1%) | 5 (2.9%) |
| $75,000 to $99,999 | 201 (22.9%) | 14 (8.1%) |
| $100,000 to $149,999 | 241 (27.4%) | 9 (5.2%) |
| $150,000 or more | 184 (20.9%) | 4 (2.3%) |
| Total | 879 (100.0%) | 172 (100.0%) |
Monthly Housing Cost Tiers in Chatfield
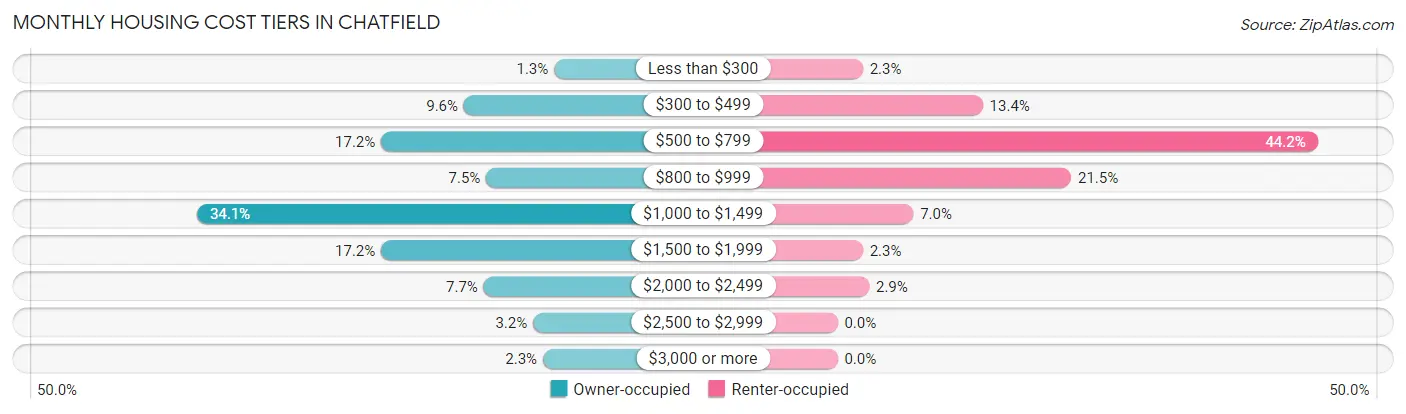
| Monthly Cost | Owner-occupied | Renter-occupied |
| Less than $300 | 11 (1.3%) | 4 (2.3%) |
| $300 to $499 | 84 (9.6%) | 23 (13.4%) |
| $500 to $799 | 151 (17.2%) | 76 (44.2%) |
| $800 to $999 | 66 (7.5%) | 37 (21.5%) |
| $1,000 to $1,499 | 300 (34.1%) | 12 (7.0%) |
| $1,500 to $1,999 | 151 (17.2%) | 4 (2.3%) |
| $2,000 to $2,499 | 68 (7.7%) | 5 (2.9%) |
| $2,500 to $2,999 | 28 (3.2%) | 0 (0.0%) |
| $3,000 or more | 20 (2.3%) | 0 (0.0%) |
| Total | 879 (100.0%) | 172 (100.0%) |
Physical Housing Characteristics in Chatfield
Housing Structures in Chatfield
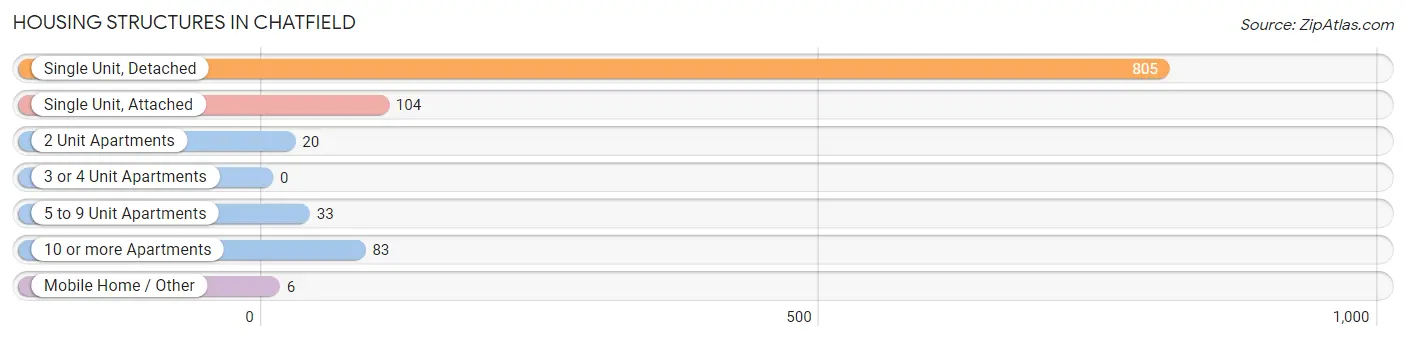
| Structure Type | # Housing Units | % Housing Units |
| Single Unit, Detached | 805 | 76.6% |
| Single Unit, Attached | 104 | 9.9% |
| 2 Unit Apartments | 20 | 1.9% |
| 3 or 4 Unit Apartments | 0 | 0.0% |
| 5 to 9 Unit Apartments | 33 | 3.1% |
| 10 or more Apartments | 83 | 7.9% |
| Mobile Home / Other | 6 | 0.6% |
| Total | 1,051 | 100.0% |
Housing Structures by Occupancy in Chatfield
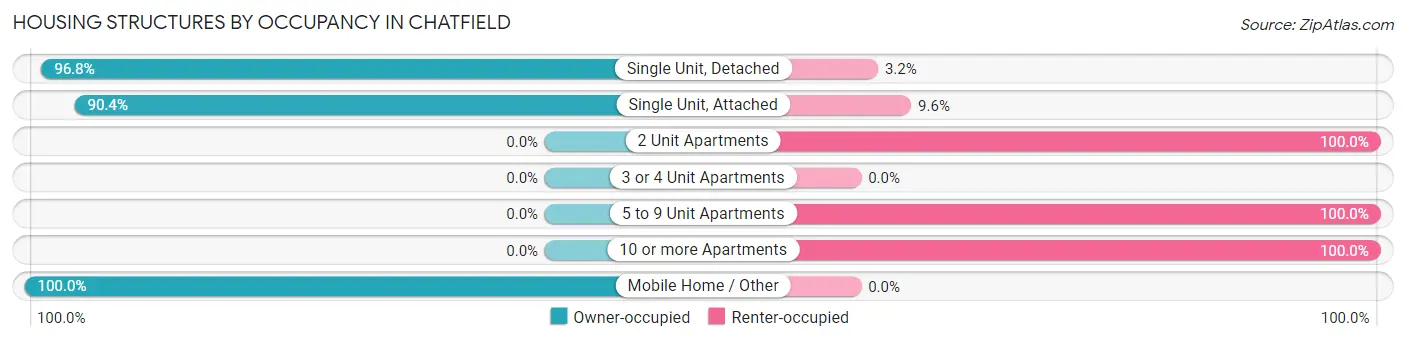
| Structure Type | Owner-occupied | Renter-occupied |
| Single Unit, Detached | 779 (96.8%) | 26 (3.2%) |
| Single Unit, Attached | 94 (90.4%) | 10 (9.6%) |
| 2 Unit Apartments | 0 (0.0%) | 20 (100.0%) |
| 3 or 4 Unit Apartments | 0 (0.0%) | 0 (0.0%) |
| 5 to 9 Unit Apartments | 0 (0.0%) | 33 (100.0%) |
| 10 or more Apartments | 0 (0.0%) | 83 (100.0%) |
| Mobile Home / Other | 6 (100.0%) | 0 (0.0%) |
| Total | 879 (83.6%) | 172 (16.4%) |
Housing Structures by Number of Rooms in Chatfield
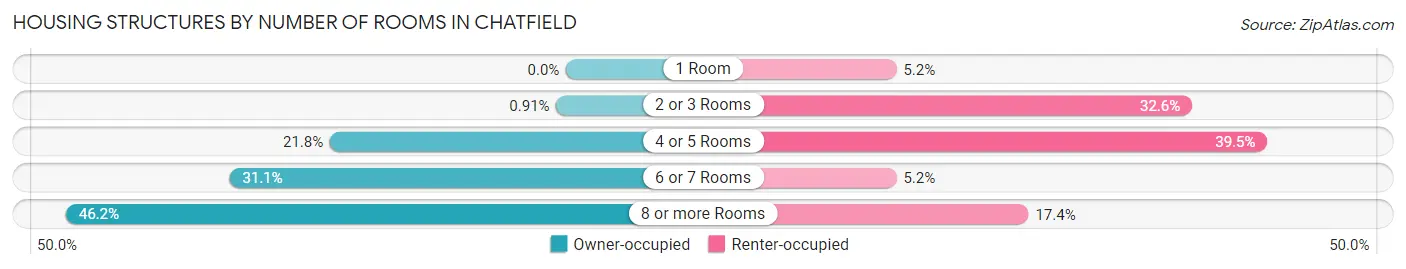
| Number of Rooms | Owner-occupied | Renter-occupied |
| 1 Room | 0 (0.0%) | 9 (5.2%) |
| 2 or 3 Rooms | 8 (0.9%) | 56 (32.6%) |
| 4 or 5 Rooms | 192 (21.8%) | 68 (39.5%) |
| 6 or 7 Rooms | 273 (31.1%) | 9 (5.2%) |
| 8 or more Rooms | 406 (46.2%) | 30 (17.4%) |
| Total | 879 (100.0%) | 172 (100.0%) |
Housing Structure by Heating Type in Chatfield
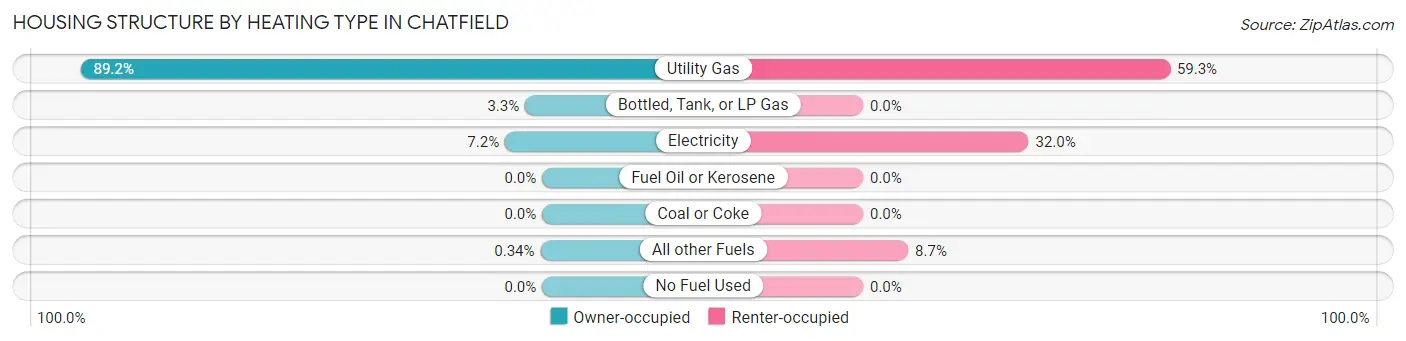
| Heating Type | Owner-occupied | Renter-occupied |
| Utility Gas | 784 (89.2%) | 102 (59.3%) |
| Bottled, Tank, or LP Gas | 29 (3.3%) | 0 (0.0%) |
| Electricity | 63 (7.2%) | 55 (32.0%) |
| Fuel Oil or Kerosene | 0 (0.0%) | 0 (0.0%) |
| Coal or Coke | 0 (0.0%) | 0 (0.0%) |
| All other Fuels | 3 (0.3%) | 15 (8.7%) |
| No Fuel Used | 0 (0.0%) | 0 (0.0%) |
| Total | 879 (100.0%) | 172 (100.0%) |
Household Vehicle Usage in Chatfield
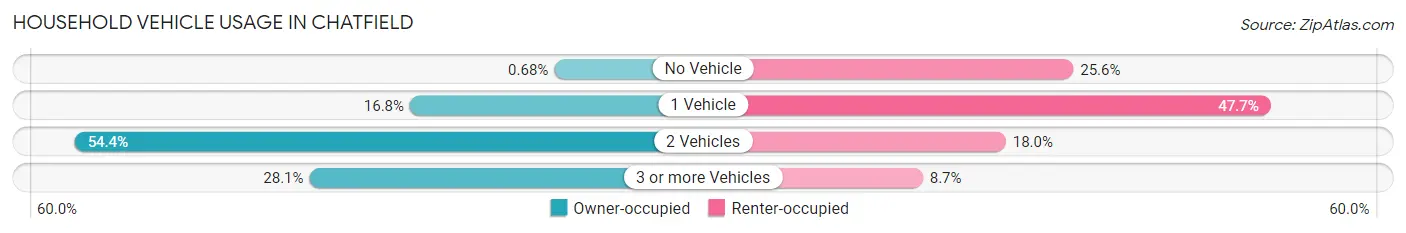
| Vehicles per Household | Owner-occupied | Renter-occupied |
| No Vehicle | 6 (0.7%) | 44 (25.6%) |
| 1 Vehicle | 148 (16.8%) | 82 (47.7%) |
| 2 Vehicles | 478 (54.4%) | 31 (18.0%) |
| 3 or more Vehicles | 247 (28.1%) | 15 (8.7%) |
| Total | 879 (100.0%) | 172 (100.0%) |
Real Estate & Mortgages in Chatfield
Real Estate and Mortgage Overview in Chatfield
| Characteristic | Without Mortgage | With Mortgage |
| Housing Units | 290 | 589 |
| Median Property Value | $194,700 | $215,800 |
| Median Household Income | $85,714 | $124 |
| Monthly Housing Costs | $598 | $20 |
| Real Estate Taxes | $2,724 | $14 |
Property Value by Mortgage Status in Chatfield
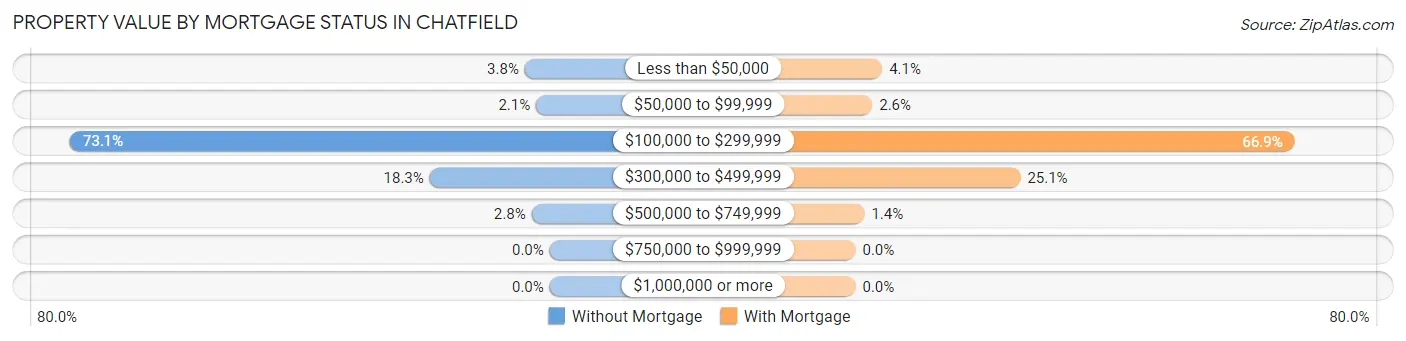
| Property Value | Without Mortgage | With Mortgage |
| Less than $50,000 | 11 (3.8%) | 24 (4.1%) |
| $50,000 to $99,999 | 6 (2.1%) | 15 (2.5%) |
| $100,000 to $299,999 | 212 (73.1%) | 394 (66.9%) |
| $300,000 to $499,999 | 53 (18.3%) | 148 (25.1%) |
| $500,000 to $749,999 | 8 (2.8%) | 8 (1.4%) |
| $750,000 to $999,999 | 0 (0.0%) | 0 (0.0%) |
| $1,000,000 or more | 0 (0.0%) | 0 (0.0%) |
| Total | 290 (100.0%) | 589 (100.0%) |
Household Income by Mortgage Status in Chatfield
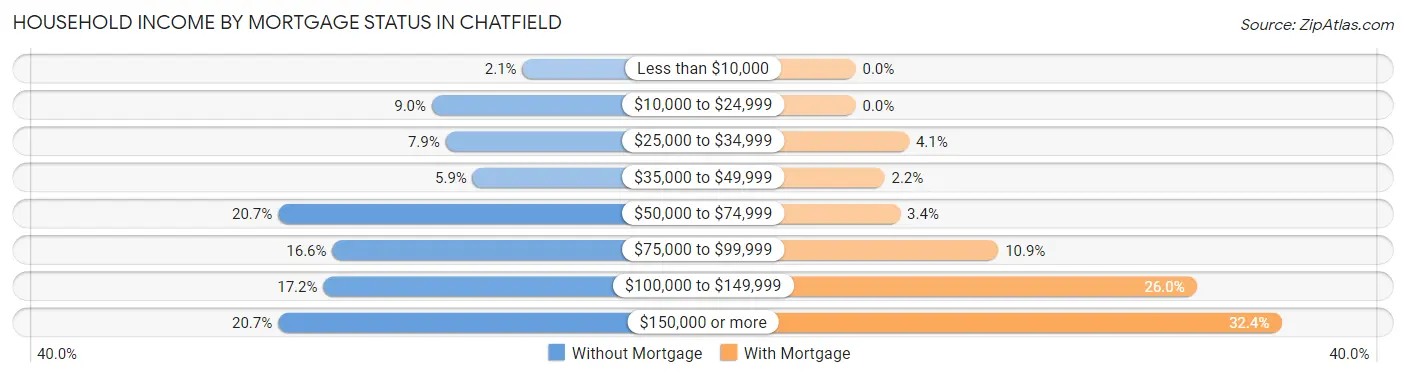
| Household Income | Without Mortgage | With Mortgage |
| Less than $10,000 | 6 (2.1%) | 0 (0.0%) |
| $10,000 to $24,999 | 26 (9.0%) | 0 (0.0%) |
| $25,000 to $34,999 | 23 (7.9%) | 24 (4.1%) |
| $35,000 to $49,999 | 17 (5.9%) | 13 (2.2%) |
| $50,000 to $74,999 | 60 (20.7%) | 20 (3.4%) |
| $75,000 to $99,999 | 48 (16.6%) | 64 (10.9%) |
| $100,000 to $149,999 | 50 (17.2%) | 153 (26.0%) |
| $150,000 or more | 60 (20.7%) | 191 (32.4%) |
| Total | 290 (100.0%) | 589 (100.0%) |
Property Value to Household Income Ratio in Chatfield
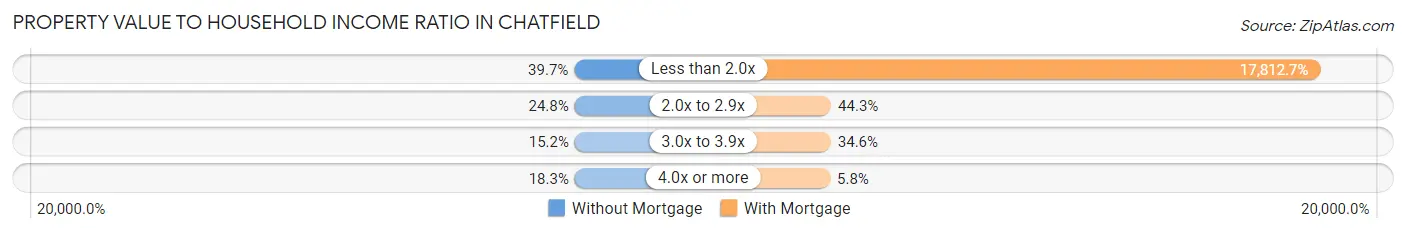
| Value-to-Income Ratio | Without Mortgage | With Mortgage |
| Less than 2.0x | 115 (39.7%) | 104,917 (17,812.7%) |
| 2.0x to 2.9x | 72 (24.8%) | 261 (44.3%) |
| 3.0x to 3.9x | 44 (15.2%) | 204 (34.6%) |
| 4.0x or more | 53 (18.3%) | 34 (5.8%) |
| Total | 290 (100.0%) | 589 (100.0%) |
Real Estate Taxes by Mortgage Status in Chatfield
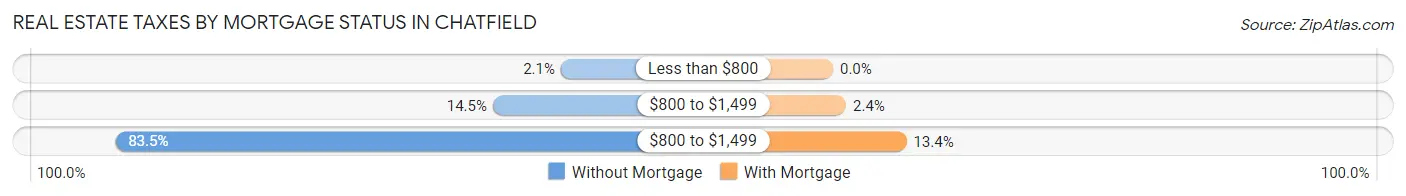
| Property Taxes | Without Mortgage | With Mortgage |
| Less than $800 | 6 (2.1%) | 0 (0.0%) |
| $800 to $1,499 | 42 (14.5%) | 14 (2.4%) |
| $800 to $1,499 | 242 (83.5%) | 79 (13.4%) |
| Total | 290 (100.0%) | 589 (100.0%) |
Health & Disability in Chatfield
Health Insurance Coverage by Age in Chatfield
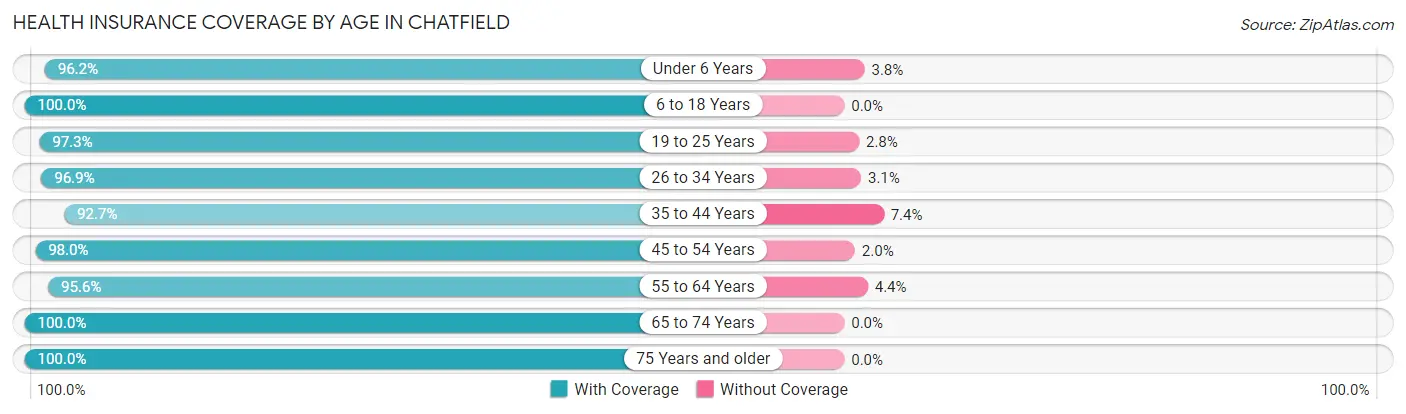
| Age Bracket | With Coverage | Without Coverage |
| Under 6 Years | 153 (96.2%) | 6 (3.8%) |
| 6 to 18 Years | 569 (100.0%) | 0 (0.0%) |
| 19 to 25 Years | 212 (97.3%) | 6 (2.8%) |
| 26 to 34 Years | 279 (96.9%) | 9 (3.1%) |
| 35 to 44 Years | 378 (92.6%) | 30 (7.3%) |
| 45 to 54 Years | 346 (98.0%) | 7 (2.0%) |
| 55 to 64 Years | 240 (95.6%) | 11 (4.4%) |
| 65 to 74 Years | 202 (100.0%) | 0 (0.0%) |
| 75 Years and older | 226 (100.0%) | 0 (0.0%) |
| Total | 2,605 (97.4%) | 69 (2.6%) |
Health Insurance Coverage by Citizenship Status in Chatfield
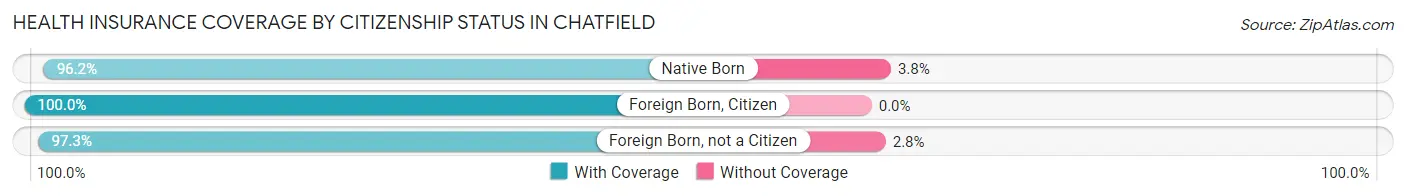
| Citizenship Status | With Coverage | Without Coverage |
| Native Born | 153 (96.2%) | 6 (3.8%) |
| Foreign Born, Citizen | 569 (100.0%) | 0 (0.0%) |
| Foreign Born, not a Citizen | 212 (97.3%) | 6 (2.8%) |
Health Insurance Coverage by Household Income in Chatfield
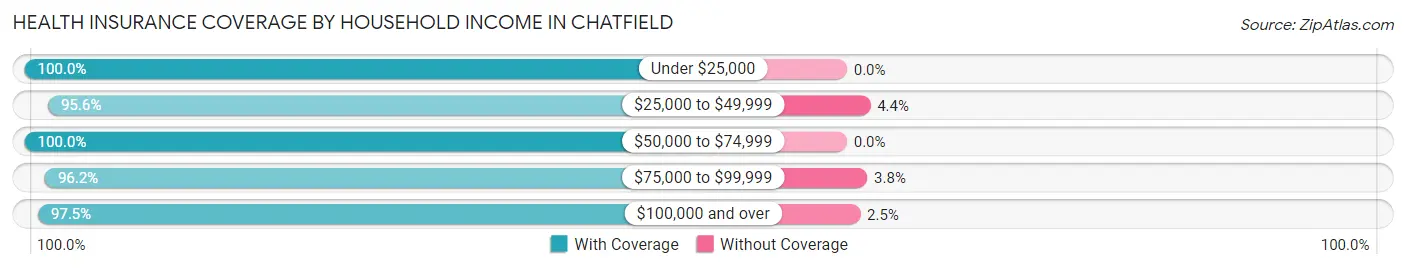
| Household Income | With Coverage | Without Coverage |
| Under $25,000 | 146 (100.0%) | 0 (0.0%) |
| $25,000 to $49,999 | 305 (95.6%) | 14 (4.4%) |
| $50,000 to $74,999 | 308 (100.0%) | 0 (0.0%) |
| $75,000 to $99,999 | 554 (96.2%) | 22 (3.8%) |
| $100,000 and over | 1,291 (97.5%) | 33 (2.5%) |
Public vs Private Health Insurance Coverage by Age in Chatfield
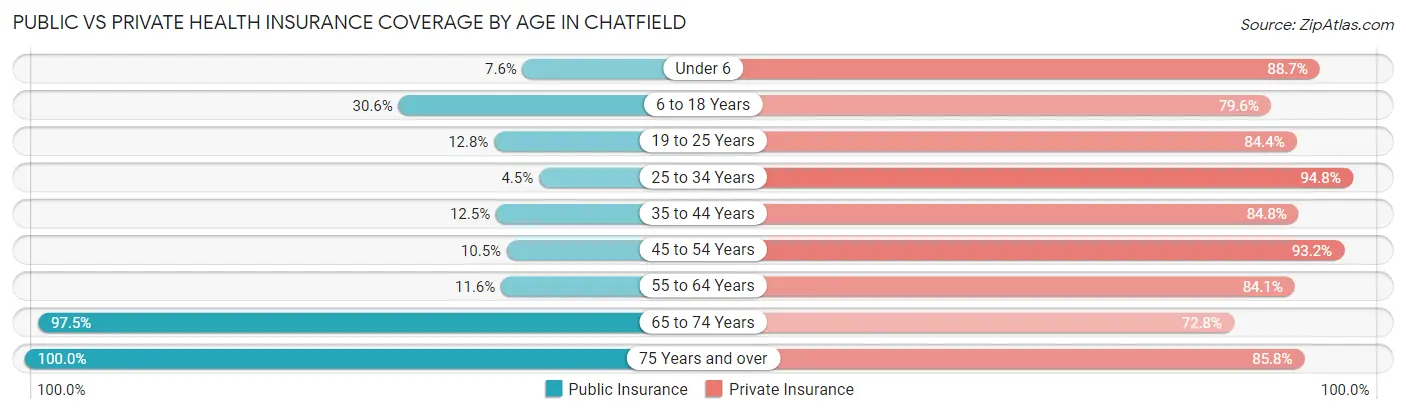
| Age Bracket | Public Insurance | Private Insurance |
| Under 6 | 12 (7.5%) | 141 (88.7%) |
| 6 to 18 Years | 174 (30.6%) | 453 (79.6%) |
| 19 to 25 Years | 28 (12.8%) | 184 (84.4%) |
| 25 to 34 Years | 13 (4.5%) | 273 (94.8%) |
| 35 to 44 Years | 51 (12.5%) | 346 (84.8%) |
| 45 to 54 Years | 37 (10.5%) | 329 (93.2%) |
| 55 to 64 Years | 29 (11.6%) | 211 (84.1%) |
| 65 to 74 Years | 197 (97.5%) | 147 (72.8%) |
| 75 Years and over | 226 (100.0%) | 194 (85.8%) |
| Total | 767 (28.7%) | 2,278 (85.2%) |
Disability Status by Sex by Age in Chatfield
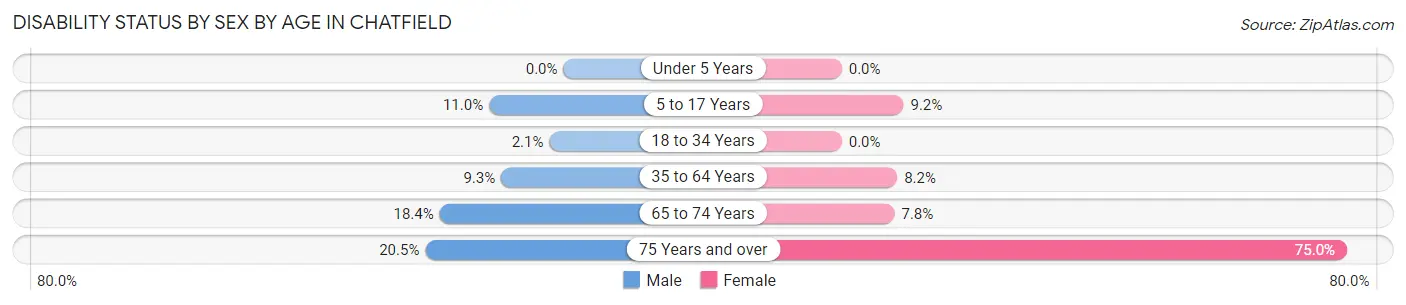
| Age Bracket | Male | Female |
| Under 5 Years | 0 (0.0%) | 0 (0.0%) |
| 5 to 17 Years | 36 (11.0%) | 22 (9.2%) |
| 18 to 34 Years | 7 (2.1%) | 0 (0.0%) |
| 35 to 64 Years | 43 (9.2%) | 45 (8.2%) |
| 65 to 74 Years | 16 (18.4%) | 9 (7.8%) |
| 75 Years and over | 16 (20.5%) | 111 (75.0%) |
Disability Class by Sex by Age in Chatfield
Disability Class: Hearing Difficulty
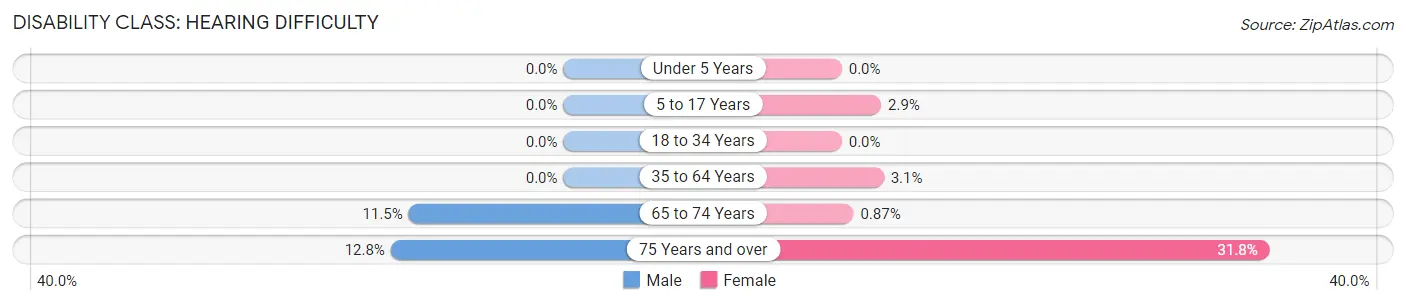
| Age Bracket | Male | Female |
| Under 5 Years | 0 (0.0%) | 0 (0.0%) |
| 5 to 17 Years | 0 (0.0%) | 7 (2.9%) |
| 18 to 34 Years | 0 (0.0%) | 0 (0.0%) |
| 35 to 64 Years | 0 (0.0%) | 17 (3.1%) |
| 65 to 74 Years | 10 (11.5%) | 1 (0.9%) |
| 75 Years and over | 10 (12.8%) | 47 (31.8%) |
Disability Class: Vision Difficulty
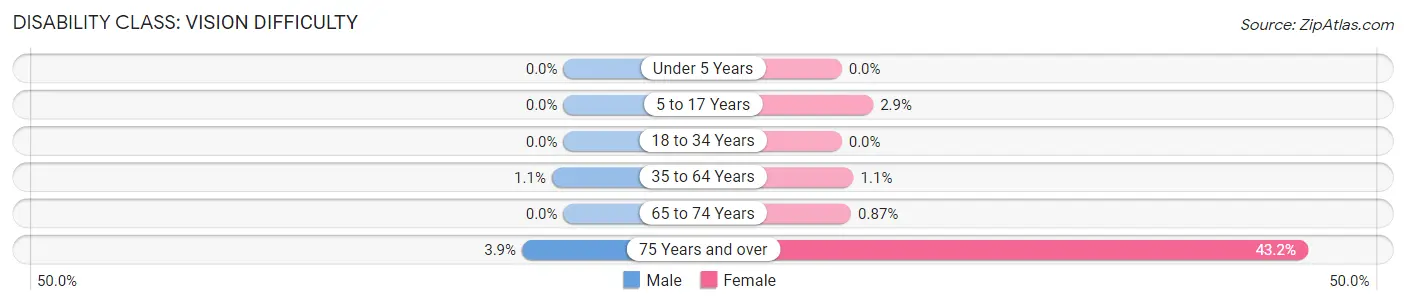
| Age Bracket | Male | Female |
| Under 5 Years | 0 (0.0%) | 0 (0.0%) |
| 5 to 17 Years | 0 (0.0%) | 7 (2.9%) |
| 18 to 34 Years | 0 (0.0%) | 0 (0.0%) |
| 35 to 64 Years | 5 (1.1%) | 6 (1.1%) |
| 65 to 74 Years | 0 (0.0%) | 1 (0.9%) |
| 75 Years and over | 3 (3.8%) | 64 (43.2%) |
Disability Class: Cognitive Difficulty
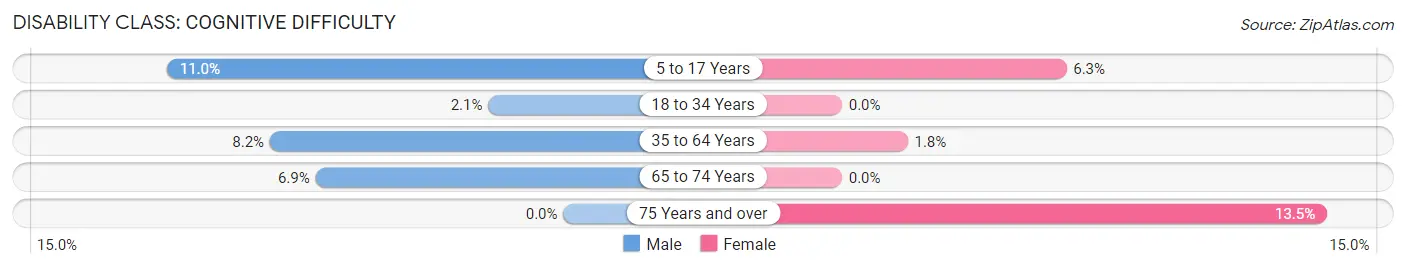
| Age Bracket | Male | Female |
| 5 to 17 Years | 36 (11.0%) | 15 (6.2%) |
| 18 to 34 Years | 7 (2.1%) | 0 (0.0%) |
| 35 to 64 Years | 38 (8.2%) | 10 (1.8%) |
| 65 to 74 Years | 6 (6.9%) | 0 (0.0%) |
| 75 Years and over | 0 (0.0%) | 20 (13.5%) |
Disability Class: Ambulatory Difficulty
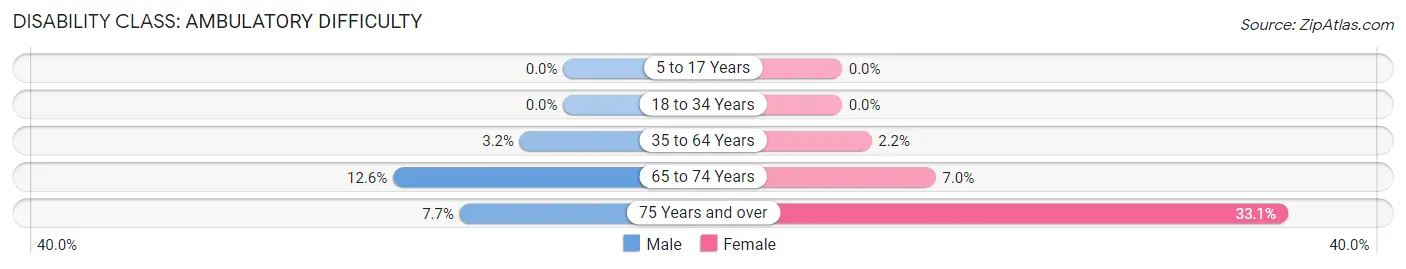
| Age Bracket | Male | Female |
| 5 to 17 Years | 0 (0.0%) | 0 (0.0%) |
| 18 to 34 Years | 0 (0.0%) | 0 (0.0%) |
| 35 to 64 Years | 15 (3.2%) | 12 (2.2%) |
| 65 to 74 Years | 11 (12.6%) | 8 (7.0%) |
| 75 Years and over | 6 (7.7%) | 49 (33.1%) |
Disability Class: Self-Care Difficulty
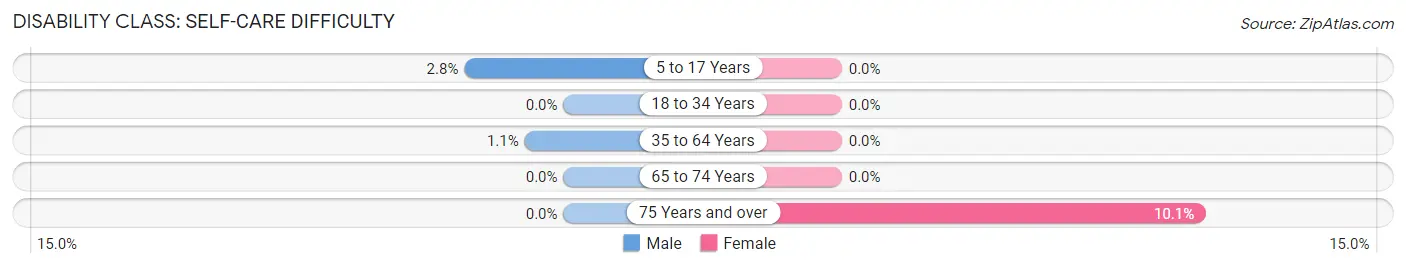
| Age Bracket | Male | Female |
| 5 to 17 Years | 9 (2.8%) | 0 (0.0%) |
| 18 to 34 Years | 0 (0.0%) | 0 (0.0%) |
| 35 to 64 Years | 5 (1.1%) | 0 (0.0%) |
| 65 to 74 Years | 0 (0.0%) | 0 (0.0%) |
| 75 Years and over | 0 (0.0%) | 15 (10.1%) |
Technology Access in Chatfield
Computing Device Access in Chatfield
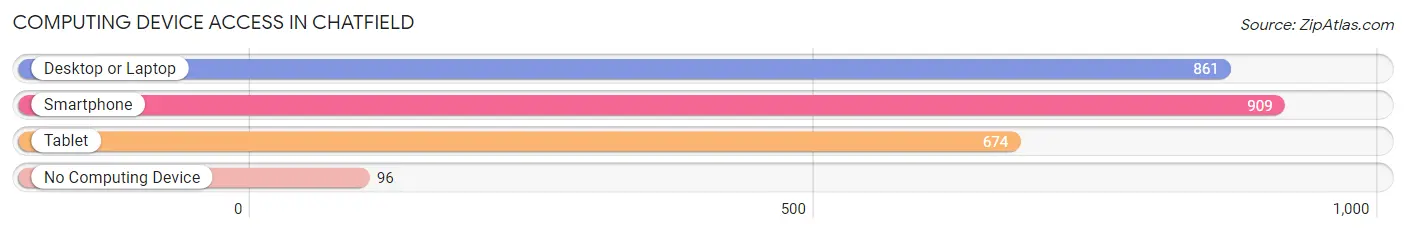
| Device Type | # Households | % Households |
| Desktop or Laptop | 861 | 81.9% |
| Smartphone | 909 | 86.5% |
| Tablet | 674 | 64.1% |
| No Computing Device | 96 | 9.1% |
| Total | 1,051 | 100.0% |
Internet Access in Chatfield
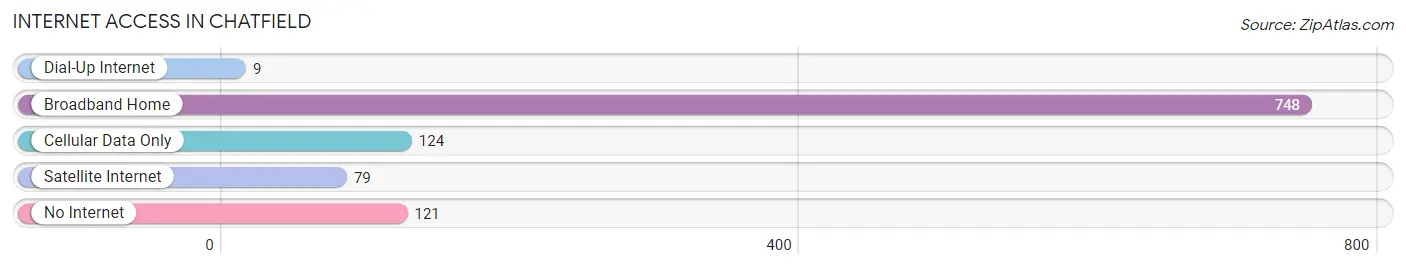
| Internet Type | # Households | % Households |
| Dial-Up Internet | 9 | 0.9% |
| Broadband Home | 748 | 71.2% |
| Cellular Data Only | 124 | 11.8% |
| Satellite Internet | 79 | 7.5% |
| No Internet | 121 | 11.5% |
| Total | 1,051 | 100.0% |
Chatfield Summary
History
The area now known as Chatfield, Minnesota was first settled in 1854 by a group of settlers from New York. The settlers were led by a man named John Chatfield, who was the first to settle in the area. The town was originally called Chatfield Corners, and was later shortened to Chatfield. The town was officially incorporated in 1872.
The town of Chatfield was originally a farming community, and the main crops grown were wheat, corn, and oats. The town also had a sawmill, a grist mill, and a blacksmith shop. In the late 1800s, the railroad came to Chatfield, and the town began to grow. The railroad brought new businesses and industries to the area, and the population of the town began to increase.
In the early 1900s, Chatfield began to experience a period of growth and prosperity. The town was home to several businesses, including a bank, a hotel, a general store, and a post office. The town also had a school, a library, and a movie theater.
In the 1950s, Chatfield began to experience a decline in population. Many of the businesses in the town closed, and the population began to decrease. In the late 1970s, the town began to experience a resurgence in population, and the town began to experience a period of growth and prosperity.
Geography
Chatfield is located in southeastern Minnesota, in Fillmore County. The town is situated on the banks of the Root River, and is surrounded by rolling hills and farmland. The town is located approximately 30 miles south of Rochester, and is about an hour and a half drive from the Twin Cities.
The town of Chatfield covers an area of approximately 2.5 square miles, and has a population of approximately 2,000 people. The town is located at an elevation of 1,000 feet above sea level.
Economy
The economy of Chatfield is largely based on agriculture. The town is home to several farms, and the main crops grown in the area are corn, soybeans, and wheat. The town also has several businesses, including a bank, a grocery store, a hardware store, and a restaurant.
The town is also home to several manufacturing companies, including a furniture manufacturer, a plastics manufacturer, and a metal fabrication company. The town also has a small airport, which is used for private and commercial flights.
Demographics
As of the 2010 census, the population of Chatfield was 2,039. The racial makeup of the town was 97.3% White, 0.3% African American, 0.2% Native American, 0.3% Asian, 0.1% Pacific Islander, 0.7% from other races, and 1.2% from two or more races. Hispanic or Latino of any race were 1.7% of the population.
The median income for a household in Chatfield was $45,938, and the median income for a family was $51,938. The per capita income for the town was $20,938. About 8.3% of families and 10.2% of the population were below the poverty line, including 14.2% of those under age 18 and 8.2% of those age 65 or over.
Common Questions
What is Per Capita Income in Chatfield?
Per Capita income in Chatfield is $40,695.
What is the Median Family Income in Chatfield?
Median Family Income in Chatfield is $103,516.
What is the Median Household income in Chatfield?
Median Household Income in Chatfield is $88,772.
What is Income or Wage Gap in Chatfield?
Income or Wage Gap in Chatfield is 1.3%.
Women in Chatfield earn 98.7 cents for every dollar earned by a man.
What is Family Income Deficit in Chatfield?
Family Income Deficit in Chatfield is $4,593.
Families that are below poverty line in Chatfield earn $4,593 less on average than the poverty threshold level.
What is Inequality or Gini Index in Chatfield?
Inequality or Gini Index in Chatfield is 0.39.
What is the Total Population of Chatfield?
Total Population of Chatfield is 2,758.
What is the Total Male Population of Chatfield?
Total Male Population of Chatfield is 1,364.
What is the Total Female Population of Chatfield?
Total Female Population of Chatfield is 1,394.
What is the Ratio of Males per 100 Females in Chatfield?
There are 97.85 Males per 100 Females in Chatfield.
What is the Ratio of Females per 100 Males in Chatfield?
There are 102.20 Females per 100 Males in Chatfield.
What is the Median Population Age in Chatfield?
Median Population Age in Chatfield is 38.8 Years.
What is the Average Family Size in Chatfield
Average Family Size in Chatfield is 3.0 People.
What is the Average Household Size in Chatfield
Average Household Size in Chatfield is 2.5 People.
How Large is the Labor Force in Chatfield?
There are 1,559 People in the Labor Forcein in Chatfield.
What is the Percentage of People in the Labor Force in Chatfield?
71.8% of People are in the Labor Force in Chatfield.
What is the Unemployment Rate in Chatfield?
Unemployment Rate in Chatfield is 1.9%.