Callaway, MN Map & Demographics
Callaway Map
Callaway Overview
$27,119
PER CAPITA INCOME
$66,250
AVG FAMILY INCOME
$50,000
AVG HOUSEHOLD INCOME
29.1%
WAGE / INCOME GAP [ % ]
70.9¢/ $1
WAGE / INCOME GAP [ $ ]
0.33
INEQUALITY / GINI INDEX
221
TOTAL POPULATION
117
MALE POPULATION
104
FEMALE POPULATION
112.50
MALES / 100 FEMALES
88.89
FEMALES / 100 MALES
39.9
MEDIAN AGE
2.7
AVG FAMILY SIZE
2.3
AVG HOUSEHOLD SIZE
135
LABOR FORCE [ PEOPLE ]
71.4%
PERCENT IN LABOR FORCE
6.7%
UNEMPLOYMENT RATE
Callaway Zip Codes
Callaway Area Codes
Income in Callaway
Income Overview in Callaway
Per Capita Income in Callaway is $27,119, while median incomes of families and households are $66,250 and $50,000 respectively.
| Characteristic | Number | Measure |
| Per Capita Income | 221 | $27,119 |
| Median Family Income | 64 | $66,250 |
| Mean Family Income | 64 | $64,741 |
| Median Household Income | 96 | $50,000 |
| Mean Household Income | 96 | $59,069 |
| Income Deficit | 64 | $0 |
| Wage / Income Gap (%) | 221 | 29.08% |
| Wage / Income Gap ($) | 221 | 70.92¢ per $1 |
| Gini / Inequality Index | 221 | 0.33 |
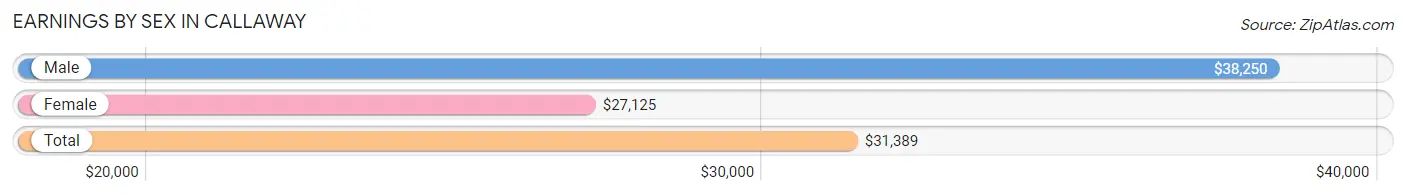
Earnings by Sex in Callaway
Average Earnings in Callaway are $31,389, $38,250 for men and $27,125 for women, a difference of 29.1%.
| Sex | Number | Average Earnings |
| Male | 71 (50.0%) | $38,250 |
| Female | 71 (50.0%) | $27,125 |
| Total | 142 (100.0%) | $31,389 |
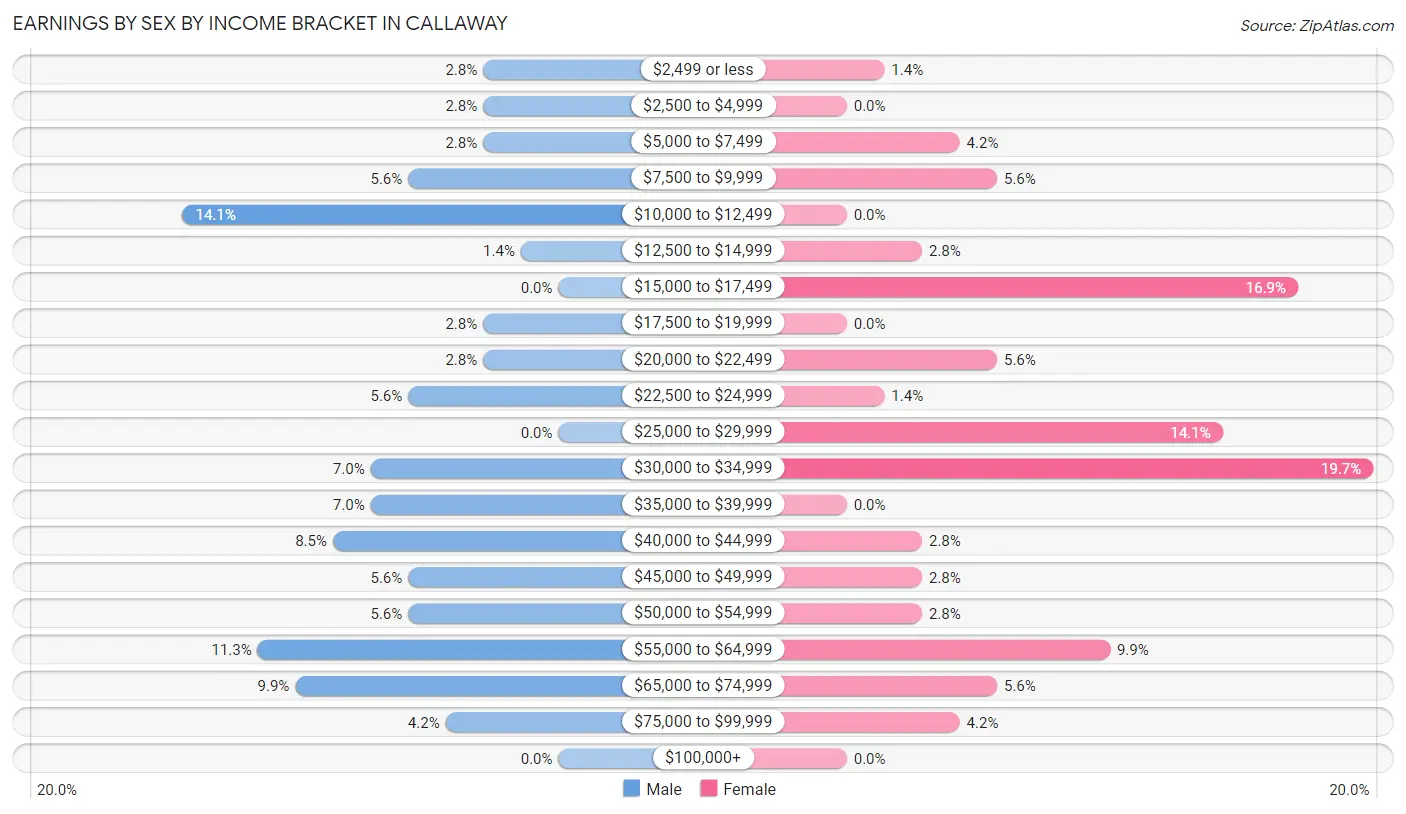
Earnings by Sex by Income Bracket in Callaway
The most common earnings brackets in Callaway are $10,000 to $12,499 for men (10 | 14.1%) and $30,000 to $34,999 for women (14 | 19.7%).
| Income | Male | Female |
| $2,499 or less | 2 (2.8%) | 1 (1.4%) |
| $2,500 to $4,999 | 2 (2.8%) | 0 (0.0%) |
| $5,000 to $7,499 | 2 (2.8%) | 3 (4.2%) |
| $7,500 to $9,999 | 4 (5.6%) | 4 (5.6%) |
| $10,000 to $12,499 | 10 (14.1%) | 0 (0.0%) |
| $12,500 to $14,999 | 1 (1.4%) | 2 (2.8%) |
| $15,000 to $17,499 | 0 (0.0%) | 12 (16.9%) |
| $17,500 to $19,999 | 2 (2.8%) | 0 (0.0%) |
| $20,000 to $22,499 | 2 (2.8%) | 4 (5.6%) |
| $22,500 to $24,999 | 4 (5.6%) | 1 (1.4%) |
| $25,000 to $29,999 | 0 (0.0%) | 10 (14.1%) |
| $30,000 to $34,999 | 5 (7.0%) | 14 (19.7%) |
| $35,000 to $39,999 | 5 (7.0%) | 0 (0.0%) |
| $40,000 to $44,999 | 6 (8.5%) | 2 (2.8%) |
| $45,000 to $49,999 | 4 (5.6%) | 2 (2.8%) |
| $50,000 to $54,999 | 4 (5.6%) | 2 (2.8%) |
| $55,000 to $64,999 | 8 (11.3%) | 7 (9.9%) |
| $65,000 to $74,999 | 7 (9.9%) | 4 (5.6%) |
| $75,000 to $99,999 | 3 (4.2%) | 3 (4.2%) |
| $100,000+ | 0 (0.0%) | 0 (0.0%) |
| Total | 71 (100.0%) | 71 (100.0%) |
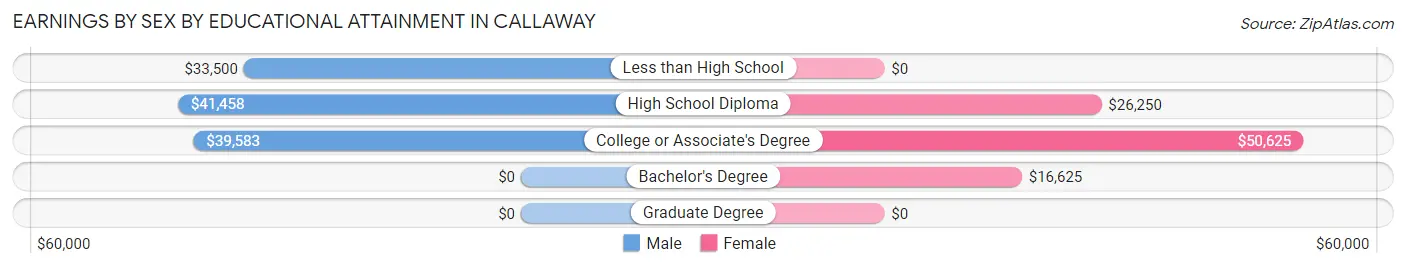
Earnings by Sex by Educational Attainment in Callaway
Average earnings in Callaway are $40,208 for men and $31,250 for women, a difference of 22.3%. Men with an educational attainment of high school diploma enjoy the highest average annual earnings of $41,458, while those with less than high school education earn the least with $33,500. Women with an educational attainment of college or associate's degree earn the most with the average annual earnings of $50,625, while those with bachelor's degree education have the smallest earnings of $16,625.
| Educational Attainment | Male Income | Female Income |
| Less than High School | $33,500 | $0 |
| High School Diploma | $41,458 | $26,250 |
| College or Associate's Degree | $39,583 | $50,625 |
| Bachelor's Degree | - | - |
| Graduate Degree | - | - |
| Total | $40,208 | $31,250 |
Family Income in Callaway
Family Income Brackets in Callaway
According to the Callaway family income data, there are 17 families falling into the $75,000 to $99,999 income range, which is the most common income bracket and makes up 26.6% of all families.
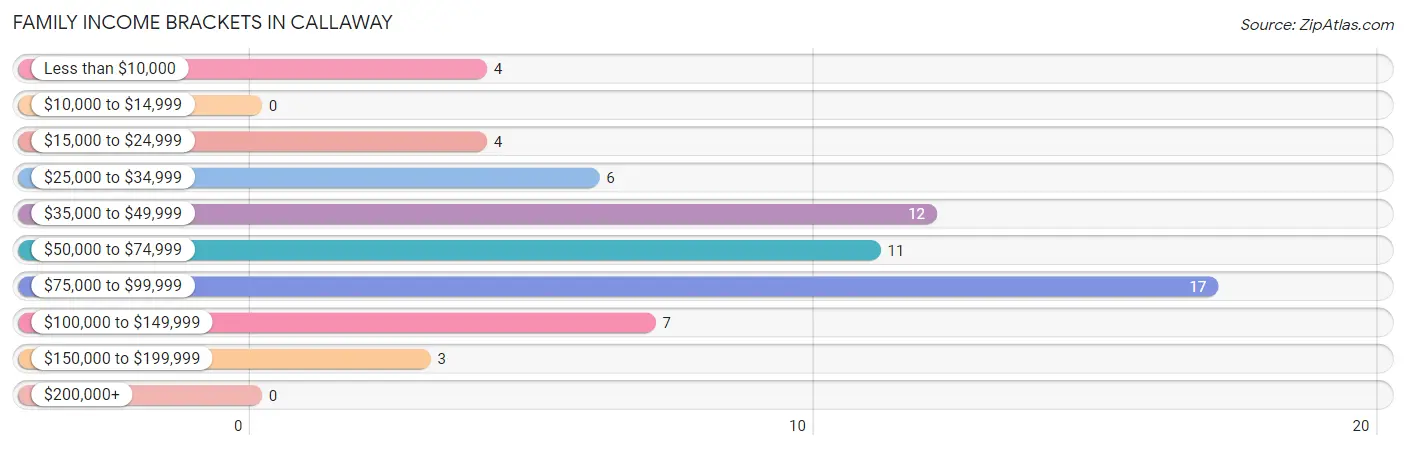
| Income Bracket | # Families | % Families |
| Less than $10,000 | 4 | 6.3% |
| $10,000 to $14,999 | 0 | 0.0% |
| $15,000 to $24,999 | 4 | 6.3% |
| $25,000 to $34,999 | 6 | 9.4% |
| $35,000 to $49,999 | 12 | 18.8% |
| $50,000 to $74,999 | 11 | 17.2% |
| $75,000 to $99,999 | 17 | 26.6% |
| $100,000 to $149,999 | 7 | 10.9% |
| $150,000 to $199,999 | 3 | 4.7% |
| $200,000+ | 0 | 0.0% |
Family Income by Famaliy Size in Callaway
2-person families (43 | 67.2%) account for the highest median family income in Callaway with $56,250 per family, while 2-person families (43 | 67.2%) have the highest median income of $28,125 per family member.
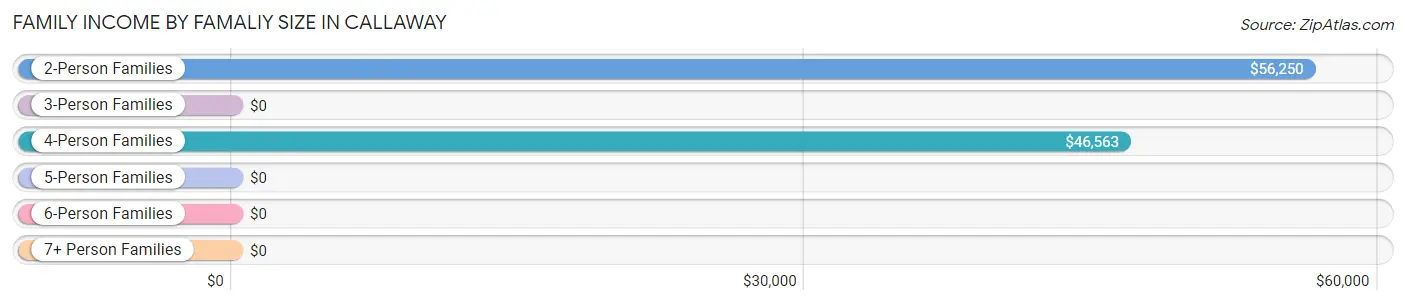
| Income Bracket | # Families | Median Income |
| 2-Person Families | 43 (67.2%) | $56,250 |
| 3-Person Families | 10 (15.6%) | $0 |
| 4-Person Families | 7 (10.9%) | $46,563 |
| 5-Person Families | 0 (0.0%) | $0 |
| 6-Person Families | 2 (3.1%) | $0 |
| 7+ Person Families | 2 (3.1%) | $0 |
| Total | 64 (100.0%) | $66,250 |
Family Income by Number of Earners in Callaway
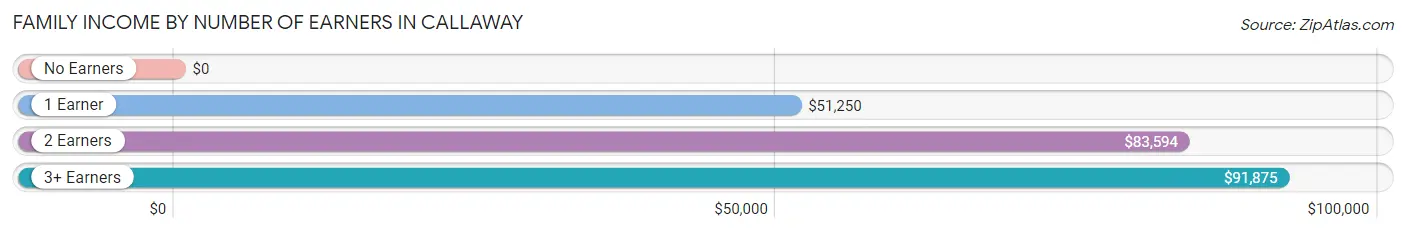
| Number of Earners | # Families | Median Income |
| No Earners | 12 (18.8%) | $0 |
| 1 Earner | 16 (25.0%) | $51,250 |
| 2 Earners | 29 (45.3%) | $83,594 |
| 3+ Earners | 7 (10.9%) | $91,875 |
| Total | 64 (100.0%) | $66,250 |
Household Income in Callaway
Household Income Brackets in Callaway
With 21 households falling in the category, the $75,000 to $99,999 income range is the most frequent in Callaway, accounting for 21.9% of all households.
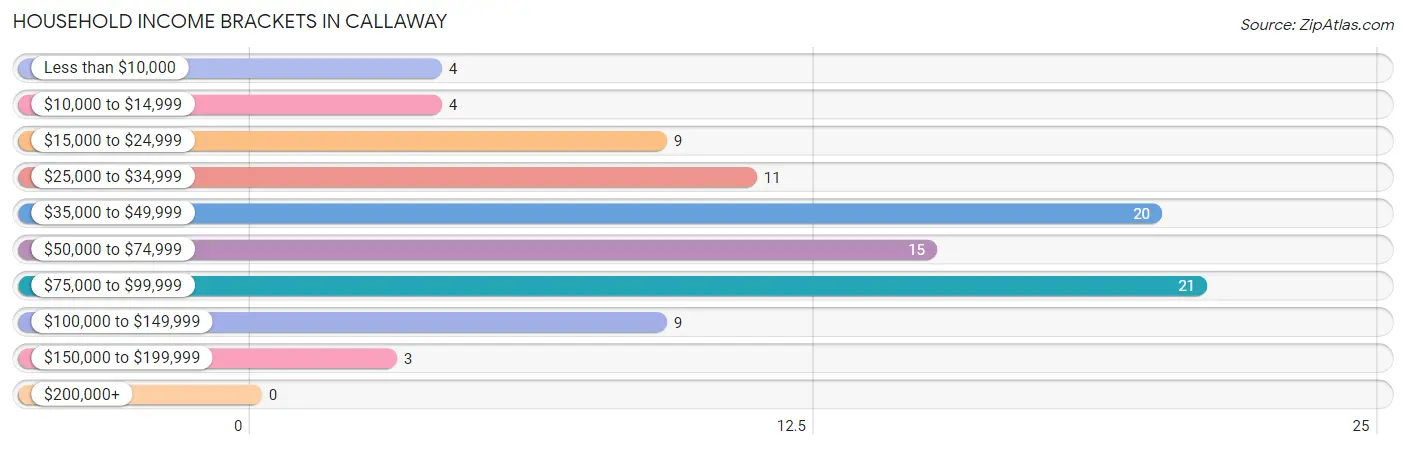
| Income Bracket | # Households | % Households |
| Less than $10,000 | 4 | 4.2% |
| $10,000 to $14,999 | 4 | 4.2% |
| $15,000 to $24,999 | 9 | 9.4% |
| $25,000 to $34,999 | 11 | 11.5% |
| $35,000 to $49,999 | 20 | 20.8% |
| $50,000 to $74,999 | 15 | 15.6% |
| $75,000 to $99,999 | 21 | 21.9% |
| $100,000 to $149,999 | 9 | 9.4% |
| $150,000 to $199,999 | 3 | 3.1% |
| $200,000+ | 0 | 0.0% |
Household Income by Householder Age in Callaway
The median household income in Callaway is $50,000, with the highest median household income of $69,583 found in the 45 to 64 years age bracket for the primary householder. A total of 31 households (32.3%) fall into this category. Meanwhile, the 15 to 24 years age bracket for the primary householder has the lowest median household income of $0, with 7 households (7.3%) in this group.
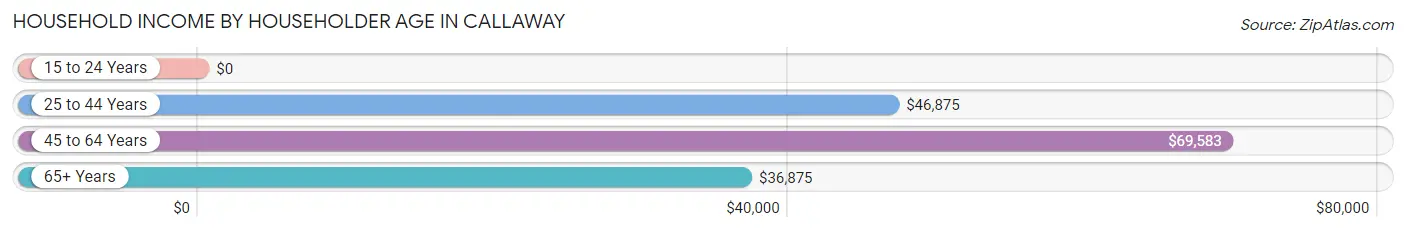
| Income Bracket | # Households | Median Income |
| 15 to 24 Years | 7 (7.3%) | $0 |
| 25 to 44 Years | 33 (34.4%) | $46,875 |
| 45 to 64 Years | 31 (32.3%) | $69,583 |
| 65+ Years | 25 (26.0%) | $36,875 |
| Total | 96 (100.0%) | $50,000 |
Poverty in Callaway
Income Below Poverty by Sex and Age in Callaway
With 14.5% poverty level for males and 3.8% for females among the residents of Callaway, 12 to 14 year old males and 35 to 44 year old females are the most vulnerable to poverty, with 2 males (50.0%) and 4 females (15.4%) in their respective age groups living below the poverty level.
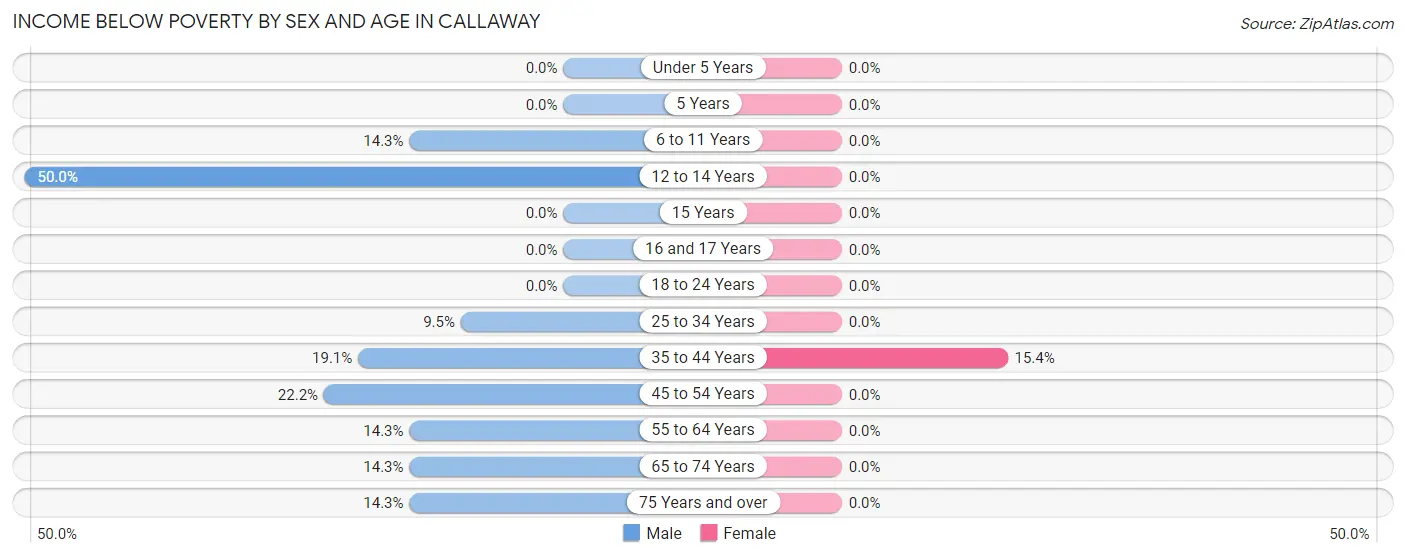
| Age Bracket | Male | Female |
| Under 5 Years | 0 (0.0%) | 0 (0.0%) |
| 5 Years | 0 (0.0%) | 0 (0.0%) |
| 6 to 11 Years | 2 (14.3%) | 0 (0.0%) |
| 12 to 14 Years | 2 (50.0%) | 0 (0.0%) |
| 15 Years | 0 (0.0%) | 0 (0.0%) |
| 16 and 17 Years | 0 (0.0%) | 0 (0.0%) |
| 18 to 24 Years | 0 (0.0%) | 0 (0.0%) |
| 25 to 34 Years | 2 (9.5%) | 0 (0.0%) |
| 35 to 44 Years | 4 (19.1%) | 4 (15.4%) |
| 45 to 54 Years | 2 (22.2%) | 0 (0.0%) |
| 55 to 64 Years | 2 (14.3%) | 0 (0.0%) |
| 65 to 74 Years | 2 (14.3%) | 0 (0.0%) |
| 75 Years and over | 1 (14.3%) | 0 (0.0%) |
| Total | 17 (14.5%) | 4 (3.8%) |
Income Above Poverty by Sex and Age in Callaway
According to the poverty statistics in Callaway, males aged 5 years and females aged under 5 years are the age groups that are most secure financially, with 100.0% of males and 100.0% of females in these age groups living above the poverty line.
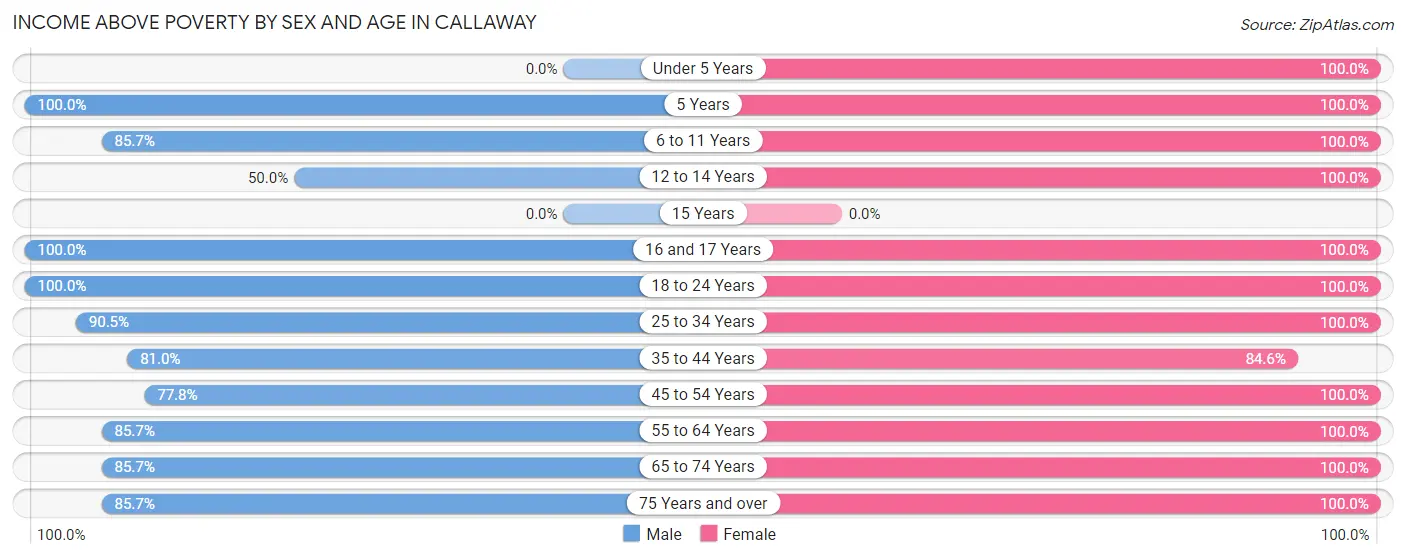
| Age Bracket | Male | Female |
| Under 5 Years | 0 (0.0%) | 4 (100.0%) |
| 5 Years | 1 (100.0%) | 1 (100.0%) |
| 6 to 11 Years | 12 (85.7%) | 7 (100.0%) |
| 12 to 14 Years | 2 (50.0%) | 1 (100.0%) |
| 15 Years | 0 (0.0%) | 0 (0.0%) |
| 16 and 17 Years | 1 (100.0%) | 2 (100.0%) |
| 18 to 24 Years | 11 (100.0%) | 10 (100.0%) |
| 25 to 34 Years | 19 (90.5%) | 6 (100.0%) |
| 35 to 44 Years | 17 (80.9%) | 22 (84.6%) |
| 45 to 54 Years | 7 (77.8%) | 18 (100.0%) |
| 55 to 64 Years | 12 (85.7%) | 11 (100.0%) |
| 65 to 74 Years | 12 (85.7%) | 13 (100.0%) |
| 75 Years and over | 6 (85.7%) | 5 (100.0%) |
| Total | 100 (85.5%) | 100 (96.2%) |
Income Below Poverty Among Married-Couple Families in Callaway
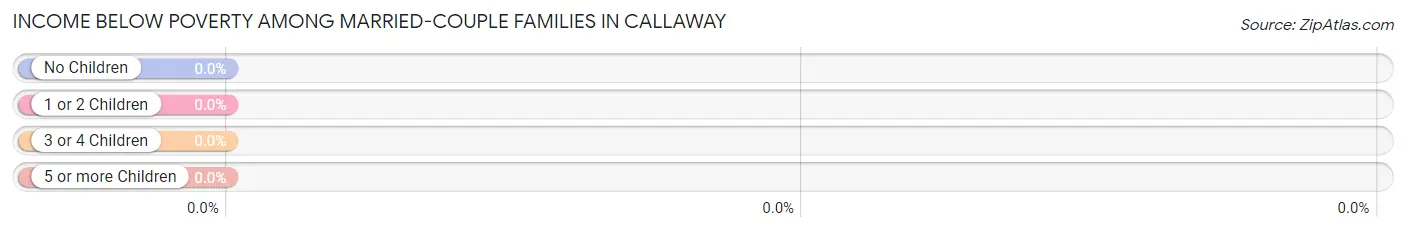
| Children | Above Poverty | Below Poverty |
| No Children | 31 (100.0%) | 0 (0.0%) |
| 1 or 2 Children | 6 (100.0%) | 0 (0.0%) |
| 3 or 4 Children | 0 (0.0%) | 0 (0.0%) |
| 5 or more Children | 2 (100.0%) | 0 (0.0%) |
| Total | 39 (100.0%) | 0 (0.0%) |
Income Below Poverty Among Single-Parent Households in Callaway
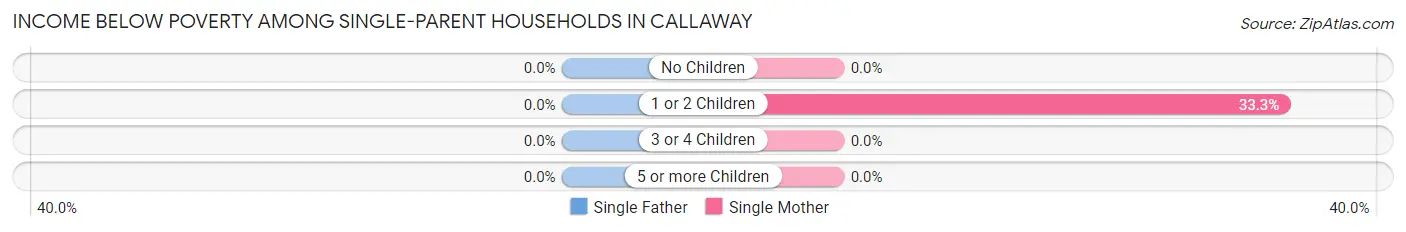
| Children | Single Father | Single Mother |
| No Children | 0 (0.0%) | 0 (0.0%) |
| 1 or 2 Children | 0 (0.0%) | 4 (33.3%) |
| 3 or 4 Children | 0 (0.0%) | 0 (0.0%) |
| 5 or more Children | 0 (0.0%) | 0 (0.0%) |
| Total | 0 (0.0%) | 4 (22.2%) |
Income Below Poverty Among Married-Couple vs Single-Parent Households in Callaway
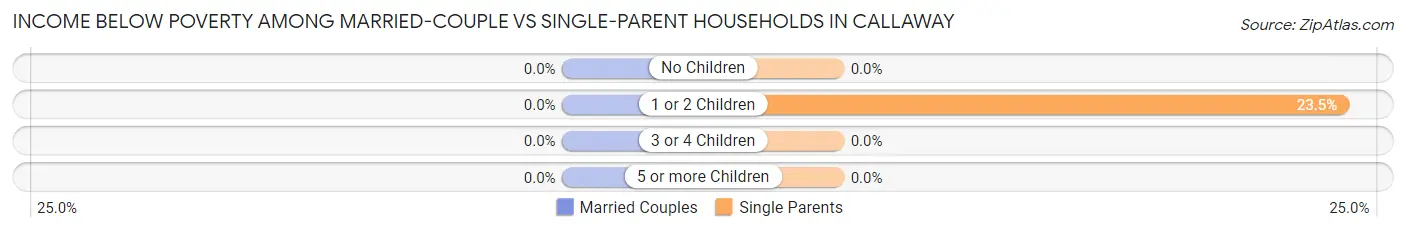
| Children | Married-Couple Families | Single-Parent Households |
| No Children | 0 (0.0%) | 0 (0.0%) |
| 1 or 2 Children | 0 (0.0%) | 4 (23.5%) |
| 3 or 4 Children | 0 (0.0%) | 0 (0.0%) |
| 5 or more Children | 0 (0.0%) | 0 (0.0%) |
| Total | 0 (0.0%) | 4 (16.0%) |
Race in Callaway
The most populous races in Callaway are White / Caucasian (136 | 61.5%), Native / Alaskan (57 | 25.8%), and Two or more Races (28 | 12.7%).
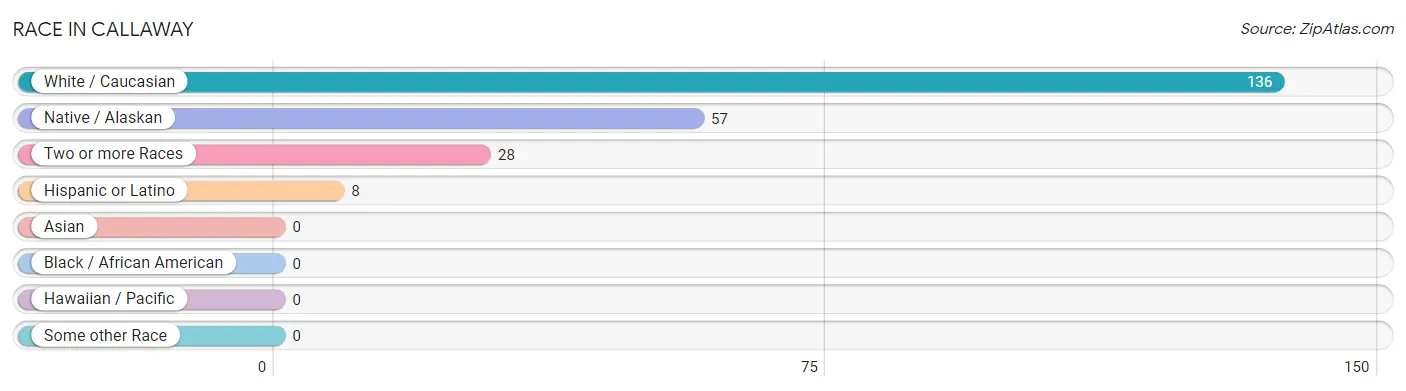
| Race | # Population | % Population |
| Asian | 0 | 0.0% |
| Black / African American | 0 | 0.0% |
| Hawaiian / Pacific | 0 | 0.0% |
| Hispanic or Latino | 8 | 3.6% |
| Native / Alaskan | 57 | 25.8% |
| White / Caucasian | 136 | 61.5% |
| Two or more Races | 28 | 12.7% |
| Some other Race | 0 | 0.0% |
| Total | 221 | 100.0% |
Ancestry in Callaway
The most populous ancestries reported in Callaway are German (79 | 35.7%), Chippewa (74 | 33.5%), Norwegian (36 | 16.3%), French (21 | 9.5%), and English (18 | 8.1%), together accounting for 103.2% of all Callaway residents.
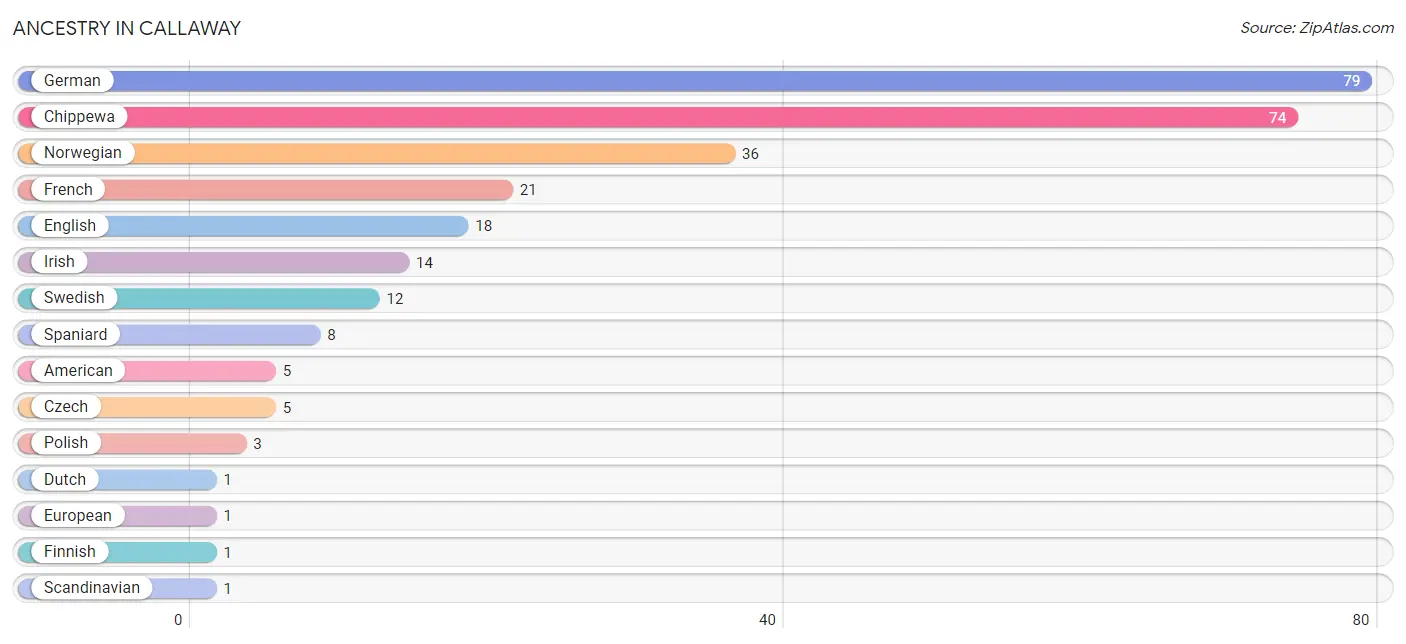
| Ancestry | # Population | % Population |
| American | 5 | 2.3% |
| Chippewa | 74 | 33.5% |
| Czech | 5 | 2.3% |
| Dutch | 1 | 0.4% |
| English | 18 | 8.1% |
| European | 1 | 0.4% |
| Finnish | 1 | 0.4% |
| French | 21 | 9.5% |
| German | 79 | 35.7% |
| Irish | 14 | 6.3% |
| Norwegian | 36 | 16.3% |
| Polish | 3 | 1.4% |
| Scandinavian | 1 | 0.4% |
| Spaniard | 8 | 3.6% |
| Swedish | 12 | 5.4% | View All 15 Rows |
Immigrants in Callaway
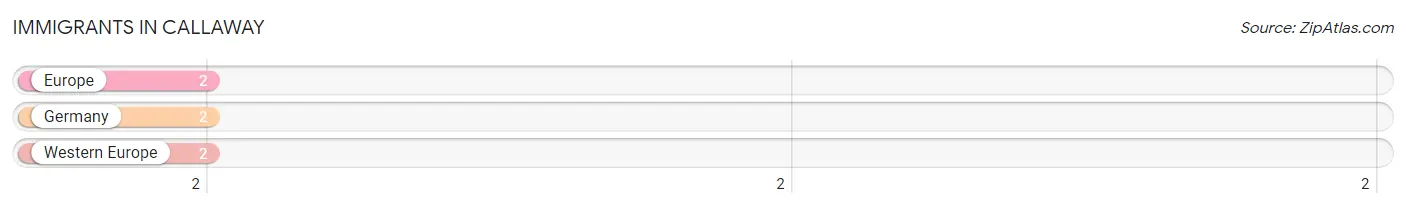
The most numerous immigrant groups reported in Callaway came from Europe (2 | 0.9%), Germany (2 | 0.9%), and Western Europe (2 | 0.9%), together accounting for 2.7% of all Callaway residents.
| Immigration Origin | # Population | % Population |
| Europe | 2 | 0.9% |
| Germany | 2 | 0.9% |
| Western Europe | 2 | 0.9% | View All 3 Rows |
Sex and Age in Callaway
Sex and Age in Callaway
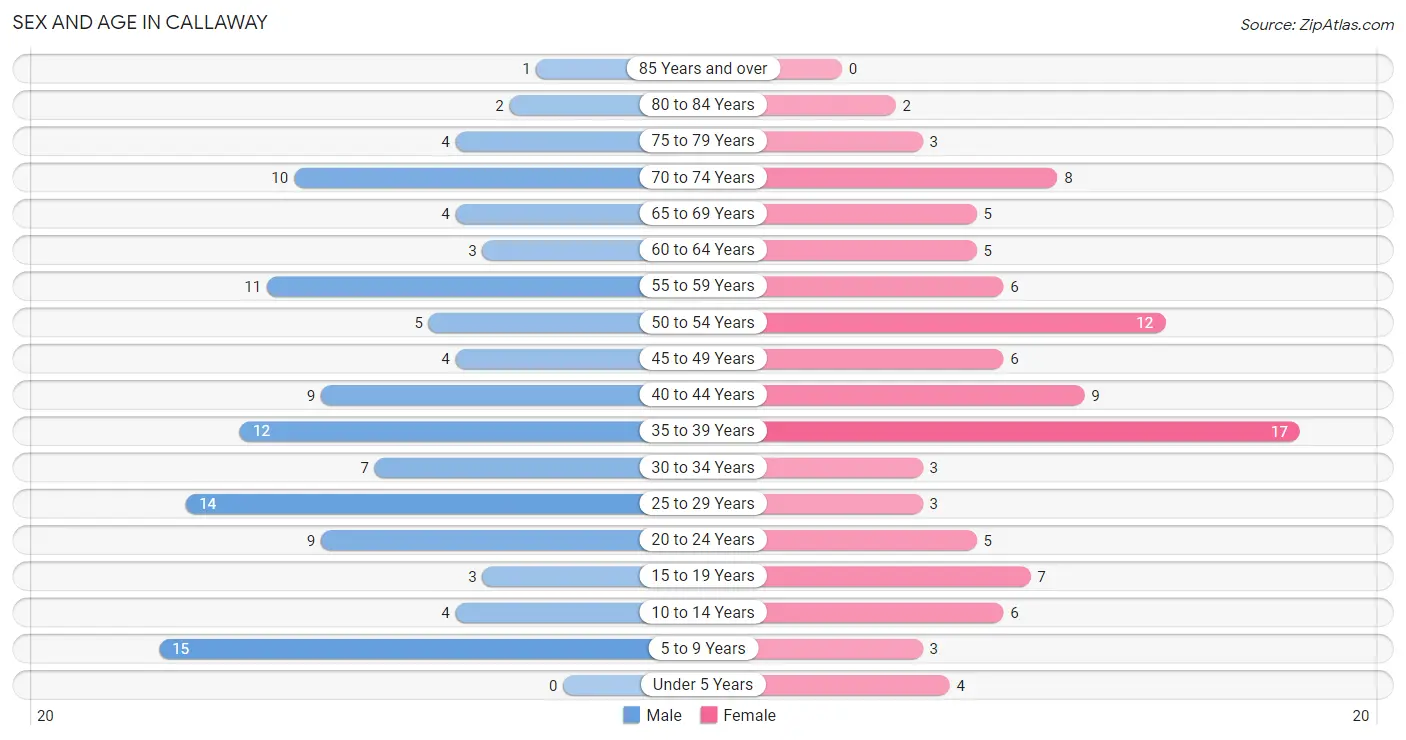
The most populous age groups in Callaway are 5 to 9 Years (15 | 12.8%) for men and 35 to 39 Years (17 | 16.4%) for women.
| Age Bracket | Male | Female |
| Under 5 Years | 0 (0.0%) | 4 (3.8%) |
| 5 to 9 Years | 15 (12.8%) | 3 (2.9%) |
| 10 to 14 Years | 4 (3.4%) | 6 (5.8%) |
| 15 to 19 Years | 3 (2.6%) | 7 (6.7%) |
| 20 to 24 Years | 9 (7.7%) | 5 (4.8%) |
| 25 to 29 Years | 14 (12.0%) | 3 (2.9%) |
| 30 to 34 Years | 7 (6.0%) | 3 (2.9%) |
| 35 to 39 Years | 12 (10.3%) | 17 (16.4%) |
| 40 to 44 Years | 9 (7.7%) | 9 (8.6%) |
| 45 to 49 Years | 4 (3.4%) | 6 (5.8%) |
| 50 to 54 Years | 5 (4.3%) | 12 (11.5%) |
| 55 to 59 Years | 11 (9.4%) | 6 (5.8%) |
| 60 to 64 Years | 3 (2.6%) | 5 (4.8%) |
| 65 to 69 Years | 4 (3.4%) | 5 (4.8%) |
| 70 to 74 Years | 10 (8.6%) | 8 (7.7%) |
| 75 to 79 Years | 4 (3.4%) | 3 (2.9%) |
| 80 to 84 Years | 2 (1.7%) | 2 (1.9%) |
| 85 Years and over | 1 (0.9%) | 0 (0.0%) |
| Total | 117 (100.0%) | 104 (100.0%) |
Families and Households in Callaway
Median Family Size in Callaway
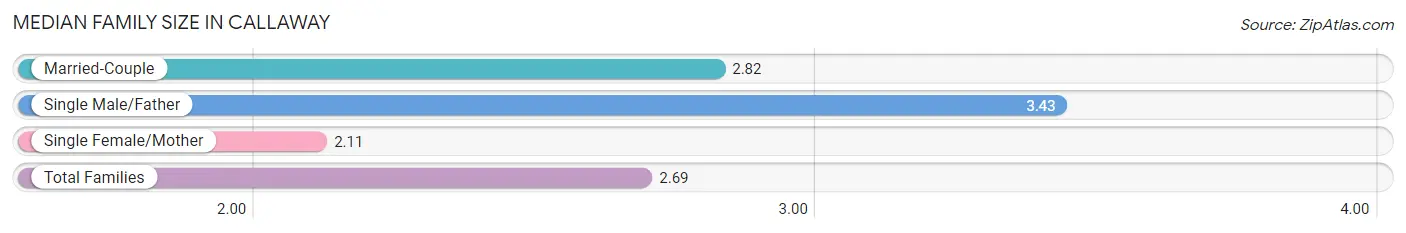
The median family size in Callaway is 2.69 persons per family, with single male/father families (7 | 10.9%) accounting for the largest median family size of 3.43 persons per family. On the other hand, single female/mother families (18 | 28.1%) represent the smallest median family size with 2.11 persons per family.
| Family Type | # Families | Family Size |
| Married-Couple | 39 (60.9%) | 2.82 |
| Single Male/Father | 7 (10.9%) | 3.43 |
| Single Female/Mother | 18 (28.1%) | 2.11 |
| Total Families | 64 (100.0%) | 2.69 |
Median Household Size in Callaway
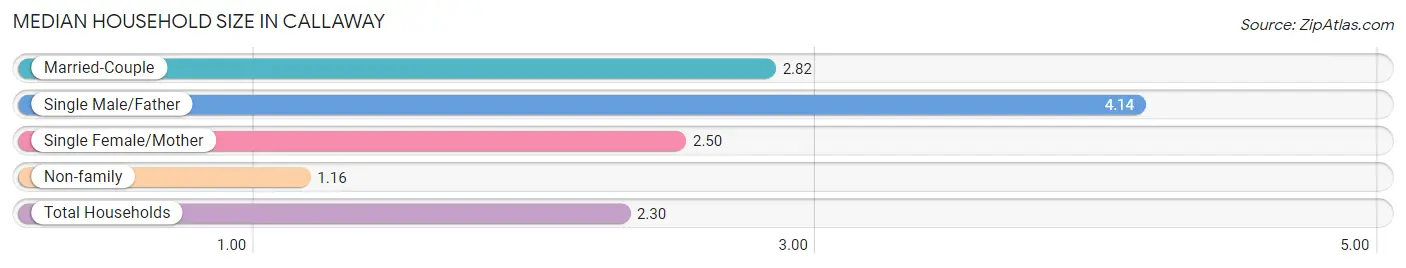
The median household size in Callaway is 2.30 persons per household, with single male/father households (7 | 7.3%) accounting for the largest median household size of 4.14 persons per household. non-family households (32 | 33.3%) represent the smallest median household size with 1.16 persons per household.
| Household Type | # Households | Household Size |
| Married-Couple | 39 (40.6%) | 2.82 |
| Single Male/Father | 7 (7.3%) | 4.14 |
| Single Female/Mother | 18 (18.8%) | 2.50 |
| Non-family | 32 (33.3%) | 1.16 |
| Total Households | 96 (100.0%) | 2.30 |
Household Size by Marriage Status in Callaway
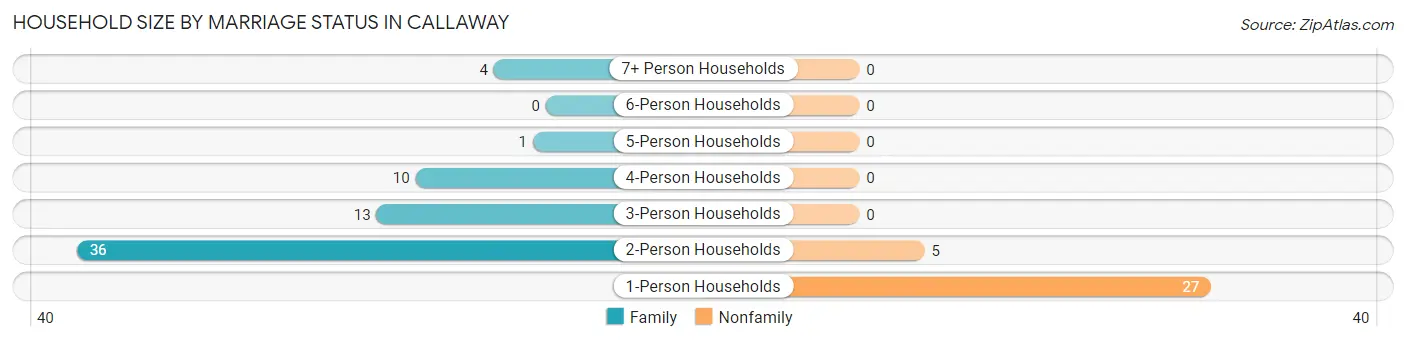
Out of a total of 96 households in Callaway, 64 (66.7%) are family households, while 32 (33.3%) are nonfamily households. The most numerous type of family households are 2-person households, comprising 36, and the most common type of nonfamily households are 1-person households, comprising 27.
| Household Size | Family Households | Nonfamily Households |
| 1-Person Households | - | 27 (28.1%) |
| 2-Person Households | 36 (37.5%) | 5 (5.2%) |
| 3-Person Households | 13 (13.5%) | 0 (0.0%) |
| 4-Person Households | 10 (10.4%) | 0 (0.0%) |
| 5-Person Households | 1 (1.0%) | 0 (0.0%) |
| 6-Person Households | 0 (0.0%) | 0 (0.0%) |
| 7+ Person Households | 4 (4.2%) | 0 (0.0%) |
| Total | 64 (66.7%) | 32 (33.3%) |
Female Fertility in Callaway
Fertility by Age in Callaway
| Age Bracket | Women with Births | Births / 1,000 Women |
| 15 to 19 years | 0 (0.0%) | 0.0 |
| 20 to 34 years | 0 (0.0%) | 0.0 |
| 35 to 50 years | 0 (0.0%) | 0.0 |
| Total | 0 (0.0%) | 0.0 |
Fertility by Age by Marriage Status in Callaway
| Age Bracket | Married | Unmarried |
| 15 to 19 years | 0 (0.0%) | 0 (0.0%) |
| 20 to 34 years | 0 (0.0%) | 0 (0.0%) |
| 35 to 50 years | 0 (0.0%) | 0 (0.0%) |
| Total | 0 (0.0%) | 0 (0.0%) |
Fertility by Education in Callaway
| Educational Attainment | Women with Births | Births / 1,000 Women |
| Less than High School | 0 (0.0%) | 0.0 |
| High School Diploma | 0 (0.0%) | 0.0 |
| College or Associate's Degree | 0 (0.0%) | 0.0 |
| Bachelor's Degree | 0 (0.0%) | 0.0 |
| Graduate Degree | 0 (0.0%) | 0.0 |
| Total | 0 (0.0%) | 0.0 |
Fertility by Education by Marriage Status in Callaway
| Educational Attainment | Married | Unmarried |
| Less than High School | 0 (0.0%) | 0 (0.0%) |
| High School Diploma | 0 (0.0%) | 0 (0.0%) |
| College or Associate's Degree | 0 (0.0%) | 0 (0.0%) |
| Bachelor's Degree | 0 (0.0%) | 0 (0.0%) |
| Graduate Degree | 0 (0.0%) | 0 (0.0%) |
| Total | 0 (0.0%) | 0 (0.0%) |
Employment Characteristics in Callaway
Employment by Class of Employer in Callaway
Among the 120 employed individuals in Callaway, private company employees (74 | 61.7%), self-employed (not incorporated) (16 | 13.3%), and local government employees (10 | 8.3%) make up the most common classes of employment.
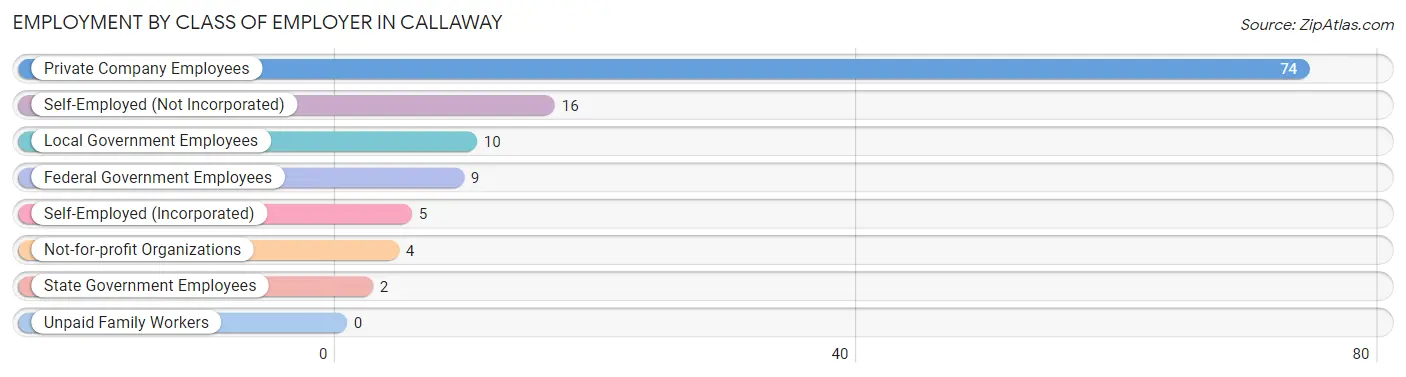
| Employer Class | # Employees | % Employees |
| Private Company Employees | 74 | 61.7% |
| Self-Employed (Incorporated) | 5 | 4.2% |
| Self-Employed (Not Incorporated) | 16 | 13.3% |
| Not-for-profit Organizations | 4 | 3.3% |
| Local Government Employees | 10 | 8.3% |
| State Government Employees | 2 | 1.7% |
| Federal Government Employees | 9 | 7.5% |
| Unpaid Family Workers | 0 | 0.0% |
| Total | 120 | 100.0% |
Employment Status by Age in Callaway
According to the labor force statistics for Callaway, out of the total population over 16 years of age (189), 71.4% or 135 individuals are in the labor force, with 6.7% or 9 of them unemployed. The age group with the highest labor force participation rate is 25 to 29 years, with 100.0% or 17 individuals in the labor force. Within the labor force, the 20 to 24 years age range has the highest percentage of unemployed individuals, with 41.7% or 5 of them being unemployed.
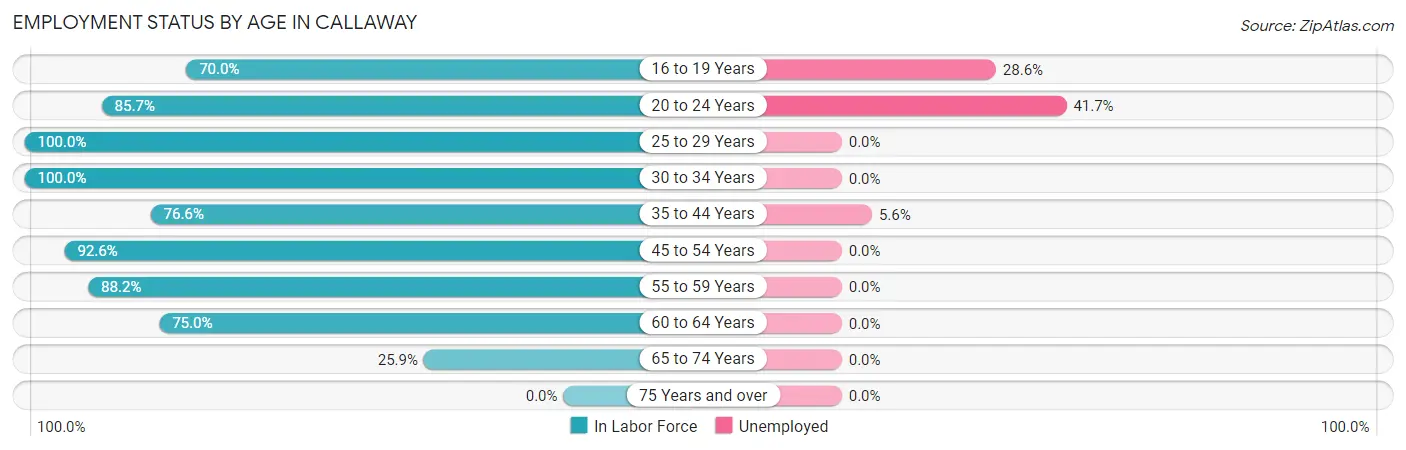
| Age Bracket | In Labor Force | Unemployed |
| 16 to 19 Years | 7 (70.0%) | 2 (28.6%) |
| 20 to 24 Years | 12 (85.7%) | 5 (41.7%) |
| 25 to 29 Years | 17 (100.0%) | 0 (0.0%) |
| 30 to 34 Years | 10 (100.0%) | 0 (0.0%) |
| 35 to 44 Years | 36 (76.6%) | 2 (5.6%) |
| 45 to 54 Years | 25 (92.6%) | 0 (0.0%) |
| 55 to 59 Years | 15 (88.2%) | 0 (0.0%) |
| 60 to 64 Years | 6 (75.0%) | 0 (0.0%) |
| 65 to 74 Years | 7 (25.9%) | 0 (0.0%) |
| 75 Years and over | 0 (0.0%) | 0 (0.0%) |
| Total | 135 (71.4%) | 9 (6.7%) |
Employment Status by Educational Attainment in Callaway
According to labor force statistics for Callaway, 86.5% of individuals (109) out of the total population between 25 and 64 years of age (126) are in the labor force, with 1.8% or 2 of them being unemployed. The group with the highest labor force participation rate are those with the educational attainment of high school diploma, with 95.0% or 38 individuals in the labor force. Within the labor force, individuals with less than high school education have the highest percentage of unemployment, with 15.4% or 2 of them being unemployed.
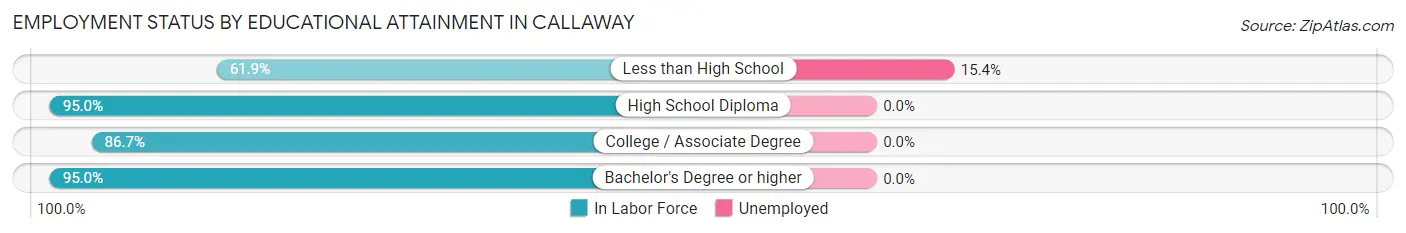
| Educational Attainment | In Labor Force | Unemployed |
| Less than High School | 13 (61.9%) | 3 (15.4%) |
| High School Diploma | 38 (95.0%) | 0 (0.0%) |
| College / Associate Degree | 39 (86.7%) | 0 (0.0%) |
| Bachelor's Degree or higher | 19 (95.0%) | 0 (0.0%) |
| Total | 109 (86.5%) | 2 (1.8%) |
Employment Occupations by Sex in Callaway
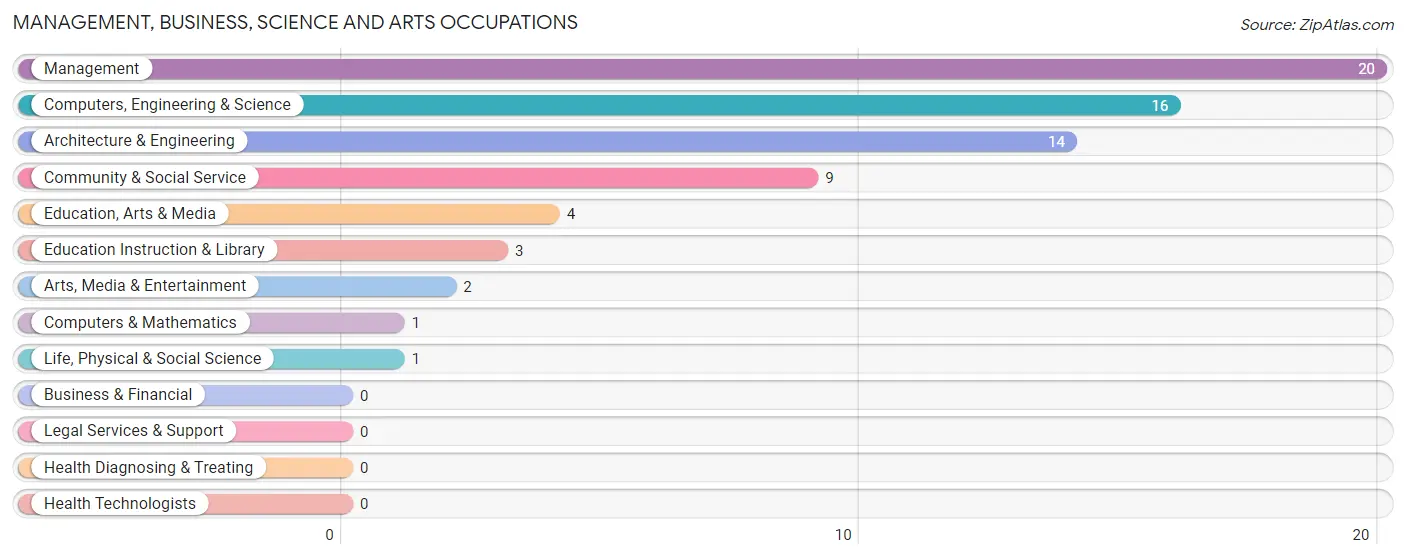
Management, Business, Science and Arts Occupations
The most common Management, Business, Science and Arts occupations in Callaway are Management (20 | 15.9%), Computers, Engineering & Science (16 | 12.7%), Architecture & Engineering (14 | 11.1%), Community & Social Service (9 | 7.1%), and Education, Arts & Media (4 | 3.2%).
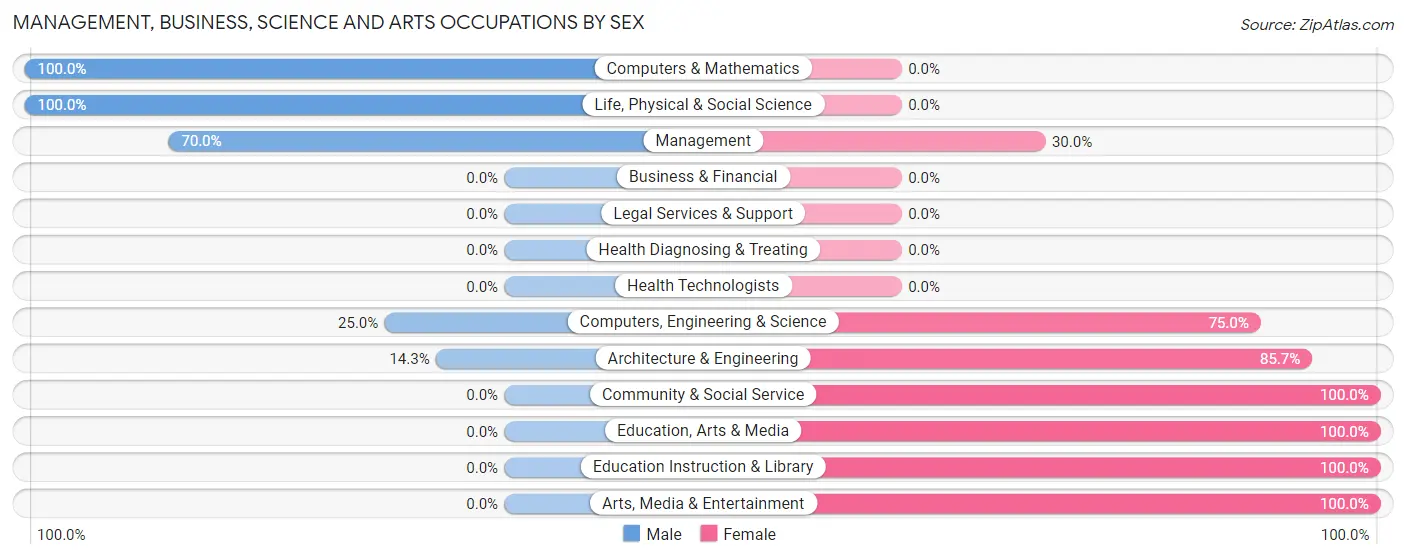
Management, Business, Science and Arts Occupations by Sex
Within the Management, Business, Science and Arts occupations in Callaway, the most male-oriented occupations are Computers & Mathematics (100.0%), Life, Physical & Social Science (100.0%), and Management (70.0%), while the most female-oriented occupations are Community & Social Service (100.0%), Education, Arts & Media (100.0%), and Education Instruction & Library (100.0%).
| Occupation | Male | Female |
| Management | 14 (70.0%) | 6 (30.0%) |
| Business & Financial | 0 (0.0%) | 0 (0.0%) |
| Computers, Engineering & Science | 4 (25.0%) | 12 (75.0%) |
| Computers & Mathematics | 1 (100.0%) | 0 (0.0%) |
| Architecture & Engineering | 2 (14.3%) | 12 (85.7%) |
| Life, Physical & Social Science | 1 (100.0%) | 0 (0.0%) |
| Community & Social Service | 0 (0.0%) | 9 (100.0%) |
| Education, Arts & Media | 0 (0.0%) | 4 (100.0%) |
| Legal Services & Support | 0 (0.0%) | 0 (0.0%) |
| Education Instruction & Library | 0 (0.0%) | 3 (100.0%) |
| Arts, Media & Entertainment | 0 (0.0%) | 2 (100.0%) |
| Health Diagnosing & Treating | 0 (0.0%) | 0 (0.0%) |
| Health Technologists | 0 (0.0%) | 0 (0.0%) |
| Total (Category) | 18 (40.0%) | 27 (60.0%) |
| Total (Overall) | 66 (52.4%) | 60 (47.6%) |
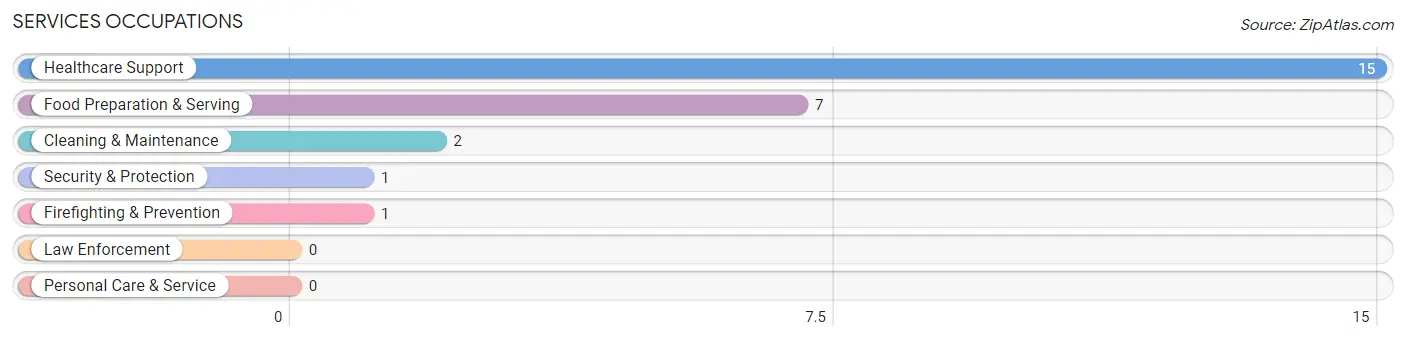
Services Occupations
The most common Services occupations in Callaway are Healthcare Support (15 | 11.9%), Food Preparation & Serving (7 | 5.6%), Cleaning & Maintenance (2 | 1.6%), Security & Protection (1 | 0.8%), and Firefighting & Prevention (1 | 0.8%).
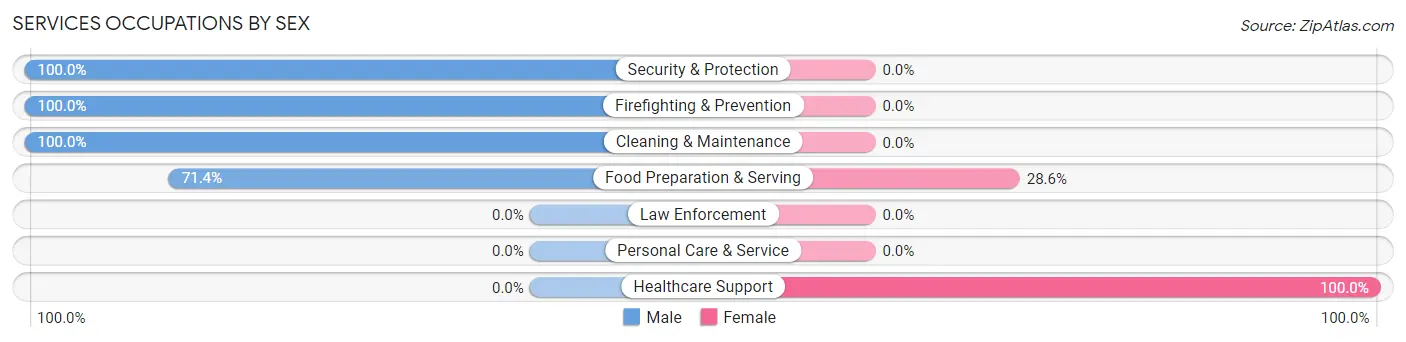
Services Occupations by Sex
Within the Services occupations in Callaway, the most male-oriented occupations are Security & Protection (100.0%), Firefighting & Prevention (100.0%), and Cleaning & Maintenance (100.0%), while the most female-oriented occupations are Healthcare Support (100.0%), and Food Preparation & Serving (28.6%).
| Occupation | Male | Female |
| Healthcare Support | 0 (0.0%) | 15 (100.0%) |
| Security & Protection | 1 (100.0%) | 0 (0.0%) |
| Firefighting & Prevention | 1 (100.0%) | 0 (0.0%) |
| Law Enforcement | 0 (0.0%) | 0 (0.0%) |
| Food Preparation & Serving | 5 (71.4%) | 2 (28.6%) |
| Cleaning & Maintenance | 2 (100.0%) | 0 (0.0%) |
| Personal Care & Service | 0 (0.0%) | 0 (0.0%) |
| Total (Category) | 8 (32.0%) | 17 (68.0%) |
| Total (Overall) | 66 (52.4%) | 60 (47.6%) |
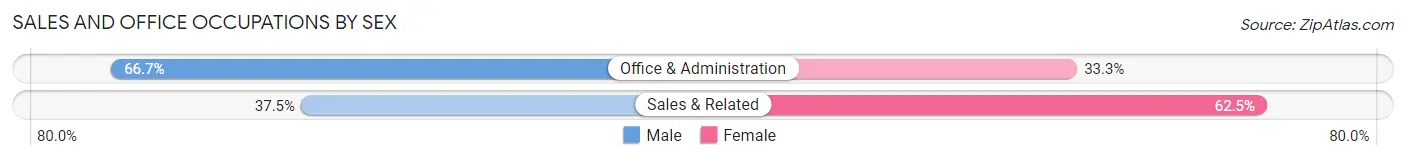
Sales and Office Occupations
The most common Sales and Office occupations in Callaway are Sales & Related (16 | 12.7%), and Office & Administration (9 | 7.1%).
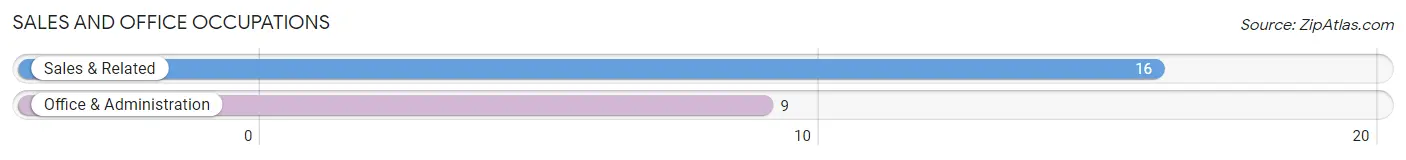
Sales and Office Occupations by Sex
| Occupation | Male | Female |
| Sales & Related | 6 (37.5%) | 10 (62.5%) |
| Office & Administration | 6 (66.7%) | 3 (33.3%) |
| Total (Category) | 12 (48.0%) | 13 (52.0%) |
| Total (Overall) | 66 (52.4%) | 60 (47.6%) |
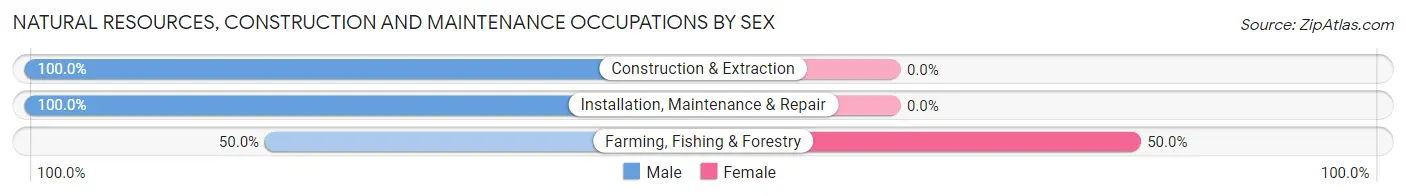
Natural Resources, Construction and Maintenance Occupations
The most common Natural Resources, Construction and Maintenance occupations in Callaway are Construction & Extraction (19 | 15.1%), Farming, Fishing & Forestry (4 | 3.2%), and Installation, Maintenance & Repair (4 | 3.2%).
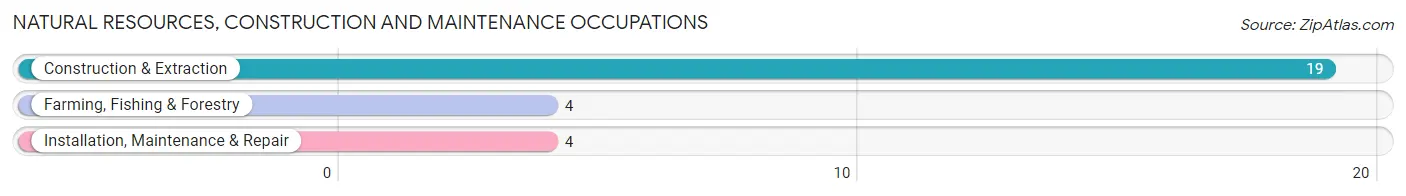
Natural Resources, Construction and Maintenance Occupations by Sex
| Occupation | Male | Female |
| Farming, Fishing & Forestry | 2 (50.0%) | 2 (50.0%) |
| Construction & Extraction | 19 (100.0%) | 0 (0.0%) |
| Installation, Maintenance & Repair | 4 (100.0%) | 0 (0.0%) |
| Total (Category) | 25 (92.6%) | 2 (7.4%) |
| Total (Overall) | 66 (52.4%) | 60 (47.6%) |
Production, Transportation and Moving Occupations
The most common Production, Transportation and Moving occupations in Callaway are , and Production (4 | 3.2%).
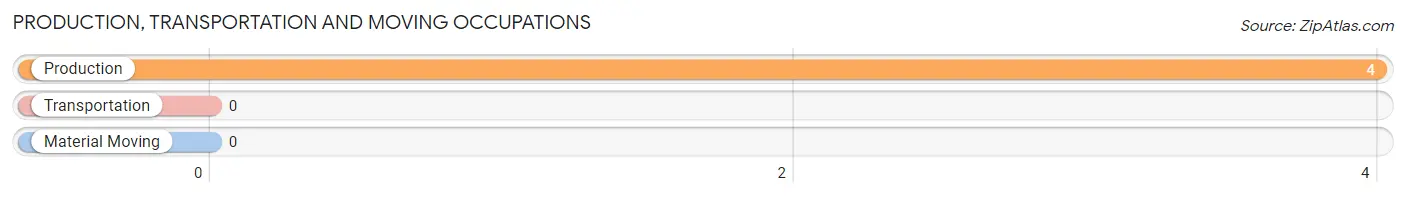
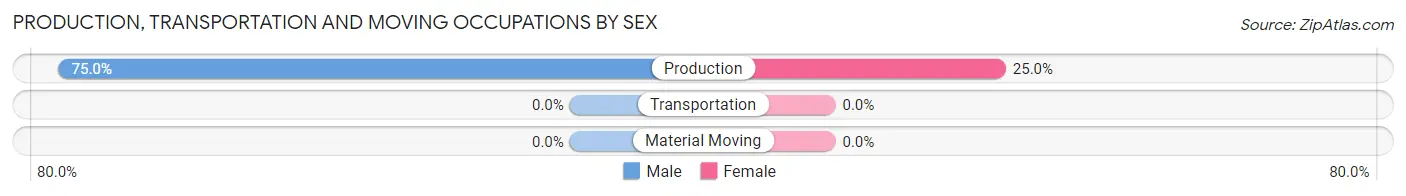
Production, Transportation and Moving Occupations by Sex
| Occupation | Male | Female |
| Production | 3 (75.0%) | 1 (25.0%) |
| Transportation | 0 (0.0%) | 0 (0.0%) |
| Material Moving | 0 (0.0%) | 0 (0.0%) |
| Total (Category) | 3 (75.0%) | 1 (25.0%) |
| Total (Overall) | 66 (52.4%) | 60 (47.6%) |
Employment Industries by Sex in Callaway
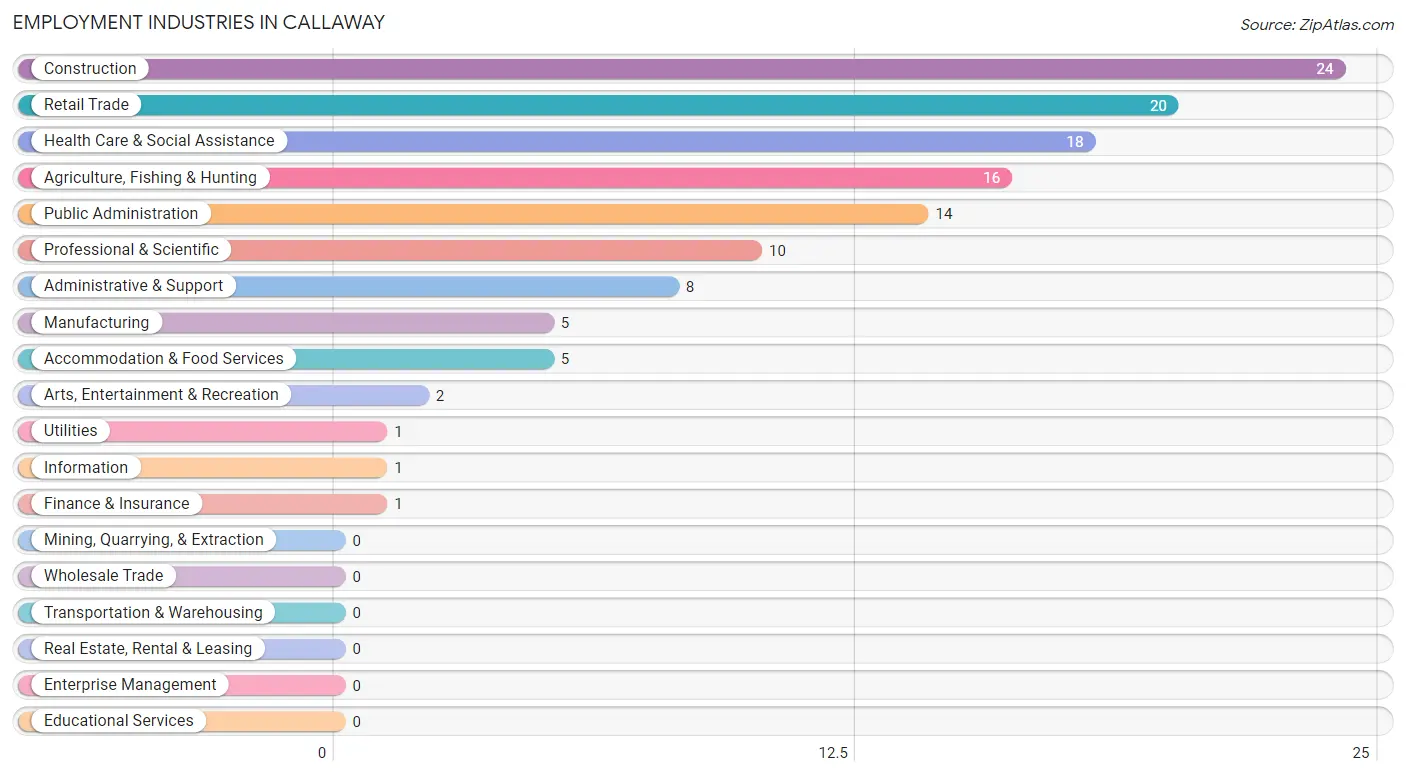
Employment Industries in Callaway
The major employment industries in Callaway include Construction (24 | 19.1%), Retail Trade (20 | 15.9%), Health Care & Social Assistance (18 | 14.3%), Agriculture, Fishing & Hunting (16 | 12.7%), and Public Administration (14 | 11.1%).
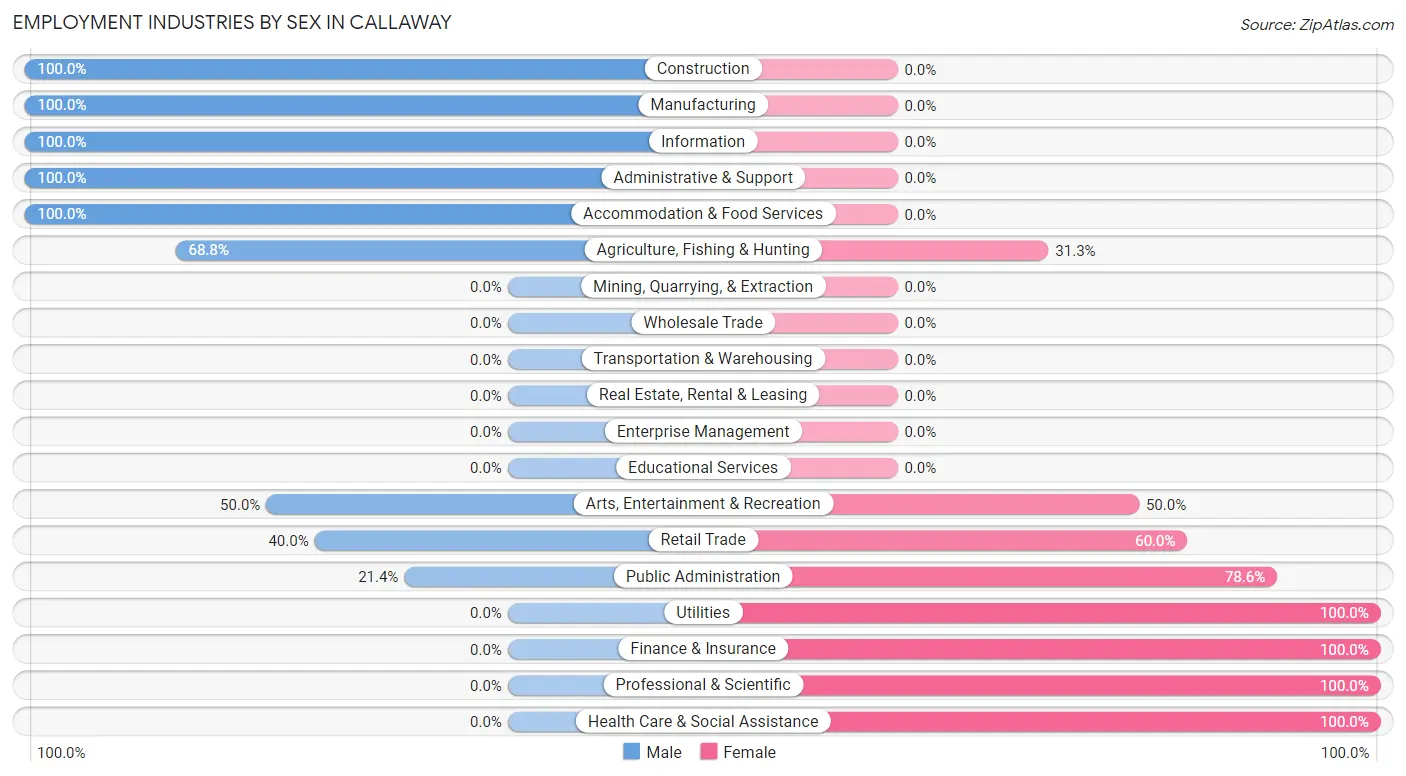
Employment Industries by Sex in Callaway
The Callaway industries that see more men than women are Construction (100.0%), Manufacturing (100.0%), and Information (100.0%), whereas the industries that tend to have a higher number of women are Utilities (100.0%), Finance & Insurance (100.0%), and Professional & Scientific (100.0%).
| Industry | Male | Female |
| Agriculture, Fishing & Hunting | 11 (68.8%) | 5 (31.2%) |
| Mining, Quarrying, & Extraction | 0 (0.0%) | 0 (0.0%) |
| Construction | 24 (100.0%) | 0 (0.0%) |
| Manufacturing | 5 (100.0%) | 0 (0.0%) |
| Wholesale Trade | 0 (0.0%) | 0 (0.0%) |
| Retail Trade | 8 (40.0%) | 12 (60.0%) |
| Transportation & Warehousing | 0 (0.0%) | 0 (0.0%) |
| Utilities | 0 (0.0%) | 1 (100.0%) |
| Information | 1 (100.0%) | 0 (0.0%) |
| Finance & Insurance | 0 (0.0%) | 1 (100.0%) |
| Real Estate, Rental & Leasing | 0 (0.0%) | 0 (0.0%) |
| Professional & Scientific | 0 (0.0%) | 10 (100.0%) |
| Enterprise Management | 0 (0.0%) | 0 (0.0%) |
| Administrative & Support | 8 (100.0%) | 0 (0.0%) |
| Educational Services | 0 (0.0%) | 0 (0.0%) |
| Health Care & Social Assistance | 0 (0.0%) | 18 (100.0%) |
| Arts, Entertainment & Recreation | 1 (50.0%) | 1 (50.0%) |
| Accommodation & Food Services | 5 (100.0%) | 0 (0.0%) |
| Public Administration | 3 (21.4%) | 11 (78.6%) |
| Total | 66 (52.4%) | 60 (47.6%) |
Education in Callaway
School Enrollment in Callaway
The most common levels of schooling among the 42 students in Callaway are elementary school (11 | 26.2%), middle school (9 | 21.4%), and college / undergraduate (8 | 19.1%).
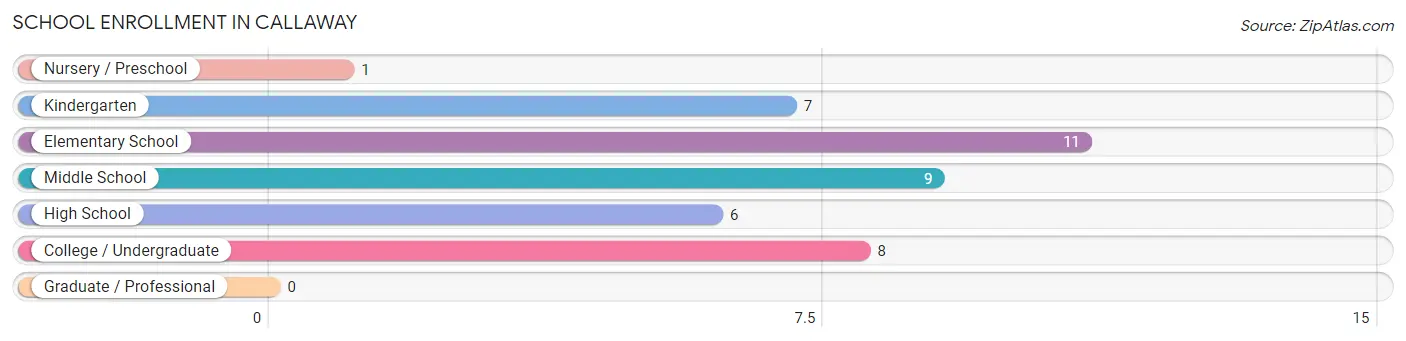
| School Level | # Students | % Students |
| Nursery / Preschool | 1 | 2.4% |
| Kindergarten | 7 | 16.7% |
| Elementary School | 11 | 26.2% |
| Middle School | 9 | 21.4% |
| High School | 6 | 14.3% |
| College / Undergraduate | 8 | 19.1% |
| Graduate / Professional | 0 | 0.0% |
| Total | 42 | 100.0% |
School Enrollment by Age by Funding Source in Callaway
Out of a total of 42 students who are enrolled in schools in Callaway, 6 (14.3%) attend a private institution, while the remaining 36 (85.7%) are enrolled in public schools. The age group of 10 to 14 year olds has the highest likelihood of being enrolled in private schools, with 4 (40.0% in the age bracket) enrolled. Conversely, the age group of 15 to 17 year olds has the lowest likelihood of being enrolled in a private school, with 3 (100.0% in the age bracket) attending a public institution.
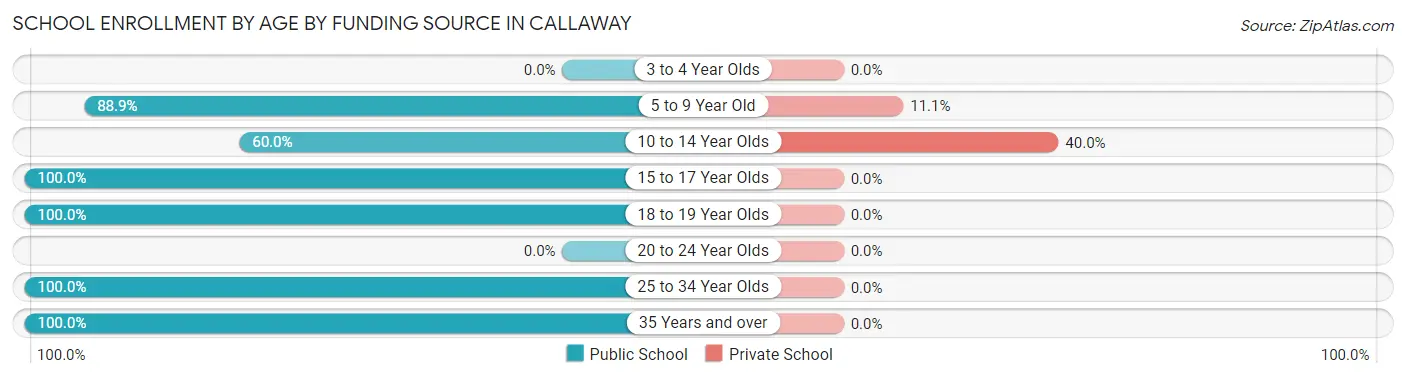
| Age Bracket | Public School | Private School |
| 3 to 4 Year Olds | 0 (0.0%) | 0 (0.0%) |
| 5 to 9 Year Old | 16 (88.9%) | 2 (11.1%) |
| 10 to 14 Year Olds | 6 (60.0%) | 4 (40.0%) |
| 15 to 17 Year Olds | 3 (100.0%) | 0 (0.0%) |
| 18 to 19 Year Olds | 5 (100.0%) | 0 (0.0%) |
| 20 to 24 Year Olds | 0 (0.0%) | 0 (0.0%) |
| 25 to 34 Year Olds | 2 (100.0%) | 0 (0.0%) |
| 35 Years and over | 4 (100.0%) | 0 (0.0%) |
| Total | 36 (85.7%) | 6 (14.3%) |
Educational Attainment by Field of Study in Callaway
Bio, nature & agricultural (12 | 44.4%), science & technology (4 | 14.8%), literature & languages (3 | 11.1%), arts & humanities (3 | 11.1%), and psychology (2 | 7.4%) are the most common fields of study among 27 individuals in Callaway who have obtained a bachelor's degree or higher.
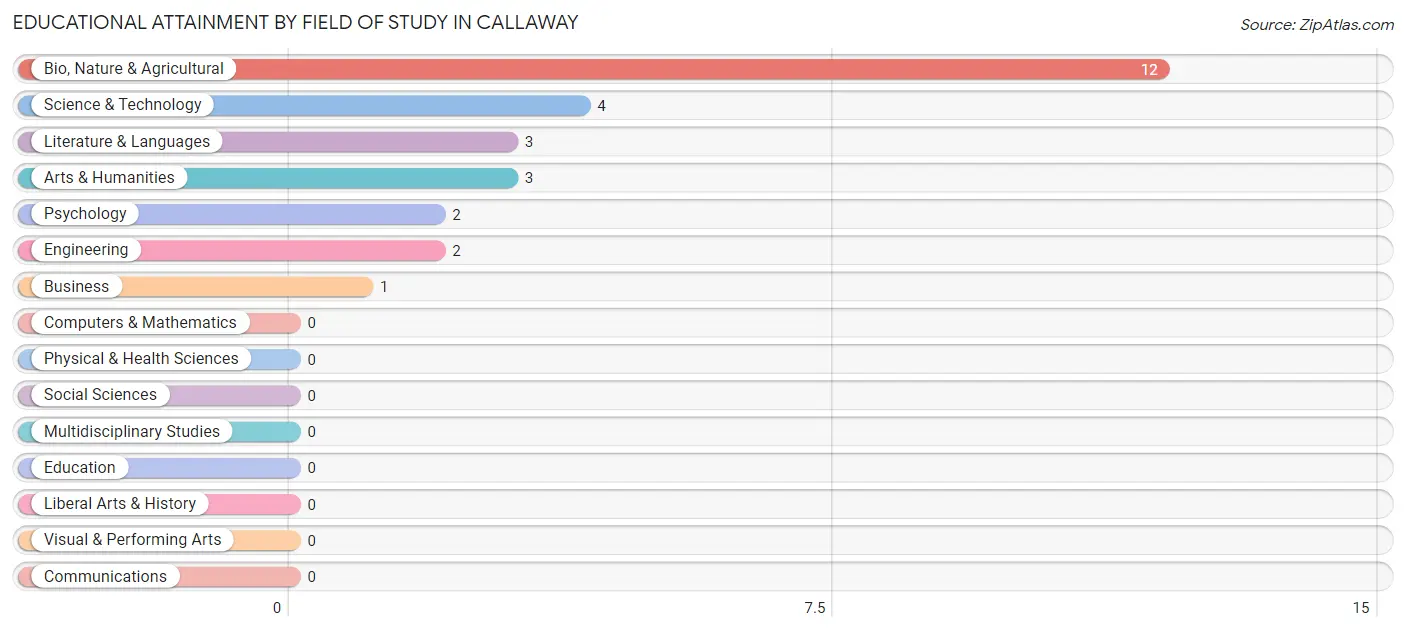
| Field of Study | # Graduates | % Graduates |
| Computers & Mathematics | 0 | 0.0% |
| Bio, Nature & Agricultural | 12 | 44.4% |
| Physical & Health Sciences | 0 | 0.0% |
| Psychology | 2 | 7.4% |
| Social Sciences | 0 | 0.0% |
| Engineering | 2 | 7.4% |
| Multidisciplinary Studies | 0 | 0.0% |
| Science & Technology | 4 | 14.8% |
| Business | 1 | 3.7% |
| Education | 0 | 0.0% |
| Literature & Languages | 3 | 11.1% |
| Liberal Arts & History | 0 | 0.0% |
| Visual & Performing Arts | 0 | 0.0% |
| Communications | 0 | 0.0% |
| Arts & Humanities | 3 | 11.1% |
| Total | 27 | 100.0% |
Transportation & Commute in Callaway
Vehicle Availability by Sex in Callaway
The most prevalent vehicle ownership categories in Callaway are males with 2 vehicles (30, accounting for 46.9%) and females with 2 vehicles (31, making up 53.6%).
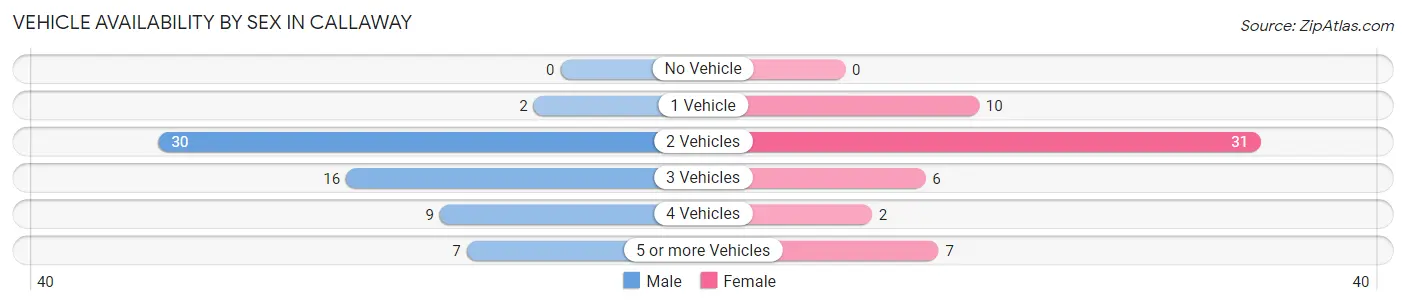
| Vehicles Available | Male | Female |
| No Vehicle | 0 (0.0%) | 0 (0.0%) |
| 1 Vehicle | 2 (3.1%) | 10 (17.9%) |
| 2 Vehicles | 30 (46.9%) | 31 (55.4%) |
| 3 Vehicles | 16 (25.0%) | 6 (10.7%) |
| 4 Vehicles | 9 (14.1%) | 2 (3.6%) |
| 5 or more Vehicles | 7 (10.9%) | 7 (12.5%) |
| Total | 64 (100.0%) | 56 (100.0%) |
Commute Time in Callaway
The most frequently occuring commute durations in Callaway are 15 to 19 minutes (26 commuters, 22.8%), less than 5 minutes (21 commuters, 18.4%), and 20 to 24 minutes (21 commuters, 18.4%).
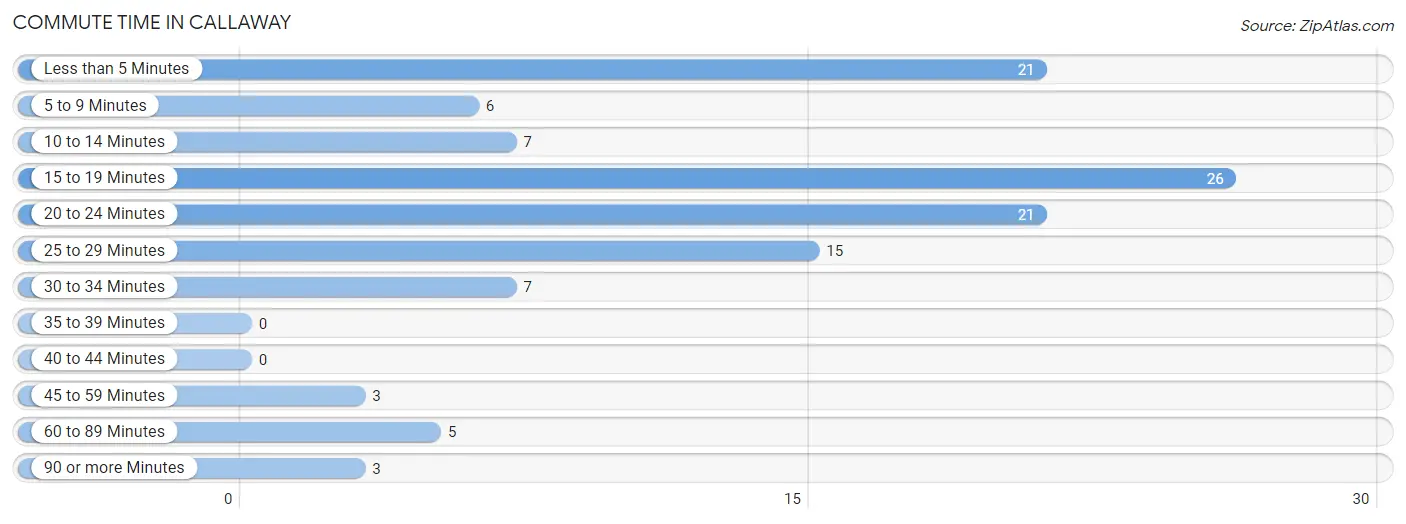
| Commute Time | # Commuters | % Commuters |
| Less than 5 Minutes | 21 | 18.4% |
| 5 to 9 Minutes | 6 | 5.3% |
| 10 to 14 Minutes | 7 | 6.1% |
| 15 to 19 Minutes | 26 | 22.8% |
| 20 to 24 Minutes | 21 | 18.4% |
| 25 to 29 Minutes | 15 | 13.2% |
| 30 to 34 Minutes | 7 | 6.1% |
| 35 to 39 Minutes | 0 | 0.0% |
| 40 to 44 Minutes | 0 | 0.0% |
| 45 to 59 Minutes | 3 | 2.6% |
| 60 to 89 Minutes | 5 | 4.4% |
| 90 or more Minutes | 3 | 2.6% |
Commute Time by Sex in Callaway
The most common commute times in Callaway are 20 to 24 minutes (11 commuters, 19.0%) for males and 15 to 19 minutes (18 commuters, 32.1%) for females.
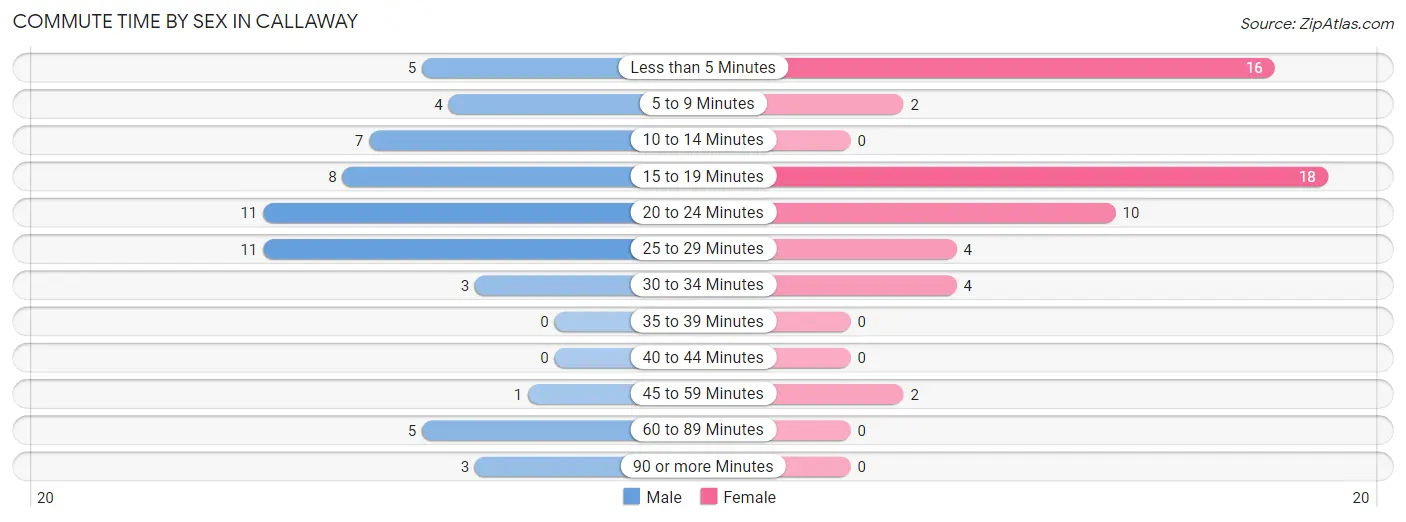
| Commute Time | Male | Female |
| Less than 5 Minutes | 5 (8.6%) | 16 (28.6%) |
| 5 to 9 Minutes | 4 (6.9%) | 2 (3.6%) |
| 10 to 14 Minutes | 7 (12.1%) | 0 (0.0%) |
| 15 to 19 Minutes | 8 (13.8%) | 18 (32.1%) |
| 20 to 24 Minutes | 11 (19.0%) | 10 (17.9%) |
| 25 to 29 Minutes | 11 (19.0%) | 4 (7.1%) |
| 30 to 34 Minutes | 3 (5.2%) | 4 (7.1%) |
| 35 to 39 Minutes | 0 (0.0%) | 0 (0.0%) |
| 40 to 44 Minutes | 0 (0.0%) | 0 (0.0%) |
| 45 to 59 Minutes | 1 (1.7%) | 2 (3.6%) |
| 60 to 89 Minutes | 5 (8.6%) | 0 (0.0%) |
| 90 or more Minutes | 3 (5.2%) | 0 (0.0%) |
Time of Departure to Work by Sex in Callaway
The most frequent times of departure to work in Callaway are 7:00 AM to 7:29 AM (14, 24.1%) for males and 7:30 AM to 7:59 AM (24, 42.9%) for females.
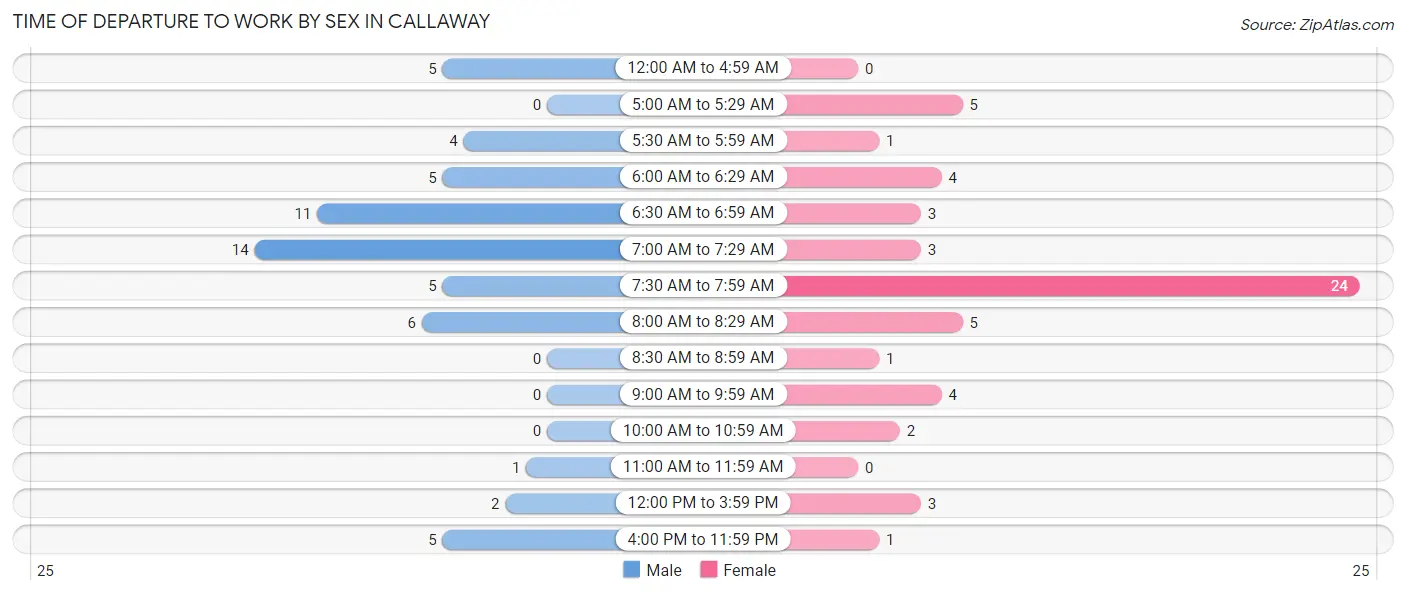
| Time of Departure | Male | Female |
| 12:00 AM to 4:59 AM | 5 (8.6%) | 0 (0.0%) |
| 5:00 AM to 5:29 AM | 0 (0.0%) | 5 (8.9%) |
| 5:30 AM to 5:59 AM | 4 (6.9%) | 1 (1.8%) |
| 6:00 AM to 6:29 AM | 5 (8.6%) | 4 (7.1%) |
| 6:30 AM to 6:59 AM | 11 (19.0%) | 3 (5.4%) |
| 7:00 AM to 7:29 AM | 14 (24.1%) | 3 (5.4%) |
| 7:30 AM to 7:59 AM | 5 (8.6%) | 24 (42.9%) |
| 8:00 AM to 8:29 AM | 6 (10.3%) | 5 (8.9%) |
| 8:30 AM to 8:59 AM | 0 (0.0%) | 1 (1.8%) |
| 9:00 AM to 9:59 AM | 0 (0.0%) | 4 (7.1%) |
| 10:00 AM to 10:59 AM | 0 (0.0%) | 2 (3.6%) |
| 11:00 AM to 11:59 AM | 1 (1.7%) | 0 (0.0%) |
| 12:00 PM to 3:59 PM | 2 (3.5%) | 3 (5.4%) |
| 4:00 PM to 11:59 PM | 5 (8.6%) | 1 (1.8%) |
| Total | 58 (100.0%) | 56 (100.0%) |
Housing Occupancy in Callaway
Occupancy by Ownership in Callaway
Of the total 96 dwellings in Callaway, owner-occupied units account for 74 (77.1%), while renter-occupied units make up 22 (22.9%).
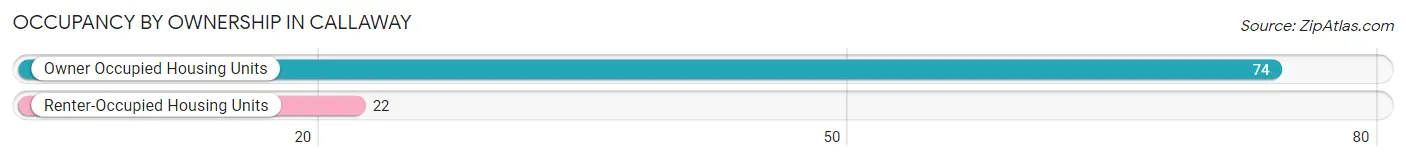
| Occupancy | # Housing Units | % Housing Units |
| Owner Occupied Housing Units | 74 | 77.1% |
| Renter-Occupied Housing Units | 22 | 22.9% |
| Total Occupied Housing Units | 96 | 100.0% |
Occupancy by Household Size in Callaway
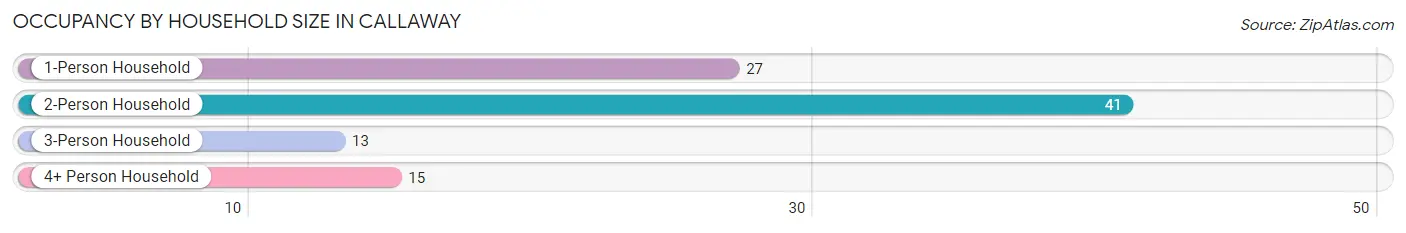
| Household Size | # Housing Units | % Housing Units |
| 1-Person Household | 27 | 28.1% |
| 2-Person Household | 41 | 42.7% |
| 3-Person Household | 13 | 13.5% |
| 4+ Person Household | 15 | 15.6% |
| Total Housing Units | 96 | 100.0% |
Occupancy by Ownership by Household Size in Callaway
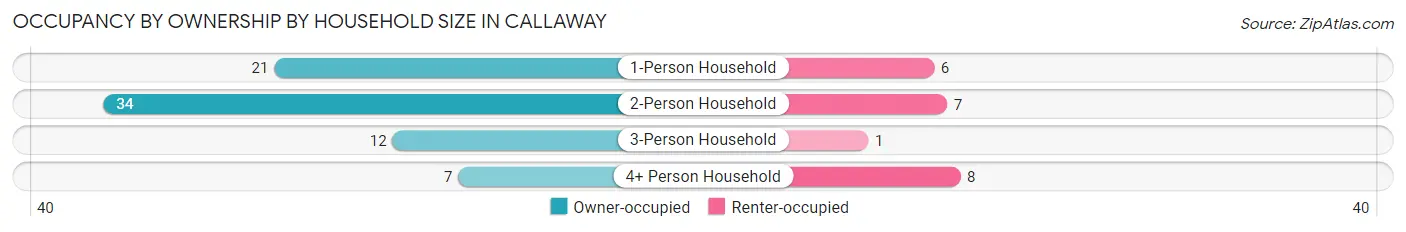
| Household Size | Owner-occupied | Renter-occupied |
| 1-Person Household | 21 (77.8%) | 6 (22.2%) |
| 2-Person Household | 34 (82.9%) | 7 (17.1%) |
| 3-Person Household | 12 (92.3%) | 1 (7.7%) |
| 4+ Person Household | 7 (46.7%) | 8 (53.3%) |
| Total Housing Units | 74 (77.1%) | 22 (22.9%) |
Occupancy by Educational Attainment in Callaway
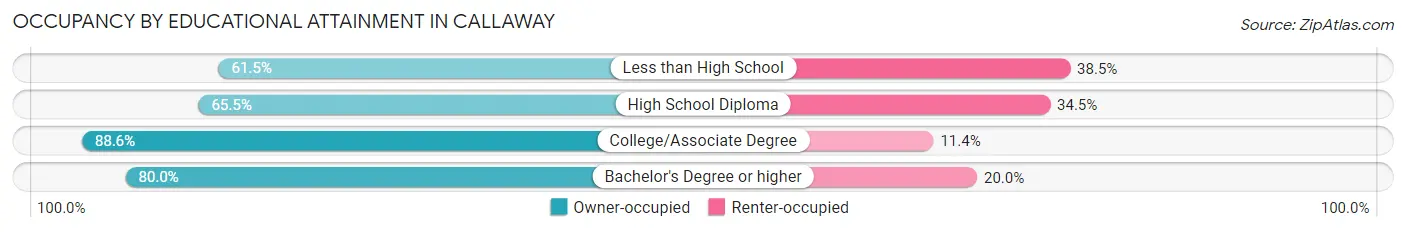
| Household Size | Owner-occupied | Renter-occupied |
| Less than High School | 8 (61.5%) | 5 (38.5%) |
| High School Diploma | 19 (65.5%) | 10 (34.5%) |
| College/Associate Degree | 39 (88.6%) | 5 (11.4%) |
| Bachelor's Degree or higher | 8 (80.0%) | 2 (20.0%) |
Occupancy by Age of Householder in Callaway
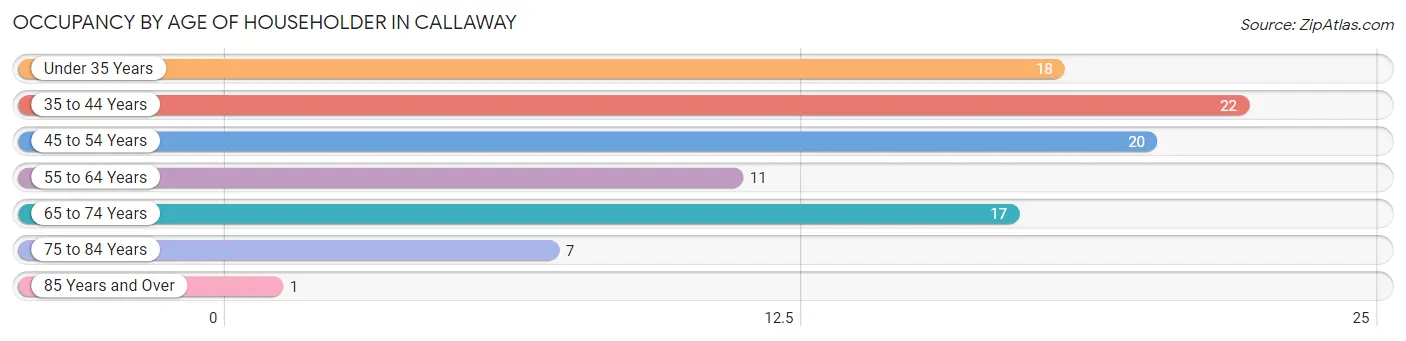
| Age Bracket | # Households | % Households |
| Under 35 Years | 18 | 18.8% |
| 35 to 44 Years | 22 | 22.9% |
| 45 to 54 Years | 20 | 20.8% |
| 55 to 64 Years | 11 | 11.5% |
| 65 to 74 Years | 17 | 17.7% |
| 75 to 84 Years | 7 | 7.3% |
| 85 Years and Over | 1 | 1.0% |
| Total | 96 | 100.0% |
Housing Finances in Callaway
Median Income by Occupancy in Callaway
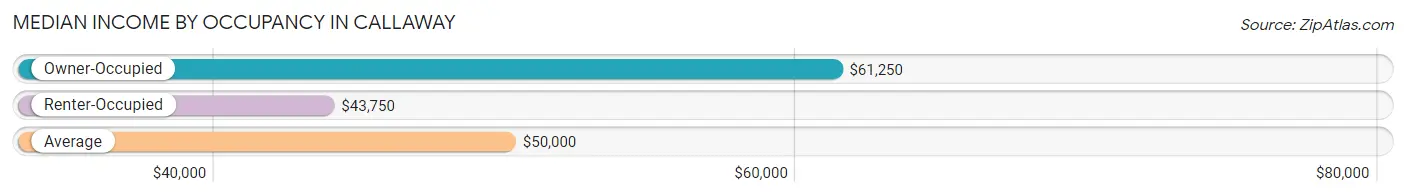
| Occupancy Type | # Households | Median Income |
| Owner-Occupied | 74 (77.1%) | $61,250 |
| Renter-Occupied | 22 (22.9%) | $43,750 |
| Average | 96 (100.0%) | $50,000 |
Occupancy by Householder Income Bracket in Callaway
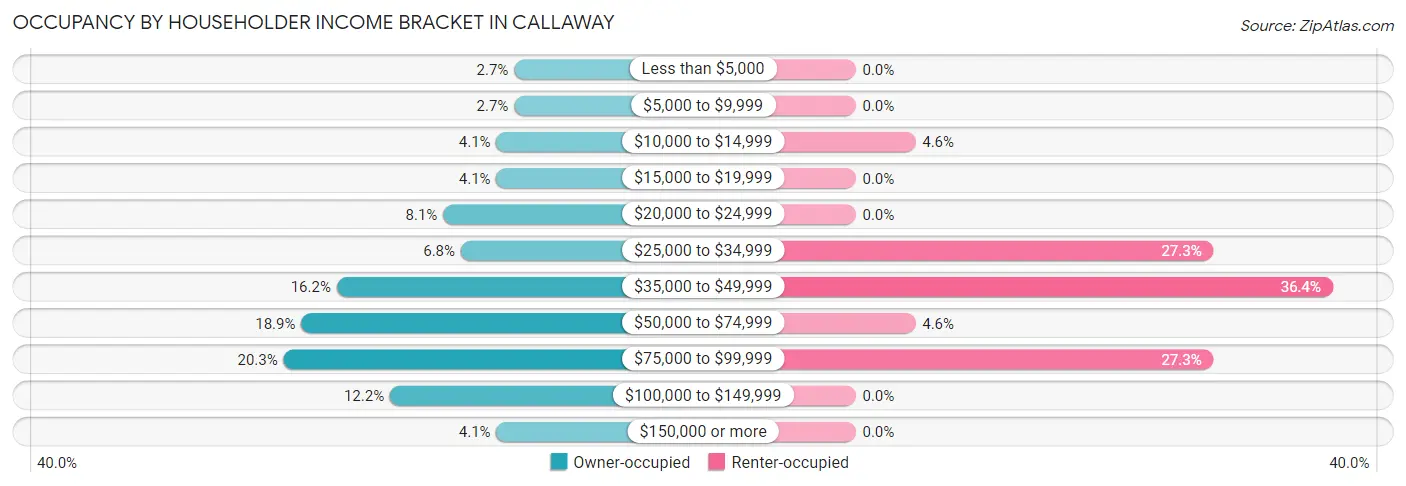
| Income Bracket | Owner-occupied | Renter-occupied |
| Less than $5,000 | 2 (2.7%) | 0 (0.0%) |
| $5,000 to $9,999 | 2 (2.7%) | 0 (0.0%) |
| $10,000 to $14,999 | 3 (4.1%) | 1 (4.5%) |
| $15,000 to $19,999 | 3 (4.1%) | 0 (0.0%) |
| $20,000 to $24,999 | 6 (8.1%) | 0 (0.0%) |
| $25,000 to $34,999 | 5 (6.8%) | 6 (27.3%) |
| $35,000 to $49,999 | 12 (16.2%) | 8 (36.4%) |
| $50,000 to $74,999 | 14 (18.9%) | 1 (4.5%) |
| $75,000 to $99,999 | 15 (20.3%) | 6 (27.3%) |
| $100,000 to $149,999 | 9 (12.2%) | 0 (0.0%) |
| $150,000 or more | 3 (4.1%) | 0 (0.0%) |
| Total | 74 (100.0%) | 22 (100.0%) |
Monthly Housing Cost Tiers in Callaway
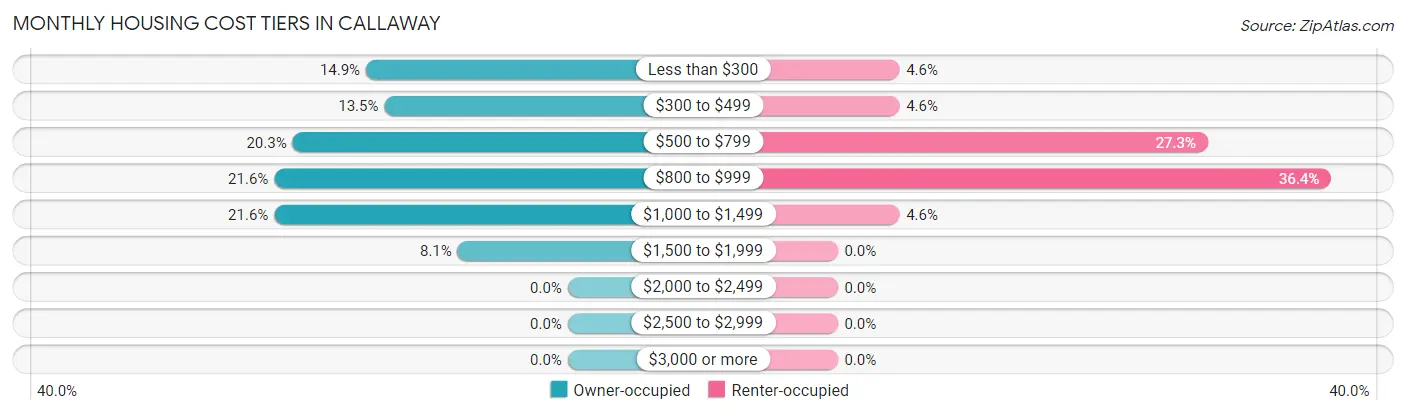
| Monthly Cost | Owner-occupied | Renter-occupied |
| Less than $300 | 11 (14.9%) | 1 (4.5%) |
| $300 to $499 | 10 (13.5%) | 1 (4.5%) |
| $500 to $799 | 15 (20.3%) | 6 (27.3%) |
| $800 to $999 | 16 (21.6%) | 8 (36.4%) |
| $1,000 to $1,499 | 16 (21.6%) | 1 (4.5%) |
| $1,500 to $1,999 | 6 (8.1%) | 0 (0.0%) |
| $2,000 to $2,499 | 0 (0.0%) | 0 (0.0%) |
| $2,500 to $2,999 | 0 (0.0%) | 0 (0.0%) |
| $3,000 or more | 0 (0.0%) | 0 (0.0%) |
| Total | 74 (100.0%) | 22 (100.0%) |
Physical Housing Characteristics in Callaway
Housing Structures in Callaway
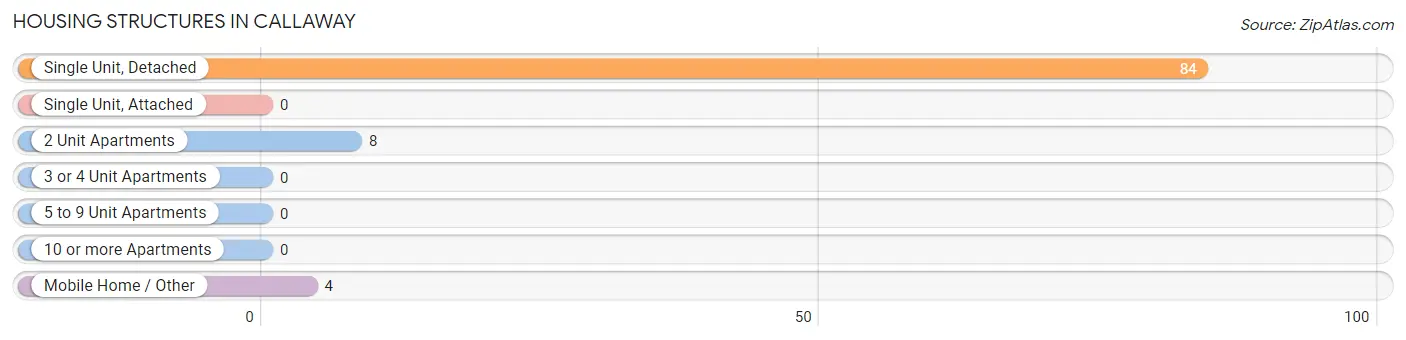
| Structure Type | # Housing Units | % Housing Units |
| Single Unit, Detached | 84 | 87.5% |
| Single Unit, Attached | 0 | 0.0% |
| 2 Unit Apartments | 8 | 8.3% |
| 3 or 4 Unit Apartments | 0 | 0.0% |
| 5 to 9 Unit Apartments | 0 | 0.0% |
| 10 or more Apartments | 0 | 0.0% |
| Mobile Home / Other | 4 | 4.2% |
| Total | 96 | 100.0% |
Housing Structures by Occupancy in Callaway
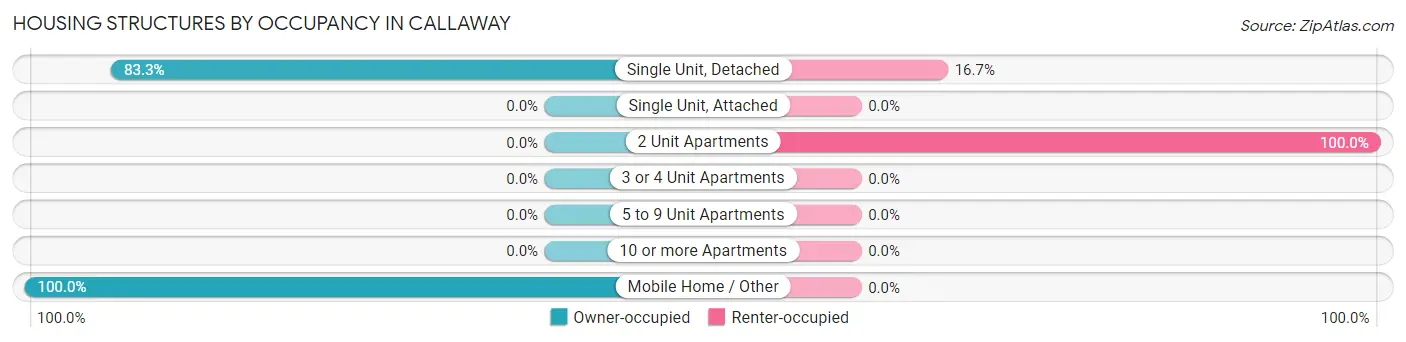
| Structure Type | Owner-occupied | Renter-occupied |
| Single Unit, Detached | 70 (83.3%) | 14 (16.7%) |
| Single Unit, Attached | 0 (0.0%) | 0 (0.0%) |
| 2 Unit Apartments | 0 (0.0%) | 8 (100.0%) |
| 3 or 4 Unit Apartments | 0 (0.0%) | 0 (0.0%) |
| 5 to 9 Unit Apartments | 0 (0.0%) | 0 (0.0%) |
| 10 or more Apartments | 0 (0.0%) | 0 (0.0%) |
| Mobile Home / Other | 4 (100.0%) | 0 (0.0%) |
| Total | 74 (77.1%) | 22 (22.9%) |
Housing Structures by Number of Rooms in Callaway
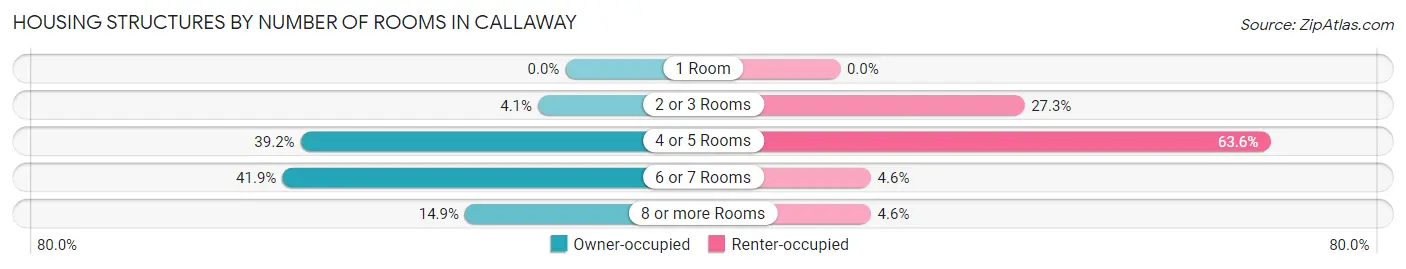
| Number of Rooms | Owner-occupied | Renter-occupied |
| 1 Room | 0 (0.0%) | 0 (0.0%) |
| 2 or 3 Rooms | 3 (4.1%) | 6 (27.3%) |
| 4 or 5 Rooms | 29 (39.2%) | 14 (63.6%) |
| 6 or 7 Rooms | 31 (41.9%) | 1 (4.5%) |
| 8 or more Rooms | 11 (14.9%) | 1 (4.5%) |
| Total | 74 (100.0%) | 22 (100.0%) |
Housing Structure by Heating Type in Callaway
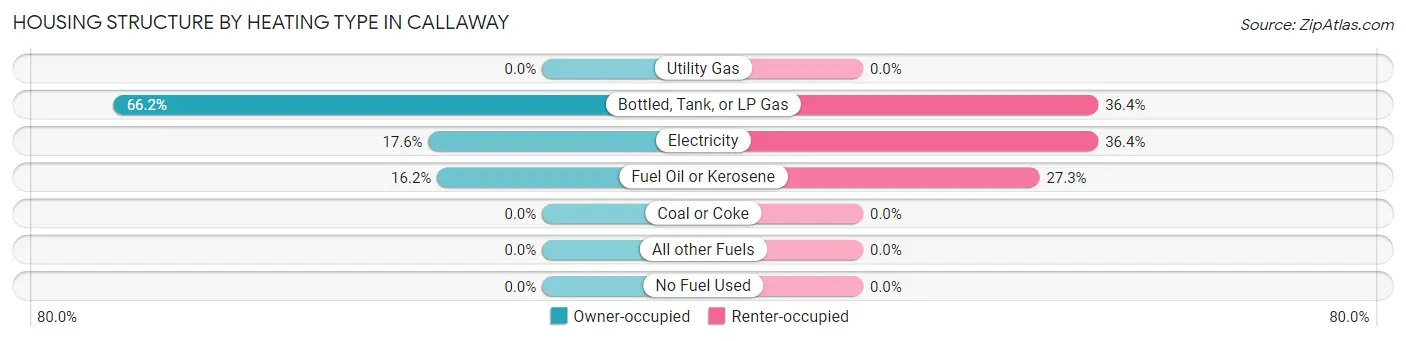
| Heating Type | Owner-occupied | Renter-occupied |
| Utility Gas | 0 (0.0%) | 0 (0.0%) |
| Bottled, Tank, or LP Gas | 49 (66.2%) | 8 (36.4%) |
| Electricity | 13 (17.6%) | 8 (36.4%) |
| Fuel Oil or Kerosene | 12 (16.2%) | 6 (27.3%) |
| Coal or Coke | 0 (0.0%) | 0 (0.0%) |
| All other Fuels | 0 (0.0%) | 0 (0.0%) |
| No Fuel Used | 0 (0.0%) | 0 (0.0%) |
| Total | 74 (100.0%) | 22 (100.0%) |
Household Vehicle Usage in Callaway
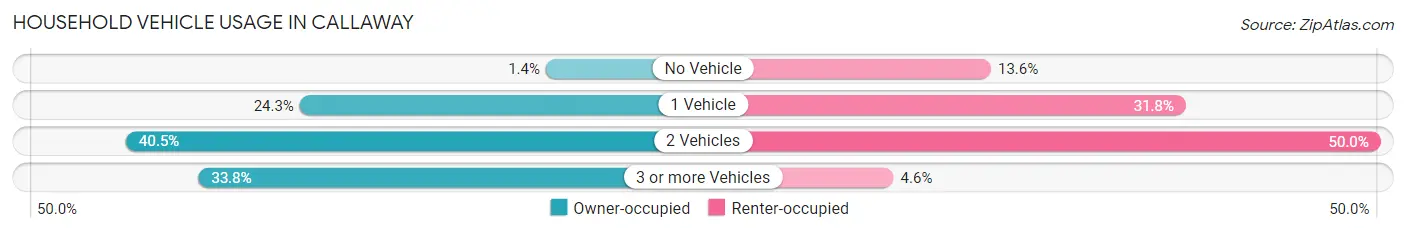
| Vehicles per Household | Owner-occupied | Renter-occupied |
| No Vehicle | 1 (1.3%) | 3 (13.6%) |
| 1 Vehicle | 18 (24.3%) | 7 (31.8%) |
| 2 Vehicles | 30 (40.5%) | 11 (50.0%) |
| 3 or more Vehicles | 25 (33.8%) | 1 (4.5%) |
| Total | 74 (100.0%) | 22 (100.0%) |
Real Estate & Mortgages in Callaway
Real Estate and Mortgage Overview in Callaway
| Characteristic | Without Mortgage | With Mortgage |
| Housing Units | 32 | 42 |
| Median Property Value | $76,700 | $87,500 |
| Median Household Income | $41,250 | $3 |
| Monthly Housing Costs | $390 | $0 |
| Real Estate Taxes | $750 | $2 |
Property Value by Mortgage Status in Callaway
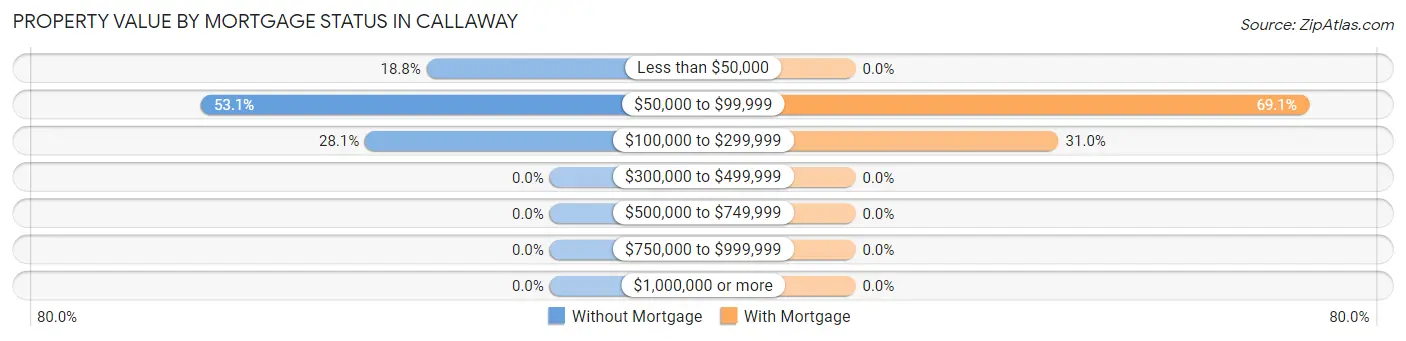
| Property Value | Without Mortgage | With Mortgage |
| Less than $50,000 | 6 (18.8%) | 0 (0.0%) |
| $50,000 to $99,999 | 17 (53.1%) | 29 (69.1%) |
| $100,000 to $299,999 | 9 (28.1%) | 13 (30.9%) |
| $300,000 to $499,999 | 0 (0.0%) | 0 (0.0%) |
| $500,000 to $749,999 | 0 (0.0%) | 0 (0.0%) |
| $750,000 to $999,999 | 0 (0.0%) | 0 (0.0%) |
| $1,000,000 or more | 0 (0.0%) | 0 (0.0%) |
| Total | 32 (100.0%) | 42 (100.0%) |
Household Income by Mortgage Status in Callaway
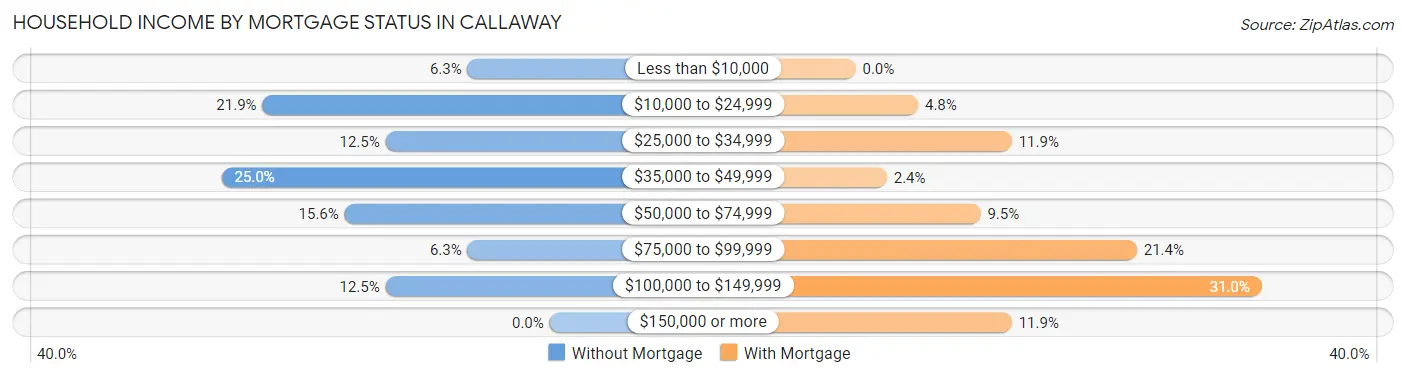
| Household Income | Without Mortgage | With Mortgage |
| Less than $10,000 | 2 (6.2%) | 0 (0.0%) |
| $10,000 to $24,999 | 7 (21.9%) | 2 (4.8%) |
| $25,000 to $34,999 | 4 (12.5%) | 5 (11.9%) |
| $35,000 to $49,999 | 8 (25.0%) | 1 (2.4%) |
| $50,000 to $74,999 | 5 (15.6%) | 4 (9.5%) |
| $75,000 to $99,999 | 2 (6.2%) | 9 (21.4%) |
| $100,000 to $149,999 | 4 (12.5%) | 13 (30.9%) |
| $150,000 or more | 0 (0.0%) | 5 (11.9%) |
| Total | 32 (100.0%) | 42 (100.0%) |
Property Value to Household Income Ratio in Callaway
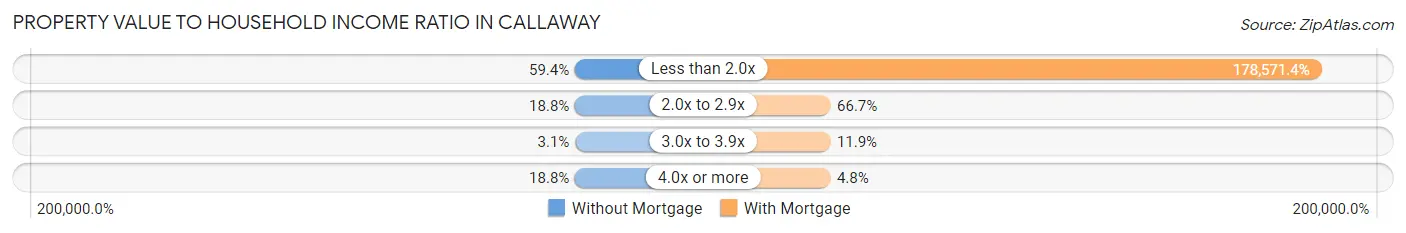
| Value-to-Income Ratio | Without Mortgage | With Mortgage |
| Less than 2.0x | 19 (59.4%) | 75,000 (178,571.4%) |
| 2.0x to 2.9x | 6 (18.8%) | 28 (66.7%) |
| 3.0x to 3.9x | 1 (3.1%) | 5 (11.9%) |
| 4.0x or more | 6 (18.8%) | 2 (4.8%) |
| Total | 32 (100.0%) | 42 (100.0%) |
Real Estate Taxes by Mortgage Status in Callaway
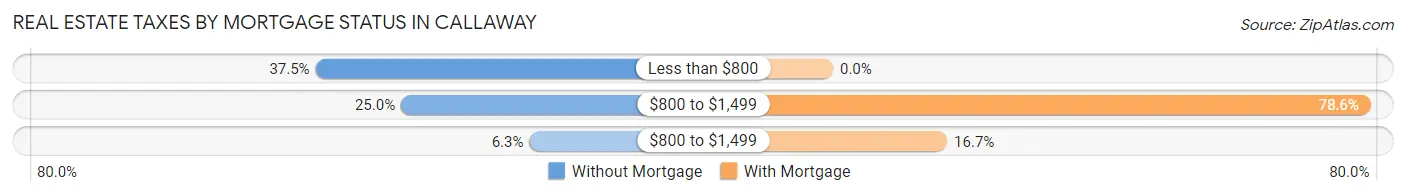
| Property Taxes | Without Mortgage | With Mortgage |
| Less than $800 | 12 (37.5%) | 0 (0.0%) |
| $800 to $1,499 | 8 (25.0%) | 33 (78.6%) |
| $800 to $1,499 | 2 (6.2%) | 7 (16.7%) |
| Total | 32 (100.0%) | 42 (100.0%) |
Health & Disability in Callaway
Health Insurance Coverage by Age in Callaway
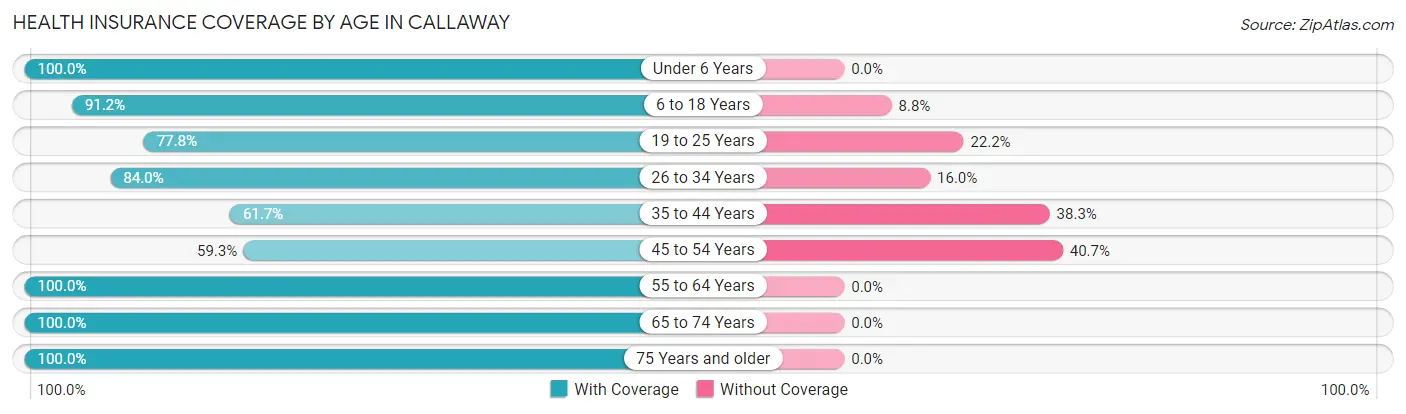
| Age Bracket | With Coverage | Without Coverage |
| Under 6 Years | 6 (100.0%) | 0 (0.0%) |
| 6 to 18 Years | 31 (91.2%) | 3 (8.8%) |
| 19 to 25 Years | 14 (77.8%) | 4 (22.2%) |
| 26 to 34 Years | 21 (84.0%) | 4 (16.0%) |
| 35 to 44 Years | 29 (61.7%) | 18 (38.3%) |
| 45 to 54 Years | 16 (59.3%) | 11 (40.7%) |
| 55 to 64 Years | 25 (100.0%) | 0 (0.0%) |
| 65 to 74 Years | 27 (100.0%) | 0 (0.0%) |
| 75 Years and older | 12 (100.0%) | 0 (0.0%) |
| Total | 181 (81.9%) | 40 (18.1%) |
Health Insurance Coverage by Citizenship Status in Callaway
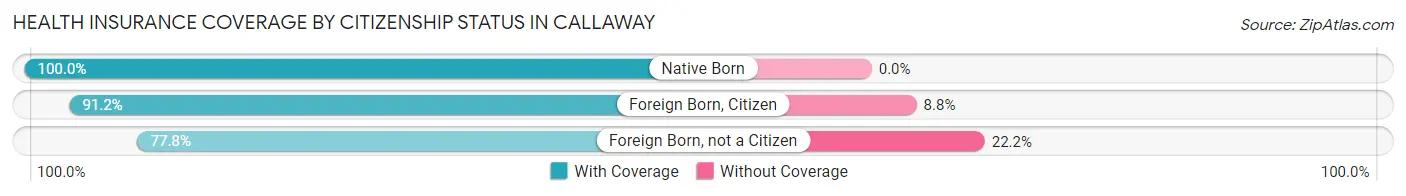
| Citizenship Status | With Coverage | Without Coverage |
| Native Born | 6 (100.0%) | 0 (0.0%) |
| Foreign Born, Citizen | 31 (91.2%) | 3 (8.8%) |
| Foreign Born, not a Citizen | 14 (77.8%) | 4 (22.2%) |
Health Insurance Coverage by Household Income in Callaway
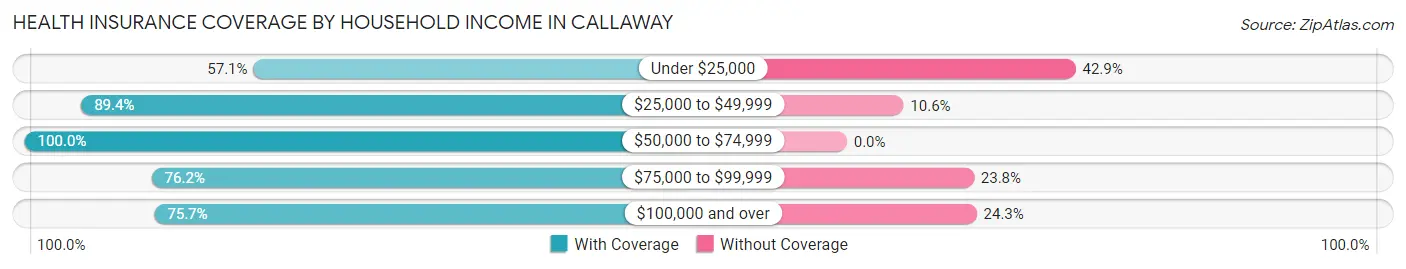
| Household Income | With Coverage | Without Coverage |
| Under $25,000 | 12 (57.1%) | 9 (42.9%) |
| $25,000 to $49,999 | 59 (89.4%) | 7 (10.6%) |
| $50,000 to $74,999 | 34 (100.0%) | 0 (0.0%) |
| $75,000 to $99,999 | 48 (76.2%) | 15 (23.8%) |
| $100,000 and over | 28 (75.7%) | 9 (24.3%) |
Public vs Private Health Insurance Coverage by Age in Callaway
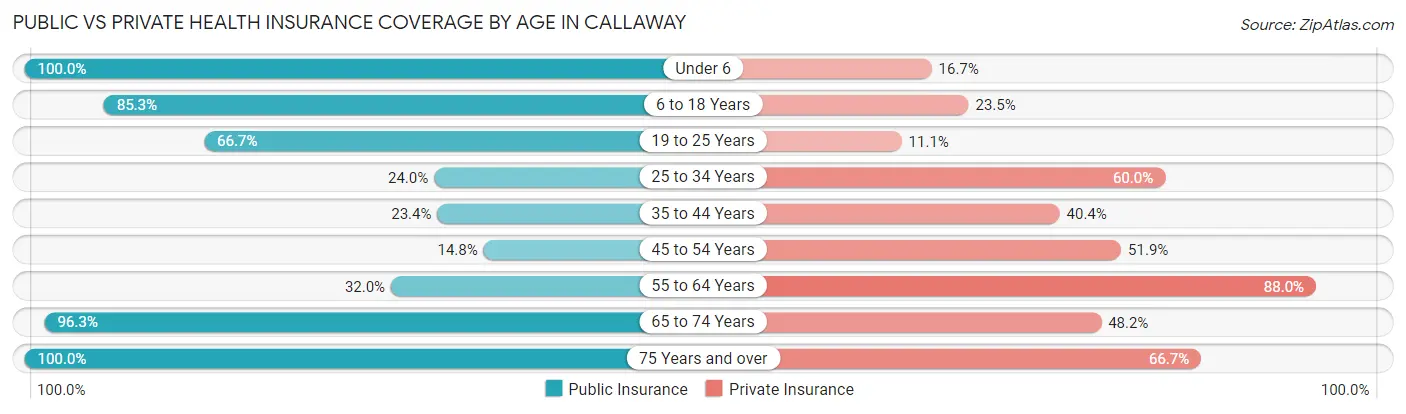
| Age Bracket | Public Insurance | Private Insurance |
| Under 6 | 6 (100.0%) | 1 (16.7%) |
| 6 to 18 Years | 29 (85.3%) | 8 (23.5%) |
| 19 to 25 Years | 12 (66.7%) | 2 (11.1%) |
| 25 to 34 Years | 6 (24.0%) | 15 (60.0%) |
| 35 to 44 Years | 11 (23.4%) | 19 (40.4%) |
| 45 to 54 Years | 4 (14.8%) | 14 (51.8%) |
| 55 to 64 Years | 8 (32.0%) | 22 (88.0%) |
| 65 to 74 Years | 26 (96.3%) | 13 (48.1%) |
| 75 Years and over | 12 (100.0%) | 8 (66.7%) |
| Total | 114 (51.6%) | 102 (46.2%) |
Disability Status by Sex by Age in Callaway
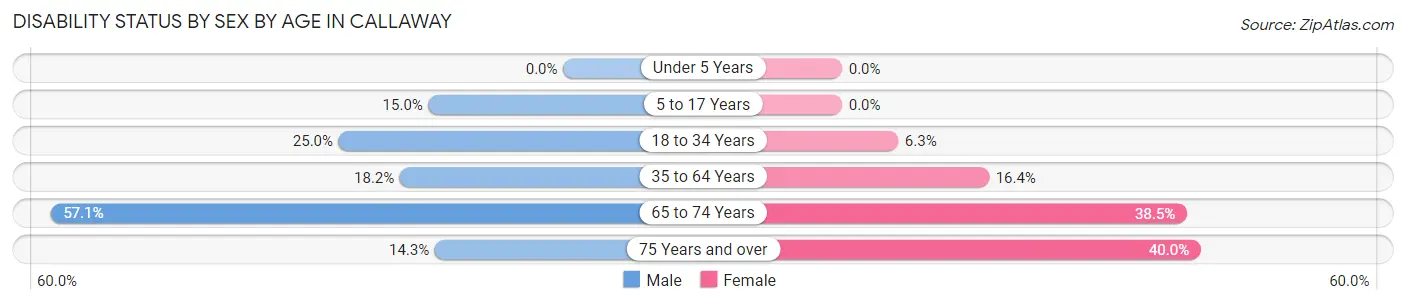
| Age Bracket | Male | Female |
| Under 5 Years | 0 (0.0%) | 0 (0.0%) |
| 5 to 17 Years | 3 (15.0%) | 0 (0.0%) |
| 18 to 34 Years | 8 (25.0%) | 1 (6.2%) |
| 35 to 64 Years | 8 (18.2%) | 9 (16.4%) |
| 65 to 74 Years | 8 (57.1%) | 5 (38.5%) |
| 75 Years and over | 1 (14.3%) | 2 (40.0%) |
Disability Class by Sex by Age in Callaway
Disability Class: Hearing Difficulty
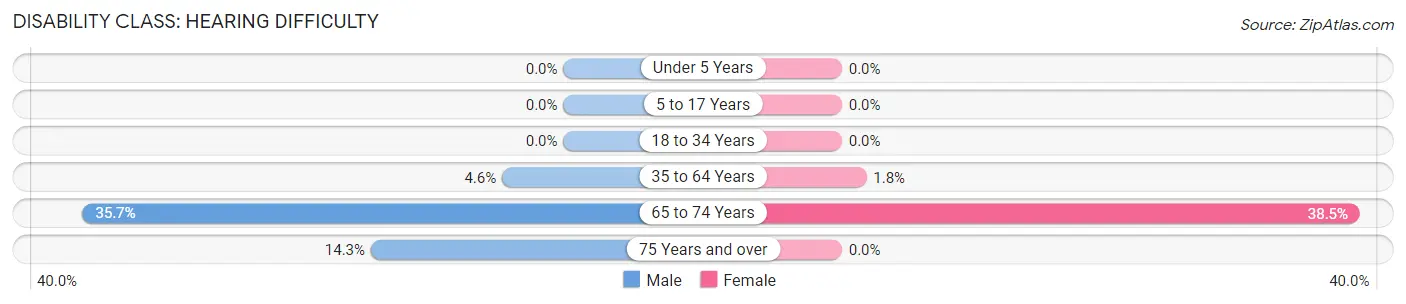
| Age Bracket | Male | Female |
| Under 5 Years | 0 (0.0%) | 0 (0.0%) |
| 5 to 17 Years | 0 (0.0%) | 0 (0.0%) |
| 18 to 34 Years | 0 (0.0%) | 0 (0.0%) |
| 35 to 64 Years | 2 (4.5%) | 1 (1.8%) |
| 65 to 74 Years | 5 (35.7%) | 5 (38.5%) |
| 75 Years and over | 1 (14.3%) | 0 (0.0%) |
Disability Class: Vision Difficulty
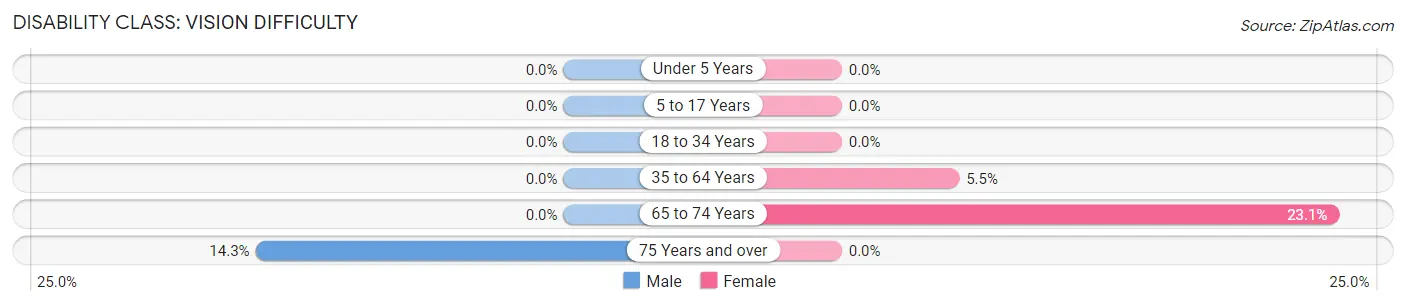
| Age Bracket | Male | Female |
| Under 5 Years | 0 (0.0%) | 0 (0.0%) |
| 5 to 17 Years | 0 (0.0%) | 0 (0.0%) |
| 18 to 34 Years | 0 (0.0%) | 0 (0.0%) |
| 35 to 64 Years | 0 (0.0%) | 3 (5.4%) |
| 65 to 74 Years | 0 (0.0%) | 3 (23.1%) |
| 75 Years and over | 1 (14.3%) | 0 (0.0%) |
Disability Class: Cognitive Difficulty
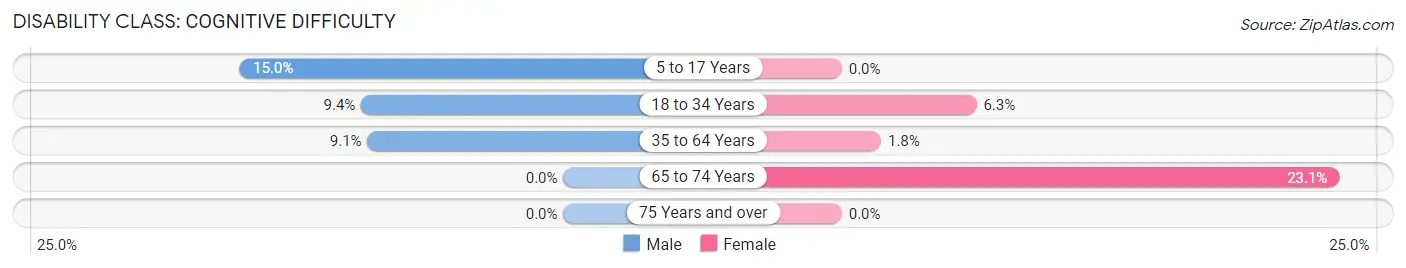
| Age Bracket | Male | Female |
| 5 to 17 Years | 3 (15.0%) | 0 (0.0%) |
| 18 to 34 Years | 3 (9.4%) | 1 (6.2%) |
| 35 to 64 Years | 4 (9.1%) | 1 (1.8%) |
| 65 to 74 Years | 0 (0.0%) | 3 (23.1%) |
| 75 Years and over | 0 (0.0%) | 0 (0.0%) |
Disability Class: Ambulatory Difficulty
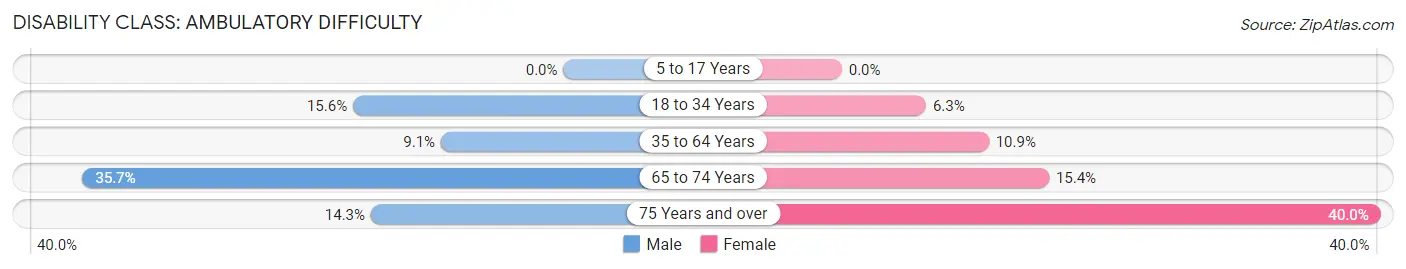
| Age Bracket | Male | Female |
| 5 to 17 Years | 0 (0.0%) | 0 (0.0%) |
| 18 to 34 Years | 5 (15.6%) | 1 (6.2%) |
| 35 to 64 Years | 4 (9.1%) | 6 (10.9%) |
| 65 to 74 Years | 5 (35.7%) | 2 (15.4%) |
| 75 Years and over | 1 (14.3%) | 2 (40.0%) |
Disability Class: Self-Care Difficulty
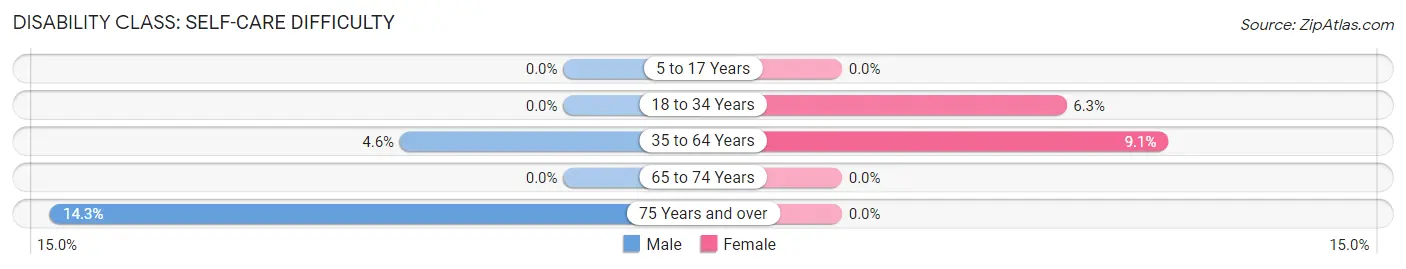
| Age Bracket | Male | Female |
| 5 to 17 Years | 0 (0.0%) | 0 (0.0%) |
| 18 to 34 Years | 0 (0.0%) | 1 (6.2%) |
| 35 to 64 Years | 2 (4.5%) | 5 (9.1%) |
| 65 to 74 Years | 0 (0.0%) | 0 (0.0%) |
| 75 Years and over | 1 (14.3%) | 0 (0.0%) |
Technology Access in Callaway
Computing Device Access in Callaway
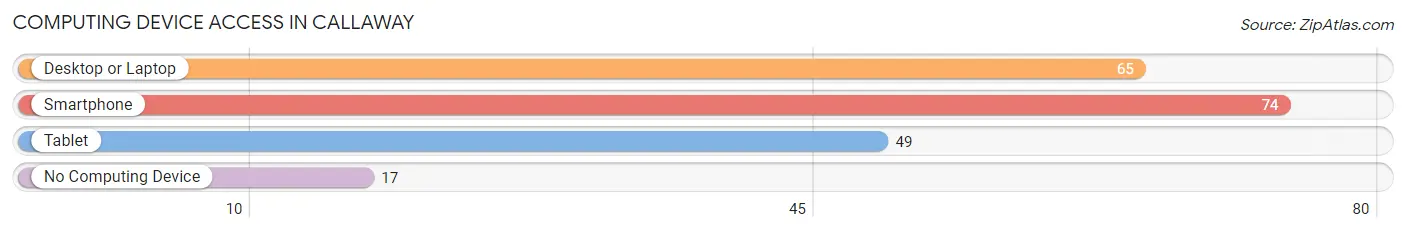
| Device Type | # Households | % Households |
| Desktop or Laptop | 65 | 67.7% |
| Smartphone | 74 | 77.1% |
| Tablet | 49 | 51.0% |
| No Computing Device | 17 | 17.7% |
| Total | 96 | 100.0% |
Internet Access in Callaway
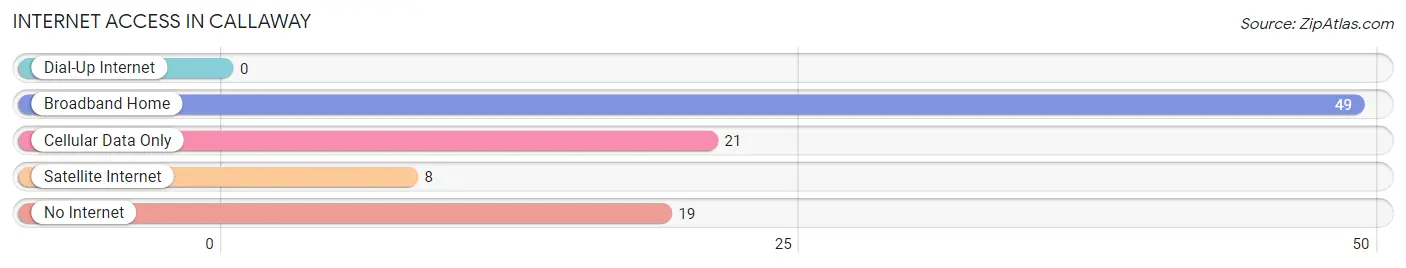
| Internet Type | # Households | % Households |
| Dial-Up Internet | 0 | 0.0% |
| Broadband Home | 49 | 51.0% |
| Cellular Data Only | 21 | 21.9% |
| Satellite Internet | 8 | 8.3% |
| No Internet | 19 | 19.8% |
| Total | 96 | 100.0% |
Callaway Summary
Callaway, Minnesota is a small city located in Becker County, in the northwestern part of the state. It is situated on the banks of the Mississippi River, and is part of the larger Fargo-Moorhead metropolitan area. The city has a population of just over 1,000 people, and is known for its rural charm and small-town atmosphere.
History
Callaway was founded in 1881 by a group of settlers from Wisconsin. The city was named after a local Native American chief, Chief Callaway. The settlers were attracted to the area due to its fertile soil and abundant natural resources. The city quickly grew, and by the early 1900s, it had become a thriving agricultural center.
In the early 20th century, the city experienced a period of growth and prosperity. The population increased, and new businesses and industries were established. The city was also home to a number of churches, schools, and other civic organizations.
In the 1950s, the city began to decline. Many of the businesses and industries closed, and the population began to decline. In the late 1970s, the city was declared a “blighted area” by the state of Minnesota. This designation allowed the city to receive state and federal funds to help revitalize the area.
Geography
Callaway is located in the northwestern part of Minnesota, in Becker County. It is situated on the banks of the Mississippi River, and is part of the larger Fargo-Moorhead metropolitan area. The city is located approximately 25 miles north of Detroit Lakes, and about 50 miles south of Grand Forks.
The city has a total area of 1.2 square miles, all of which is land. The terrain is mostly flat, with some rolling hills. The climate is humid continental, with cold winters and warm summers.
Economy
The economy of Callaway is largely based on agriculture. The city is home to several farms, and the surrounding area is known for its production of corn, soybeans, and other crops. The city is also home to a number of small businesses, including restaurants, retail stores, and service providers.
The city is also home to a number of manufacturing companies, including a paper mill and a plastics factory. The city is also home to a number of government offices, including the Becker County Courthouse and the Becker County Sheriff’s Office.
Demographics
As of the 2010 census, the population of Callaway was 1,072. The racial makeup of the city was 97.2% White, 0.7% African American, 0.3% Native American, 0.2% Asian, 0.1% Pacific Islander, 0.7% from other races, and 0.9% from two or more races. Hispanic or Latino of any race were 1.3% of the population.
The median income for a household in the city was $37,500, and the median income for a family was $45,000. The per capita income for the city was $19,845. About 11.2% of families and 14.2% of the population were below the poverty line, including 18.2% of those under age 18 and 8.3% of those age 65 or over.
Callaway is a small city with a rich history and a unique culture. It is home to a diverse population, and is known for its rural charm and small-town atmosphere. The city has a strong agricultural base, and is home to a number of businesses and industries. The city is also home to a number of government offices, and is part of the larger Fargo-Moorhead metropolitan area.
Common Questions
What is Per Capita Income in Callaway?
Per Capita income in Callaway is $27,119.
What is the Median Family Income in Callaway?
Median Family Income in Callaway is $66,250.
What is the Median Household income in Callaway?
Median Household Income in Callaway is $50,000.
What is Income or Wage Gap in Callaway?
Income or Wage Gap in Callaway is 29.1%.
Women in Callaway earn 70.9 cents for every dollar earned by a man.
What is Inequality or Gini Index in Callaway?
Inequality or Gini Index in Callaway is 0.33.
What is the Total Population of Callaway?
Total Population of Callaway is 221.
What is the Total Male Population of Callaway?
Total Male Population of Callaway is 117.
What is the Total Female Population of Callaway?
Total Female Population of Callaway is 104.
What is the Ratio of Males per 100 Females in Callaway?
There are 112.50 Males per 100 Females in Callaway.
What is the Ratio of Females per 100 Males in Callaway?
There are 88.89 Females per 100 Males in Callaway.
What is the Median Population Age in Callaway?
Median Population Age in Callaway is 39.9 Years.
What is the Average Family Size in Callaway
Average Family Size in Callaway is 2.7 People.
What is the Average Household Size in Callaway
Average Household Size in Callaway is 2.3 People.
How Large is the Labor Force in Callaway?
There are 135 People in the Labor Forcein in Callaway.
What is the Percentage of People in the Labor Force in Callaway?
71.4% of People are in the Labor Force in Callaway.
What is the Unemployment Rate in Callaway?
Unemployment Rate in Callaway is 6.7%.