Clearwater County, MN Map & Demographics
Clearwater County Overview
$31,879
PER CAPITA INCOME
$79,342
AVG FAMILY INCOME
$62,723
AVG HOUSEHOLD INCOME
34.1%
WAGE / INCOME GAP [ % ]
65.9¢/ $1
WAGE / INCOME GAP [ $ ]
$8,107
FAMILY INCOME DEFICIT
0.45
INEQUALITY / GINI INDEX
8,541
TOTAL POPULATION
4,314
MALE POPULATION
4,227
FEMALE POPULATION
102.06
MALES / 100 FEMALES
97.98
FEMALES / 100 MALES
41.6
MEDIAN AGE
3.2
AVG FAMILY SIZE
2.6
AVG HOUSEHOLD SIZE
3,927
LABOR FORCE [ PEOPLE ]
59.1%
PERCENT IN LABOR FORCE
7.6%
UNEMPLOYMENT RATE
Clearwater County Area Codes
Income in Clearwater County
Income Overview in Clearwater County
Per Capita Income in Clearwater County is $31,879, while median incomes of families and households are $79,342 and $62,723 respectively.
| Characteristic | Number | Measure |
| Per Capita Income | 8,541 | $31,879 |
| Median Family Income | 2,130 | $79,342 |
| Mean Family Income | 2,130 | $92,386 |
| Median Household Income | 3,196 | $62,723 |
| Mean Household Income | 3,196 | $81,621 |
| Income Deficit | 2,130 | $8,107 |
| Wage / Income Gap (%) | 8,541 | 34.09% |
| Wage / Income Gap ($) | 8,541 | 65.91¢ per $1 |
| Gini / Inequality Index | 8,541 | 0.45 |
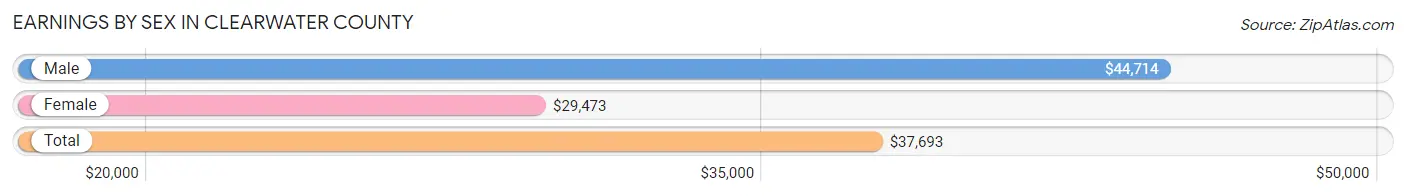
Earnings by Sex in Clearwater County
Average Earnings in Clearwater County are $37,693, $44,714 for men and $29,473 for women, a difference of 34.1%.
| Sex | Number | Average Earnings |
| Male | 2,200 (52.8%) | $44,714 |
| Female | 1,965 (47.2%) | $29,473 |
| Total | 4,165 (100.0%) | $37,693 |
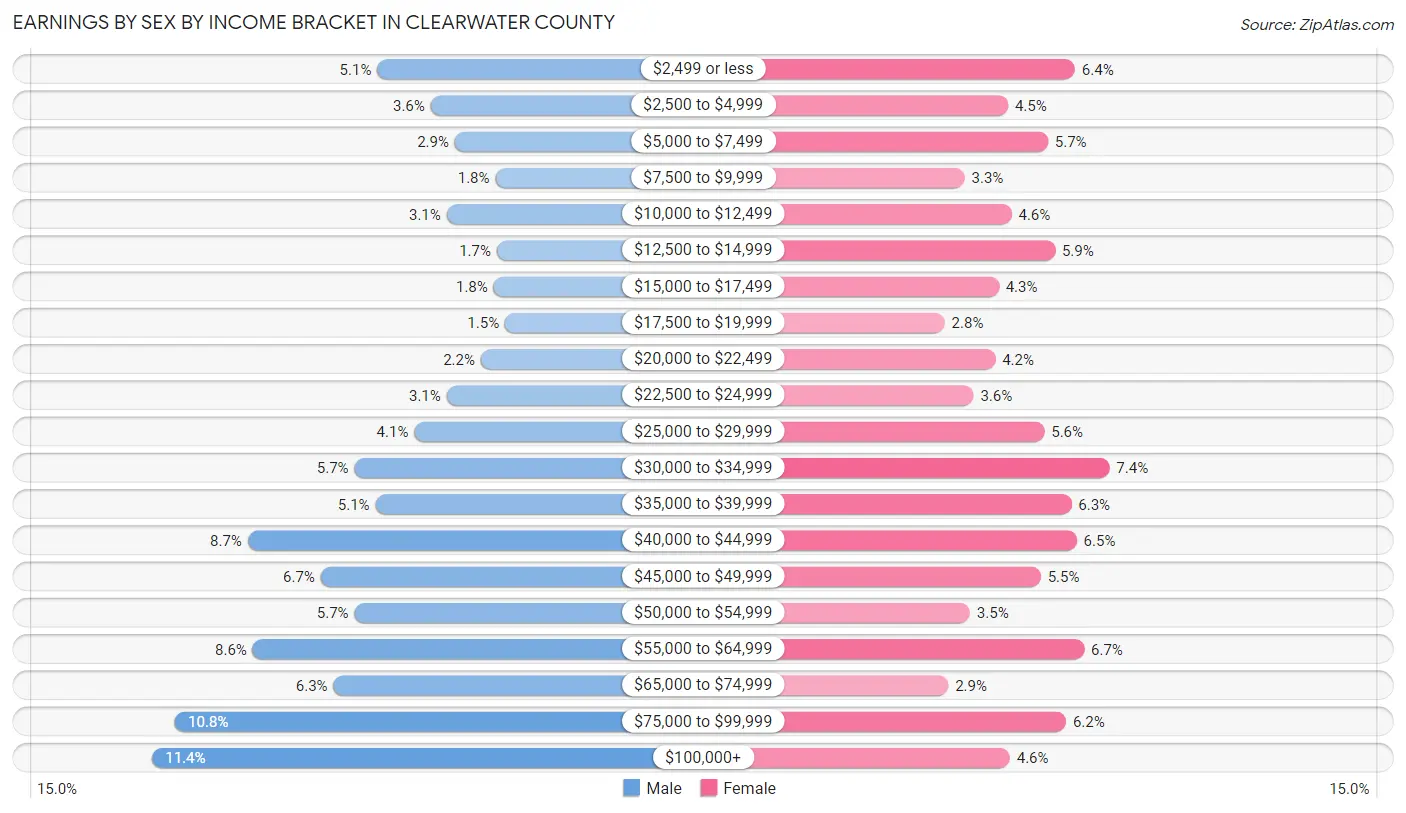
Earnings by Sex by Income Bracket in Clearwater County
The most common earnings brackets in Clearwater County are $100,000+ for men (251 | 11.4%) and $30,000 to $34,999 for women (145 | 7.4%).
| Income | Male | Female |
| $2,499 or less | 112 (5.1%) | 126 (6.4%) |
| $2,500 to $4,999 | 79 (3.6%) | 89 (4.5%) |
| $5,000 to $7,499 | 64 (2.9%) | 111 (5.7%) |
| $7,500 to $9,999 | 39 (1.8%) | 65 (3.3%) |
| $10,000 to $12,499 | 69 (3.1%) | 91 (4.6%) |
| $12,500 to $14,999 | 38 (1.7%) | 115 (5.9%) |
| $15,000 to $17,499 | 40 (1.8%) | 84 (4.3%) |
| $17,500 to $19,999 | 33 (1.5%) | 54 (2.8%) |
| $20,000 to $22,499 | 48 (2.2%) | 82 (4.2%) |
| $22,500 to $24,999 | 69 (3.1%) | 70 (3.6%) |
| $25,000 to $29,999 | 89 (4.1%) | 109 (5.6%) |
| $30,000 to $34,999 | 126 (5.7%) | 145 (7.4%) |
| $35,000 to $39,999 | 113 (5.1%) | 124 (6.3%) |
| $40,000 to $44,999 | 192 (8.7%) | 127 (6.5%) |
| $45,000 to $49,999 | 147 (6.7%) | 107 (5.4%) |
| $50,000 to $54,999 | 126 (5.7%) | 68 (3.5%) |
| $55,000 to $64,999 | 189 (8.6%) | 131 (6.7%) |
| $65,000 to $74,999 | 139 (6.3%) | 56 (2.9%) |
| $75,000 to $99,999 | 237 (10.8%) | 121 (6.2%) |
| $100,000+ | 251 (11.4%) | 90 (4.6%) |
| Total | 2,200 (100.0%) | 1,965 (100.0%) |
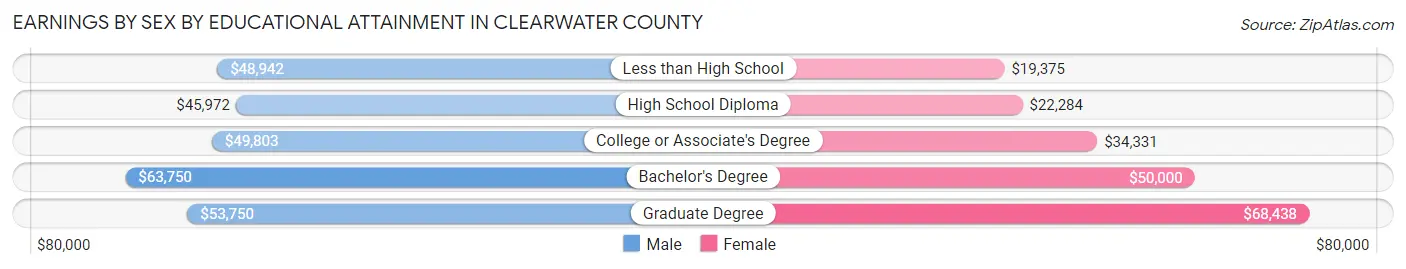
Earnings by Sex by Educational Attainment in Clearwater County
Average earnings in Clearwater County are $49,423 for men and $34,116 for women, a difference of 31.0%. Men with an educational attainment of bachelor's degree enjoy the highest average annual earnings of $63,750, while those with high school diploma education earn the least with $45,972. Women with an educational attainment of graduate degree earn the most with the average annual earnings of $68,438, while those with less than high school education have the smallest earnings of $19,375.
| Educational Attainment | Male Income | Female Income |
| Less than High School | $48,942 | $19,375 |
| High School Diploma | $45,972 | $22,284 |
| College or Associate's Degree | $49,803 | $34,331 |
| Bachelor's Degree | $63,750 | $50,000 |
| Graduate Degree | $53,750 | $68,438 |
| Total | $49,423 | $34,116 |
Family Income in Clearwater County
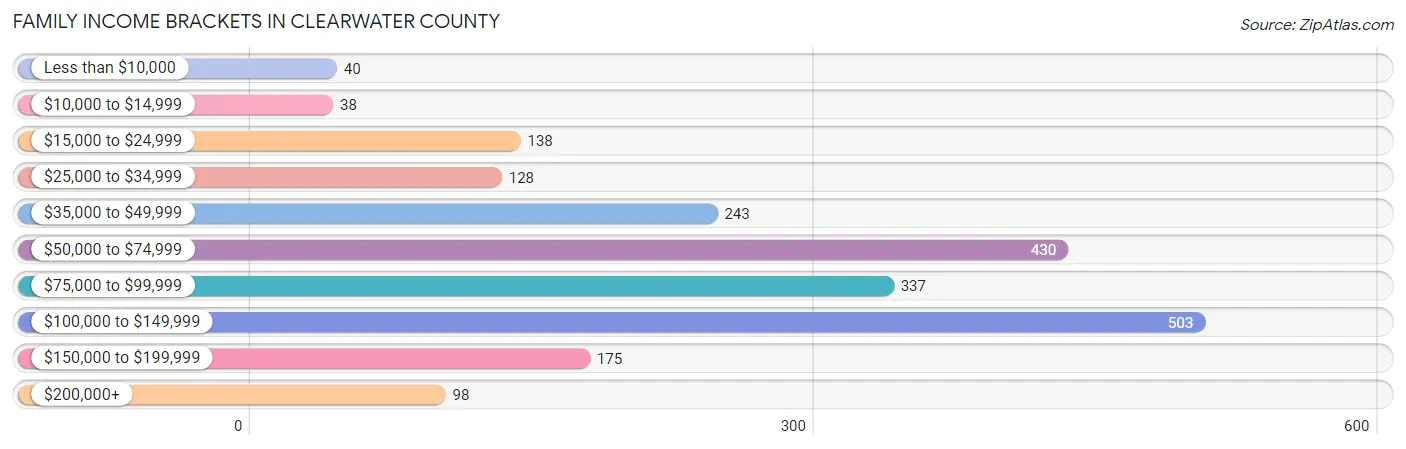
Family Income Brackets in Clearwater County
According to the Clearwater County family income data, there are 503 families falling into the $100,000 to $149,999 income range, which is the most common income bracket and makes up 23.6% of all families. Conversely, the $10,000 to $14,999 income bracket is the least frequent group with only 38 families (1.8%) belonging to this category.
| Income Bracket | # Families | % Families |
| Less than $10,000 | 40 | 1.9% |
| $10,000 to $14,999 | 38 | 1.8% |
| $15,000 to $24,999 | 138 | 6.5% |
| $25,000 to $34,999 | 128 | 6.0% |
| $35,000 to $49,999 | 243 | 11.4% |
| $50,000 to $74,999 | 430 | 20.2% |
| $75,000 to $99,999 | 337 | 15.8% |
| $100,000 to $149,999 | 503 | 23.6% |
| $150,000 to $199,999 | 175 | 8.2% |
| $200,000+ | 98 | 4.6% |
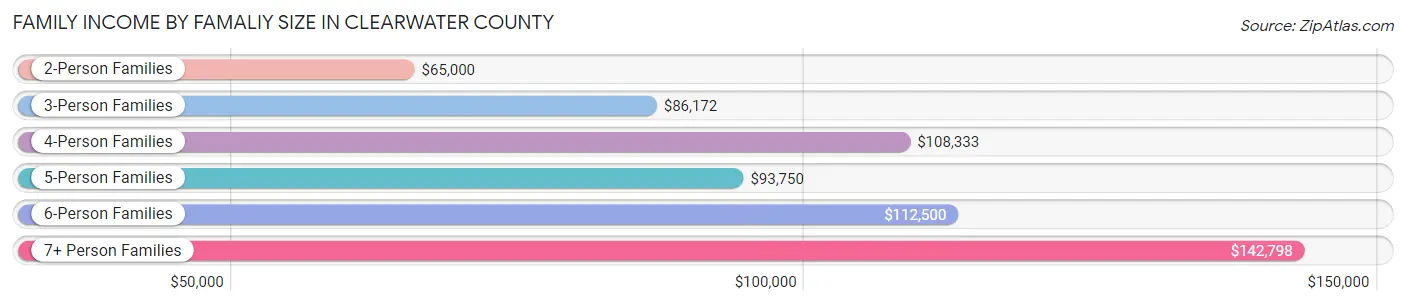
Family Income by Famaliy Size in Clearwater County
7+ person families (63 | 3.0%) account for the highest median family income in Clearwater County with $142,798 per family, while 2-person families (1,112 | 52.2%) have the highest median income of $32,500 per family member.
| Income Bracket | # Families | Median Income |
| 2-Person Families | 1,112 (52.2%) | $65,000 |
| 3-Person Families | 399 (18.7%) | $86,172 |
| 4-Person Families | 300 (14.1%) | $108,333 |
| 5-Person Families | 168 (7.9%) | $93,750 |
| 6-Person Families | 88 (4.1%) | $112,500 |
| 7+ Person Families | 63 (3.0%) | $142,798 |
| Total | 2,130 (100.0%) | $79,342 |
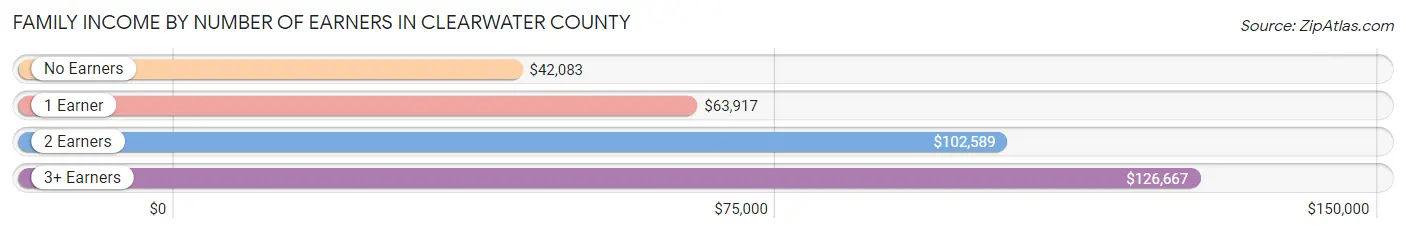
Family Income by Number of Earners in Clearwater County
The median family income in Clearwater County is $79,342, with families comprising 3+ earners (260) having the highest median family income of $126,667, while families with no earners (408) have the lowest median family income of $42,083, accounting for 12.2% and 19.2% of families, respectively.
| Number of Earners | # Families | Median Income |
| No Earners | 408 (19.2%) | $42,083 |
| 1 Earner | 665 (31.2%) | $63,917 |
| 2 Earners | 797 (37.4%) | $102,589 |
| 3+ Earners | 260 (12.2%) | $126,667 |
| Total | 2,130 (100.0%) | $79,342 |
Household Income in Clearwater County
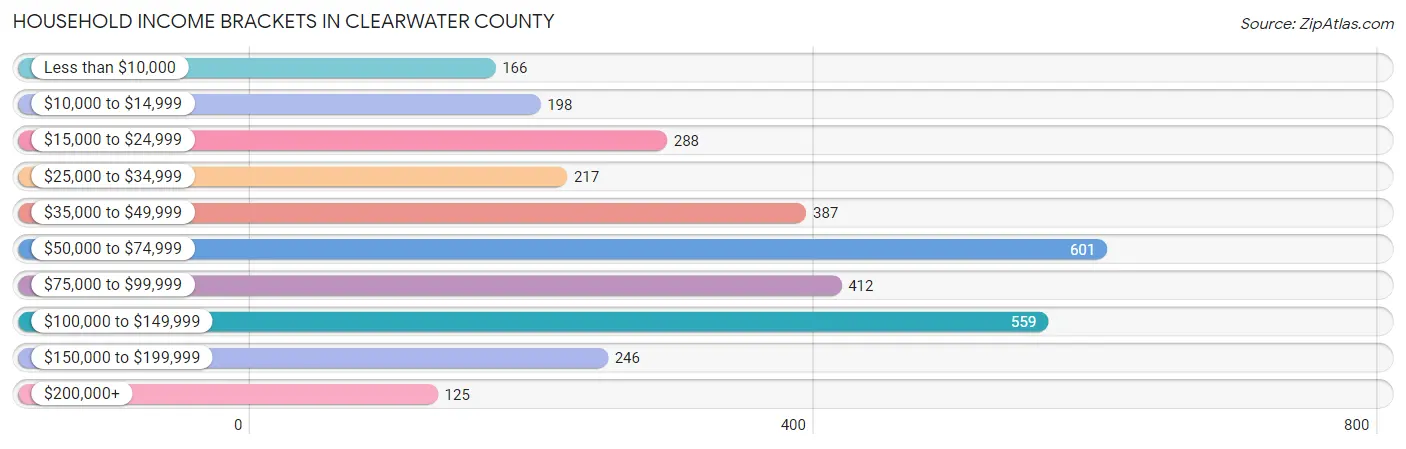
Household Income Brackets in Clearwater County
With 601 households falling in the category, the $50,000 to $74,999 income range is the most frequent in Clearwater County, accounting for 18.8% of all households. In contrast, only 125 households (3.9%) fall into the $200,000+ income bracket, making it the least populous group.
| Income Bracket | # Households | % Households |
| Less than $10,000 | 166 | 5.2% |
| $10,000 to $14,999 | 198 | 6.2% |
| $15,000 to $24,999 | 288 | 9.0% |
| $25,000 to $34,999 | 217 | 6.8% |
| $35,000 to $49,999 | 387 | 12.1% |
| $50,000 to $74,999 | 601 | 18.8% |
| $75,000 to $99,999 | 412 | 12.9% |
| $100,000 to $149,999 | 559 | 17.5% |
| $150,000 to $199,999 | 246 | 7.7% |
| $200,000+ | 125 | 3.9% |
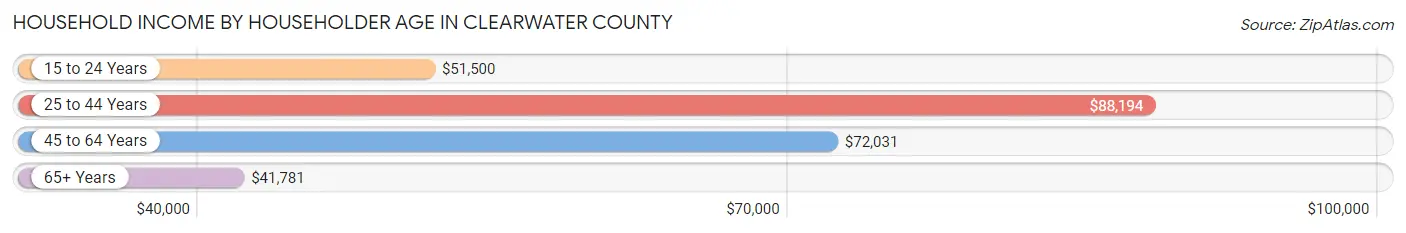
Household Income by Householder Age in Clearwater County
The median household income in Clearwater County is $62,723, with the highest median household income of $88,194 found in the 25 to 44 years age bracket for the primary householder. A total of 847 households (26.5%) fall into this category. Meanwhile, the 65+ years age bracket for the primary householder has the lowest median household income of $41,781, with 1,097 households (34.3%) in this group.
| Income Bracket | # Households | Median Income |
| 15 to 24 Years | 102 (3.2%) | $51,500 |
| 25 to 44 Years | 847 (26.5%) | $88,194 |
| 45 to 64 Years | 1,150 (36.0%) | $72,031 |
| 65+ Years | 1,097 (34.3%) | $41,781 |
| Total | 3,196 (100.0%) | $62,723 |
Poverty in Clearwater County
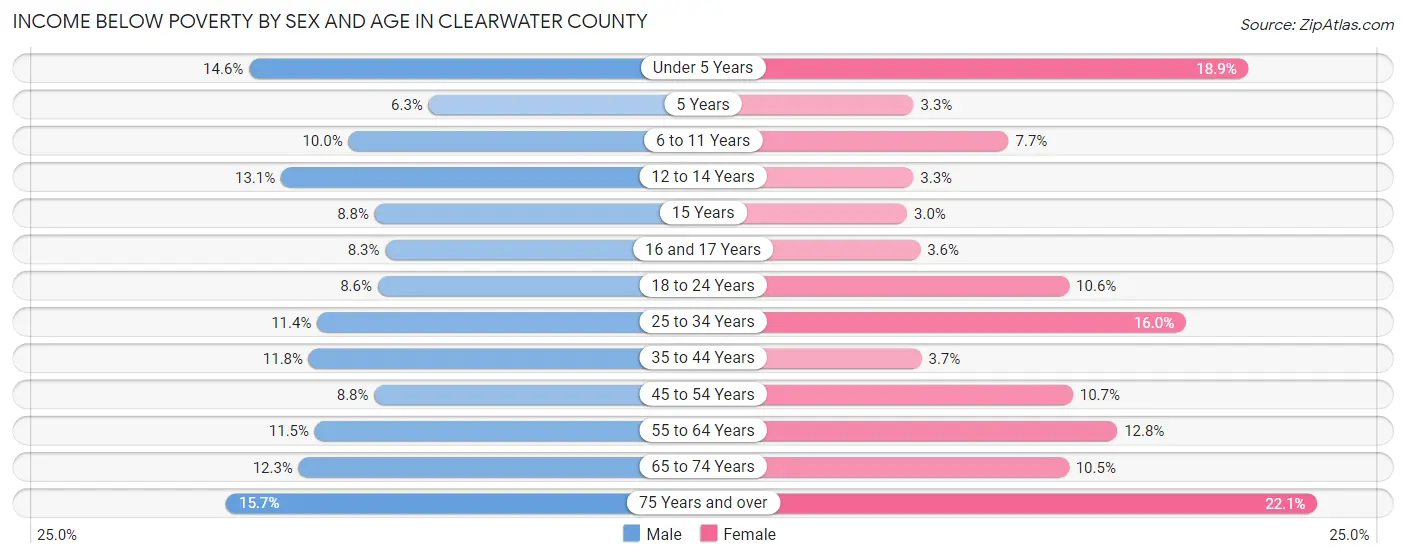
Income Below Poverty by Sex and Age in Clearwater County
With 11.3% poverty level for males and 11.2% for females among the residents of Clearwater County, 75 year old and over males and 75 year old and over females are the most vulnerable to poverty, with 49 males (15.7%) and 83 females (22.1%) in their respective age groups living below the poverty level.
| Age Bracket | Male | Female |
| Under 5 Years | 35 (14.6%) | 50 (18.9%) |
| 5 Years | 4 (6.2%) | 3 (3.3%) |
| 6 to 11 Years | 36 (10.0%) | 25 (7.7%) |
| 12 to 14 Years | 22 (13.1%) | 7 (3.3%) |
| 15 Years | 7 (8.7%) | 2 (3.0%) |
| 16 and 17 Years | 10 (8.3%) | 4 (3.6%) |
| 18 to 24 Years | 29 (8.6%) | 29 (10.5%) |
| 25 to 34 Years | 50 (11.4%) | 65 (16.0%) |
| 35 to 44 Years | 64 (11.8%) | 17 (3.7%) |
| 45 to 54 Years | 40 (8.8%) | 49 (10.7%) |
| 55 to 64 Years | 70 (11.5%) | 80 (12.8%) |
| 65 to 74 Years | 63 (12.3%) | 50 (10.5%) |
| 75 Years and over | 49 (15.7%) | 83 (22.1%) |
| Total | 479 (11.3%) | 464 (11.2%) |
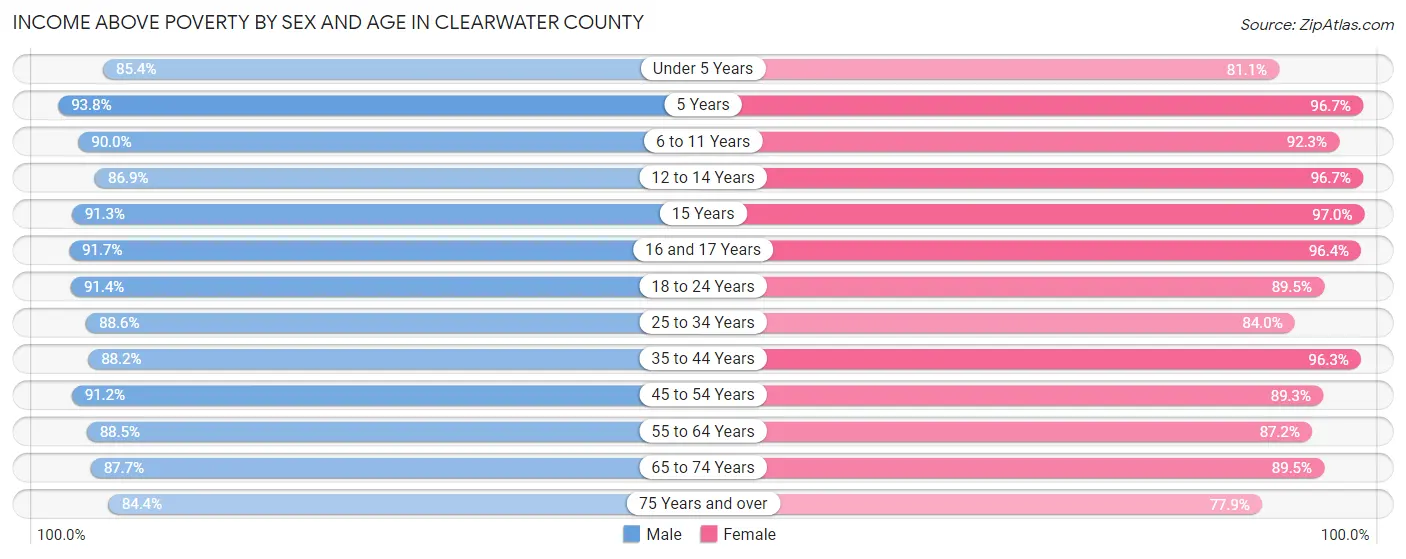
Income Above Poverty by Sex and Age in Clearwater County
According to the poverty statistics in Clearwater County, males aged 5 years and females aged 15 years are the age groups that are most secure financially, with 93.8% of males and 97.0% of females in these age groups living above the poverty line.
| Age Bracket | Male | Female |
| Under 5 Years | 205 (85.4%) | 215 (81.1%) |
| 5 Years | 60 (93.8%) | 87 (96.7%) |
| 6 to 11 Years | 325 (90.0%) | 298 (92.3%) |
| 12 to 14 Years | 146 (86.9%) | 204 (96.7%) |
| 15 Years | 73 (91.2%) | 64 (97.0%) |
| 16 and 17 Years | 111 (91.7%) | 106 (96.4%) |
| 18 to 24 Years | 308 (91.4%) | 246 (89.4%) |
| 25 to 34 Years | 388 (88.6%) | 342 (84.0%) |
| 35 to 44 Years | 478 (88.2%) | 443 (96.3%) |
| 45 to 54 Years | 416 (91.2%) | 408 (89.3%) |
| 55 to 64 Years | 537 (88.5%) | 546 (87.2%) |
| 65 to 74 Years | 450 (87.7%) | 425 (89.5%) |
| 75 Years and over | 264 (84.4%) | 293 (77.9%) |
| Total | 3,761 (88.7%) | 3,677 (88.8%) |
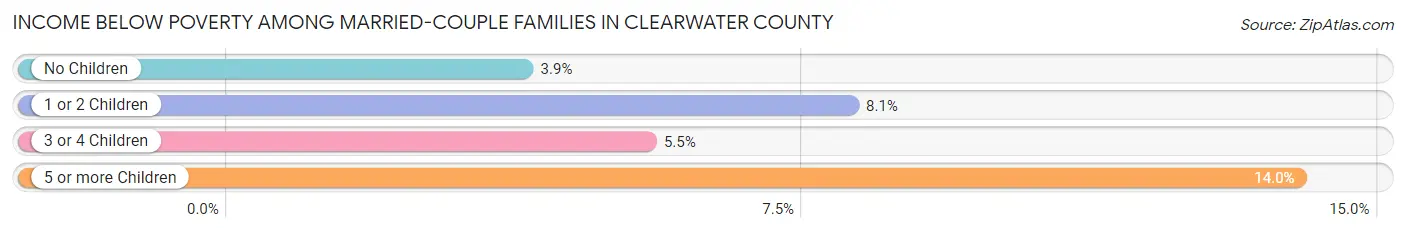
Income Below Poverty Among Married-Couple Families in Clearwater County
The poverty statistics for married-couple families in Clearwater County show that 5.2% or 88 of the total 1,677 families live below the poverty line. Families with 5 or more children have the highest poverty rate of 14.0%, comprising of 6 families. On the other hand, families with no children have the lowest poverty rate of 3.9%, which includes 41 families.
| Children | Above Poverty | Below Poverty |
| No Children | 1,022 (96.1%) | 41 (3.9%) |
| 1 or 2 Children | 340 (91.9%) | 30 (8.1%) |
| 3 or 4 Children | 190 (94.5%) | 11 (5.5%) |
| 5 or more Children | 37 (86.1%) | 6 (14.0%) |
| Total | 1,589 (94.8%) | 88 (5.2%) |
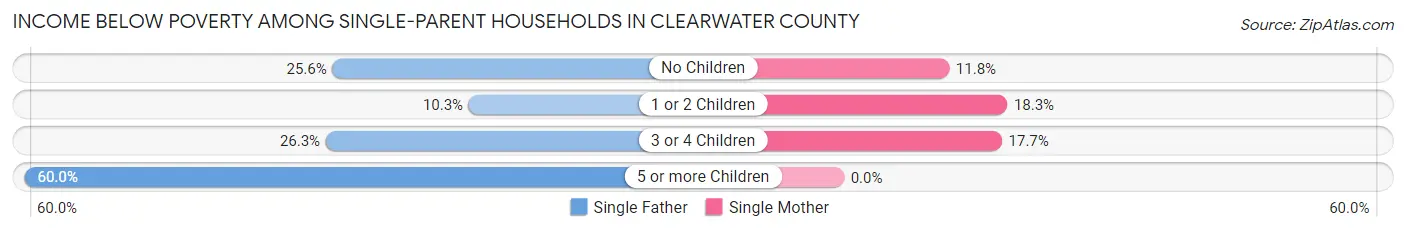
Income Below Poverty Among Single-Parent Households in Clearwater County
According to the poverty data in Clearwater County, 19.8% or 39 single-father households and 15.6% or 40 single-mother households are living below the poverty line. Among single-father households, those with 5 or more children have the highest poverty rate, with 3 households (60.0%) experiencing poverty. Likewise, among single-mother households, those with 1 or 2 children have the highest poverty rate, with 25 households (18.2%) falling below the poverty line.
| Children | Single Father | Single Mother |
| No Children | 22 (25.6%) | 12 (11.8%) |
| 1 or 2 Children | 9 (10.3%) | 25 (18.2%) |
| 3 or 4 Children | 5 (26.3%) | 3 (17.6%) |
| 5 or more Children | 3 (60.0%) | 0 (0.0%) |
| Total | 39 (19.8%) | 40 (15.6%) |
Income Below Poverty Among Married-Couple vs Single-Parent Households in Clearwater County
The poverty data for Clearwater County shows that 88 of the married-couple family households (5.2%) and 79 of the single-parent households (17.4%) are living below the poverty level. Within the married-couple family households, those with 5 or more children have the highest poverty rate, with 6 households (14.0%) falling below the poverty line. Among the single-parent households, those with 5 or more children have the highest poverty rate, with 3 household (60.0%) living below poverty.
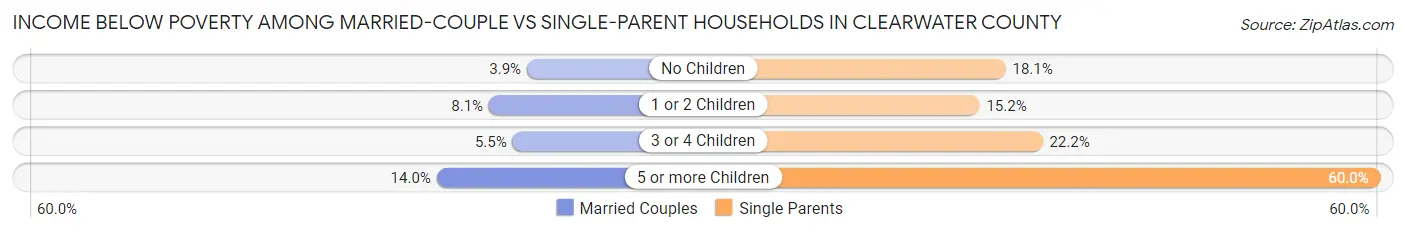
| Children | Married-Couple Families | Single-Parent Households |
| No Children | 41 (3.9%) | 34 (18.1%) |
| 1 or 2 Children | 30 (8.1%) | 34 (15.2%) |
| 3 or 4 Children | 11 (5.5%) | 8 (22.2%) |
| 5 or more Children | 6 (14.0%) | 3 (60.0%) |
| Total | 88 (5.2%) | 79 (17.4%) |
Race in Clearwater County
The most populous races in Clearwater County are White / Caucasian (7,181 | 84.1%), Two or more Races (681 | 8.0%), and Native / Alaskan (570 | 6.7%).
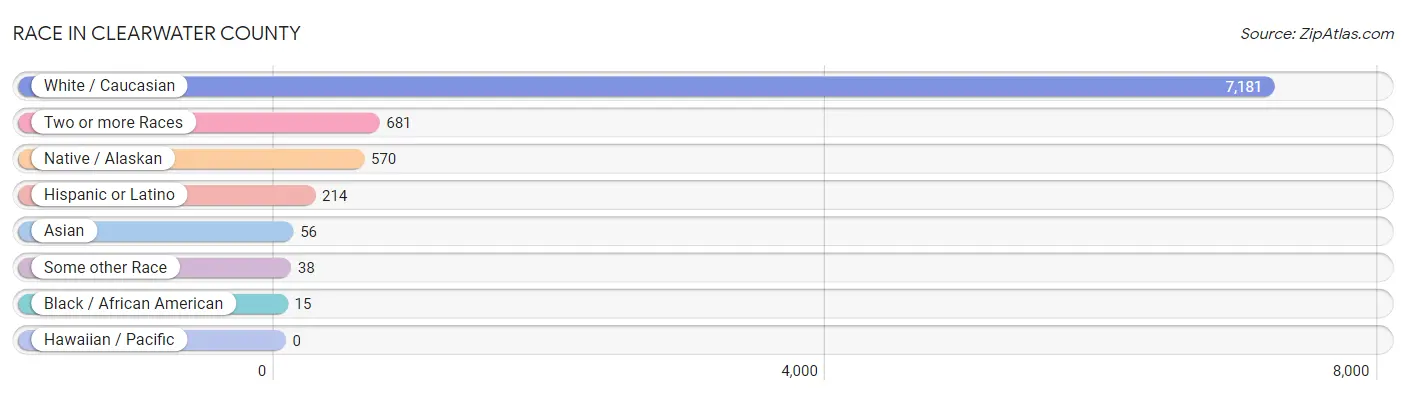
| Race | # Population | % Population |
| Asian | 56 | 0.7% |
| Black / African American | 15 | 0.2% |
| Hawaiian / Pacific | 0 | 0.0% |
| Hispanic or Latino | 214 | 2.5% |
| Native / Alaskan | 570 | 6.7% |
| White / Caucasian | 7,181 | 84.1% |
| Two or more Races | 681 | 8.0% |
| Some other Race | 38 | 0.4% |
| Total | 8,541 | 100.0% |
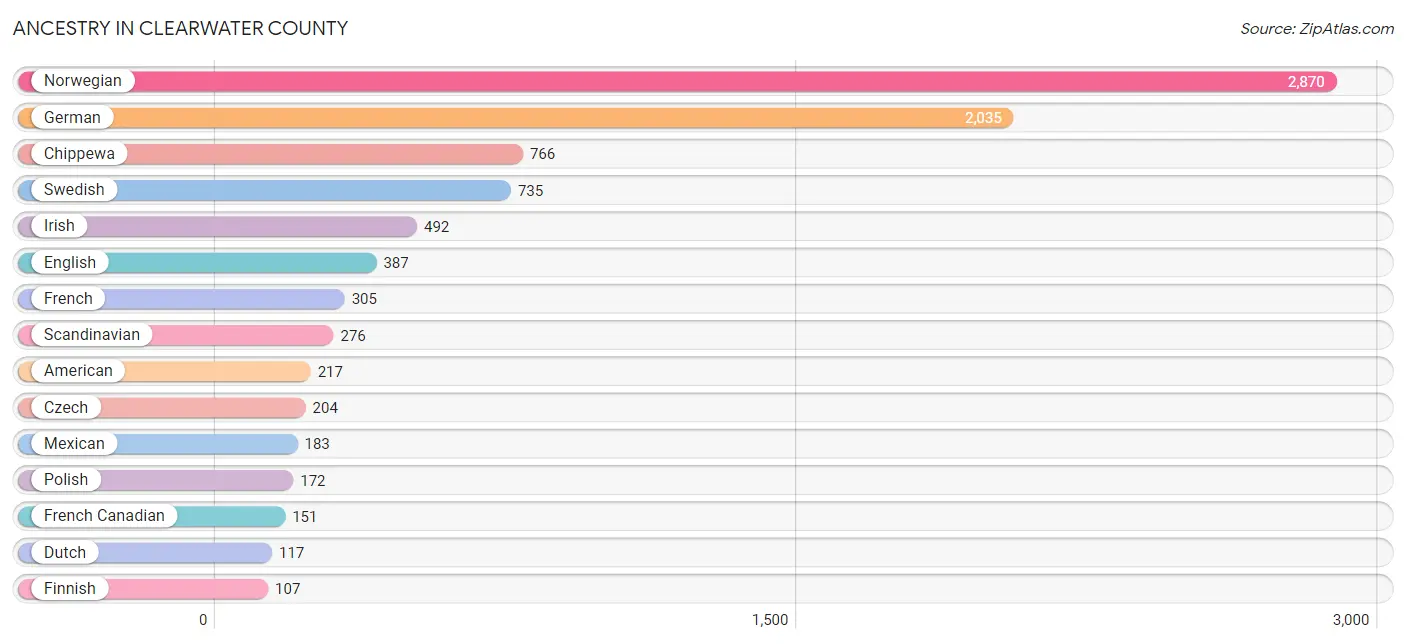
Ancestry in Clearwater County
The most populous ancestries reported in Clearwater County are Norwegian (2,870 | 33.6%), German (2,035 | 23.8%), Chippewa (766 | 9.0%), Swedish (735 | 8.6%), and Irish (492 | 5.8%), together accounting for 80.8% of all Clearwater County residents.
| Ancestry | # Population | % Population |
| American | 217 | 2.5% |
| Arab | 31 | 0.4% |
| Austrian | 3 | 0.0% |
| Belgian | 5 | 0.1% |
| Bhutanese | 33 | 0.4% |
| Blackfeet | 11 | 0.1% |
| Brazilian | 3 | 0.0% |
| British | 22 | 0.3% |
| Burmese | 21 | 0.3% |
| Canadian | 1 | 0.0% |
| Celtic | 2 | 0.0% |
| Central American | 1 | 0.0% |
| Cherokee | 41 | 0.5% |
| Chippewa | 766 | 9.0% |
| Choctaw | 5 | 0.1% |
| Creek | 1 | 0.0% |
| Croatian | 7 | 0.1% |
| Cuban | 12 | 0.1% |
| Czech | 204 | 2.4% |
| Czechoslovakian | 37 | 0.4% |
| Danish | 93 | 1.1% |
| Dutch | 117 | 1.4% |
| Eastern European | 2 | 0.0% |
| English | 387 | 4.5% |
| European | 61 | 0.7% |
| Finnish | 107 | 1.3% |
| French | 305 | 3.6% |
| French American Indian | 17 | 0.2% |
| French Canadian | 151 | 1.8% |
| German | 2,035 | 23.8% |
| Greek | 5 | 0.1% |
| Guatemalan | 1 | 0.0% |
| Hungarian | 2 | 0.0% |
| Indian (Asian) | 26 | 0.3% |
| Irish | 492 | 5.8% |
| Iroquois | 1 | 0.0% |
| Italian | 24 | 0.3% |
| Korean | 26 | 0.3% |
| Lebanese | 8 | 0.1% |
| Lithuanian | 12 | 0.1% |
| Luxembourger | 3 | 0.0% |
| Mexican | 183 | 2.1% |
| Nigerian | 11 | 0.1% |
| Northern European | 28 | 0.3% |
| Norwegian | 2,870 | 33.6% |
| Pakistani | 9 | 0.1% |
| Pennsylvania German | 33 | 0.4% |
| Polish | 172 | 2.0% |
| Portuguese | 4 | 0.1% |
| Potawatomi | 17 | 0.2% |
| Puerto Rican | 3 | 0.0% |
| Romanian | 5 | 0.1% |
| Russian | 17 | 0.2% |
| Scandinavian | 276 | 3.2% |
| Scotch-Irish | 60 | 0.7% |
| Scottish | 80 | 0.9% |
| Serbian | 17 | 0.2% |
| Sioux | 61 | 0.7% |
| Slavic | 50 | 0.6% |
| Slovak | 4 | 0.1% |
| Slovene | 9 | 0.1% |
| Spaniard | 2 | 0.0% |
| Spanish | 7 | 0.1% |
| Subsaharan African | 11 | 0.1% |
| Swedish | 735 | 8.6% |
| Swiss | 24 | 0.3% |
| Thai | 4 | 0.1% |
| Tlingit-Haida | 2 | 0.0% |
| Ukrainian | 18 | 0.2% |
| Welsh | 17 | 0.2% | View All 70 Rows |
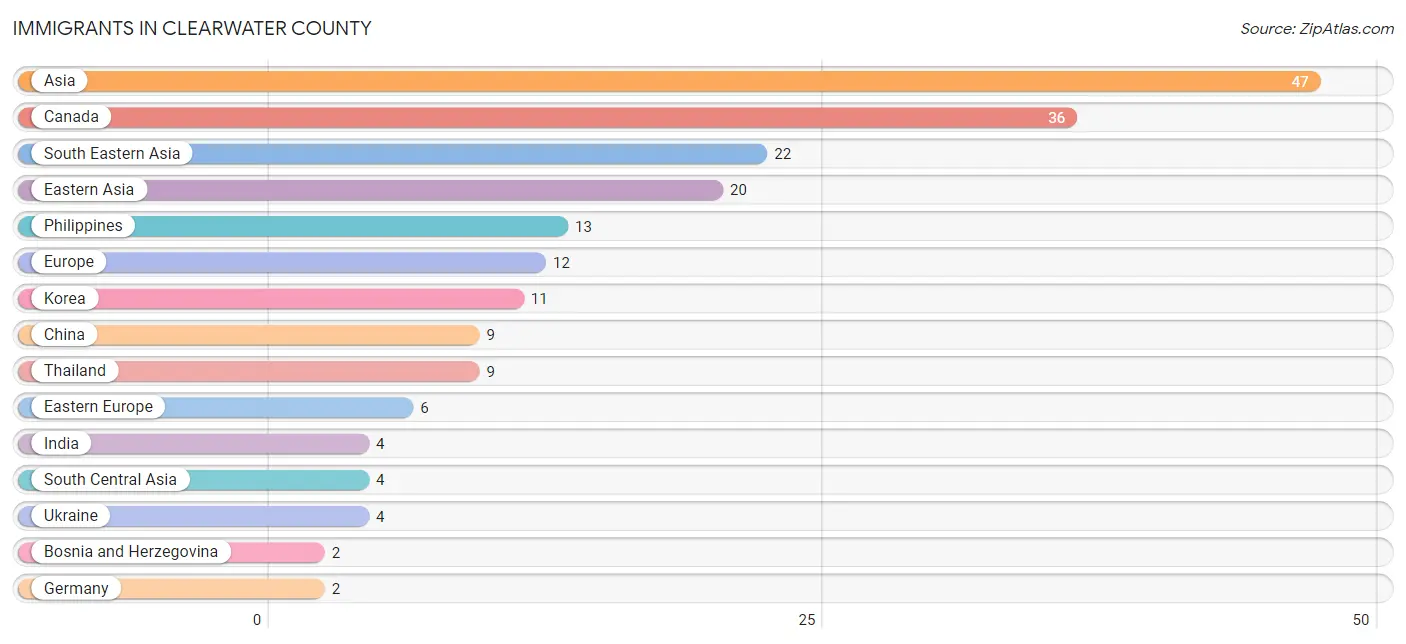
Immigrants in Clearwater County
The most numerous immigrant groups reported in Clearwater County came from Asia (47 | 0.5%), Canada (36 | 0.4%), South Eastern Asia (22 | 0.3%), Eastern Asia (20 | 0.2%), and Philippines (13 | 0.2%), together accounting for 1.6% of all Clearwater County residents.
| Immigration Origin | # Population | % Population |
| Asia | 47 | 0.5% |
| Australia | 1 | 0.0% |
| Bosnia and Herzegovina | 2 | 0.0% |
| Canada | 36 | 0.4% |
| Central America | 1 | 0.0% |
| China | 9 | 0.1% |
| Eastern Asia | 20 | 0.2% |
| Eastern Europe | 6 | 0.1% |
| England | 1 | 0.0% |
| Europe | 12 | 0.1% |
| Germany | 2 | 0.0% |
| Guatemala | 1 | 0.0% |
| India | 4 | 0.1% |
| Korea | 11 | 0.1% |
| Latin America | 1 | 0.0% |
| Northern Europe | 2 | 0.0% |
| Norway | 1 | 0.0% |
| Oceania | 1 | 0.0% |
| Philippines | 13 | 0.2% |
| South Central Asia | 4 | 0.1% |
| South Eastern Asia | 22 | 0.3% |
| Southern Europe | 2 | 0.0% |
| Spain | 2 | 0.0% |
| Thailand | 9 | 0.1% |
| Ukraine | 4 | 0.1% |
| Western Asia | 1 | 0.0% |
| Western Europe | 2 | 0.0% | View All 27 Rows |
Sex and Age in Clearwater County
Sex and Age in Clearwater County
The most populous age groups in Clearwater County are 55 to 59 Years (325 | 7.5%) for men and 10 to 14 Years (367 | 8.7%) for women.
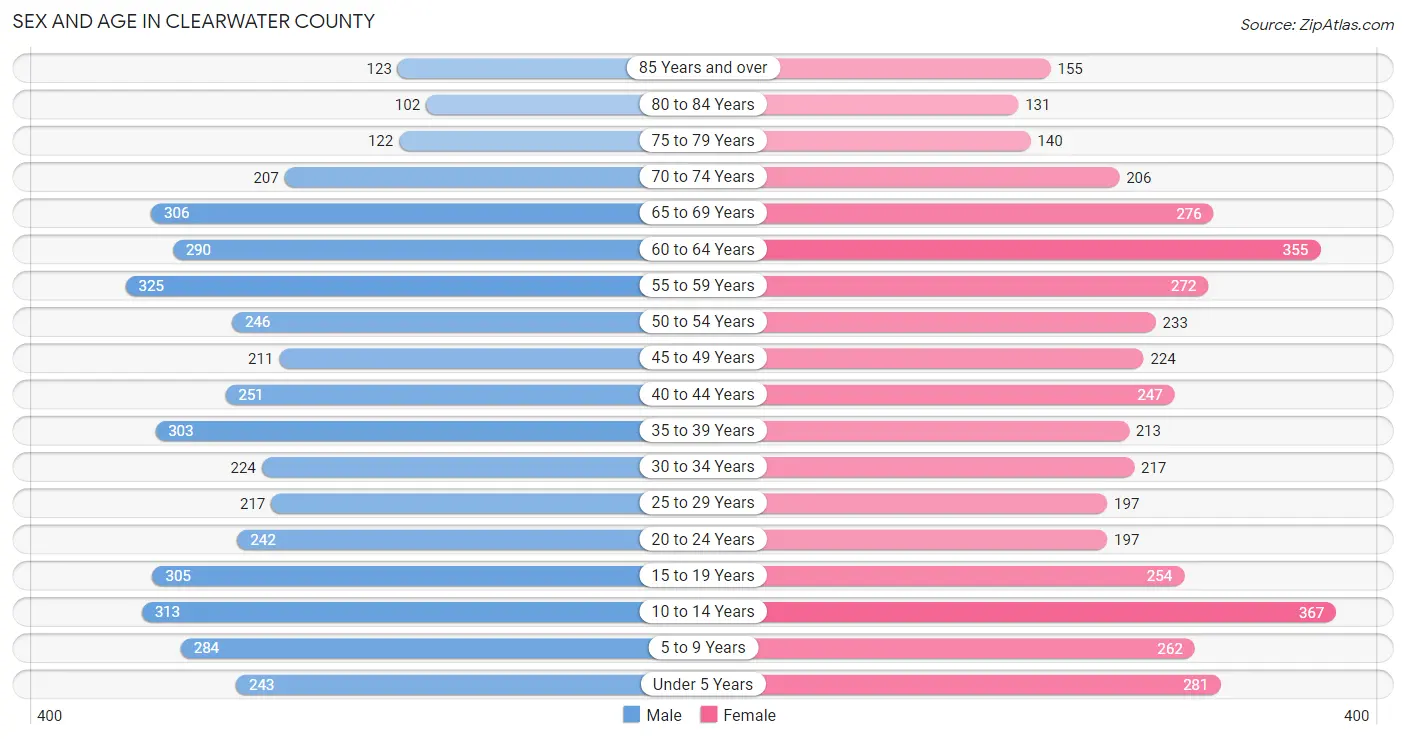
| Age Bracket | Male | Female |
| Under 5 Years | 243 (5.6%) | 281 (6.7%) |
| 5 to 9 Years | 284 (6.6%) | 262 (6.2%) |
| 10 to 14 Years | 313 (7.3%) | 367 (8.7%) |
| 15 to 19 Years | 305 (7.1%) | 254 (6.0%) |
| 20 to 24 Years | 242 (5.6%) | 197 (4.7%) |
| 25 to 29 Years | 217 (5.0%) | 197 (4.7%) |
| 30 to 34 Years | 224 (5.2%) | 217 (5.1%) |
| 35 to 39 Years | 303 (7.0%) | 213 (5.0%) |
| 40 to 44 Years | 251 (5.8%) | 247 (5.8%) |
| 45 to 49 Years | 211 (4.9%) | 224 (5.3%) |
| 50 to 54 Years | 246 (5.7%) | 233 (5.5%) |
| 55 to 59 Years | 325 (7.5%) | 272 (6.4%) |
| 60 to 64 Years | 290 (6.7%) | 355 (8.4%) |
| 65 to 69 Years | 306 (7.1%) | 276 (6.5%) |
| 70 to 74 Years | 207 (4.8%) | 206 (4.9%) |
| 75 to 79 Years | 122 (2.8%) | 140 (3.3%) |
| 80 to 84 Years | 102 (2.4%) | 131 (3.1%) |
| 85 Years and over | 123 (2.9%) | 155 (3.7%) |
| Total | 4,314 (100.0%) | 4,227 (100.0%) |
Families and Households in Clearwater County
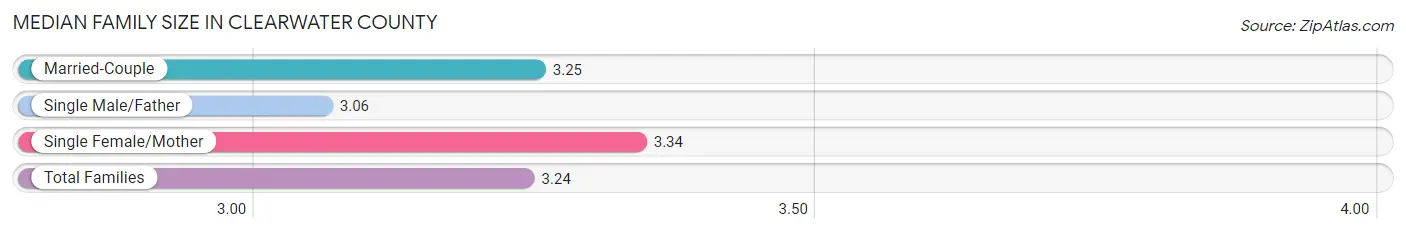
Median Family Size in Clearwater County
The median family size in Clearwater County is 3.24 persons per family, with single female/mother families (256 | 12.0%) accounting for the largest median family size of 3.34 persons per family. On the other hand, single male/father families (197 | 9.2%) represent the smallest median family size with 3.06 persons per family.
| Family Type | # Families | Family Size |
| Married-Couple | 1,677 (78.7%) | 3.25 |
| Single Male/Father | 197 (9.2%) | 3.06 |
| Single Female/Mother | 256 (12.0%) | 3.34 |
| Total Families | 2,130 (100.0%) | 3.24 |
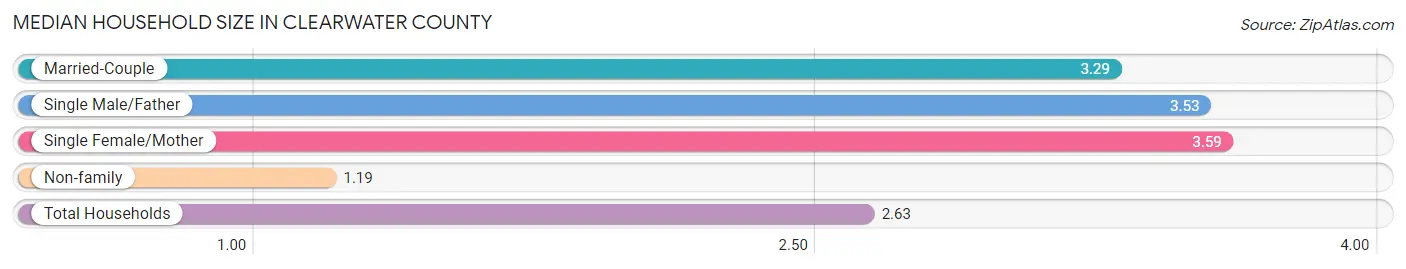
Median Household Size in Clearwater County
The median household size in Clearwater County is 2.63 persons per household, with single female/mother households (256 | 8.0%) accounting for the largest median household size of 3.59 persons per household. non-family households (1,066 | 33.4%) represent the smallest median household size with 1.19 persons per household.
| Household Type | # Households | Household Size |
| Married-Couple | 1,677 (52.5%) | 3.29 |
| Single Male/Father | 197 (6.2%) | 3.53 |
| Single Female/Mother | 256 (8.0%) | 3.59 |
| Non-family | 1,066 (33.4%) | 1.19 |
| Total Households | 3,196 (100.0%) | 2.63 |
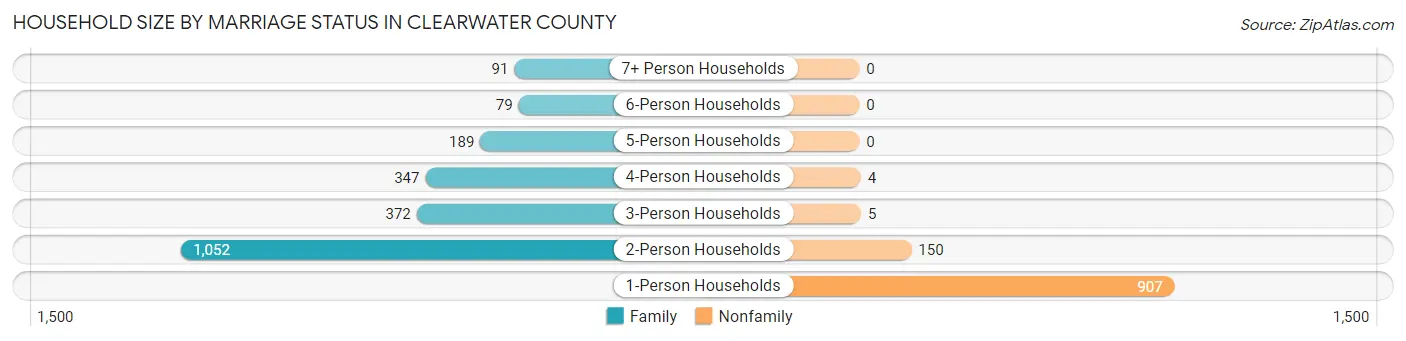
Household Size by Marriage Status in Clearwater County
Out of a total of 3,196 households in Clearwater County, 2,130 (66.6%) are family households, while 1,066 (33.4%) are nonfamily households. The most numerous type of family households are 2-person households, comprising 1,052, and the most common type of nonfamily households are 1-person households, comprising 907.
| Household Size | Family Households | Nonfamily Households |
| 1-Person Households | - | 907 (28.4%) |
| 2-Person Households | 1,052 (32.9%) | 150 (4.7%) |
| 3-Person Households | 372 (11.6%) | 5 (0.2%) |
| 4-Person Households | 347 (10.9%) | 4 (0.1%) |
| 5-Person Households | 189 (5.9%) | 0 (0.0%) |
| 6-Person Households | 79 (2.5%) | 0 (0.0%) |
| 7+ Person Households | 91 (2.9%) | 0 (0.0%) |
| Total | 2,130 (66.6%) | 1,066 (33.4%) |
Female Fertility in Clearwater County
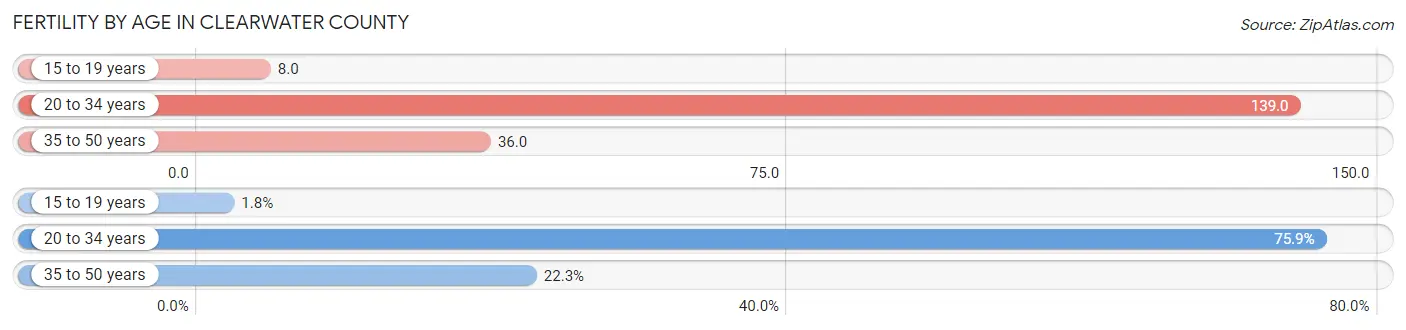
Fertility by Age in Clearwater County
Average fertility rate in Clearwater County is 72.0 births per 1,000 women. Women in the age bracket of 20 to 34 years have the highest fertility rate with 139.0 births per 1,000 women. Women in the age bracket of 20 to 34 years acount for 75.9% of all women with births.
| Age Bracket | Women with Births | Births / 1,000 Women |
| 15 to 19 years | 2 (1.8%) | 8.0 |
| 20 to 34 years | 85 (75.9%) | 139.0 |
| 35 to 50 years | 25 (22.3%) | 36.0 |
| Total | 112 (100.0%) | 72.0 |
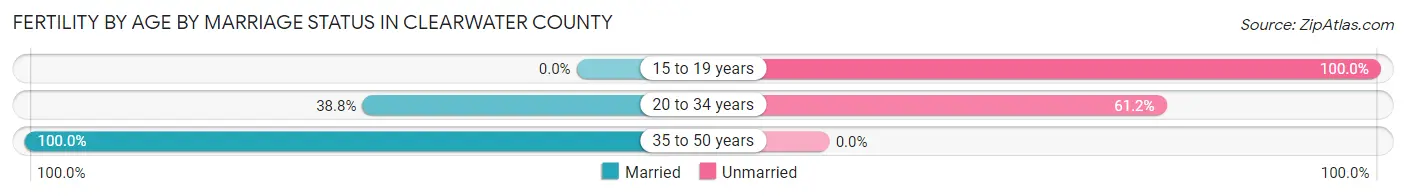
Fertility by Age by Marriage Status in Clearwater County
51.8% of women with births (112) in Clearwater County are married. The highest percentage of unmarried women with births falls into 15 to 19 years age bracket with 100.0% of them unmarried at the time of birth, while the lowest percentage of unmarried women with births belong to 35 to 50 years age bracket with 0.0% of them unmarried.
| Age Bracket | Married | Unmarried |
| 15 to 19 years | 0 (0.0%) | 2 (100.0%) |
| 20 to 34 years | 33 (38.8%) | 52 (61.2%) |
| 35 to 50 years | 25 (100.0%) | 0 (0.0%) |
| Total | 58 (51.8%) | 54 (48.2%) |
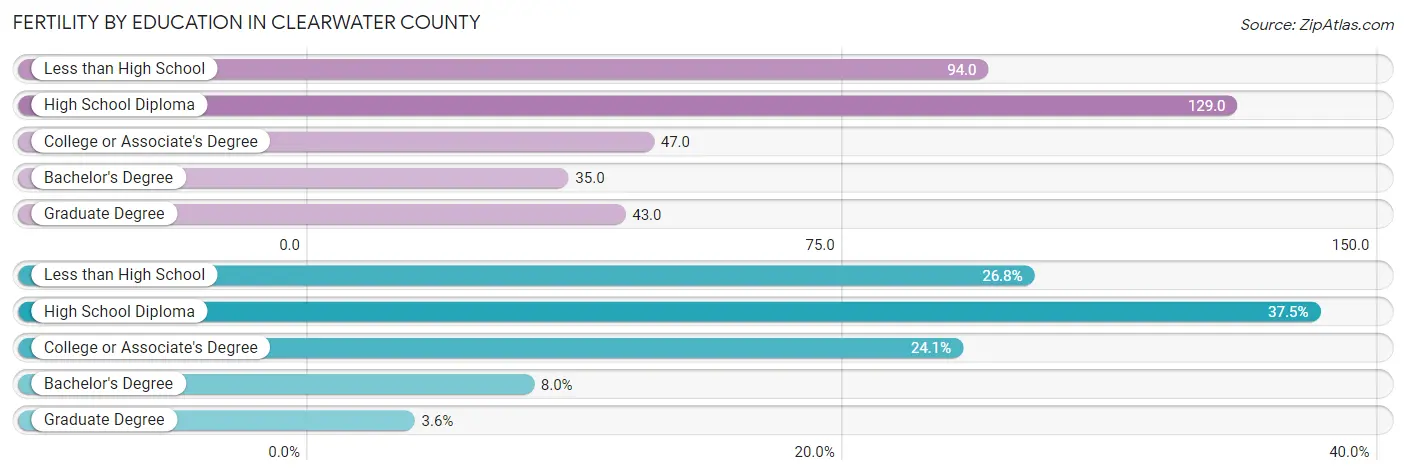
Fertility by Education in Clearwater County
Average fertility rate in Clearwater County is 72.0 births per 1,000 women. Women with the education attainment of high school diploma have the highest fertility rate of 129.0 births per 1,000 women, while women with the education attainment of bachelor's degree have the lowest fertility at 35.0 births per 1,000 women. Women with the education attainment of high school diploma represent 37.5% of all women with births.
| Educational Attainment | Women with Births | Births / 1,000 Women |
| Less than High School | 30 (26.8%) | 94.0 |
| High School Diploma | 42 (37.5%) | 129.0 |
| College or Associate's Degree | 27 (24.1%) | 47.0 |
| Bachelor's Degree | 9 (8.0%) | 35.0 |
| Graduate Degree | 4 (3.6%) | 43.0 |
| Total | 112 (100.0%) | 72.0 |
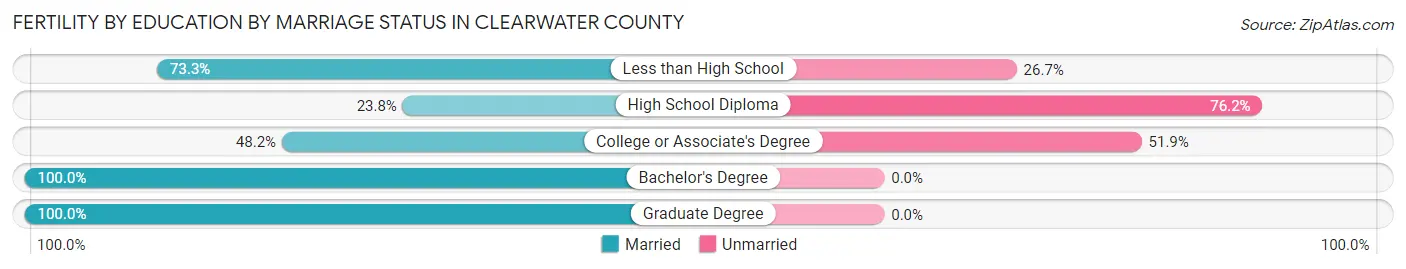
Fertility by Education by Marriage Status in Clearwater County
48.2% of women with births in Clearwater County are unmarried. Women with the educational attainment of bachelor's degree are most likely to be married with 100.0% of them married at childbirth, while women with the educational attainment of high school diploma are least likely to be married with 76.2% of them unmarried at childbirth.
| Educational Attainment | Married | Unmarried |
| Less than High School | 22 (73.3%) | 8 (26.7%) |
| High School Diploma | 10 (23.8%) | 32 (76.2%) |
| College or Associate's Degree | 13 (48.1%) | 14 (51.8%) |
| Bachelor's Degree | 9 (100.0%) | 0 (0.0%) |
| Graduate Degree | 4 (100.0%) | 0 (0.0%) |
| Total | 58 (51.8%) | 54 (48.2%) |
Employment Characteristics in Clearwater County
Employment by Class of Employer in Clearwater County
Among the 3,576 employed individuals in Clearwater County, private company employees (2,096 | 58.6%), local government employees (463 | 13.0%), and not-for-profit organizations (393 | 11.0%) make up the most common classes of employment.
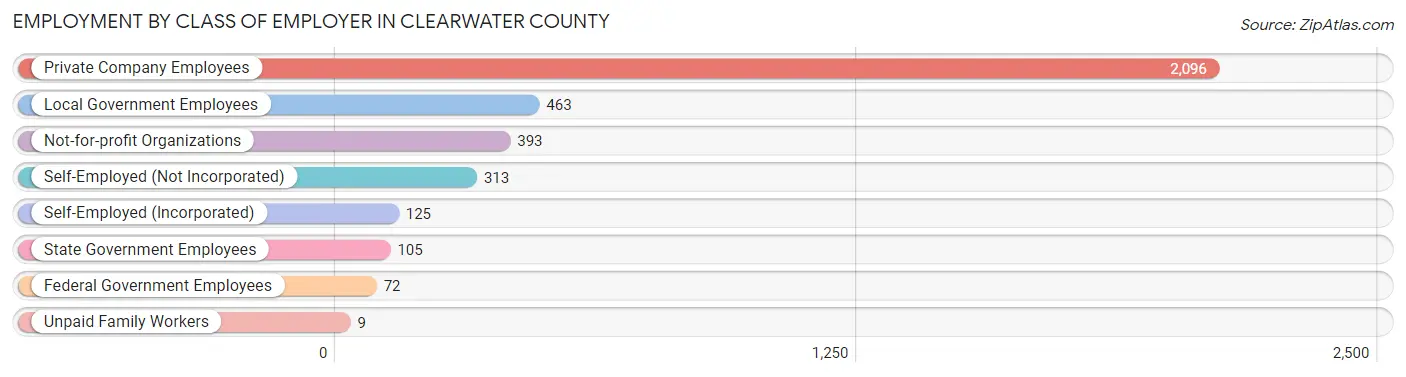
| Employer Class | # Employees | % Employees |
| Private Company Employees | 2,096 | 58.6% |
| Self-Employed (Incorporated) | 125 | 3.5% |
| Self-Employed (Not Incorporated) | 313 | 8.7% |
| Not-for-profit Organizations | 393 | 11.0% |
| Local Government Employees | 463 | 13.0% |
| State Government Employees | 105 | 2.9% |
| Federal Government Employees | 72 | 2.0% |
| Unpaid Family Workers | 9 | 0.3% |
| Total | 3,576 | 100.0% |
Employment Status by Age in Clearwater County
According to the labor force statistics for Clearwater County, out of the total population over 16 years of age (6,645), 59.1% or 3,927 individuals are in the labor force, with 7.6% or 298 of them unemployed. The age group with the highest labor force participation rate is 20 to 24 years, with 86.8% or 381 individuals in the labor force. Within the labor force, the 20 to 24 years age range has the highest percentage of unemployed individuals, with 12.4% or 47 of them being unemployed.
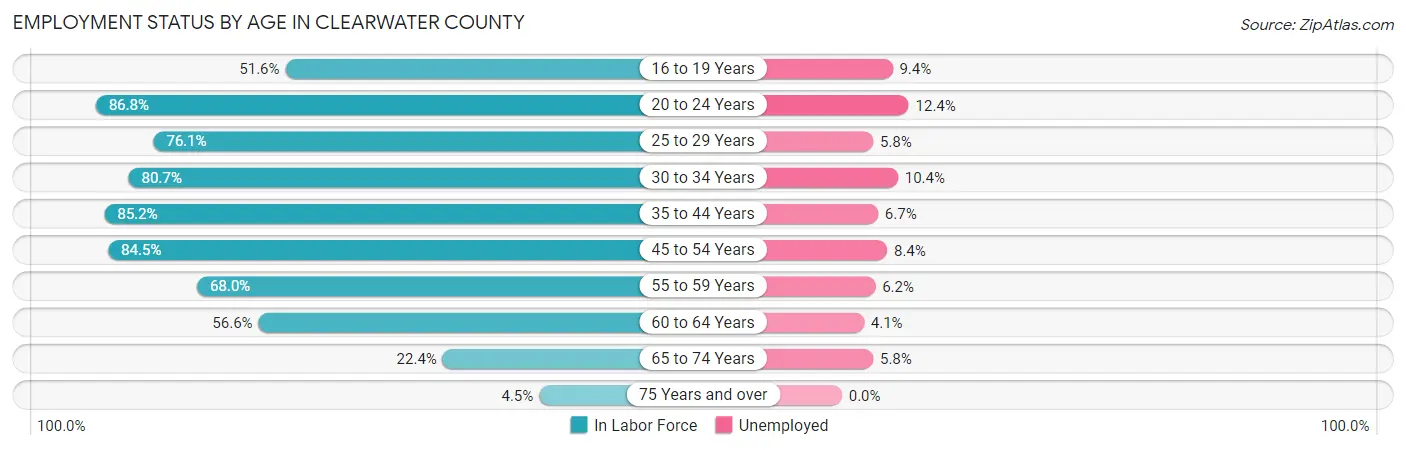
| Age Bracket | In Labor Force | Unemployed |
| 16 to 19 Years | 213 (51.6%) | 20 (9.4%) |
| 20 to 24 Years | 381 (86.8%) | 47 (12.4%) |
| 25 to 29 Years | 315 (76.1%) | 18 (5.8%) |
| 30 to 34 Years | 356 (80.7%) | 37 (10.4%) |
| 35 to 44 Years | 864 (85.2%) | 58 (6.7%) |
| 45 to 54 Years | 772 (84.5%) | 65 (8.4%) |
| 55 to 59 Years | 406 (68.0%) | 25 (6.2%) |
| 60 to 64 Years | 365 (56.6%) | 15 (4.1%) |
| 65 to 74 Years | 223 (22.4%) | 13 (5.8%) |
| 75 Years and over | 35 (4.5%) | 0 (0.0%) |
| Total | 3,927 (59.1%) | 298 (7.6%) |
Employment Status by Educational Attainment in Clearwater County
According to labor force statistics for Clearwater County, 76.5% of individuals (3,079) out of the total population between 25 and 64 years of age (4,025) are in the labor force, with 7.1% or 219 of them being unemployed. The group with the highest labor force participation rate are those with the educational attainment of bachelor's degree or higher, with 86.7% or 676 individuals in the labor force. Within the labor force, individuals with high school diploma education have the highest percentage of unemployment, with 10.7% or 111 of them being unemployed.
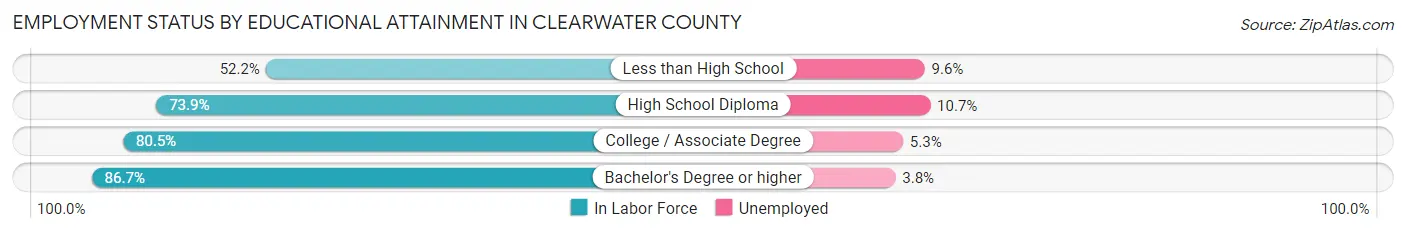
| Educational Attainment | In Labor Force | Unemployed |
| Less than High School | 218 (52.2%) | 40 (9.6%) |
| High School Diploma | 1,033 (73.9%) | 150 (10.7%) |
| College / Associate Degree | 1,150 (80.5%) | 76 (5.3%) |
| Bachelor's Degree or higher | 676 (86.7%) | 30 (3.8%) |
| Total | 3,079 (76.5%) | 286 (7.1%) |
Employment Occupations by Sex in Clearwater County
Management, Business, Science and Arts Occupations
The most common Management, Business, Science and Arts occupations in Clearwater County are Community & Social Service (405 | 11.2%), Management (273 | 7.5%), Health Diagnosing & Treating (253 | 7.0%), Education Instruction & Library (235 | 6.5%), and Health Technologists (164 | 4.5%).
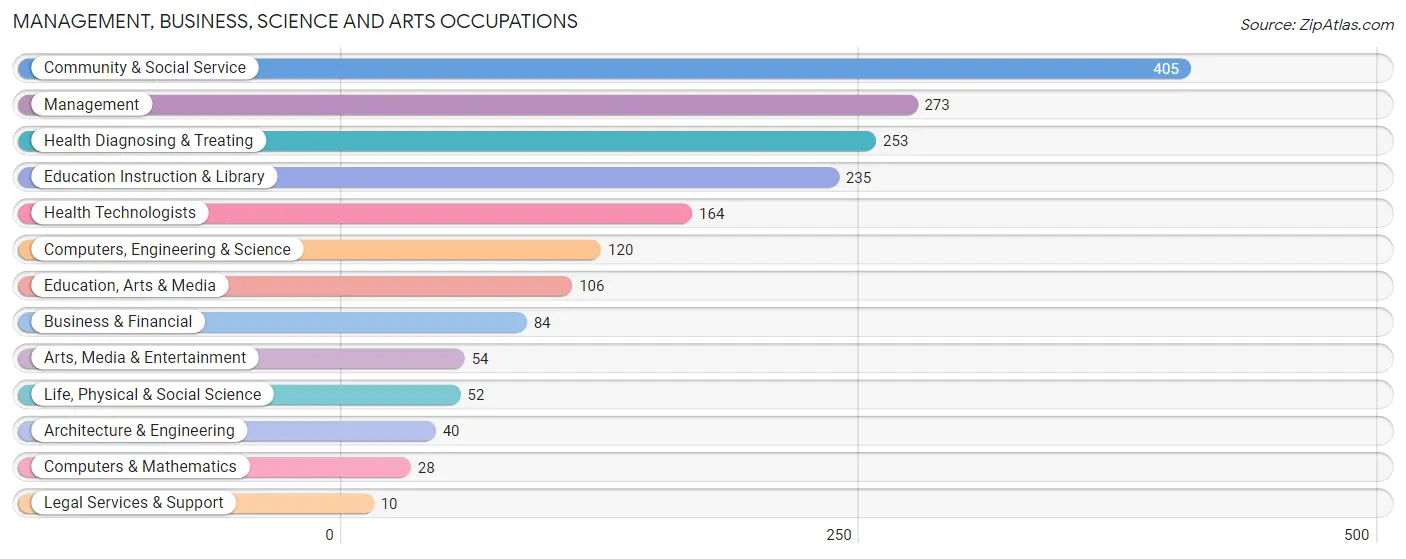
Management, Business, Science and Arts Occupations by Sex
Within the Management, Business, Science and Arts occupations in Clearwater County, the most male-oriented occupations are Architecture & Engineering (95.0%), Computers, Engineering & Science (75.0%), and Computers & Mathematics (75.0%), while the most female-oriented occupations are Health Technologists (93.9%), Health Diagnosing & Treating (91.3%), and Education Instruction & Library (77.0%).
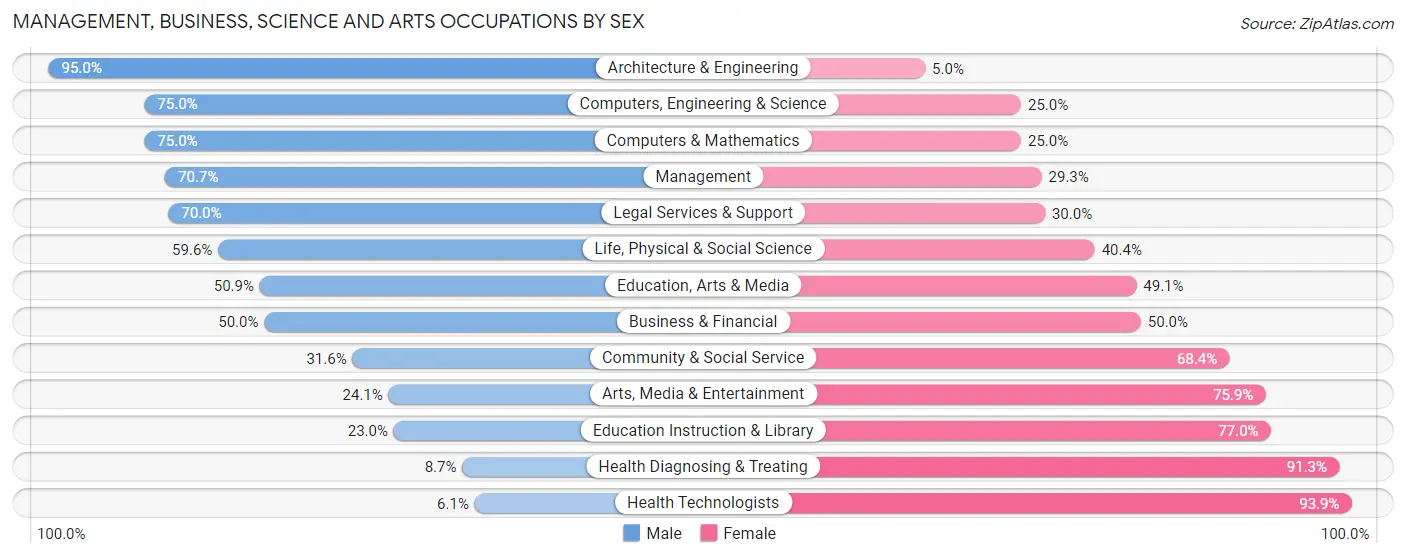
| Occupation | Male | Female |
| Management | 193 (70.7%) | 80 (29.3%) |
| Business & Financial | 42 (50.0%) | 42 (50.0%) |
| Computers, Engineering & Science | 90 (75.0%) | 30 (25.0%) |
| Computers & Mathematics | 21 (75.0%) | 7 (25.0%) |
| Architecture & Engineering | 38 (95.0%) | 2 (5.0%) |
| Life, Physical & Social Science | 31 (59.6%) | 21 (40.4%) |
| Community & Social Service | 128 (31.6%) | 277 (68.4%) |
| Education, Arts & Media | 54 (50.9%) | 52 (49.1%) |
| Legal Services & Support | 7 (70.0%) | 3 (30.0%) |
| Education Instruction & Library | 54 (23.0%) | 181 (77.0%) |
| Arts, Media & Entertainment | 13 (24.1%) | 41 (75.9%) |
| Health Diagnosing & Treating | 22 (8.7%) | 231 (91.3%) |
| Health Technologists | 10 (6.1%) | 154 (93.9%) |
| Total (Category) | 475 (41.8%) | 660 (58.2%) |
| Total (Overall) | 1,871 (51.6%) | 1,757 (48.4%) |
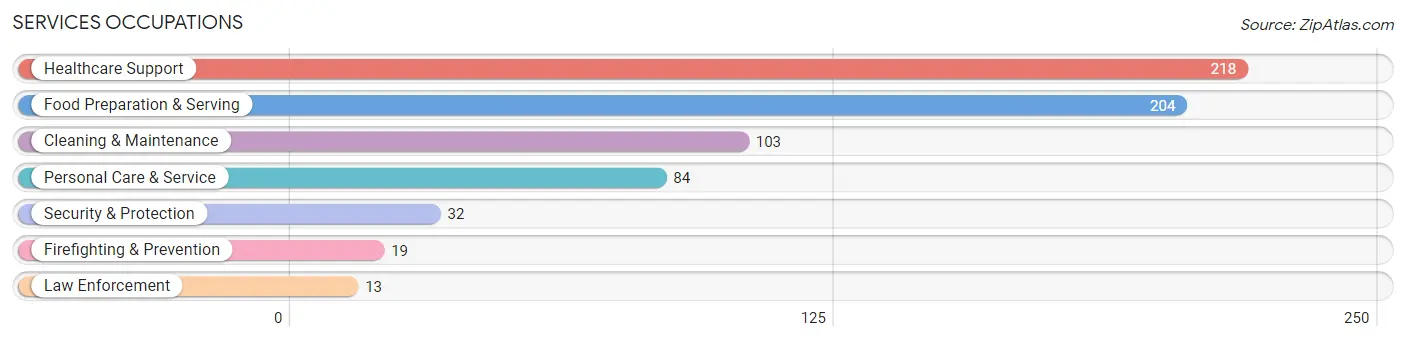
Services Occupations
The most common Services occupations in Clearwater County are Healthcare Support (218 | 6.0%), Food Preparation & Serving (204 | 5.6%), Cleaning & Maintenance (103 | 2.8%), Personal Care & Service (84 | 2.3%), and Security & Protection (32 | 0.9%).
Services Occupations by Sex
Within the Services occupations in Clearwater County, the most male-oriented occupations are Law Enforcement (84.6%), Security & Protection (78.1%), and Firefighting & Prevention (73.7%), while the most female-oriented occupations are Healthcare Support (86.7%), Personal Care & Service (78.6%), and Food Preparation & Serving (76.5%).
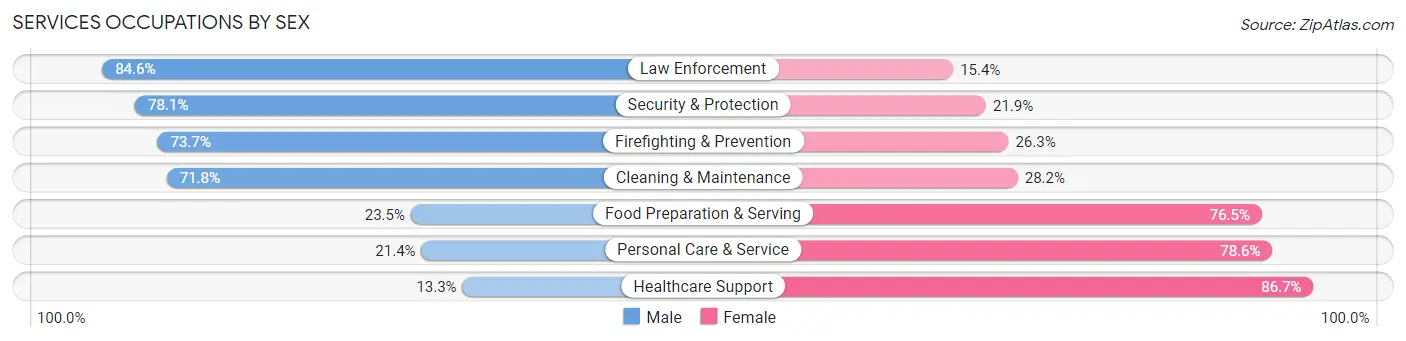
| Occupation | Male | Female |
| Healthcare Support | 29 (13.3%) | 189 (86.7%) |
| Security & Protection | 25 (78.1%) | 7 (21.9%) |
| Firefighting & Prevention | 14 (73.7%) | 5 (26.3%) |
| Law Enforcement | 11 (84.6%) | 2 (15.4%) |
| Food Preparation & Serving | 48 (23.5%) | 156 (76.5%) |
| Cleaning & Maintenance | 74 (71.8%) | 29 (28.2%) |
| Personal Care & Service | 18 (21.4%) | 66 (78.6%) |
| Total (Category) | 194 (30.3%) | 447 (69.7%) |
| Total (Overall) | 1,871 (51.6%) | 1,757 (48.4%) |
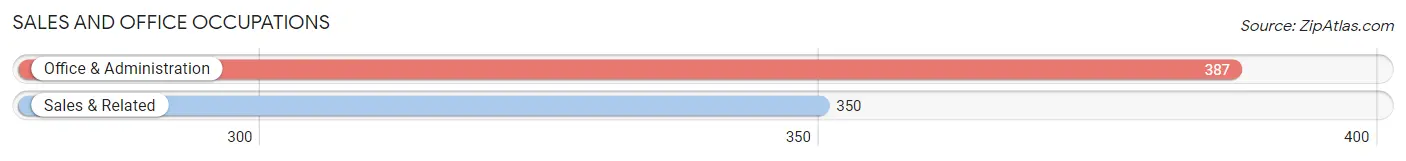
Sales and Office Occupations
The most common Sales and Office occupations in Clearwater County are Office & Administration (387 | 10.7%), and Sales & Related (350 | 9.7%).
Sales and Office Occupations by Sex

| Occupation | Male | Female |
| Sales & Related | 136 (38.9%) | 214 (61.1%) |
| Office & Administration | 68 (17.6%) | 319 (82.4%) |
| Total (Category) | 204 (27.7%) | 533 (72.3%) |
| Total (Overall) | 1,871 (51.6%) | 1,757 (48.4%) |
Natural Resources, Construction and Maintenance Occupations
The most common Natural Resources, Construction and Maintenance occupations in Clearwater County are Construction & Extraction (332 | 9.1%), Installation, Maintenance & Repair (130 | 3.6%), and Farming, Fishing & Forestry (61 | 1.7%).
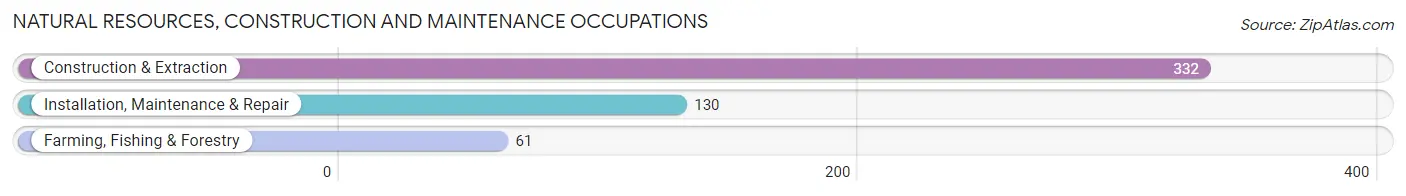
Natural Resources, Construction and Maintenance Occupations by Sex
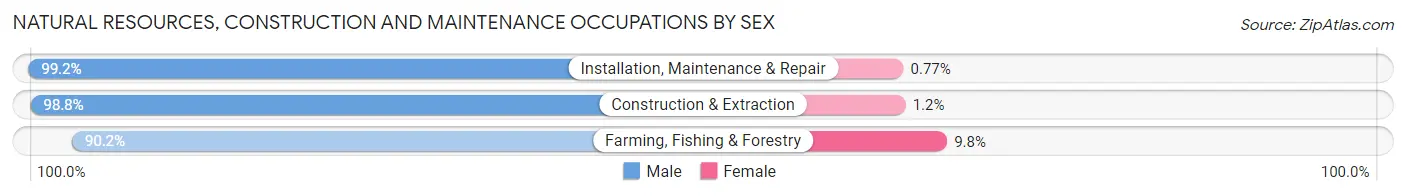
| Occupation | Male | Female |
| Farming, Fishing & Forestry | 55 (90.2%) | 6 (9.8%) |
| Construction & Extraction | 328 (98.8%) | 4 (1.2%) |
| Installation, Maintenance & Repair | 129 (99.2%) | 1 (0.8%) |
| Total (Category) | 512 (97.9%) | 11 (2.1%) |
| Total (Overall) | 1,871 (51.6%) | 1,757 (48.4%) |
Production, Transportation and Moving Occupations
The most common Production, Transportation and Moving occupations in Clearwater County are Production (238 | 6.6%), Transportation (187 | 5.1%), and Material Moving (167 | 4.6%).
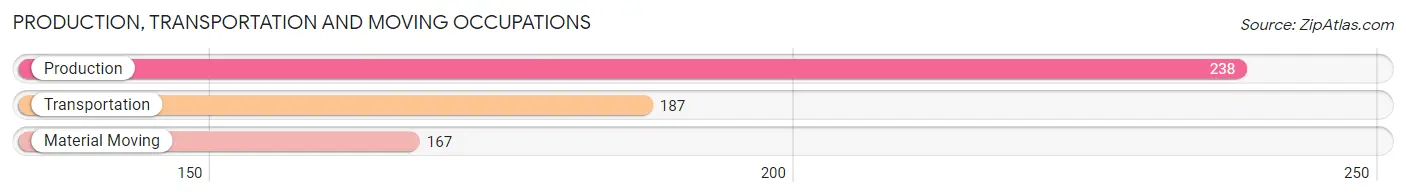
Production, Transportation and Moving Occupations by Sex
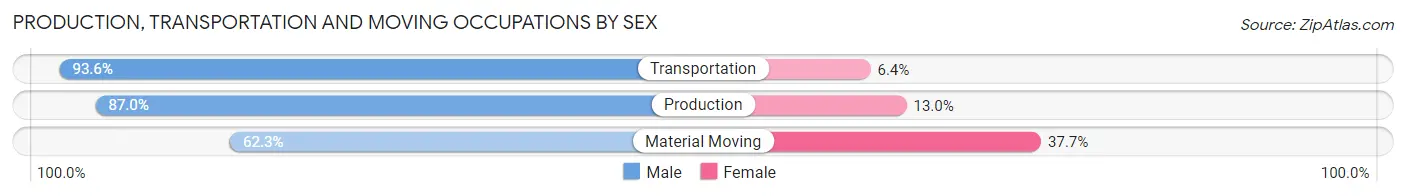
| Occupation | Male | Female |
| Production | 207 (87.0%) | 31 (13.0%) |
| Transportation | 175 (93.6%) | 12 (6.4%) |
| Material Moving | 104 (62.3%) | 63 (37.7%) |
| Total (Category) | 486 (82.1%) | 106 (17.9%) |
| Total (Overall) | 1,871 (51.6%) | 1,757 (48.4%) |
Employment Industries by Sex in Clearwater County
Employment Industries in Clearwater County
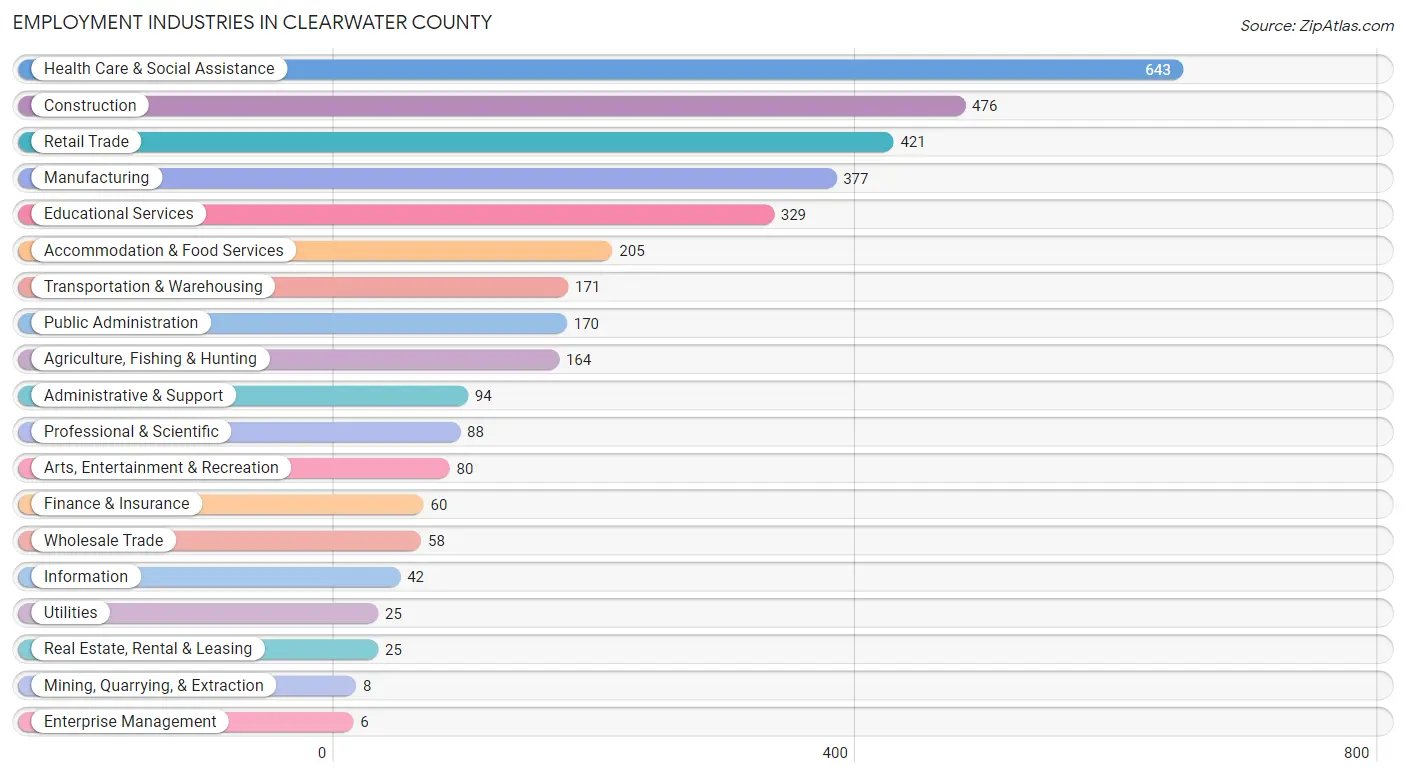
The major employment industries in Clearwater County include Health Care & Social Assistance (643 | 17.7%), Construction (476 | 13.1%), Retail Trade (421 | 11.6%), Manufacturing (377 | 10.4%), and Educational Services (329 | 9.1%).
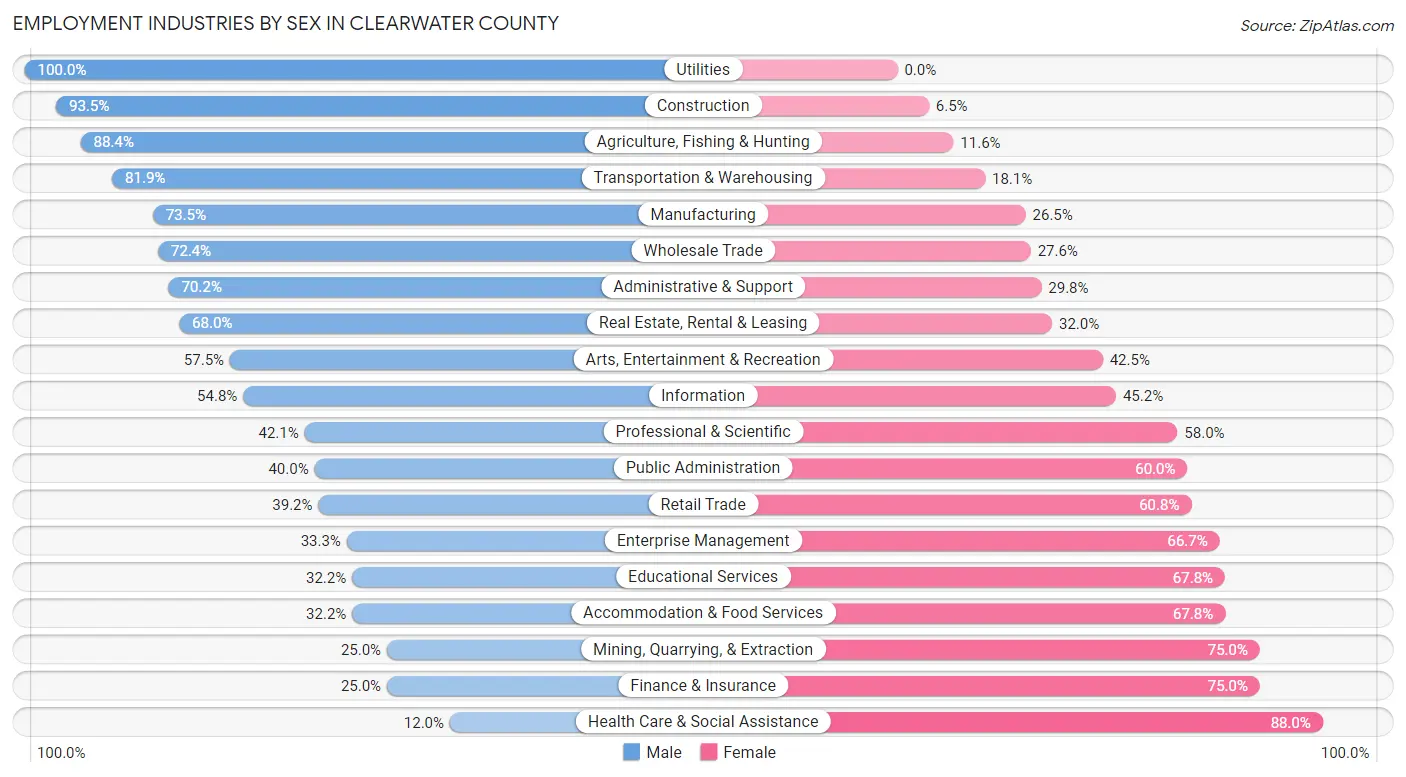
Employment Industries by Sex in Clearwater County
The Clearwater County industries that see more men than women are Utilities (100.0%), Construction (93.5%), and Agriculture, Fishing & Hunting (88.4%), whereas the industries that tend to have a higher number of women are Health Care & Social Assistance (88.0%), Mining, Quarrying, & Extraction (75.0%), and Finance & Insurance (75.0%).
| Industry | Male | Female |
| Agriculture, Fishing & Hunting | 145 (88.4%) | 19 (11.6%) |
| Mining, Quarrying, & Extraction | 2 (25.0%) | 6 (75.0%) |
| Construction | 445 (93.5%) | 31 (6.5%) |
| Manufacturing | 277 (73.5%) | 100 (26.5%) |
| Wholesale Trade | 42 (72.4%) | 16 (27.6%) |
| Retail Trade | 165 (39.2%) | 256 (60.8%) |
| Transportation & Warehousing | 140 (81.9%) | 31 (18.1%) |
| Utilities | 25 (100.0%) | 0 (0.0%) |
| Information | 23 (54.8%) | 19 (45.2%) |
| Finance & Insurance | 15 (25.0%) | 45 (75.0%) |
| Real Estate, Rental & Leasing | 17 (68.0%) | 8 (32.0%) |
| Professional & Scientific | 37 (42.0%) | 51 (58.0%) |
| Enterprise Management | 2 (33.3%) | 4 (66.7%) |
| Administrative & Support | 66 (70.2%) | 28 (29.8%) |
| Educational Services | 106 (32.2%) | 223 (67.8%) |
| Health Care & Social Assistance | 77 (12.0%) | 566 (88.0%) |
| Arts, Entertainment & Recreation | 46 (57.5%) | 34 (42.5%) |
| Accommodation & Food Services | 66 (32.2%) | 139 (67.8%) |
| Public Administration | 68 (40.0%) | 102 (60.0%) |
| Total | 1,871 (51.6%) | 1,757 (48.4%) |
Education in Clearwater County
School Enrollment in Clearwater County
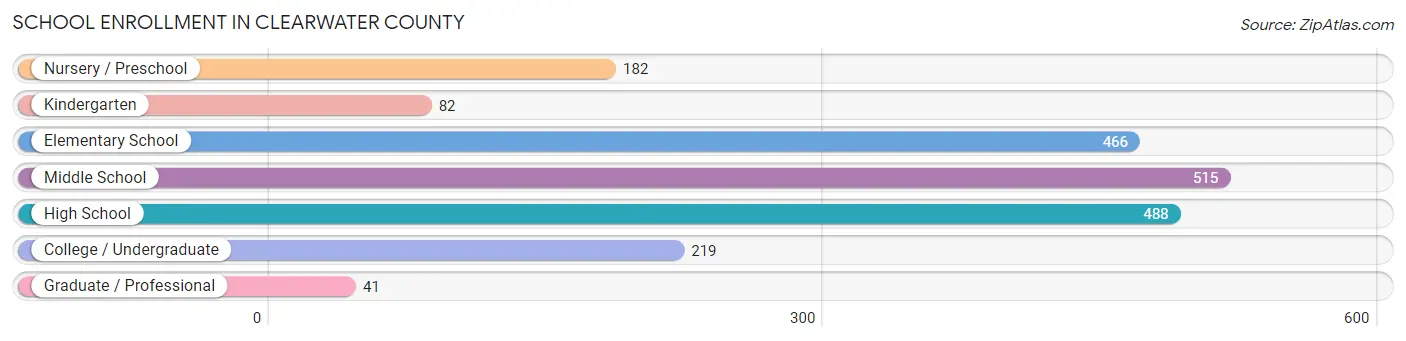
The most common levels of schooling among the 1,993 students in Clearwater County are middle school (515 | 25.8%), high school (488 | 24.5%), and elementary school (466 | 23.4%).
| School Level | # Students | % Students |
| Nursery / Preschool | 182 | 9.1% |
| Kindergarten | 82 | 4.1% |
| Elementary School | 466 | 23.4% |
| Middle School | 515 | 25.8% |
| High School | 488 | 24.5% |
| College / Undergraduate | 219 | 11.0% |
| Graduate / Professional | 41 | 2.1% |
| Total | 1,993 | 100.0% |
School Enrollment by Age by Funding Source in Clearwater County
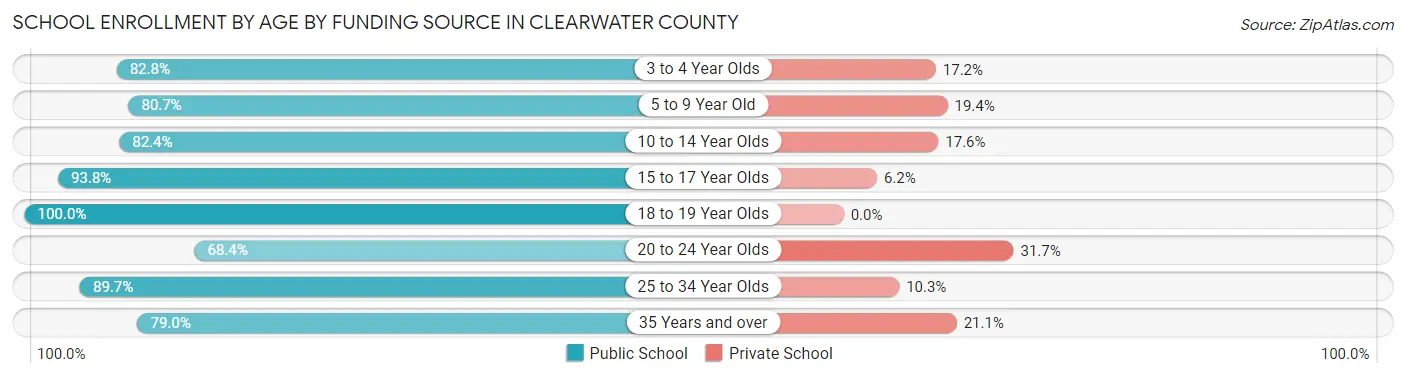
Out of a total of 1,993 students who are enrolled in schools in Clearwater County, 309 (15.5%) attend a private institution, while the remaining 1,684 (84.5%) are enrolled in public schools. The age group of 20 to 24 year olds has the highest likelihood of being enrolled in private schools, with 25 (31.7% in the age bracket) enrolled. Conversely, the age group of 18 to 19 year olds has the lowest likelihood of being enrolled in a private school, with 91 (100.0% in the age bracket) attending a public institution.
| Age Bracket | Public School | Private School |
| 3 to 4 Year Olds | 82 (82.8%) | 17 (17.2%) |
| 5 to 9 Year Old | 421 (80.6%) | 101 (19.4%) |
| 10 to 14 Year Olds | 551 (82.4%) | 118 (17.6%) |
| 15 to 17 Year Olds | 347 (93.8%) | 23 (6.2%) |
| 18 to 19 Year Olds | 91 (100.0%) | 0 (0.0%) |
| 20 to 24 Year Olds | 54 (68.3%) | 25 (31.7%) |
| 25 to 34 Year Olds | 78 (89.7%) | 9 (10.3%) |
| 35 Years and over | 60 (78.9%) | 16 (21.0%) |
| Total | 1,684 (84.5%) | 309 (15.5%) |
Educational Attainment by Field of Study in Clearwater County
Education (302 | 25.7%), science & technology (157 | 13.3%), business (141 | 12.0%), arts & humanities (127 | 10.8%), and bio, nature & agricultural (89 | 7.6%) are the most common fields of study among 1,177 individuals in Clearwater County who have obtained a bachelor's degree or higher.
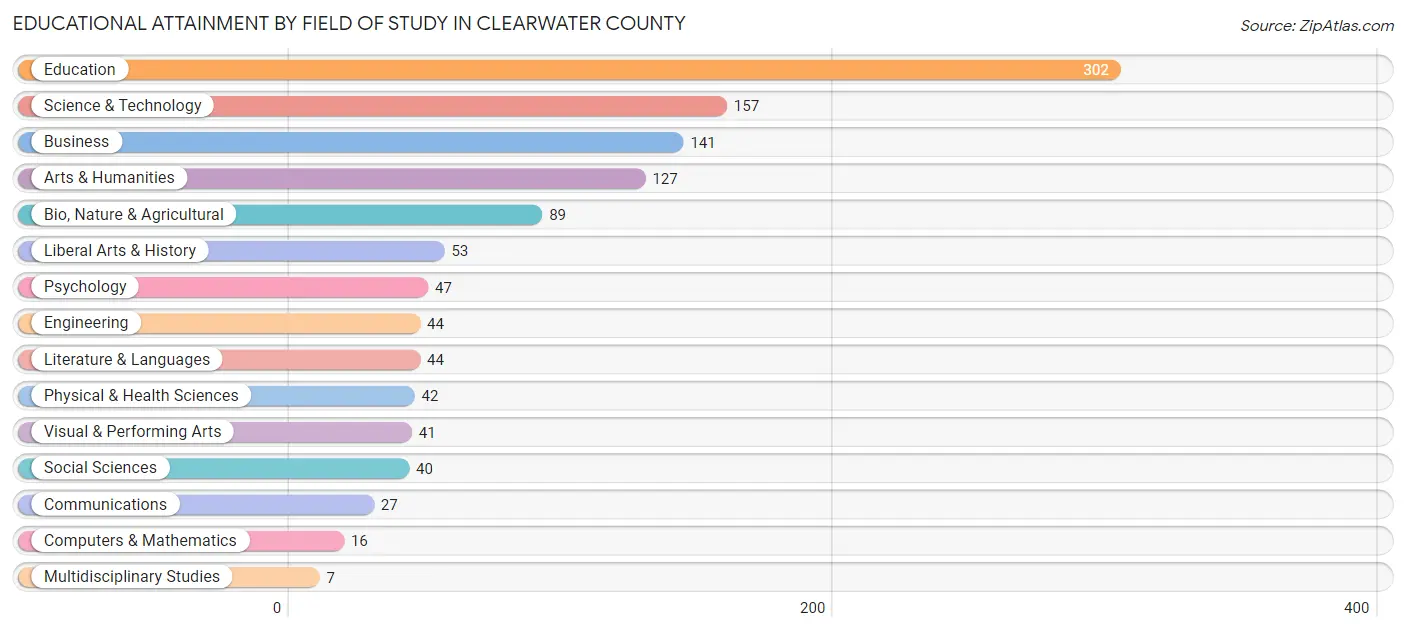
| Field of Study | # Graduates | % Graduates |
| Computers & Mathematics | 16 | 1.4% |
| Bio, Nature & Agricultural | 89 | 7.6% |
| Physical & Health Sciences | 42 | 3.6% |
| Psychology | 47 | 4.0% |
| Social Sciences | 40 | 3.4% |
| Engineering | 44 | 3.7% |
| Multidisciplinary Studies | 7 | 0.6% |
| Science & Technology | 157 | 13.3% |
| Business | 141 | 12.0% |
| Education | 302 | 25.7% |
| Literature & Languages | 44 | 3.7% |
| Liberal Arts & History | 53 | 4.5% |
| Visual & Performing Arts | 41 | 3.5% |
| Communications | 27 | 2.3% |
| Arts & Humanities | 127 | 10.8% |
| Total | 1,177 | 100.0% |
Transportation & Commute in Clearwater County
Vehicle Availability by Sex in Clearwater County
The most prevalent vehicle ownership categories in Clearwater County are males with 3 vehicles (560, accounting for 30.4%) and females with 3 vehicles (483, making up 32.4%).
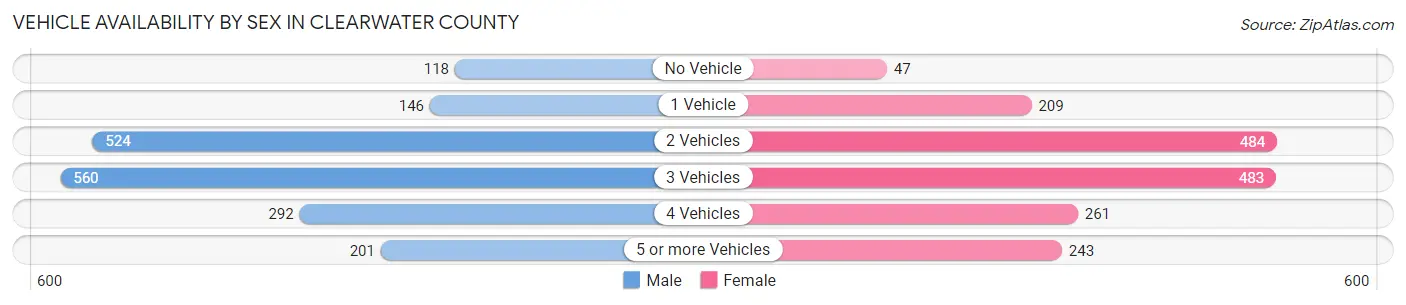
| Vehicles Available | Male | Female |
| No Vehicle | 118 (6.4%) | 47 (2.7%) |
| 1 Vehicle | 146 (7.9%) | 209 (12.1%) |
| 2 Vehicles | 524 (28.5%) | 484 (28.0%) |
| 3 Vehicles | 560 (30.4%) | 483 (28.0%) |
| 4 Vehicles | 292 (15.9%) | 261 (15.1%) |
| 5 or more Vehicles | 201 (10.9%) | 243 (14.1%) |
| Total | 1,841 (100.0%) | 1,727 (100.0%) |
Commute Time in Clearwater County
The most frequently occuring commute durations in Clearwater County are 5 to 9 minutes (533 commuters, 16.2%), 15 to 19 minutes (420 commuters, 12.8%), and 10 to 14 minutes (376 commuters, 11.5%).
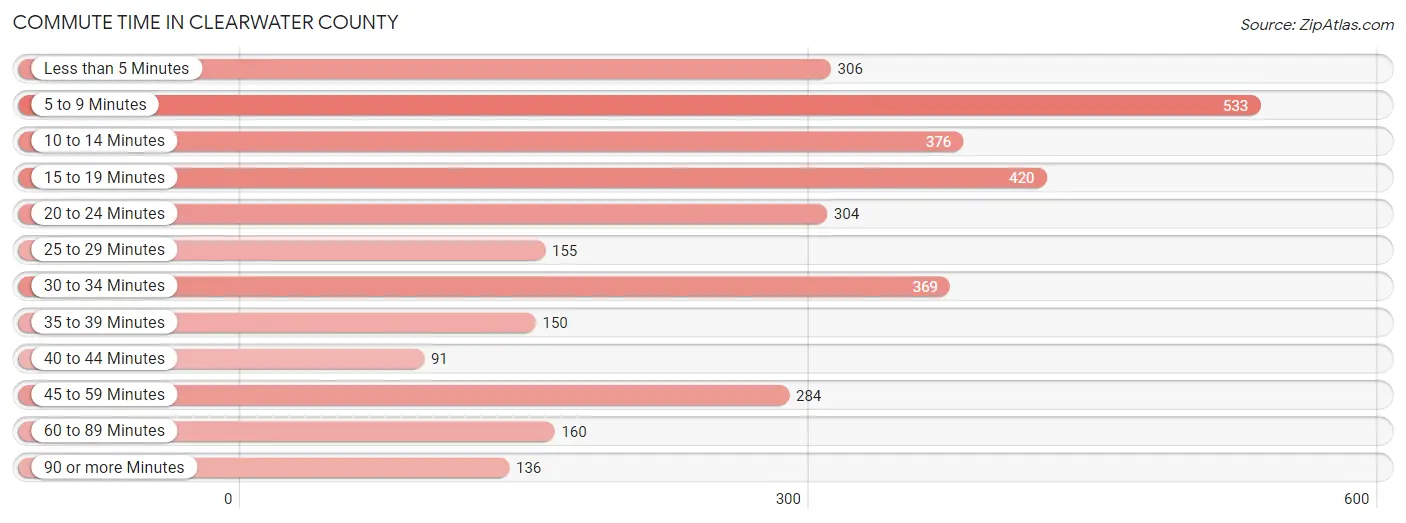
| Commute Time | # Commuters | % Commuters |
| Less than 5 Minutes | 306 | 9.3% |
| 5 to 9 Minutes | 533 | 16.2% |
| 10 to 14 Minutes | 376 | 11.5% |
| 15 to 19 Minutes | 420 | 12.8% |
| 20 to 24 Minutes | 304 | 9.3% |
| 25 to 29 Minutes | 155 | 4.7% |
| 30 to 34 Minutes | 369 | 11.2% |
| 35 to 39 Minutes | 150 | 4.6% |
| 40 to 44 Minutes | 91 | 2.8% |
| 45 to 59 Minutes | 284 | 8.6% |
| 60 to 89 Minutes | 160 | 4.9% |
| 90 or more Minutes | 136 | 4.1% |
Commute Time by Sex in Clearwater County
The most common commute times in Clearwater County are 5 to 9 minutes (251 commuters, 14.8%) for males and 5 to 9 minutes (282 commuters, 17.8%) for females.
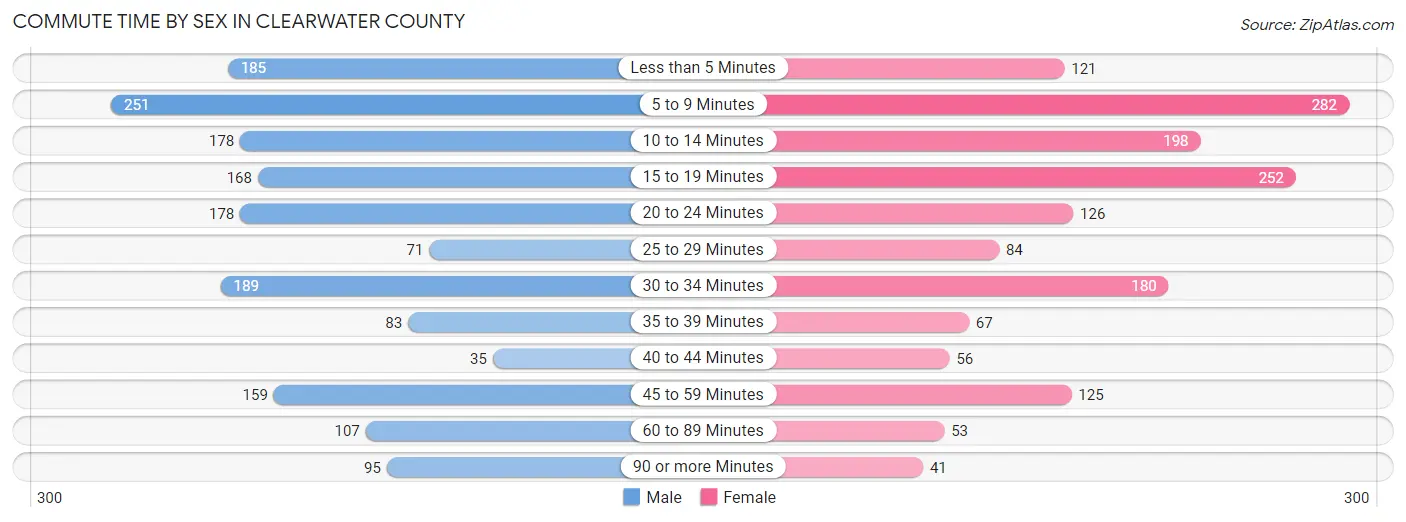
| Commute Time | Male | Female |
| Less than 5 Minutes | 185 (10.9%) | 121 (7.6%) |
| 5 to 9 Minutes | 251 (14.8%) | 282 (17.8%) |
| 10 to 14 Minutes | 178 (10.5%) | 198 (12.5%) |
| 15 to 19 Minutes | 168 (9.9%) | 252 (15.9%) |
| 20 to 24 Minutes | 178 (10.5%) | 126 (8.0%) |
| 25 to 29 Minutes | 71 (4.2%) | 84 (5.3%) |
| 30 to 34 Minutes | 189 (11.1%) | 180 (11.4%) |
| 35 to 39 Minutes | 83 (4.9%) | 67 (4.2%) |
| 40 to 44 Minutes | 35 (2.1%) | 56 (3.5%) |
| 45 to 59 Minutes | 159 (9.4%) | 125 (7.9%) |
| 60 to 89 Minutes | 107 (6.3%) | 53 (3.3%) |
| 90 or more Minutes | 95 (5.6%) | 41 (2.6%) |
Time of Departure to Work by Sex in Clearwater County
The most frequent times of departure to work in Clearwater County are 7:00 AM to 7:29 AM (270, 15.9%) for males and 7:30 AM to 7:59 AM (308, 19.4%) for females.
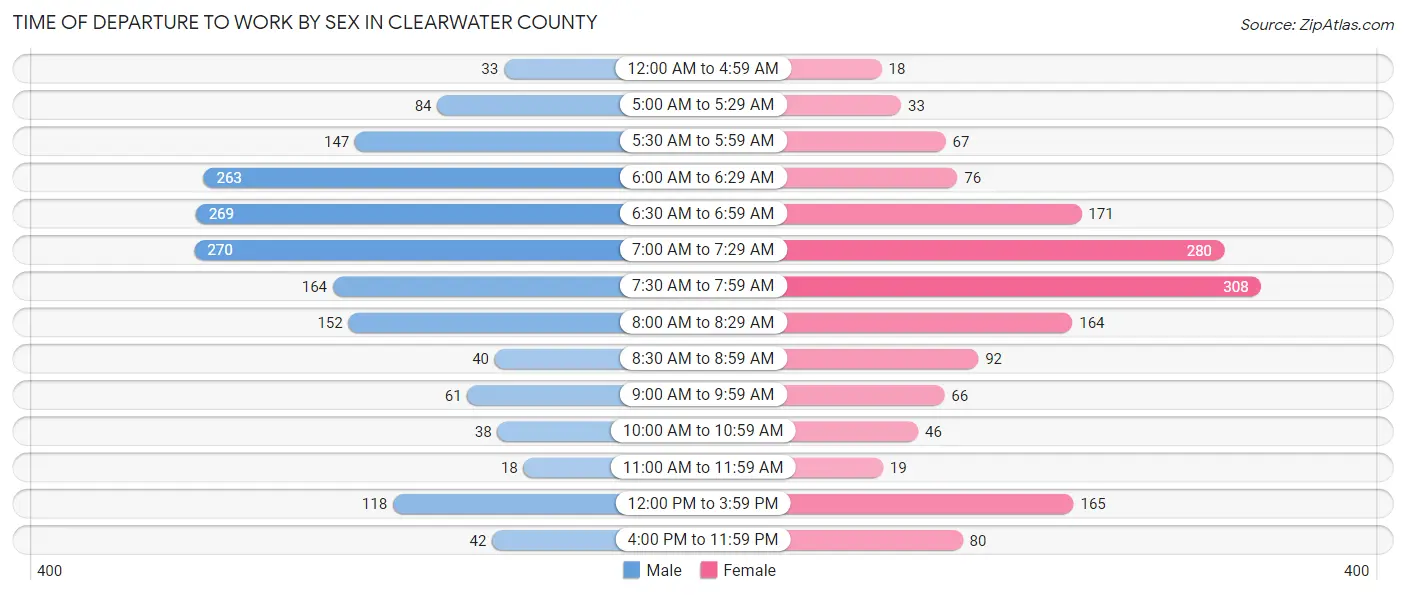
| Time of Departure | Male | Female |
| 12:00 AM to 4:59 AM | 33 (1.9%) | 18 (1.1%) |
| 5:00 AM to 5:29 AM | 84 (4.9%) | 33 (2.1%) |
| 5:30 AM to 5:59 AM | 147 (8.6%) | 67 (4.2%) |
| 6:00 AM to 6:29 AM | 263 (15.5%) | 76 (4.8%) |
| 6:30 AM to 6:59 AM | 269 (15.8%) | 171 (10.8%) |
| 7:00 AM to 7:29 AM | 270 (15.9%) | 280 (17.7%) |
| 7:30 AM to 7:59 AM | 164 (9.7%) | 308 (19.4%) |
| 8:00 AM to 8:29 AM | 152 (8.9%) | 164 (10.3%) |
| 8:30 AM to 8:59 AM | 40 (2.4%) | 92 (5.8%) |
| 9:00 AM to 9:59 AM | 61 (3.6%) | 66 (4.2%) |
| 10:00 AM to 10:59 AM | 38 (2.2%) | 46 (2.9%) |
| 11:00 AM to 11:59 AM | 18 (1.1%) | 19 (1.2%) |
| 12:00 PM to 3:59 PM | 118 (7.0%) | 165 (10.4%) |
| 4:00 PM to 11:59 PM | 42 (2.5%) | 80 (5.1%) |
| Total | 1,699 (100.0%) | 1,585 (100.0%) |
Housing Occupancy in Clearwater County
Occupancy by Ownership in Clearwater County
Of the total 3,196 dwellings in Clearwater County, owner-occupied units account for 2,617 (81.9%), while renter-occupied units make up 579 (18.1%).
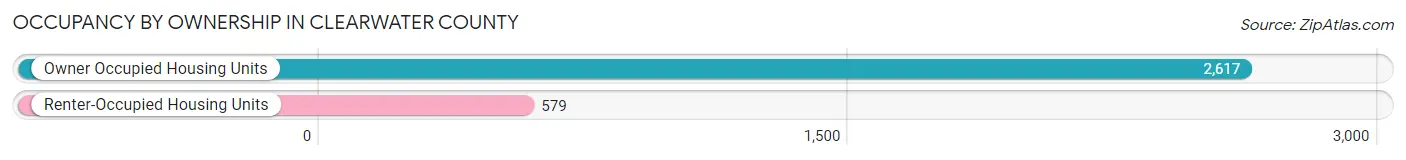
| Occupancy | # Housing Units | % Housing Units |
| Owner Occupied Housing Units | 2,617 | 81.9% |
| Renter-Occupied Housing Units | 579 | 18.1% |
| Total Occupied Housing Units | 3,196 | 100.0% |
Occupancy by Household Size in Clearwater County
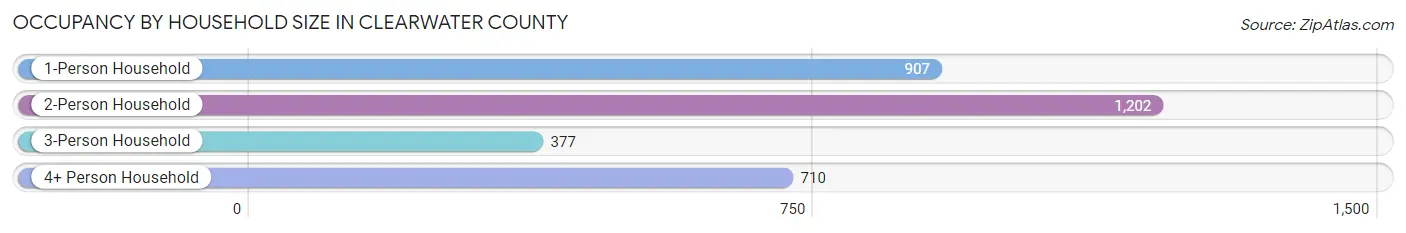
| Household Size | # Housing Units | % Housing Units |
| 1-Person Household | 907 | 28.4% |
| 2-Person Household | 1,202 | 37.6% |
| 3-Person Household | 377 | 11.8% |
| 4+ Person Household | 710 | 22.2% |
| Total Housing Units | 3,196 | 100.0% |
Occupancy by Ownership by Household Size in Clearwater County
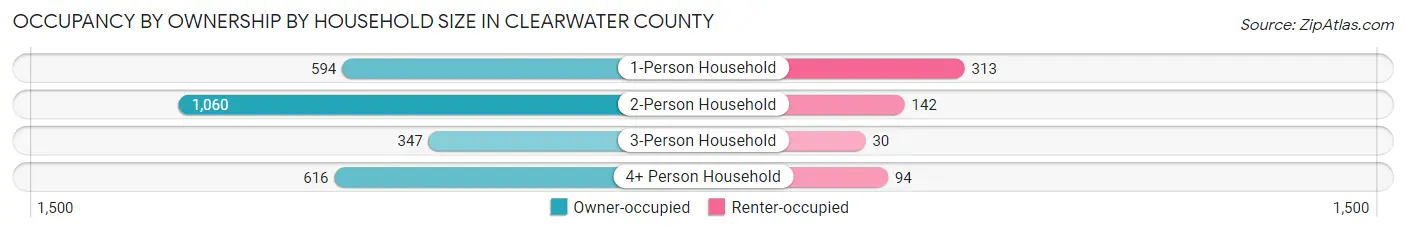
| Household Size | Owner-occupied | Renter-occupied |
| 1-Person Household | 594 (65.5%) | 313 (34.5%) |
| 2-Person Household | 1,060 (88.2%) | 142 (11.8%) |
| 3-Person Household | 347 (92.0%) | 30 (8.0%) |
| 4+ Person Household | 616 (86.8%) | 94 (13.2%) |
| Total Housing Units | 2,617 (81.9%) | 579 (18.1%) |
Occupancy by Educational Attainment in Clearwater County
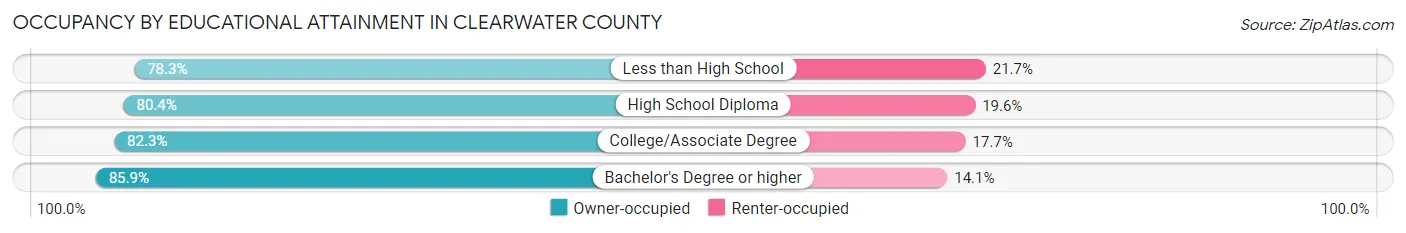
| Household Size | Owner-occupied | Renter-occupied |
| Less than High School | 306 (78.3%) | 85 (21.7%) |
| High School Diploma | 872 (80.4%) | 213 (19.6%) |
| College/Associate Degree | 867 (82.3%) | 187 (17.7%) |
| Bachelor's Degree or higher | 572 (85.9%) | 94 (14.1%) |
Occupancy by Age of Householder in Clearwater County
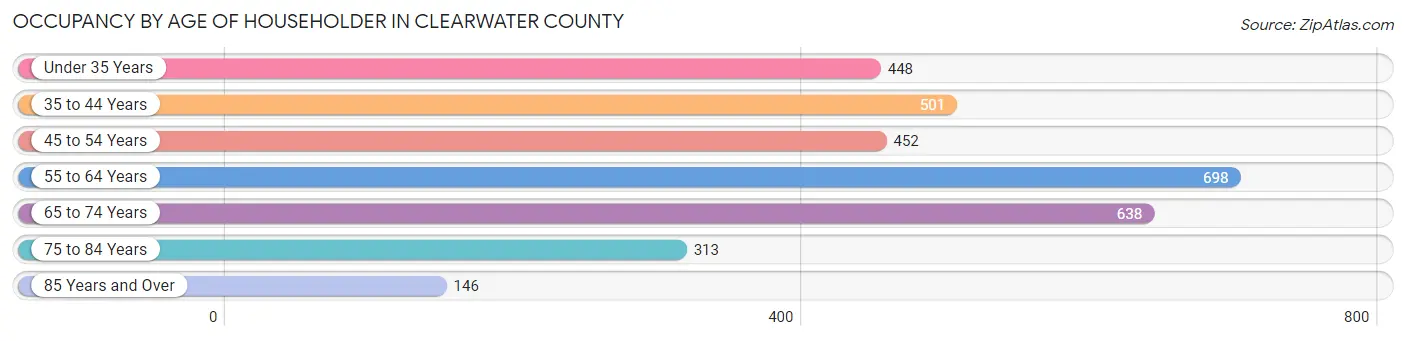
| Age Bracket | # Households | % Households |
| Under 35 Years | 448 | 14.0% |
| 35 to 44 Years | 501 | 15.7% |
| 45 to 54 Years | 452 | 14.1% |
| 55 to 64 Years | 698 | 21.8% |
| 65 to 74 Years | 638 | 20.0% |
| 75 to 84 Years | 313 | 9.8% |
| 85 Years and Over | 146 | 4.6% |
| Total | 3,196 | 100.0% |
Housing Finances in Clearwater County
Median Income by Occupancy in Clearwater County
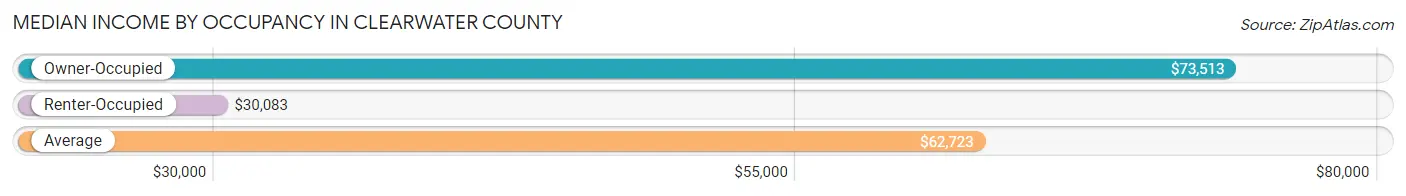
| Occupancy Type | # Households | Median Income |
| Owner-Occupied | 2,617 (81.9%) | $73,513 |
| Renter-Occupied | 579 (18.1%) | $30,083 |
| Average | 3,196 (100.0%) | $62,723 |
Occupancy by Householder Income Bracket in Clearwater County
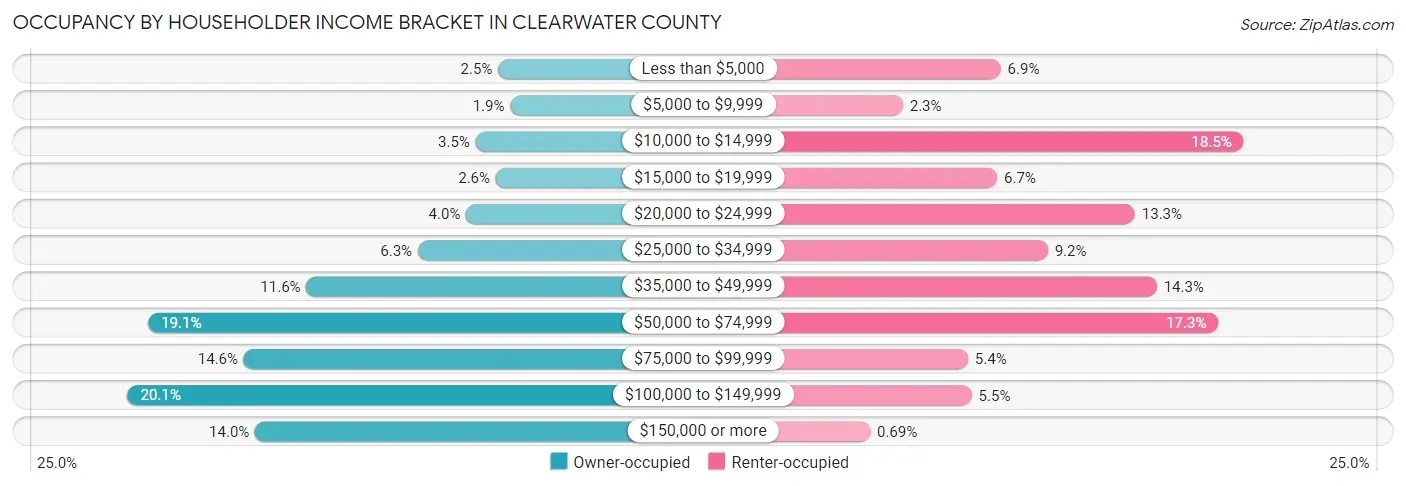
| Income Bracket | Owner-occupied | Renter-occupied |
| Less than $5,000 | 64 (2.5%) | 40 (6.9%) |
| $5,000 to $9,999 | 49 (1.9%) | 13 (2.2%) |
| $10,000 to $14,999 | 92 (3.5%) | 107 (18.5%) |
| $15,000 to $19,999 | 67 (2.6%) | 39 (6.7%) |
| $20,000 to $24,999 | 104 (4.0%) | 77 (13.3%) |
| $25,000 to $34,999 | 164 (6.3%) | 53 (9.1%) |
| $35,000 to $49,999 | 303 (11.6%) | 83 (14.3%) |
| $50,000 to $74,999 | 500 (19.1%) | 100 (17.3%) |
| $75,000 to $99,999 | 381 (14.6%) | 31 (5.3%) |
| $100,000 to $149,999 | 526 (20.1%) | 32 (5.5%) |
| $150,000 or more | 367 (14.0%) | 4 (0.7%) |
| Total | 2,617 (100.0%) | 579 (100.0%) |
Monthly Housing Cost Tiers in Clearwater County
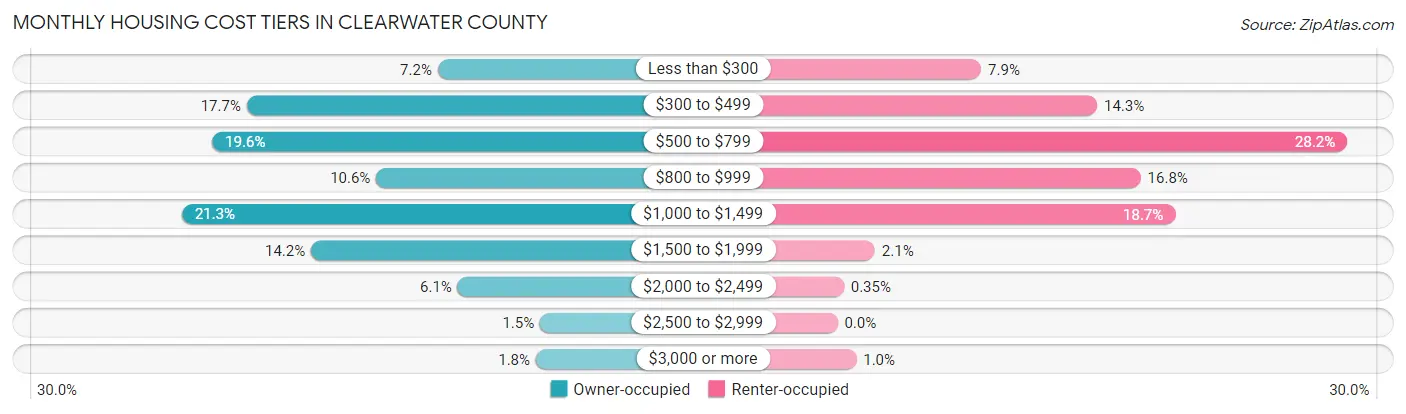
| Monthly Cost | Owner-occupied | Renter-occupied |
| Less than $300 | 188 (7.2%) | 46 (7.9%) |
| $300 to $499 | 464 (17.7%) | 83 (14.3%) |
| $500 to $799 | 514 (19.6%) | 163 (28.1%) |
| $800 to $999 | 277 (10.6%) | 97 (16.8%) |
| $1,000 to $1,499 | 558 (21.3%) | 108 (18.6%) |
| $1,500 to $1,999 | 371 (14.2%) | 12 (2.1%) |
| $2,000 to $2,499 | 159 (6.1%) | 2 (0.4%) |
| $2,500 to $2,999 | 40 (1.5%) | 0 (0.0%) |
| $3,000 or more | 46 (1.8%) | 6 (1.0%) |
| Total | 2,617 (100.0%) | 579 (100.0%) |
Physical Housing Characteristics in Clearwater County
Housing Structures in Clearwater County
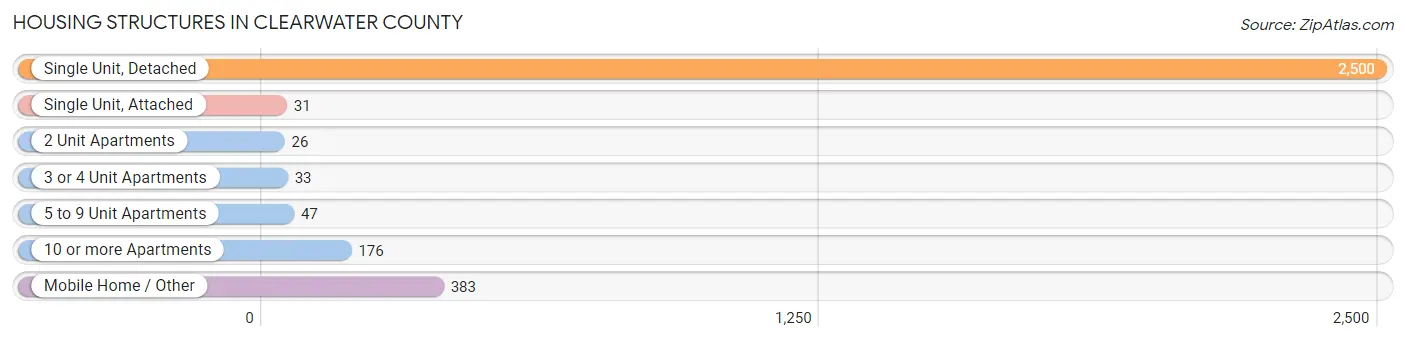
| Structure Type | # Housing Units | % Housing Units |
| Single Unit, Detached | 2,500 | 78.2% |
| Single Unit, Attached | 31 | 1.0% |
| 2 Unit Apartments | 26 | 0.8% |
| 3 or 4 Unit Apartments | 33 | 1.0% |
| 5 to 9 Unit Apartments | 47 | 1.5% |
| 10 or more Apartments | 176 | 5.5% |
| Mobile Home / Other | 383 | 12.0% |
| Total | 3,196 | 100.0% |
Housing Structures by Occupancy in Clearwater County
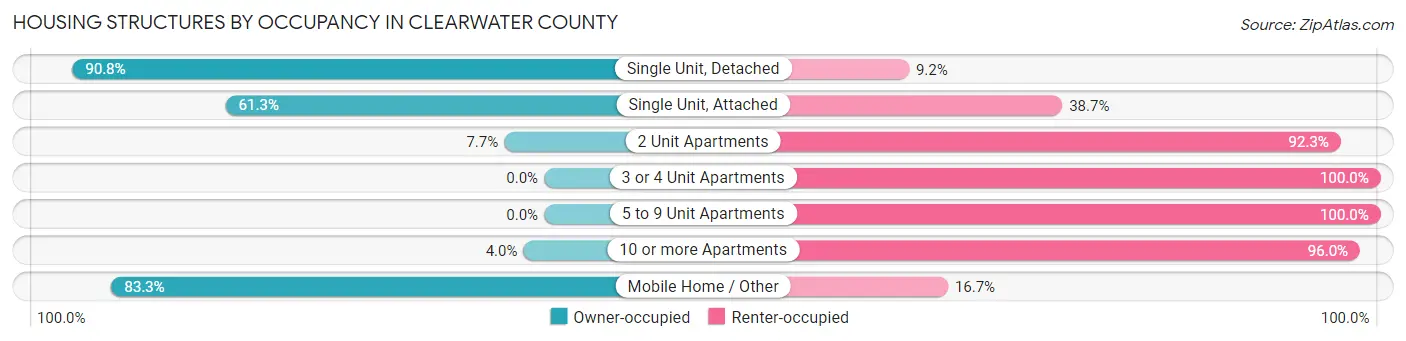
| Structure Type | Owner-occupied | Renter-occupied |
| Single Unit, Detached | 2,270 (90.8%) | 230 (9.2%) |
| Single Unit, Attached | 19 (61.3%) | 12 (38.7%) |
| 2 Unit Apartments | 2 (7.7%) | 24 (92.3%) |
| 3 or 4 Unit Apartments | 0 (0.0%) | 33 (100.0%) |
| 5 to 9 Unit Apartments | 0 (0.0%) | 47 (100.0%) |
| 10 or more Apartments | 7 (4.0%) | 169 (96.0%) |
| Mobile Home / Other | 319 (83.3%) | 64 (16.7%) |
| Total | 2,617 (81.9%) | 579 (18.1%) |
Housing Structures by Number of Rooms in Clearwater County
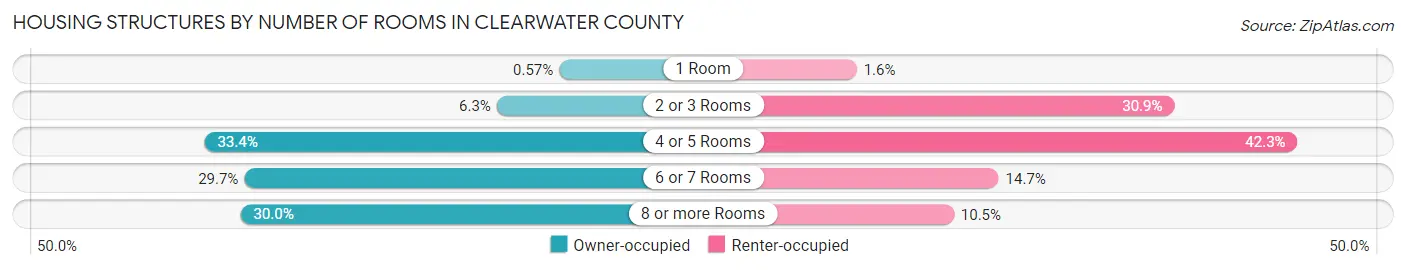
| Number of Rooms | Owner-occupied | Renter-occupied |
| 1 Room | 15 (0.6%) | 9 (1.5%) |
| 2 or 3 Rooms | 166 (6.3%) | 179 (30.9%) |
| 4 or 5 Rooms | 873 (33.4%) | 245 (42.3%) |
| 6 or 7 Rooms | 777 (29.7%) | 85 (14.7%) |
| 8 or more Rooms | 786 (30.0%) | 61 (10.5%) |
| Total | 2,617 (100.0%) | 579 (100.0%) |
Housing Structure by Heating Type in Clearwater County
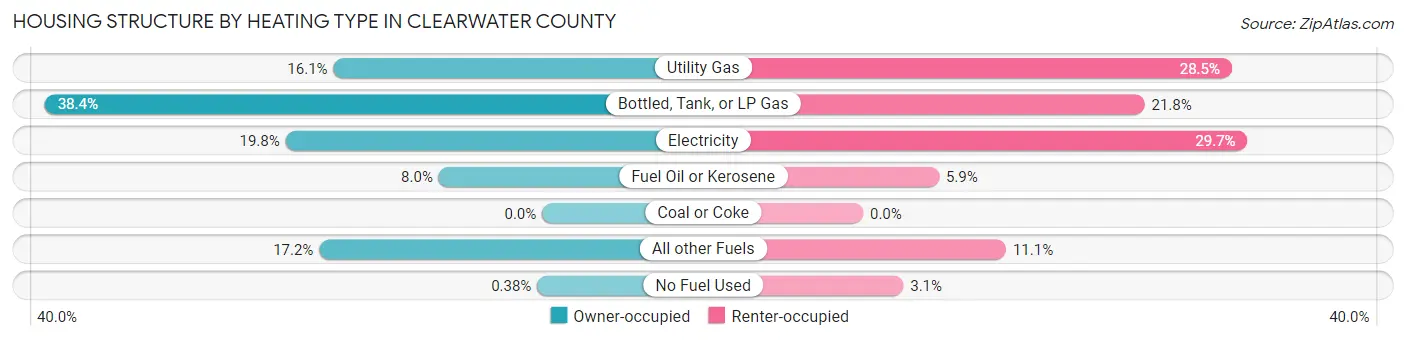
| Heating Type | Owner-occupied | Renter-occupied |
| Utility Gas | 422 (16.1%) | 165 (28.5%) |
| Bottled, Tank, or LP Gas | 1,006 (38.4%) | 126 (21.8%) |
| Electricity | 519 (19.8%) | 172 (29.7%) |
| Fuel Oil or Kerosene | 209 (8.0%) | 34 (5.9%) |
| Coal or Coke | 0 (0.0%) | 0 (0.0%) |
| All other Fuels | 451 (17.2%) | 64 (11.1%) |
| No Fuel Used | 10 (0.4%) | 18 (3.1%) |
| Total | 2,617 (100.0%) | 579 (100.0%) |
Household Vehicle Usage in Clearwater County
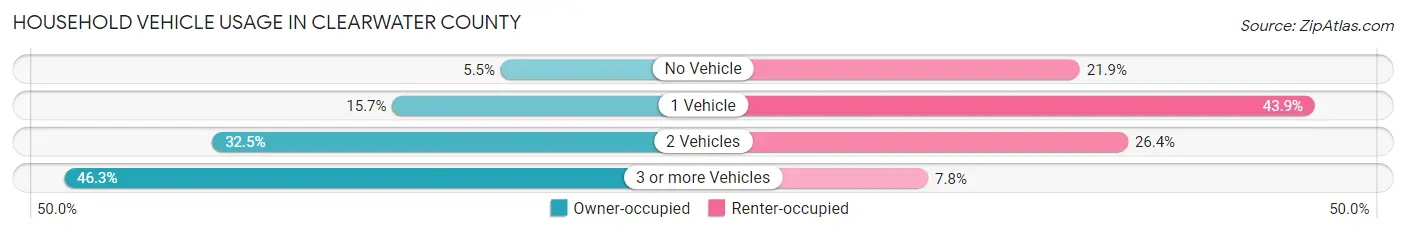
| Vehicles per Household | Owner-occupied | Renter-occupied |
| No Vehicle | 145 (5.5%) | 127 (21.9%) |
| 1 Vehicle | 410 (15.7%) | 254 (43.9%) |
| 2 Vehicles | 850 (32.5%) | 153 (26.4%) |
| 3 or more Vehicles | 1,212 (46.3%) | 45 (7.8%) |
| Total | 2,617 (100.0%) | 579 (100.0%) |
Real Estate & Mortgages in Clearwater County
Real Estate and Mortgage Overview in Clearwater County
| Characteristic | Without Mortgage | With Mortgage |
| Housing Units | 1,287 | 1,330 |
| Median Property Value | $141,400 | $176,200 |
| Median Household Income | $56,658 | $231 |
| Monthly Housing Costs | $506 | $41 |
| Real Estate Taxes | $1,190 | $26 |
Property Value by Mortgage Status in Clearwater County
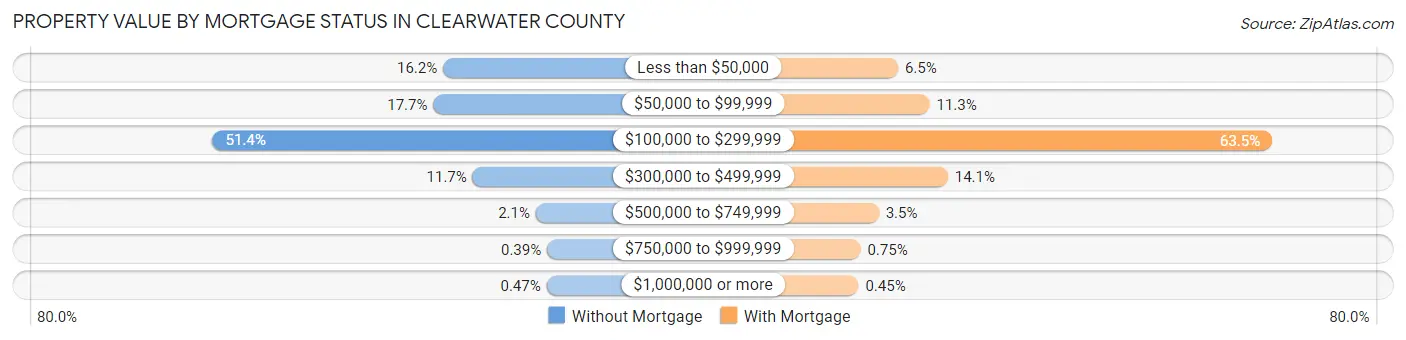
| Property Value | Without Mortgage | With Mortgage |
| Less than $50,000 | 209 (16.2%) | 86 (6.5%) |
| $50,000 to $99,999 | 228 (17.7%) | 150 (11.3%) |
| $100,000 to $299,999 | 661 (51.4%) | 844 (63.5%) |
| $300,000 to $499,999 | 151 (11.7%) | 187 (14.1%) |
| $500,000 to $749,999 | 27 (2.1%) | 47 (3.5%) |
| $750,000 to $999,999 | 5 (0.4%) | 10 (0.7%) |
| $1,000,000 or more | 6 (0.5%) | 6 (0.4%) |
| Total | 1,287 (100.0%) | 1,330 (100.0%) |
Household Income by Mortgage Status in Clearwater County
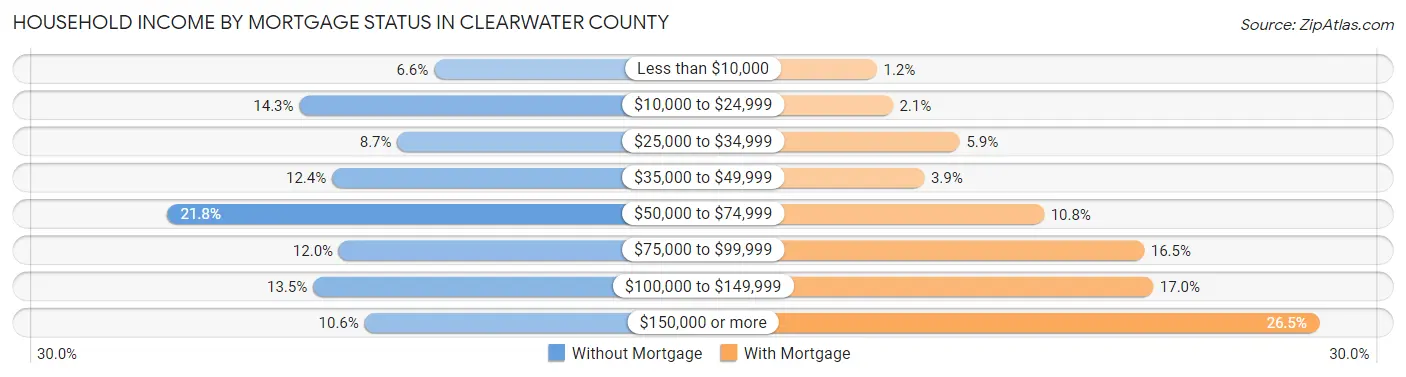
| Household Income | Without Mortgage | With Mortgage |
| Less than $10,000 | 85 (6.6%) | 16 (1.2%) |
| $10,000 to $24,999 | 184 (14.3%) | 28 (2.1%) |
| $25,000 to $34,999 | 112 (8.7%) | 79 (5.9%) |
| $35,000 to $49,999 | 160 (12.4%) | 52 (3.9%) |
| $50,000 to $74,999 | 281 (21.8%) | 143 (10.7%) |
| $75,000 to $99,999 | 155 (12.0%) | 219 (16.5%) |
| $100,000 to $149,999 | 174 (13.5%) | 226 (17.0%) |
| $150,000 or more | 136 (10.6%) | 352 (26.5%) |
| Total | 1,287 (100.0%) | 1,330 (100.0%) |
Property Value to Household Income Ratio in Clearwater County
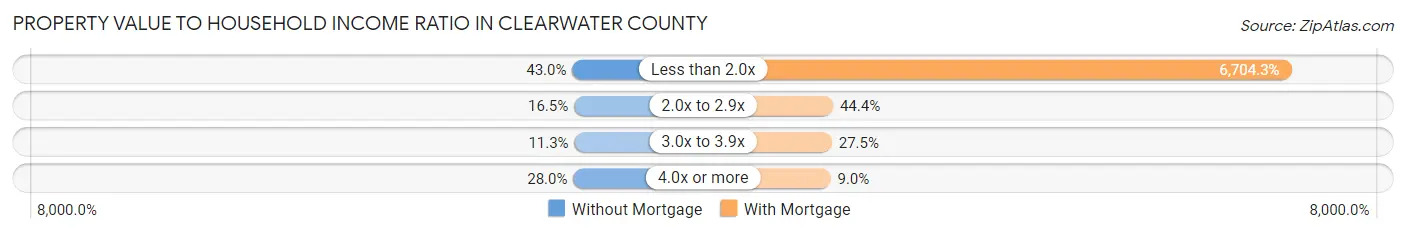
| Value-to-Income Ratio | Without Mortgage | With Mortgage |
| Less than 2.0x | 553 (43.0%) | 89,167 (6,704.3%) |
| 2.0x to 2.9x | 212 (16.5%) | 590 (44.4%) |
| 3.0x to 3.9x | 145 (11.3%) | 366 (27.5%) |
| 4.0x or more | 360 (28.0%) | 119 (8.9%) |
| Total | 1,287 (100.0%) | 1,330 (100.0%) |
Real Estate Taxes by Mortgage Status in Clearwater County
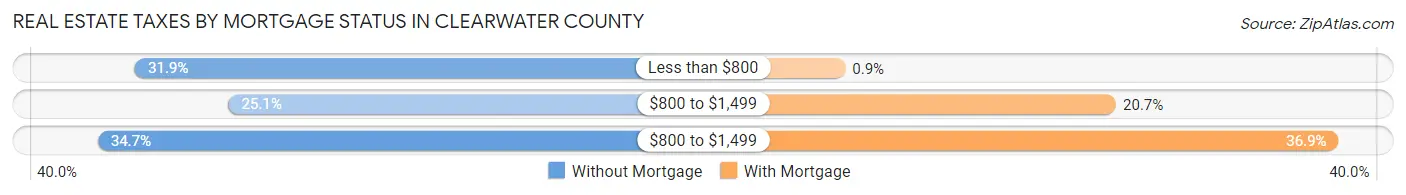
| Property Taxes | Without Mortgage | With Mortgage |
| Less than $800 | 411 (31.9%) | 12 (0.9%) |
| $800 to $1,499 | 323 (25.1%) | 275 (20.7%) |
| $800 to $1,499 | 446 (34.6%) | 491 (36.9%) |
| Total | 1,287 (100.0%) | 1,330 (100.0%) |
Health & Disability in Clearwater County
Health Insurance Coverage by Age in Clearwater County
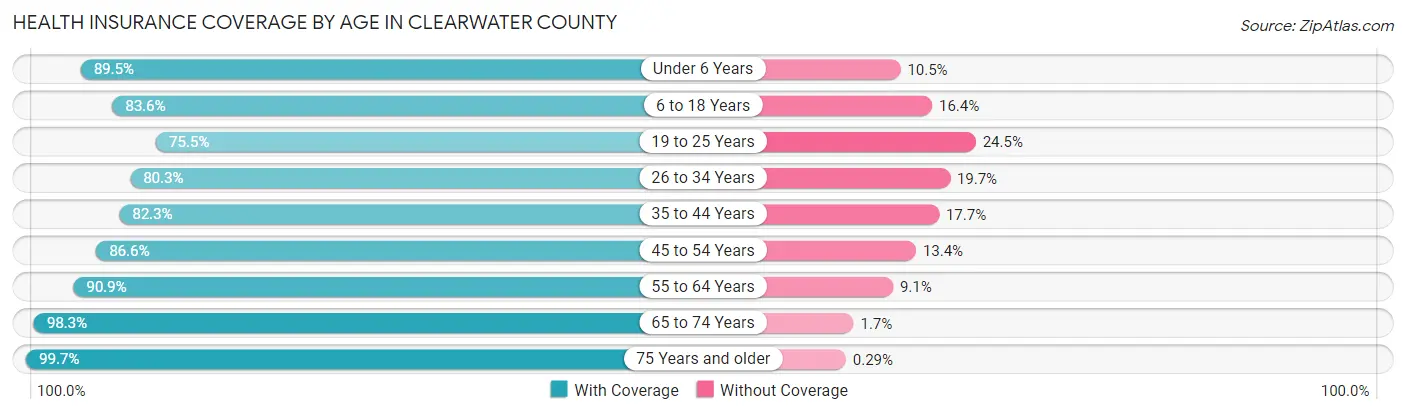
| Age Bracket | With Coverage | Without Coverage |
| Under 6 Years | 607 (89.5%) | 71 (10.5%) |
| 6 to 18 Years | 1,299 (83.6%) | 254 (16.4%) |
| 19 to 25 Years | 459 (75.5%) | 149 (24.5%) |
| 26 to 34 Years | 595 (80.3%) | 146 (19.7%) |
| 35 to 44 Years | 825 (82.3%) | 177 (17.7%) |
| 45 to 54 Years | 791 (86.6%) | 122 (13.4%) |
| 55 to 64 Years | 1,121 (90.9%) | 112 (9.1%) |
| 65 to 74 Years | 971 (98.3%) | 17 (1.7%) |
| 75 Years and older | 687 (99.7%) | 2 (0.3%) |
| Total | 7,355 (87.5%) | 1,050 (12.5%) |
Health Insurance Coverage by Citizenship Status in Clearwater County
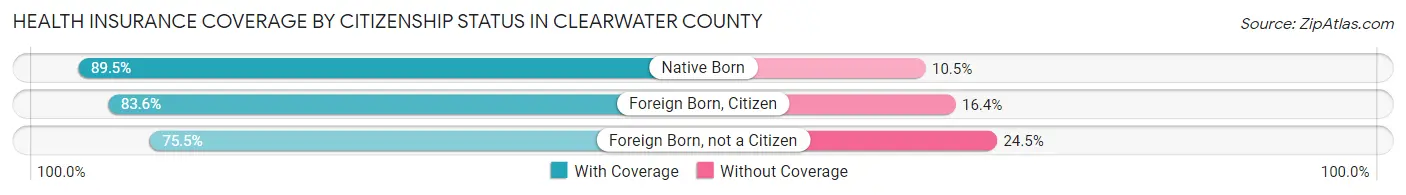
| Citizenship Status | With Coverage | Without Coverage |
| Native Born | 607 (89.5%) | 71 (10.5%) |
| Foreign Born, Citizen | 1,299 (83.6%) | 254 (16.4%) |
| Foreign Born, not a Citizen | 459 (75.5%) | 149 (24.5%) |
Health Insurance Coverage by Household Income in Clearwater County
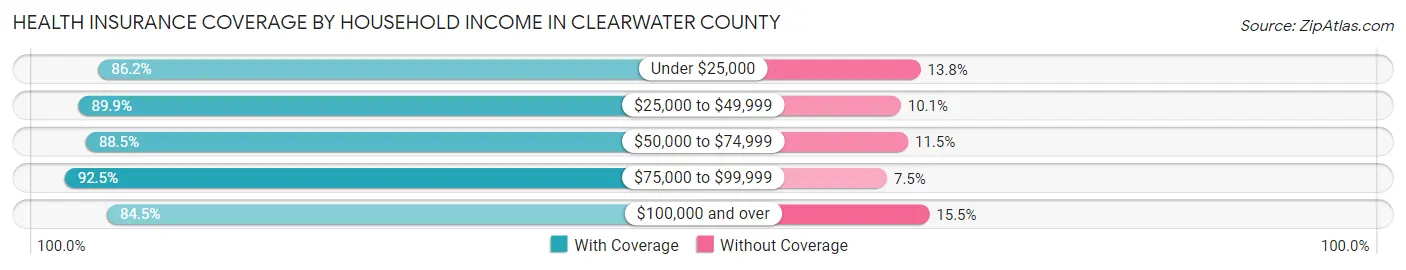
| Household Income | With Coverage | Without Coverage |
| Under $25,000 | 841 (86.2%) | 135 (13.8%) |
| $25,000 to $49,999 | 1,225 (89.9%) | 138 (10.1%) |
| $50,000 to $74,999 | 1,428 (88.5%) | 185 (11.5%) |
| $75,000 to $99,999 | 1,103 (92.5%) | 90 (7.5%) |
| $100,000 and over | 2,743 (84.5%) | 502 (15.5%) |
Public vs Private Health Insurance Coverage by Age in Clearwater County
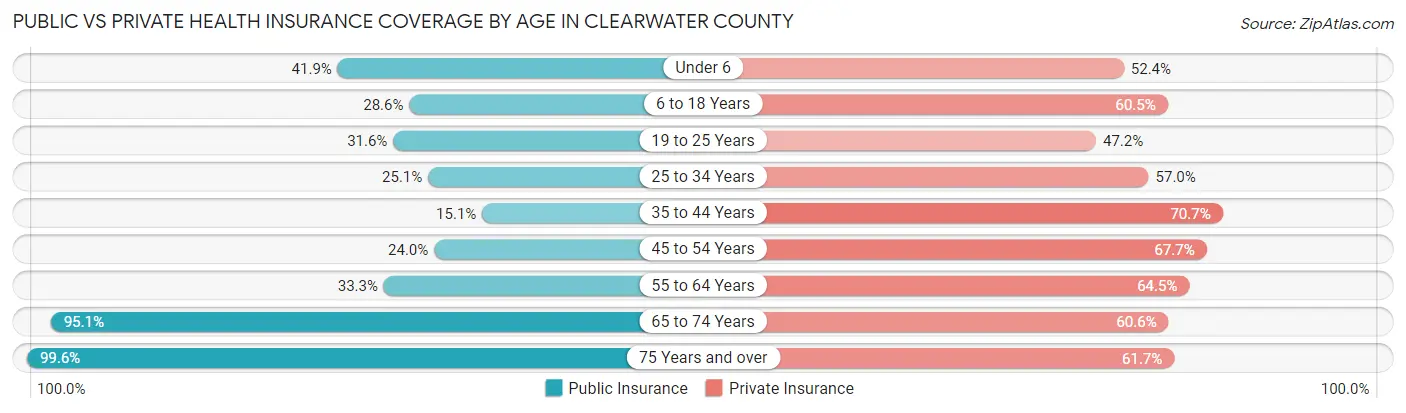
| Age Bracket | Public Insurance | Private Insurance |
| Under 6 | 284 (41.9%) | 355 (52.4%) |
| 6 to 18 Years | 444 (28.6%) | 939 (60.5%) |
| 19 to 25 Years | 192 (31.6%) | 287 (47.2%) |
| 25 to 34 Years | 186 (25.1%) | 422 (57.0%) |
| 35 to 44 Years | 151 (15.1%) | 708 (70.7%) |
| 45 to 54 Years | 219 (24.0%) | 618 (67.7%) |
| 55 to 64 Years | 411 (33.3%) | 795 (64.5%) |
| 65 to 74 Years | 940 (95.1%) | 599 (60.6%) |
| 75 Years and over | 686 (99.6%) | 425 (61.7%) |
| Total | 3,513 (41.8%) | 5,148 (61.3%) |
Disability Status by Sex by Age in Clearwater County
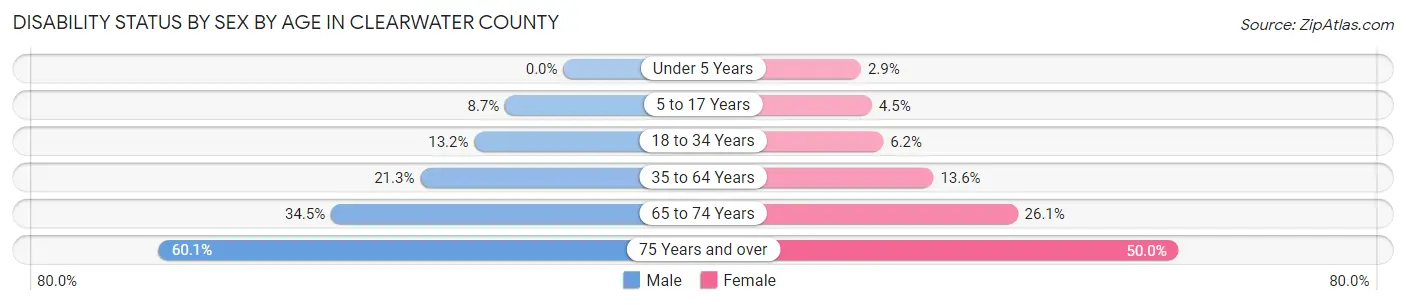
| Age Bracket | Male | Female |
| Under 5 Years | 0 (0.0%) | 8 (2.9%) |
| 5 to 17 Years | 69 (8.6%) | 36 (4.5%) |
| 18 to 34 Years | 102 (13.2%) | 42 (6.2%) |
| 35 to 64 Years | 341 (21.2%) | 210 (13.6%) |
| 65 to 74 Years | 177 (34.5%) | 124 (26.1%) |
| 75 Years and over | 188 (60.1%) | 188 (50.0%) |
Disability Class by Sex by Age in Clearwater County
Disability Class: Hearing Difficulty
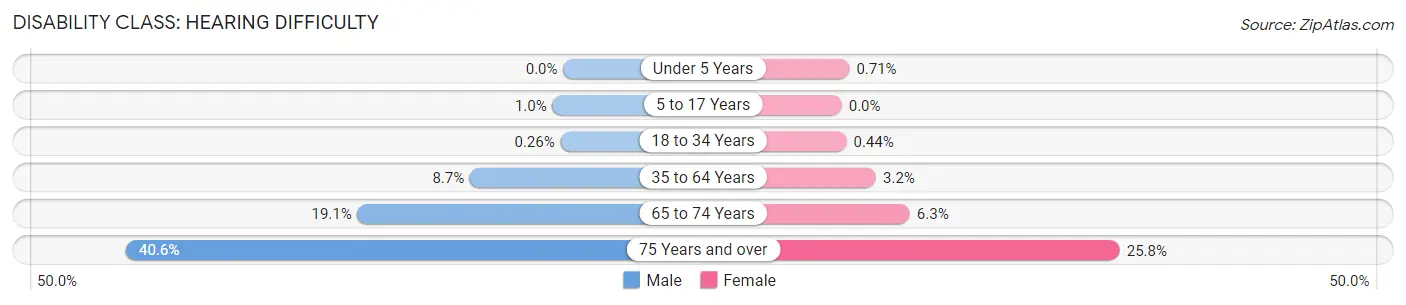
| Age Bracket | Male | Female |
| Under 5 Years | 0 (0.0%) | 2 (0.7%) |
| 5 to 17 Years | 8 (1.0%) | 0 (0.0%) |
| 18 to 34 Years | 2 (0.3%) | 3 (0.4%) |
| 35 to 64 Years | 139 (8.7%) | 49 (3.2%) |
| 65 to 74 Years | 98 (19.1%) | 30 (6.3%) |
| 75 Years and over | 127 (40.6%) | 97 (25.8%) |
Disability Class: Vision Difficulty
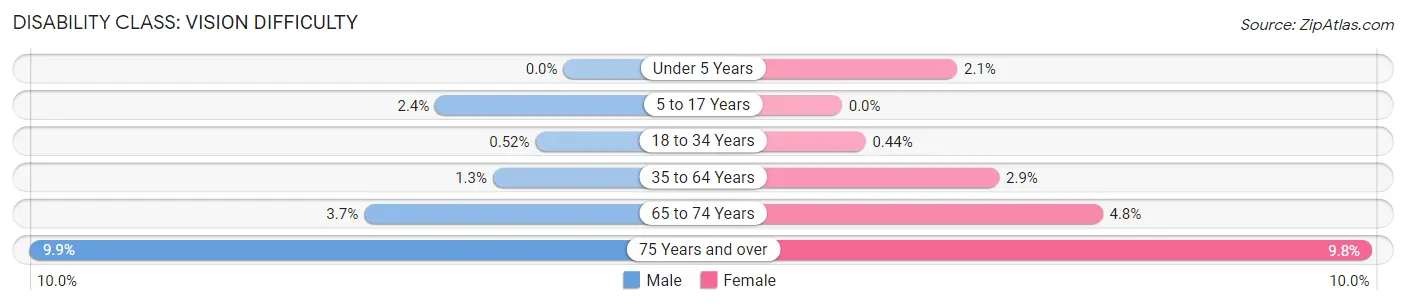
| Age Bracket | Male | Female |
| Under 5 Years | 0 (0.0%) | 6 (2.1%) |
| 5 to 17 Years | 19 (2.4%) | 0 (0.0%) |
| 18 to 34 Years | 4 (0.5%) | 3 (0.4%) |
| 35 to 64 Years | 21 (1.3%) | 45 (2.9%) |
| 65 to 74 Years | 19 (3.7%) | 23 (4.8%) |
| 75 Years and over | 31 (9.9%) | 37 (9.8%) |
Disability Class: Cognitive Difficulty
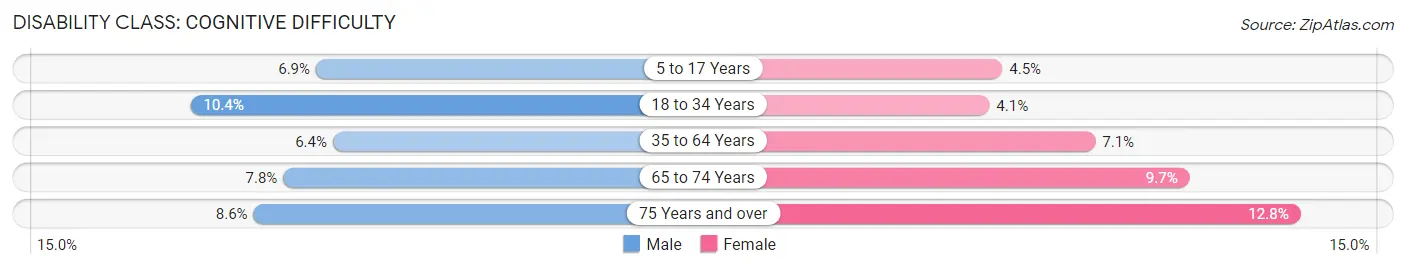
| Age Bracket | Male | Female |
| 5 to 17 Years | 55 (6.9%) | 36 (4.5%) |
| 18 to 34 Years | 80 (10.4%) | 28 (4.1%) |
| 35 to 64 Years | 103 (6.4%) | 109 (7.1%) |
| 65 to 74 Years | 40 (7.8%) | 46 (9.7%) |
| 75 Years and over | 27 (8.6%) | 48 (12.8%) |
Disability Class: Ambulatory Difficulty
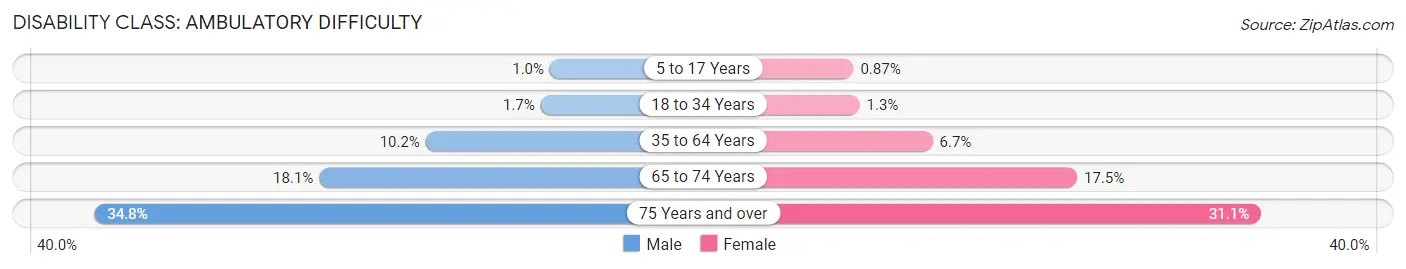
| Age Bracket | Male | Female |
| 5 to 17 Years | 8 (1.0%) | 7 (0.9%) |
| 18 to 34 Years | 13 (1.7%) | 9 (1.3%) |
| 35 to 64 Years | 164 (10.2%) | 104 (6.7%) |
| 65 to 74 Years | 93 (18.1%) | 83 (17.5%) |
| 75 Years and over | 109 (34.8%) | 117 (31.1%) |
Disability Class: Self-Care Difficulty
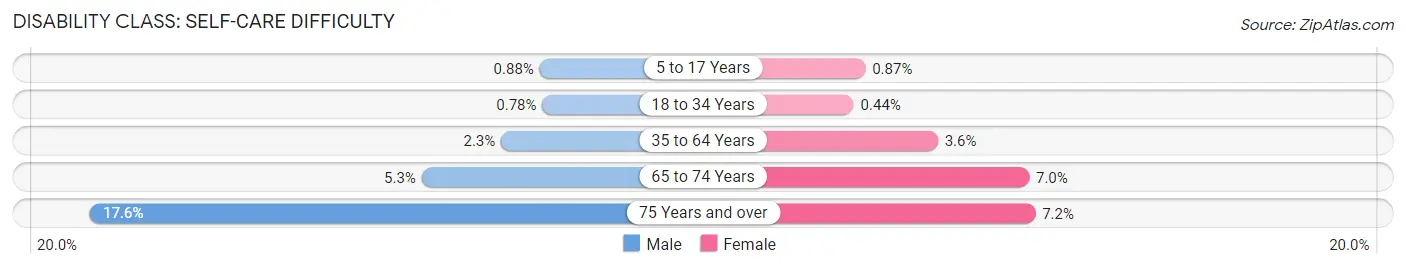
| Age Bracket | Male | Female |
| 5 to 17 Years | 7 (0.9%) | 7 (0.9%) |
| 18 to 34 Years | 6 (0.8%) | 3 (0.4%) |
| 35 to 64 Years | 37 (2.3%) | 55 (3.6%) |
| 65 to 74 Years | 27 (5.3%) | 33 (7.0%) |
| 75 Years and over | 55 (17.6%) | 27 (7.2%) |
Technology Access in Clearwater County
Computing Device Access in Clearwater County
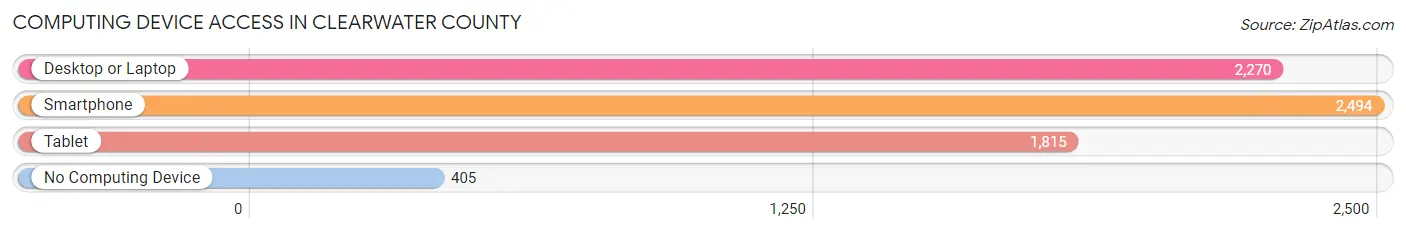
| Device Type | # Households | % Households |
| Desktop or Laptop | 2,270 | 71.0% |
| Smartphone | 2,494 | 78.0% |
| Tablet | 1,815 | 56.8% |
| No Computing Device | 405 | 12.7% |
| Total | 3,196 | 100.0% |
Internet Access in Clearwater County
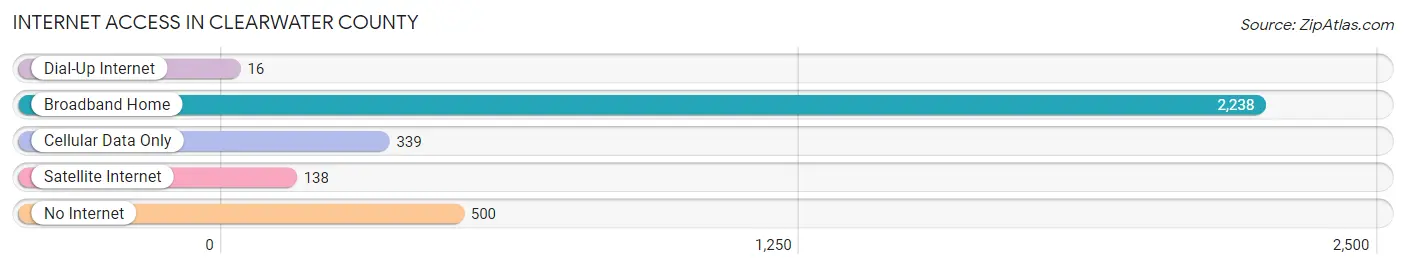
| Internet Type | # Households | % Households |
| Dial-Up Internet | 16 | 0.5% |
| Broadband Home | 2,238 | 70.0% |
| Cellular Data Only | 339 | 10.6% |
| Satellite Internet | 138 | 4.3% |
| No Internet | 500 | 15.6% |
| Total | 3,196 | 100.0% |
Clearwater County Summary
Clearwater County is located in the north-central region of Minnesota, and is part of the Red River Valley. It is bordered by Mahnomen County to the north, Becker County to the east, Wadena County to the south, and Hubbard County to the west. The county seat is Bagley, and the county has a total area of 845 square miles.
History
Clearwater County was established in 1894 and was named after the Clearwater River, which runs through the county. The county was originally inhabited by the Ojibwe people, who were later displaced by European settlers. The first settlers arrived in the area in the late 1800s, and the county was officially organized in 1894.
The county was initially an agricultural area, with the main crops being wheat, oats, and potatoes. In the early 1900s, the county experienced a population boom due to the logging industry. Logging was the main industry in the county until the 1950s, when the industry began to decline.
Geography
Clearwater County is located in the north-central region of Minnesota, and is part of the Red River Valley. The county is bordered by Mahnomen County to the north, Becker County to the east, Wadena County to the south, and Hubbard County to the west. The county has a total area of 845 square miles, and is mostly covered by forests and wetlands. The Clearwater River runs through the county, and there are several lakes, including Big Rice Lake, Little Rice Lake, and Clearwater Lake.
The county has a humid continental climate, with cold winters and warm summers. The average temperature in the county is around 40 degrees Fahrenheit, and the average annual precipitation is around 28 inches.
Economy
The economy of Clearwater County is largely based on agriculture and tourism. The main crops grown in the county are wheat, oats, and potatoes. The county also has a thriving tourism industry, with many visitors coming to the area to enjoy the lakes and forests.
The county also has a growing manufacturing sector, with several companies located in the area. The largest employers in the county are the Clearwater County Hospital, the Clearwater County School District, and the Clearwater County Sheriff's Office.
Demographics
As of the 2010 census, the population of Clearwater County was 8,695. The population is mostly white (94.3%), with small percentages of Native American (2.2%), African American (0.7%), and Asian (0.4%) populations. The median household income in the county is $41,945, and the median age is 44.
Clearwater County is a rural area, with most of the population living in small towns and villages. The largest city in the county is Bagley, with a population of 1,845. Other cities in the county include Clearbrook, Shevlin, and Leonard.
Common Questions
What is Per Capita Income in Clearwater County?
Per Capita income in Clearwater County is $31,879.
What is the Median Family Income in Clearwater County?
Median Family Income in Clearwater County is $79,342.
What is the Median Household income in Clearwater County?
Median Household Income in Clearwater County is $62,723.
What is Income or Wage Gap in Clearwater County?
Income or Wage Gap in Clearwater County is 34.1%.
Women in Clearwater County earn 65.9 cents for every dollar earned by a man.
What is Family Income Deficit in Clearwater County?
Family Income Deficit in Clearwater County is $8,107.
Families that are below poverty line in Clearwater County earn $8,107 less on average than the poverty threshold level.
What is Inequality or Gini Index in Clearwater County?
Inequality or Gini Index in Clearwater County is 0.45.
What is the Total Population of Clearwater County?
Total Population of Clearwater County is 8,541.
What is the Total Male Population of Clearwater County?
Total Male Population of Clearwater County is 4,314.
What is the Total Female Population of Clearwater County?
Total Female Population of Clearwater County is 4,227.
What is the Ratio of Males per 100 Females in Clearwater County?
There are 102.06 Males per 100 Females in Clearwater County.
What is the Ratio of Females per 100 Males in Clearwater County?
There are 97.98 Females per 100 Males in Clearwater County.
What is the Median Population Age in Clearwater County?
Median Population Age in Clearwater County is 41.6 Years.
What is the Average Family Size in Clearwater County
Average Family Size in Clearwater County is 3.2 People.
What is the Average Household Size in Clearwater County
Average Household Size in Clearwater County is 2.6 People.
How Large is the Labor Force in Clearwater County?
There are 3,927 People in the Labor Forcein in Clearwater County.
What is the Percentage of People in the Labor Force in Clearwater County?
59.1% of People are in the Labor Force in Clearwater County.
What is the Unemployment Rate in Clearwater County?
Unemployment Rate in Clearwater County is 7.6%.