Browerville, MN Map & Demographics
Browerville Map
Browerville Overview
$23,443
PER CAPITA INCOME
$62,500
AVG FAMILY INCOME
$44,671
AVG HOUSEHOLD INCOME
17.3%
WAGE / INCOME GAP [ % ]
82.7¢/ $1
WAGE / INCOME GAP [ $ ]
0.44
INEQUALITY / GINI INDEX
899
TOTAL POPULATION
498
MALE POPULATION
401
FEMALE POPULATION
124.19
MALES / 100 FEMALES
80.52
FEMALES / 100 MALES
38.1
MEDIAN AGE
3.4
AVG FAMILY SIZE
2.4
AVG HOUSEHOLD SIZE
416
LABOR FORCE [ PEOPLE ]
59.6%
PERCENT IN LABOR FORCE
11.3%
UNEMPLOYMENT RATE
Browerville Zip Codes
Browerville Area Codes
Income in Browerville
Income Overview in Browerville
Per Capita Income in Browerville is $23,443, while median incomes of families and households are $62,500 and $44,671 respectively.
| Characteristic | Number | Measure |
| Per Capita Income | 899 | $23,443 |
| Median Family Income | 184 | $62,500 |
| Mean Family Income | 184 | $79,335 |
| Median Household Income | 365 | $44,671 |
| Mean Household Income | 365 | $54,558 |
| Income Deficit | 184 | $0 |
| Wage / Income Gap (%) | 899 | 17.33% |
| Wage / Income Gap ($) | 899 | 82.67¢ per $1 |
| Gini / Inequality Index | 899 | 0.44 |
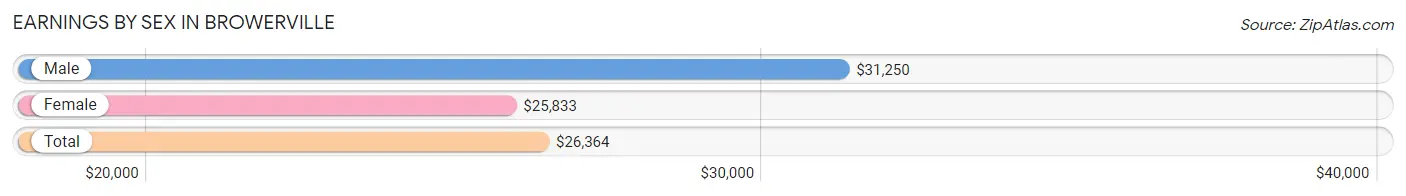
Earnings by Sex in Browerville
Average Earnings in Browerville are $26,364, $31,250 for men and $25,833 for women, a difference of 17.3%.
| Sex | Number | Average Earnings |
| Male | 232 (55.8%) | $31,250 |
| Female | 184 (44.2%) | $25,833 |
| Total | 416 (100.0%) | $26,364 |
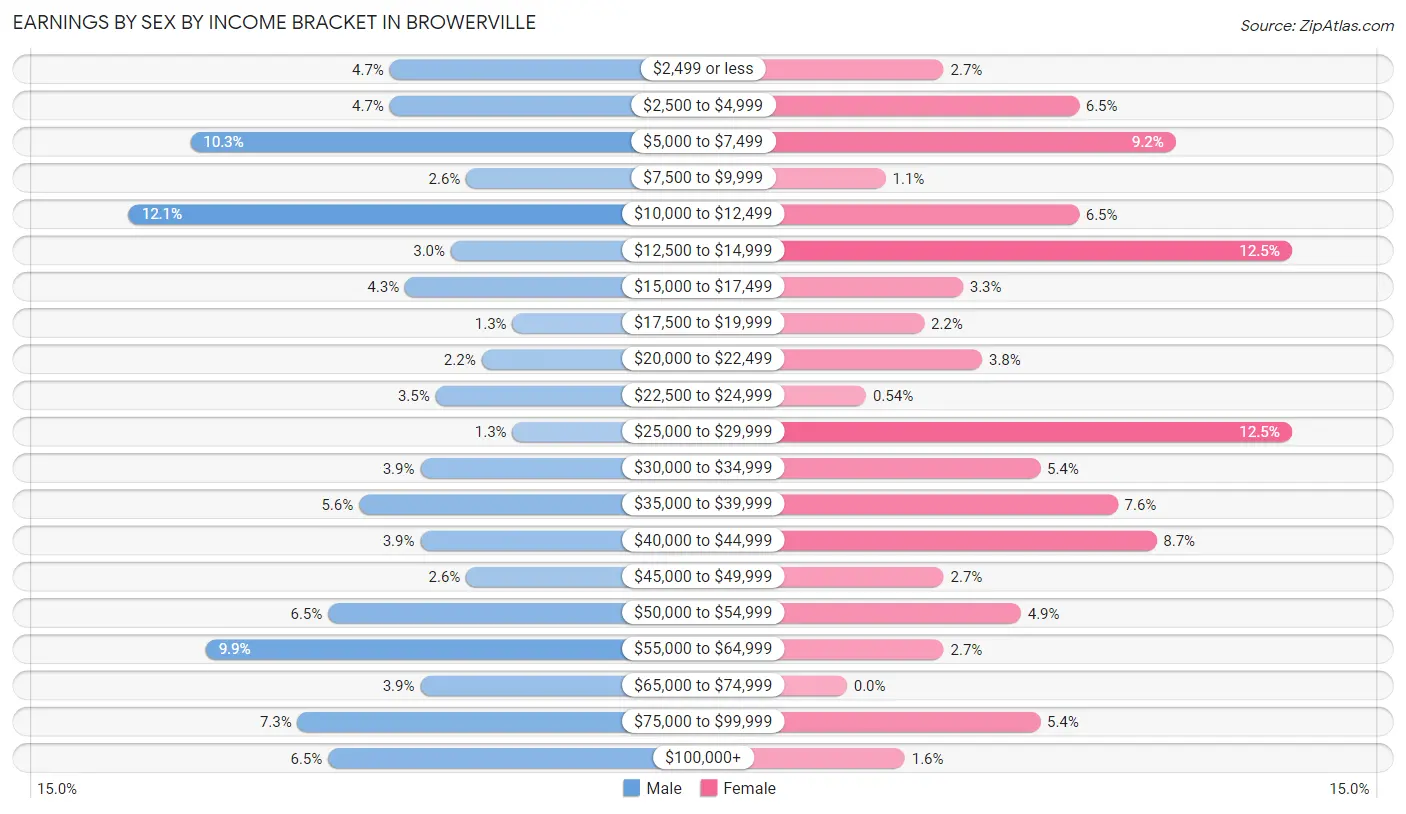
Earnings by Sex by Income Bracket in Browerville
The most common earnings brackets in Browerville are $10,000 to $12,499 for men (28 | 12.1%) and $12,500 to $14,999 for women (23 | 12.5%).
| Income | Male | Female |
| $2,499 or less | 11 (4.7%) | 5 (2.7%) |
| $2,500 to $4,999 | 11 (4.7%) | 12 (6.5%) |
| $5,000 to $7,499 | 24 (10.3%) | 17 (9.2%) |
| $7,500 to $9,999 | 6 (2.6%) | 2 (1.1%) |
| $10,000 to $12,499 | 28 (12.1%) | 12 (6.5%) |
| $12,500 to $14,999 | 7 (3.0%) | 23 (12.5%) |
| $15,000 to $17,499 | 10 (4.3%) | 6 (3.3%) |
| $17,500 to $19,999 | 3 (1.3%) | 4 (2.2%) |
| $20,000 to $22,499 | 5 (2.2%) | 7 (3.8%) |
| $22,500 to $24,999 | 8 (3.5%) | 1 (0.5%) |
| $25,000 to $29,999 | 3 (1.3%) | 23 (12.5%) |
| $30,000 to $34,999 | 9 (3.9%) | 10 (5.4%) |
| $35,000 to $39,999 | 13 (5.6%) | 14 (7.6%) |
| $40,000 to $44,999 | 9 (3.9%) | 16 (8.7%) |
| $45,000 to $49,999 | 6 (2.6%) | 5 (2.7%) |
| $50,000 to $54,999 | 15 (6.5%) | 9 (4.9%) |
| $55,000 to $64,999 | 23 (9.9%) | 5 (2.7%) |
| $65,000 to $74,999 | 9 (3.9%) | 0 (0.0%) |
| $75,000 to $99,999 | 17 (7.3%) | 10 (5.4%) |
| $100,000+ | 15 (6.5%) | 3 (1.6%) |
| Total | 232 (100.0%) | 184 (100.0%) |
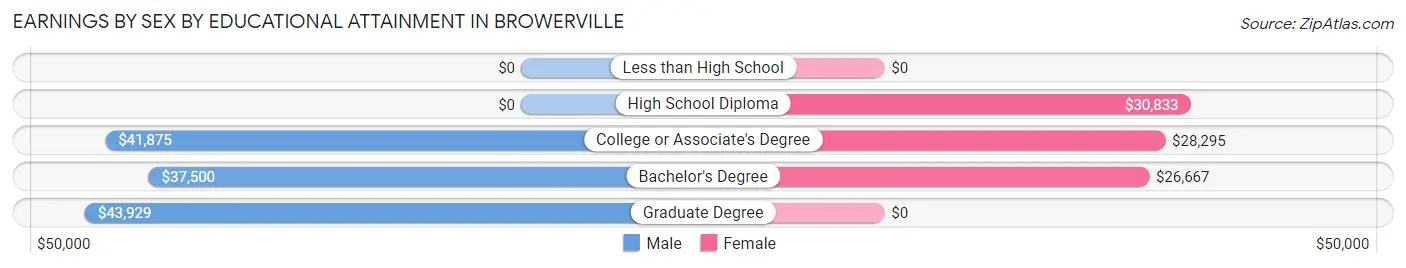
Earnings by Sex by Educational Attainment in Browerville
Average earnings in Browerville are $37,344 for men and $28,571 for women, a difference of 23.5%. Men with an educational attainment of graduate degree enjoy the highest average annual earnings of $43,929, while those with bachelor's degree education earn the least with $37,500. Women with an educational attainment of high school diploma earn the most with the average annual earnings of $30,833, while those with bachelor's degree education have the smallest earnings of $26,667.
| Educational Attainment | Male Income | Female Income |
| Less than High School | - | - |
| High School Diploma | - | - |
| College or Associate's Degree | $41,875 | $28,295 |
| Bachelor's Degree | $37,500 | $26,667 |
| Graduate Degree | $43,929 | $0 |
| Total | $37,344 | $28,571 |
Family Income in Browerville
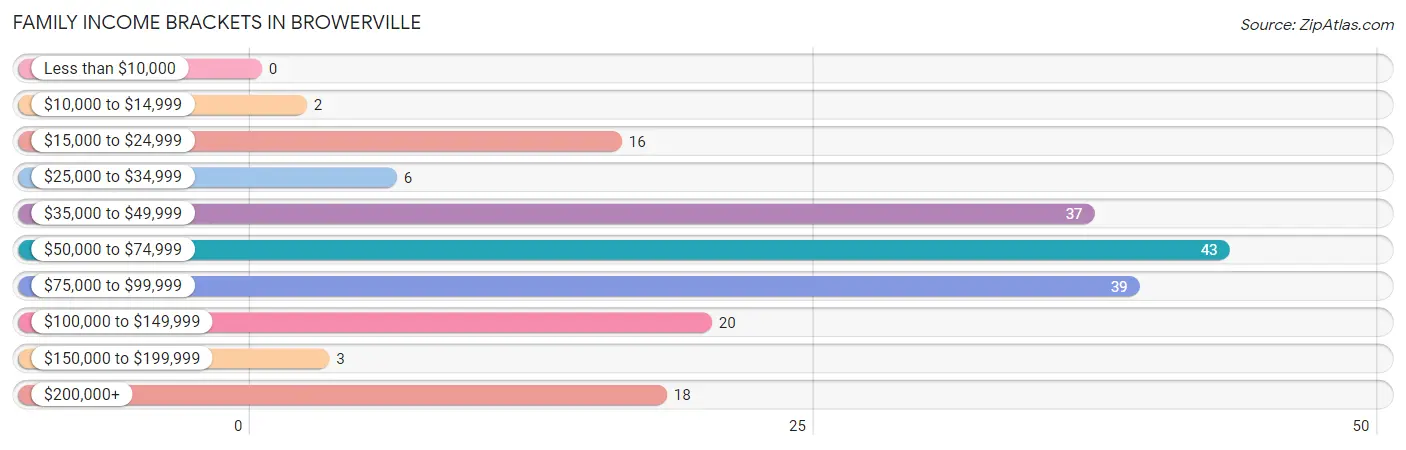
Family Income Brackets in Browerville
According to the Browerville family income data, there are 43 families falling into the $50,000 to $74,999 income range, which is the most common income bracket and makes up 23.4% of all families.
| Income Bracket | # Families | % Families |
| Less than $10,000 | 0 | 0.0% |
| $10,000 to $14,999 | 2 | 1.1% |
| $15,000 to $24,999 | 16 | 8.7% |
| $25,000 to $34,999 | 6 | 3.3% |
| $35,000 to $49,999 | 37 | 20.1% |
| $50,000 to $74,999 | 43 | 23.4% |
| $75,000 to $99,999 | 39 | 21.2% |
| $100,000 to $149,999 | 20 | 10.9% |
| $150,000 to $199,999 | 3 | 1.6% |
| $200,000+ | 18 | 9.8% |
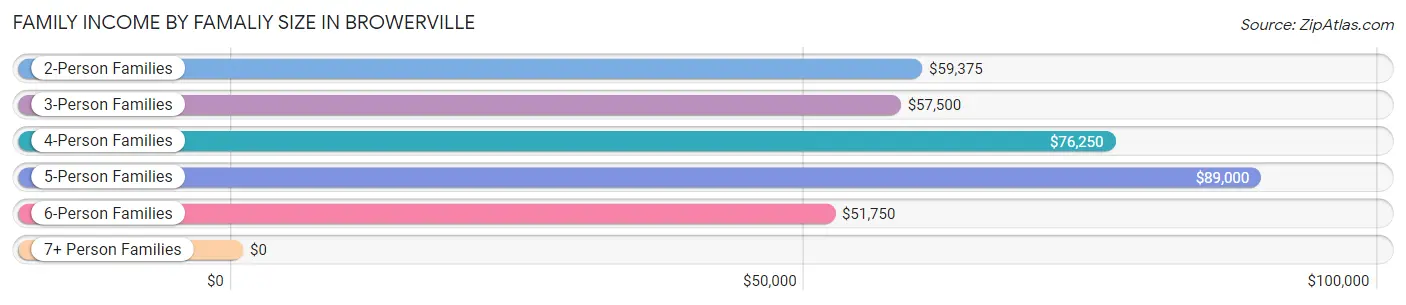
Family Income by Famaliy Size in Browerville
5-person families (10 | 5.4%) account for the highest median family income in Browerville with $89,000 per family, while 2-person families (73 | 39.7%) have the highest median income of $29,688 per family member.
| Income Bracket | # Families | Median Income |
| 2-Person Families | 73 (39.7%) | $59,375 |
| 3-Person Families | 38 (20.6%) | $57,500 |
| 4-Person Families | 45 (24.5%) | $76,250 |
| 5-Person Families | 10 (5.4%) | $89,000 |
| 6-Person Families | 15 (8.2%) | $51,750 |
| 7+ Person Families | 3 (1.6%) | $0 |
| Total | 184 (100.0%) | $62,500 |
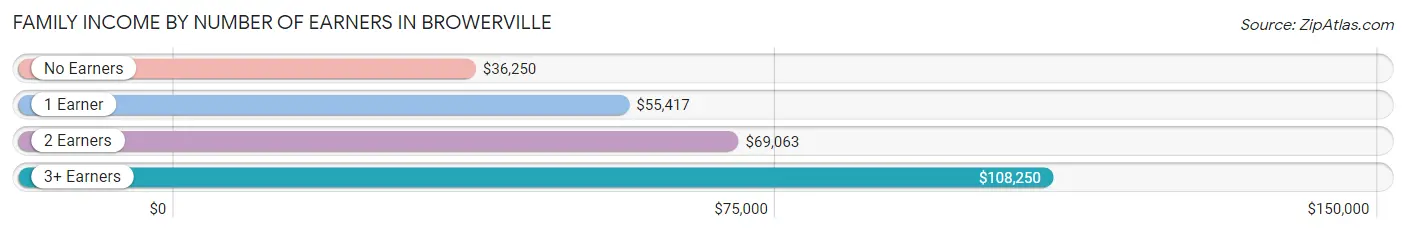
Family Income by Number of Earners in Browerville
The median family income in Browerville is $62,500, with families comprising 3+ earners (27) having the highest median family income of $108,250, while families with no earners (30) have the lowest median family income of $36,250, accounting for 14.7% and 16.3% of families, respectively.
| Number of Earners | # Families | Median Income |
| No Earners | 30 (16.3%) | $36,250 |
| 1 Earner | 58 (31.5%) | $55,417 |
| 2 Earners | 69 (37.5%) | $69,063 |
| 3+ Earners | 27 (14.7%) | $108,250 |
| Total | 184 (100.0%) | $62,500 |
Household Income in Browerville
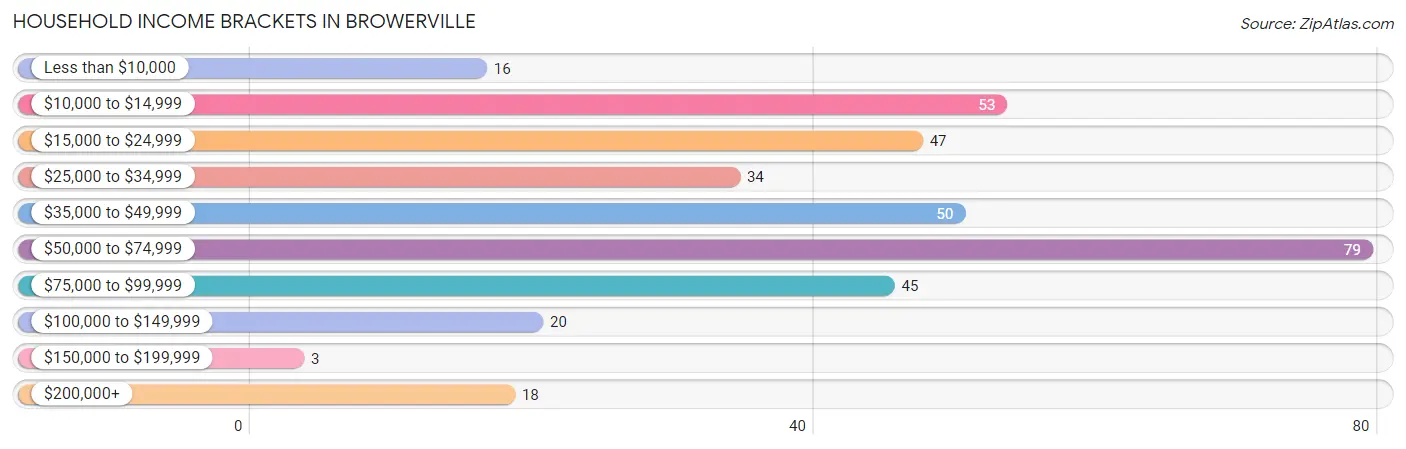
Household Income Brackets in Browerville
With 79 households falling in the category, the $50,000 to $74,999 income range is the most frequent in Browerville, accounting for 21.6% of all households. In contrast, only 3 households (0.8%) fall into the $150,000 to $199,999 income bracket, making it the least populous group.
| Income Bracket | # Households | % Households |
| Less than $10,000 | 16 | 4.4% |
| $10,000 to $14,999 | 53 | 14.5% |
| $15,000 to $24,999 | 47 | 12.9% |
| $25,000 to $34,999 | 34 | 9.3% |
| $35,000 to $49,999 | 50 | 13.7% |
| $50,000 to $74,999 | 79 | 21.6% |
| $75,000 to $99,999 | 45 | 12.3% |
| $100,000 to $149,999 | 20 | 5.5% |
| $150,000 to $199,999 | 3 | 0.8% |
| $200,000+ | 18 | 4.9% |
Household Income by Householder Age in Browerville
The median household income in Browerville is $44,671, with the highest median household income of $51,667 found in the 45 to 64 years age bracket for the primary householder. A total of 98 households (26.9%) fall into this category. Meanwhile, the 15 to 24 years age bracket for the primary householder has the lowest median household income of $13,750, with 32 households (8.8%) in this group.
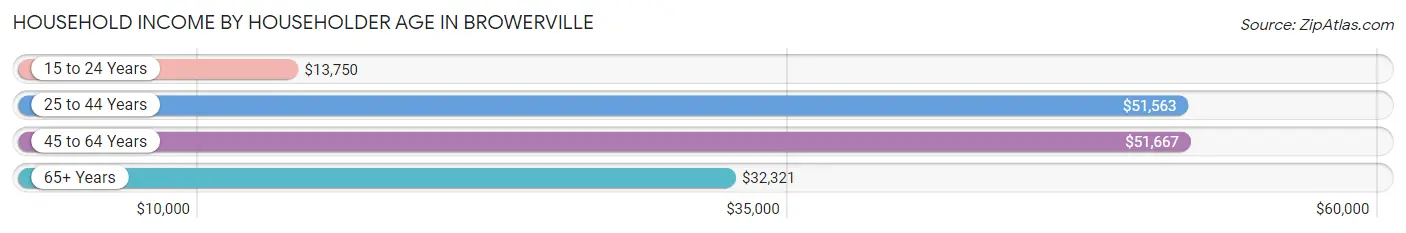
| Income Bracket | # Households | Median Income |
| 15 to 24 Years | 32 (8.8%) | $13,750 |
| 25 to 44 Years | 134 (36.7%) | $51,563 |
| 45 to 64 Years | 98 (26.9%) | $51,667 |
| 65+ Years | 101 (27.7%) | $32,321 |
| Total | 365 (100.0%) | $44,671 |
Poverty in Browerville
Income Below Poverty by Sex and Age in Browerville
With 9.2% poverty level for males and 25.8% for females among the residents of Browerville, 16 and 17 year old males and 16 and 17 year old females are the most vulnerable to poverty, with 8 males (27.6%) and 28 females (71.8%) in their respective age groups living below the poverty level.
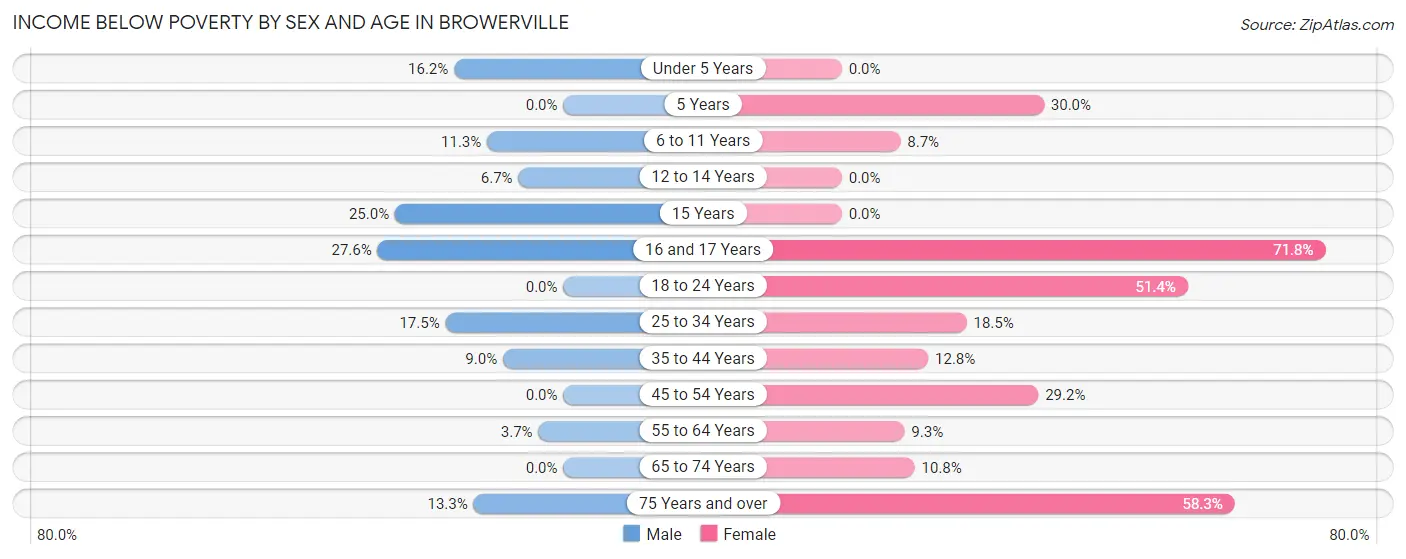
| Age Bracket | Male | Female |
| Under 5 Years | 6 (16.2%) | 0 (0.0%) |
| 5 Years | 0 (0.0%) | 3 (30.0%) |
| 6 to 11 Years | 6 (11.3%) | 2 (8.7%) |
| 12 to 14 Years | 2 (6.7%) | 0 (0.0%) |
| 15 Years | 3 (25.0%) | 0 (0.0%) |
| 16 and 17 Years | 8 (27.6%) | 28 (71.8%) |
| 18 to 24 Years | 0 (0.0%) | 19 (51.3%) |
| 25 to 34 Years | 7 (17.5%) | 5 (18.5%) |
| 35 to 44 Years | 6 (9.0%) | 10 (12.8%) |
| 45 to 54 Years | 0 (0.0%) | 14 (29.2%) |
| 55 to 64 Years | 2 (3.7%) | 4 (9.3%) |
| 65 to 74 Years | 0 (0.0%) | 4 (10.8%) |
| 75 Years and over | 6 (13.3%) | 14 (58.3%) |
| Total | 46 (9.2%) | 103 (25.8%) |
Income Above Poverty by Sex and Age in Browerville
According to the poverty statistics in Browerville, males aged 5 years and females aged under 5 years are the age groups that are most secure financially, with 100.0% of males and 100.0% of females in these age groups living above the poverty line.
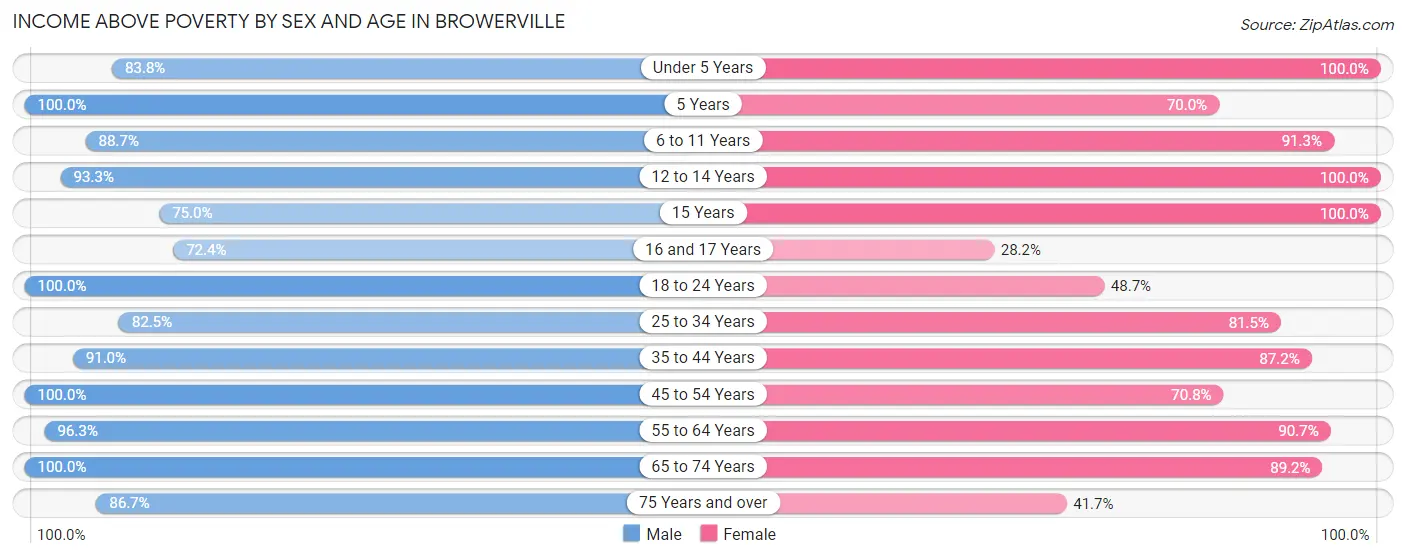
| Age Bracket | Male | Female |
| Under 5 Years | 31 (83.8%) | 18 (100.0%) |
| 5 Years | 1 (100.0%) | 7 (70.0%) |
| 6 to 11 Years | 47 (88.7%) | 21 (91.3%) |
| 12 to 14 Years | 28 (93.3%) | 13 (100.0%) |
| 15 Years | 9 (75.0%) | 2 (100.0%) |
| 16 and 17 Years | 21 (72.4%) | 11 (28.2%) |
| 18 to 24 Years | 28 (100.0%) | 18 (48.6%) |
| 25 to 34 Years | 33 (82.5%) | 22 (81.5%) |
| 35 to 44 Years | 61 (91.0%) | 68 (87.2%) |
| 45 to 54 Years | 51 (100.0%) | 34 (70.8%) |
| 55 to 64 Years | 52 (96.3%) | 39 (90.7%) |
| 65 to 74 Years | 51 (100.0%) | 33 (89.2%) |
| 75 Years and over | 39 (86.7%) | 10 (41.7%) |
| Total | 452 (90.8%) | 296 (74.2%) |
Income Below Poverty Among Married-Couple Families in Browerville
The poverty statistics for married-couple families in Browerville show that 8.4% or 12 of the total 143 families live below the poverty line. Families with 3 or 4 children have the highest poverty rate of 20.0%, comprising of 4 families. On the other hand, families with 1 or 2 children have the lowest poverty rate of 0.0%, which includes 0 families.
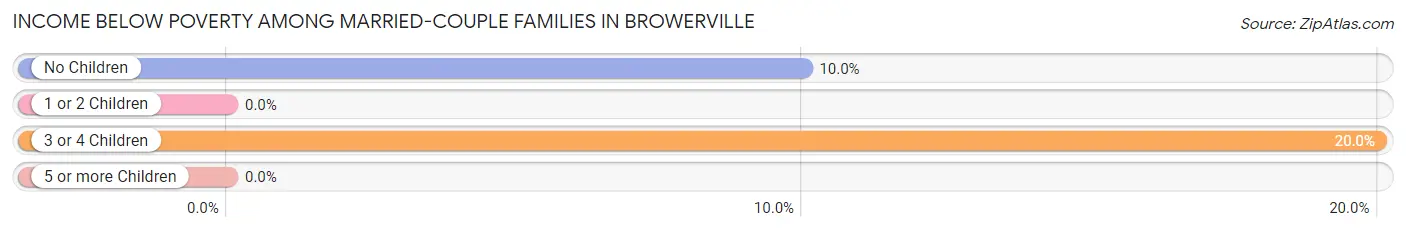
| Children | Above Poverty | Below Poverty |
| No Children | 72 (90.0%) | 8 (10.0%) |
| 1 or 2 Children | 43 (100.0%) | 0 (0.0%) |
| 3 or 4 Children | 16 (80.0%) | 4 (20.0%) |
| 5 or more Children | 0 (0.0%) | 0 (0.0%) |
| Total | 131 (91.6%) | 12 (8.4%) |
Income Below Poverty Among Single-Parent Households in Browerville
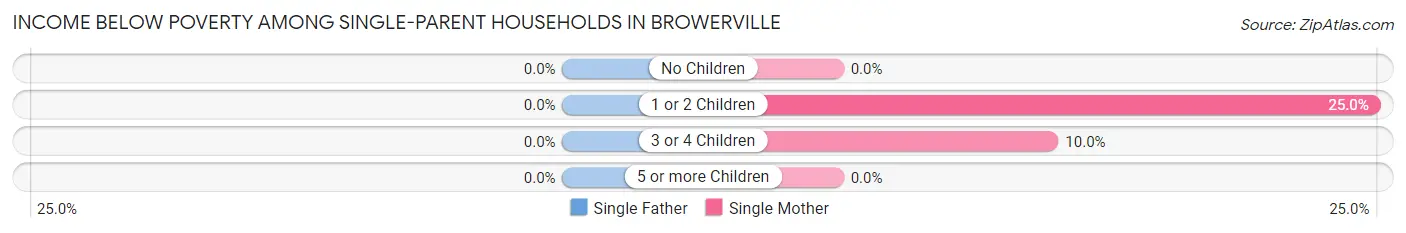
| Children | Single Father | Single Mother |
| No Children | 0 (0.0%) | 0 (0.0%) |
| 1 or 2 Children | 0 (0.0%) | 3 (25.0%) |
| 3 or 4 Children | 0 (0.0%) | 1 (10.0%) |
| 5 or more Children | 0 (0.0%) | 0 (0.0%) |
| Total | 0 (0.0%) | 4 (13.3%) |
Income Below Poverty Among Married-Couple vs Single-Parent Households in Browerville
The poverty data for Browerville shows that 12 of the married-couple family households (8.4%) and 4 of the single-parent households (9.8%) are living below the poverty level. Within the married-couple family households, those with 3 or 4 children have the highest poverty rate, with 4 households (20.0%) falling below the poverty line. Among the single-parent households, those with 1 or 2 children have the highest poverty rate, with 3 household (13.6%) living below poverty.
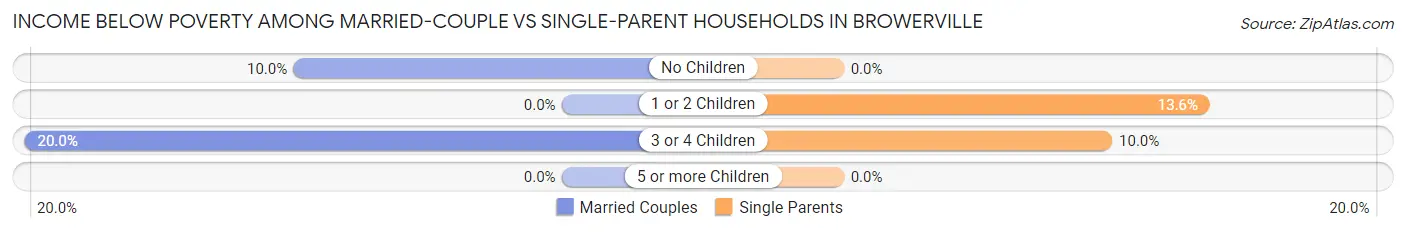
| Children | Married-Couple Families | Single-Parent Households |
| No Children | 8 (10.0%) | 0 (0.0%) |
| 1 or 2 Children | 0 (0.0%) | 3 (13.6%) |
| 3 or 4 Children | 4 (20.0%) | 1 (10.0%) |
| 5 or more Children | 0 (0.0%) | 0 (0.0%) |
| Total | 12 (8.4%) | 4 (9.8%) |
Race in Browerville
The most populous races in Browerville are White / Caucasian (774 | 86.1%), Hispanic or Latino (116 | 12.9%), and Two or more Races (102 | 11.4%).
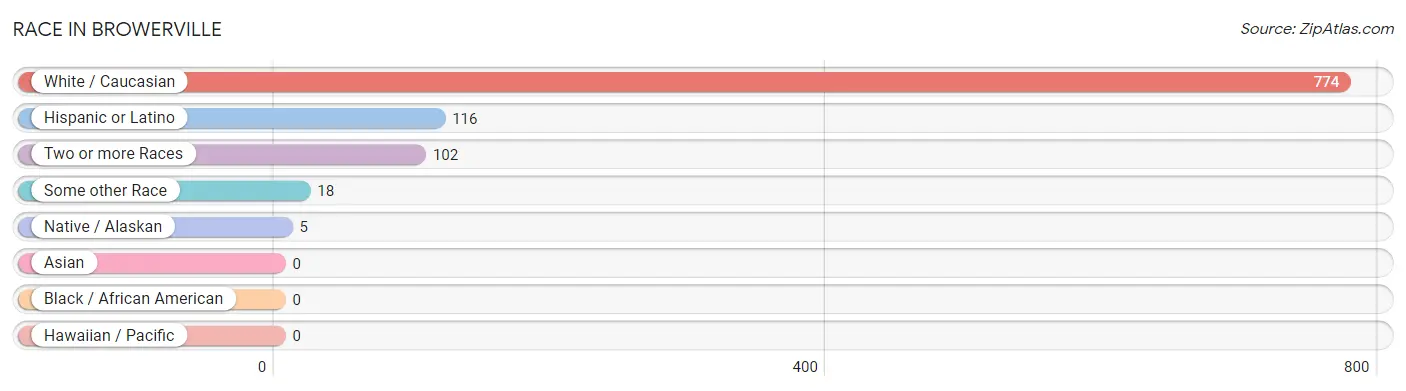
| Race | # Population | % Population |
| Asian | 0 | 0.0% |
| Black / African American | 0 | 0.0% |
| Hawaiian / Pacific | 0 | 0.0% |
| Hispanic or Latino | 116 | 12.9% |
| Native / Alaskan | 5 | 0.6% |
| White / Caucasian | 774 | 86.1% |
| Two or more Races | 102 | 11.4% |
| Some other Race | 18 | 2.0% |
| Total | 899 | 100.0% |
Ancestry in Browerville
The most populous ancestries reported in Browerville are German (358 | 39.8%), Polish (172 | 19.1%), Norwegian (59 | 6.6%), Mexican (52 | 5.8%), and Puerto Rican (46 | 5.1%), together accounting for 76.4% of all Browerville residents.
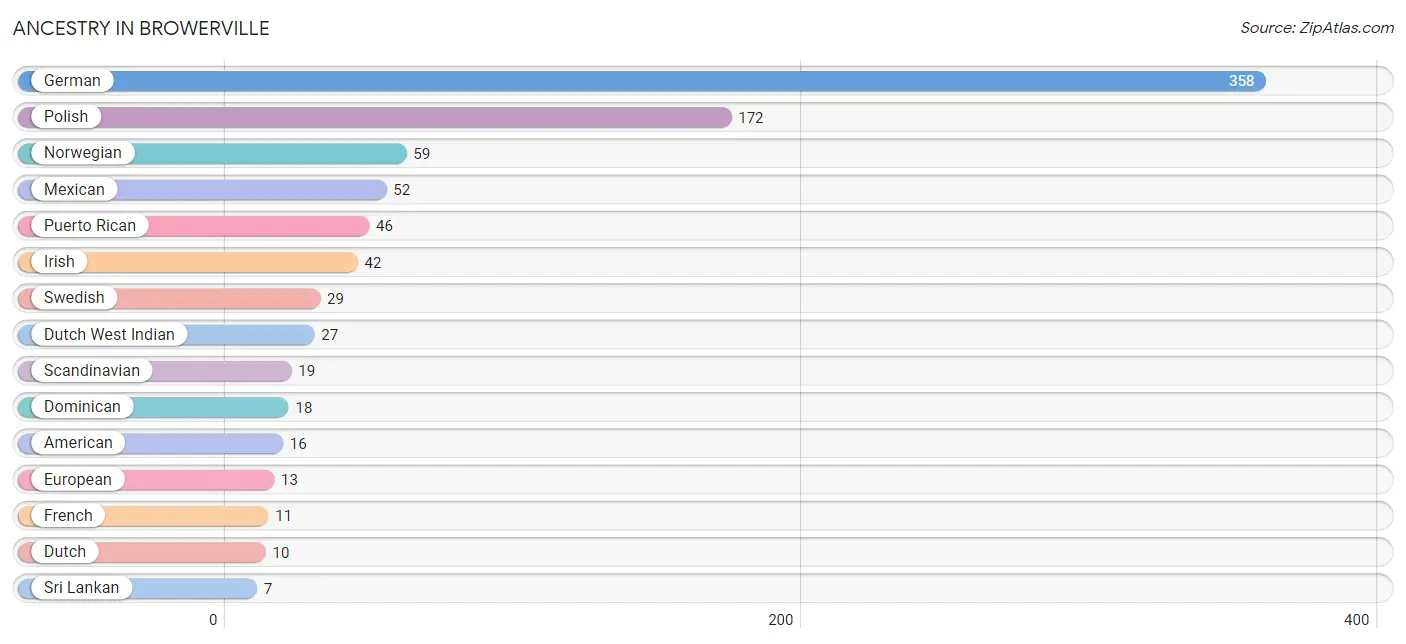
| Ancestry | # Population | % Population |
| American | 16 | 1.8% |
| Austrian | 4 | 0.4% |
| Chippewa | 5 | 0.6% |
| Czech | 3 | 0.3% |
| Dominican | 18 | 2.0% |
| Dutch | 10 | 1.1% |
| Dutch West Indian | 27 | 3.0% |
| English | 1 | 0.1% |
| European | 13 | 1.5% |
| French | 11 | 1.2% |
| French Canadian | 2 | 0.2% |
| German | 358 | 39.8% |
| Irish | 42 | 4.7% |
| Italian | 6 | 0.7% |
| Luxembourger | 2 | 0.2% |
| Mexican | 52 | 5.8% |
| Norwegian | 59 | 6.6% |
| Polish | 172 | 19.1% |
| Puerto Rican | 46 | 5.1% |
| Scandinavian | 19 | 2.1% |
| Scottish | 2 | 0.2% |
| Sri Lankan | 7 | 0.8% |
| Swedish | 29 | 3.2% |
| Yugoslavian | 3 | 0.3% | View All 24 Rows |
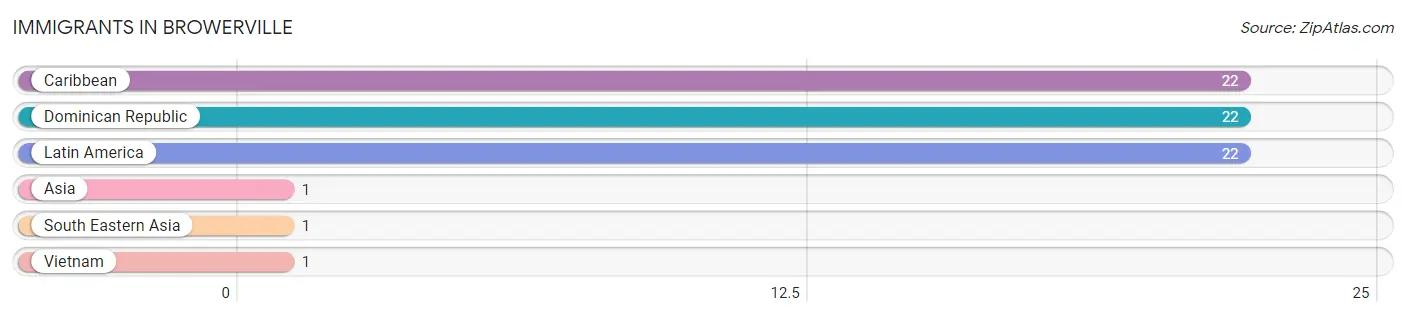
Immigrants in Browerville
The most numerous immigrant groups reported in Browerville came from Caribbean (22 | 2.5%), Dominican Republic (22 | 2.5%), Latin America (22 | 2.5%), Asia (1 | 0.1%), and South Eastern Asia (1 | 0.1%), together accounting for 7.6% of all Browerville residents.
| Immigration Origin | # Population | % Population |
| Asia | 1 | 0.1% |
| Caribbean | 22 | 2.5% |
| Dominican Republic | 22 | 2.5% |
| Latin America | 22 | 2.5% |
| South Eastern Asia | 1 | 0.1% |
| Vietnam | 1 | 0.1% | View All 6 Rows |
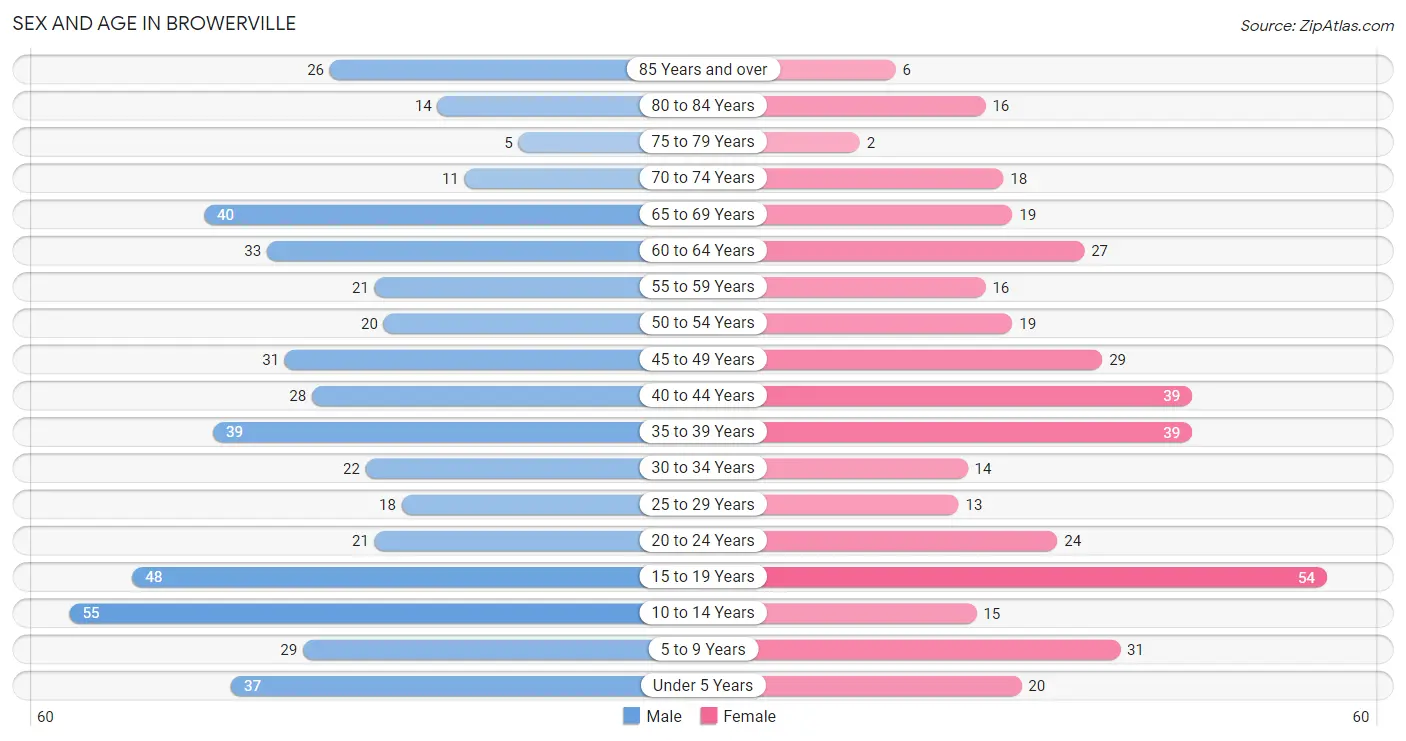
Sex and Age in Browerville
Sex and Age in Browerville
The most populous age groups in Browerville are 10 to 14 Years (55 | 11.0%) for men and 15 to 19 Years (54 | 13.5%) for women.
| Age Bracket | Male | Female |
| Under 5 Years | 37 (7.4%) | 20 (5.0%) |
| 5 to 9 Years | 29 (5.8%) | 31 (7.7%) |
| 10 to 14 Years | 55 (11.0%) | 15 (3.7%) |
| 15 to 19 Years | 48 (9.6%) | 54 (13.5%) |
| 20 to 24 Years | 21 (4.2%) | 24 (6.0%) |
| 25 to 29 Years | 18 (3.6%) | 13 (3.2%) |
| 30 to 34 Years | 22 (4.4%) | 14 (3.5%) |
| 35 to 39 Years | 39 (7.8%) | 39 (9.7%) |
| 40 to 44 Years | 28 (5.6%) | 39 (9.7%) |
| 45 to 49 Years | 31 (6.2%) | 29 (7.2%) |
| 50 to 54 Years | 20 (4.0%) | 19 (4.7%) |
| 55 to 59 Years | 21 (4.2%) | 16 (4.0%) |
| 60 to 64 Years | 33 (6.6%) | 27 (6.7%) |
| 65 to 69 Years | 40 (8.0%) | 19 (4.7%) |
| 70 to 74 Years | 11 (2.2%) | 18 (4.5%) |
| 75 to 79 Years | 5 (1.0%) | 2 (0.5%) |
| 80 to 84 Years | 14 (2.8%) | 16 (4.0%) |
| 85 Years and over | 26 (5.2%) | 6 (1.5%) |
| Total | 498 (100.0%) | 401 (100.0%) |
Families and Households in Browerville
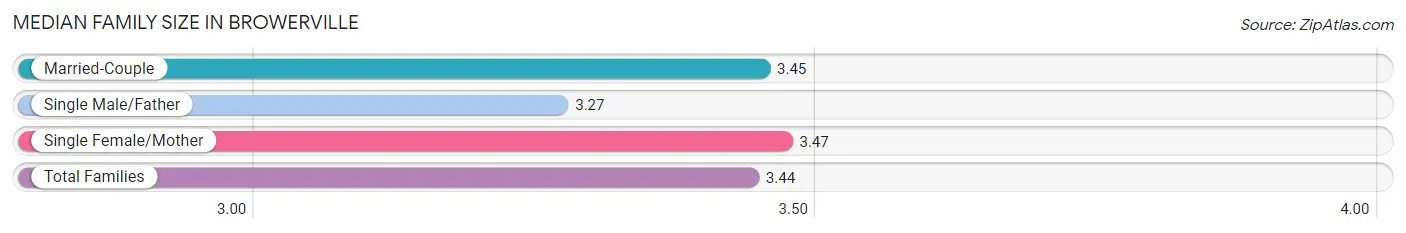
Median Family Size in Browerville
The median family size in Browerville is 3.44 persons per family, with single female/mother families (30 | 16.3%) accounting for the largest median family size of 3.47 persons per family. On the other hand, single male/father families (11 | 6.0%) represent the smallest median family size with 3.27 persons per family.
| Family Type | # Families | Family Size |
| Married-Couple | 143 (77.7%) | 3.45 |
| Single Male/Father | 11 (6.0%) | 3.27 |
| Single Female/Mother | 30 (16.3%) | 3.47 |
| Total Families | 184 (100.0%) | 3.44 |
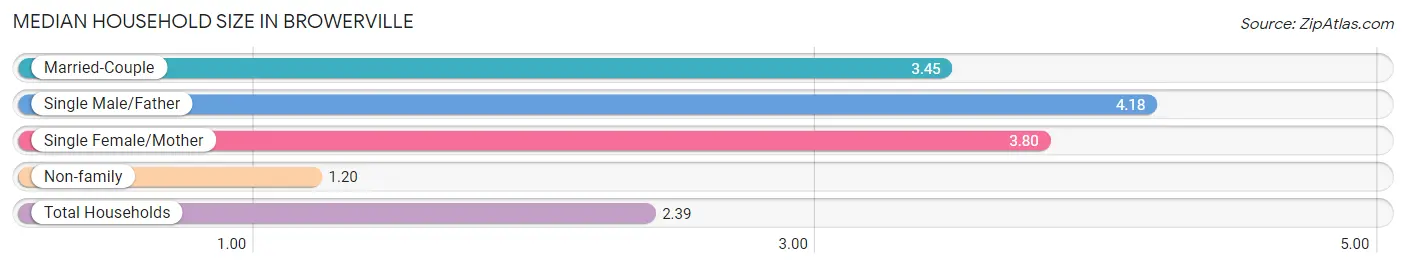
Median Household Size in Browerville
The median household size in Browerville is 2.39 persons per household, with single male/father households (11 | 3.0%) accounting for the largest median household size of 4.18 persons per household. non-family households (181 | 49.6%) represent the smallest median household size with 1.20 persons per household.
| Household Type | # Households | Household Size |
| Married-Couple | 143 (39.2%) | 3.45 |
| Single Male/Father | 11 (3.0%) | 4.18 |
| Single Female/Mother | 30 (8.2%) | 3.80 |
| Non-family | 181 (49.6%) | 1.20 |
| Total Households | 365 (100.0%) | 2.39 |
Household Size by Marriage Status in Browerville
Out of a total of 365 households in Browerville, 184 (50.4%) are family households, while 181 (49.6%) are nonfamily households. The most numerous type of family households are 2-person households, comprising 70, and the most common type of nonfamily households are 1-person households, comprising 158.
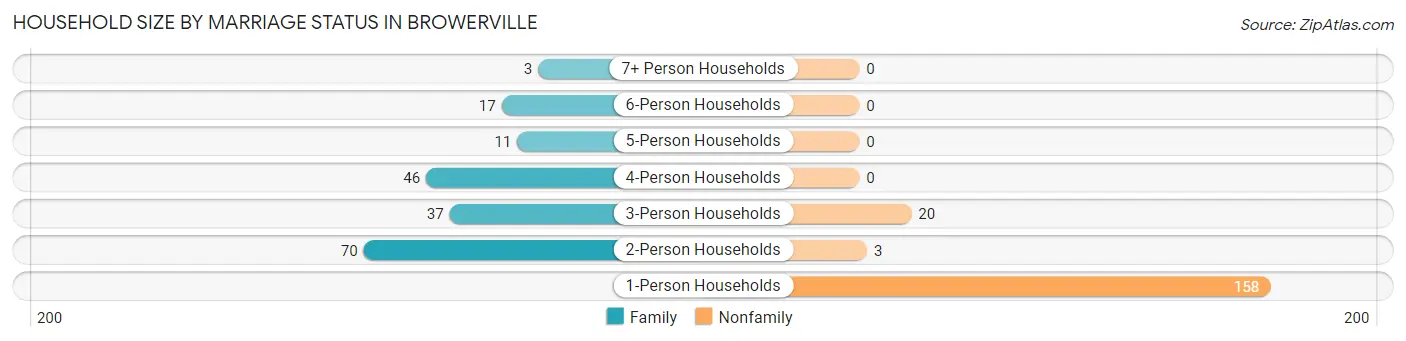
| Household Size | Family Households | Nonfamily Households |
| 1-Person Households | - | 158 (43.3%) |
| 2-Person Households | 70 (19.2%) | 3 (0.8%) |
| 3-Person Households | 37 (10.1%) | 20 (5.5%) |
| 4-Person Households | 46 (12.6%) | 0 (0.0%) |
| 5-Person Households | 11 (3.0%) | 0 (0.0%) |
| 6-Person Households | 17 (4.7%) | 0 (0.0%) |
| 7+ Person Households | 3 (0.8%) | 0 (0.0%) |
| Total | 184 (50.4%) | 181 (49.6%) |
Female Fertility in Browerville
Fertility by Age in Browerville
Average fertility rate in Browerville is 33.0 births per 1,000 women. Women in the age bracket of 20 to 34 years have the highest fertility rate with 137.0 births per 1,000 women. Women in the age bracket of 20 to 34 years acount for 100.0% of all women with births.
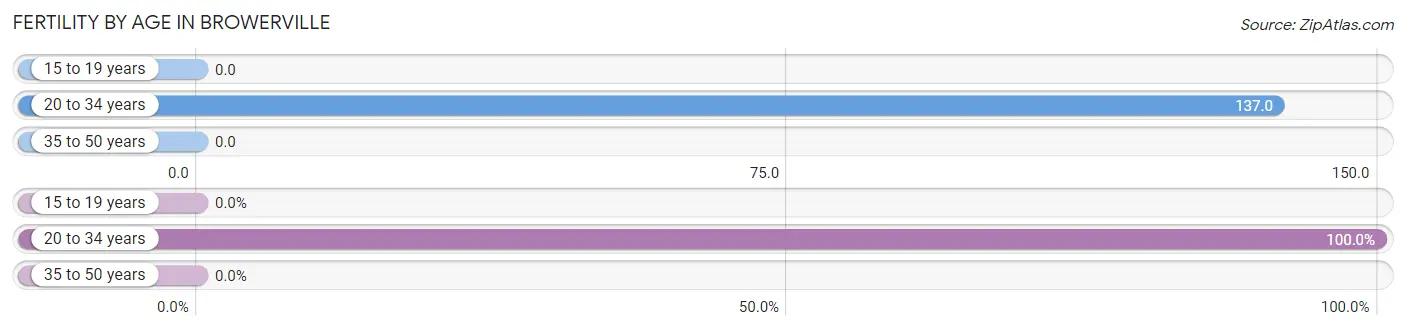
| Age Bracket | Women with Births | Births / 1,000 Women |
| 15 to 19 years | 0 (0.0%) | 0.0 |
| 20 to 34 years | 7 (100.0%) | 137.0 |
| 35 to 50 years | 0 (0.0%) | 0.0 |
| Total | 7 (100.0%) | 33.0 |
Fertility by Age by Marriage Status in Browerville
57.1% of women with births (7) in Browerville are married. The highest percentage of unmarried women with births falls into 20 to 34 years age bracket with 42.9% of them unmarried at the time of birth, while the lowest percentage of unmarried women with births belong to 20 to 34 years age bracket with 42.9% of them unmarried.
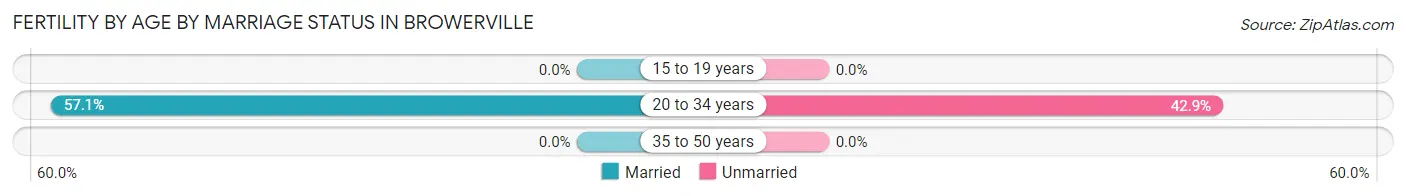
| Age Bracket | Married | Unmarried |
| 15 to 19 years | 0 (0.0%) | 0 (0.0%) |
| 20 to 34 years | 4 (57.1%) | 3 (42.9%) |
| 35 to 50 years | 0 (0.0%) | 0 (0.0%) |
| Total | 4 (57.1%) | 3 (42.9%) |
Fertility by Education in Browerville
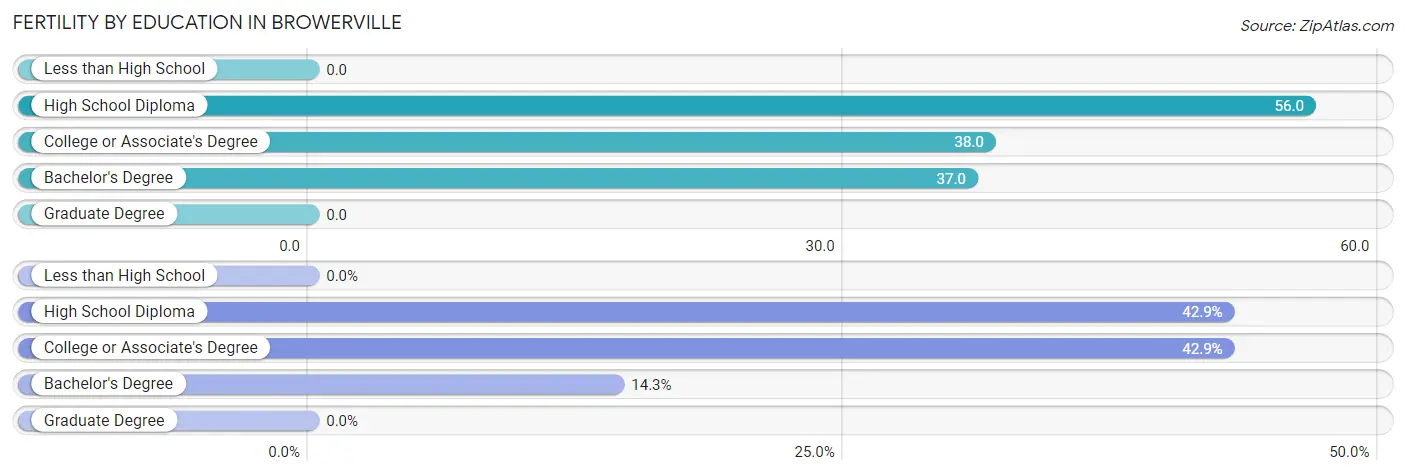
| Educational Attainment | Women with Births | Births / 1,000 Women |
| Less than High School | 0 (0.0%) | 0.0 |
| High School Diploma | 3 (42.9%) | 56.0 |
| College or Associate's Degree | 3 (42.9%) | 38.0 |
| Bachelor's Degree | 1 (14.3%) | 37.0 |
| Graduate Degree | 0 (0.0%) | 0.0 |
| Total | 7 (100.0%) | 33.0 |
Fertility by Education by Marriage Status in Browerville
42.9% of women with births in Browerville are unmarried. Women with the educational attainment of college or associate's degree are most likely to be married with 100.0% of them married at childbirth, while women with the educational attainment of high school diploma are least likely to be married with 100.0% of them unmarried at childbirth.
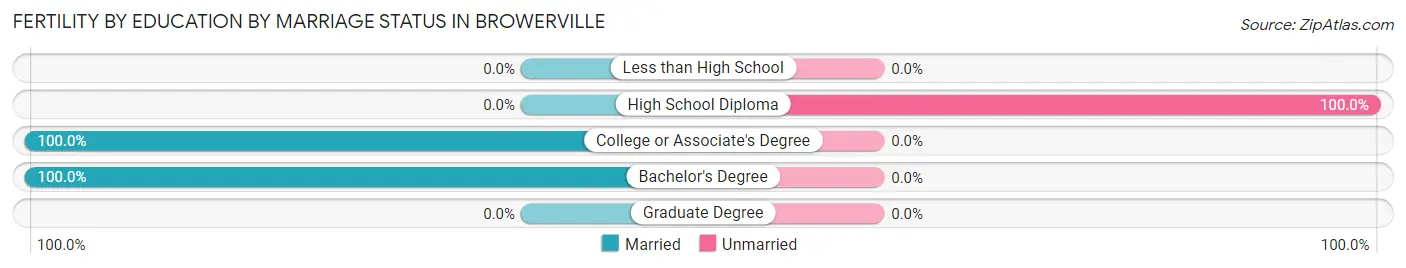
| Educational Attainment | Married | Unmarried |
| Less than High School | 0 (0.0%) | 0 (0.0%) |
| High School Diploma | 0 (0.0%) | 3 (100.0%) |
| College or Associate's Degree | 3 (100.0%) | 0 (0.0%) |
| Bachelor's Degree | 1 (100.0%) | 0 (0.0%) |
| Graduate Degree | 0 (0.0%) | 0 (0.0%) |
| Total | 4 (57.1%) | 3 (42.9%) |
Employment Characteristics in Browerville
Employment by Class of Employer in Browerville
Among the 367 employed individuals in Browerville, private company employees (242 | 65.9%), local government employees (28 | 7.6%), and not-for-profit organizations (27 | 7.4%) make up the most common classes of employment.
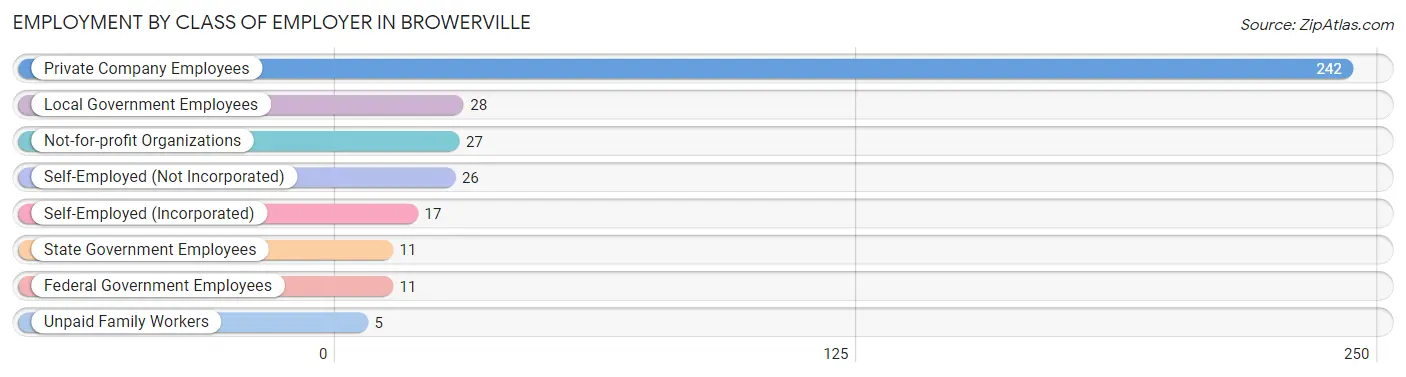
| Employer Class | # Employees | % Employees |
| Private Company Employees | 242 | 65.9% |
| Self-Employed (Incorporated) | 17 | 4.6% |
| Self-Employed (Not Incorporated) | 26 | 7.1% |
| Not-for-profit Organizations | 27 | 7.4% |
| Local Government Employees | 28 | 7.6% |
| State Government Employees | 11 | 3.0% |
| Federal Government Employees | 11 | 3.0% |
| Unpaid Family Workers | 5 | 1.4% |
| Total | 367 | 100.0% |
Employment Status by Age in Browerville
According to the labor force statistics for Browerville, out of the total population over 16 years of age (698), 59.6% or 416 individuals are in the labor force, with 11.3% or 47 of them unemployed. The age group with the highest labor force participation rate is 20 to 24 years, with 91.1% or 41 individuals in the labor force. Within the labor force, the 16 to 19 years age range has the highest percentage of unemployed individuals, with 60.3% or 38 of them being unemployed.
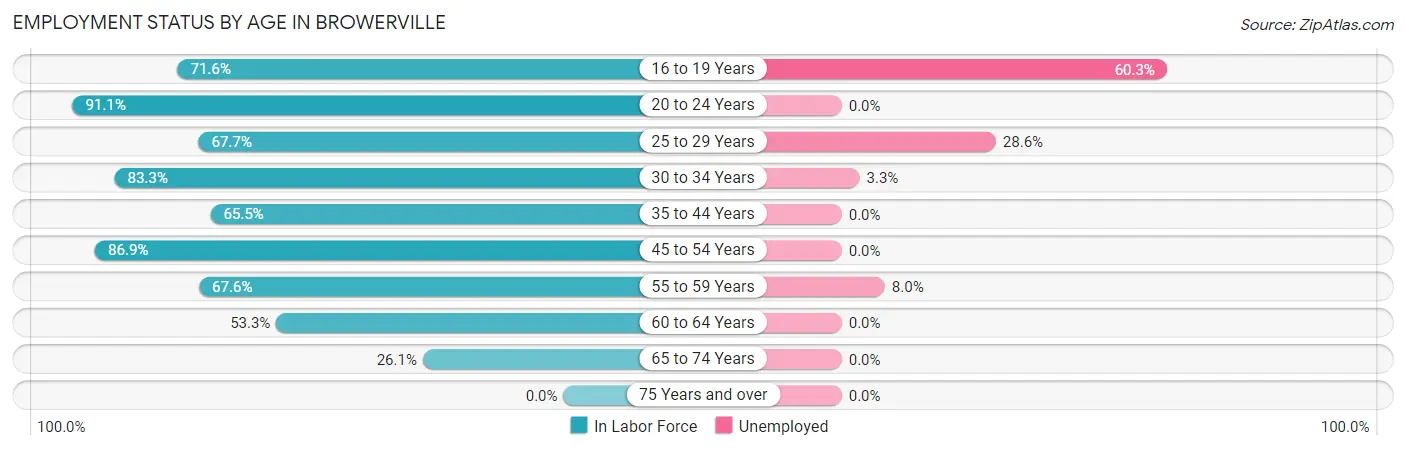
| Age Bracket | In Labor Force | Unemployed |
| 16 to 19 Years | 63 (71.6%) | 38 (60.3%) |
| 20 to 24 Years | 41 (91.1%) | 0 (0.0%) |
| 25 to 29 Years | 21 (67.7%) | 6 (28.6%) |
| 30 to 34 Years | 30 (83.3%) | 1 (3.3%) |
| 35 to 44 Years | 95 (65.5%) | 0 (0.0%) |
| 45 to 54 Years | 86 (86.9%) | 0 (0.0%) |
| 55 to 59 Years | 25 (67.6%) | 2 (8.0%) |
| 60 to 64 Years | 32 (53.3%) | 0 (0.0%) |
| 65 to 74 Years | 23 (26.1%) | 0 (0.0%) |
| 75 Years and over | 0 (0.0%) | 0 (0.0%) |
| Total | 416 (59.6%) | 47 (11.3%) |
Employment Status by Educational Attainment in Browerville
According to labor force statistics for Browerville, 70.8% of individuals (289) out of the total population between 25 and 64 years of age (408) are in the labor force, with 3.1% or 9 of them being unemployed. The group with the highest labor force participation rate are those with the educational attainment of bachelor's degree or higher, with 87.3% or 62 individuals in the labor force. Within the labor force, individuals with high school diploma education have the highest percentage of unemployment, with 8.7% or 9 of them being unemployed.
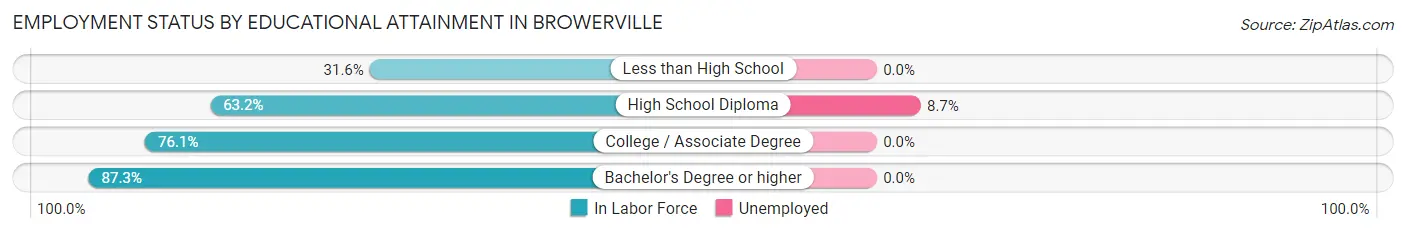
| Educational Attainment | In Labor Force | Unemployed |
| Less than High School | 6 (31.6%) | 0 (0.0%) |
| High School Diploma | 103 (63.2%) | 14 (8.7%) |
| College / Associate Degree | 118 (76.1%) | 0 (0.0%) |
| Bachelor's Degree or higher | 62 (87.3%) | 0 (0.0%) |
| Total | 289 (70.8%) | 13 (3.1%) |
Employment Occupations by Sex in Browerville
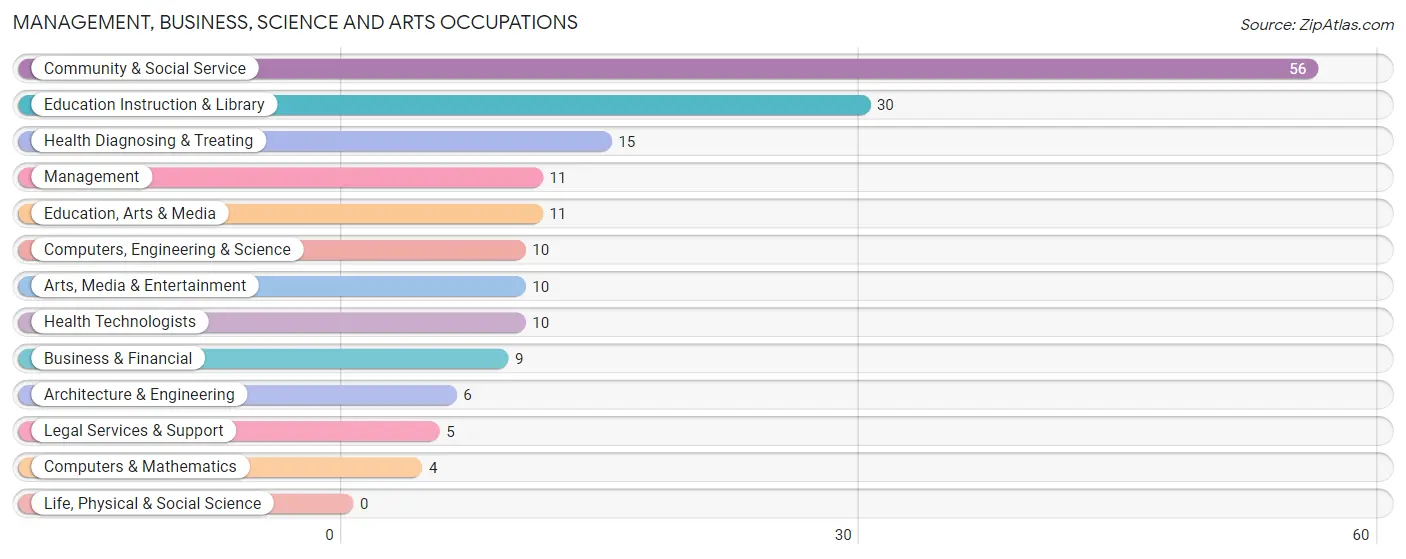
Management, Business, Science and Arts Occupations
The most common Management, Business, Science and Arts occupations in Browerville are Community & Social Service (56 | 15.2%), Education Instruction & Library (30 | 8.1%), Health Diagnosing & Treating (15 | 4.1%), Management (11 | 3.0%), and Education, Arts & Media (11 | 3.0%).
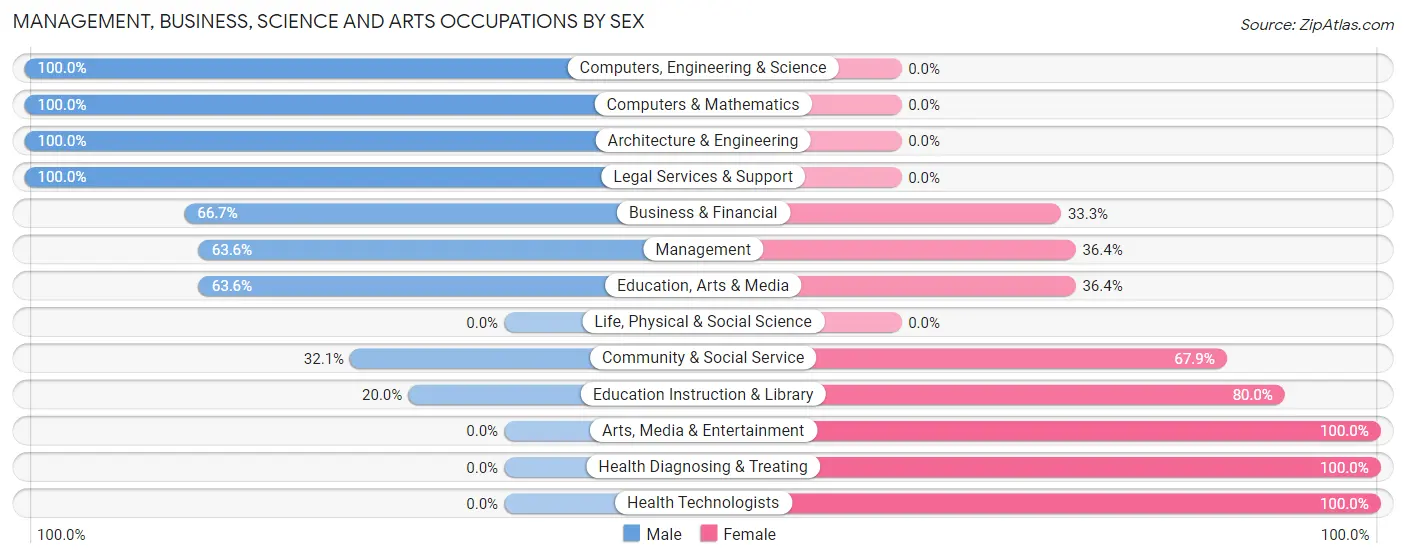
Management, Business, Science and Arts Occupations by Sex
Within the Management, Business, Science and Arts occupations in Browerville, the most male-oriented occupations are Computers, Engineering & Science (100.0%), Computers & Mathematics (100.0%), and Architecture & Engineering (100.0%), while the most female-oriented occupations are Arts, Media & Entertainment (100.0%), Health Diagnosing & Treating (100.0%), and Health Technologists (100.0%).
| Occupation | Male | Female |
| Management | 7 (63.6%) | 4 (36.4%) |
| Business & Financial | 6 (66.7%) | 3 (33.3%) |
| Computers, Engineering & Science | 10 (100.0%) | 0 (0.0%) |
| Computers & Mathematics | 4 (100.0%) | 0 (0.0%) |
| Architecture & Engineering | 6 (100.0%) | 0 (0.0%) |
| Life, Physical & Social Science | 0 (0.0%) | 0 (0.0%) |
| Community & Social Service | 18 (32.1%) | 38 (67.9%) |
| Education, Arts & Media | 7 (63.6%) | 4 (36.4%) |
| Legal Services & Support | 5 (100.0%) | 0 (0.0%) |
| Education Instruction & Library | 6 (20.0%) | 24 (80.0%) |
| Arts, Media & Entertainment | 0 (0.0%) | 10 (100.0%) |
| Health Diagnosing & Treating | 0 (0.0%) | 15 (100.0%) |
| Health Technologists | 0 (0.0%) | 10 (100.0%) |
| Total (Category) | 41 (40.6%) | 60 (59.4%) |
| Total (Overall) | 208 (56.4%) | 161 (43.6%) |
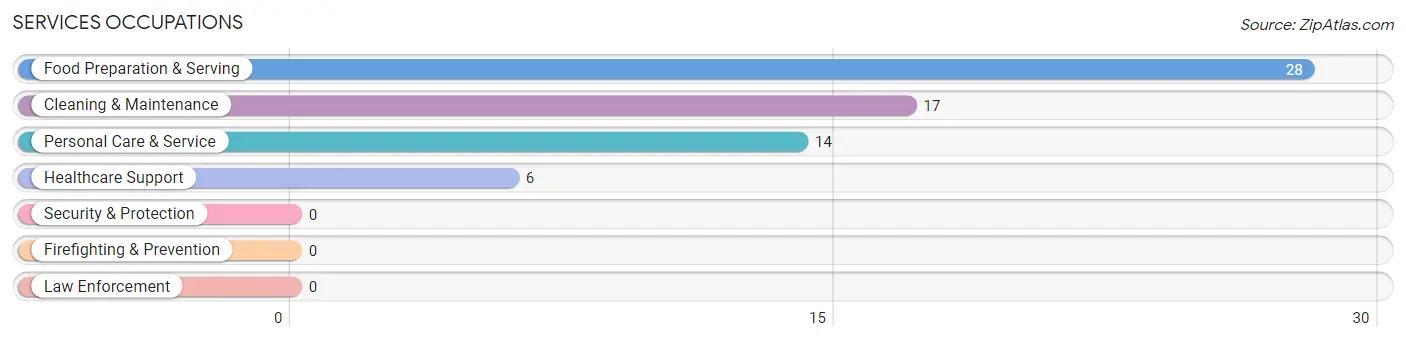
Services Occupations
The most common Services occupations in Browerville are Food Preparation & Serving (28 | 7.6%), Cleaning & Maintenance (17 | 4.6%), Personal Care & Service (14 | 3.8%), and Healthcare Support (6 | 1.6%).
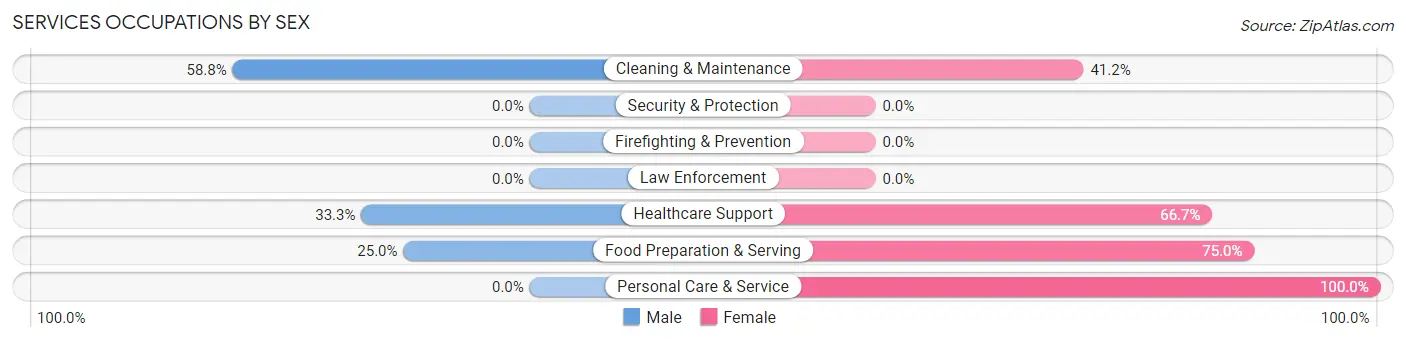
Services Occupations by Sex
Within the Services occupations in Browerville, the most male-oriented occupations are Cleaning & Maintenance (58.8%), Healthcare Support (33.3%), and Food Preparation & Serving (25.0%), while the most female-oriented occupations are Personal Care & Service (100.0%), Food Preparation & Serving (75.0%), and Healthcare Support (66.7%).
| Occupation | Male | Female |
| Healthcare Support | 2 (33.3%) | 4 (66.7%) |
| Security & Protection | 0 (0.0%) | 0 (0.0%) |
| Firefighting & Prevention | 0 (0.0%) | 0 (0.0%) |
| Law Enforcement | 0 (0.0%) | 0 (0.0%) |
| Food Preparation & Serving | 7 (25.0%) | 21 (75.0%) |
| Cleaning & Maintenance | 10 (58.8%) | 7 (41.2%) |
| Personal Care & Service | 0 (0.0%) | 14 (100.0%) |
| Total (Category) | 19 (29.2%) | 46 (70.8%) |
| Total (Overall) | 208 (56.4%) | 161 (43.6%) |
Sales and Office Occupations
The most common Sales and Office occupations in Browerville are Sales & Related (19 | 5.1%), and Office & Administration (7 | 1.9%).
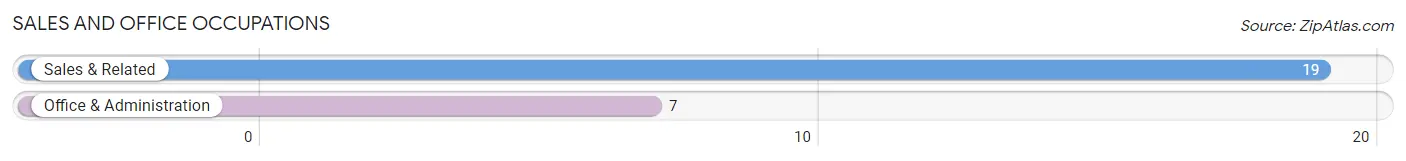
Sales and Office Occupations by Sex
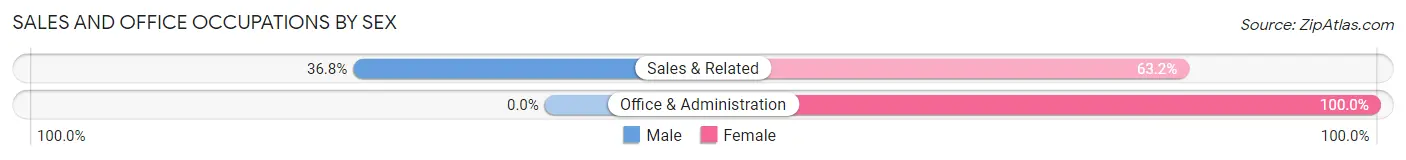
| Occupation | Male | Female |
| Sales & Related | 7 (36.8%) | 12 (63.2%) |
| Office & Administration | 0 (0.0%) | 7 (100.0%) |
| Total (Category) | 7 (26.9%) | 19 (73.1%) |
| Total (Overall) | 208 (56.4%) | 161 (43.6%) |
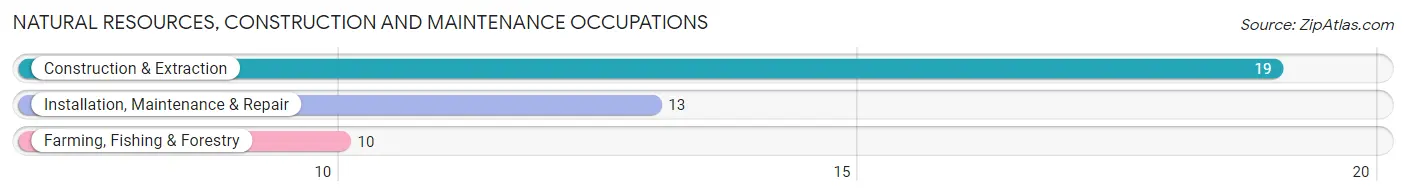
Natural Resources, Construction and Maintenance Occupations
The most common Natural Resources, Construction and Maintenance occupations in Browerville are Construction & Extraction (19 | 5.1%), Installation, Maintenance & Repair (13 | 3.5%), and Farming, Fishing & Forestry (10 | 2.7%).
Natural Resources, Construction and Maintenance Occupations by Sex
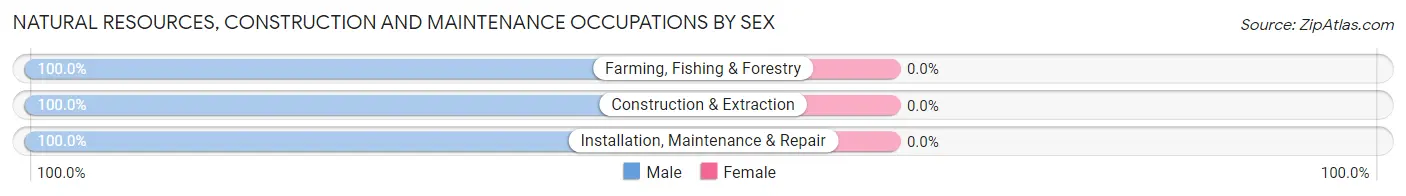
| Occupation | Male | Female |
| Farming, Fishing & Forestry | 10 (100.0%) | 0 (0.0%) |
| Construction & Extraction | 19 (100.0%) | 0 (0.0%) |
| Installation, Maintenance & Repair | 13 (100.0%) | 0 (0.0%) |
| Total (Category) | 42 (100.0%) | 0 (0.0%) |
| Total (Overall) | 208 (56.4%) | 161 (43.6%) |
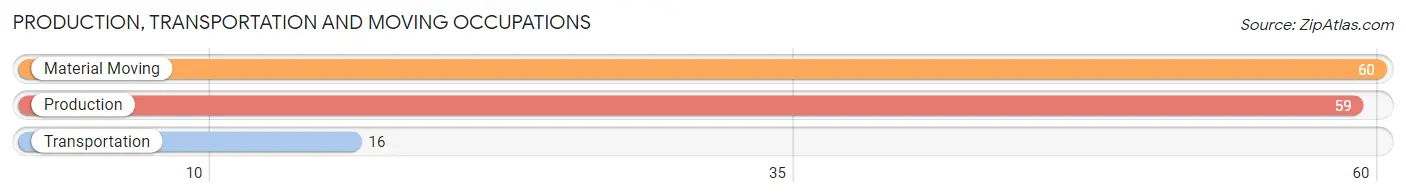
Production, Transportation and Moving Occupations
The most common Production, Transportation and Moving occupations in Browerville are Material Moving (60 | 16.3%), Production (59 | 16.0%), and Transportation (16 | 4.3%).
Production, Transportation and Moving Occupations by Sex
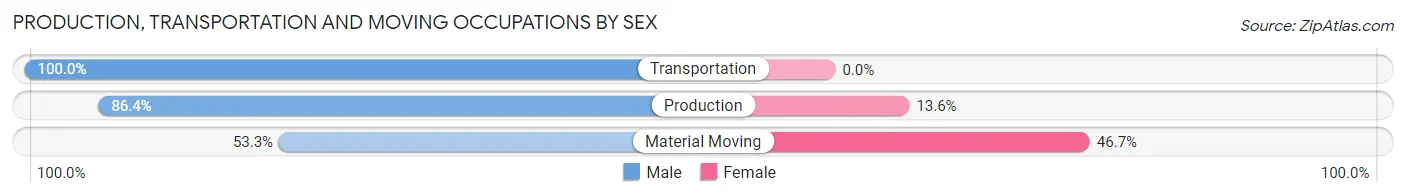
| Occupation | Male | Female |
| Production | 51 (86.4%) | 8 (13.6%) |
| Transportation | 16 (100.0%) | 0 (0.0%) |
| Material Moving | 32 (53.3%) | 28 (46.7%) |
| Total (Category) | 99 (73.3%) | 36 (26.7%) |
| Total (Overall) | 208 (56.4%) | 161 (43.6%) |
Employment Industries by Sex in Browerville
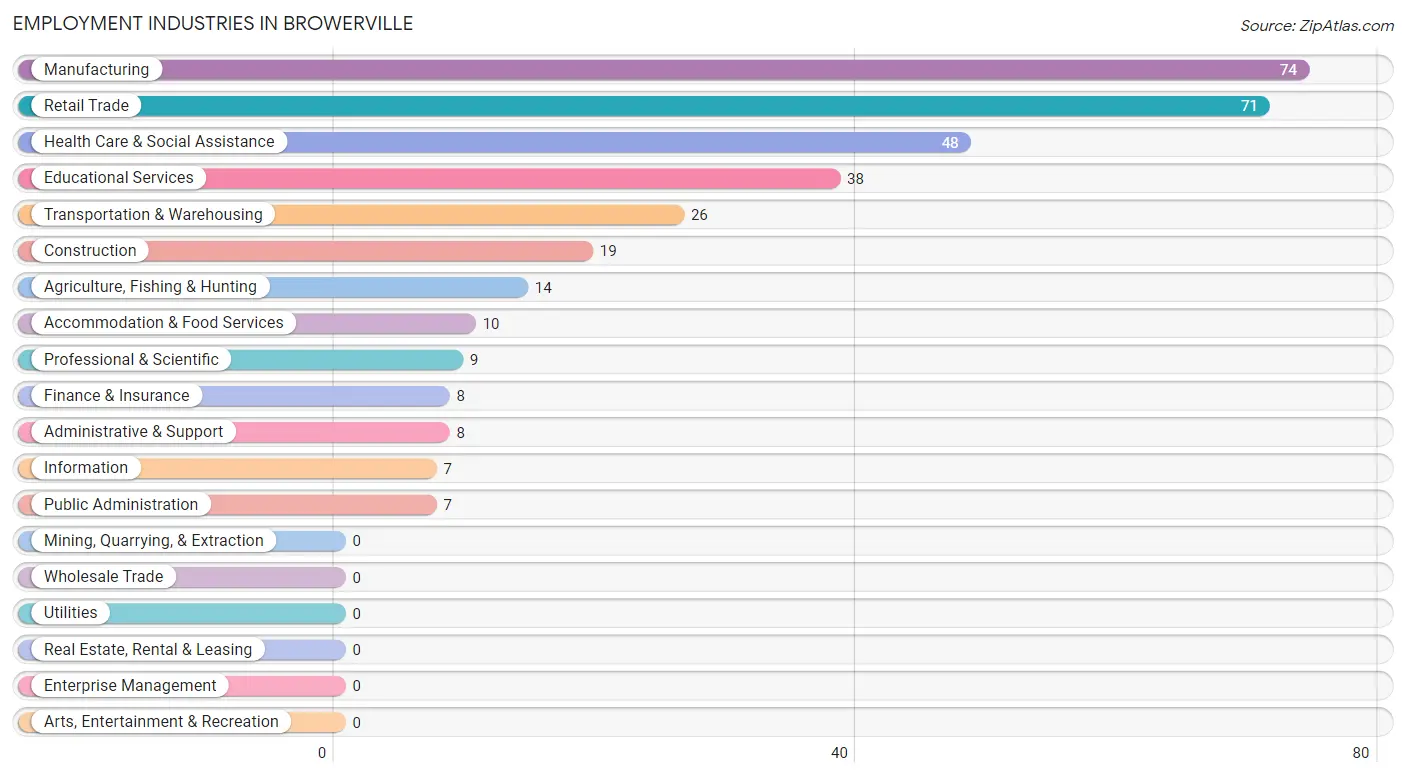
Employment Industries in Browerville
The major employment industries in Browerville include Manufacturing (74 | 20.1%), Retail Trade (71 | 19.2%), Health Care & Social Assistance (48 | 13.0%), Educational Services (38 | 10.3%), and Transportation & Warehousing (26 | 7.0%).
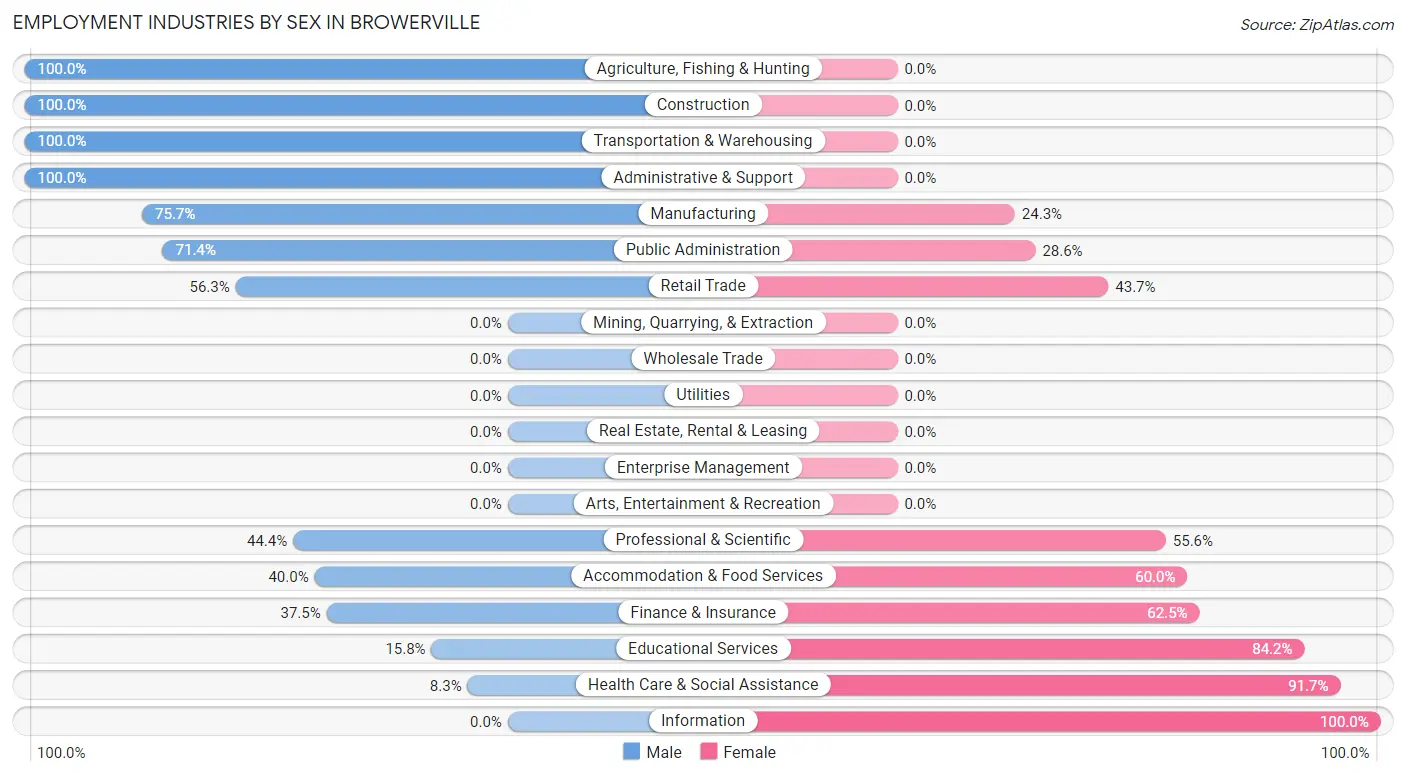
Employment Industries by Sex in Browerville
The Browerville industries that see more men than women are Agriculture, Fishing & Hunting (100.0%), Construction (100.0%), and Transportation & Warehousing (100.0%), whereas the industries that tend to have a higher number of women are Information (100.0%), Health Care & Social Assistance (91.7%), and Educational Services (84.2%).
| Industry | Male | Female |
| Agriculture, Fishing & Hunting | 14 (100.0%) | 0 (0.0%) |
| Mining, Quarrying, & Extraction | 0 (0.0%) | 0 (0.0%) |
| Construction | 19 (100.0%) | 0 (0.0%) |
| Manufacturing | 56 (75.7%) | 18 (24.3%) |
| Wholesale Trade | 0 (0.0%) | 0 (0.0%) |
| Retail Trade | 40 (56.3%) | 31 (43.7%) |
| Transportation & Warehousing | 26 (100.0%) | 0 (0.0%) |
| Utilities | 0 (0.0%) | 0 (0.0%) |
| Information | 0 (0.0%) | 7 (100.0%) |
| Finance & Insurance | 3 (37.5%) | 5 (62.5%) |
| Real Estate, Rental & Leasing | 0 (0.0%) | 0 (0.0%) |
| Professional & Scientific | 4 (44.4%) | 5 (55.6%) |
| Enterprise Management | 0 (0.0%) | 0 (0.0%) |
| Administrative & Support | 8 (100.0%) | 0 (0.0%) |
| Educational Services | 6 (15.8%) | 32 (84.2%) |
| Health Care & Social Assistance | 4 (8.3%) | 44 (91.7%) |
| Arts, Entertainment & Recreation | 0 (0.0%) | 0 (0.0%) |
| Accommodation & Food Services | 4 (40.0%) | 6 (60.0%) |
| Public Administration | 5 (71.4%) | 2 (28.6%) |
| Total | 208 (56.4%) | 161 (43.6%) |
Education in Browerville
School Enrollment in Browerville
The most common levels of schooling among the 306 students in Browerville are high school (109 | 35.6%), elementary school (63 | 20.6%), and middle school (47 | 15.4%).
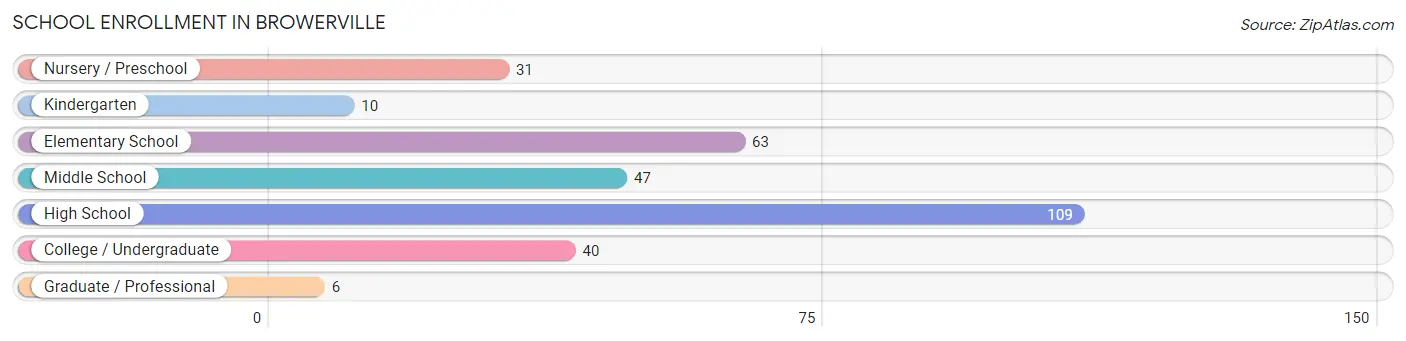
| School Level | # Students | % Students |
| Nursery / Preschool | 31 | 10.1% |
| Kindergarten | 10 | 3.3% |
| Elementary School | 63 | 20.6% |
| Middle School | 47 | 15.4% |
| High School | 109 | 35.6% |
| College / Undergraduate | 40 | 13.1% |
| Graduate / Professional | 6 | 2.0% |
| Total | 306 | 100.0% |
School Enrollment by Age by Funding Source in Browerville
Out of a total of 306 students who are enrolled in schools in Browerville, 8 (2.6%) attend a private institution, while the remaining 298 (97.4%) are enrolled in public schools. The age group of 5 to 9 year old has the highest likelihood of being enrolled in private schools, with 4 (6.7% in the age bracket) enrolled. Conversely, the age group of 3 to 4 year olds has the lowest likelihood of being enrolled in a private school, with 28 (100.0% in the age bracket) attending a public institution.
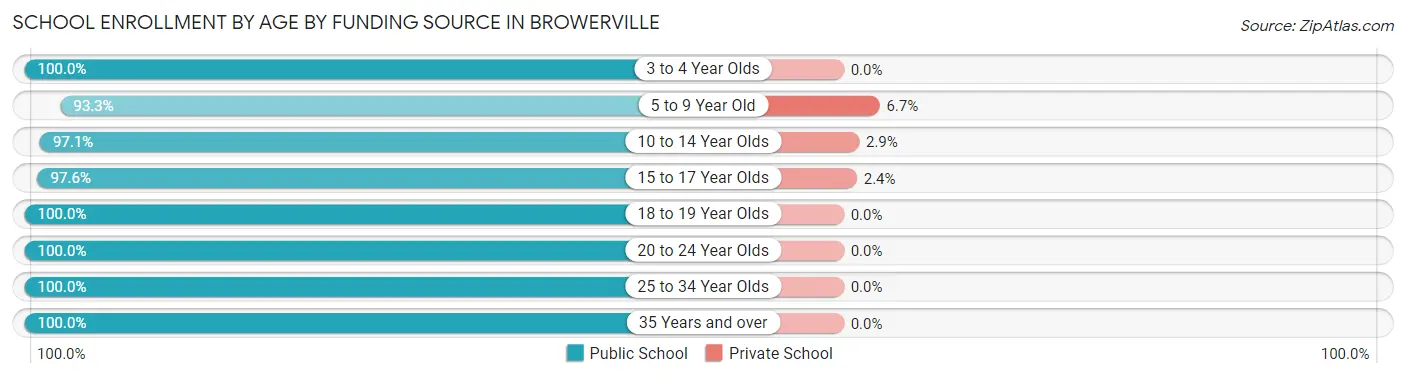
| Age Bracket | Public School | Private School |
| 3 to 4 Year Olds | 28 (100.0%) | 0 (0.0%) |
| 5 to 9 Year Old | 56 (93.3%) | 4 (6.7%) |
| 10 to 14 Year Olds | 68 (97.1%) | 2 (2.9%) |
| 15 to 17 Year Olds | 80 (97.6%) | 2 (2.4%) |
| 18 to 19 Year Olds | 16 (100.0%) | 0 (0.0%) |
| 20 to 24 Year Olds | 20 (100.0%) | 0 (0.0%) |
| 25 to 34 Year Olds | 6 (100.0%) | 0 (0.0%) |
| 35 Years and over | 24 (100.0%) | 0 (0.0%) |
| Total | 298 (97.4%) | 8 (2.6%) |
Educational Attainment by Field of Study in Browerville
Arts & humanities (35 | 28.2%), education (31 | 25.0%), social sciences (14 | 11.3%), bio, nature & agricultural (11 | 8.9%), and literature & languages (9 | 7.3%) are the most common fields of study among 124 individuals in Browerville who have obtained a bachelor's degree or higher.
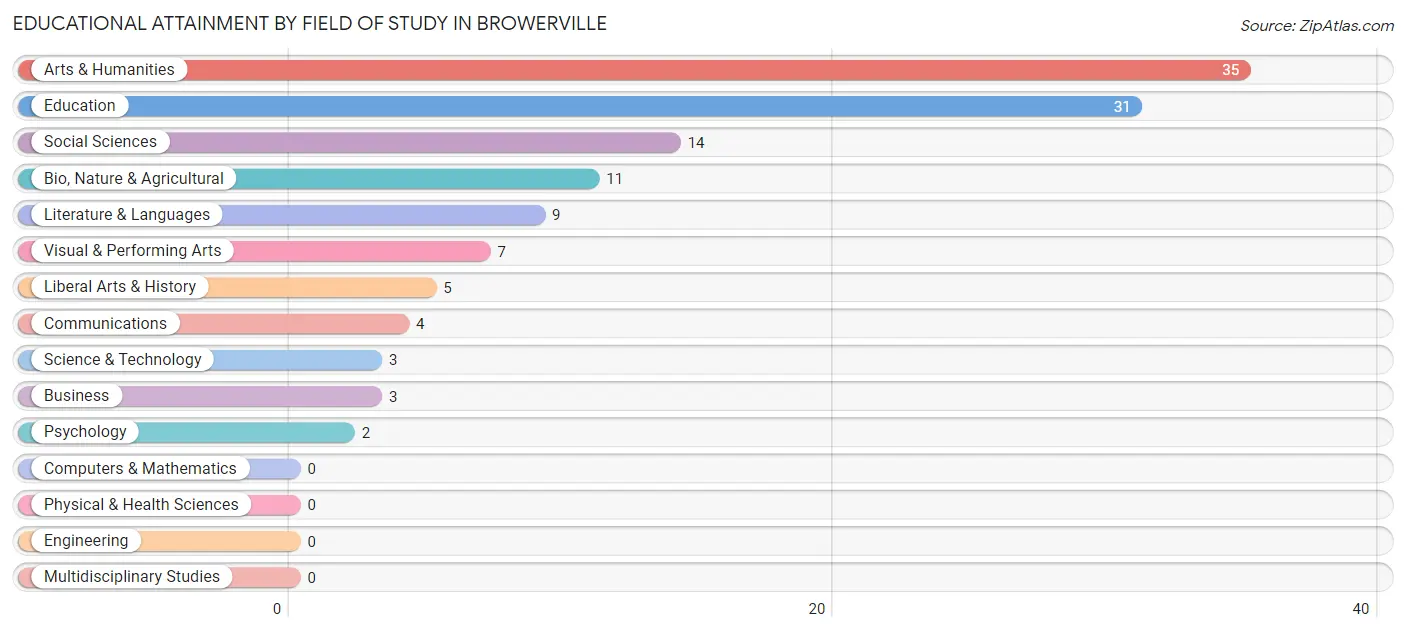
| Field of Study | # Graduates | % Graduates |
| Computers & Mathematics | 0 | 0.0% |
| Bio, Nature & Agricultural | 11 | 8.9% |
| Physical & Health Sciences | 0 | 0.0% |
| Psychology | 2 | 1.6% |
| Social Sciences | 14 | 11.3% |
| Engineering | 0 | 0.0% |
| Multidisciplinary Studies | 0 | 0.0% |
| Science & Technology | 3 | 2.4% |
| Business | 3 | 2.4% |
| Education | 31 | 25.0% |
| Literature & Languages | 9 | 7.3% |
| Liberal Arts & History | 5 | 4.0% |
| Visual & Performing Arts | 7 | 5.7% |
| Communications | 4 | 3.2% |
| Arts & Humanities | 35 | 28.2% |
| Total | 124 | 100.0% |
Transportation & Commute in Browerville
Vehicle Availability by Sex in Browerville
The most prevalent vehicle ownership categories in Browerville are males with 2 vehicles (83, accounting for 39.9%) and females with 2 vehicles (38, making up 53.5%).
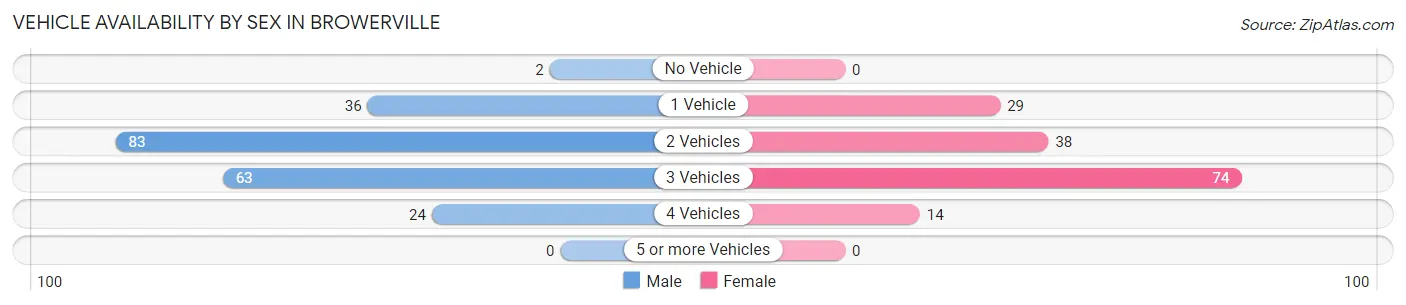
| Vehicles Available | Male | Female |
| No Vehicle | 2 (1.0%) | 0 (0.0%) |
| 1 Vehicle | 36 (17.3%) | 29 (18.7%) |
| 2 Vehicles | 83 (39.9%) | 38 (24.5%) |
| 3 Vehicles | 63 (30.3%) | 74 (47.7%) |
| 4 Vehicles | 24 (11.5%) | 14 (9.0%) |
| 5 or more Vehicles | 0 (0.0%) | 0 (0.0%) |
| Total | 208 (100.0%) | 155 (100.0%) |
Commute Time in Browerville
The most frequently occuring commute durations in Browerville are 5 to 9 minutes (77 commuters, 23.3%), 10 to 14 minutes (66 commuters, 19.9%), and 15 to 19 minutes (66 commuters, 19.9%).
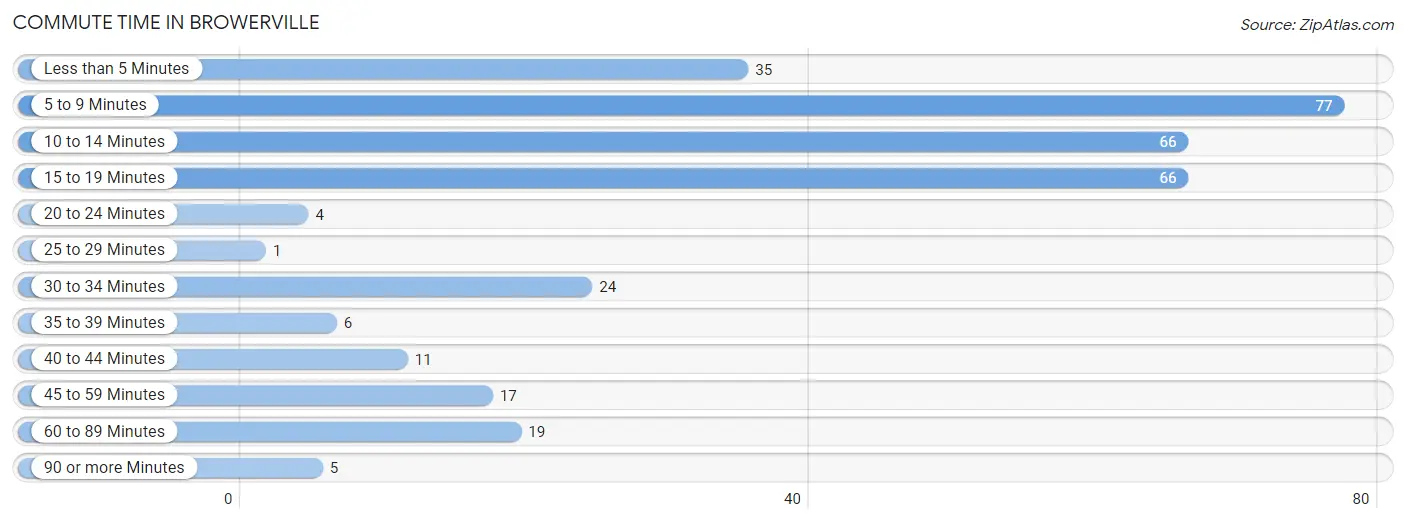
| Commute Time | # Commuters | % Commuters |
| Less than 5 Minutes | 35 | 10.6% |
| 5 to 9 Minutes | 77 | 23.3% |
| 10 to 14 Minutes | 66 | 19.9% |
| 15 to 19 Minutes | 66 | 19.9% |
| 20 to 24 Minutes | 4 | 1.2% |
| 25 to 29 Minutes | 1 | 0.3% |
| 30 to 34 Minutes | 24 | 7.2% |
| 35 to 39 Minutes | 6 | 1.8% |
| 40 to 44 Minutes | 11 | 3.3% |
| 45 to 59 Minutes | 17 | 5.1% |
| 60 to 89 Minutes | 19 | 5.7% |
| 90 or more Minutes | 5 | 1.5% |
Commute Time by Sex in Browerville
The most common commute times in Browerville are 5 to 9 minutes (48 commuters, 24.4%) for males and 10 to 14 minutes (40 commuters, 29.8%) for females.
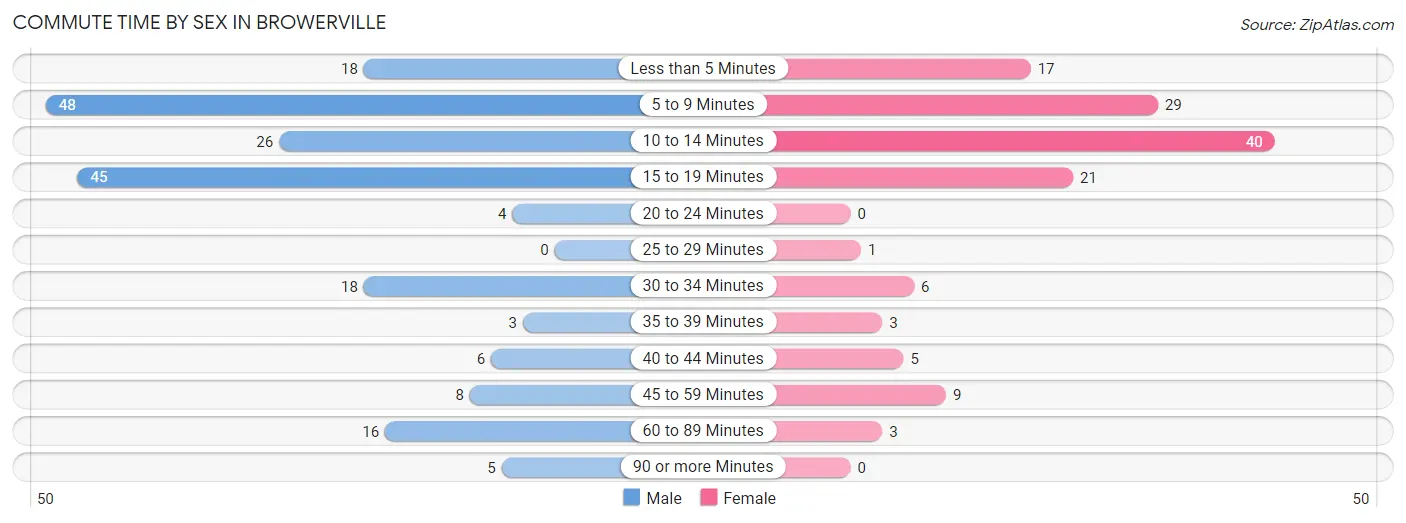
| Commute Time | Male | Female |
| Less than 5 Minutes | 18 (9.1%) | 17 (12.7%) |
| 5 to 9 Minutes | 48 (24.4%) | 29 (21.6%) |
| 10 to 14 Minutes | 26 (13.2%) | 40 (29.8%) |
| 15 to 19 Minutes | 45 (22.8%) | 21 (15.7%) |
| 20 to 24 Minutes | 4 (2.0%) | 0 (0.0%) |
| 25 to 29 Minutes | 0 (0.0%) | 1 (0.7%) |
| 30 to 34 Minutes | 18 (9.1%) | 6 (4.5%) |
| 35 to 39 Minutes | 3 (1.5%) | 3 (2.2%) |
| 40 to 44 Minutes | 6 (3.0%) | 5 (3.7%) |
| 45 to 59 Minutes | 8 (4.1%) | 9 (6.7%) |
| 60 to 89 Minutes | 16 (8.1%) | 3 (2.2%) |
| 90 or more Minutes | 5 (2.5%) | 0 (0.0%) |
Time of Departure to Work by Sex in Browerville
The most frequent times of departure to work in Browerville are 12:00 PM to 3:59 PM (37, 18.8%) for males and 7:00 AM to 7:29 AM (19, 14.2%) for females.
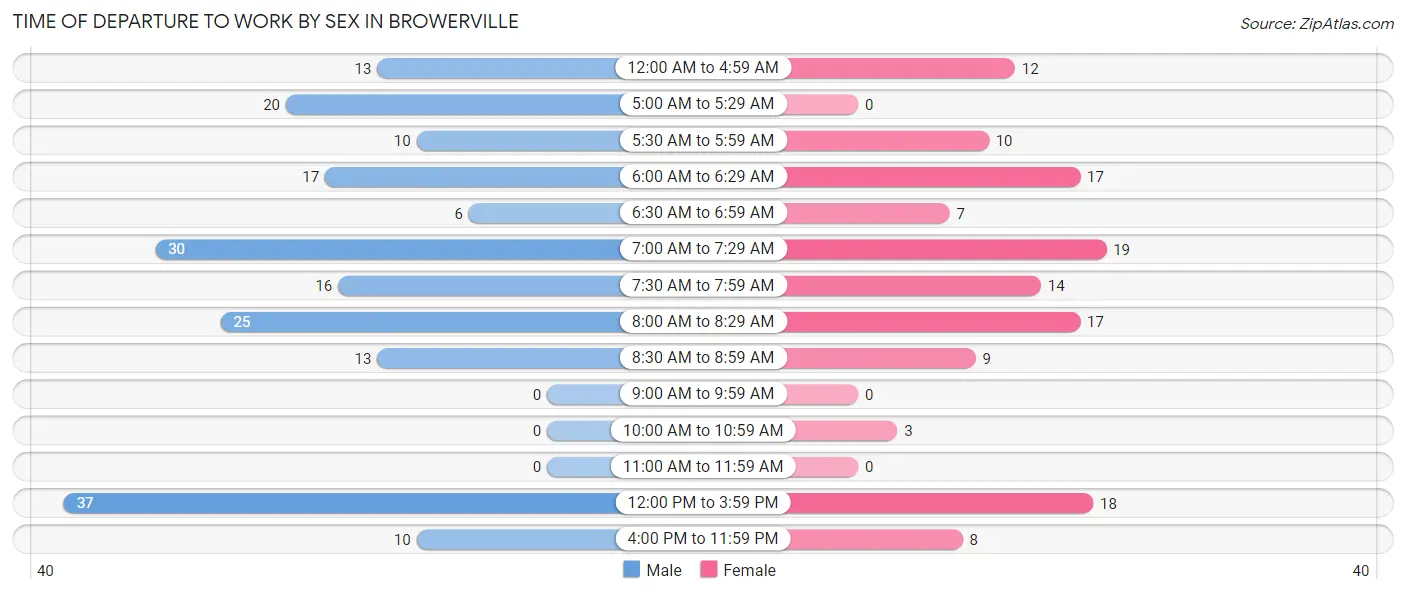
| Time of Departure | Male | Female |
| 12:00 AM to 4:59 AM | 13 (6.6%) | 12 (9.0%) |
| 5:00 AM to 5:29 AM | 20 (10.2%) | 0 (0.0%) |
| 5:30 AM to 5:59 AM | 10 (5.1%) | 10 (7.5%) |
| 6:00 AM to 6:29 AM | 17 (8.6%) | 17 (12.7%) |
| 6:30 AM to 6:59 AM | 6 (3.0%) | 7 (5.2%) |
| 7:00 AM to 7:29 AM | 30 (15.2%) | 19 (14.2%) |
| 7:30 AM to 7:59 AM | 16 (8.1%) | 14 (10.4%) |
| 8:00 AM to 8:29 AM | 25 (12.7%) | 17 (12.7%) |
| 8:30 AM to 8:59 AM | 13 (6.6%) | 9 (6.7%) |
| 9:00 AM to 9:59 AM | 0 (0.0%) | 0 (0.0%) |
| 10:00 AM to 10:59 AM | 0 (0.0%) | 3 (2.2%) |
| 11:00 AM to 11:59 AM | 0 (0.0%) | 0 (0.0%) |
| 12:00 PM to 3:59 PM | 37 (18.8%) | 18 (13.4%) |
| 4:00 PM to 11:59 PM | 10 (5.1%) | 8 (6.0%) |
| Total | 197 (100.0%) | 134 (100.0%) |
Housing Occupancy in Browerville
Occupancy by Ownership in Browerville
Of the total 365 dwellings in Browerville, owner-occupied units account for 217 (59.5%), while renter-occupied units make up 148 (40.6%).
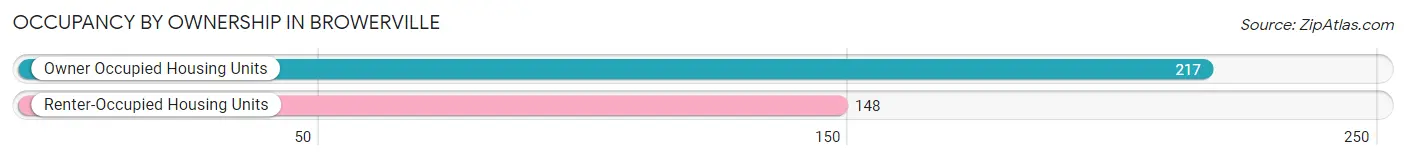
| Occupancy | # Housing Units | % Housing Units |
| Owner Occupied Housing Units | 217 | 59.5% |
| Renter-Occupied Housing Units | 148 | 40.6% |
| Total Occupied Housing Units | 365 | 100.0% |
Occupancy by Household Size in Browerville
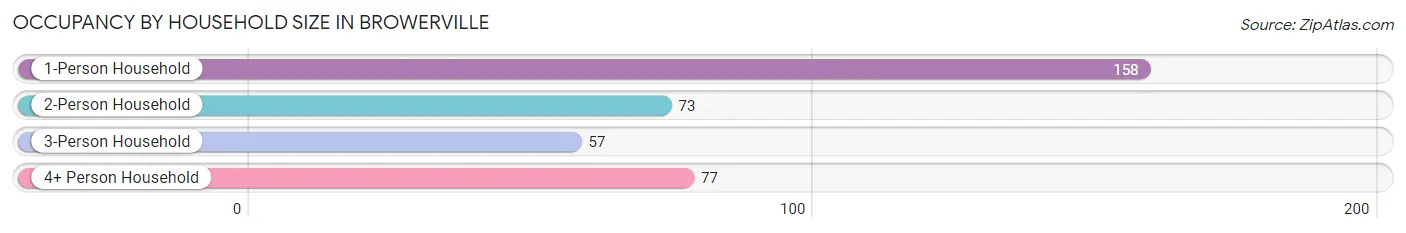
| Household Size | # Housing Units | % Housing Units |
| 1-Person Household | 158 | 43.3% |
| 2-Person Household | 73 | 20.0% |
| 3-Person Household | 57 | 15.6% |
| 4+ Person Household | 77 | 21.1% |
| Total Housing Units | 365 | 100.0% |
Occupancy by Ownership by Household Size in Browerville
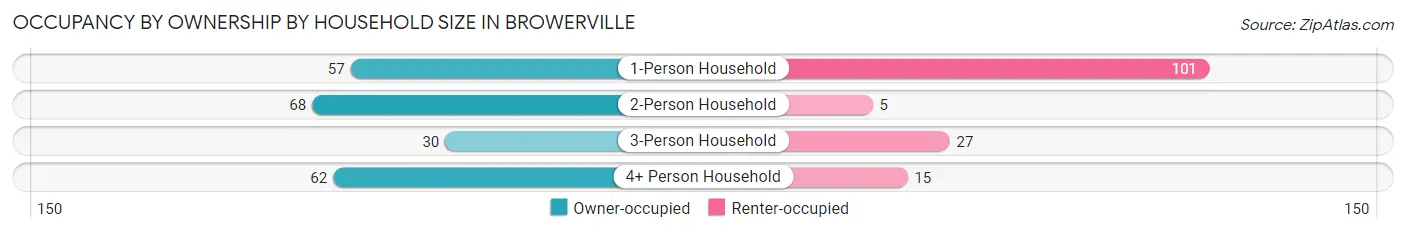
| Household Size | Owner-occupied | Renter-occupied |
| 1-Person Household | 57 (36.1%) | 101 (63.9%) |
| 2-Person Household | 68 (93.1%) | 5 (6.9%) |
| 3-Person Household | 30 (52.6%) | 27 (47.4%) |
| 4+ Person Household | 62 (80.5%) | 15 (19.5%) |
| Total Housing Units | 217 (59.5%) | 148 (40.6%) |
Occupancy by Educational Attainment in Browerville
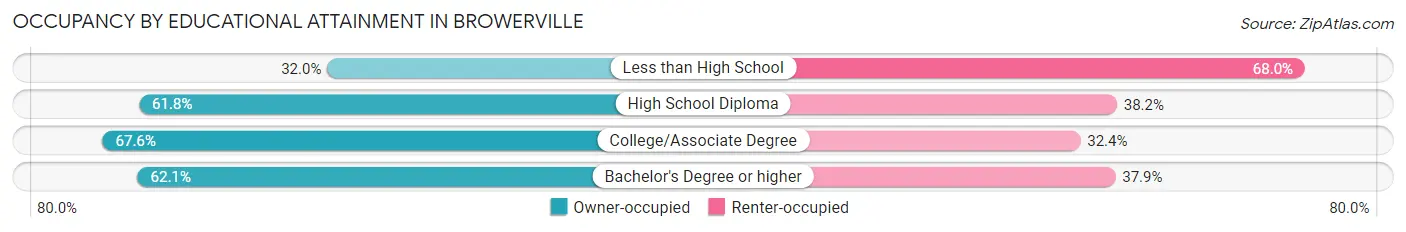
| Household Size | Owner-occupied | Renter-occupied |
| Less than High School | 16 (32.0%) | 34 (68.0%) |
| High School Diploma | 94 (61.8%) | 58 (38.2%) |
| College/Associate Degree | 71 (67.6%) | 34 (32.4%) |
| Bachelor's Degree or higher | 36 (62.1%) | 22 (37.9%) |
Occupancy by Age of Householder in Browerville
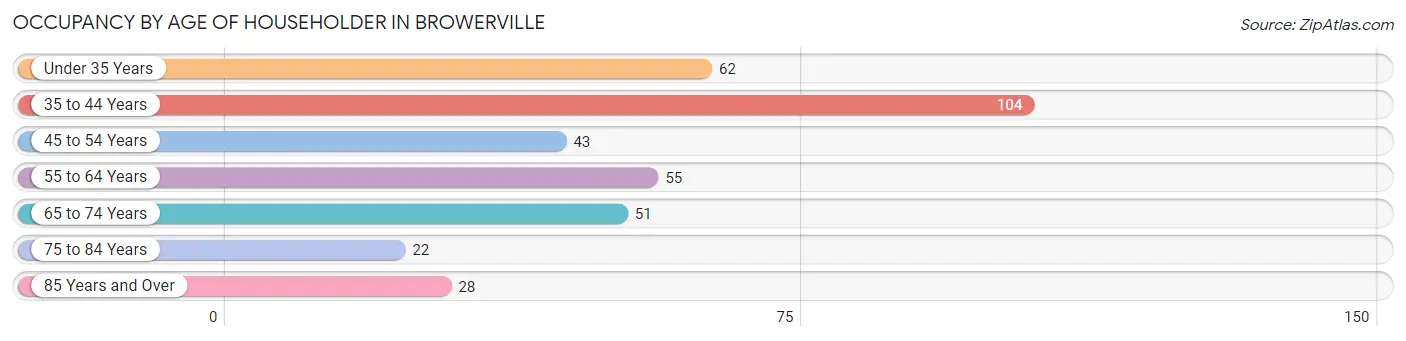
| Age Bracket | # Households | % Households |
| Under 35 Years | 62 | 17.0% |
| 35 to 44 Years | 104 | 28.5% |
| 45 to 54 Years | 43 | 11.8% |
| 55 to 64 Years | 55 | 15.1% |
| 65 to 74 Years | 51 | 14.0% |
| 75 to 84 Years | 22 | 6.0% |
| 85 Years and Over | 28 | 7.7% |
| Total | 365 | 100.0% |
Housing Finances in Browerville
Median Income by Occupancy in Browerville
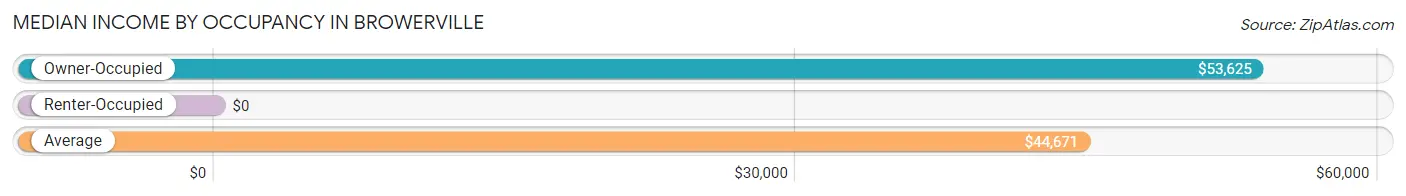
| Occupancy Type | # Households | Median Income |
| Owner-Occupied | 217 (59.5%) | $53,625 |
| Renter-Occupied | 148 (40.6%) | $0 |
| Average | 365 (100.0%) | $44,671 |
Occupancy by Householder Income Bracket in Browerville
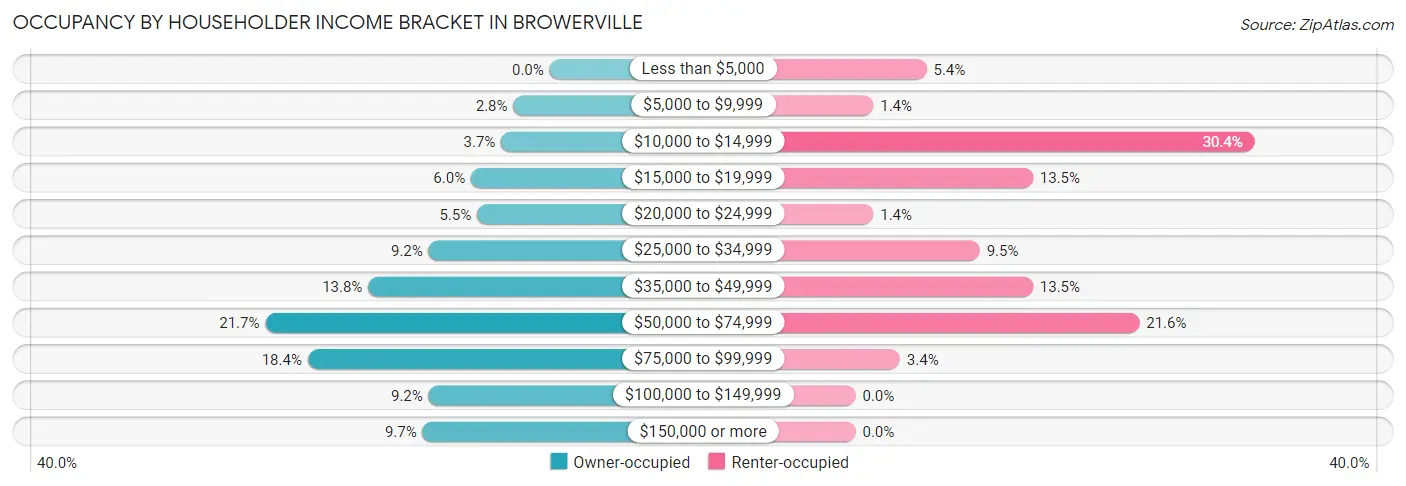
| Income Bracket | Owner-occupied | Renter-occupied |
| Less than $5,000 | 0 (0.0%) | 8 (5.4%) |
| $5,000 to $9,999 | 6 (2.8%) | 2 (1.3%) |
| $10,000 to $14,999 | 8 (3.7%) | 45 (30.4%) |
| $15,000 to $19,999 | 13 (6.0%) | 20 (13.5%) |
| $20,000 to $24,999 | 12 (5.5%) | 2 (1.3%) |
| $25,000 to $34,999 | 20 (9.2%) | 14 (9.5%) |
| $35,000 to $49,999 | 30 (13.8%) | 20 (13.5%) |
| $50,000 to $74,999 | 47 (21.7%) | 32 (21.6%) |
| $75,000 to $99,999 | 40 (18.4%) | 5 (3.4%) |
| $100,000 to $149,999 | 20 (9.2%) | 0 (0.0%) |
| $150,000 or more | 21 (9.7%) | 0 (0.0%) |
| Total | 217 (100.0%) | 148 (100.0%) |
Monthly Housing Cost Tiers in Browerville
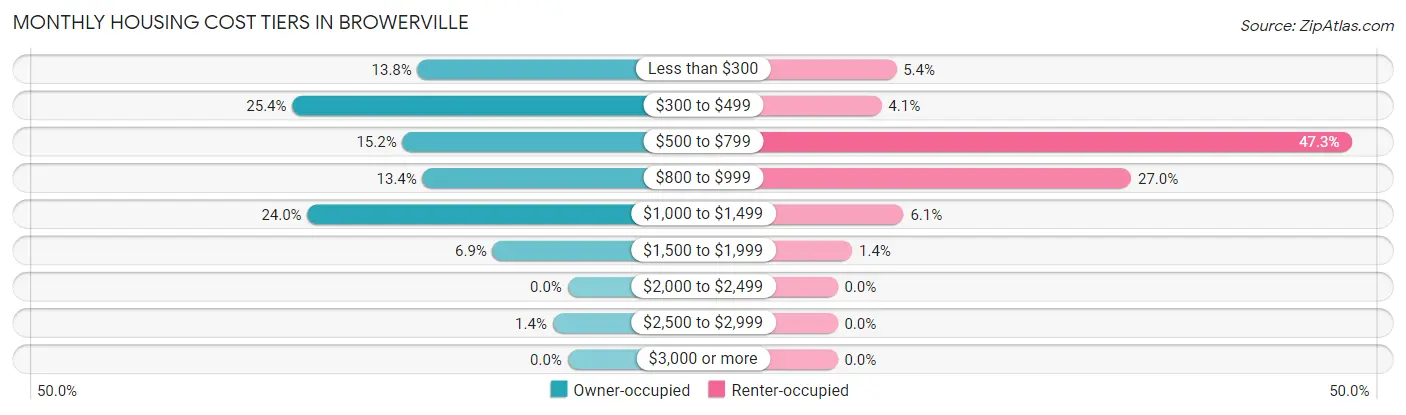
| Monthly Cost | Owner-occupied | Renter-occupied |
| Less than $300 | 30 (13.8%) | 8 (5.4%) |
| $300 to $499 | 55 (25.4%) | 6 (4.1%) |
| $500 to $799 | 33 (15.2%) | 70 (47.3%) |
| $800 to $999 | 29 (13.4%) | 40 (27.0%) |
| $1,000 to $1,499 | 52 (24.0%) | 9 (6.1%) |
| $1,500 to $1,999 | 15 (6.9%) | 2 (1.3%) |
| $2,000 to $2,499 | 0 (0.0%) | 0 (0.0%) |
| $2,500 to $2,999 | 3 (1.4%) | 0 (0.0%) |
| $3,000 or more | 0 (0.0%) | 0 (0.0%) |
| Total | 217 (100.0%) | 148 (100.0%) |
Physical Housing Characteristics in Browerville
Housing Structures in Browerville
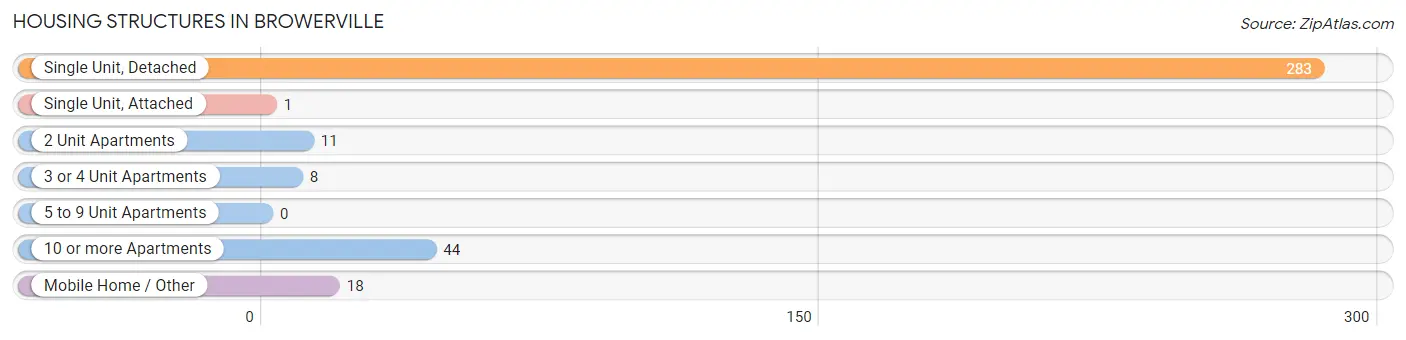
| Structure Type | # Housing Units | % Housing Units |
| Single Unit, Detached | 283 | 77.5% |
| Single Unit, Attached | 1 | 0.3% |
| 2 Unit Apartments | 11 | 3.0% |
| 3 or 4 Unit Apartments | 8 | 2.2% |
| 5 to 9 Unit Apartments | 0 | 0.0% |
| 10 or more Apartments | 44 | 12.0% |
| Mobile Home / Other | 18 | 4.9% |
| Total | 365 | 100.0% |
Housing Structures by Occupancy in Browerville
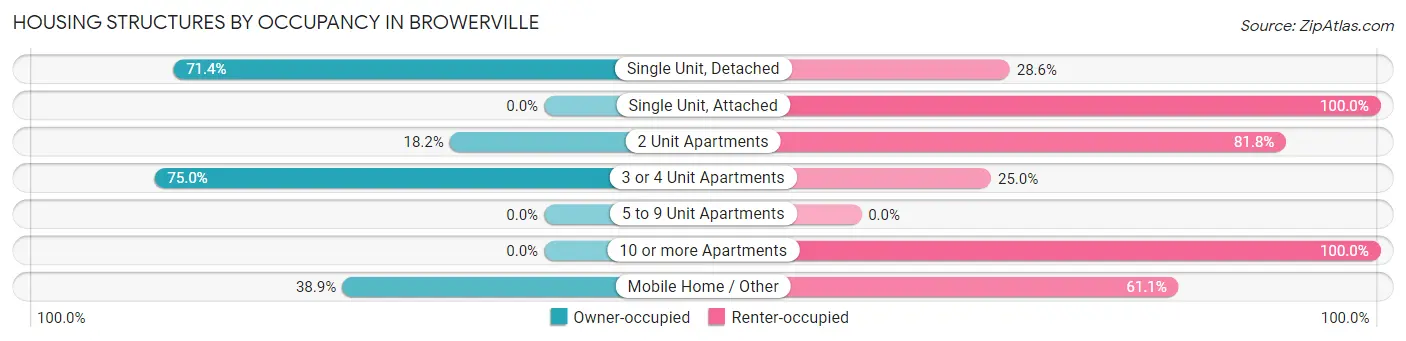
| Structure Type | Owner-occupied | Renter-occupied |
| Single Unit, Detached | 202 (71.4%) | 81 (28.6%) |
| Single Unit, Attached | 0 (0.0%) | 1 (100.0%) |
| 2 Unit Apartments | 2 (18.2%) | 9 (81.8%) |
| 3 or 4 Unit Apartments | 6 (75.0%) | 2 (25.0%) |
| 5 to 9 Unit Apartments | 0 (0.0%) | 0 (0.0%) |
| 10 or more Apartments | 0 (0.0%) | 44 (100.0%) |
| Mobile Home / Other | 7 (38.9%) | 11 (61.1%) |
| Total | 217 (59.5%) | 148 (40.6%) |
Housing Structures by Number of Rooms in Browerville
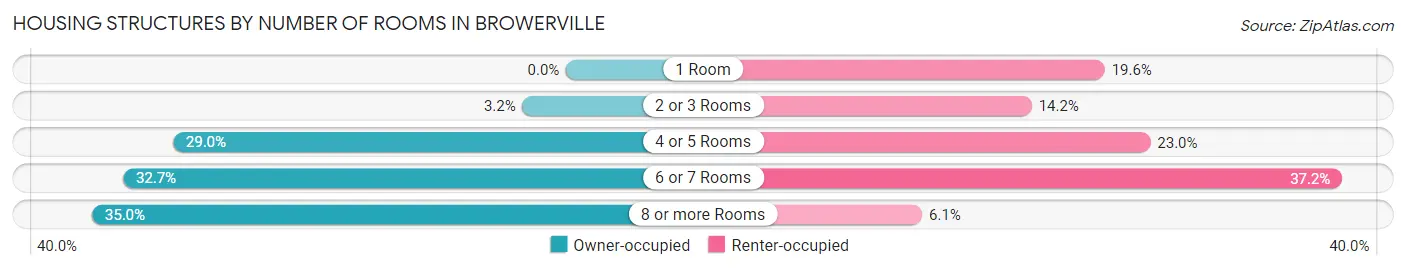
| Number of Rooms | Owner-occupied | Renter-occupied |
| 1 Room | 0 (0.0%) | 29 (19.6%) |
| 2 or 3 Rooms | 7 (3.2%) | 21 (14.2%) |
| 4 or 5 Rooms | 63 (29.0%) | 34 (23.0%) |
| 6 or 7 Rooms | 71 (32.7%) | 55 (37.2%) |
| 8 or more Rooms | 76 (35.0%) | 9 (6.1%) |
| Total | 217 (100.0%) | 148 (100.0%) |
Housing Structure by Heating Type in Browerville
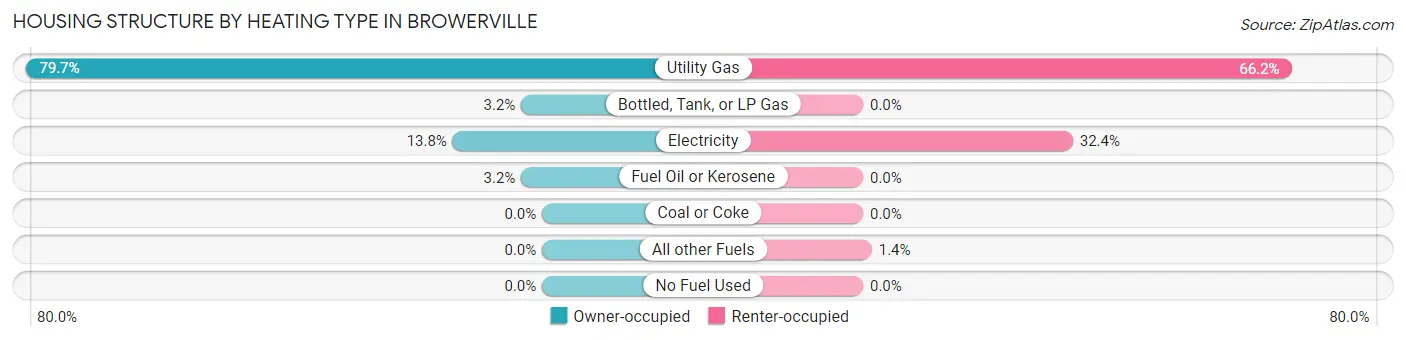
| Heating Type | Owner-occupied | Renter-occupied |
| Utility Gas | 173 (79.7%) | 98 (66.2%) |
| Bottled, Tank, or LP Gas | 7 (3.2%) | 0 (0.0%) |
| Electricity | 30 (13.8%) | 48 (32.4%) |
| Fuel Oil or Kerosene | 7 (3.2%) | 0 (0.0%) |
| Coal or Coke | 0 (0.0%) | 0 (0.0%) |
| All other Fuels | 0 (0.0%) | 2 (1.3%) |
| No Fuel Used | 0 (0.0%) | 0 (0.0%) |
| Total | 217 (100.0%) | 148 (100.0%) |
Household Vehicle Usage in Browerville
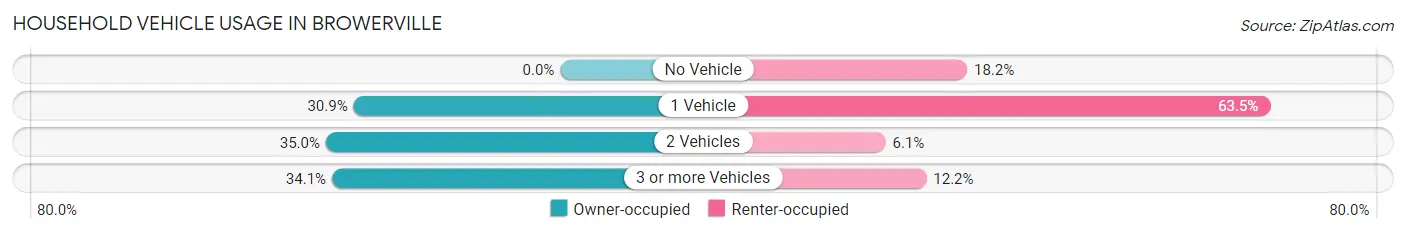
| Vehicles per Household | Owner-occupied | Renter-occupied |
| No Vehicle | 0 (0.0%) | 27 (18.2%) |
| 1 Vehicle | 67 (30.9%) | 94 (63.5%) |
| 2 Vehicles | 76 (35.0%) | 9 (6.1%) |
| 3 or more Vehicles | 74 (34.1%) | 18 (12.2%) |
| Total | 217 (100.0%) | 148 (100.0%) |
Real Estate & Mortgages in Browerville
Real Estate and Mortgage Overview in Browerville
| Characteristic | Without Mortgage | With Mortgage |
| Housing Units | 88 | 129 |
| Median Property Value | $99,300 | $111,600 |
| Median Household Income | $39,167 | $21 |
| Monthly Housing Costs | $382 | $0 |
| Real Estate Taxes | $1,147 | $2 |
Property Value by Mortgage Status in Browerville
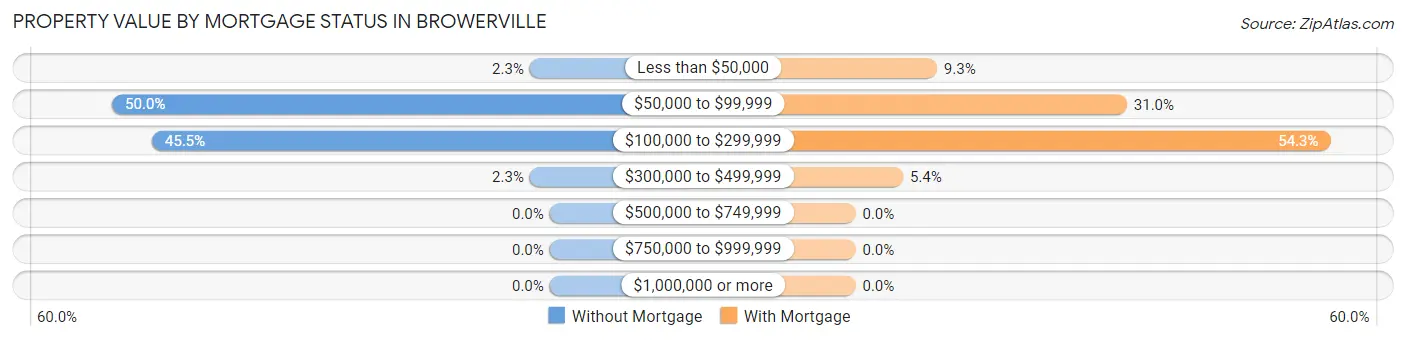
| Property Value | Without Mortgage | With Mortgage |
| Less than $50,000 | 2 (2.3%) | 12 (9.3%) |
| $50,000 to $99,999 | 44 (50.0%) | 40 (31.0%) |
| $100,000 to $299,999 | 40 (45.5%) | 70 (54.3%) |
| $300,000 to $499,999 | 2 (2.3%) | 7 (5.4%) |
| $500,000 to $749,999 | 0 (0.0%) | 0 (0.0%) |
| $750,000 to $999,999 | 0 (0.0%) | 0 (0.0%) |
| $1,000,000 or more | 0 (0.0%) | 0 (0.0%) |
| Total | 88 (100.0%) | 129 (100.0%) |
Household Income by Mortgage Status in Browerville
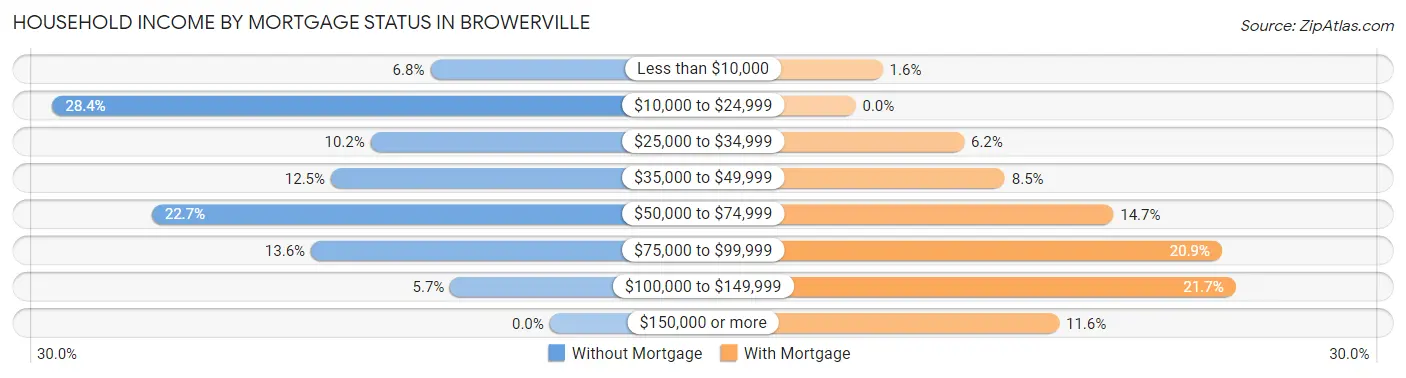
| Household Income | Without Mortgage | With Mortgage |
| Less than $10,000 | 6 (6.8%) | 2 (1.5%) |
| $10,000 to $24,999 | 25 (28.4%) | 0 (0.0%) |
| $25,000 to $34,999 | 9 (10.2%) | 8 (6.2%) |
| $35,000 to $49,999 | 11 (12.5%) | 11 (8.5%) |
| $50,000 to $74,999 | 20 (22.7%) | 19 (14.7%) |
| $75,000 to $99,999 | 12 (13.6%) | 27 (20.9%) |
| $100,000 to $149,999 | 5 (5.7%) | 28 (21.7%) |
| $150,000 or more | 0 (0.0%) | 15 (11.6%) |
| Total | 88 (100.0%) | 129 (100.0%) |
Property Value to Household Income Ratio in Browerville
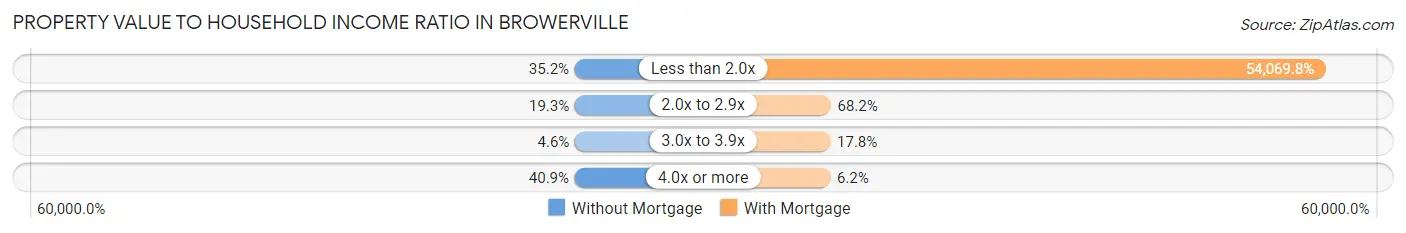
| Value-to-Income Ratio | Without Mortgage | With Mortgage |
| Less than 2.0x | 31 (35.2%) | 69,750 (54,069.8%) |
| 2.0x to 2.9x | 17 (19.3%) | 88 (68.2%) |
| 3.0x to 3.9x | 4 (4.5%) | 23 (17.8%) |
| 4.0x or more | 36 (40.9%) | 8 (6.2%) |
| Total | 88 (100.0%) | 129 (100.0%) |
Real Estate Taxes by Mortgage Status in Browerville
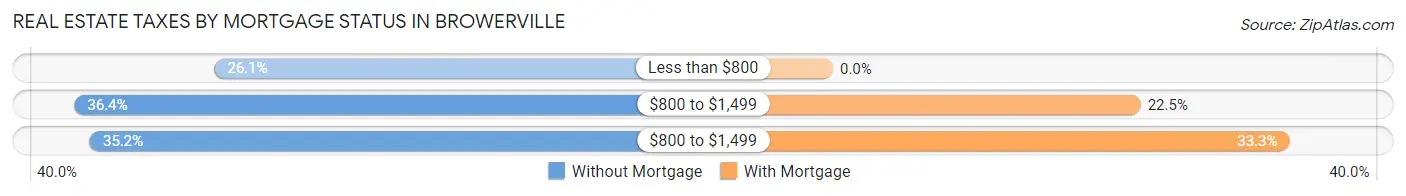
| Property Taxes | Without Mortgage | With Mortgage |
| Less than $800 | 23 (26.1%) | 0 (0.0%) |
| $800 to $1,499 | 32 (36.4%) | 29 (22.5%) |
| $800 to $1,499 | 31 (35.2%) | 43 (33.3%) |
| Total | 88 (100.0%) | 129 (100.0%) |
Health & Disability in Browerville
Health Insurance Coverage by Age in Browerville
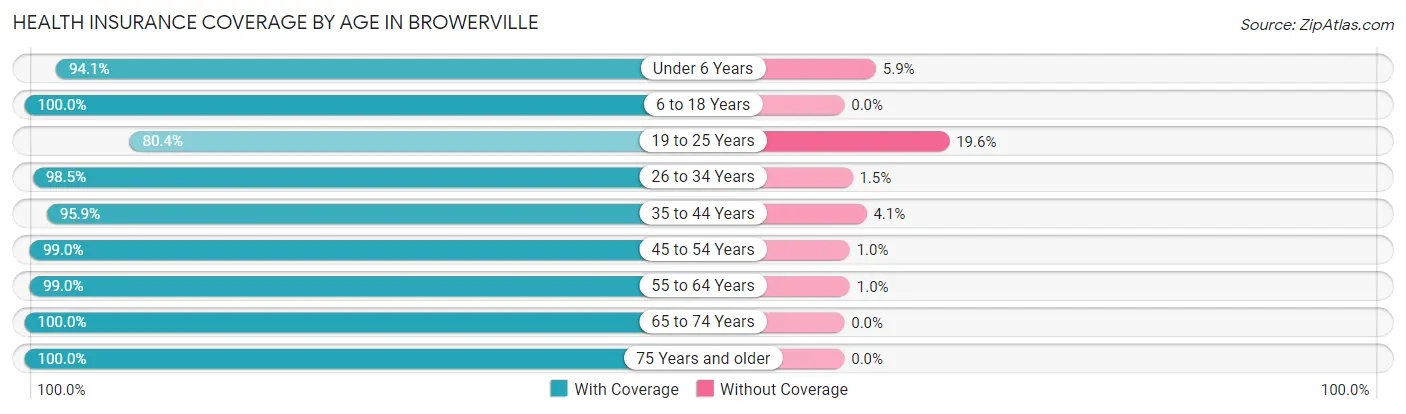
| Age Bracket | With Coverage | Without Coverage |
| Under 6 Years | 64 (94.1%) | 4 (5.9%) |
| 6 to 18 Years | 221 (100.0%) | 0 (0.0%) |
| 19 to 25 Years | 37 (80.4%) | 9 (19.6%) |
| 26 to 34 Years | 65 (98.5%) | 1 (1.5%) |
| 35 to 44 Years | 139 (95.9%) | 6 (4.1%) |
| 45 to 54 Years | 98 (99.0%) | 1 (1.0%) |
| 55 to 64 Years | 96 (99.0%) | 1 (1.0%) |
| 65 to 74 Years | 88 (100.0%) | 0 (0.0%) |
| 75 Years and older | 69 (100.0%) | 0 (0.0%) |
| Total | 877 (97.6%) | 22 (2.5%) |
Health Insurance Coverage by Citizenship Status in Browerville
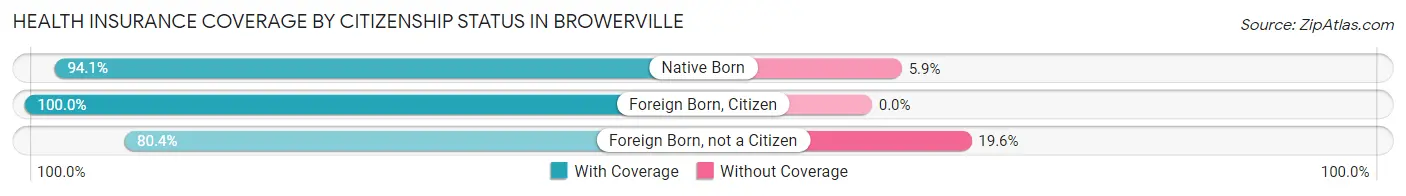
| Citizenship Status | With Coverage | Without Coverage |
| Native Born | 64 (94.1%) | 4 (5.9%) |
| Foreign Born, Citizen | 221 (100.0%) | 0 (0.0%) |
| Foreign Born, not a Citizen | 37 (80.4%) | 9 (19.6%) |
Health Insurance Coverage by Household Income in Browerville
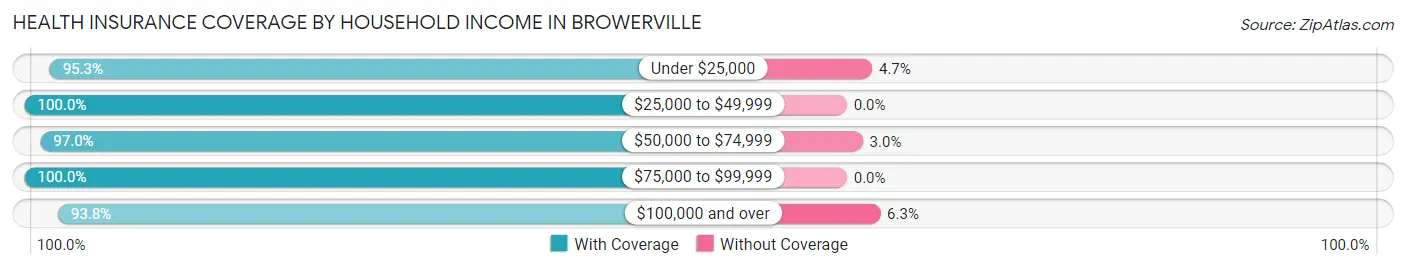
| Household Income | With Coverage | Without Coverage |
| Under $25,000 | 121 (95.3%) | 6 (4.7%) |
| $25,000 to $49,999 | 198 (100.0%) | 0 (0.0%) |
| $50,000 to $74,999 | 229 (97.0%) | 7 (3.0%) |
| $75,000 to $99,999 | 166 (100.0%) | 0 (0.0%) |
| $100,000 and over | 135 (93.8%) | 9 (6.2%) |
Public vs Private Health Insurance Coverage by Age in Browerville
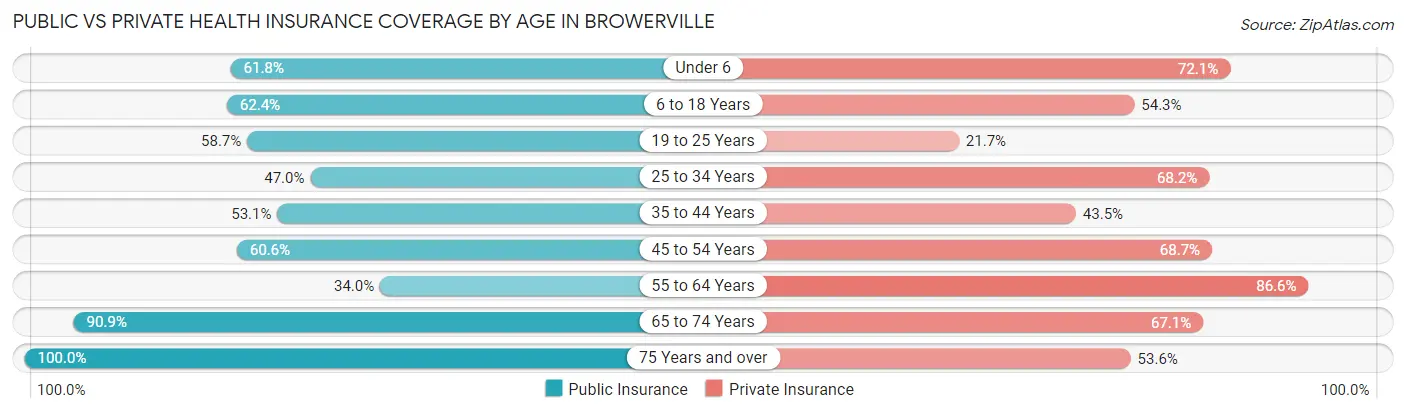
| Age Bracket | Public Insurance | Private Insurance |
| Under 6 | 42 (61.8%) | 49 (72.1%) |
| 6 to 18 Years | 138 (62.4%) | 120 (54.3%) |
| 19 to 25 Years | 27 (58.7%) | 10 (21.7%) |
| 25 to 34 Years | 31 (47.0%) | 45 (68.2%) |
| 35 to 44 Years | 77 (53.1%) | 63 (43.4%) |
| 45 to 54 Years | 60 (60.6%) | 68 (68.7%) |
| 55 to 64 Years | 33 (34.0%) | 84 (86.6%) |
| 65 to 74 Years | 80 (90.9%) | 59 (67.0%) |
| 75 Years and over | 69 (100.0%) | 37 (53.6%) |
| Total | 557 (62.0%) | 535 (59.5%) |
Disability Status by Sex by Age in Browerville
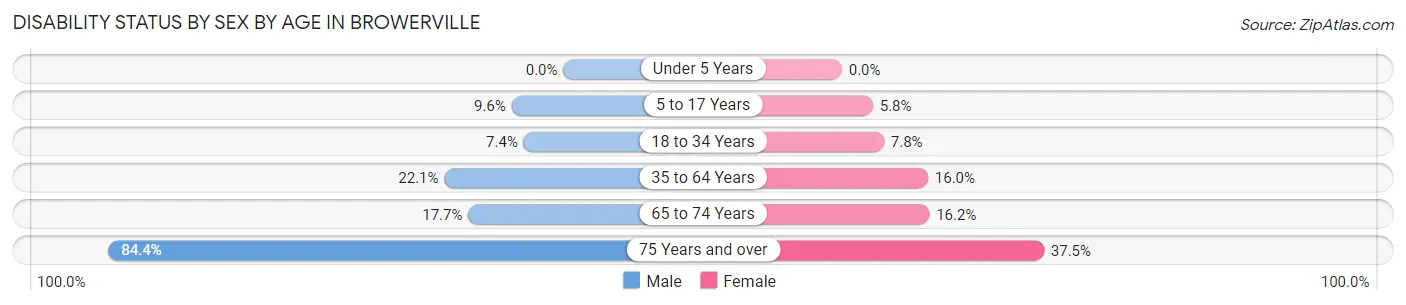
| Age Bracket | Male | Female |
| Under 5 Years | 0 (0.0%) | 0 (0.0%) |
| 5 to 17 Years | 12 (9.6%) | 5 (5.8%) |
| 18 to 34 Years | 5 (7.3%) | 5 (7.8%) |
| 35 to 64 Years | 38 (22.1%) | 27 (16.0%) |
| 65 to 74 Years | 9 (17.6%) | 6 (16.2%) |
| 75 Years and over | 38 (84.4%) | 9 (37.5%) |
Disability Class by Sex by Age in Browerville
Disability Class: Hearing Difficulty
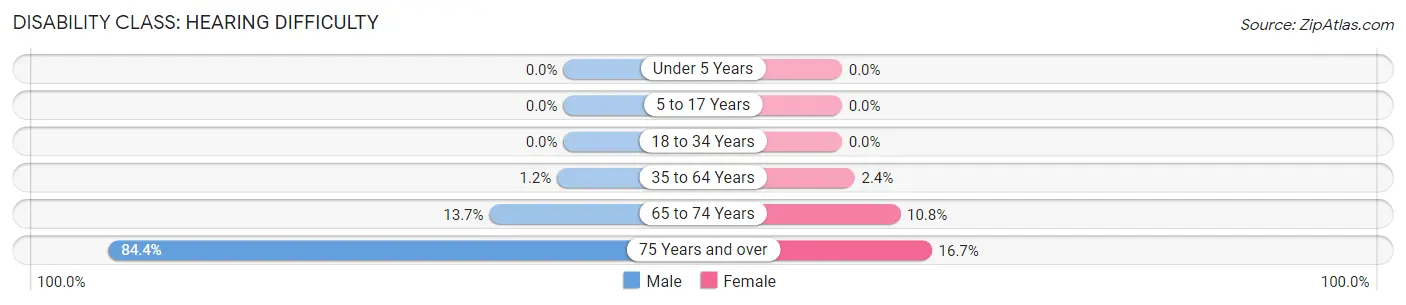
| Age Bracket | Male | Female |
| Under 5 Years | 0 (0.0%) | 0 (0.0%) |
| 5 to 17 Years | 0 (0.0%) | 0 (0.0%) |
| 18 to 34 Years | 0 (0.0%) | 0 (0.0%) |
| 35 to 64 Years | 2 (1.2%) | 4 (2.4%) |
| 65 to 74 Years | 7 (13.7%) | 4 (10.8%) |
| 75 Years and over | 38 (84.4%) | 4 (16.7%) |
Disability Class: Vision Difficulty
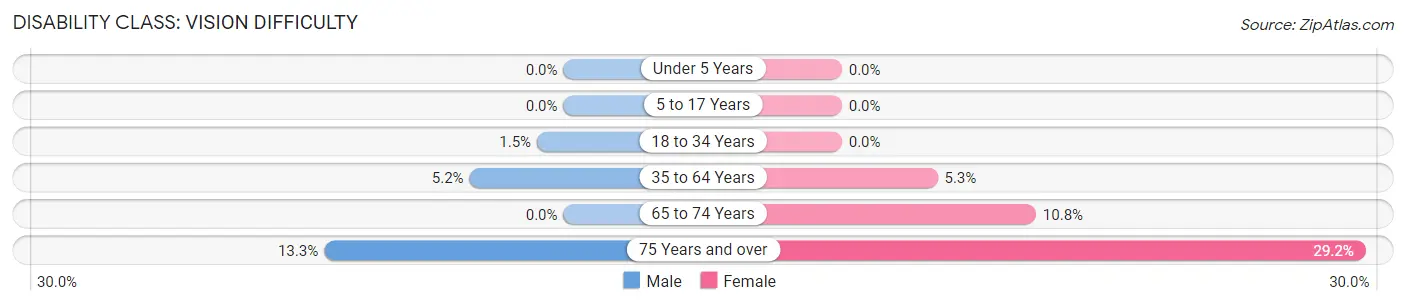
| Age Bracket | Male | Female |
| Under 5 Years | 0 (0.0%) | 0 (0.0%) |
| 5 to 17 Years | 0 (0.0%) | 0 (0.0%) |
| 18 to 34 Years | 1 (1.5%) | 0 (0.0%) |
| 35 to 64 Years | 9 (5.2%) | 9 (5.3%) |
| 65 to 74 Years | 0 (0.0%) | 4 (10.8%) |
| 75 Years and over | 6 (13.3%) | 7 (29.2%) |
Disability Class: Cognitive Difficulty
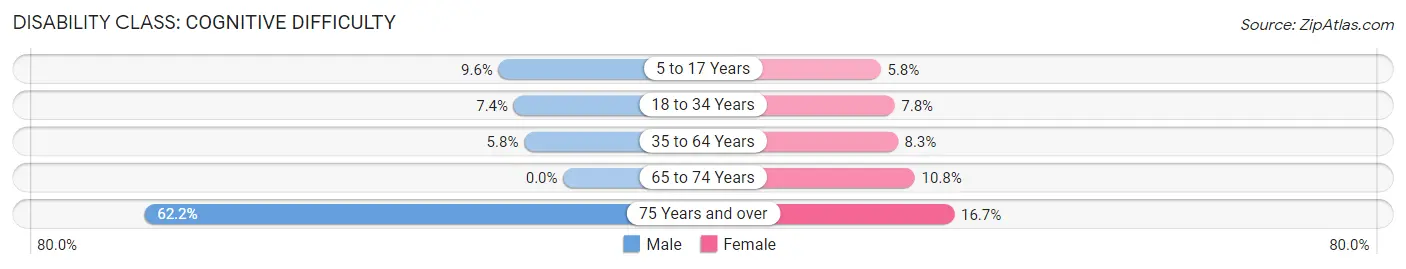
| Age Bracket | Male | Female |
| 5 to 17 Years | 12 (9.6%) | 5 (5.8%) |
| 18 to 34 Years | 5 (7.3%) | 5 (7.8%) |
| 35 to 64 Years | 10 (5.8%) | 14 (8.3%) |
| 65 to 74 Years | 0 (0.0%) | 4 (10.8%) |
| 75 Years and over | 28 (62.2%) | 4 (16.7%) |
Disability Class: Ambulatory Difficulty
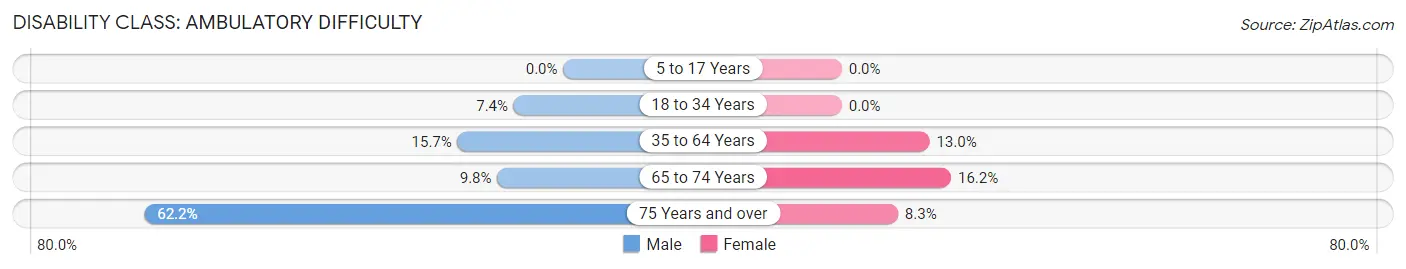
| Age Bracket | Male | Female |
| 5 to 17 Years | 0 (0.0%) | 0 (0.0%) |
| 18 to 34 Years | 5 (7.3%) | 0 (0.0%) |
| 35 to 64 Years | 27 (15.7%) | 22 (13.0%) |
| 65 to 74 Years | 5 (9.8%) | 6 (16.2%) |
| 75 Years and over | 28 (62.2%) | 2 (8.3%) |
Disability Class: Self-Care Difficulty
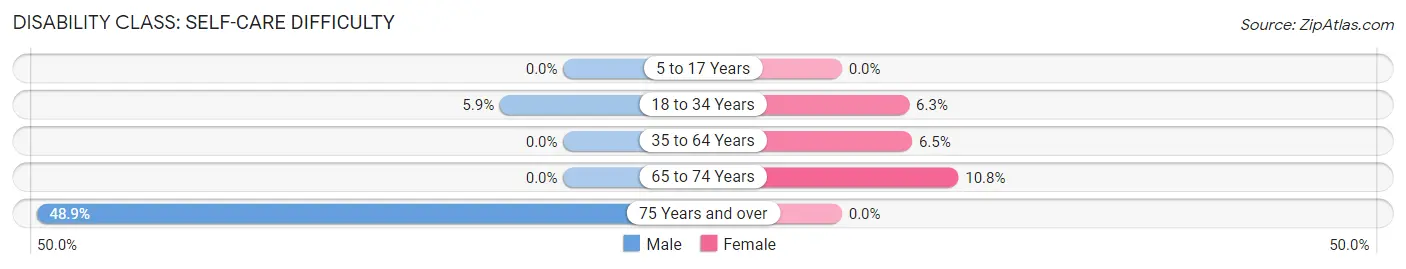
| Age Bracket | Male | Female |
| 5 to 17 Years | 0 (0.0%) | 0 (0.0%) |
| 18 to 34 Years | 4 (5.9%) | 4 (6.2%) |
| 35 to 64 Years | 0 (0.0%) | 11 (6.5%) |
| 65 to 74 Years | 0 (0.0%) | 4 (10.8%) |
| 75 Years and over | 22 (48.9%) | 0 (0.0%) |
Technology Access in Browerville
Computing Device Access in Browerville
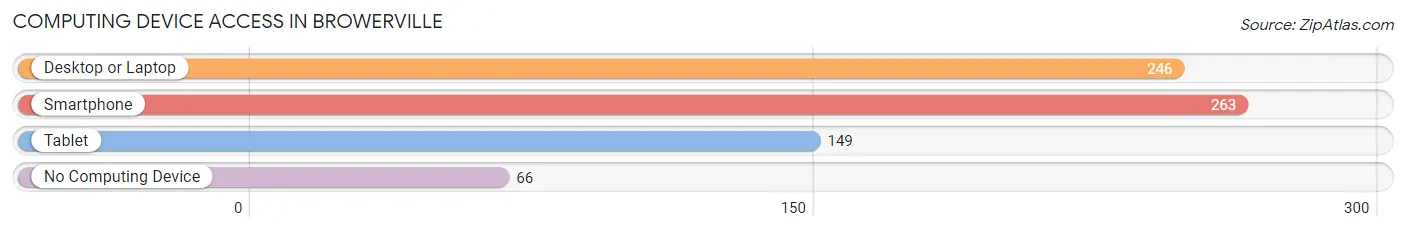
| Device Type | # Households | % Households |
| Desktop or Laptop | 246 | 67.4% |
| Smartphone | 263 | 72.1% |
| Tablet | 149 | 40.8% |
| No Computing Device | 66 | 18.1% |
| Total | 365 | 100.0% |
Internet Access in Browerville
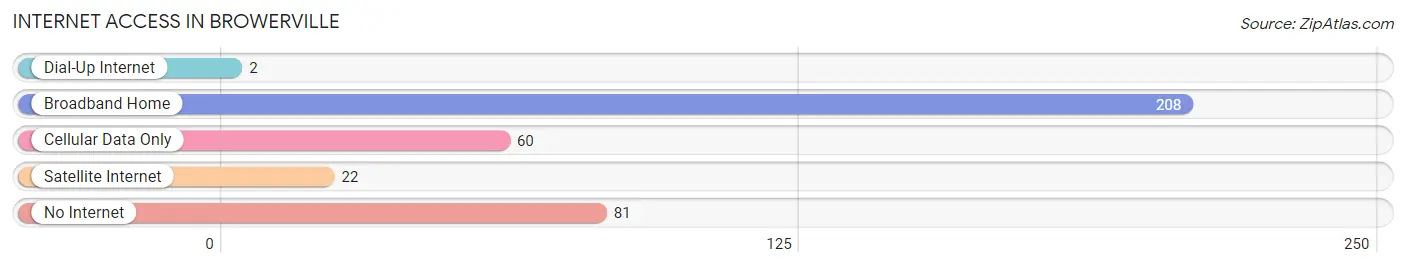
| Internet Type | # Households | % Households |
| Dial-Up Internet | 2 | 0.5% |
| Broadband Home | 208 | 57.0% |
| Cellular Data Only | 60 | 16.4% |
| Satellite Internet | 22 | 6.0% |
| No Internet | 81 | 22.2% |
| Total | 365 | 100.0% |
Browerville Summary
History
The small town of Browerville, Minnesota is located in Todd County, in the central part of the state. It is situated on the banks of the Long Prairie River, and is surrounded by rolling hills and farmland. The town was founded in 1881 by a group of settlers from Wisconsin, who were looking for a place to settle and start a new life. The town was named after one of the settlers, John Brown, who had a farm nearby.
The town grew slowly but steadily over the years, and by the early 1900s it had become a thriving community. It had a post office, a general store, a blacksmith shop, a hotel, a bank, and several churches. The town also had a school, which was built in 1891 and is still in use today.
The town was also home to a number of businesses, including a creamery, a lumber mill, a flour mill, and a sawmill. These businesses provided employment for many of the town’s residents, and helped to make Browerville a prosperous community.
In the early 1900s, the town was also home to a number of cultural and recreational activities. The town had a band, a baseball team, and a theater. The theater was especially popular, and it was the site of many plays and concerts.
The town continued to grow and prosper throughout the 20th century. In the 1950s, the town was home to a number of new businesses, including a grocery store, a hardware store, and a clothing store. The town also had a number of new churches, and a new school was built in the 1960s.
Today, Browerville is a small but vibrant community. It is home to a number of businesses, including a bank, a grocery store, a hardware store, and a clothing store. The town also has a post office, a library, and a number of churches. The town is also home to a number of recreational activities, including a golf course, a swimming pool, and a number of parks.
Geography
Browerville is located in Todd County, in the central part of Minnesota. It is situated on the banks of the Long Prairie River, and is surrounded by rolling hills and farmland. The town is located about 40 miles northwest of St. Cloud, and about 70 miles northwest of Minneapolis.
The town has a total area of 1.2 square miles, all of which is land. The town is located at an elevation of 1,072 feet above sea level. The climate in Browerville is generally mild, with cold winters and warm summers.
Economy
The economy of Browerville is largely based on agriculture. The town is home to a number of farms, which produce a variety of crops, including corn, soybeans, and wheat. The town also has a number of businesses, including a bank, a grocery store, a hardware store, and a clothing store.
The town is also home to a number of manufacturing businesses, including a lumber mill, a flour mill, and a sawmill. These businesses provide employment for many of the town’s residents.
Demographics
As of the 2010 census, the population of Browerville was 1,092. The racial makeup of the town was 97.3% White, 0.7% African American, 0.2% Native American, 0.2% Asian, 0.1% from other races, and 1.5% from two or more races. Hispanic or Latino of any race were 0.7% of the population.
The median income for a household in the town was $41,250, and the median income for a family was $50,000. The per capita income for the town was $19,945. About 8.3% of families and 10.2% of the population were below the poverty line, including 11.3% of those under age 18 and 8.3% of those age 65 or over.
Common Questions
What is Per Capita Income in Browerville?
Per Capita income in Browerville is $23,443.
What is the Median Family Income in Browerville?
Median Family Income in Browerville is $62,500.
What is the Median Household income in Browerville?
Median Household Income in Browerville is $44,671.
What is Income or Wage Gap in Browerville?
Income or Wage Gap in Browerville is 17.3%.
Women in Browerville earn 82.7 cents for every dollar earned by a man.
What is Inequality or Gini Index in Browerville?
Inequality or Gini Index in Browerville is 0.44.
What is the Total Population of Browerville?
Total Population of Browerville is 899.
What is the Total Male Population of Browerville?
Total Male Population of Browerville is 498.
What is the Total Female Population of Browerville?
Total Female Population of Browerville is 401.
What is the Ratio of Males per 100 Females in Browerville?
There are 124.19 Males per 100 Females in Browerville.
What is the Ratio of Females per 100 Males in Browerville?
There are 80.52 Females per 100 Males in Browerville.
What is the Median Population Age in Browerville?
Median Population Age in Browerville is 38.1 Years.
What is the Average Family Size in Browerville
Average Family Size in Browerville is 3.4 People.
What is the Average Household Size in Browerville
Average Household Size in Browerville is 2.4 People.
How Large is the Labor Force in Browerville?
There are 416 People in the Labor Forcein in Browerville.
What is the Percentage of People in the Labor Force in Browerville?
59.6% of People are in the Labor Force in Browerville.
What is the Unemployment Rate in Browerville?
Unemployment Rate in Browerville is 11.3%.