Brainerd, MN Map & Demographics
Brainerd Map
Brainerd Overview
$28,313
PER CAPITA INCOME
$53,423
AVG FAMILY INCOME
$46,933
AVG HOUSEHOLD INCOME
25.8%
WAGE / INCOME GAP [ % ]
74.2¢/ $1
WAGE / INCOME GAP [ $ ]
0.43
INEQUALITY / GINI INDEX
14,412
TOTAL POPULATION
6,706
MALE POPULATION
7,706
FEMALE POPULATION
87.02
MALES / 100 FEMALES
114.91
FEMALES / 100 MALES
36.0
MEDIAN AGE
2.9
AVG FAMILY SIZE
2.2
AVG HOUSEHOLD SIZE
7,348
LABOR FORCE [ PEOPLE ]
64.2%
PERCENT IN LABOR FORCE
7.4%
UNEMPLOYMENT RATE
Brainerd Zip Codes
Brainerd Area Codes
Income in Brainerd
Income Overview in Brainerd
Per Capita Income in Brainerd is $28,313, while median incomes of families and households are $53,423 and $46,933 respectively.
| Characteristic | Number | Measure |
| Per Capita Income | 14,412 | $28,313 |
| Median Family Income | 3,257 | $53,423 |
| Mean Family Income | 3,257 | $73,056 |
| Median Household Income | 6,223 | $46,933 |
| Mean Household Income | 6,223 | $61,717 |
| Income Deficit | 3,257 | $0 |
| Wage / Income Gap (%) | 14,412 | 25.84% |
| Wage / Income Gap ($) | 14,412 | 74.16¢ per $1 |
| Gini / Inequality Index | 14,412 | 0.43 |
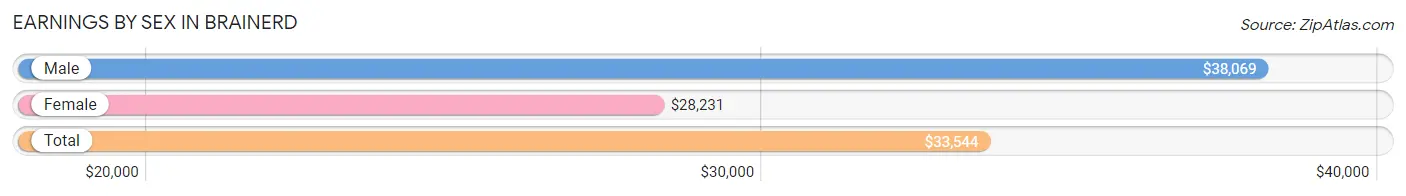
Earnings by Sex in Brainerd
Average Earnings in Brainerd are $33,544, $38,069 for men and $28,231 for women, a difference of 25.8%.
| Sex | Number | Average Earnings |
| Male | 3,714 (47.9%) | $38,069 |
| Female | 4,044 (52.1%) | $28,231 |
| Total | 7,758 (100.0%) | $33,544 |
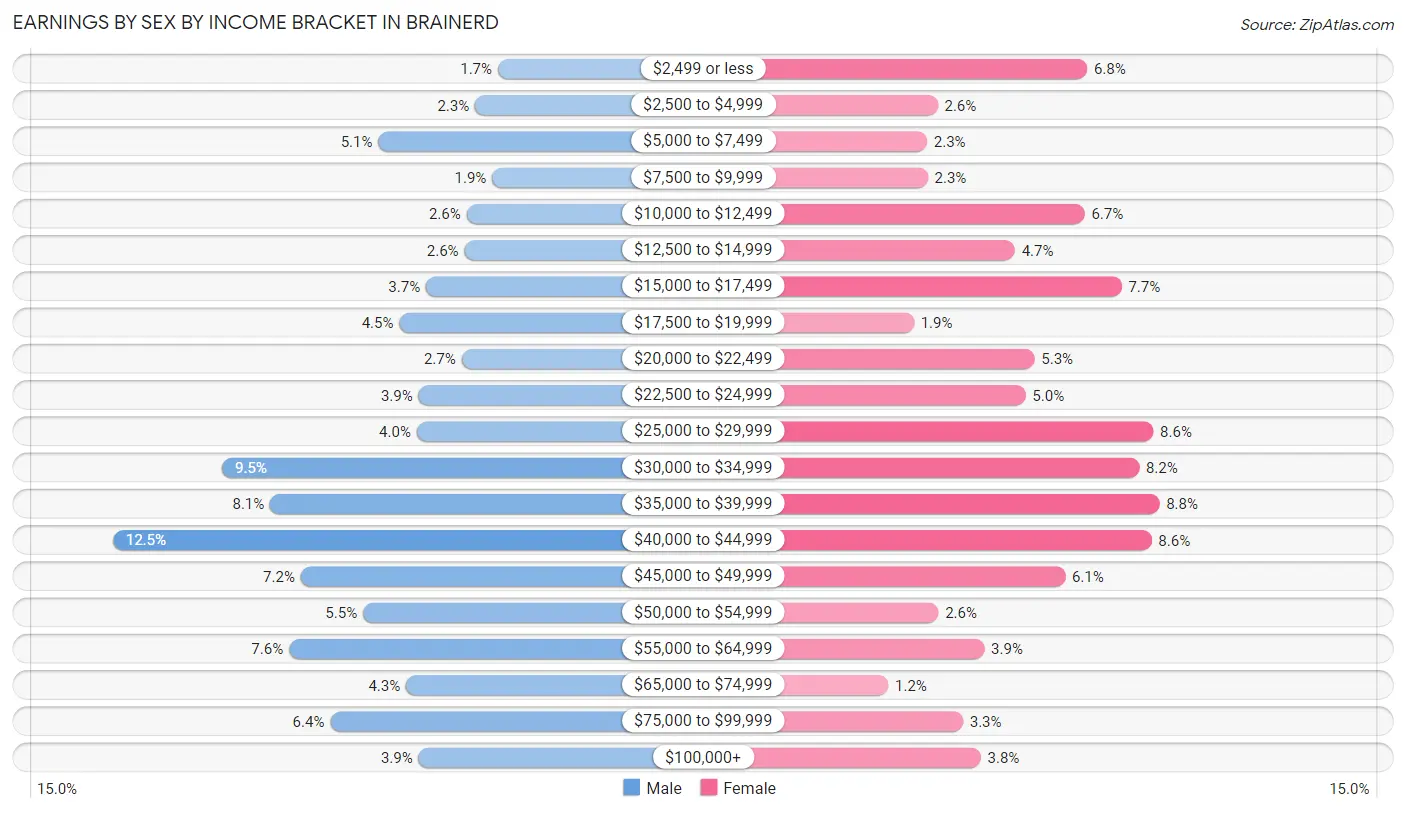
Earnings by Sex by Income Bracket in Brainerd
The most common earnings brackets in Brainerd are $40,000 to $44,999 for men (465 | 12.5%) and $35,000 to $39,999 for women (355 | 8.8%).
| Income | Male | Female |
| $2,499 or less | 63 (1.7%) | 273 (6.8%) |
| $2,500 to $4,999 | 87 (2.3%) | 103 (2.5%) |
| $5,000 to $7,499 | 188 (5.1%) | 91 (2.2%) |
| $7,500 to $9,999 | 69 (1.9%) | 92 (2.3%) |
| $10,000 to $12,499 | 96 (2.6%) | 270 (6.7%) |
| $12,500 to $14,999 | 98 (2.6%) | 191 (4.7%) |
| $15,000 to $17,499 | 138 (3.7%) | 312 (7.7%) |
| $17,500 to $19,999 | 166 (4.5%) | 76 (1.9%) |
| $20,000 to $22,499 | 101 (2.7%) | 213 (5.3%) |
| $22,500 to $24,999 | 146 (3.9%) | 203 (5.0%) |
| $25,000 to $29,999 | 148 (4.0%) | 348 (8.6%) |
| $30,000 to $34,999 | 351 (9.5%) | 332 (8.2%) |
| $35,000 to $39,999 | 301 (8.1%) | 355 (8.8%) |
| $40,000 to $44,999 | 465 (12.5%) | 346 (8.6%) |
| $45,000 to $49,999 | 269 (7.2%) | 248 (6.1%) |
| $50,000 to $54,999 | 204 (5.5%) | 104 (2.6%) |
| $55,000 to $64,999 | 281 (7.6%) | 156 (3.9%) |
| $65,000 to $74,999 | 159 (4.3%) | 47 (1.2%) |
| $75,000 to $99,999 | 238 (6.4%) | 132 (3.3%) |
| $100,000+ | 146 (3.9%) | 152 (3.8%) |
| Total | 3,714 (100.0%) | 4,044 (100.0%) |
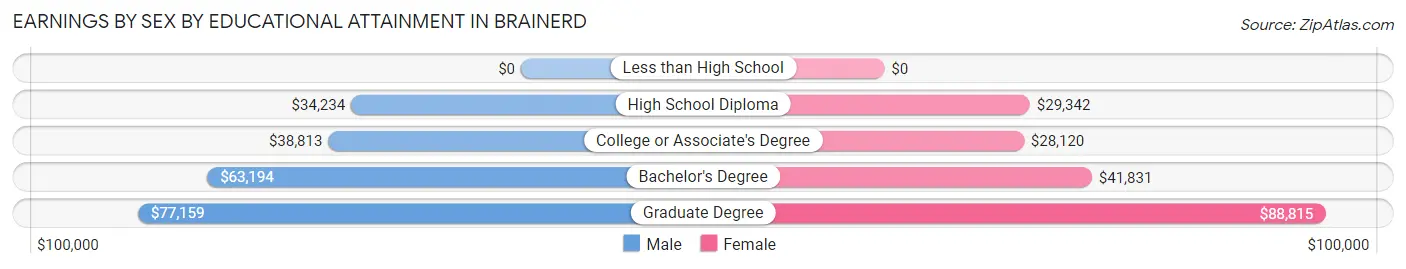
Earnings by Sex by Educational Attainment in Brainerd
Average earnings in Brainerd are $40,038 for men and $32,134 for women, a difference of 19.7%. Men with an educational attainment of graduate degree enjoy the highest average annual earnings of $77,159, while those with high school diploma education earn the least with $34,234. Women with an educational attainment of graduate degree earn the most with the average annual earnings of $88,815, while those with college or associate's degree education have the smallest earnings of $28,120.
| Educational Attainment | Male Income | Female Income |
| Less than High School | - | - |
| High School Diploma | $34,234 | $29,342 |
| College or Associate's Degree | $38,813 | $28,120 |
| Bachelor's Degree | $63,194 | $41,831 |
| Graduate Degree | $77,159 | $88,815 |
| Total | $40,038 | $32,134 |
Family Income in Brainerd
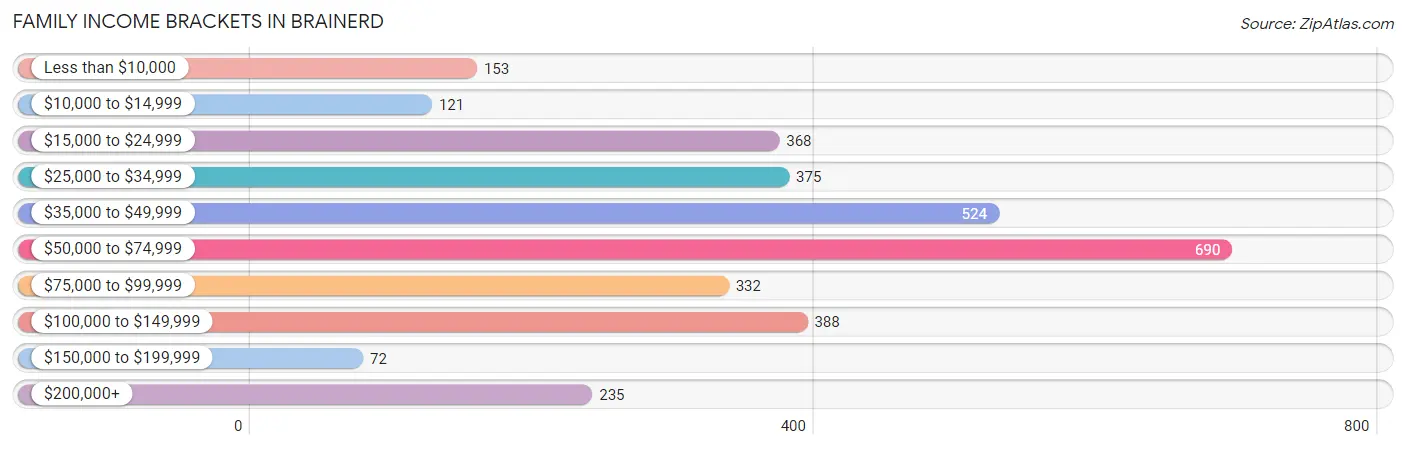
Family Income Brackets in Brainerd
According to the Brainerd family income data, there are 690 families falling into the $50,000 to $74,999 income range, which is the most common income bracket and makes up 21.2% of all families. Conversely, the $150,000 to $199,999 income bracket is the least frequent group with only 72 families (2.2%) belonging to this category.
| Income Bracket | # Families | % Families |
| Less than $10,000 | 153 | 4.7% |
| $10,000 to $14,999 | 121 | 3.7% |
| $15,000 to $24,999 | 368 | 11.3% |
| $25,000 to $34,999 | 375 | 11.5% |
| $35,000 to $49,999 | 524 | 16.1% |
| $50,000 to $74,999 | 690 | 21.2% |
| $75,000 to $99,999 | 332 | 10.2% |
| $100,000 to $149,999 | 388 | 11.9% |
| $150,000 to $199,999 | 72 | 2.2% |
| $200,000+ | 235 | 7.2% |
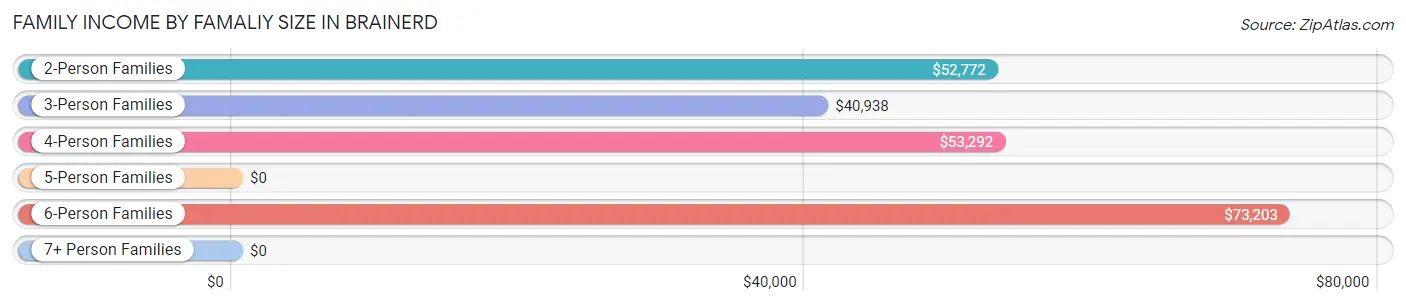
Family Income by Famaliy Size in Brainerd
6-person families (49 | 1.5%) account for the highest median family income in Brainerd with $73,203 per family, while 2-person families (1,681 | 51.6%) have the highest median income of $26,386 per family member.
| Income Bracket | # Families | Median Income |
| 2-Person Families | 1,681 (51.6%) | $52,772 |
| 3-Person Families | 742 (22.8%) | $40,938 |
| 4-Person Families | 525 (16.1%) | $53,292 |
| 5-Person Families | 260 (8.0%) | $0 |
| 6-Person Families | 49 (1.5%) | $73,203 |
| 7+ Person Families | 0 (0.0%) | $0 |
| Total | 3,257 (100.0%) | $53,423 |
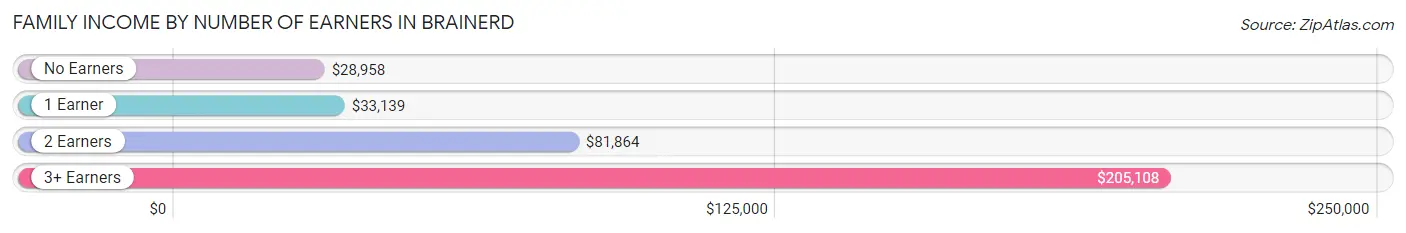
Family Income by Number of Earners in Brainerd
The median family income in Brainerd is $53,423, with families comprising 3+ earners (185) having the highest median family income of $205,108, while families with no earners (481) have the lowest median family income of $28,958, accounting for 5.7% and 14.8% of families, respectively.
| Number of Earners | # Families | Median Income |
| No Earners | 481 (14.8%) | $28,958 |
| 1 Earner | 1,226 (37.6%) | $33,139 |
| 2 Earners | 1,365 (41.9%) | $81,864 |
| 3+ Earners | 185 (5.7%) | $205,108 |
| Total | 3,257 (100.0%) | $53,423 |
Household Income in Brainerd
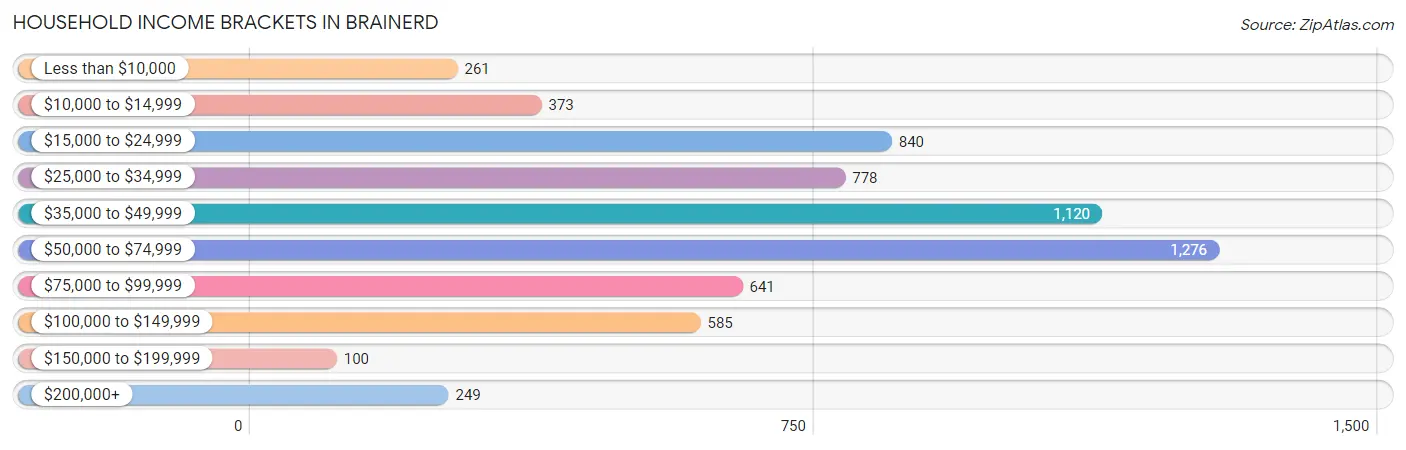
Household Income Brackets in Brainerd
With 1,276 households falling in the category, the $50,000 to $74,999 income range is the most frequent in Brainerd, accounting for 20.5% of all households. In contrast, only 100 households (1.6%) fall into the $150,000 to $199,999 income bracket, making it the least populous group.
| Income Bracket | # Households | % Households |
| Less than $10,000 | 261 | 4.2% |
| $10,000 to $14,999 | 373 | 6.0% |
| $15,000 to $24,999 | 840 | 13.5% |
| $25,000 to $34,999 | 778 | 12.5% |
| $35,000 to $49,999 | 1,120 | 18.0% |
| $50,000 to $74,999 | 1,276 | 20.5% |
| $75,000 to $99,999 | 641 | 10.3% |
| $100,000 to $149,999 | 585 | 9.4% |
| $150,000 to $199,999 | 100 | 1.6% |
| $200,000+ | 249 | 4.0% |
Household Income by Householder Age in Brainerd
The median household income in Brainerd is $46,933, with the highest median household income of $49,722 found in the 15 to 24 years age bracket for the primary householder. A total of 614 households (9.9%) fall into this category. Meanwhile, the 65+ years age bracket for the primary householder has the lowest median household income of $41,250, with 1,614 households (25.9%) in this group.
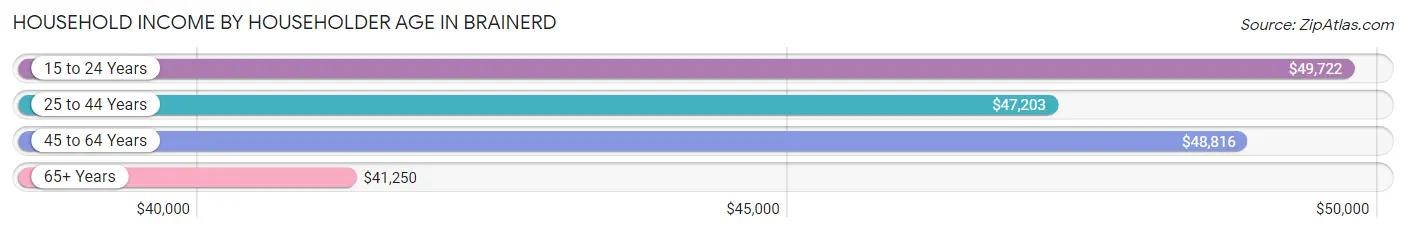
| Income Bracket | # Households | Median Income |
| 15 to 24 Years | 614 (9.9%) | $49,722 |
| 25 to 44 Years | 2,111 (33.9%) | $47,203 |
| 45 to 64 Years | 1,884 (30.3%) | $48,816 |
| 65+ Years | 1,614 (25.9%) | $41,250 |
| Total | 6,223 (100.0%) | $46,933 |
Poverty in Brainerd
Income Below Poverty by Sex and Age in Brainerd
With 16.9% poverty level for males and 21.5% for females among the residents of Brainerd, 15 year old males and 6 to 11 year old females are the most vulnerable to poverty, with 31 males (56.4%) and 273 females (53.8%) in their respective age groups living below the poverty level.
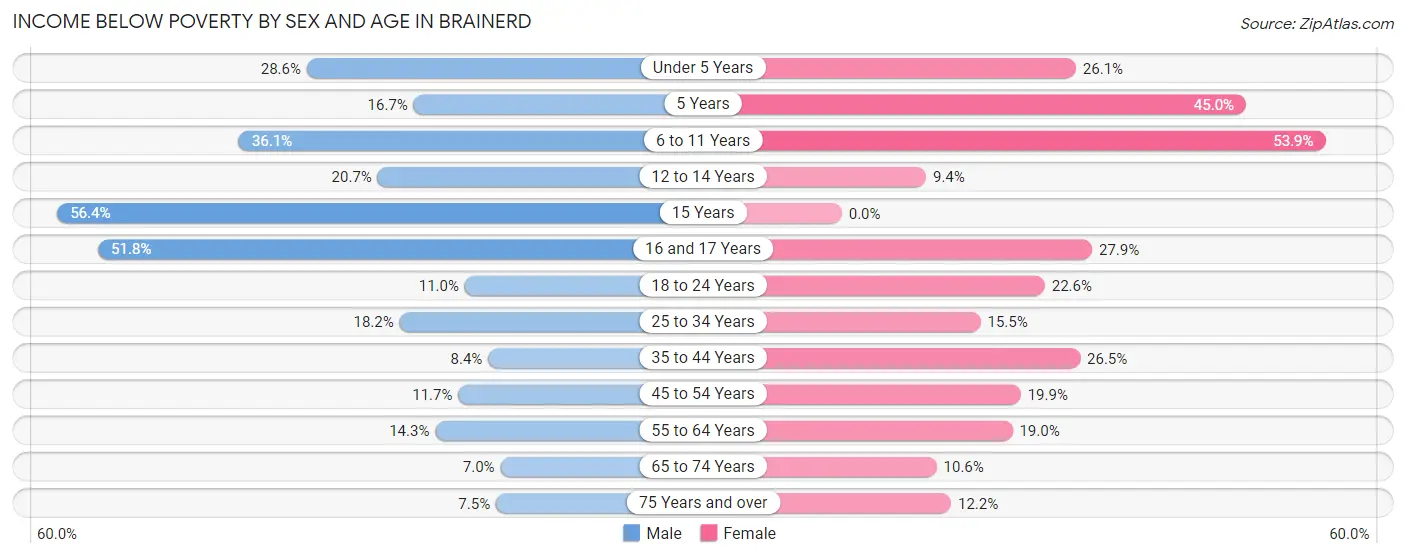
| Age Bracket | Male | Female |
| Under 5 Years | 124 (28.6%) | 183 (26.1%) |
| 5 Years | 20 (16.7%) | 36 (45.0%) |
| 6 to 11 Years | 211 (36.1%) | 273 (53.8%) |
| 12 to 14 Years | 49 (20.7%) | 18 (9.4%) |
| 15 Years | 31 (56.4%) | 0 (0.0%) |
| 16 and 17 Years | 57 (51.8%) | 34 (27.9%) |
| 18 to 24 Years | 57 (11.0%) | 194 (22.6%) |
| 25 to 34 Years | 182 (18.2%) | 195 (15.4%) |
| 35 to 44 Years | 80 (8.4%) | 241 (26.5%) |
| 45 to 54 Years | 86 (11.7%) | 115 (19.9%) |
| 55 to 64 Years | 130 (14.3%) | 154 (19.0%) |
| 65 to 74 Years | 31 (7.0%) | 70 (10.6%) |
| 75 Years and over | 21 (7.5%) | 93 (12.2%) |
| Total | 1,079 (16.9%) | 1,606 (21.5%) |
Income Above Poverty by Sex and Age in Brainerd
According to the poverty statistics in Brainerd, males aged 65 to 74 years and females aged 15 years are the age groups that are most secure financially, with 93.0% of males and 100.0% of females in these age groups living above the poverty line.
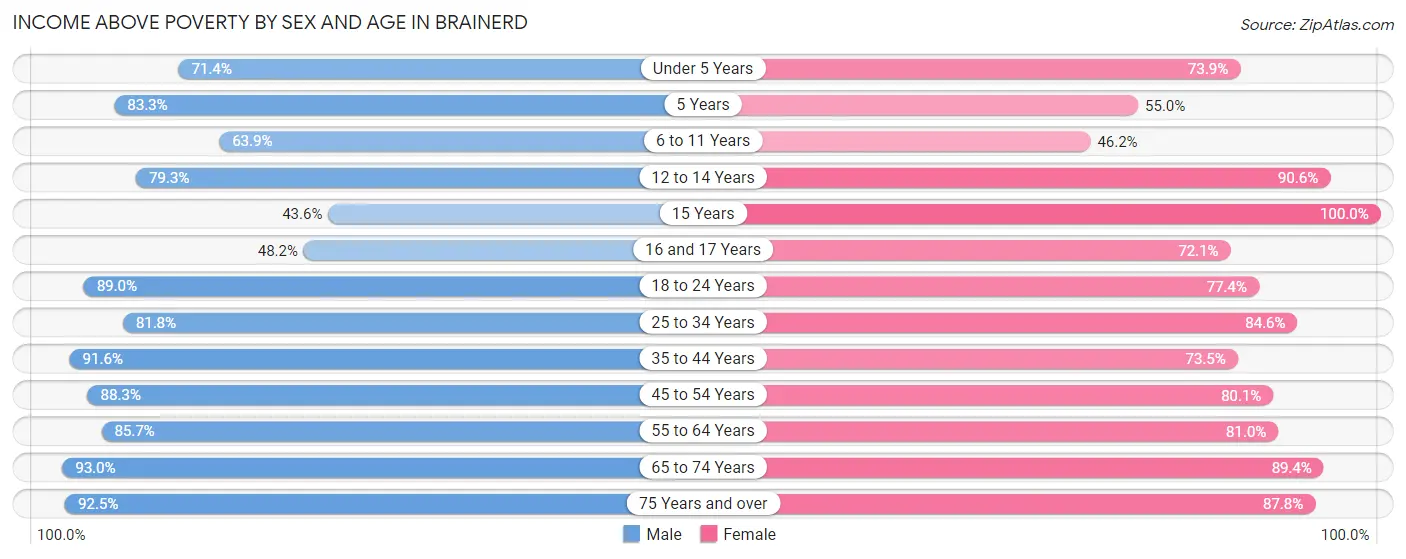
| Age Bracket | Male | Female |
| Under 5 Years | 310 (71.4%) | 519 (73.9%) |
| 5 Years | 100 (83.3%) | 44 (55.0%) |
| 6 to 11 Years | 373 (63.9%) | 234 (46.2%) |
| 12 to 14 Years | 188 (79.3%) | 174 (90.6%) |
| 15 Years | 24 (43.6%) | 16 (100.0%) |
| 16 and 17 Years | 53 (48.2%) | 88 (72.1%) |
| 18 to 24 Years | 462 (89.0%) | 664 (77.4%) |
| 25 to 34 Years | 816 (81.8%) | 1,067 (84.6%) |
| 35 to 44 Years | 876 (91.6%) | 667 (73.5%) |
| 45 to 54 Years | 649 (88.3%) | 462 (80.1%) |
| 55 to 64 Years | 781 (85.7%) | 656 (81.0%) |
| 65 to 74 Years | 411 (93.0%) | 593 (89.4%) |
| 75 Years and over | 259 (92.5%) | 671 (87.8%) |
| Total | 5,302 (83.1%) | 5,855 (78.5%) |
Income Below Poverty Among Married-Couple Families in Brainerd
The poverty statistics for married-couple families in Brainerd show that 5.5% or 111 of the total 2,020 families live below the poverty line. Families with 1 or 2 children have the highest poverty rate of 10.8%, comprising of 72 families. On the other hand, families with no children have the lowest poverty rate of 2.6%, which includes 31 families.
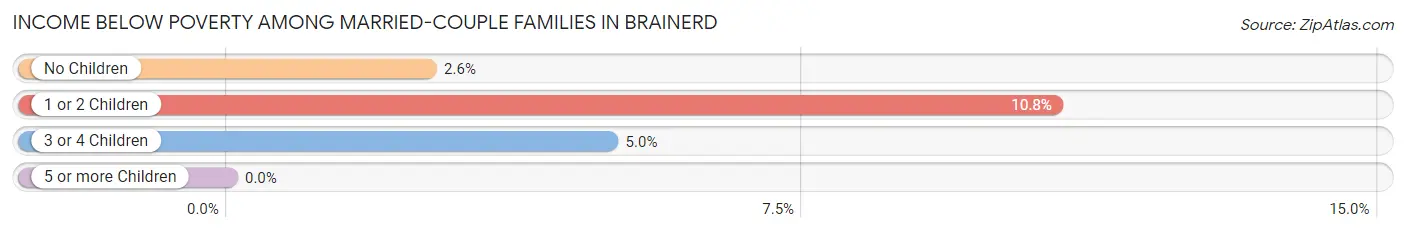
| Children | Above Poverty | Below Poverty |
| No Children | 1,160 (97.4%) | 31 (2.6%) |
| 1 or 2 Children | 596 (89.2%) | 72 (10.8%) |
| 3 or 4 Children | 153 (95.0%) | 8 (5.0%) |
| 5 or more Children | 0 (0.0%) | 0 (0.0%) |
| Total | 1,909 (94.5%) | 111 (5.5%) |
Income Below Poverty Among Single-Parent Households in Brainerd
According to the poverty data in Brainerd, 31.3% or 71 single-father households and 42.3% or 427 single-mother households are living below the poverty line. Among single-father households, those with 1 or 2 children have the highest poverty rate, with 71 households (43.8%) experiencing poverty. Likewise, among single-mother households, those with 3 or 4 children have the highest poverty rate, with 166 households (77.2%) falling below the poverty line.
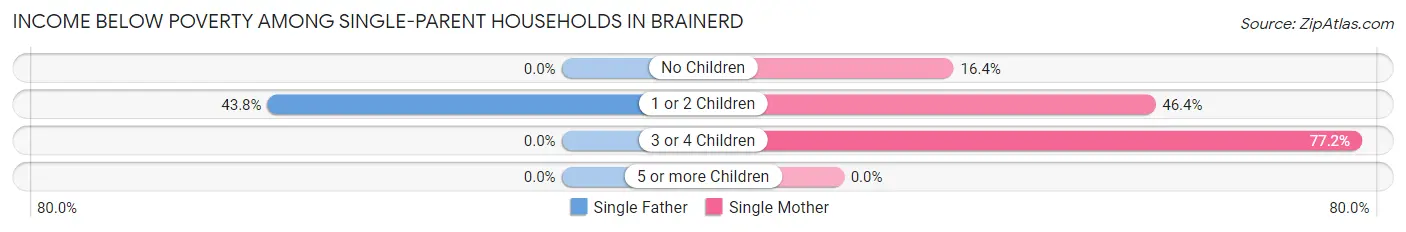
| Children | Single Father | Single Mother |
| No Children | 0 (0.0%) | 59 (16.4%) |
| 1 or 2 Children | 71 (43.8%) | 202 (46.4%) |
| 3 or 4 Children | 0 (0.0%) | 166 (77.2%) |
| 5 or more Children | 0 (0.0%) | 0 (0.0%) |
| Total | 71 (31.3%) | 427 (42.3%) |
Income Below Poverty Among Married-Couple vs Single-Parent Households in Brainerd
The poverty data for Brainerd shows that 111 of the married-couple family households (5.5%) and 498 of the single-parent households (40.3%) are living below the poverty level. Within the married-couple family households, those with 1 or 2 children have the highest poverty rate, with 72 households (10.8%) falling below the poverty line. Among the single-parent households, those with 3 or 4 children have the highest poverty rate, with 166 household (72.8%) living below poverty.
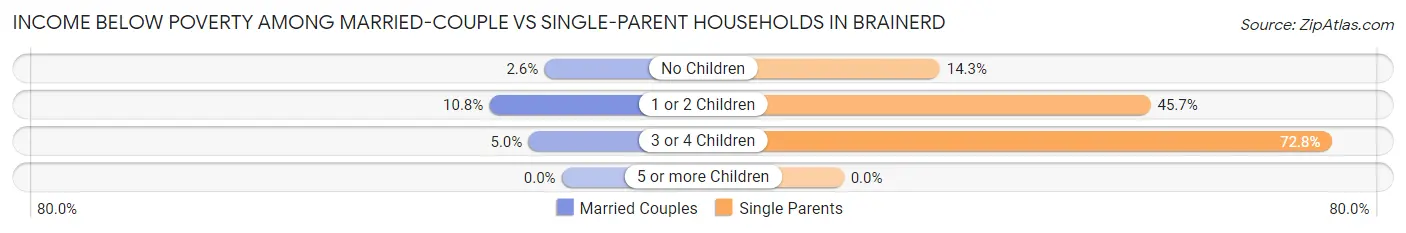
| Children | Married-Couple Families | Single-Parent Households |
| No Children | 31 (2.6%) | 59 (14.3%) |
| 1 or 2 Children | 72 (10.8%) | 273 (45.7%) |
| 3 or 4 Children | 8 (5.0%) | 166 (72.8%) |
| 5 or more Children | 0 (0.0%) | 0 (0.0%) |
| Total | 111 (5.5%) | 498 (40.3%) |
Race in Brainerd
The most populous races in Brainerd are White / Caucasian (13,316 | 92.4%), Hispanic or Latino (465 | 3.2%), and Two or more Races (421 | 2.9%).
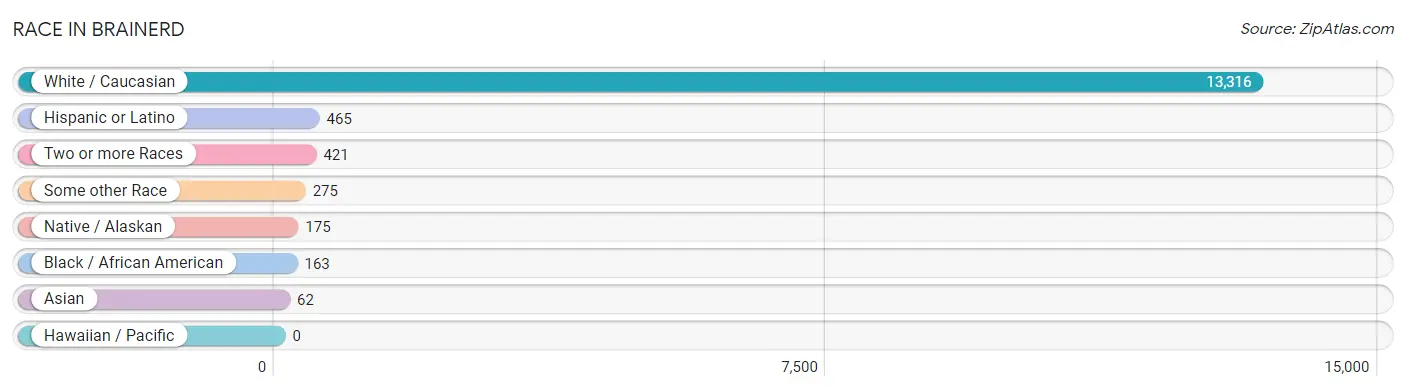
| Race | # Population | % Population |
| Asian | 62 | 0.4% |
| Black / African American | 163 | 1.1% |
| Hawaiian / Pacific | 0 | 0.0% |
| Hispanic or Latino | 465 | 3.2% |
| Native / Alaskan | 175 | 1.2% |
| White / Caucasian | 13,316 | 92.4% |
| Two or more Races | 421 | 2.9% |
| Some other Race | 275 | 1.9% |
| Total | 14,412 | 100.0% |
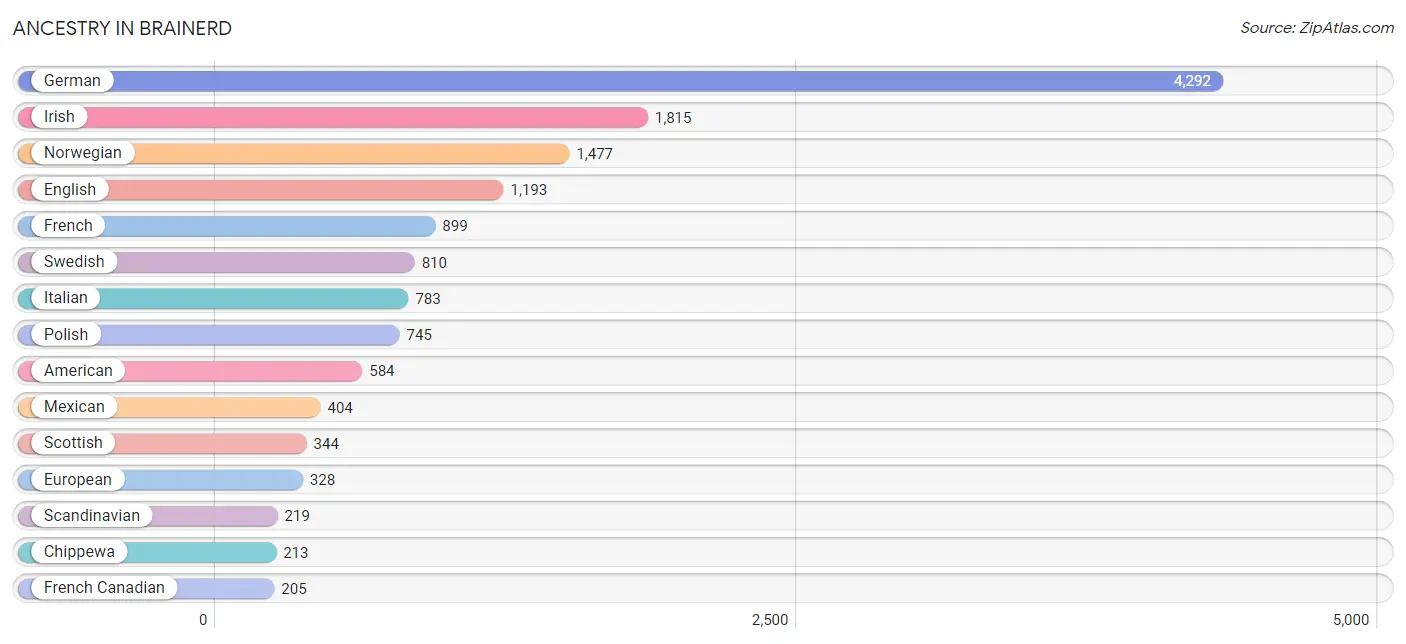
Ancestry in Brainerd
The most populous ancestries reported in Brainerd are German (4,292 | 29.8%), Irish (1,815 | 12.6%), Norwegian (1,477 | 10.2%), English (1,193 | 8.3%), and French (899 | 6.2%), together accounting for 67.1% of all Brainerd residents.
| Ancestry | # Population | % Population |
| African | 1 | 0.0% |
| American | 584 | 4.1% |
| Arab | 15 | 0.1% |
| Austrian | 14 | 0.1% |
| Belgian | 8 | 0.1% |
| Bhutanese | 4 | 0.0% |
| British | 44 | 0.3% |
| Burmese | 14 | 0.1% |
| Canadian | 7 | 0.1% |
| Cherokee | 13 | 0.1% |
| Chippewa | 213 | 1.5% |
| Czech | 61 | 0.4% |
| Czechoslovakian | 47 | 0.3% |
| Danish | 163 | 1.1% |
| Dutch | 173 | 1.2% |
| Eastern European | 27 | 0.2% |
| English | 1,193 | 8.3% |
| European | 328 | 2.3% |
| Finnish | 199 | 1.4% |
| French | 899 | 6.2% |
| French Canadian | 205 | 1.4% |
| German | 4,292 | 29.8% |
| Greek | 61 | 0.4% |
| Hungarian | 26 | 0.2% |
| Irish | 1,815 | 12.6% |
| Italian | 783 | 5.4% |
| Mexican | 404 | 2.8% |
| Native Hawaiian | 4 | 0.0% |
| Northern European | 28 | 0.2% |
| Norwegian | 1,477 | 10.2% |
| Pennsylvania German | 20 | 0.1% |
| Polish | 745 | 5.2% |
| Portuguese | 8 | 0.1% |
| Puerto Rican | 30 | 0.2% |
| Russian | 64 | 0.4% |
| Scandinavian | 219 | 1.5% |
| Scotch-Irish | 153 | 1.1% |
| Scottish | 344 | 2.4% |
| Sioux | 21 | 0.2% |
| Slovene | 36 | 0.3% |
| Sri Lankan | 48 | 0.3% |
| Subsaharan African | 1 | 0.0% |
| Swedish | 810 | 5.6% |
| Thai | 24 | 0.2% |
| Welsh | 116 | 0.8% | View All 45 Rows |
Immigrants in Brainerd
The most numerous immigrant groups reported in Brainerd came from Asia (62 | 0.4%), South Eastern Asia (48 | 0.3%), Vietnam (48 | 0.3%), Central America (38 | 0.3%), and Latin America (38 | 0.3%), together accounting for 1.6% of all Brainerd residents.
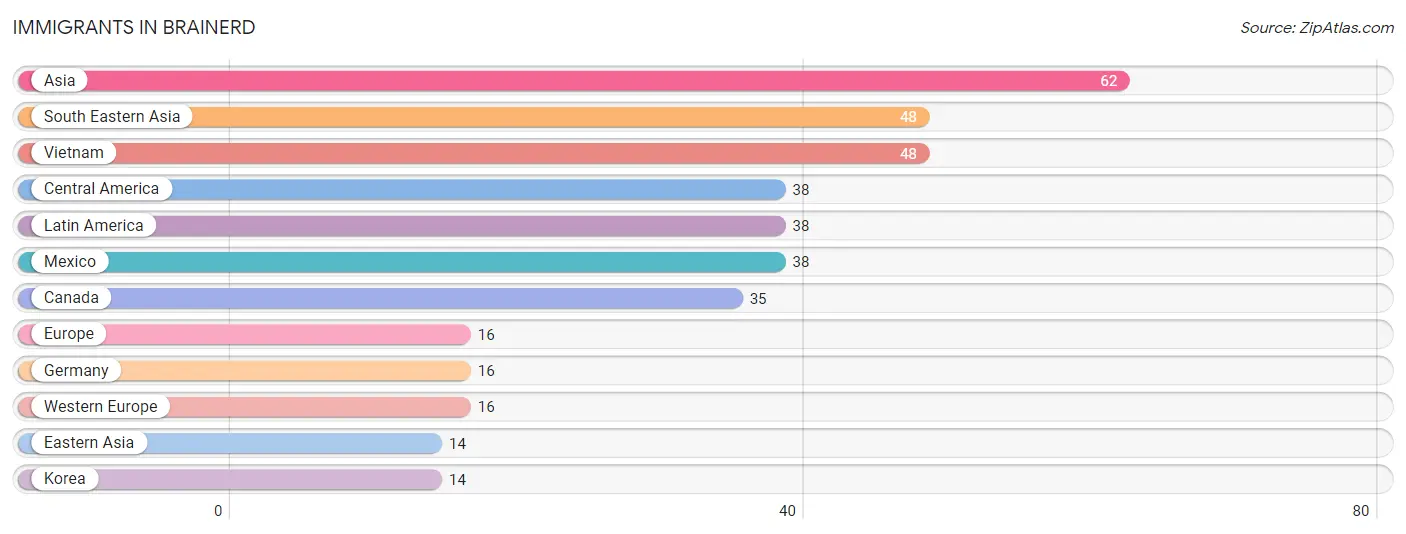
| Immigration Origin | # Population | % Population |
| Asia | 62 | 0.4% |
| Canada | 35 | 0.2% |
| Central America | 38 | 0.3% |
| Eastern Asia | 14 | 0.1% |
| Europe | 16 | 0.1% |
| Germany | 16 | 0.1% |
| Korea | 14 | 0.1% |
| Latin America | 38 | 0.3% |
| Mexico | 38 | 0.3% |
| South Eastern Asia | 48 | 0.3% |
| Vietnam | 48 | 0.3% |
| Western Europe | 16 | 0.1% | View All 12 Rows |
Sex and Age in Brainerd
Sex and Age in Brainerd
The most populous age groups in Brainerd are 5 to 9 Years (627 | 9.3%) for men and 20 to 24 Years (739 | 9.6%) for women.
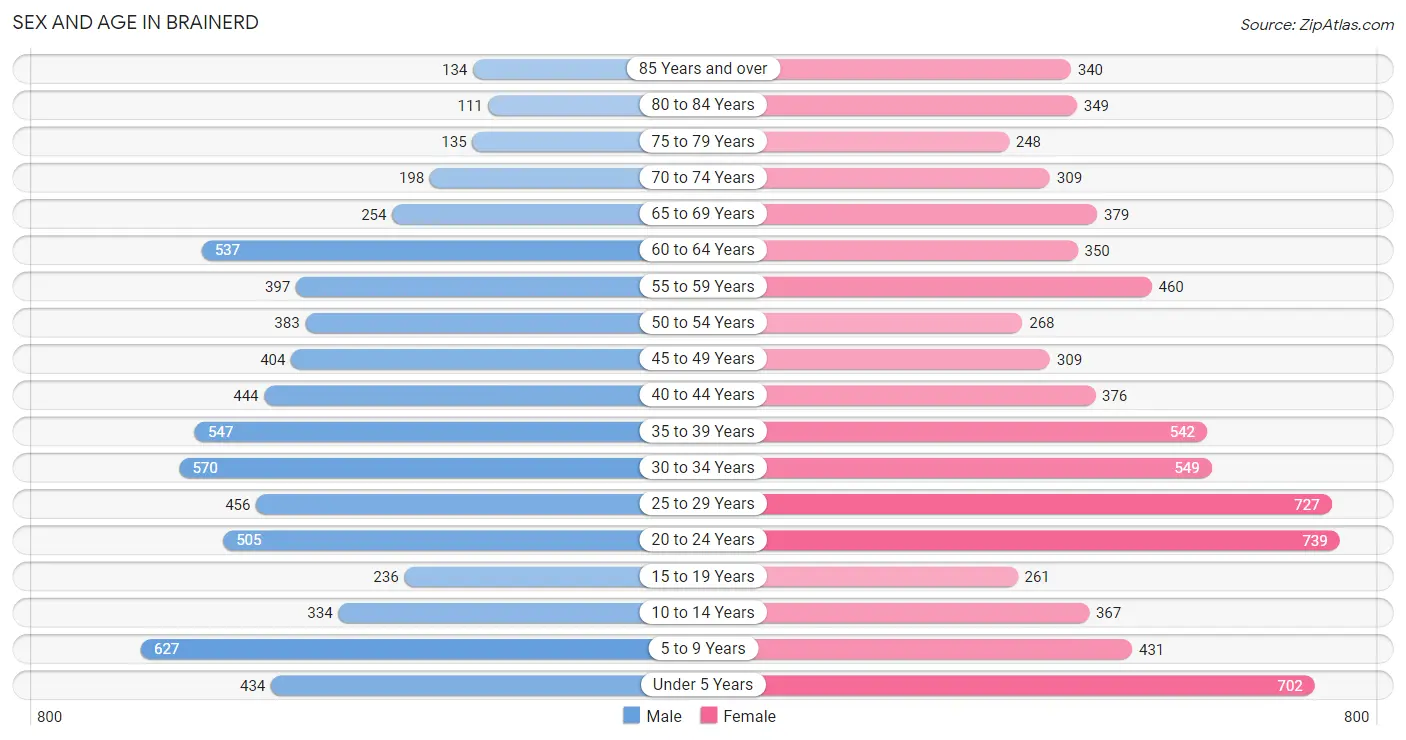
| Age Bracket | Male | Female |
| Under 5 Years | 434 (6.5%) | 702 (9.1%) |
| 5 to 9 Years | 627 (9.3%) | 431 (5.6%) |
| 10 to 14 Years | 334 (5.0%) | 367 (4.8%) |
| 15 to 19 Years | 236 (3.5%) | 261 (3.4%) |
| 20 to 24 Years | 505 (7.5%) | 739 (9.6%) |
| 25 to 29 Years | 456 (6.8%) | 727 (9.4%) |
| 30 to 34 Years | 570 (8.5%) | 549 (7.1%) |
| 35 to 39 Years | 547 (8.2%) | 542 (7.0%) |
| 40 to 44 Years | 444 (6.6%) | 376 (4.9%) |
| 45 to 49 Years | 404 (6.0%) | 309 (4.0%) |
| 50 to 54 Years | 383 (5.7%) | 268 (3.5%) |
| 55 to 59 Years | 397 (5.9%) | 460 (6.0%) |
| 60 to 64 Years | 537 (8.0%) | 350 (4.5%) |
| 65 to 69 Years | 254 (3.8%) | 379 (4.9%) |
| 70 to 74 Years | 198 (2.9%) | 309 (4.0%) |
| 75 to 79 Years | 135 (2.0%) | 248 (3.2%) |
| 80 to 84 Years | 111 (1.7%) | 349 (4.5%) |
| 85 Years and over | 134 (2.0%) | 340 (4.4%) |
| Total | 6,706 (100.0%) | 7,706 (100.0%) |
Families and Households in Brainerd
Median Family Size in Brainerd
The median family size in Brainerd is 2.94 persons per family, with single female/mother families (1,010 | 31.0%) accounting for the largest median family size of 3.1 persons per family. On the other hand, married-couple families (2,020 | 62.0%) represent the smallest median family size with 2.87 persons per family.
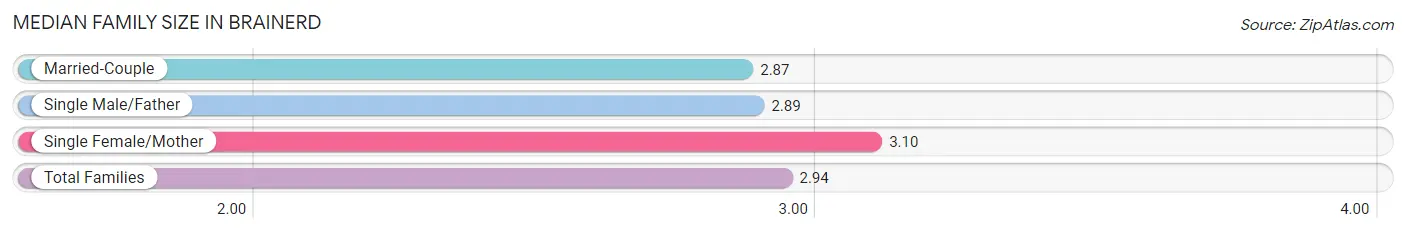
| Family Type | # Families | Family Size |
| Married-Couple | 2,020 (62.0%) | 2.87 |
| Single Male/Father | 227 (7.0%) | 2.89 |
| Single Female/Mother | 1,010 (31.0%) | 3.10 |
| Total Families | 3,257 (100.0%) | 2.94 |
Median Household Size in Brainerd
The median household size in Brainerd is 2.19 persons per household, with single female/mother households (1,010 | 16.2%) accounting for the largest median household size of 3.5 persons per household. non-family households (2,966 | 47.7%) represent the smallest median household size with 1.19 persons per household.
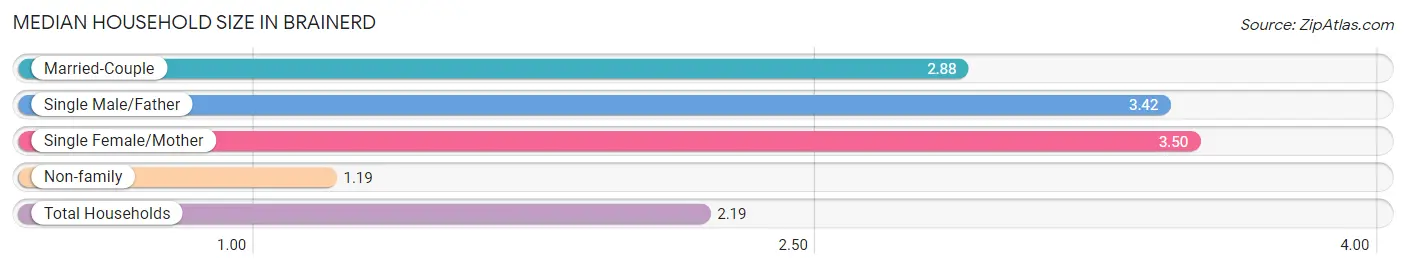
| Household Type | # Households | Household Size |
| Married-Couple | 2,020 (32.5%) | 2.88 |
| Single Male/Father | 227 (3.6%) | 3.42 |
| Single Female/Mother | 1,010 (16.2%) | 3.50 |
| Non-family | 2,966 (47.7%) | 1.19 |
| Total Households | 6,223 (100.0%) | 2.19 |
Household Size by Marriage Status in Brainerd
Out of a total of 6,223 households in Brainerd, 3,257 (52.3%) are family households, while 2,966 (47.7%) are nonfamily households. The most numerous type of family households are 2-person households, comprising 1,545, and the most common type of nonfamily households are 1-person households, comprising 2,415.
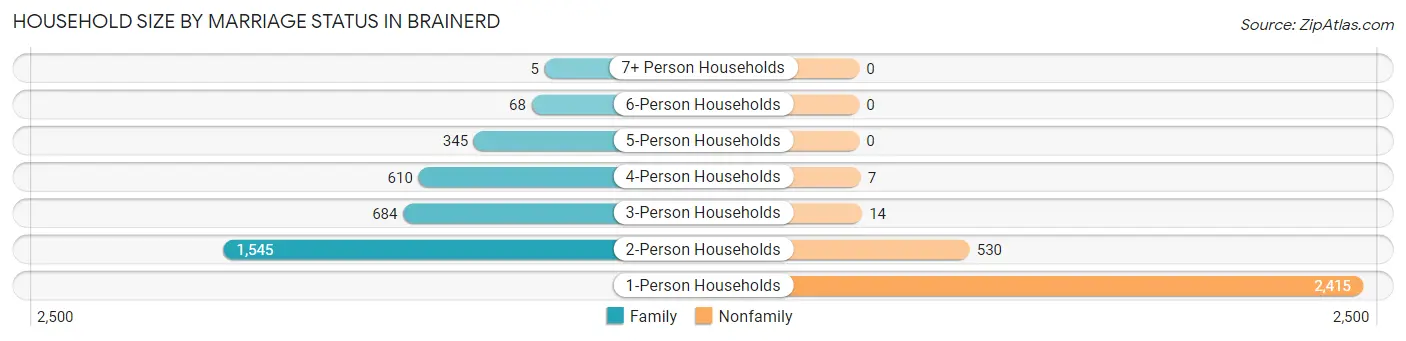
| Household Size | Family Households | Nonfamily Households |
| 1-Person Households | - | 2,415 (38.8%) |
| 2-Person Households | 1,545 (24.8%) | 530 (8.5%) |
| 3-Person Households | 684 (11.0%) | 14 (0.2%) |
| 4-Person Households | 610 (9.8%) | 7 (0.1%) |
| 5-Person Households | 345 (5.5%) | 0 (0.0%) |
| 6-Person Households | 68 (1.1%) | 0 (0.0%) |
| 7+ Person Households | 5 (0.1%) | 0 (0.0%) |
| Total | 3,257 (52.3%) | 2,966 (47.7%) |
Female Fertility in Brainerd
Fertility by Age in Brainerd
Average fertility rate in Brainerd is 35.0 births per 1,000 women. Women in the age bracket of 20 to 34 years have the highest fertility rate with 62.0 births per 1,000 women. Women in the age bracket of 20 to 34 years acount for 100.0% of all women with births.
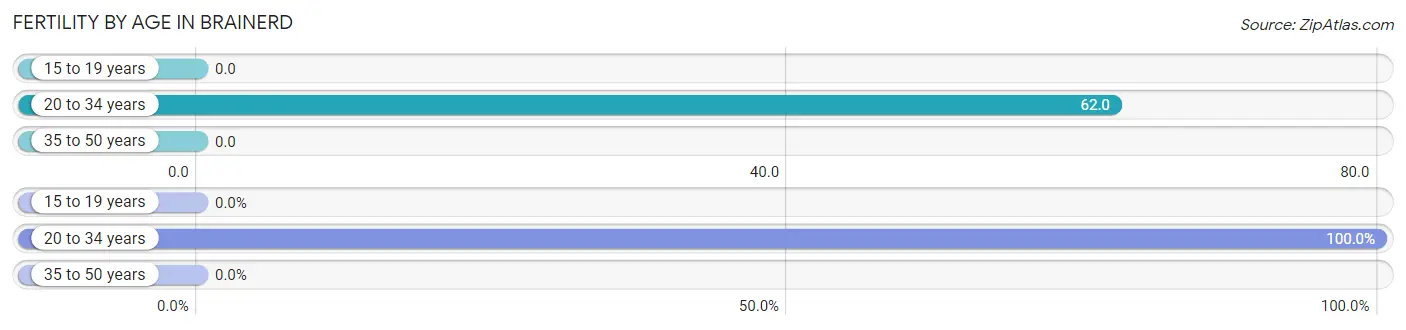
| Age Bracket | Women with Births | Births / 1,000 Women |
| 15 to 19 years | 0 (0.0%) | 0.0 |
| 20 to 34 years | 125 (100.0%) | 62.0 |
| 35 to 50 years | 0 (0.0%) | 0.0 |
| Total | 125 (100.0%) | 35.0 |
Fertility by Age by Marriage Status in Brainerd
73.6% of women with births (125) in Brainerd are married. The highest percentage of unmarried women with births falls into 20 to 34 years age bracket with 26.4% of them unmarried at the time of birth, while the lowest percentage of unmarried women with births belong to 20 to 34 years age bracket with 26.4% of them unmarried.
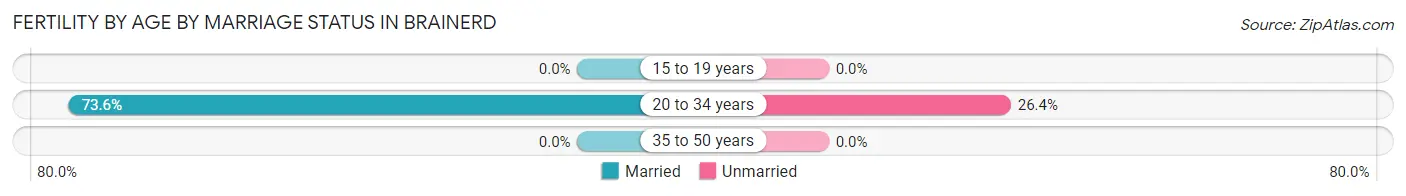
| Age Bracket | Married | Unmarried |
| 15 to 19 years | 0 (0.0%) | 0 (0.0%) |
| 20 to 34 years | 92 (73.6%) | 33 (26.4%) |
| 35 to 50 years | 0 (0.0%) | 0 (0.0%) |
| Total | 92 (73.6%) | 33 (26.4%) |
Fertility by Education in Brainerd
Average fertility rate in Brainerd is 35.0 births per 1,000 women. Women with the education attainment of graduate degree have the highest fertility rate of 153.0 births per 1,000 women, while women with the education attainment of college or associate's degree have the lowest fertility at 9.0 births per 1,000 women. Women with the education attainment of high school diploma represent 26.4% of all women with births.
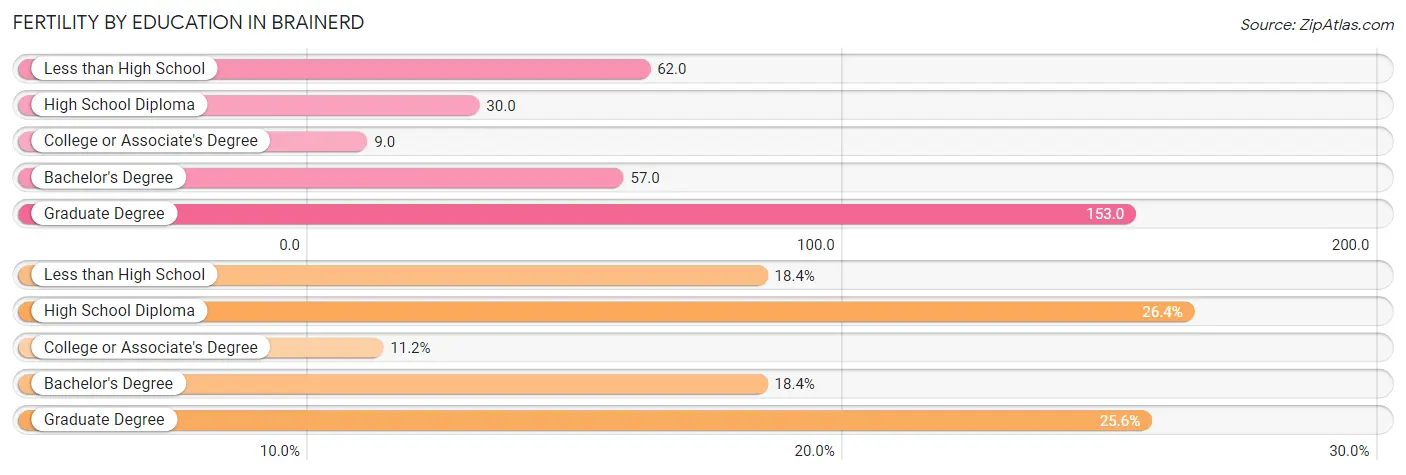
| Educational Attainment | Women with Births | Births / 1,000 Women |
| Less than High School | 23 (18.4%) | 62.0 |
| High School Diploma | 33 (26.4%) | 30.0 |
| College or Associate's Degree | 14 (11.2%) | 9.0 |
| Bachelor's Degree | 23 (18.4%) | 57.0 |
| Graduate Degree | 32 (25.6%) | 153.0 |
| Total | 125 (100.0%) | 35.0 |
Fertility by Education by Marriage Status in Brainerd
26.4% of women with births in Brainerd are unmarried. Women with the educational attainment of less than high school are most likely to be married with 100.0% of them married at childbirth, while women with the educational attainment of high school diploma are least likely to be married with 100.0% of them unmarried at childbirth.
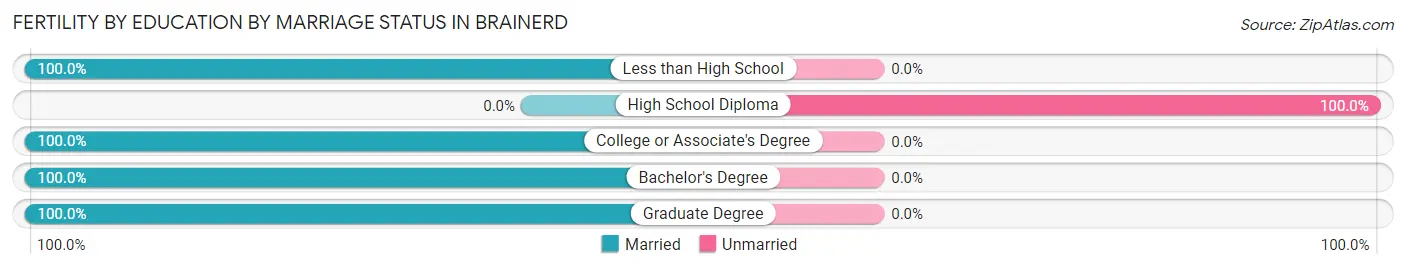
| Educational Attainment | Married | Unmarried |
| Less than High School | 23 (100.0%) | 0 (0.0%) |
| High School Diploma | 0 (0.0%) | 33 (100.0%) |
| College or Associate's Degree | 14 (100.0%) | 0 (0.0%) |
| Bachelor's Degree | 23 (100.0%) | 0 (0.0%) |
| Graduate Degree | 32 (100.0%) | 0 (0.0%) |
| Total | 92 (73.6%) | 33 (26.4%) |
Employment Characteristics in Brainerd
Employment by Class of Employer in Brainerd
Among the 6,709 employed individuals in Brainerd, private company employees (4,670 | 69.6%), not-for-profit organizations (788 | 11.7%), and local government employees (481 | 7.2%) make up the most common classes of employment.
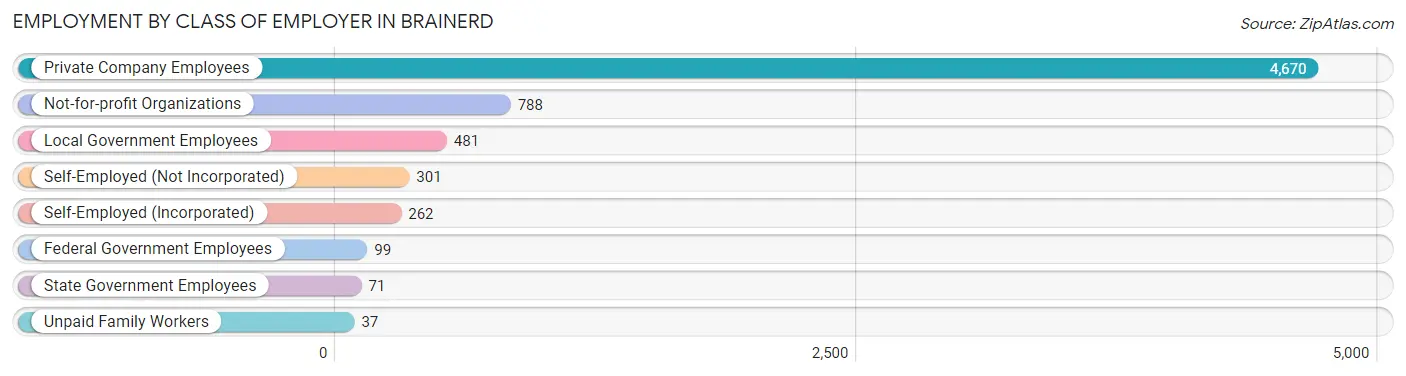
| Employer Class | # Employees | % Employees |
| Private Company Employees | 4,670 | 69.6% |
| Self-Employed (Incorporated) | 262 | 3.9% |
| Self-Employed (Not Incorporated) | 301 | 4.5% |
| Not-for-profit Organizations | 788 | 11.7% |
| Local Government Employees | 481 | 7.2% |
| State Government Employees | 71 | 1.1% |
| Federal Government Employees | 99 | 1.5% |
| Unpaid Family Workers | 37 | 0.5% |
| Total | 6,709 | 100.0% |
Employment Status by Age in Brainerd
According to the labor force statistics for Brainerd, out of the total population over 16 years of age (11,446), 64.2% or 7,348 individuals are in the labor force, with 7.4% or 544 of them unemployed. The age group with the highest labor force participation rate is 25 to 29 years, with 92.3% or 1,092 individuals in the labor force. Within the labor force, the 25 to 29 years age range has the highest percentage of unemployed individuals, with 15.7% or 171 of them being unemployed.
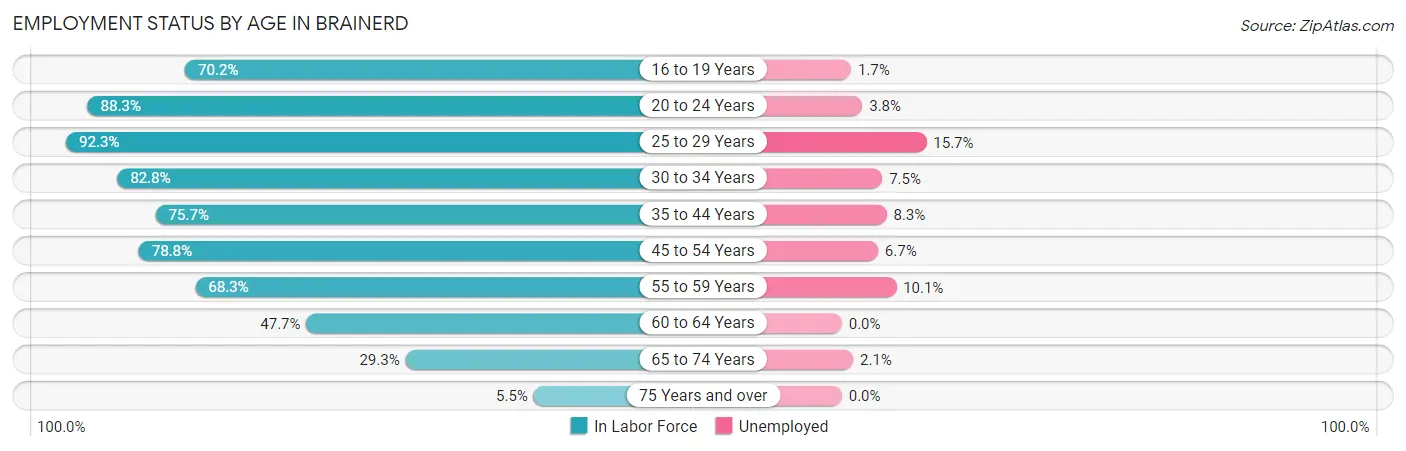
| Age Bracket | In Labor Force | Unemployed |
| 16 to 19 Years | 299 (70.2%) | 5 (1.7%) |
| 20 to 24 Years | 1,098 (88.3%) | 42 (3.8%) |
| 25 to 29 Years | 1,092 (92.3%) | 171 (15.7%) |
| 30 to 34 Years | 927 (82.8%) | 70 (7.5%) |
| 35 to 44 Years | 1,445 (75.7%) | 120 (8.3%) |
| 45 to 54 Years | 1,075 (78.8%) | 72 (6.7%) |
| 55 to 59 Years | 585 (68.3%) | 59 (10.1%) |
| 60 to 64 Years | 423 (47.7%) | 0 (0.0%) |
| 65 to 74 Years | 334 (29.3%) | 7 (2.1%) |
| 75 Years and over | 72 (5.5%) | 0 (0.0%) |
| Total | 7,348 (64.2%) | 544 (7.4%) |
Employment Status by Educational Attainment in Brainerd
According to labor force statistics for Brainerd, 75.8% of individuals (5,548) out of the total population between 25 and 64 years of age (7,319) are in the labor force, with 8.8% or 488 of them being unemployed. The group with the highest labor force participation rate are those with the educational attainment of bachelor's degree or higher, with 89.3% or 1,186 individuals in the labor force. Within the labor force, individuals with high school diploma education have the highest percentage of unemployment, with 14.1% or 227 of them being unemployed.
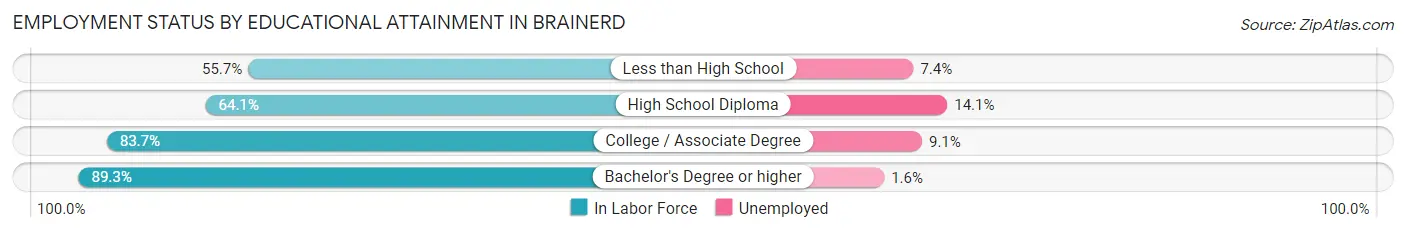
| Educational Attainment | In Labor Force | Unemployed |
| Less than High School | 324 (55.7%) | 43 (7.4%) |
| High School Diploma | 1,608 (64.1%) | 354 (14.1%) |
| College / Associate Degree | 2,428 (83.7%) | 264 (9.1%) |
| Bachelor's Degree or higher | 1,186 (89.3%) | 21 (1.6%) |
| Total | 5,548 (75.8%) | 644 (8.8%) |
Employment Occupations by Sex in Brainerd
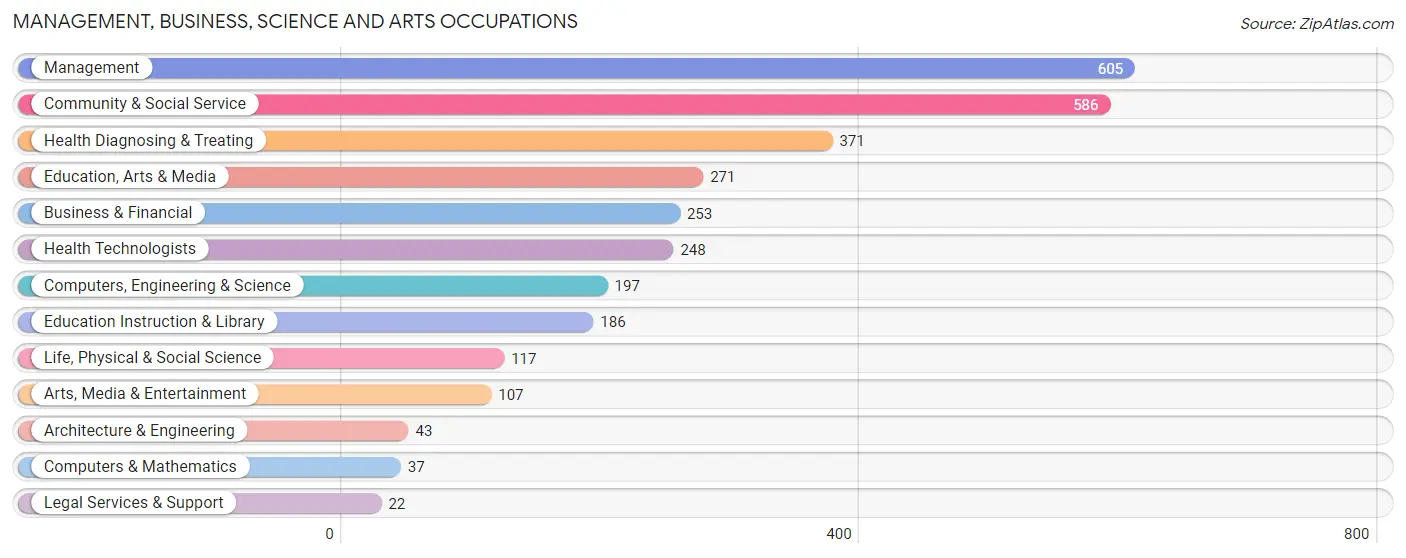
Management, Business, Science and Arts Occupations
The most common Management, Business, Science and Arts occupations in Brainerd are Management (605 | 8.9%), Community & Social Service (586 | 8.6%), Health Diagnosing & Treating (371 | 5.4%), Education, Arts & Media (271 | 4.0%), and Business & Financial (253 | 3.7%).
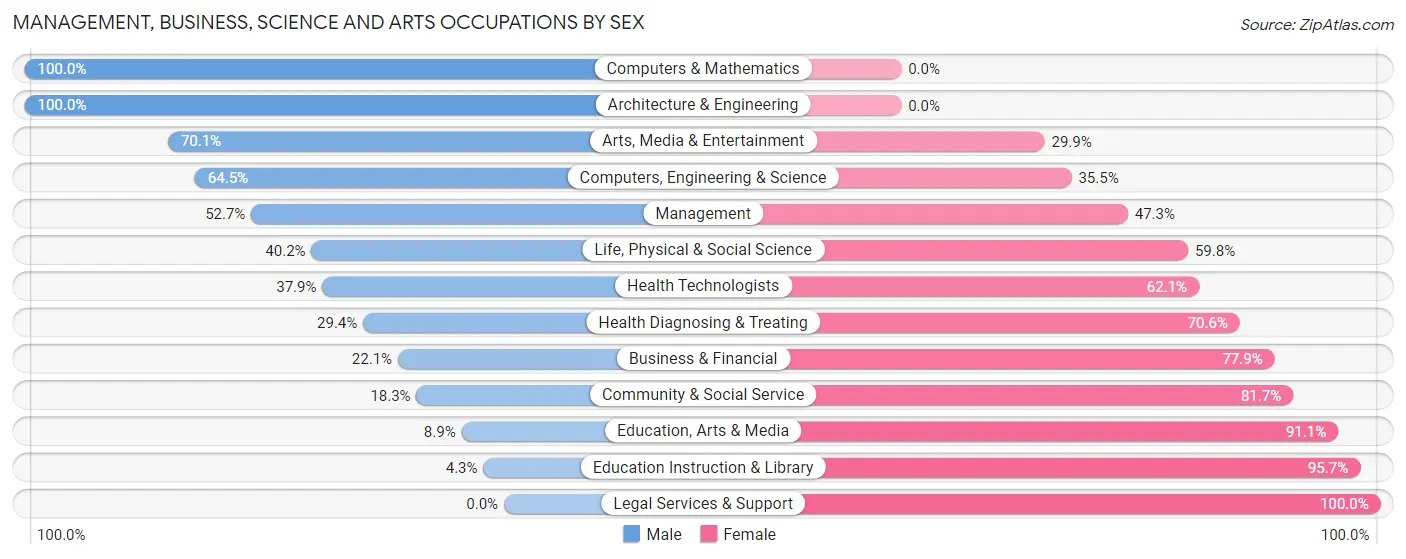
Management, Business, Science and Arts Occupations by Sex
Within the Management, Business, Science and Arts occupations in Brainerd, the most male-oriented occupations are Computers & Mathematics (100.0%), Architecture & Engineering (100.0%), and Arts, Media & Entertainment (70.1%), while the most female-oriented occupations are Legal Services & Support (100.0%), Education Instruction & Library (95.7%), and Education, Arts & Media (91.1%).
| Occupation | Male | Female |
| Management | 319 (52.7%) | 286 (47.3%) |
| Business & Financial | 56 (22.1%) | 197 (77.9%) |
| Computers, Engineering & Science | 127 (64.5%) | 70 (35.5%) |
| Computers & Mathematics | 37 (100.0%) | 0 (0.0%) |
| Architecture & Engineering | 43 (100.0%) | 0 (0.0%) |
| Life, Physical & Social Science | 47 (40.2%) | 70 (59.8%) |
| Community & Social Service | 107 (18.3%) | 479 (81.7%) |
| Education, Arts & Media | 24 (8.9%) | 247 (91.1%) |
| Legal Services & Support | 0 (0.0%) | 22 (100.0%) |
| Education Instruction & Library | 8 (4.3%) | 178 (95.7%) |
| Arts, Media & Entertainment | 75 (70.1%) | 32 (29.9%) |
| Health Diagnosing & Treating | 109 (29.4%) | 262 (70.6%) |
| Health Technologists | 94 (37.9%) | 154 (62.1%) |
| Total (Category) | 718 (35.7%) | 1,294 (64.3%) |
| Total (Overall) | 3,271 (48.1%) | 3,531 (51.9%) |
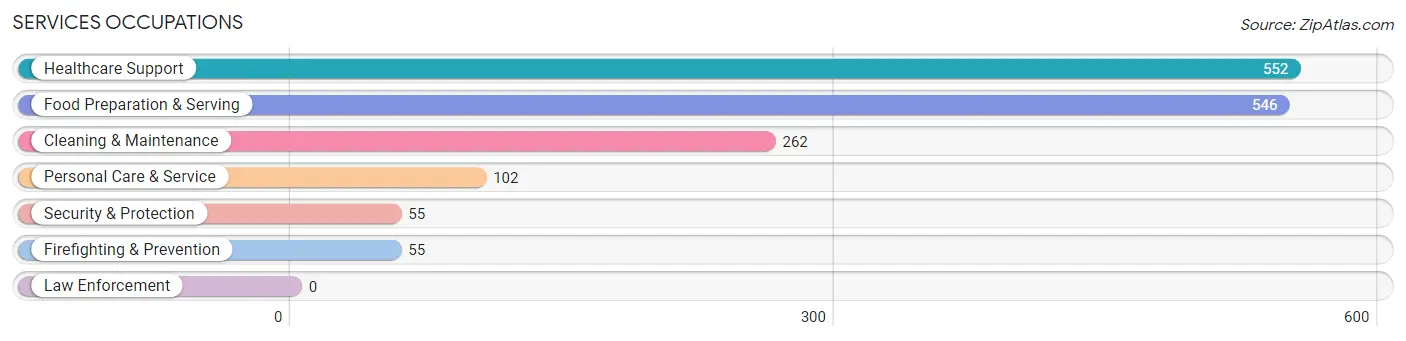
Services Occupations
The most common Services occupations in Brainerd are Healthcare Support (552 | 8.1%), Food Preparation & Serving (546 | 8.0%), Cleaning & Maintenance (262 | 3.8%), Personal Care & Service (102 | 1.5%), and Security & Protection (55 | 0.8%).
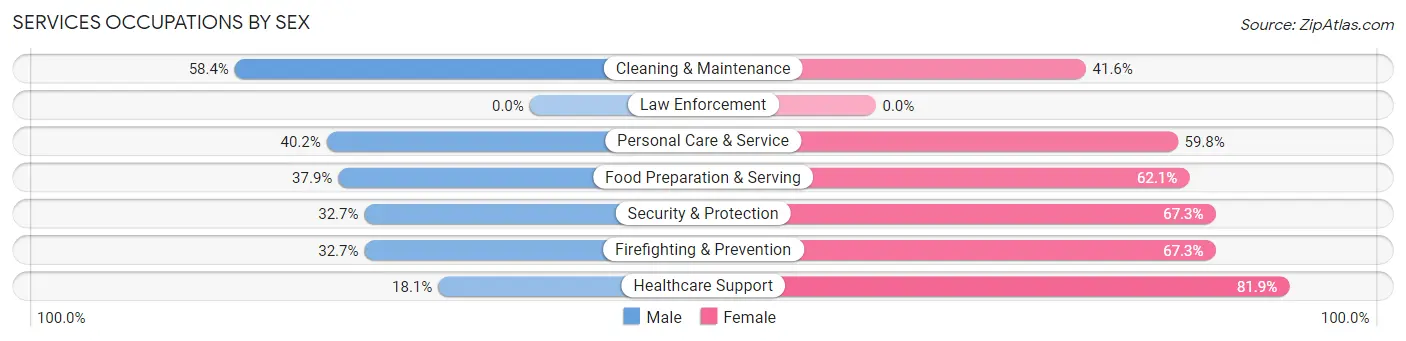
Services Occupations by Sex
Within the Services occupations in Brainerd, the most male-oriented occupations are Cleaning & Maintenance (58.4%), Personal Care & Service (40.2%), and Food Preparation & Serving (37.9%), while the most female-oriented occupations are Healthcare Support (81.9%), Security & Protection (67.3%), and Firefighting & Prevention (67.3%).
| Occupation | Male | Female |
| Healthcare Support | 100 (18.1%) | 452 (81.9%) |
| Security & Protection | 18 (32.7%) | 37 (67.3%) |
| Firefighting & Prevention | 18 (32.7%) | 37 (67.3%) |
| Law Enforcement | 0 (0.0%) | 0 (0.0%) |
| Food Preparation & Serving | 207 (37.9%) | 339 (62.1%) |
| Cleaning & Maintenance | 153 (58.4%) | 109 (41.6%) |
| Personal Care & Service | 41 (40.2%) | 61 (59.8%) |
| Total (Category) | 519 (34.2%) | 998 (65.8%) |
| Total (Overall) | 3,271 (48.1%) | 3,531 (51.9%) |
Sales and Office Occupations
The most common Sales and Office occupations in Brainerd are Sales & Related (686 | 10.1%), and Office & Administration (639 | 9.4%).
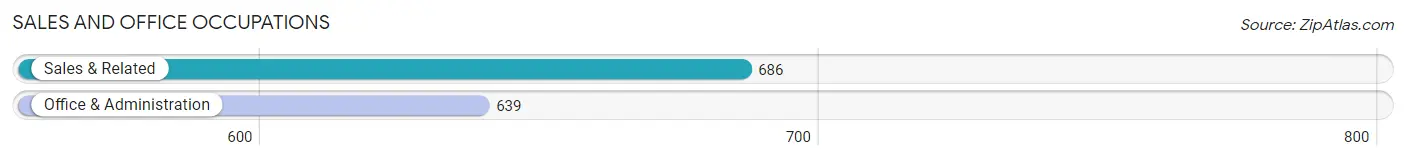
Sales and Office Occupations by Sex
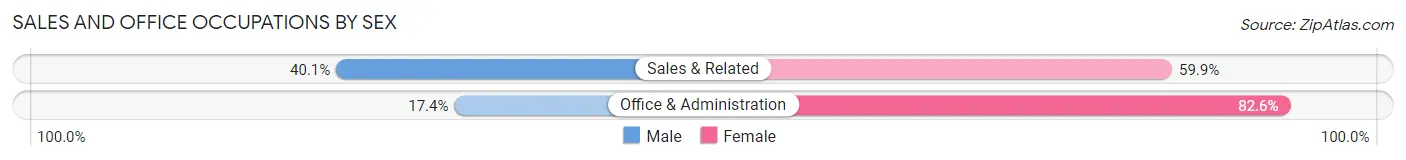
| Occupation | Male | Female |
| Sales & Related | 275 (40.1%) | 411 (59.9%) |
| Office & Administration | 111 (17.4%) | 528 (82.6%) |
| Total (Category) | 386 (29.1%) | 939 (70.9%) |
| Total (Overall) | 3,271 (48.1%) | 3,531 (51.9%) |
Natural Resources, Construction and Maintenance Occupations
The most common Natural Resources, Construction and Maintenance occupations in Brainerd are Construction & Extraction (378 | 5.6%), Installation, Maintenance & Repair (219 | 3.2%), and Farming, Fishing & Forestry (13 | 0.2%).
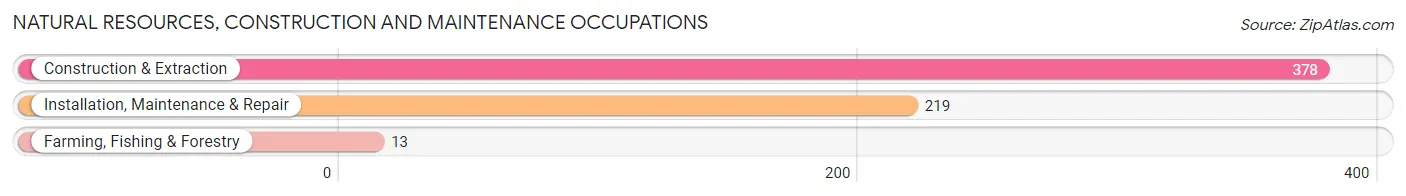
Natural Resources, Construction and Maintenance Occupations by Sex
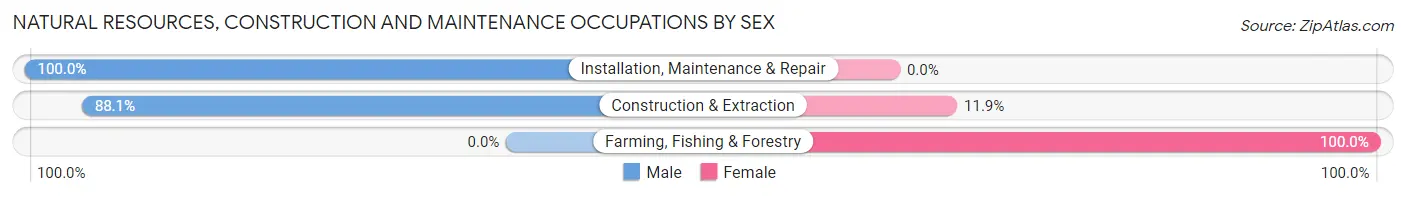
| Occupation | Male | Female |
| Farming, Fishing & Forestry | 0 (0.0%) | 13 (100.0%) |
| Construction & Extraction | 333 (88.1%) | 45 (11.9%) |
| Installation, Maintenance & Repair | 219 (100.0%) | 0 (0.0%) |
| Total (Category) | 552 (90.5%) | 58 (9.5%) |
| Total (Overall) | 3,271 (48.1%) | 3,531 (51.9%) |
Production, Transportation and Moving Occupations
The most common Production, Transportation and Moving occupations in Brainerd are Production (676 | 9.9%), Material Moving (418 | 6.1%), and Transportation (244 | 3.6%).
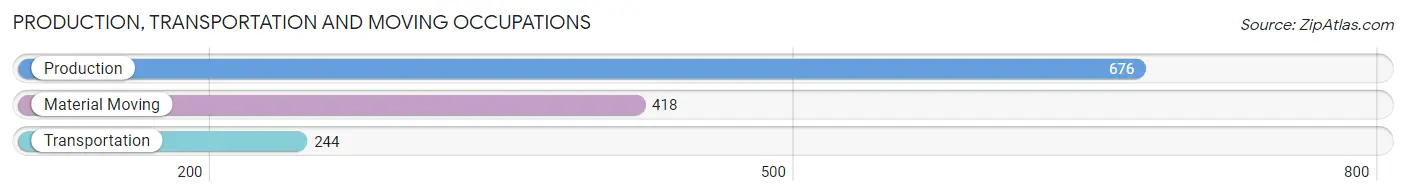
Production, Transportation and Moving Occupations by Sex
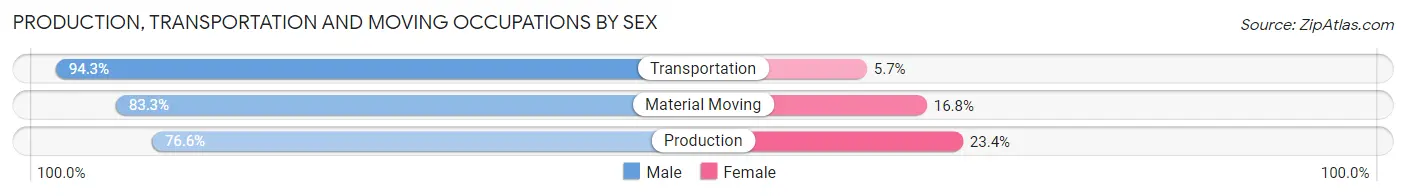
| Occupation | Male | Female |
| Production | 518 (76.6%) | 158 (23.4%) |
| Transportation | 230 (94.3%) | 14 (5.7%) |
| Material Moving | 348 (83.3%) | 70 (16.8%) |
| Total (Category) | 1,096 (81.9%) | 242 (18.1%) |
| Total (Overall) | 3,271 (48.1%) | 3,531 (51.9%) |
Employment Industries by Sex in Brainerd
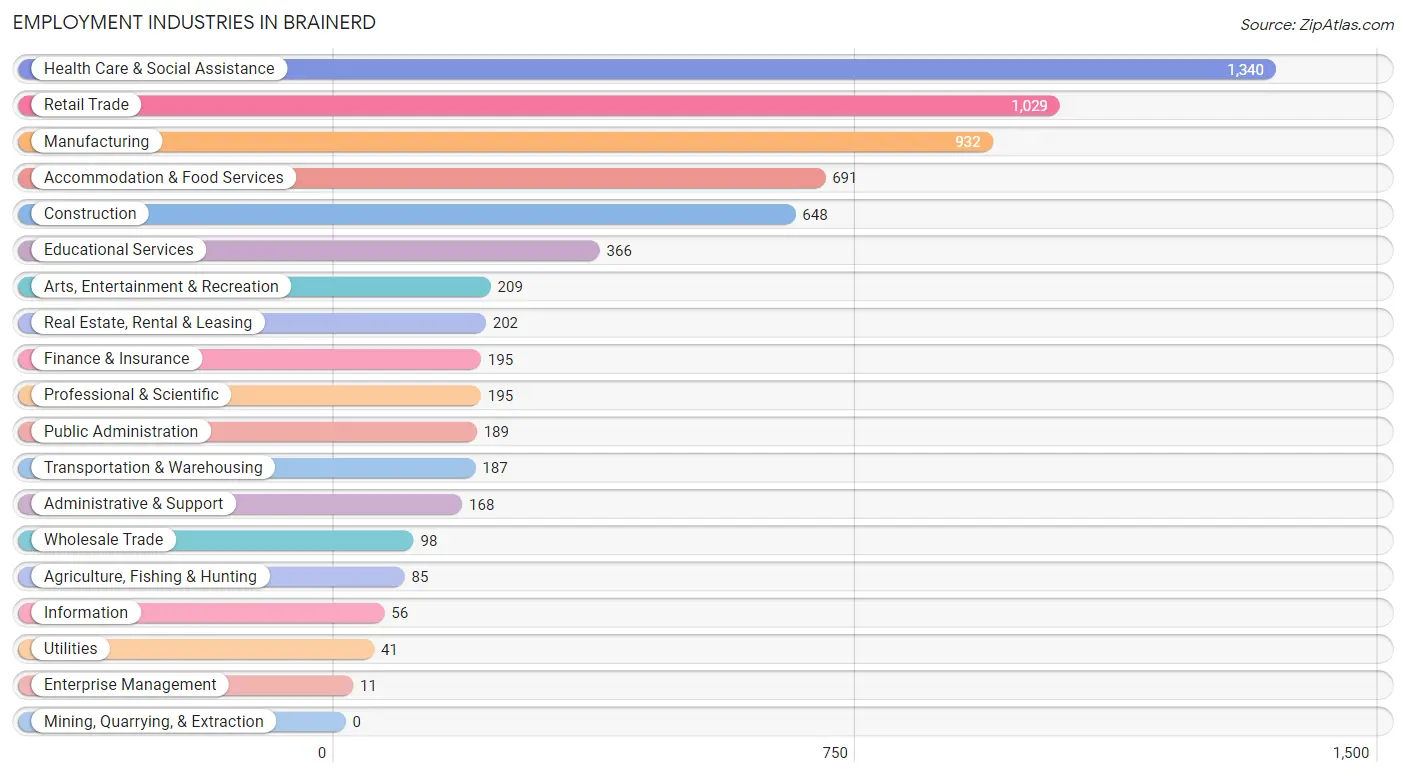
Employment Industries in Brainerd
The major employment industries in Brainerd include Health Care & Social Assistance (1,340 | 19.7%), Retail Trade (1,029 | 15.1%), Manufacturing (932 | 13.7%), Accommodation & Food Services (691 | 10.2%), and Construction (648 | 9.5%).
Employment Industries by Sex in Brainerd
The Brainerd industries that see more men than women are Enterprise Management (100.0%), Transportation & Warehousing (88.2%), and Wholesale Trade (85.7%), whereas the industries that tend to have a higher number of women are Health Care & Social Assistance (79.8%), Educational Services (76.0%), and Finance & Insurance (75.9%).
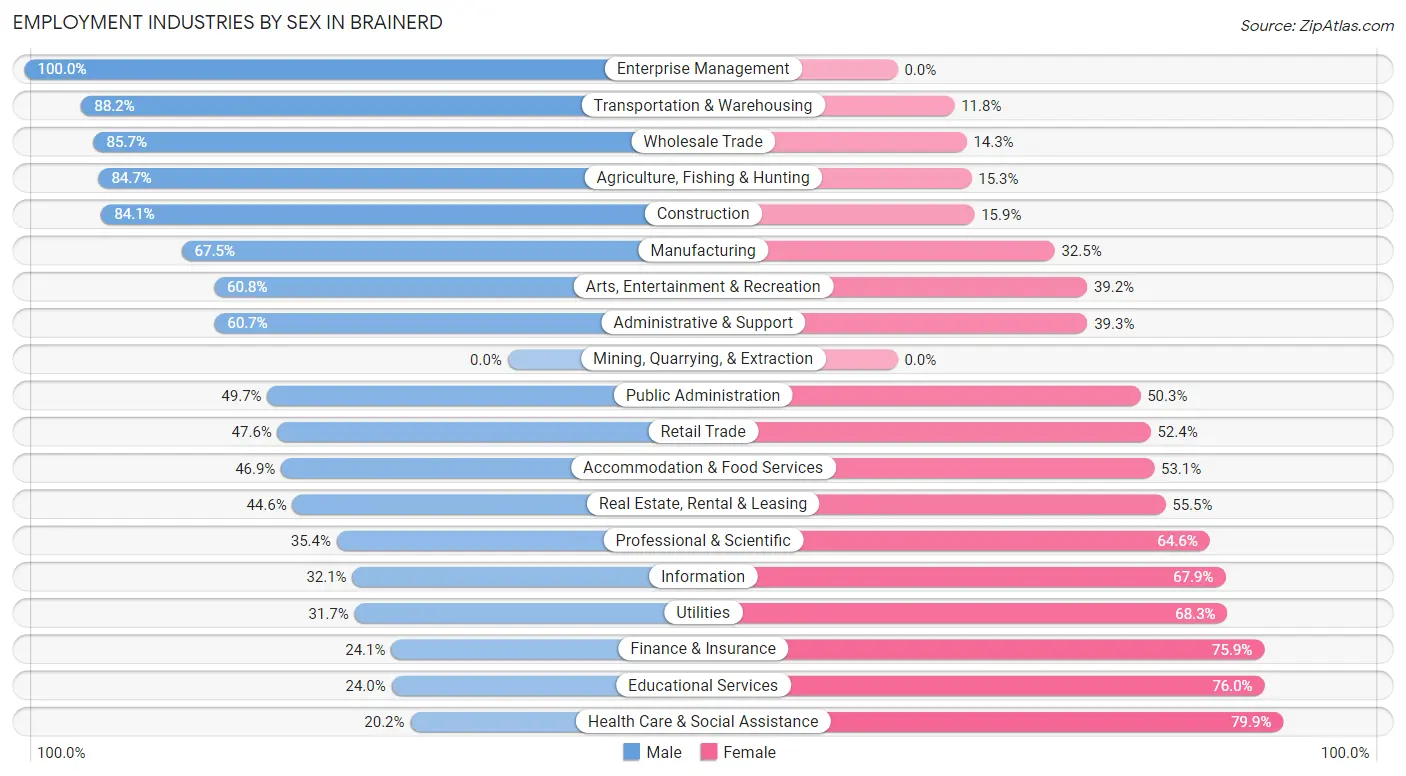
| Industry | Male | Female |
| Agriculture, Fishing & Hunting | 72 (84.7%) | 13 (15.3%) |
| Mining, Quarrying, & Extraction | 0 (0.0%) | 0 (0.0%) |
| Construction | 545 (84.1%) | 103 (15.9%) |
| Manufacturing | 629 (67.5%) | 303 (32.5%) |
| Wholesale Trade | 84 (85.7%) | 14 (14.3%) |
| Retail Trade | 490 (47.6%) | 539 (52.4%) |
| Transportation & Warehousing | 165 (88.2%) | 22 (11.8%) |
| Utilities | 13 (31.7%) | 28 (68.3%) |
| Information | 18 (32.1%) | 38 (67.9%) |
| Finance & Insurance | 47 (24.1%) | 148 (75.9%) |
| Real Estate, Rental & Leasing | 90 (44.6%) | 112 (55.4%) |
| Professional & Scientific | 69 (35.4%) | 126 (64.6%) |
| Enterprise Management | 11 (100.0%) | 0 (0.0%) |
| Administrative & Support | 102 (60.7%) | 66 (39.3%) |
| Educational Services | 88 (24.0%) | 278 (76.0%) |
| Health Care & Social Assistance | 270 (20.2%) | 1,070 (79.8%) |
| Arts, Entertainment & Recreation | 127 (60.8%) | 82 (39.2%) |
| Accommodation & Food Services | 324 (46.9%) | 367 (53.1%) |
| Public Administration | 94 (49.7%) | 95 (50.3%) |
| Total | 3,271 (48.1%) | 3,531 (51.9%) |
Education in Brainerd
School Enrollment in Brainerd
The most common levels of schooling among the 2,673 students in Brainerd are elementary school (684 | 25.6%), middle school (610 | 22.8%), and college / undergraduate (469 | 17.5%).
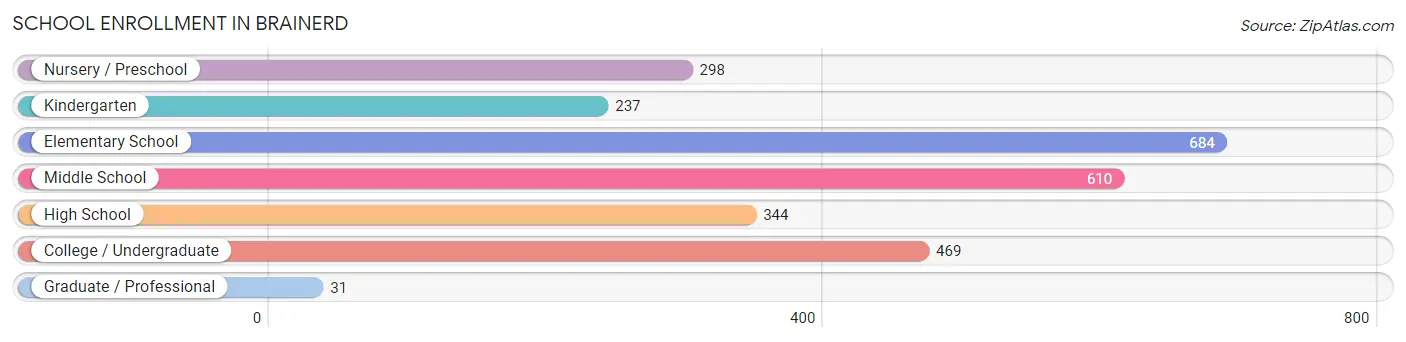
| School Level | # Students | % Students |
| Nursery / Preschool | 298 | 11.2% |
| Kindergarten | 237 | 8.9% |
| Elementary School | 684 | 25.6% |
| Middle School | 610 | 22.8% |
| High School | 344 | 12.9% |
| College / Undergraduate | 469 | 17.5% |
| Graduate / Professional | 31 | 1.2% |
| Total | 2,673 | 100.0% |
School Enrollment by Age by Funding Source in Brainerd
Out of a total of 2,673 students who are enrolled in schools in Brainerd, 337 (12.6%) attend a private institution, while the remaining 2,336 (87.4%) are enrolled in public schools. The age group of 18 to 19 year olds has the highest likelihood of being enrolled in private schools, with 61 (54.0% in the age bracket) enrolled. Conversely, the age group of 15 to 17 year olds has the lowest likelihood of being enrolled in a private school, with 259 (100.0% in the age bracket) attending a public institution.
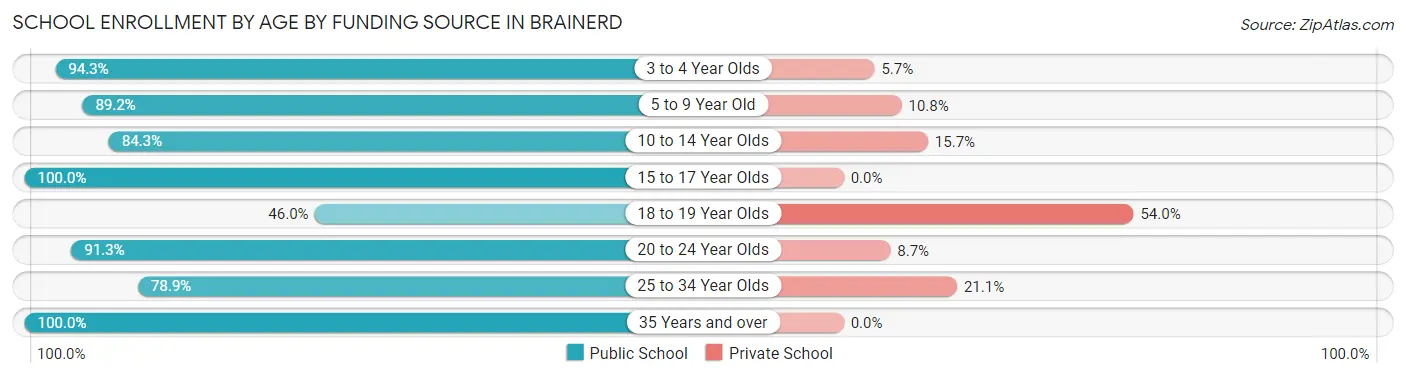
| Age Bracket | Public School | Private School |
| 3 to 4 Year Olds | 230 (94.3%) | 14 (5.7%) |
| 5 to 9 Year Old | 819 (89.2%) | 99 (10.8%) |
| 10 to 14 Year Olds | 591 (84.3%) | 110 (15.7%) |
| 15 to 17 Year Olds | 259 (100.0%) | 0 (0.0%) |
| 18 to 19 Year Olds | 52 (46.0%) | 61 (54.0%) |
| 20 to 24 Year Olds | 147 (91.3%) | 14 (8.7%) |
| 25 to 34 Year Olds | 142 (78.9%) | 38 (21.1%) |
| 35 Years and over | 97 (100.0%) | 0 (0.0%) |
| Total | 2,336 (87.4%) | 337 (12.6%) |
Educational Attainment by Field of Study in Brainerd
Education (371 | 18.9%), business (354 | 18.1%), science & technology (277 | 14.1%), psychology (265 | 13.5%), and liberal arts & history (146 | 7.4%) are the most common fields of study among 1,959 individuals in Brainerd who have obtained a bachelor's degree or higher.
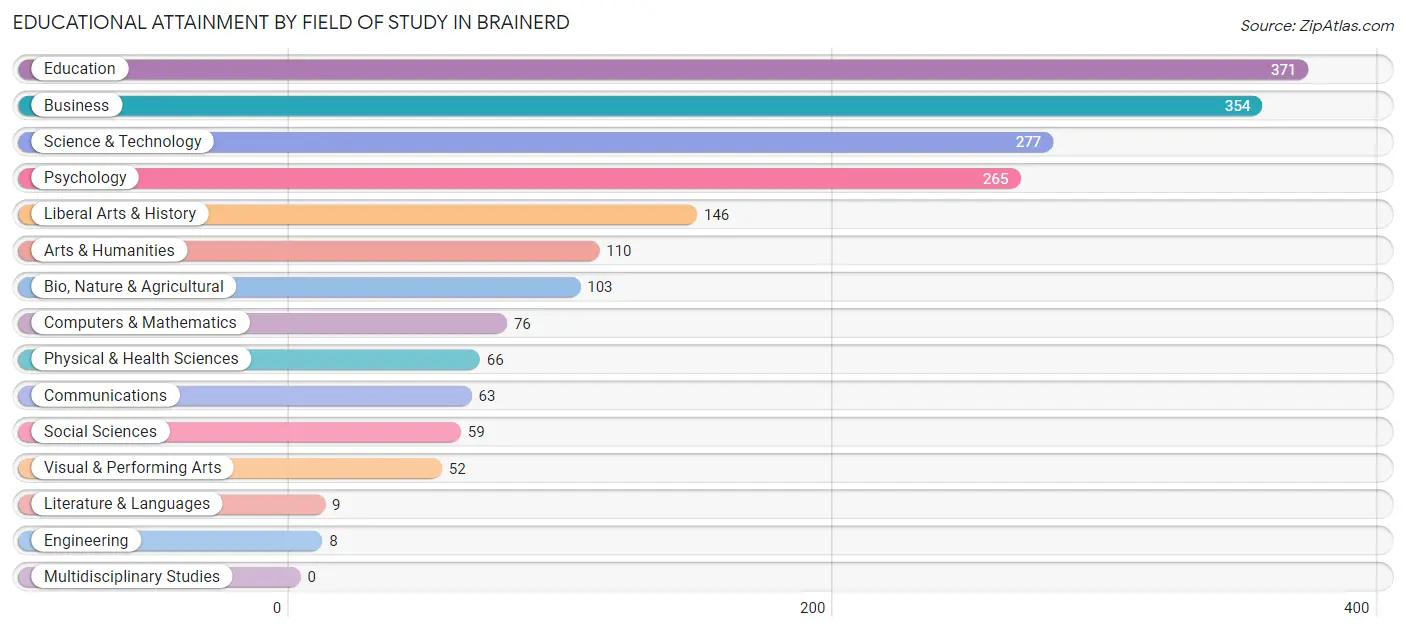
| Field of Study | # Graduates | % Graduates |
| Computers & Mathematics | 76 | 3.9% |
| Bio, Nature & Agricultural | 103 | 5.3% |
| Physical & Health Sciences | 66 | 3.4% |
| Psychology | 265 | 13.5% |
| Social Sciences | 59 | 3.0% |
| Engineering | 8 | 0.4% |
| Multidisciplinary Studies | 0 | 0.0% |
| Science & Technology | 277 | 14.1% |
| Business | 354 | 18.1% |
| Education | 371 | 18.9% |
| Literature & Languages | 9 | 0.5% |
| Liberal Arts & History | 146 | 7.4% |
| Visual & Performing Arts | 52 | 2.6% |
| Communications | 63 | 3.2% |
| Arts & Humanities | 110 | 5.6% |
| Total | 1,959 | 100.0% |
Transportation & Commute in Brainerd
Vehicle Availability by Sex in Brainerd
The most prevalent vehicle ownership categories in Brainerd are males with 2 vehicles (1,542, accounting for 48.0%) and females with 2 vehicles (1,534, making up 45.3%).
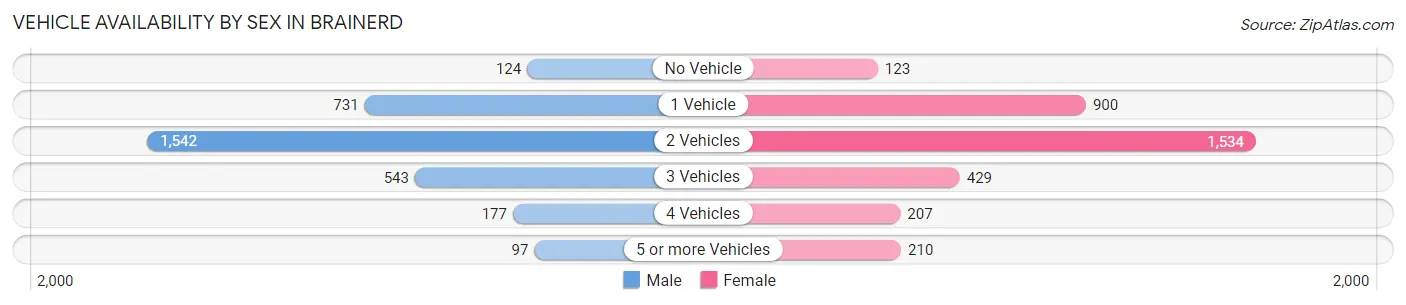
| Vehicles Available | Male | Female |
| No Vehicle | 124 (3.9%) | 123 (3.6%) |
| 1 Vehicle | 731 (22.7%) | 900 (26.5%) |
| 2 Vehicles | 1,542 (48.0%) | 1,534 (45.1%) |
| 3 Vehicles | 543 (16.9%) | 429 (12.6%) |
| 4 Vehicles | 177 (5.5%) | 207 (6.1%) |
| 5 or more Vehicles | 97 (3.0%) | 210 (6.2%) |
| Total | 3,214 (100.0%) | 3,403 (100.0%) |
Commute Time in Brainerd
The most frequently occuring commute durations in Brainerd are 10 to 14 minutes (1,672 commuters, 26.1%), 5 to 9 minutes (1,410 commuters, 22.0%), and 15 to 19 minutes (1,132 commuters, 17.7%).
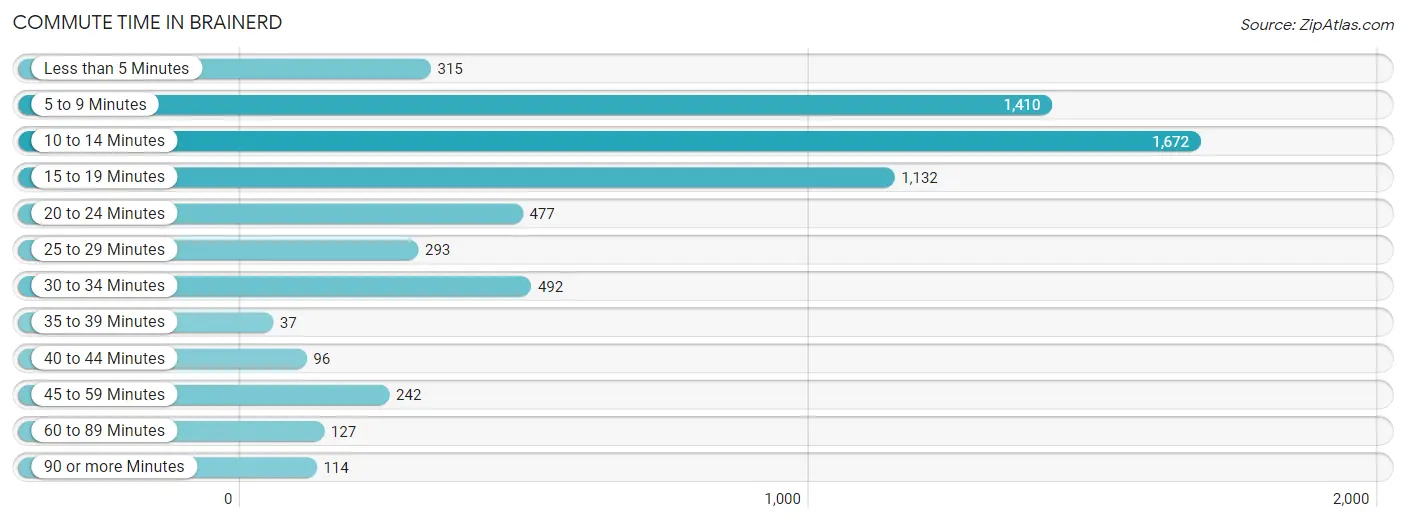
| Commute Time | # Commuters | % Commuters |
| Less than 5 Minutes | 315 | 4.9% |
| 5 to 9 Minutes | 1,410 | 22.0% |
| 10 to 14 Minutes | 1,672 | 26.1% |
| 15 to 19 Minutes | 1,132 | 17.7% |
| 20 to 24 Minutes | 477 | 7.4% |
| 25 to 29 Minutes | 293 | 4.6% |
| 30 to 34 Minutes | 492 | 7.7% |
| 35 to 39 Minutes | 37 | 0.6% |
| 40 to 44 Minutes | 96 | 1.5% |
| 45 to 59 Minutes | 242 | 3.8% |
| 60 to 89 Minutes | 127 | 2.0% |
| 90 or more Minutes | 114 | 1.8% |
Commute Time by Sex in Brainerd
The most common commute times in Brainerd are 10 to 14 minutes (719 commuters, 23.0%) for males and 10 to 14 minutes (953 commuters, 29.0%) for females.
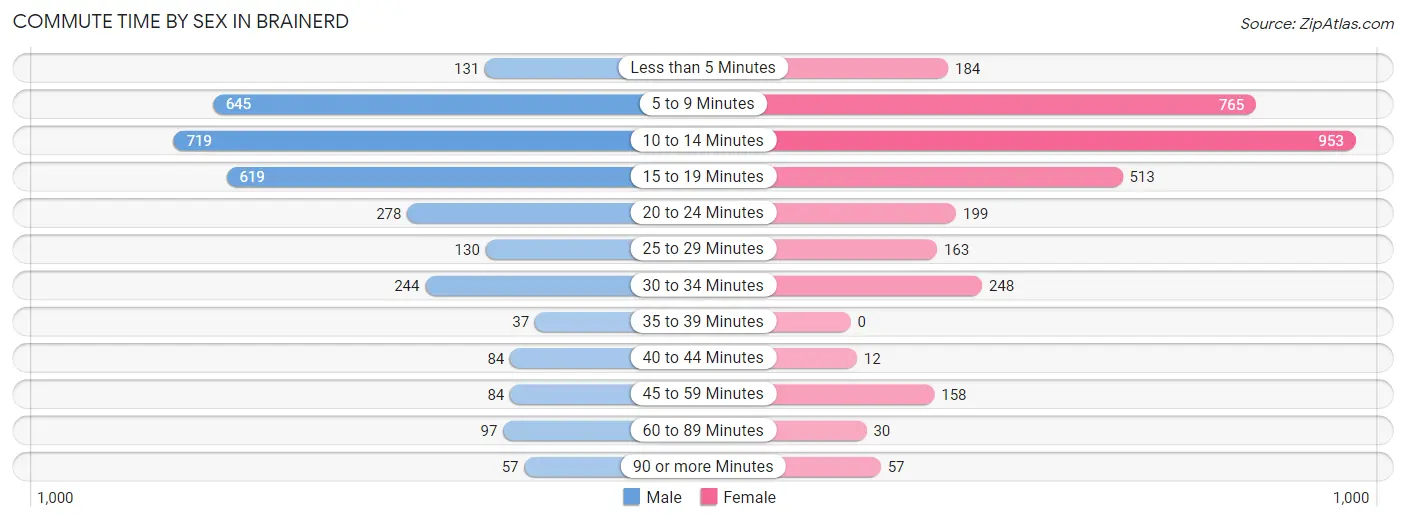
| Commute Time | Male | Female |
| Less than 5 Minutes | 131 (4.2%) | 184 (5.6%) |
| 5 to 9 Minutes | 645 (20.6%) | 765 (23.3%) |
| 10 to 14 Minutes | 719 (23.0%) | 953 (29.0%) |
| 15 to 19 Minutes | 619 (19.8%) | 513 (15.6%) |
| 20 to 24 Minutes | 278 (8.9%) | 199 (6.1%) |
| 25 to 29 Minutes | 130 (4.2%) | 163 (5.0%) |
| 30 to 34 Minutes | 244 (7.8%) | 248 (7.6%) |
| 35 to 39 Minutes | 37 (1.2%) | 0 (0.0%) |
| 40 to 44 Minutes | 84 (2.7%) | 12 (0.4%) |
| 45 to 59 Minutes | 84 (2.7%) | 158 (4.8%) |
| 60 to 89 Minutes | 97 (3.1%) | 30 (0.9%) |
| 90 or more Minutes | 57 (1.8%) | 57 (1.7%) |
Time of Departure to Work by Sex in Brainerd
The most frequent times of departure to work in Brainerd are 6:30 AM to 6:59 AM (405, 13.0%) for males and 7:30 AM to 7:59 AM (539, 16.4%) for females.
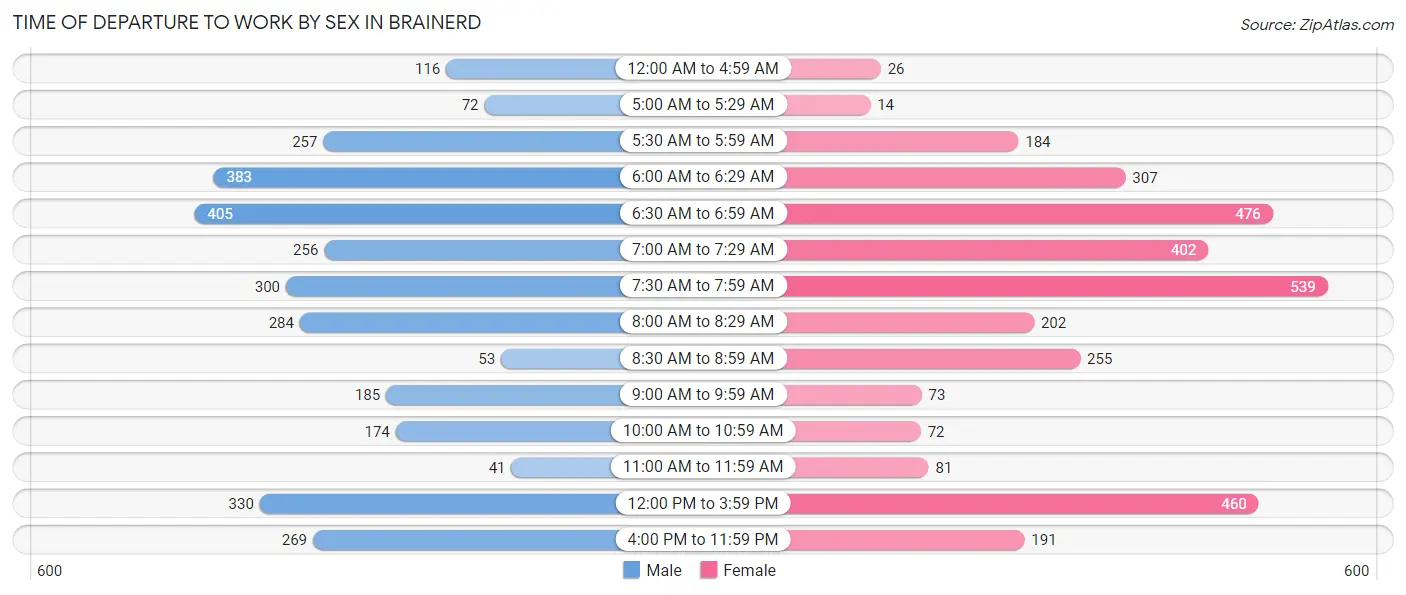
| Time of Departure | Male | Female |
| 12:00 AM to 4:59 AM | 116 (3.7%) | 26 (0.8%) |
| 5:00 AM to 5:29 AM | 72 (2.3%) | 14 (0.4%) |
| 5:30 AM to 5:59 AM | 257 (8.2%) | 184 (5.6%) |
| 6:00 AM to 6:29 AM | 383 (12.3%) | 307 (9.3%) |
| 6:30 AM to 6:59 AM | 405 (13.0%) | 476 (14.5%) |
| 7:00 AM to 7:29 AM | 256 (8.2%) | 402 (12.2%) |
| 7:30 AM to 7:59 AM | 300 (9.6%) | 539 (16.4%) |
| 8:00 AM to 8:29 AM | 284 (9.1%) | 202 (6.1%) |
| 8:30 AM to 8:59 AM | 53 (1.7%) | 255 (7.8%) |
| 9:00 AM to 9:59 AM | 185 (5.9%) | 73 (2.2%) |
| 10:00 AM to 10:59 AM | 174 (5.6%) | 72 (2.2%) |
| 11:00 AM to 11:59 AM | 41 (1.3%) | 81 (2.5%) |
| 12:00 PM to 3:59 PM | 330 (10.6%) | 460 (14.0%) |
| 4:00 PM to 11:59 PM | 269 (8.6%) | 191 (5.8%) |
| Total | 3,125 (100.0%) | 3,282 (100.0%) |
Housing Occupancy in Brainerd
Occupancy by Ownership in Brainerd
Of the total 6,223 dwellings in Brainerd, owner-occupied units account for 3,473 (55.8%), while renter-occupied units make up 2,750 (44.2%).
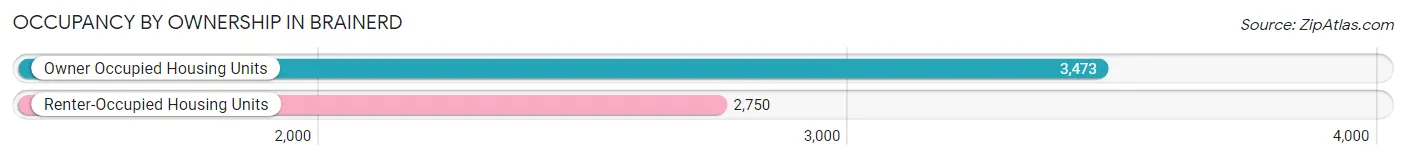
| Occupancy | # Housing Units | % Housing Units |
| Owner Occupied Housing Units | 3,473 | 55.8% |
| Renter-Occupied Housing Units | 2,750 | 44.2% |
| Total Occupied Housing Units | 6,223 | 100.0% |
Occupancy by Household Size in Brainerd
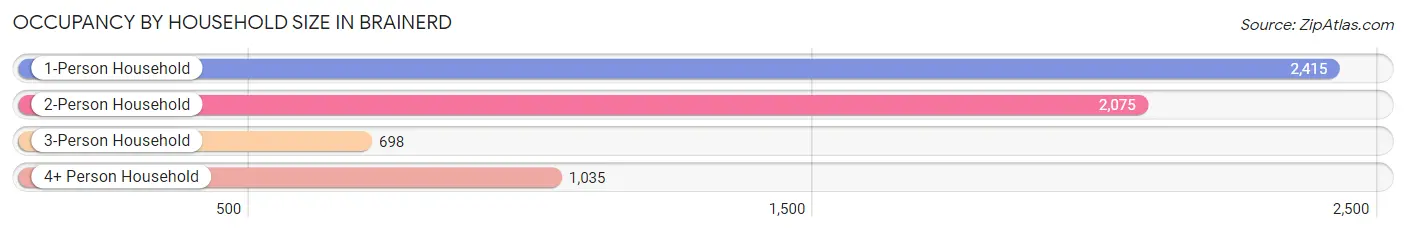
| Household Size | # Housing Units | % Housing Units |
| 1-Person Household | 2,415 | 38.8% |
| 2-Person Household | 2,075 | 33.3% |
| 3-Person Household | 698 | 11.2% |
| 4+ Person Household | 1,035 | 16.6% |
| Total Housing Units | 6,223 | 100.0% |
Occupancy by Ownership by Household Size in Brainerd
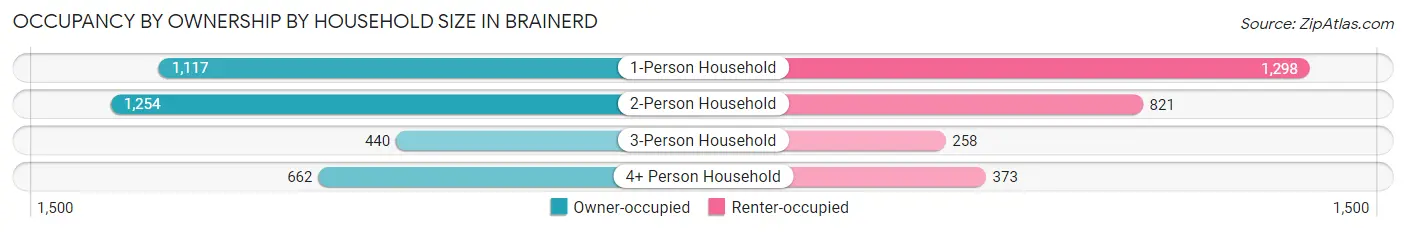
| Household Size | Owner-occupied | Renter-occupied |
| 1-Person Household | 1,117 (46.3%) | 1,298 (53.7%) |
| 2-Person Household | 1,254 (60.4%) | 821 (39.6%) |
| 3-Person Household | 440 (63.0%) | 258 (37.0%) |
| 4+ Person Household | 662 (64.0%) | 373 (36.0%) |
| Total Housing Units | 3,473 (55.8%) | 2,750 (44.2%) |
Occupancy by Educational Attainment in Brainerd
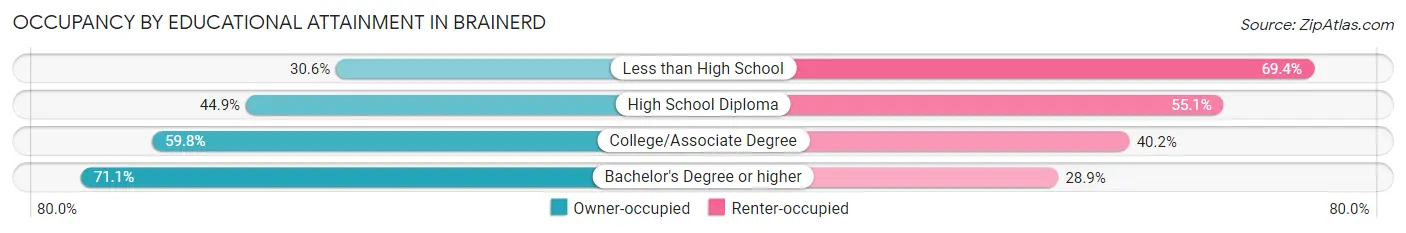
| Household Size | Owner-occupied | Renter-occupied |
| Less than High School | 97 (30.6%) | 220 (69.4%) |
| High School Diploma | 871 (44.9%) | 1,069 (55.1%) |
| College/Associate Degree | 1,662 (59.8%) | 1,118 (40.2%) |
| Bachelor's Degree or higher | 843 (71.1%) | 343 (28.9%) |
Occupancy by Age of Householder in Brainerd
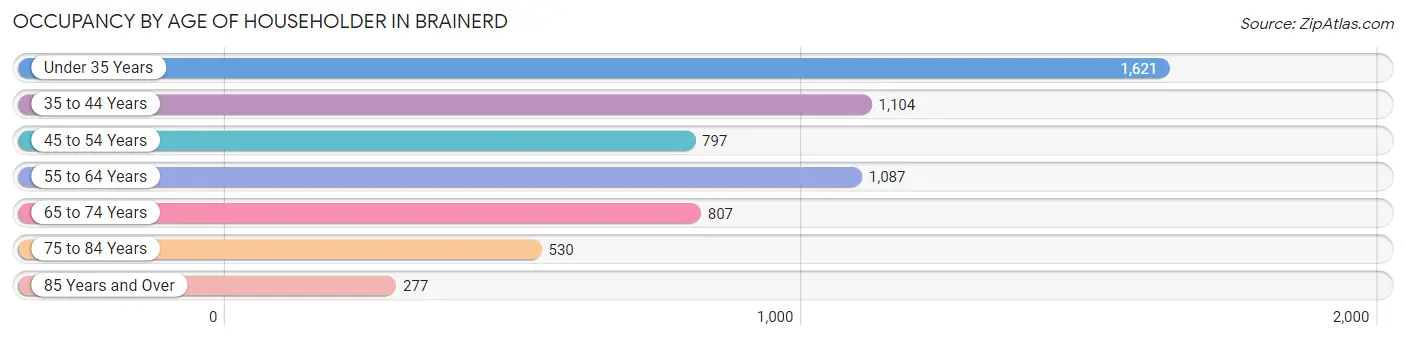
| Age Bracket | # Households | % Households |
| Under 35 Years | 1,621 | 26.1% |
| 35 to 44 Years | 1,104 | 17.7% |
| 45 to 54 Years | 797 | 12.8% |
| 55 to 64 Years | 1,087 | 17.5% |
| 65 to 74 Years | 807 | 13.0% |
| 75 to 84 Years | 530 | 8.5% |
| 85 Years and Over | 277 | 4.4% |
| Total | 6,223 | 100.0% |
Housing Finances in Brainerd
Median Income by Occupancy in Brainerd
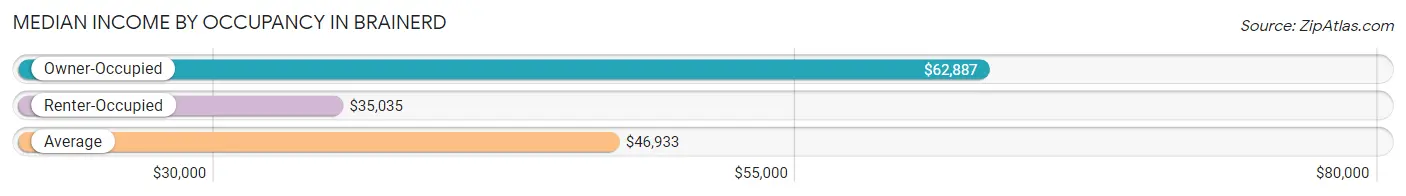
| Occupancy Type | # Households | Median Income |
| Owner-Occupied | 3,473 (55.8%) | $62,887 |
| Renter-Occupied | 2,750 (44.2%) | $35,035 |
| Average | 6,223 (100.0%) | $46,933 |
Occupancy by Householder Income Bracket in Brainerd
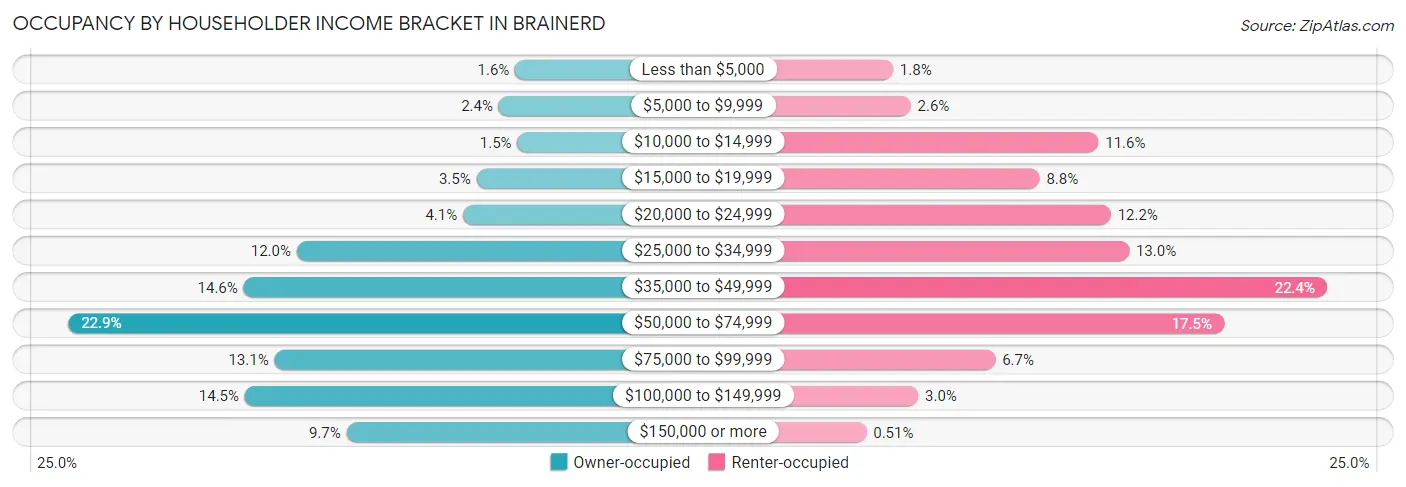
| Income Bracket | Owner-occupied | Renter-occupied |
| Less than $5,000 | 57 (1.6%) | 49 (1.8%) |
| $5,000 to $9,999 | 84 (2.4%) | 72 (2.6%) |
| $10,000 to $14,999 | 53 (1.5%) | 318 (11.6%) |
| $15,000 to $19,999 | 121 (3.5%) | 241 (8.8%) |
| $20,000 to $24,999 | 143 (4.1%) | 334 (12.1%) |
| $25,000 to $34,999 | 418 (12.0%) | 358 (13.0%) |
| $35,000 to $49,999 | 506 (14.6%) | 617 (22.4%) |
| $50,000 to $74,999 | 796 (22.9%) | 482 (17.5%) |
| $75,000 to $99,999 | 455 (13.1%) | 183 (6.7%) |
| $100,000 to $149,999 | 504 (14.5%) | 82 (3.0%) |
| $150,000 or more | 336 (9.7%) | 14 (0.5%) |
| Total | 3,473 (100.0%) | 2,750 (100.0%) |
Monthly Housing Cost Tiers in Brainerd
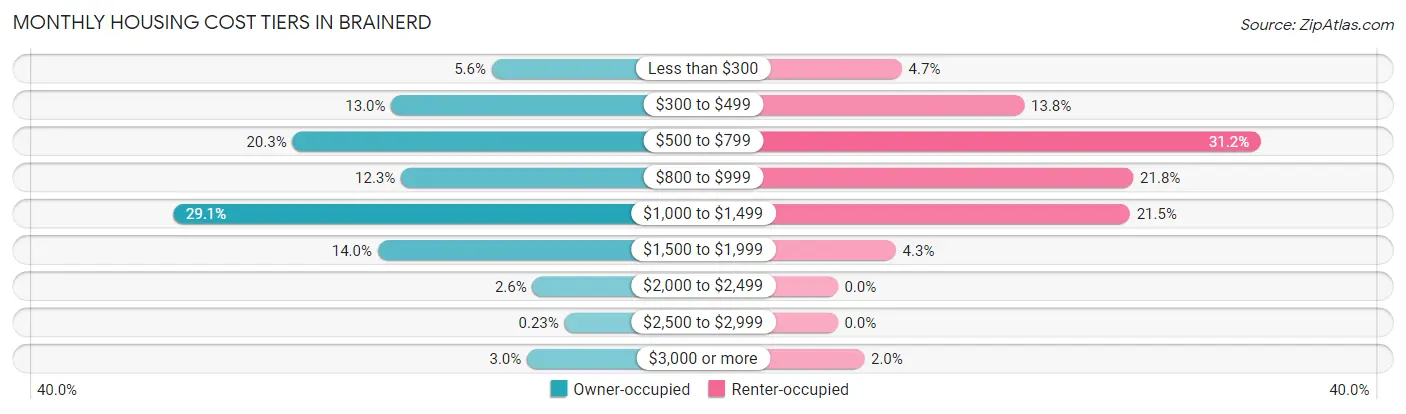
| Monthly Cost | Owner-occupied | Renter-occupied |
| Less than $300 | 194 (5.6%) | 130 (4.7%) |
| $300 to $499 | 451 (13.0%) | 378 (13.8%) |
| $500 to $799 | 704 (20.3%) | 858 (31.2%) |
| $800 to $999 | 426 (12.3%) | 599 (21.8%) |
| $1,000 to $1,499 | 1,010 (29.1%) | 592 (21.5%) |
| $1,500 to $1,999 | 486 (14.0%) | 118 (4.3%) |
| $2,000 to $2,499 | 90 (2.6%) | 0 (0.0%) |
| $2,500 to $2,999 | 8 (0.2%) | 0 (0.0%) |
| $3,000 or more | 104 (3.0%) | 54 (2.0%) |
| Total | 3,473 (100.0%) | 2,750 (100.0%) |
Physical Housing Characteristics in Brainerd
Housing Structures in Brainerd
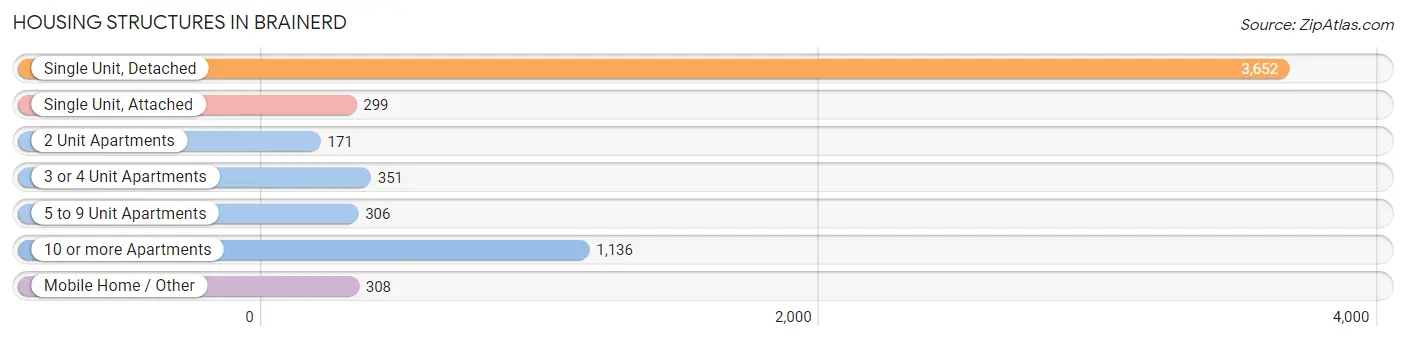
| Structure Type | # Housing Units | % Housing Units |
| Single Unit, Detached | 3,652 | 58.7% |
| Single Unit, Attached | 299 | 4.8% |
| 2 Unit Apartments | 171 | 2.8% |
| 3 or 4 Unit Apartments | 351 | 5.6% |
| 5 to 9 Unit Apartments | 306 | 4.9% |
| 10 or more Apartments | 1,136 | 18.2% |
| Mobile Home / Other | 308 | 5.0% |
| Total | 6,223 | 100.0% |
Housing Structures by Occupancy in Brainerd
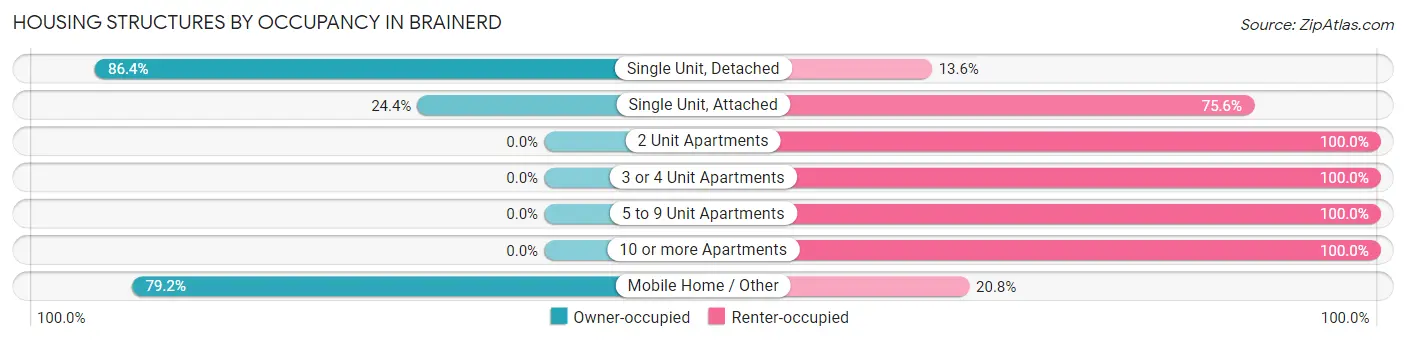
| Structure Type | Owner-occupied | Renter-occupied |
| Single Unit, Detached | 3,156 (86.4%) | 496 (13.6%) |
| Single Unit, Attached | 73 (24.4%) | 226 (75.6%) |
| 2 Unit Apartments | 0 (0.0%) | 171 (100.0%) |
| 3 or 4 Unit Apartments | 0 (0.0%) | 351 (100.0%) |
| 5 to 9 Unit Apartments | 0 (0.0%) | 306 (100.0%) |
| 10 or more Apartments | 0 (0.0%) | 1,136 (100.0%) |
| Mobile Home / Other | 244 (79.2%) | 64 (20.8%) |
| Total | 3,473 (55.8%) | 2,750 (44.2%) |
Housing Structures by Number of Rooms in Brainerd
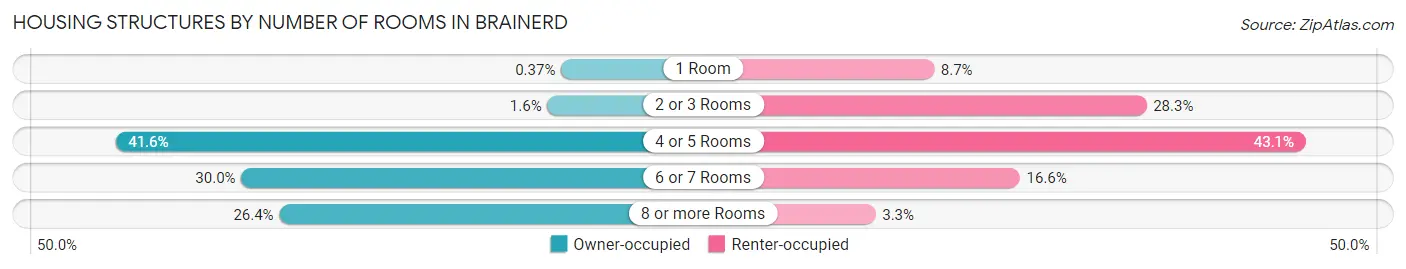
| Number of Rooms | Owner-occupied | Renter-occupied |
| 1 Room | 13 (0.4%) | 239 (8.7%) |
| 2 or 3 Rooms | 57 (1.6%) | 779 (28.3%) |
| 4 or 5 Rooms | 1,445 (41.6%) | 1,185 (43.1%) |
| 6 or 7 Rooms | 1,040 (29.9%) | 457 (16.6%) |
| 8 or more Rooms | 918 (26.4%) | 90 (3.3%) |
| Total | 3,473 (100.0%) | 2,750 (100.0%) |
Housing Structure by Heating Type in Brainerd
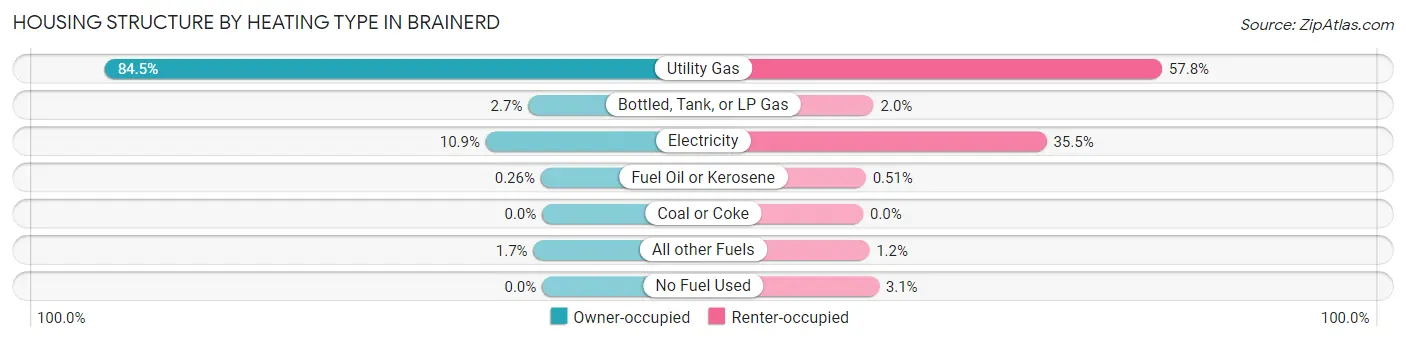
| Heating Type | Owner-occupied | Renter-occupied |
| Utility Gas | 2,935 (84.5%) | 1,588 (57.8%) |
| Bottled, Tank, or LP Gas | 93 (2.7%) | 56 (2.0%) |
| Electricity | 378 (10.9%) | 975 (35.4%) |
| Fuel Oil or Kerosene | 9 (0.3%) | 14 (0.5%) |
| Coal or Coke | 0 (0.0%) | 0 (0.0%) |
| All other Fuels | 58 (1.7%) | 33 (1.2%) |
| No Fuel Used | 0 (0.0%) | 84 (3.0%) |
| Total | 3,473 (100.0%) | 2,750 (100.0%) |
Household Vehicle Usage in Brainerd
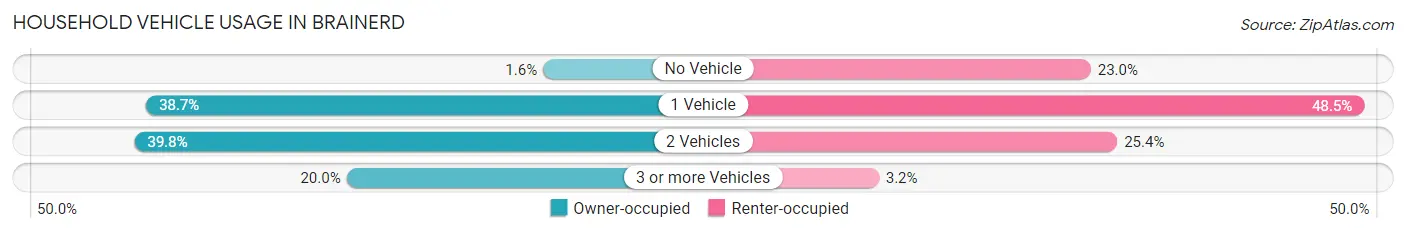
| Vehicles per Household | Owner-occupied | Renter-occupied |
| No Vehicle | 56 (1.6%) | 631 (23.0%) |
| 1 Vehicle | 1,343 (38.7%) | 1,333 (48.5%) |
| 2 Vehicles | 1,381 (39.8%) | 699 (25.4%) |
| 3 or more Vehicles | 693 (20.0%) | 87 (3.2%) |
| Total | 3,473 (100.0%) | 2,750 (100.0%) |
Real Estate & Mortgages in Brainerd
Real Estate and Mortgage Overview in Brainerd
| Characteristic | Without Mortgage | With Mortgage |
| Housing Units | 1,126 | 2,347 |
| Median Property Value | $158,800 | $164,000 |
| Median Household Income | $47,083 | $270 |
| Monthly Housing Costs | $482 | $104 |
| Real Estate Taxes | $1,630 | $55 |
Property Value by Mortgage Status in Brainerd
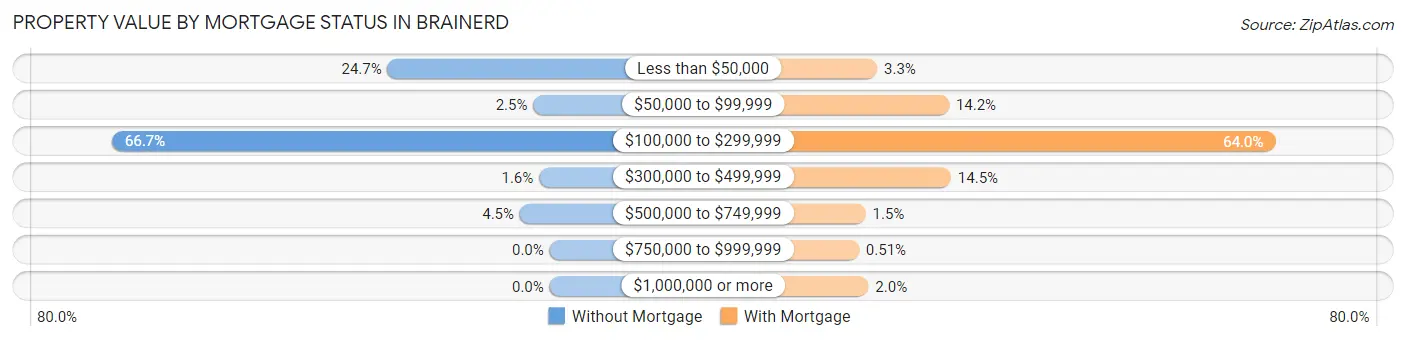
| Property Value | Without Mortgage | With Mortgage |
| Less than $50,000 | 278 (24.7%) | 77 (3.3%) |
| $50,000 to $99,999 | 28 (2.5%) | 334 (14.2%) |
| $100,000 to $299,999 | 751 (66.7%) | 1,501 (63.9%) |
| $300,000 to $499,999 | 18 (1.6%) | 341 (14.5%) |
| $500,000 to $749,999 | 51 (4.5%) | 36 (1.5%) |
| $750,000 to $999,999 | 0 (0.0%) | 12 (0.5%) |
| $1,000,000 or more | 0 (0.0%) | 46 (2.0%) |
| Total | 1,126 (100.0%) | 2,347 (100.0%) |
Household Income by Mortgage Status in Brainerd
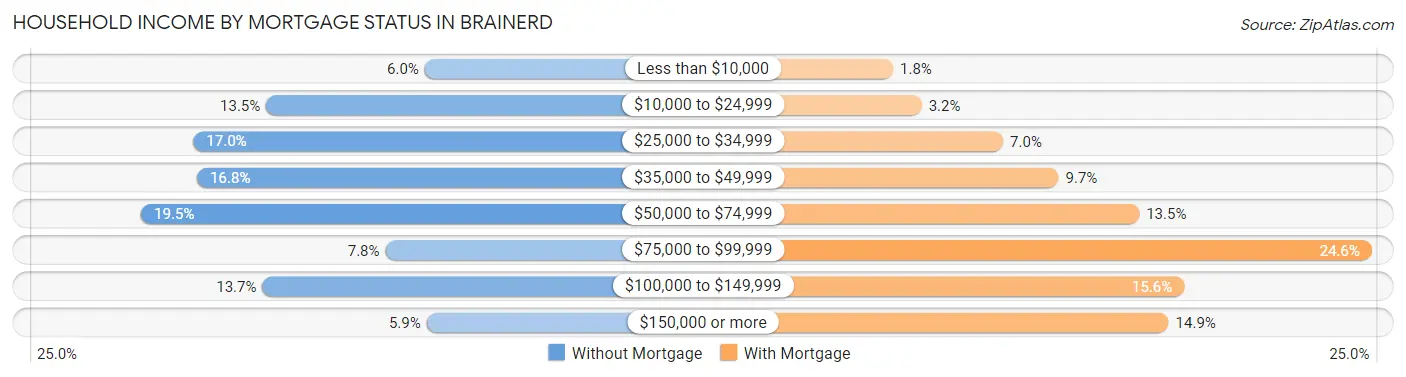
| Household Income | Without Mortgage | With Mortgage |
| Less than $10,000 | 67 (5.9%) | 42 (1.8%) |
| $10,000 to $24,999 | 152 (13.5%) | 74 (3.2%) |
| $25,000 to $34,999 | 191 (17.0%) | 165 (7.0%) |
| $35,000 to $49,999 | 189 (16.8%) | 227 (9.7%) |
| $50,000 to $74,999 | 219 (19.5%) | 317 (13.5%) |
| $75,000 to $99,999 | 88 (7.8%) | 577 (24.6%) |
| $100,000 to $149,999 | 154 (13.7%) | 367 (15.6%) |
| $150,000 or more | 66 (5.9%) | 350 (14.9%) |
| Total | 1,126 (100.0%) | 2,347 (100.0%) |
Property Value to Household Income Ratio in Brainerd
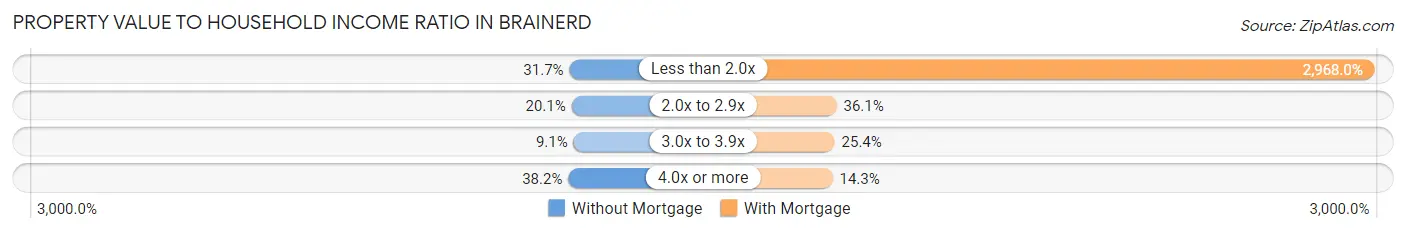
| Value-to-Income Ratio | Without Mortgage | With Mortgage |
| Less than 2.0x | 357 (31.7%) | 69,659 (2,968.0%) |
| 2.0x to 2.9x | 226 (20.1%) | 847 (36.1%) |
| 3.0x to 3.9x | 102 (9.1%) | 597 (25.4%) |
| 4.0x or more | 430 (38.2%) | 335 (14.3%) |
| Total | 1,126 (100.0%) | 2,347 (100.0%) |
Real Estate Taxes by Mortgage Status in Brainerd
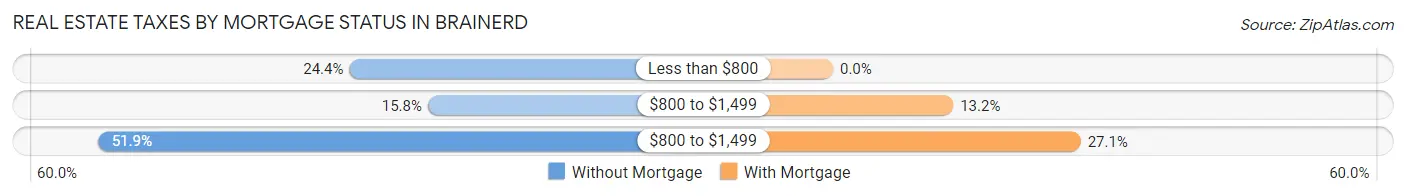
| Property Taxes | Without Mortgage | With Mortgage |
| Less than $800 | 275 (24.4%) | 0 (0.0%) |
| $800 to $1,499 | 178 (15.8%) | 309 (13.2%) |
| $800 to $1,499 | 584 (51.9%) | 637 (27.1%) |
| Total | 1,126 (100.0%) | 2,347 (100.0%) |
Health & Disability in Brainerd
Health Insurance Coverage by Age in Brainerd
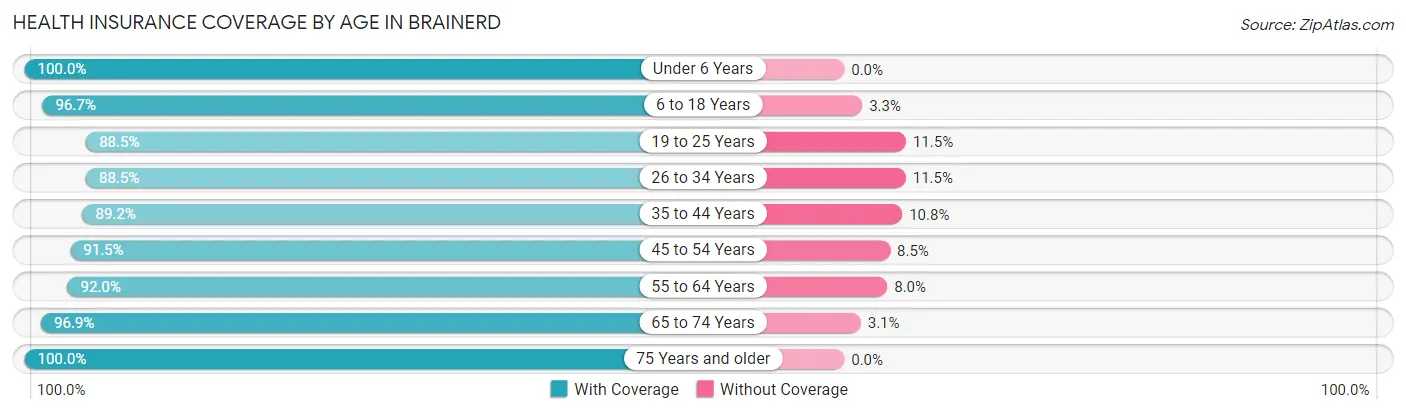
| Age Bracket | With Coverage | Without Coverage |
| Under 6 Years | 1,336 (100.0%) | 0 (0.0%) |
| 6 to 18 Years | 1,825 (96.7%) | 63 (3.3%) |
| 19 to 25 Years | 1,547 (88.5%) | 201 (11.5%) |
| 26 to 34 Years | 1,667 (88.5%) | 216 (11.5%) |
| 35 to 44 Years | 1,659 (89.2%) | 201 (10.8%) |
| 45 to 54 Years | 1,200 (91.5%) | 112 (8.5%) |
| 55 to 64 Years | 1,583 (92.0%) | 138 (8.0%) |
| 65 to 74 Years | 1,071 (96.9%) | 34 (3.1%) |
| 75 Years and older | 1,044 (100.0%) | 0 (0.0%) |
| Total | 12,932 (93.1%) | 965 (6.9%) |
Health Insurance Coverage by Citizenship Status in Brainerd
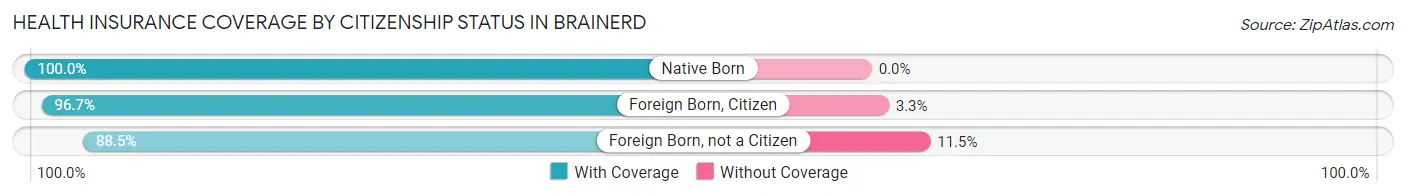
| Citizenship Status | With Coverage | Without Coverage |
| Native Born | 1,336 (100.0%) | 0 (0.0%) |
| Foreign Born, Citizen | 1,825 (96.7%) | 63 (3.3%) |
| Foreign Born, not a Citizen | 1,547 (88.5%) | 201 (11.5%) |
Health Insurance Coverage by Household Income in Brainerd
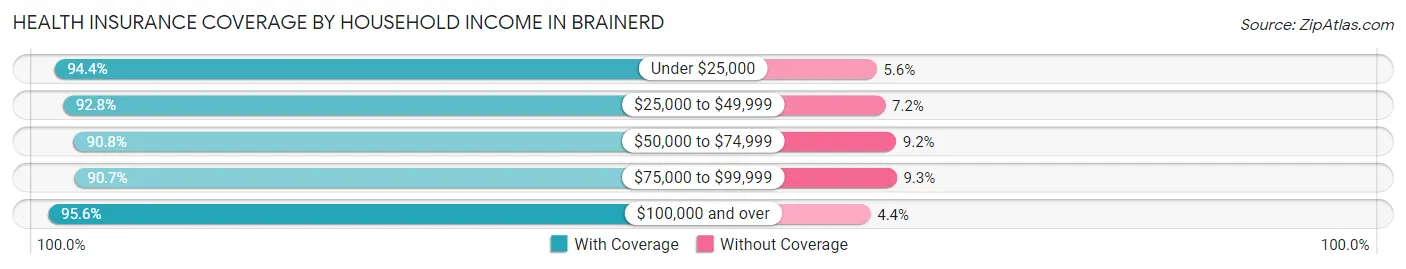
| Household Income | With Coverage | Without Coverage |
| Under $25,000 | 2,397 (94.4%) | 141 (5.6%) |
| $25,000 to $49,999 | 3,105 (92.8%) | 240 (7.2%) |
| $50,000 to $74,999 | 3,044 (90.8%) | 308 (9.2%) |
| $75,000 to $99,999 | 1,509 (90.7%) | 155 (9.3%) |
| $100,000 and over | 2,629 (95.6%) | 121 (4.4%) |
Public vs Private Health Insurance Coverage by Age in Brainerd
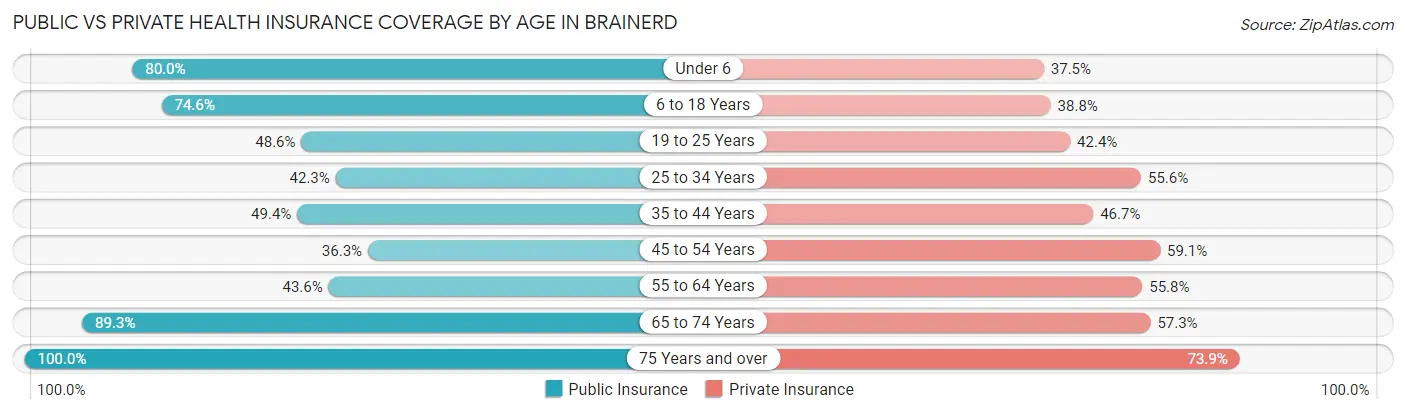
| Age Bracket | Public Insurance | Private Insurance |
| Under 6 | 1,069 (80.0%) | 501 (37.5%) |
| 6 to 18 Years | 1,408 (74.6%) | 732 (38.8%) |
| 19 to 25 Years | 850 (48.6%) | 741 (42.4%) |
| 25 to 34 Years | 796 (42.3%) | 1,046 (55.5%) |
| 35 to 44 Years | 919 (49.4%) | 868 (46.7%) |
| 45 to 54 Years | 476 (36.3%) | 775 (59.1%) |
| 55 to 64 Years | 750 (43.6%) | 960 (55.8%) |
| 65 to 74 Years | 987 (89.3%) | 633 (57.3%) |
| 75 Years and over | 1,044 (100.0%) | 771 (73.9%) |
| Total | 8,299 (59.7%) | 7,027 (50.6%) |
Disability Status by Sex by Age in Brainerd
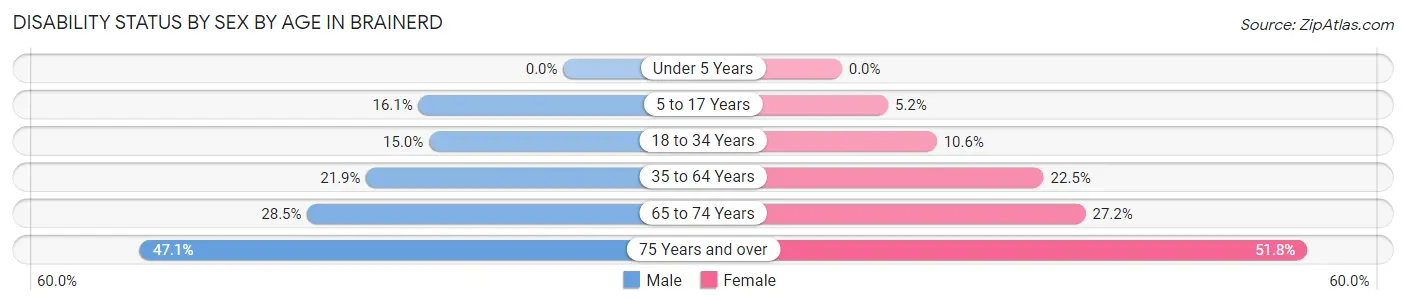
| Age Bracket | Male | Female |
| Under 5 Years | 0 (0.0%) | 0 (0.0%) |
| 5 to 17 Years | 181 (16.1%) | 48 (5.1%) |
| 18 to 34 Years | 231 (14.9%) | 224 (10.6%) |
| 35 to 64 Years | 570 (21.9%) | 516 (22.5%) |
| 65 to 74 Years | 126 (28.5%) | 180 (27.2%) |
| 75 Years and over | 132 (47.1%) | 396 (51.8%) |
Disability Class by Sex by Age in Brainerd
Disability Class: Hearing Difficulty
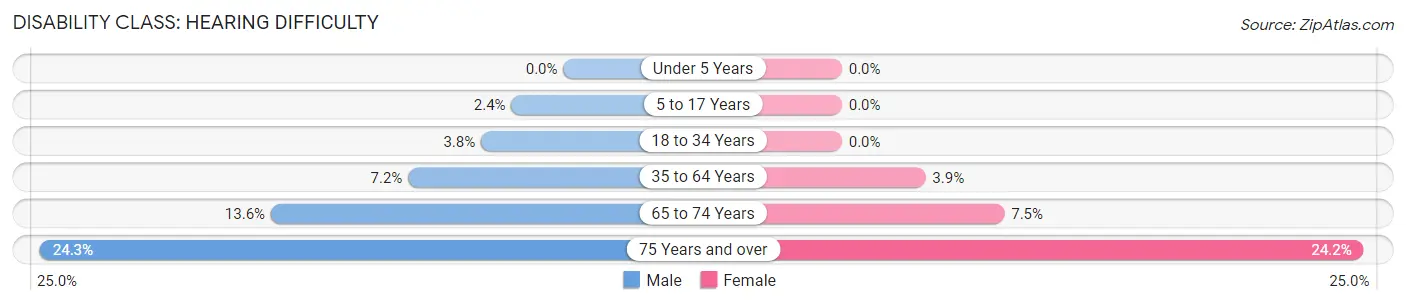
| Age Bracket | Male | Female |
| Under 5 Years | 0 (0.0%) | 0 (0.0%) |
| 5 to 17 Years | 27 (2.4%) | 0 (0.0%) |
| 18 to 34 Years | 59 (3.8%) | 0 (0.0%) |
| 35 to 64 Years | 187 (7.2%) | 89 (3.9%) |
| 65 to 74 Years | 60 (13.6%) | 50 (7.5%) |
| 75 Years and over | 68 (24.3%) | 185 (24.2%) |
Disability Class: Vision Difficulty
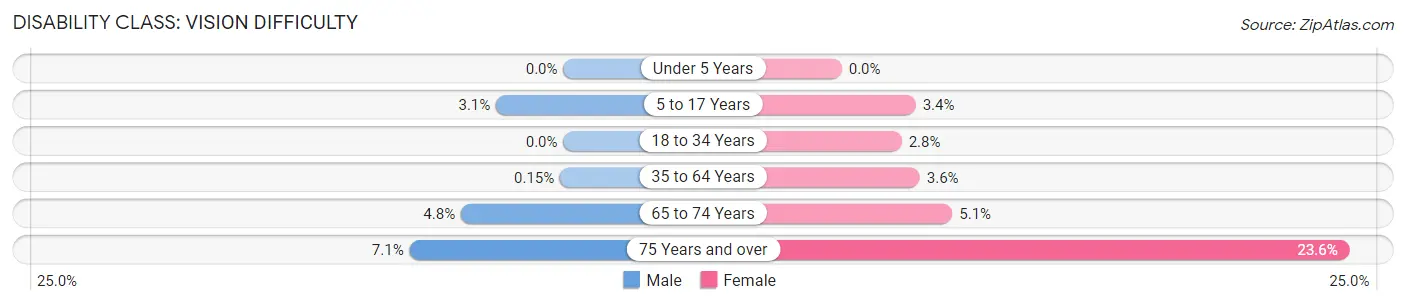
| Age Bracket | Male | Female |
| Under 5 Years | 0 (0.0%) | 0 (0.0%) |
| 5 to 17 Years | 35 (3.1%) | 32 (3.4%) |
| 18 to 34 Years | 0 (0.0%) | 59 (2.8%) |
| 35 to 64 Years | 4 (0.2%) | 83 (3.6%) |
| 65 to 74 Years | 21 (4.8%) | 34 (5.1%) |
| 75 Years and over | 20 (7.1%) | 180 (23.6%) |
Disability Class: Cognitive Difficulty
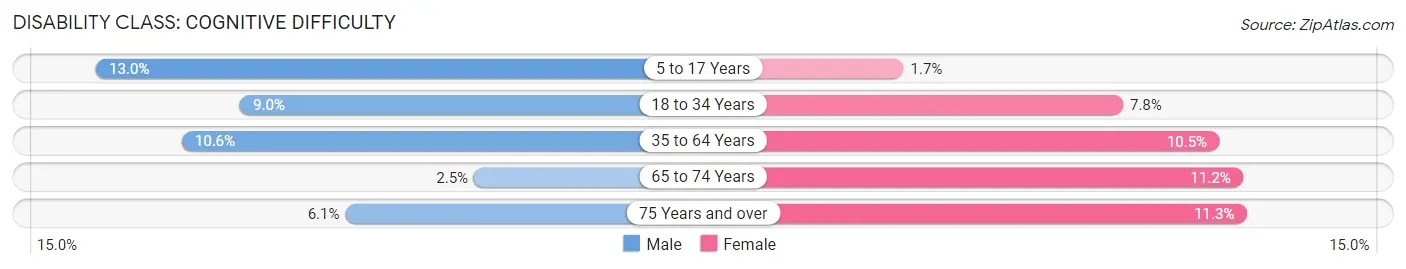
| Age Bracket | Male | Female |
| 5 to 17 Years | 146 (13.0%) | 16 (1.7%) |
| 18 to 34 Years | 139 (9.0%) | 166 (7.8%) |
| 35 to 64 Years | 276 (10.6%) | 241 (10.5%) |
| 65 to 74 Years | 11 (2.5%) | 74 (11.2%) |
| 75 Years and over | 17 (6.1%) | 86 (11.3%) |
Disability Class: Ambulatory Difficulty
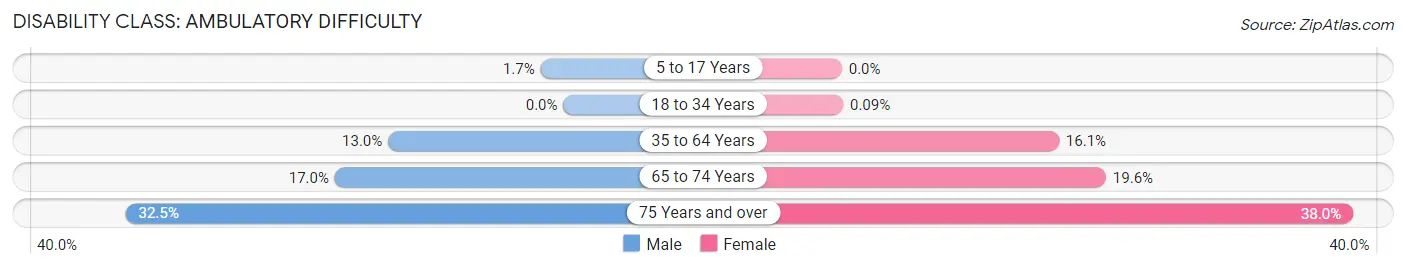
| Age Bracket | Male | Female |
| 5 to 17 Years | 19 (1.7%) | 0 (0.0%) |
| 18 to 34 Years | 0 (0.0%) | 2 (0.1%) |
| 35 to 64 Years | 338 (13.0%) | 370 (16.1%) |
| 65 to 74 Years | 75 (17.0%) | 130 (19.6%) |
| 75 Years and over | 91 (32.5%) | 290 (38.0%) |
Disability Class: Self-Care Difficulty
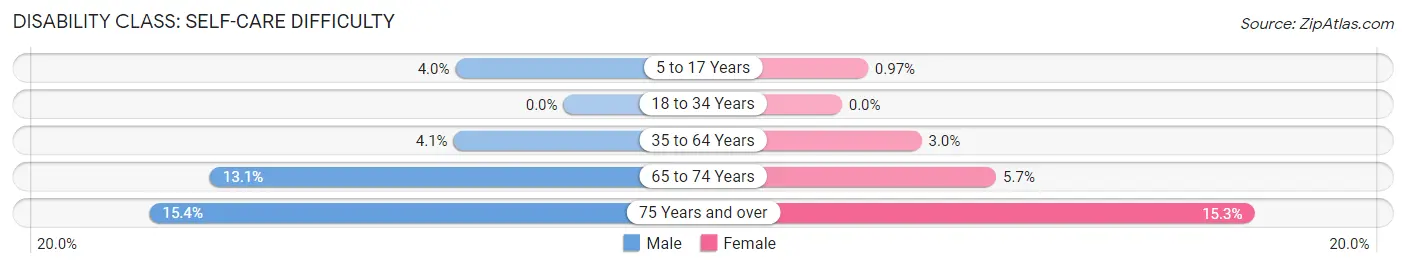
| Age Bracket | Male | Female |
| 5 to 17 Years | 45 (4.0%) | 9 (1.0%) |
| 18 to 34 Years | 0 (0.0%) | 0 (0.0%) |
| 35 to 64 Years | 106 (4.1%) | 68 (3.0%) |
| 65 to 74 Years | 58 (13.1%) | 38 (5.7%) |
| 75 Years and over | 43 (15.4%) | 117 (15.3%) |
Technology Access in Brainerd
Computing Device Access in Brainerd
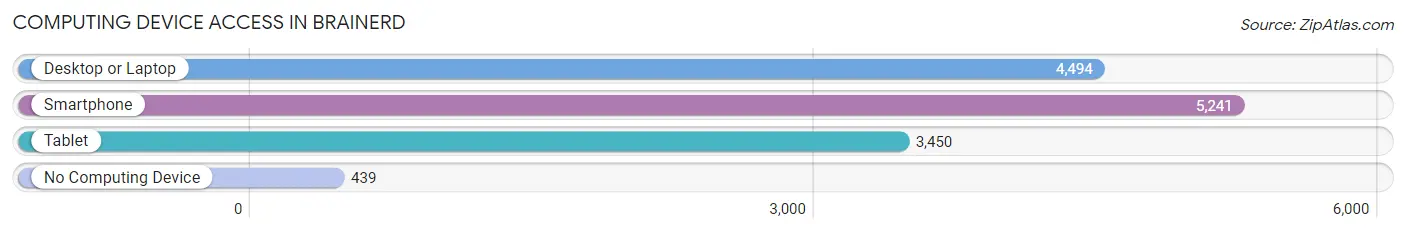
| Device Type | # Households | % Households |
| Desktop or Laptop | 4,494 | 72.2% |
| Smartphone | 5,241 | 84.2% |
| Tablet | 3,450 | 55.4% |
| No Computing Device | 439 | 7.0% |
| Total | 6,223 | 100.0% |
Internet Access in Brainerd
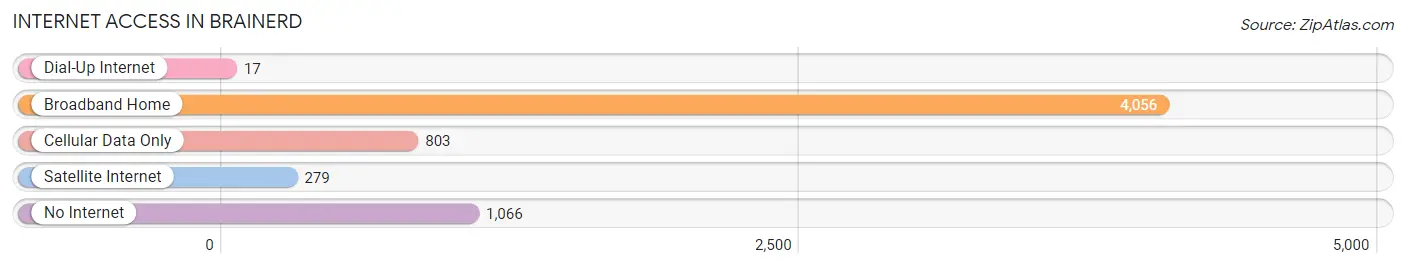
| Internet Type | # Households | % Households |
| Dial-Up Internet | 17 | 0.3% |
| Broadband Home | 4,056 | 65.2% |
| Cellular Data Only | 803 | 12.9% |
| Satellite Internet | 279 | 4.5% |
| No Internet | 1,066 | 17.1% |
| Total | 6,223 | 100.0% |
Brainerd Summary
History
The city of Brainerd, Minnesota is located in the heart of the state, in Crow Wing County. It is situated on the south shore of Gull Lake, and is the county seat. The city was founded in 1871 by the Northern Pacific Railroad, and was named after Lawrence Brainerd, a railroad official. The city was incorporated in 1873, and has since grown to become the largest city in the county.
The area around Brainerd has a long history of human habitation. The Ojibwe people were the first to inhabit the area, and they were followed by French fur traders and missionaries. The area was also home to the Dakota people, who were displaced by the Ojibwe. The first permanent settlers in the area were the French-Canadian Metis, who arrived in the late 1800s.
Geography
Brainerd is located in the center of Minnesota, in Crow Wing County. It is situated on the south shore of Gull Lake, and is surrounded by several other lakes, including Whitefish, Pelican, and North Long. The city is located in the heart of the state's lake country, and is known for its many recreational opportunities.
The city has a total area of 16.2 square miles, of which 15.7 square miles is land and 0.5 square miles is water. The terrain is mostly flat, with some rolling hills in the northern part of the city. The climate is humid continental, with cold winters and warm summers.
Economy
Brainerd is the economic hub of Crow Wing County, and is home to a variety of businesses and industries. The city is home to several large employers, including the Brainerd Public Schools, Essentia Health, and the Brainerd Lakes Area Chamber of Commerce. The city is also home to several manufacturing companies, including 3M, Cargill, and Andersen Windows.
The city is also home to a thriving tourism industry, with many visitors coming to the area to enjoy the lakes, forests, and other outdoor activities. The city is home to several golf courses, as well as a variety of restaurants, shops, and other attractions.
Demographics
As of the 2010 census, the population of Brainerd was 13,592. The racial makeup of the city was 94.2% White, 1.2% African American, 0.7% Native American, 0.7% Asian, 0.1% Pacific Islander, 1.3% from other races, and 1.9% from two or more races. Hispanic or Latino of any race were 3.2% of the population.
The median income for a household in the city was $41,945, and the median income for a family was $50,945. The per capita income for the city was $21,845. About 11.2% of families and 14.2% of the population were below the poverty line, including 19.2% of those under age 18 and 8.2% of those age 65 or over.
Brainerd is a diverse city, with a variety of cultures and backgrounds represented. The city is home to a variety of churches, including Catholic, Lutheran, Methodist, and Baptist. The city is also home to a variety of ethnic restaurants, including Mexican, Chinese, and Italian.
Common Questions
What is Per Capita Income in Brainerd?
Per Capita income in Brainerd is $28,313.
What is the Median Family Income in Brainerd?
Median Family Income in Brainerd is $53,423.
What is the Median Household income in Brainerd?
Median Household Income in Brainerd is $46,933.
What is Income or Wage Gap in Brainerd?
Income or Wage Gap in Brainerd is 25.8%.
Women in Brainerd earn 74.2 cents for every dollar earned by a man.
What is Inequality or Gini Index in Brainerd?
Inequality or Gini Index in Brainerd is 0.43.
What is the Total Population of Brainerd?
Total Population of Brainerd is 14,412.
What is the Total Male Population of Brainerd?
Total Male Population of Brainerd is 6,706.
What is the Total Female Population of Brainerd?
Total Female Population of Brainerd is 7,706.
What is the Ratio of Males per 100 Females in Brainerd?
There are 87.02 Males per 100 Females in Brainerd.
What is the Ratio of Females per 100 Males in Brainerd?
There are 114.91 Females per 100 Males in Brainerd.
What is the Median Population Age in Brainerd?
Median Population Age in Brainerd is 36.0 Years.
What is the Average Family Size in Brainerd
Average Family Size in Brainerd is 2.9 People.
What is the Average Household Size in Brainerd
Average Household Size in Brainerd is 2.2 People.
How Large is the Labor Force in Brainerd?
There are 7,348 People in the Labor Forcein in Brainerd.
What is the Percentage of People in the Labor Force in Brainerd?
64.2% of People are in the Labor Force in Brainerd.
What is the Unemployment Rate in Brainerd?
Unemployment Rate in Brainerd is 7.4%.