Bingham Lake, MN Map & Demographics
Bingham Lake Map
Bingham Lake Overview
$37,122
PER CAPITA INCOME
$121,250
AVG FAMILY INCOME
$95,750
AVG HOUSEHOLD INCOME
27.7%
WAGE / INCOME GAP [ % ]
72.3¢/ $1
WAGE / INCOME GAP [ $ ]
0.38
INEQUALITY / GINI INDEX
125
TOTAL POPULATION
79
MALE POPULATION
46
FEMALE POPULATION
171.74
MALES / 100 FEMALES
58.23
FEMALES / 100 MALES
41.3
MEDIAN AGE
3.5
AVG FAMILY SIZE
2.8
AVG HOUSEHOLD SIZE
64
LABOR FORCE [ PEOPLE ]
75.3%
PERCENT IN LABOR FORCE
6.3%
UNEMPLOYMENT RATE
Bingham Lake Zip Codes
Bingham Lake Area Codes
Income in Bingham Lake
Income Overview in Bingham Lake
Per Capita Income in Bingham Lake is $37,122, while median incomes of families and households are $121,250 and $95,750 respectively.
| Characteristic | Number | Measure |
| Per Capita Income | 125 | $37,122 |
| Median Family Income | 31 | $121,250 |
| Mean Family Income | 31 | $135,429 |
| Median Household Income | 45 | $95,750 |
| Mean Household Income | 45 | $104,947 |
| Income Deficit | 31 | $0 |
| Wage / Income Gap (%) | 125 | 27.66% |
| Wage / Income Gap ($) | 125 | 72.34¢ per $1 |
| Gini / Inequality Index | 125 | 0.38 |
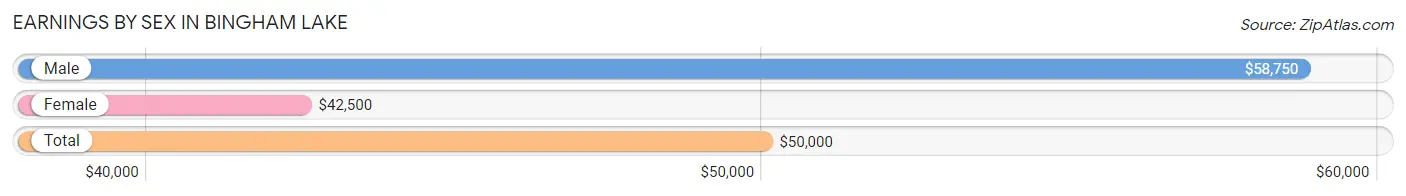
Earnings by Sex in Bingham Lake
Average Earnings in Bingham Lake are $50,000, $58,750 for men and $42,500 for women, a difference of 27.7%.
| Sex | Number | Average Earnings |
| Male | 42 (60.0%) | $58,750 |
| Female | 28 (40.0%) | $42,500 |
| Total | 70 (100.0%) | $50,000 |
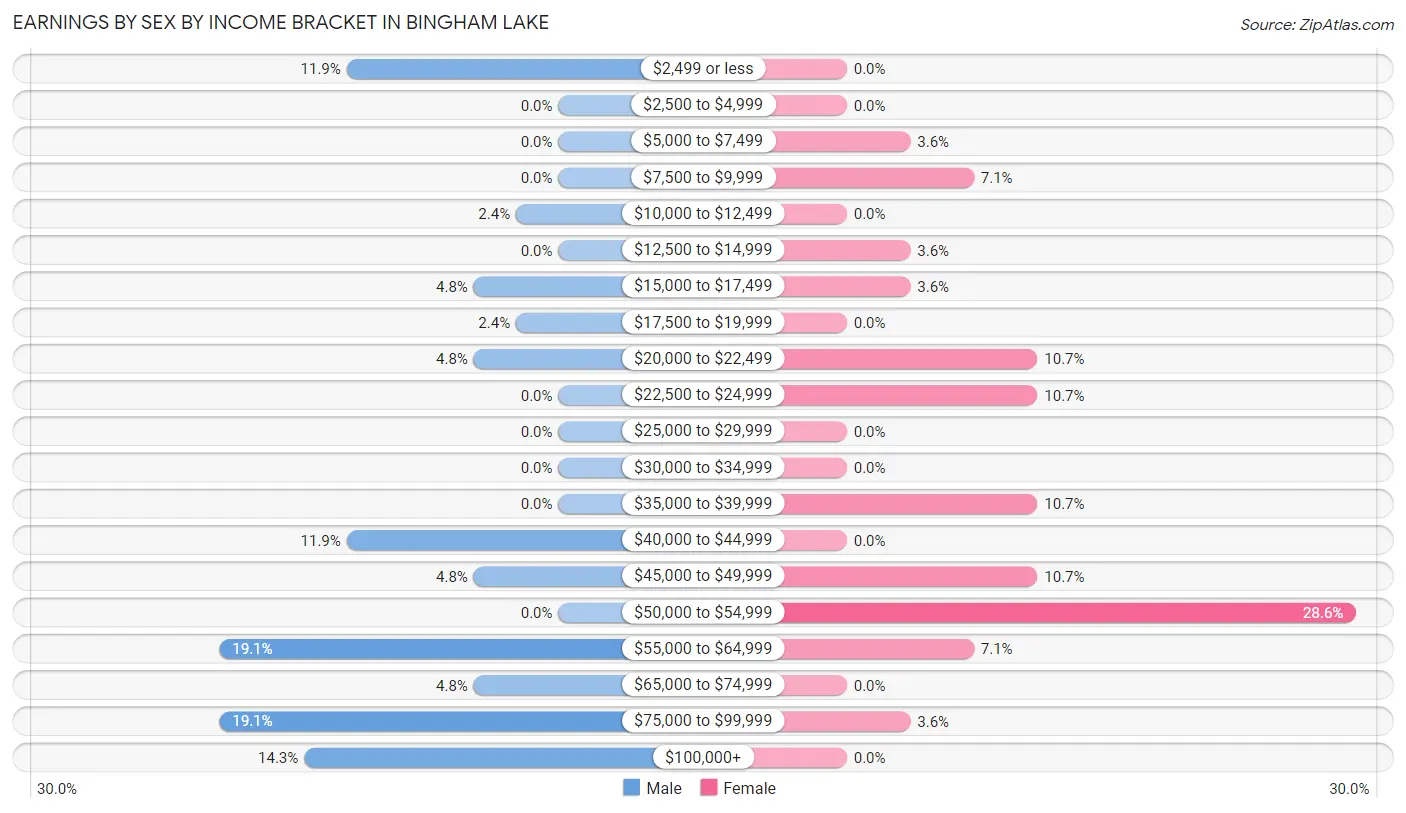
Earnings by Sex by Income Bracket in Bingham Lake
The most common earnings brackets in Bingham Lake are $55,000 to $64,999 for men (8 | 19.1%) and $50,000 to $54,999 for women (8 | 28.6%).
| Income | Male | Female |
| $2,499 or less | 5 (11.9%) | 0 (0.0%) |
| $2,500 to $4,999 | 0 (0.0%) | 0 (0.0%) |
| $5,000 to $7,499 | 0 (0.0%) | 1 (3.6%) |
| $7,500 to $9,999 | 0 (0.0%) | 2 (7.1%) |
| $10,000 to $12,499 | 1 (2.4%) | 0 (0.0%) |
| $12,500 to $14,999 | 0 (0.0%) | 1 (3.6%) |
| $15,000 to $17,499 | 2 (4.8%) | 1 (3.6%) |
| $17,500 to $19,999 | 1 (2.4%) | 0 (0.0%) |
| $20,000 to $22,499 | 2 (4.8%) | 3 (10.7%) |
| $22,500 to $24,999 | 0 (0.0%) | 3 (10.7%) |
| $25,000 to $29,999 | 0 (0.0%) | 0 (0.0%) |
| $30,000 to $34,999 | 0 (0.0%) | 0 (0.0%) |
| $35,000 to $39,999 | 0 (0.0%) | 3 (10.7%) |
| $40,000 to $44,999 | 5 (11.9%) | 0 (0.0%) |
| $45,000 to $49,999 | 2 (4.8%) | 3 (10.7%) |
| $50,000 to $54,999 | 0 (0.0%) | 8 (28.6%) |
| $55,000 to $64,999 | 8 (19.1%) | 2 (7.1%) |
| $65,000 to $74,999 | 2 (4.8%) | 0 (0.0%) |
| $75,000 to $99,999 | 8 (19.1%) | 1 (3.6%) |
| $100,000+ | 6 (14.3%) | 0 (0.0%) |
| Total | 42 (100.0%) | 28 (100.0%) |
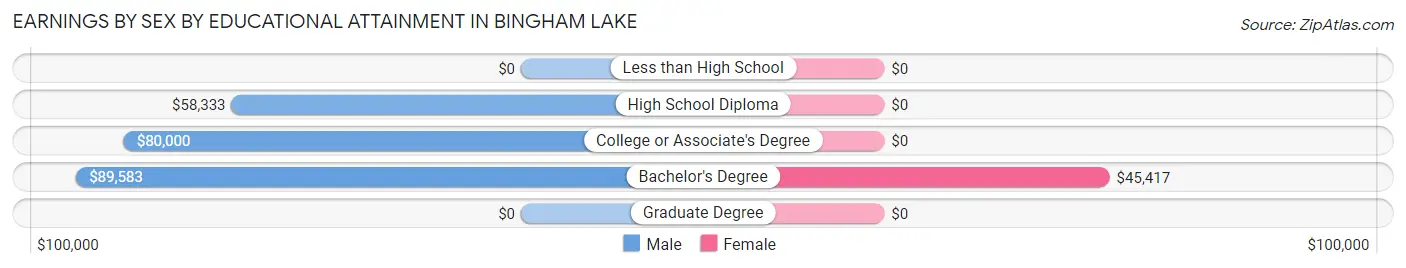
Earnings by Sex by Educational Attainment in Bingham Lake
Average earnings in Bingham Lake are $59,792 for men and $42,500 for women, a difference of 28.9%. Men with an educational attainment of bachelor's degree enjoy the highest average annual earnings of $89,583, while those with high school diploma education earn the least with $58,333. Women with an educational attainment of bachelor's degree earn the most with the average annual earnings of $45,417, while those with bachelor's degree education have the smallest earnings of $45,417.
| Educational Attainment | Male Income | Female Income |
| Less than High School | - | - |
| High School Diploma | $58,333 | $0 |
| College or Associate's Degree | $80,000 | $0 |
| Bachelor's Degree | $89,583 | $45,417 |
| Graduate Degree | - | - |
| Total | $59,792 | $42,500 |
Family Income in Bingham Lake
Family Income Brackets in Bingham Lake
According to the Bingham Lake family income data, there are 9 families falling into the $100,000 to $149,999 income range, which is the most common income bracket and makes up 29.0% of all families.
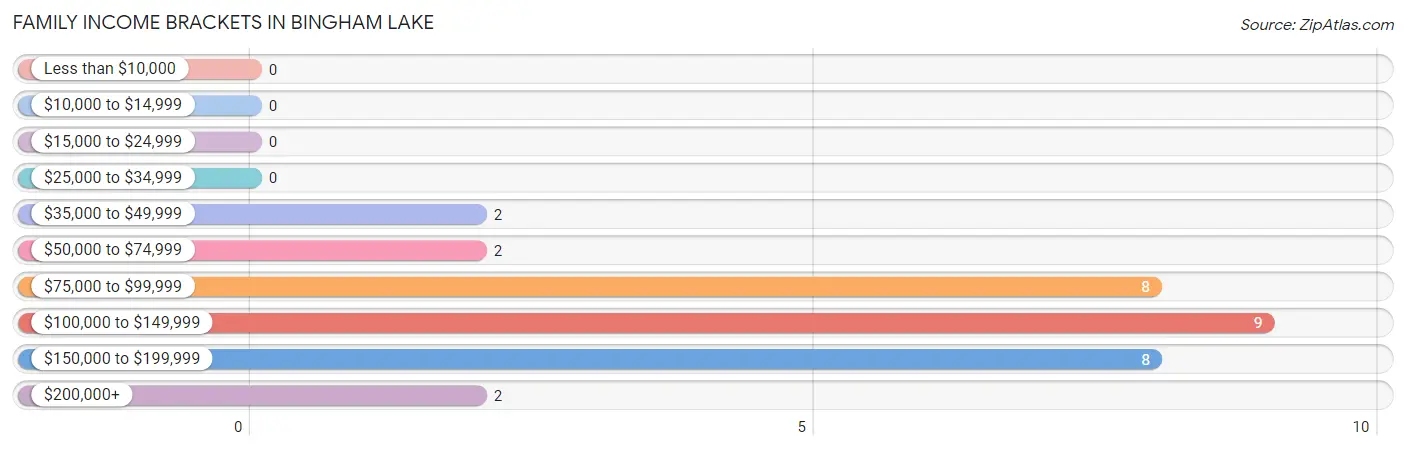
| Income Bracket | # Families | % Families |
| Less than $10,000 | 0 | 0.0% |
| $10,000 to $14,999 | 0 | 0.0% |
| $15,000 to $24,999 | 0 | 0.0% |
| $25,000 to $34,999 | 0 | 0.0% |
| $35,000 to $49,999 | 2 | 6.5% |
| $50,000 to $74,999 | 2 | 6.5% |
| $75,000 to $99,999 | 8 | 25.8% |
| $100,000 to $149,999 | 9 | 29.0% |
| $150,000 to $199,999 | 8 | 25.8% |
| $200,000+ | 2 | 6.5% |
Family Income by Famaliy Size in Bingham Lake
2-person families (17 | 54.8%) account for the highest median family income in Bingham Lake with $158,438 per family, while 2-person families (17 | 54.8%) have the highest median income of $79,219 per family member.
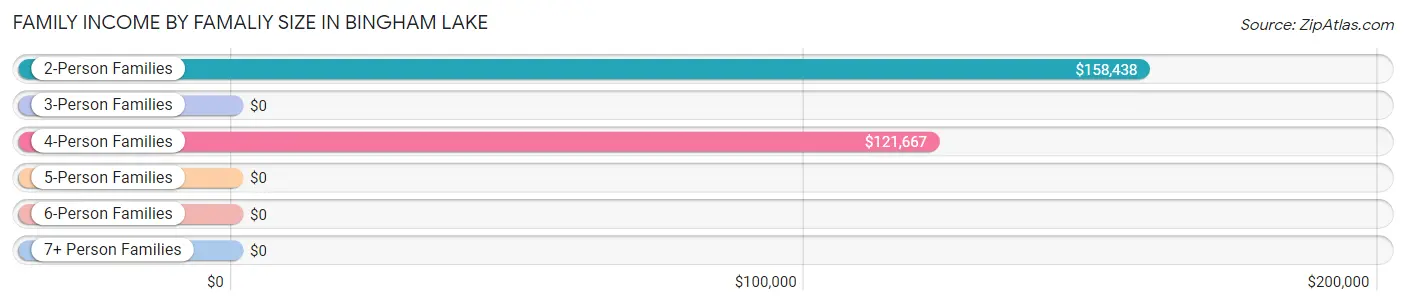
| Income Bracket | # Families | Median Income |
| 2-Person Families | 17 (54.8%) | $158,438 |
| 3-Person Families | 1 (3.2%) | $0 |
| 4-Person Families | 8 (25.8%) | $121,667 |
| 5-Person Families | 0 (0.0%) | $0 |
| 6-Person Families | 0 (0.0%) | $0 |
| 7+ Person Families | 5 (16.1%) | $0 |
| Total | 31 (100.0%) | $121,250 |
Family Income by Number of Earners in Bingham Lake
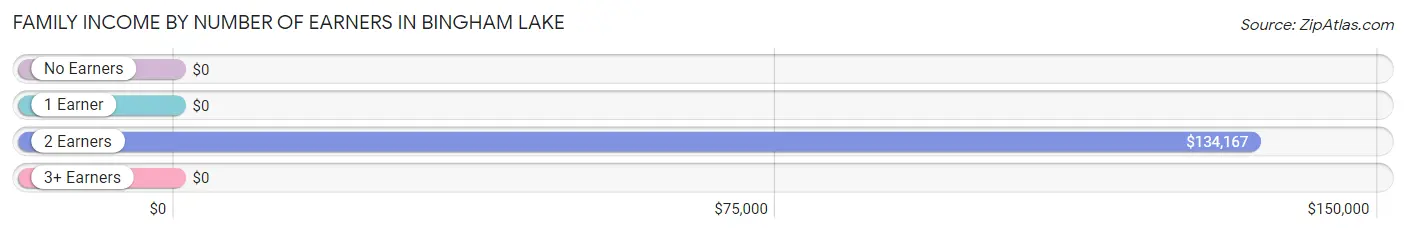
| Number of Earners | # Families | Median Income |
| No Earners | 2 (6.5%) | $0 |
| 1 Earner | 2 (6.5%) | $0 |
| 2 Earners | 22 (71.0%) | $134,167 |
| 3+ Earners | 5 (16.1%) | $0 |
| Total | 31 (100.0%) | $121,250 |
Household Income in Bingham Lake
Household Income Brackets in Bingham Lake
With 10 households falling in the category, the $75,000 to $99,999 income range is the most frequent in Bingham Lake, accounting for 22.2% of all households.
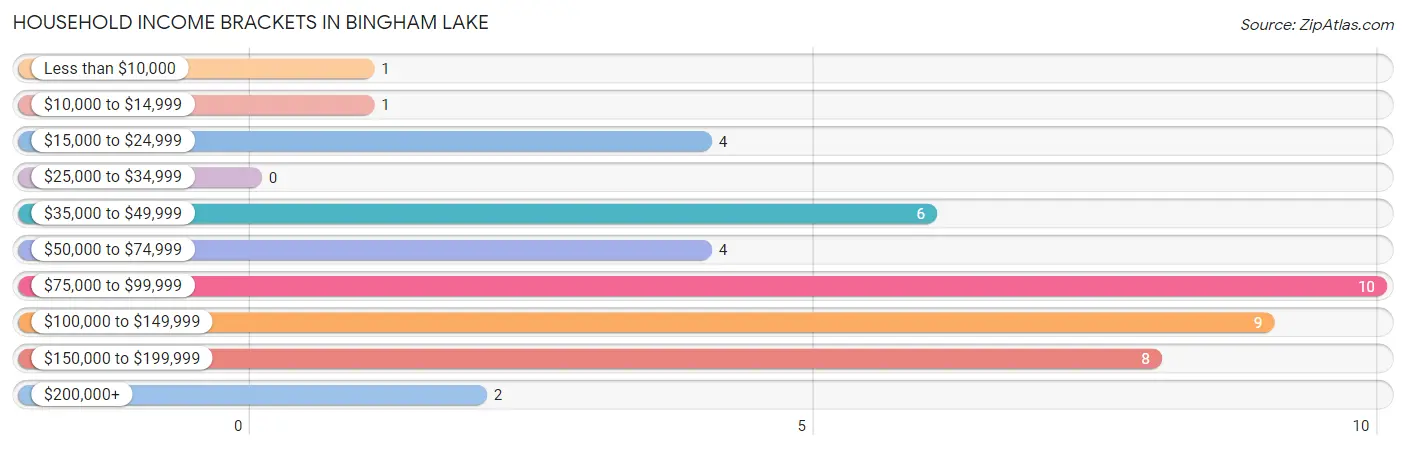
| Income Bracket | # Households | % Households |
| Less than $10,000 | 1 | 2.2% |
| $10,000 to $14,999 | 1 | 2.2% |
| $15,000 to $24,999 | 4 | 8.9% |
| $25,000 to $34,999 | 0 | 0.0% |
| $35,000 to $49,999 | 6 | 13.3% |
| $50,000 to $74,999 | 4 | 8.9% |
| $75,000 to $99,999 | 10 | 22.2% |
| $100,000 to $149,999 | 9 | 20.0% |
| $150,000 to $199,999 | 8 | 17.8% |
| $200,000+ | 2 | 4.4% |
Household Income by Householder Age in Bingham Lake
The median household income in Bingham Lake is $95,750, with the highest median household income of $96,250 found in the 45 to 64 years age bracket for the primary householder. A total of 23 households (51.1%) fall into this category.
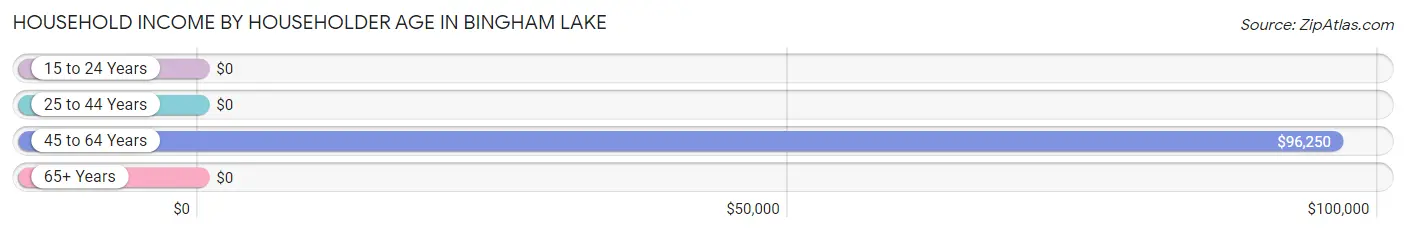
| Income Bracket | # Households | Median Income |
| 15 to 24 Years | 0 (0.0%) | $0 |
| 25 to 44 Years | 12 (26.7%) | $0 |
| 45 to 64 Years | 23 (51.1%) | $96,250 |
| 65+ Years | 10 (22.2%) | $0 |
| Total | 45 (100.0%) | $95,750 |
Poverty in Bingham Lake
Income Below Poverty by Sex and Age in Bingham Lake
With 1.3% poverty level for males and 6.5% for females among the residents of Bingham Lake, 55 to 64 year old males and 15 year old females are the most vulnerable to poverty, with 1 males (9.1%) and 2 females (100.0%) in their respective age groups living below the poverty level.
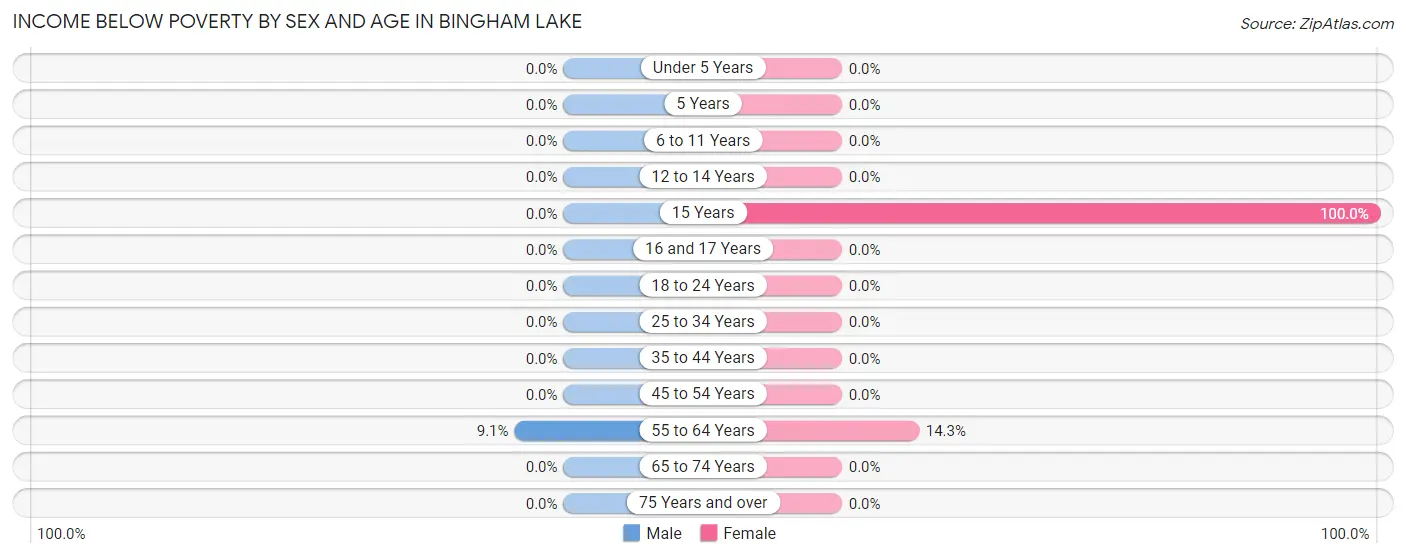
| Age Bracket | Male | Female |
| Under 5 Years | 0 (0.0%) | 0 (0.0%) |
| 5 Years | 0 (0.0%) | 0 (0.0%) |
| 6 to 11 Years | 0 (0.0%) | 0 (0.0%) |
| 12 to 14 Years | 0 (0.0%) | 0 (0.0%) |
| 15 Years | 0 (0.0%) | 2 (100.0%) |
| 16 and 17 Years | 0 (0.0%) | 0 (0.0%) |
| 18 to 24 Years | 0 (0.0%) | 0 (0.0%) |
| 25 to 34 Years | 0 (0.0%) | 0 (0.0%) |
| 35 to 44 Years | 0 (0.0%) | 0 (0.0%) |
| 45 to 54 Years | 0 (0.0%) | 0 (0.0%) |
| 55 to 64 Years | 1 (9.1%) | 1 (14.3%) |
| 65 to 74 Years | 0 (0.0%) | 0 (0.0%) |
| 75 Years and over | 0 (0.0%) | 0 (0.0%) |
| Total | 1 (1.3%) | 3 (6.5%) |
Income Above Poverty by Sex and Age in Bingham Lake
According to the poverty statistics in Bingham Lake, males aged under 5 years and females aged under 5 years are the age groups that are most secure financially, with 100.0% of males and 100.0% of females in these age groups living above the poverty line.
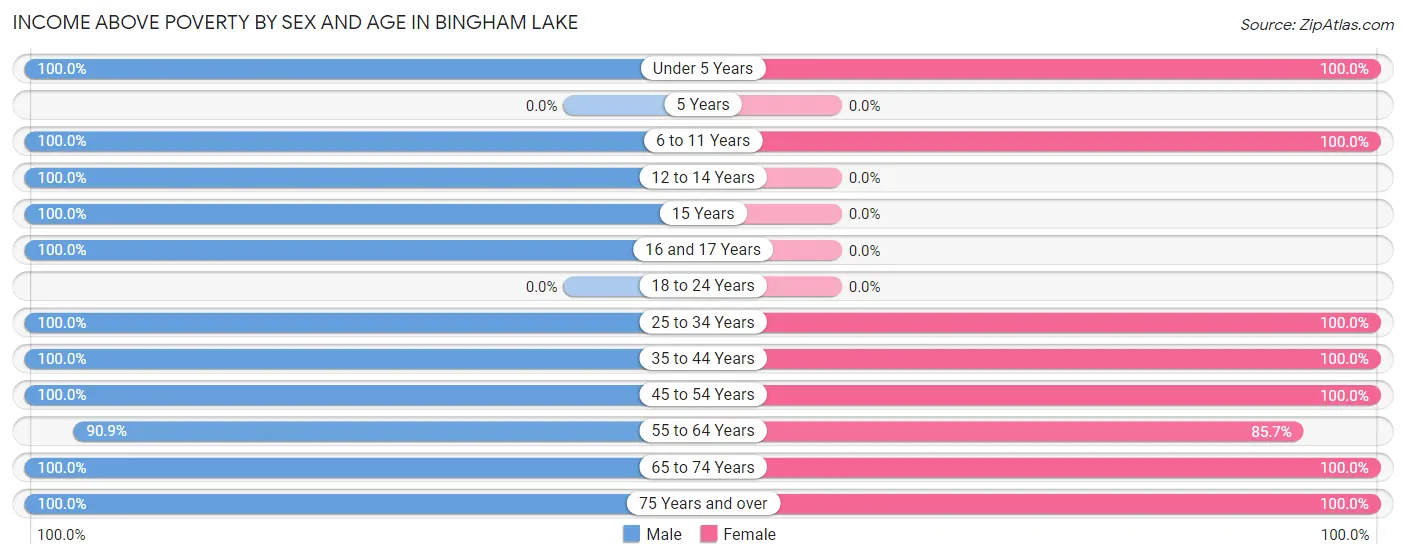
| Age Bracket | Male | Female |
| Under 5 Years | 9 (100.0%) | 2 (100.0%) |
| 5 Years | 0 (0.0%) | 0 (0.0%) |
| 6 to 11 Years | 13 (100.0%) | 7 (100.0%) |
| 12 to 14 Years | 1 (100.0%) | 0 (0.0%) |
| 15 Years | 6 (100.0%) | 0 (0.0%) |
| 16 and 17 Years | 10 (100.0%) | 0 (0.0%) |
| 18 to 24 Years | 0 (0.0%) | 0 (0.0%) |
| 25 to 34 Years | 6 (100.0%) | 6 (100.0%) |
| 35 to 44 Years | 5 (100.0%) | 4 (100.0%) |
| 45 to 54 Years | 11 (100.0%) | 9 (100.0%) |
| 55 to 64 Years | 10 (90.9%) | 6 (85.7%) |
| 65 to 74 Years | 5 (100.0%) | 7 (100.0%) |
| 75 Years and over | 2 (100.0%) | 2 (100.0%) |
| Total | 78 (98.7%) | 43 (93.5%) |
Income Below Poverty Among Married-Couple Families in Bingham Lake
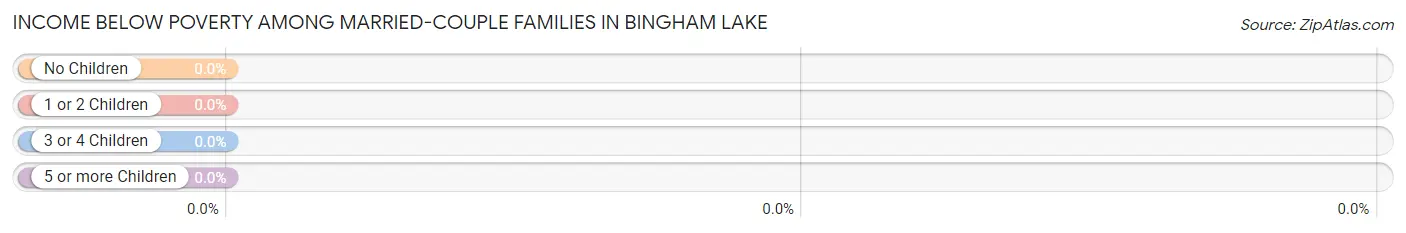
| Children | Above Poverty | Below Poverty |
| No Children | 16 (100.0%) | 0 (0.0%) |
| 1 or 2 Children | 9 (100.0%) | 0 (0.0%) |
| 3 or 4 Children | 0 (0.0%) | 0 (0.0%) |
| 5 or more Children | 5 (100.0%) | 0 (0.0%) |
| Total | 30 (100.0%) | 0 (0.0%) |
Income Below Poverty Among Single-Parent Households in Bingham Lake
| Children | Single Father | Single Mother |
| No Children | 0 (0.0%) | 0 (0.0%) |
| 1 or 2 Children | 0 (0.0%) | 0 (0.0%) |
| 3 or 4 Children | 0 (0.0%) | 0 (0.0%) |
| 5 or more Children | 0 (0.0%) | 0 (0.0%) |
| Total | 0 (0.0%) | 0 (0.0%) |
Income Below Poverty Among Married-Couple vs Single-Parent Households in Bingham Lake
| Children | Married-Couple Families | Single-Parent Households |
| No Children | 0 (0.0%) | 0 (0.0%) |
| 1 or 2 Children | 0 (0.0%) | 0 (0.0%) |
| 3 or 4 Children | 0 (0.0%) | 0 (0.0%) |
| 5 or more Children | 0 (0.0%) | 0 (0.0%) |
| Total | 0 (0.0%) | 0 (0.0%) |
Race in Bingham Lake
The most populous races in Bingham Lake are White / Caucasian (124 | 99.2%), and Asian (1 | 0.8%).
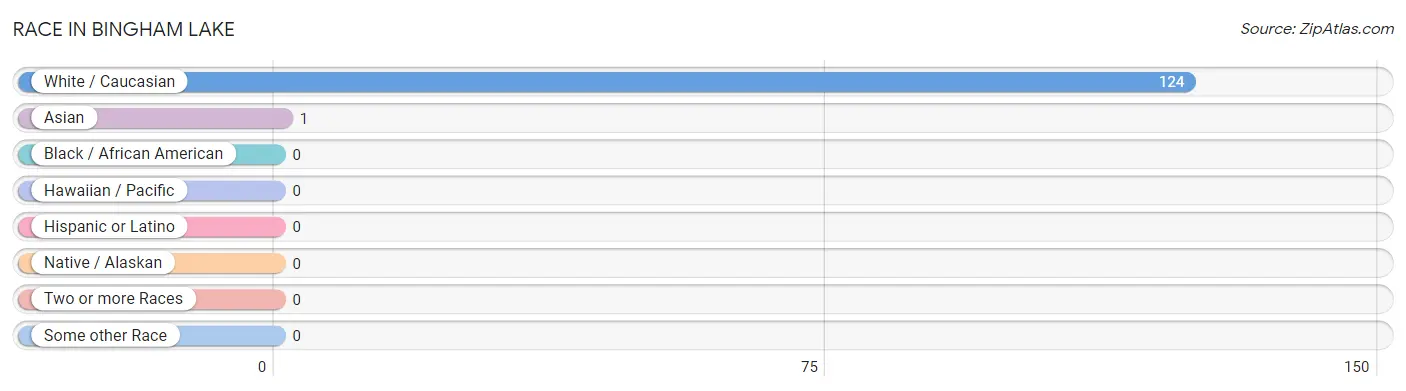
| Race | # Population | % Population |
| Asian | 1 | 0.8% |
| Black / African American | 0 | 0.0% |
| Hawaiian / Pacific | 0 | 0.0% |
| Hispanic or Latino | 0 | 0.0% |
| Native / Alaskan | 0 | 0.0% |
| White / Caucasian | 124 | 99.2% |
| Two or more Races | 0 | 0.0% |
| Some other Race | 0 | 0.0% |
| Total | 125 | 100.0% |
Ancestry in Bingham Lake
The most populous ancestries reported in Bingham Lake are German (95 | 76.0%), Irish (58 | 46.4%), Norwegian (27 | 21.6%), English (7 | 5.6%), and Dutch (3 | 2.4%), together accounting for 152.0% of all Bingham Lake residents.
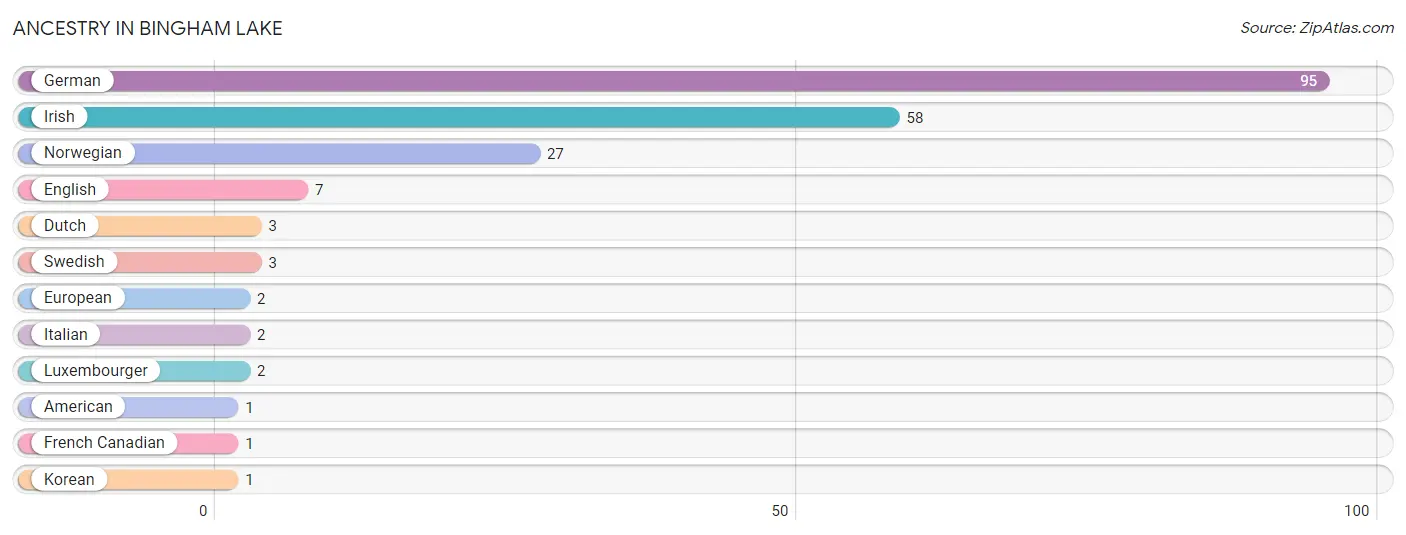
| Ancestry | # Population | % Population |
| American | 1 | 0.8% |
| Dutch | 3 | 2.4% |
| English | 7 | 5.6% |
| European | 2 | 1.6% |
| French Canadian | 1 | 0.8% |
| German | 95 | 76.0% |
| Irish | 58 | 46.4% |
| Italian | 2 | 1.6% |
| Korean | 1 | 0.8% |
| Luxembourger | 2 | 1.6% |
| Norwegian | 27 | 21.6% |
| Swedish | 3 | 2.4% | View All 12 Rows |
Immigrants in Bingham Lake
The most numerous immigrant groups reported in Bingham Lake came from Asia (1 | 0.8%), Philippines (1 | 0.8%), and South Eastern Asia (1 | 0.8%), together accounting for 2.4% of all Bingham Lake residents.
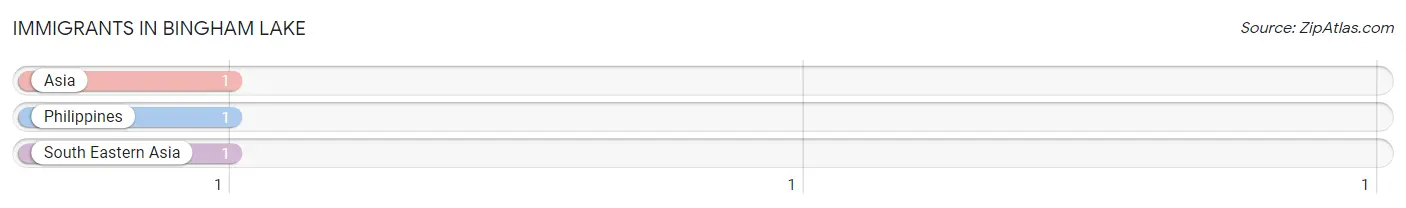
| Immigration Origin | # Population | % Population |
| Asia | 1 | 0.8% |
| Philippines | 1 | 0.8% |
| South Eastern Asia | 1 | 0.8% | View All 3 Rows |
Sex and Age in Bingham Lake
Sex and Age in Bingham Lake
The most populous age groups in Bingham Lake are 15 to 19 Years (16 | 20.3%) for men and 50 to 54 Years (9 | 19.6%) for women.
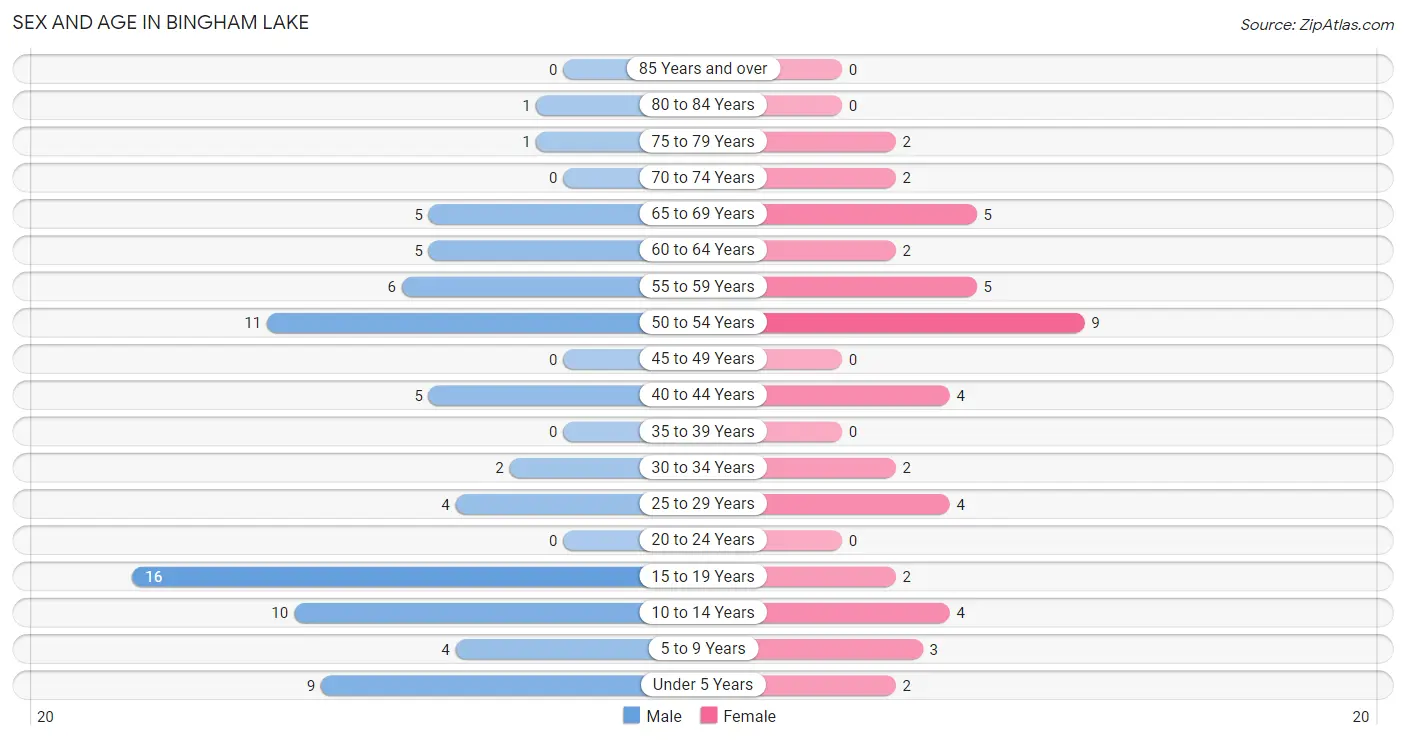
| Age Bracket | Male | Female |
| Under 5 Years | 9 (11.4%) | 2 (4.3%) |
| 5 to 9 Years | 4 (5.1%) | 3 (6.5%) |
| 10 to 14 Years | 10 (12.7%) | 4 (8.7%) |
| 15 to 19 Years | 16 (20.3%) | 2 (4.3%) |
| 20 to 24 Years | 0 (0.0%) | 0 (0.0%) |
| 25 to 29 Years | 4 (5.1%) | 4 (8.7%) |
| 30 to 34 Years | 2 (2.5%) | 2 (4.3%) |
| 35 to 39 Years | 0 (0.0%) | 0 (0.0%) |
| 40 to 44 Years | 5 (6.3%) | 4 (8.7%) |
| 45 to 49 Years | 0 (0.0%) | 0 (0.0%) |
| 50 to 54 Years | 11 (13.9%) | 9 (19.6%) |
| 55 to 59 Years | 6 (7.6%) | 5 (10.9%) |
| 60 to 64 Years | 5 (6.3%) | 2 (4.3%) |
| 65 to 69 Years | 5 (6.3%) | 5 (10.9%) |
| 70 to 74 Years | 0 (0.0%) | 2 (4.3%) |
| 75 to 79 Years | 1 (1.3%) | 2 (4.3%) |
| 80 to 84 Years | 1 (1.3%) | 0 (0.0%) |
| 85 Years and over | 0 (0.0%) | 0 (0.0%) |
| Total | 79 (100.0%) | 46 (100.0%) |
Families and Households in Bingham Lake
Median Family Size in Bingham Lake
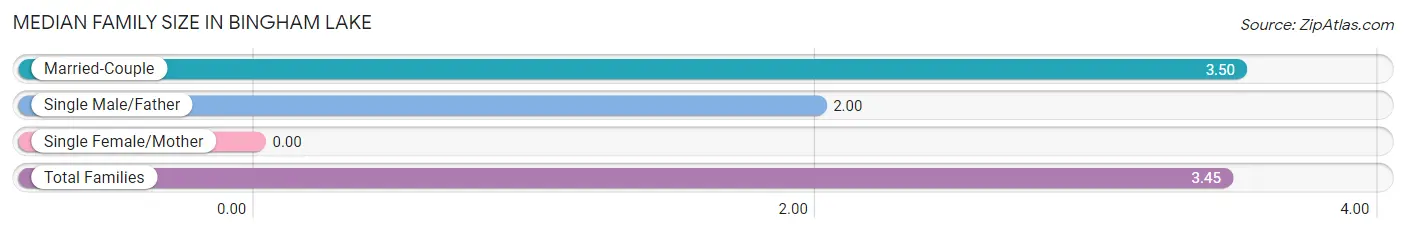
| Family Type | # Families | Family Size |
| Married-Couple | 30 (96.8%) | 3.50 |
| Single Male/Father | 1 (3.2%) | 2.00 |
| Single Female/Mother | 0 (0.0%) | - |
| Total Families | 31 (100.0%) | 3.45 |
Median Household Size in Bingham Lake
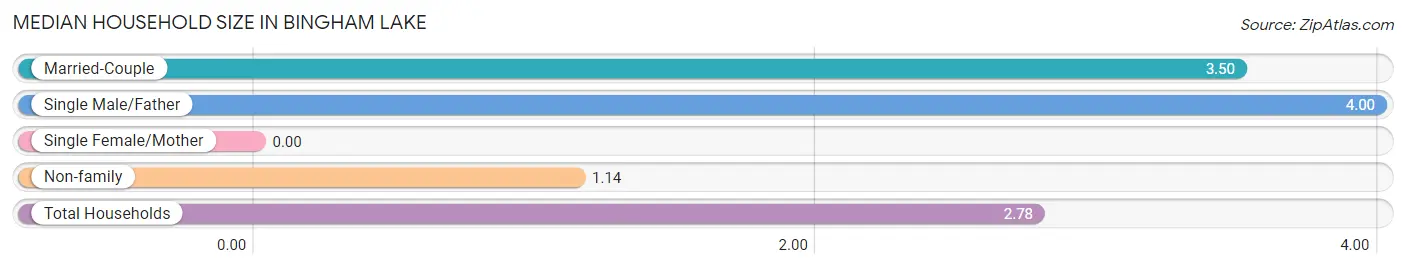
| Household Type | # Households | Household Size |
| Married-Couple | 30 (66.7%) | 3.50 |
| Single Male/Father | 1 (2.2%) | 4.00 |
| Single Female/Mother | 0 (0.0%) | - |
| Non-family | 14 (31.1%) | 1.14 |
| Total Households | 45 (100.0%) | 2.78 |
Household Size by Marriage Status in Bingham Lake
Out of a total of 45 households in Bingham Lake, 31 (68.9%) are family households, while 14 (31.1%) are nonfamily households. The most numerous type of family households are 2-person households, comprising 16, and the most common type of nonfamily households are 1-person households, comprising 12.
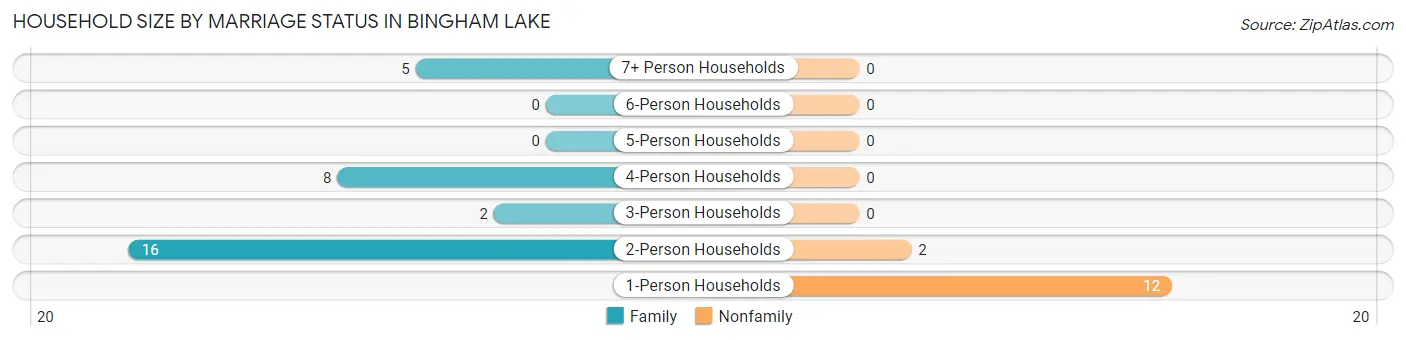
| Household Size | Family Households | Nonfamily Households |
| 1-Person Households | - | 12 (26.7%) |
| 2-Person Households | 16 (35.6%) | 2 (4.4%) |
| 3-Person Households | 2 (4.4%) | 0 (0.0%) |
| 4-Person Households | 8 (17.8%) | 0 (0.0%) |
| 5-Person Households | 0 (0.0%) | 0 (0.0%) |
| 6-Person Households | 0 (0.0%) | 0 (0.0%) |
| 7+ Person Households | 5 (11.1%) | 0 (0.0%) |
| Total | 31 (68.9%) | 14 (31.1%) |
Female Fertility in Bingham Lake
Fertility by Age in Bingham Lake
| Age Bracket | Women with Births | Births / 1,000 Women |
| 15 to 19 years | 0 (0.0%) | 0.0 |
| 20 to 34 years | 0 (0.0%) | 0.0 |
| 35 to 50 years | 0 (0.0%) | 0.0 |
| Total | 0 (0.0%) | 0.0 |
Fertility by Age by Marriage Status in Bingham Lake
| Age Bracket | Married | Unmarried |
| 15 to 19 years | 0 (0.0%) | 0 (0.0%) |
| 20 to 34 years | 0 (0.0%) | 0 (0.0%) |
| 35 to 50 years | 0 (0.0%) | 0 (0.0%) |
| Total | 0 (0.0%) | 0 (0.0%) |
Fertility by Education in Bingham Lake
| Educational Attainment | Women with Births | Births / 1,000 Women |
| Less than High School | 0 (0.0%) | 0.0 |
| High School Diploma | 0 (0.0%) | 0.0 |
| College or Associate's Degree | 0 (0.0%) | 0.0 |
| Bachelor's Degree | 0 (0.0%) | 0.0 |
| Graduate Degree | 0 (0.0%) | 0.0 |
| Total | 0 (0.0%) | 0.0 |
Fertility by Education by Marriage Status in Bingham Lake
| Educational Attainment | Married | Unmarried |
| Less than High School | 0 (0.0%) | 0 (0.0%) |
| High School Diploma | 0 (0.0%) | 0 (0.0%) |
| College or Associate's Degree | 0 (0.0%) | 0 (0.0%) |
| Bachelor's Degree | 0 (0.0%) | 0 (0.0%) |
| Graduate Degree | 0 (0.0%) | 0 (0.0%) |
| Total | 0 (0.0%) | 0 (0.0%) |
Employment Characteristics in Bingham Lake
Employment by Class of Employer in Bingham Lake
Among the 60 employed individuals in Bingham Lake, private company employees (41 | 68.3%), self-employed (not incorporated) (5 | 8.3%), and not-for-profit organizations (5 | 8.3%) make up the most common classes of employment.
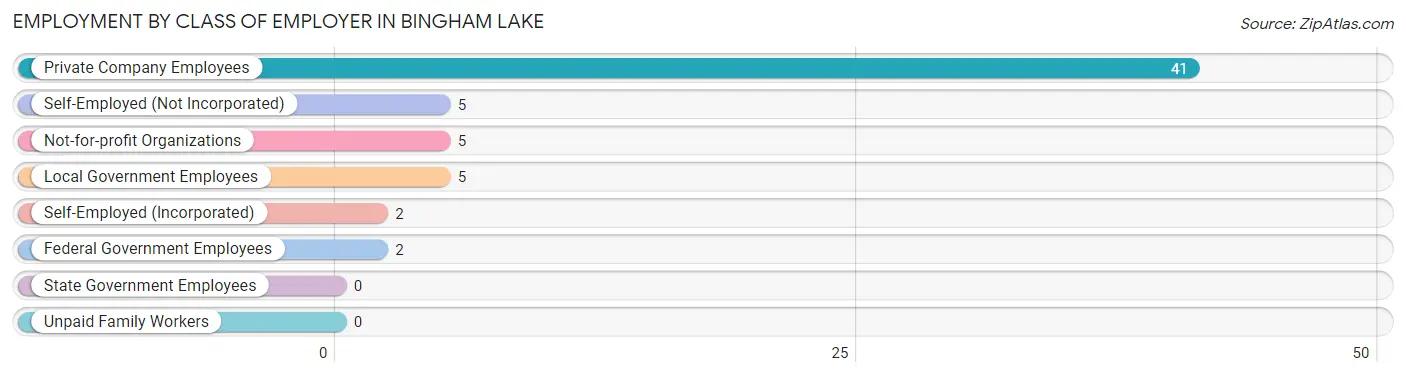
| Employer Class | # Employees | % Employees |
| Private Company Employees | 41 | 68.3% |
| Self-Employed (Incorporated) | 2 | 3.3% |
| Self-Employed (Not Incorporated) | 5 | 8.3% |
| Not-for-profit Organizations | 5 | 8.3% |
| Local Government Employees | 5 | 8.3% |
| State Government Employees | 0 | 0.0% |
| Federal Government Employees | 2 | 3.3% |
| Unpaid Family Workers | 0 | 0.0% |
| Total | 60 | 100.0% |
Employment Status by Age in Bingham Lake
According to the labor force statistics for Bingham Lake, out of the total population over 16 years of age (85), 75.3% or 64 individuals are in the labor force, with 6.3% or 4 of them unemployed. The age group with the highest labor force participation rate is 25 to 29 years, with 100.0% or 8 individuals in the labor force. Within the labor force, the 45 to 54 years age range has the highest percentage of unemployed individuals, with 15.8% or 3 of them being unemployed.
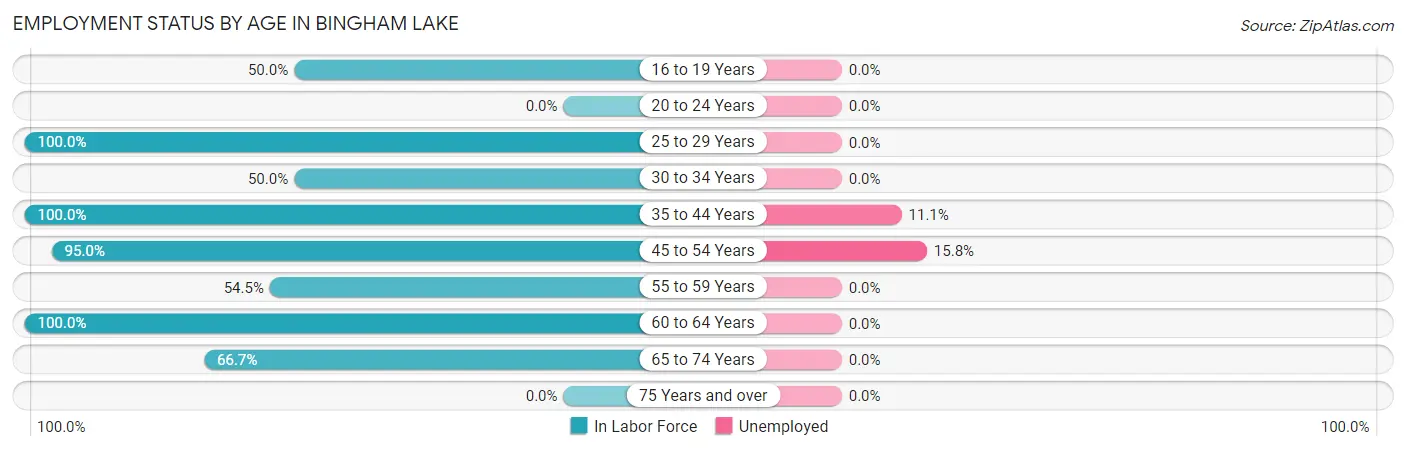
| Age Bracket | In Labor Force | Unemployed |
| 16 to 19 Years | 5 (50.0%) | 0 (0.0%) |
| 20 to 24 Years | 0 (0.0%) | 0 (0.0%) |
| 25 to 29 Years | 8 (100.0%) | 0 (0.0%) |
| 30 to 34 Years | 2 (50.0%) | 0 (0.0%) |
| 35 to 44 Years | 9 (100.0%) | 1 (11.1%) |
| 45 to 54 Years | 19 (95.0%) | 3 (15.8%) |
| 55 to 59 Years | 6 (54.5%) | 0 (0.0%) |
| 60 to 64 Years | 7 (100.0%) | 0 (0.0%) |
| 65 to 74 Years | 8 (66.7%) | 0 (0.0%) |
| 75 Years and over | 0 (0.0%) | 0 (0.0%) |
| Total | 64 (75.3%) | 4 (6.3%) |
Employment Status by Educational Attainment in Bingham Lake
According to labor force statistics for Bingham Lake, 86.4% of individuals (51) out of the total population between 25 and 64 years of age (59) are in the labor force, with 7.8% or 4 of them being unemployed. The group with the highest labor force participation rate are those with the educational attainment of less than high school, with 100.0% or 6 individuals in the labor force. Within the labor force, individuals with bachelor's degree or higher education have the highest percentage of unemployment, with 21.1% or 4 of them being unemployed.
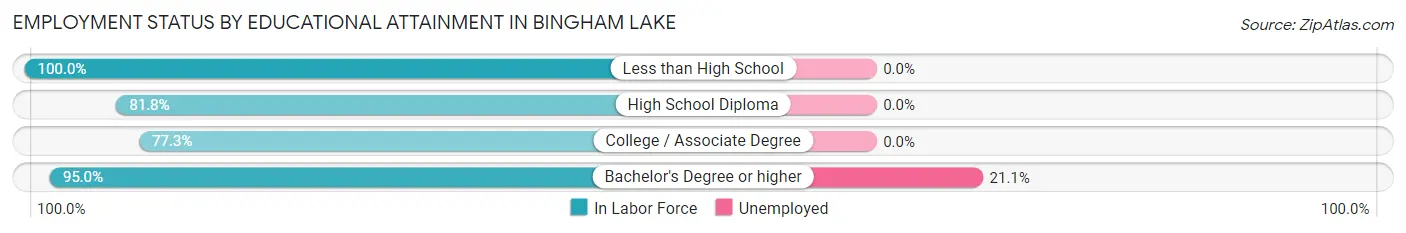
| Educational Attainment | In Labor Force | Unemployed |
| Less than High School | 6 (100.0%) | 0 (0.0%) |
| High School Diploma | 9 (81.8%) | 0 (0.0%) |
| College / Associate Degree | 17 (77.3%) | 0 (0.0%) |
| Bachelor's Degree or higher | 19 (95.0%) | 4 (21.1%) |
| Total | 51 (86.4%) | 5 (7.8%) |
Employment Occupations by Sex in Bingham Lake
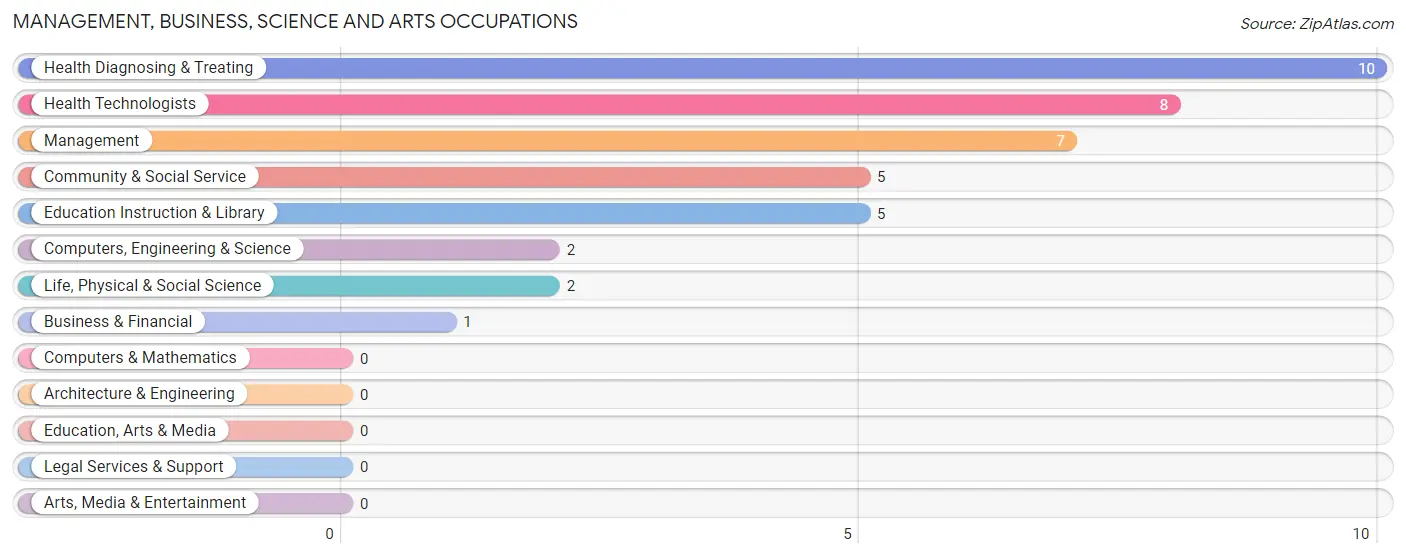
Management, Business, Science and Arts Occupations
The most common Management, Business, Science and Arts occupations in Bingham Lake are Health Diagnosing & Treating (10 | 16.7%), Health Technologists (8 | 13.3%), Management (7 | 11.7%), Community & Social Service (5 | 8.3%), and Education Instruction & Library (5 | 8.3%).
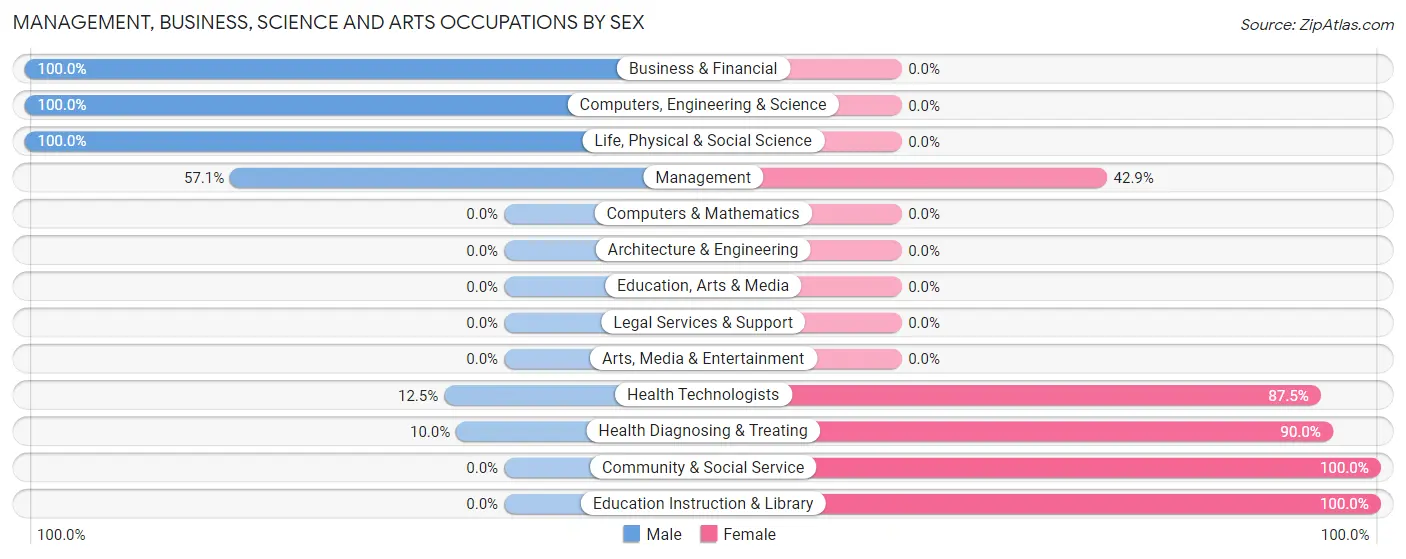
Management, Business, Science and Arts Occupations by Sex
Within the Management, Business, Science and Arts occupations in Bingham Lake, the most male-oriented occupations are Business & Financial (100.0%), Computers, Engineering & Science (100.0%), and Life, Physical & Social Science (100.0%), while the most female-oriented occupations are Community & Social Service (100.0%), Education Instruction & Library (100.0%), and Health Diagnosing & Treating (90.0%).
| Occupation | Male | Female |
| Management | 4 (57.1%) | 3 (42.9%) |
| Business & Financial | 1 (100.0%) | 0 (0.0%) |
| Computers, Engineering & Science | 2 (100.0%) | 0 (0.0%) |
| Computers & Mathematics | 0 (0.0%) | 0 (0.0%) |
| Architecture & Engineering | 0 (0.0%) | 0 (0.0%) |
| Life, Physical & Social Science | 2 (100.0%) | 0 (0.0%) |
| Community & Social Service | 0 (0.0%) | 5 (100.0%) |
| Education, Arts & Media | 0 (0.0%) | 0 (0.0%) |
| Legal Services & Support | 0 (0.0%) | 0 (0.0%) |
| Education Instruction & Library | 0 (0.0%) | 5 (100.0%) |
| Arts, Media & Entertainment | 0 (0.0%) | 0 (0.0%) |
| Health Diagnosing & Treating | 1 (10.0%) | 9 (90.0%) |
| Health Technologists | 1 (12.5%) | 7 (87.5%) |
| Total (Category) | 8 (32.0%) | 17 (68.0%) |
| Total (Overall) | 37 (61.7%) | 23 (38.3%) |
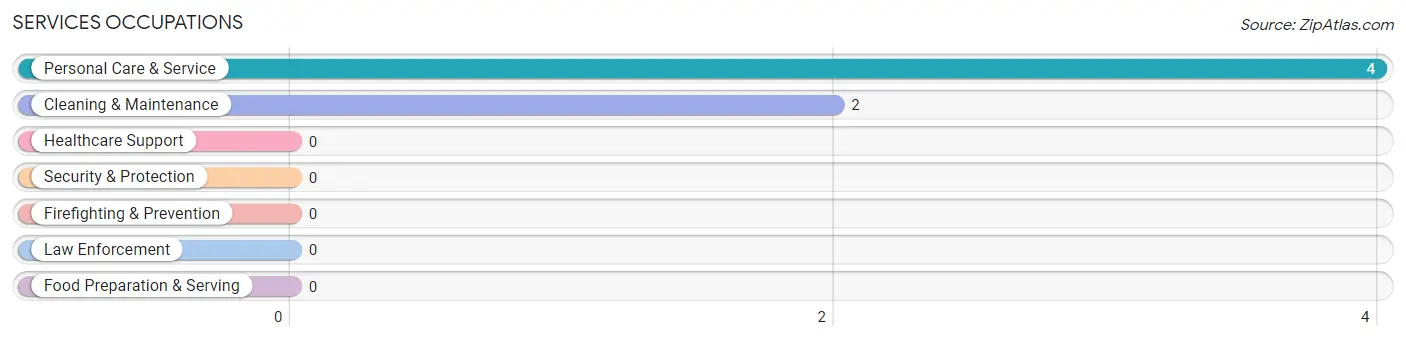
Services Occupations
The most common Services occupations in Bingham Lake are Personal Care & Service (4 | 6.7%), and Cleaning & Maintenance (2 | 3.3%).
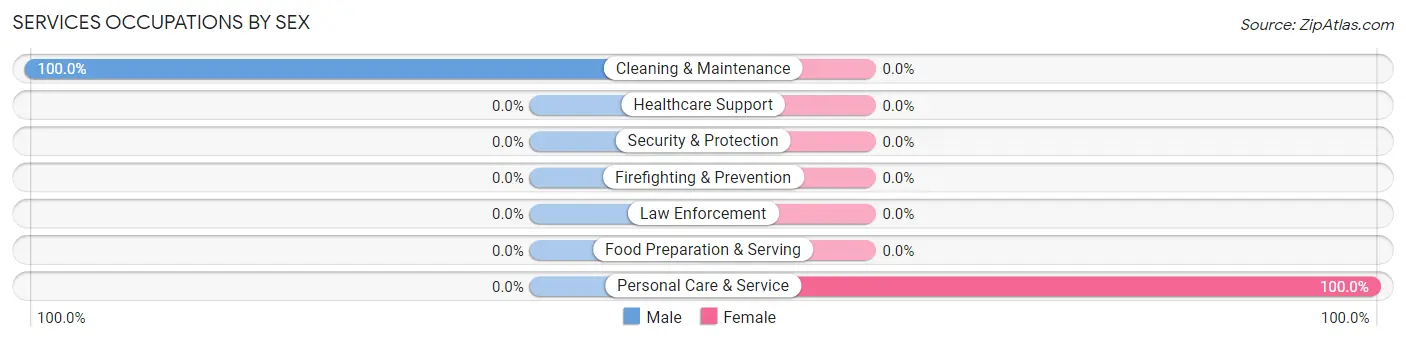
Services Occupations by Sex
| Occupation | Male | Female |
| Healthcare Support | 0 (0.0%) | 0 (0.0%) |
| Security & Protection | 0 (0.0%) | 0 (0.0%) |
| Firefighting & Prevention | 0 (0.0%) | 0 (0.0%) |
| Law Enforcement | 0 (0.0%) | 0 (0.0%) |
| Food Preparation & Serving | 0 (0.0%) | 0 (0.0%) |
| Cleaning & Maintenance | 2 (100.0%) | 0 (0.0%) |
| Personal Care & Service | 0 (0.0%) | 4 (100.0%) |
| Total (Category) | 2 (33.3%) | 4 (66.7%) |
| Total (Overall) | 37 (61.7%) | 23 (38.3%) |
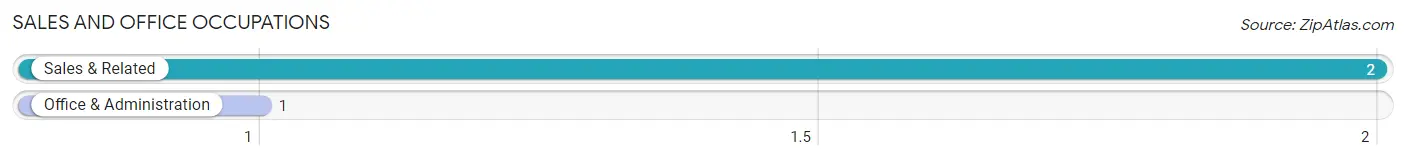
Sales and Office Occupations
The most common Sales and Office occupations in Bingham Lake are Sales & Related (2 | 3.3%), and Office & Administration (1 | 1.7%).
Sales and Office Occupations by Sex
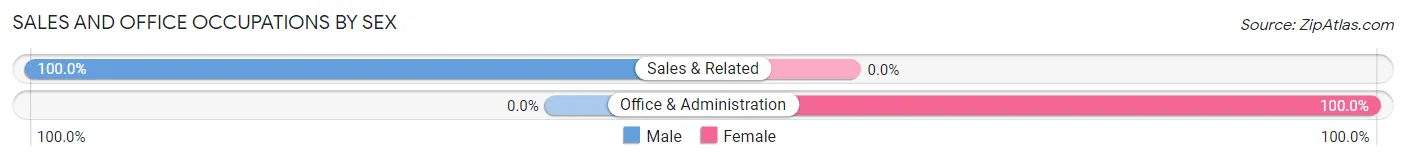
| Occupation | Male | Female |
| Sales & Related | 2 (100.0%) | 0 (0.0%) |
| Office & Administration | 0 (0.0%) | 1 (100.0%) |
| Total (Category) | 2 (66.7%) | 1 (33.3%) |
| Total (Overall) | 37 (61.7%) | 23 (38.3%) |
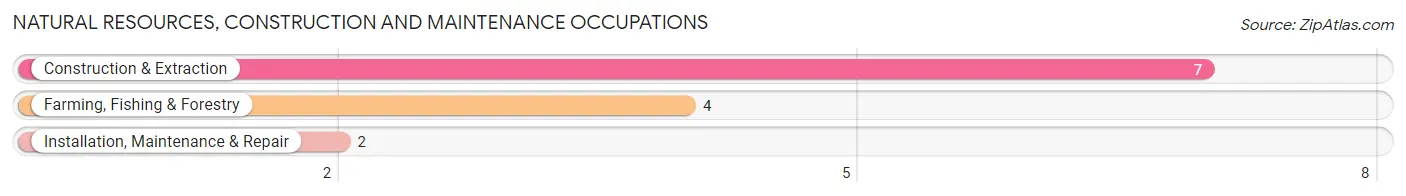
Natural Resources, Construction and Maintenance Occupations
The most common Natural Resources, Construction and Maintenance occupations in Bingham Lake are Construction & Extraction (7 | 11.7%), Farming, Fishing & Forestry (4 | 6.7%), and Installation, Maintenance & Repair (2 | 3.3%).
Natural Resources, Construction and Maintenance Occupations by Sex
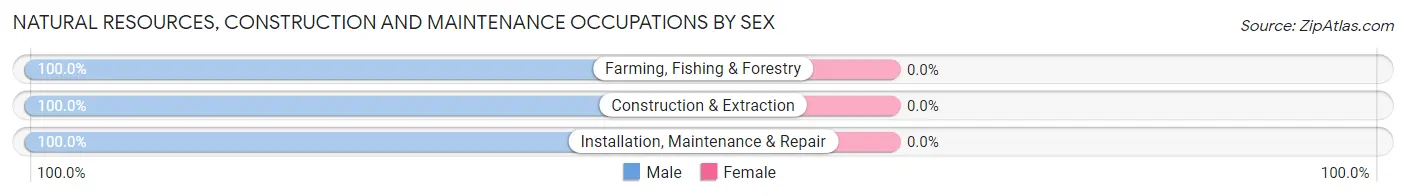
| Occupation | Male | Female |
| Farming, Fishing & Forestry | 4 (100.0%) | 0 (0.0%) |
| Construction & Extraction | 7 (100.0%) | 0 (0.0%) |
| Installation, Maintenance & Repair | 2 (100.0%) | 0 (0.0%) |
| Total (Category) | 13 (100.0%) | 0 (0.0%) |
| Total (Overall) | 37 (61.7%) | 23 (38.3%) |
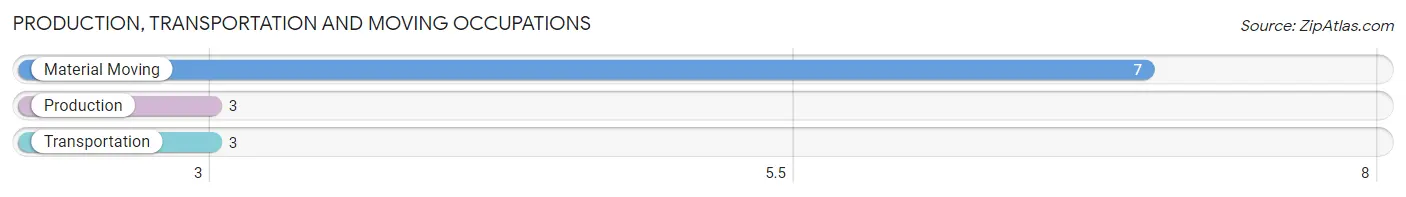
Production, Transportation and Moving Occupations
The most common Production, Transportation and Moving occupations in Bingham Lake are Material Moving (7 | 11.7%), Production (3 | 5.0%), and Transportation (3 | 5.0%).
Production, Transportation and Moving Occupations by Sex
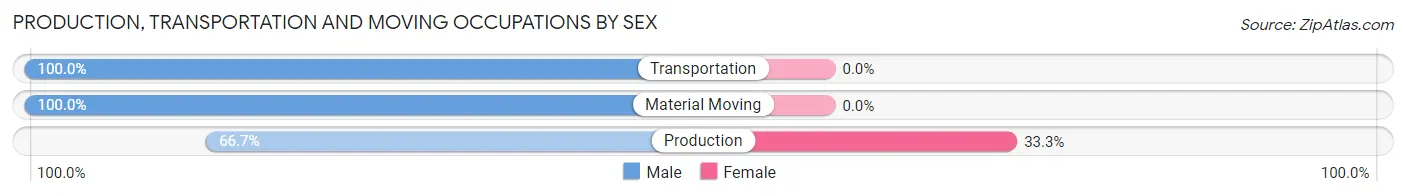
| Occupation | Male | Female |
| Production | 2 (66.7%) | 1 (33.3%) |
| Transportation | 3 (100.0%) | 0 (0.0%) |
| Material Moving | 7 (100.0%) | 0 (0.0%) |
| Total (Category) | 12 (92.3%) | 1 (7.7%) |
| Total (Overall) | 37 (61.7%) | 23 (38.3%) |
Employment Industries by Sex in Bingham Lake
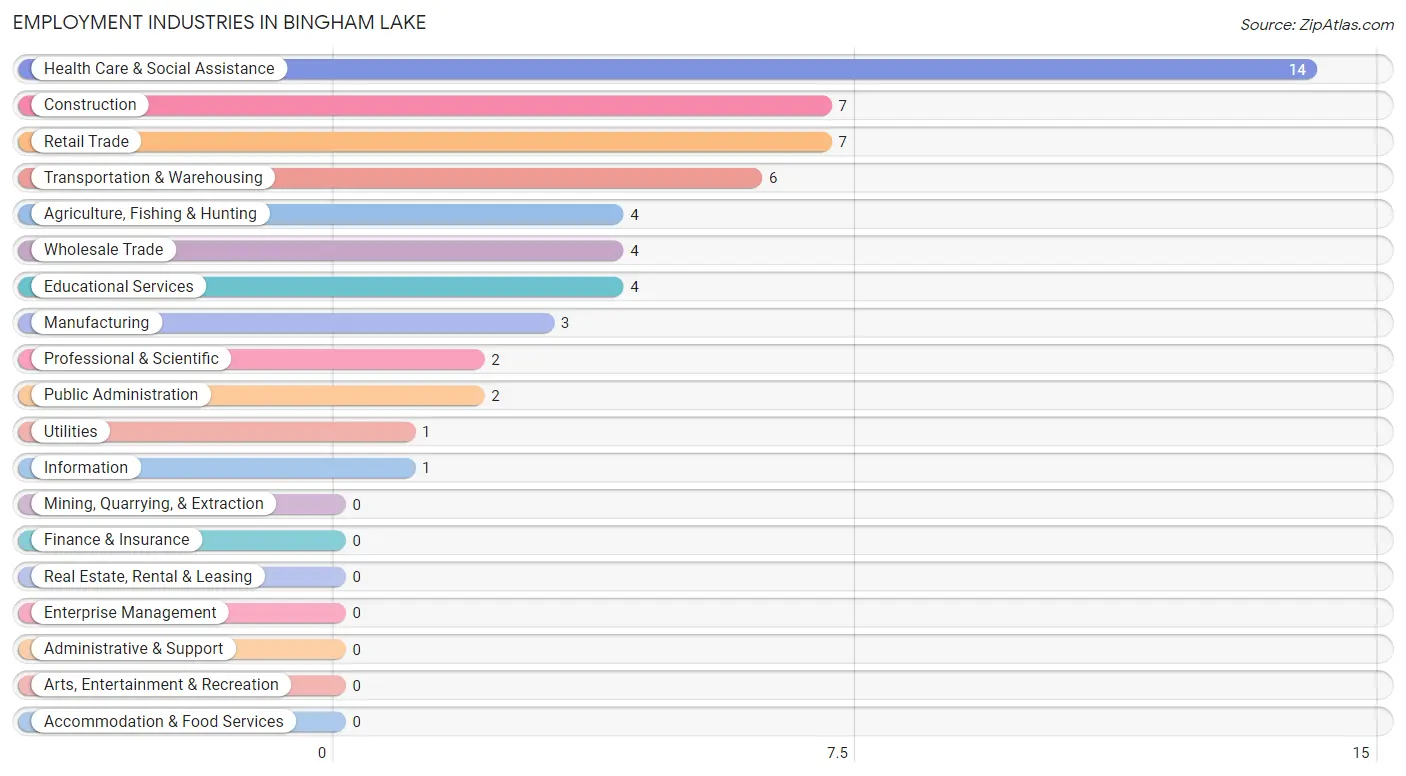
Employment Industries in Bingham Lake
The major employment industries in Bingham Lake include Health Care & Social Assistance (14 | 23.3%), Construction (7 | 11.7%), Retail Trade (7 | 11.7%), Transportation & Warehousing (6 | 10.0%), and Agriculture, Fishing & Hunting (4 | 6.7%).
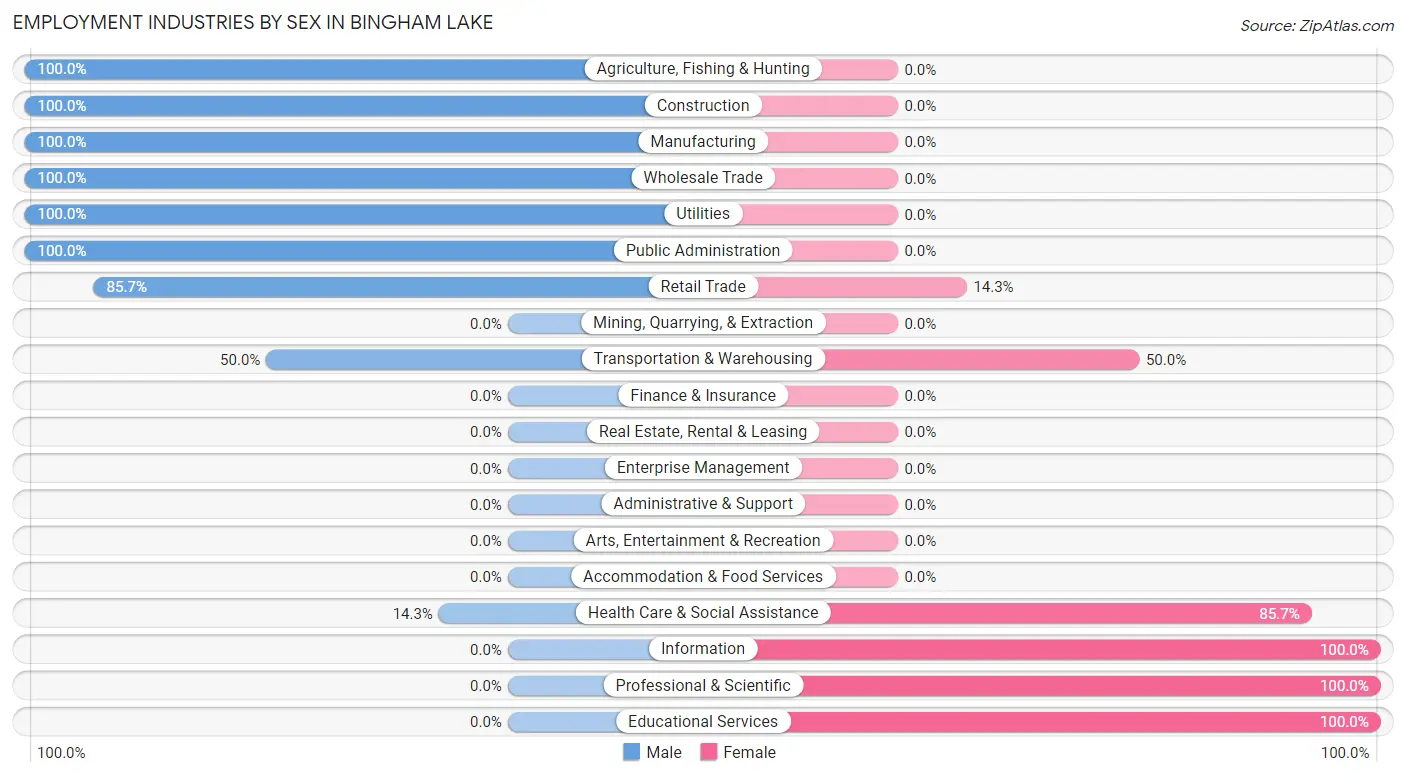
Employment Industries by Sex in Bingham Lake
The Bingham Lake industries that see more men than women are Agriculture, Fishing & Hunting (100.0%), Construction (100.0%), and Manufacturing (100.0%), whereas the industries that tend to have a higher number of women are Information (100.0%), Professional & Scientific (100.0%), and Educational Services (100.0%).
| Industry | Male | Female |
| Agriculture, Fishing & Hunting | 4 (100.0%) | 0 (0.0%) |
| Mining, Quarrying, & Extraction | 0 (0.0%) | 0 (0.0%) |
| Construction | 7 (100.0%) | 0 (0.0%) |
| Manufacturing | 3 (100.0%) | 0 (0.0%) |
| Wholesale Trade | 4 (100.0%) | 0 (0.0%) |
| Retail Trade | 6 (85.7%) | 1 (14.3%) |
| Transportation & Warehousing | 3 (50.0%) | 3 (50.0%) |
| Utilities | 1 (100.0%) | 0 (0.0%) |
| Information | 0 (0.0%) | 1 (100.0%) |
| Finance & Insurance | 0 (0.0%) | 0 (0.0%) |
| Real Estate, Rental & Leasing | 0 (0.0%) | 0 (0.0%) |
| Professional & Scientific | 0 (0.0%) | 2 (100.0%) |
| Enterprise Management | 0 (0.0%) | 0 (0.0%) |
| Administrative & Support | 0 (0.0%) | 0 (0.0%) |
| Educational Services | 0 (0.0%) | 4 (100.0%) |
| Health Care & Social Assistance | 2 (14.3%) | 12 (85.7%) |
| Arts, Entertainment & Recreation | 0 (0.0%) | 0 (0.0%) |
| Accommodation & Food Services | 0 (0.0%) | 0 (0.0%) |
| Public Administration | 2 (100.0%) | 0 (0.0%) |
| Total | 37 (61.7%) | 23 (38.3%) |
Education in Bingham Lake
School Enrollment in Bingham Lake
The most common levels of schooling among the 45 students in Bingham Lake are high school (19 | 42.2%), middle school (13 | 28.9%), and elementary school (4 | 8.9%).
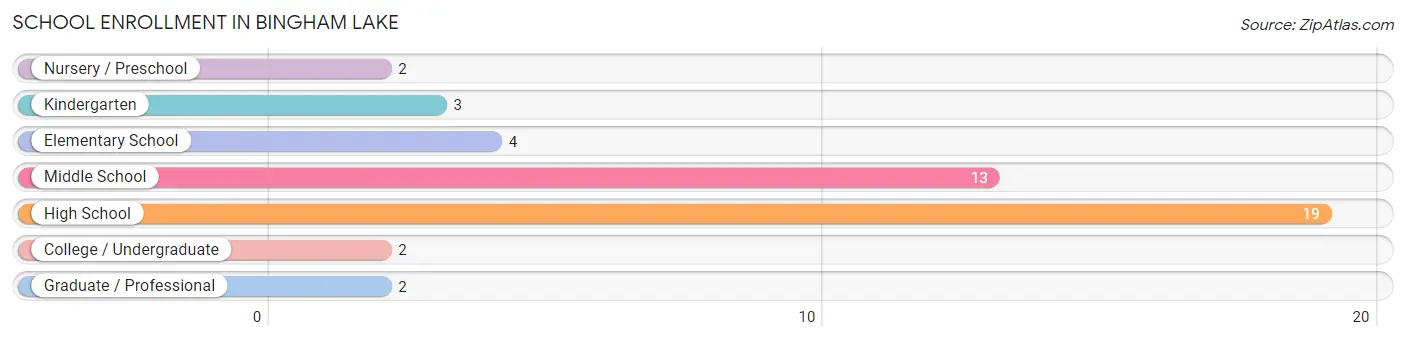
| School Level | # Students | % Students |
| Nursery / Preschool | 2 | 4.4% |
| Kindergarten | 3 | 6.7% |
| Elementary School | 4 | 8.9% |
| Middle School | 13 | 28.9% |
| High School | 19 | 42.2% |
| College / Undergraduate | 2 | 4.4% |
| Graduate / Professional | 2 | 4.4% |
| Total | 45 | 100.0% |
School Enrollment by Age by Funding Source in Bingham Lake
Out of a total of 45 students who are enrolled in schools in Bingham Lake, 11 (24.4%) attend a private institution, while the remaining 34 (75.6%) are enrolled in public schools. The age group of 10 to 14 year olds has the highest likelihood of being enrolled in private schools, with 5 (35.7% in the age bracket) enrolled. Conversely, the age group of 3 to 4 year olds has the lowest likelihood of being enrolled in a private school, with 2 (100.0% in the age bracket) attending a public institution.
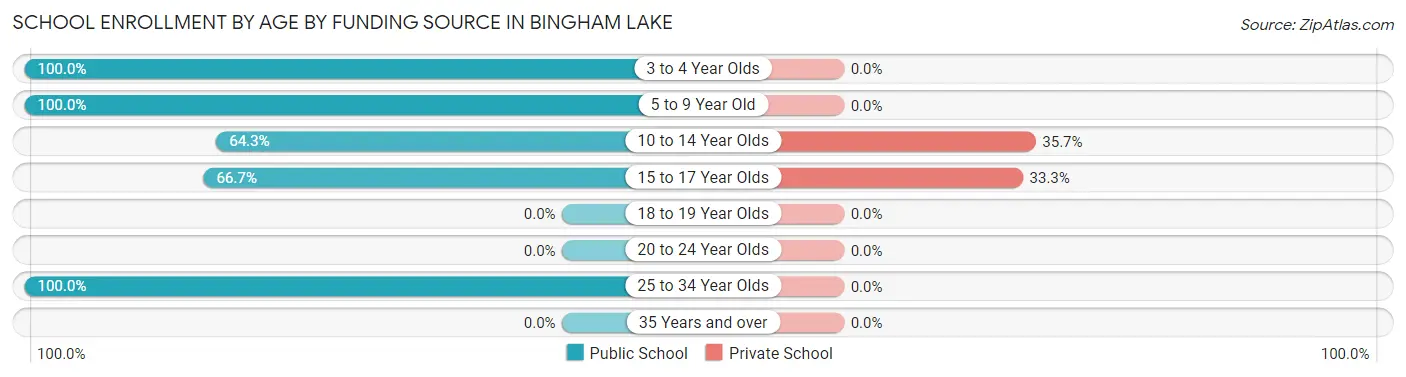
| Age Bracket | Public School | Private School |
| 3 to 4 Year Olds | 2 (100.0%) | 0 (0.0%) |
| 5 to 9 Year Old | 7 (100.0%) | 0 (0.0%) |
| 10 to 14 Year Olds | 9 (64.3%) | 5 (35.7%) |
| 15 to 17 Year Olds | 12 (66.7%) | 6 (33.3%) |
| 18 to 19 Year Olds | 0 (0.0%) | 0 (0.0%) |
| 20 to 24 Year Olds | 0 (0.0%) | 0 (0.0%) |
| 25 to 34 Year Olds | 4 (100.0%) | 0 (0.0%) |
| 35 Years and over | 0 (0.0%) | 0 (0.0%) |
| Total | 34 (75.6%) | 11 (24.4%) |
Educational Attainment by Field of Study in Bingham Lake
Business (7 | 35.0%), bio, nature & agricultural (5 | 25.0%), science & technology (3 | 15.0%), education (3 | 15.0%), and physical & health sciences (1 | 5.0%) are the most common fields of study among 20 individuals in Bingham Lake who have obtained a bachelor's degree or higher.
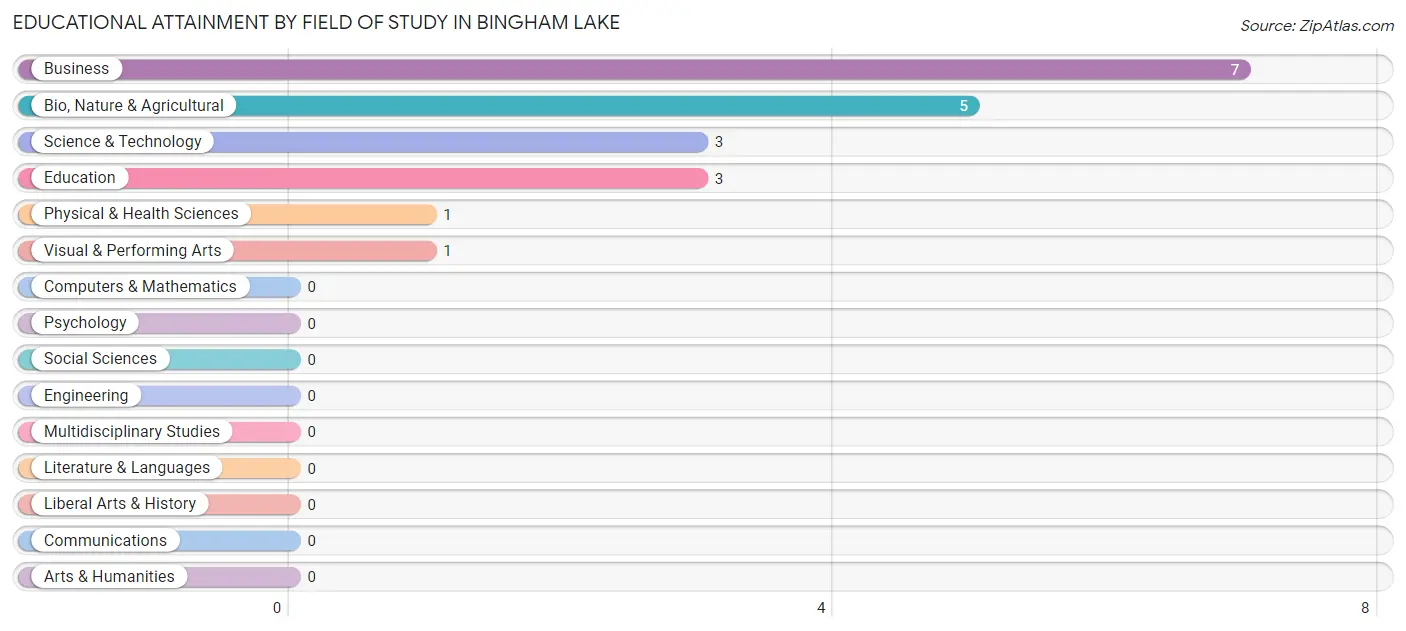
| Field of Study | # Graduates | % Graduates |
| Computers & Mathematics | 0 | 0.0% |
| Bio, Nature & Agricultural | 5 | 25.0% |
| Physical & Health Sciences | 1 | 5.0% |
| Psychology | 0 | 0.0% |
| Social Sciences | 0 | 0.0% |
| Engineering | 0 | 0.0% |
| Multidisciplinary Studies | 0 | 0.0% |
| Science & Technology | 3 | 15.0% |
| Business | 7 | 35.0% |
| Education | 3 | 15.0% |
| Literature & Languages | 0 | 0.0% |
| Liberal Arts & History | 0 | 0.0% |
| Visual & Performing Arts | 1 | 5.0% |
| Communications | 0 | 0.0% |
| Arts & Humanities | 0 | 0.0% |
| Total | 20 | 100.0% |
Transportation & Commute in Bingham Lake
Vehicle Availability by Sex in Bingham Lake
The most prevalent vehicle ownership categories in Bingham Lake are males with 3 vehicles (14, accounting for 37.8%) and females with 3 vehicles (5, making up 60.9%).
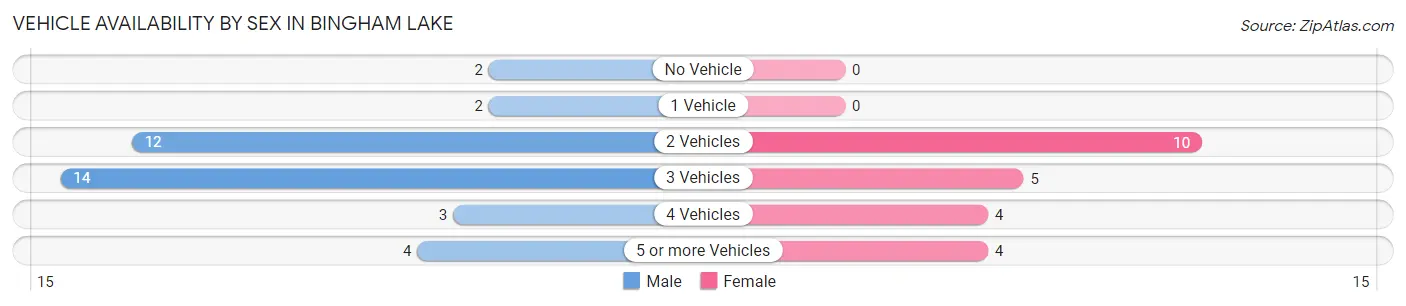
| Vehicles Available | Male | Female |
| No Vehicle | 2 (5.4%) | 0 (0.0%) |
| 1 Vehicle | 2 (5.4%) | 0 (0.0%) |
| 2 Vehicles | 12 (32.4%) | 10 (43.5%) |
| 3 Vehicles | 14 (37.8%) | 5 (21.7%) |
| 4 Vehicles | 3 (8.1%) | 4 (17.4%) |
| 5 or more Vehicles | 4 (10.8%) | 4 (17.4%) |
| Total | 37 (100.0%) | 23 (100.0%) |
Commute Time in Bingham Lake
The most frequently occuring commute durations in Bingham Lake are 5 to 9 minutes (16 commuters, 29.1%), 10 to 14 minutes (9 commuters, 16.4%), and 25 to 29 minutes (8 commuters, 14.5%).
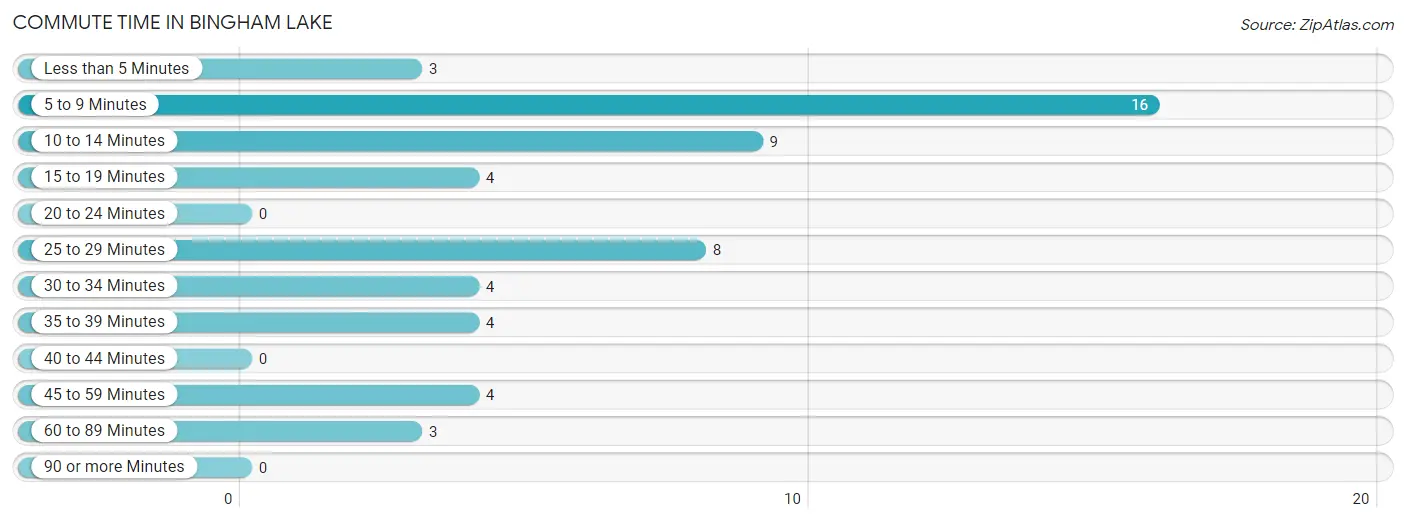
| Commute Time | # Commuters | % Commuters |
| Less than 5 Minutes | 3 | 5.4% |
| 5 to 9 Minutes | 16 | 29.1% |
| 10 to 14 Minutes | 9 | 16.4% |
| 15 to 19 Minutes | 4 | 7.3% |
| 20 to 24 Minutes | 0 | 0.0% |
| 25 to 29 Minutes | 8 | 14.5% |
| 30 to 34 Minutes | 4 | 7.3% |
| 35 to 39 Minutes | 4 | 7.3% |
| 40 to 44 Minutes | 0 | 0.0% |
| 45 to 59 Minutes | 4 | 7.3% |
| 60 to 89 Minutes | 3 | 5.4% |
| 90 or more Minutes | 0 | 0.0% |
Commute Time by Sex in Bingham Lake
The most common commute times in Bingham Lake are 5 to 9 minutes (13 commuters, 36.1%) for males and 10 to 14 minutes (7 commuters, 36.8%) for females.
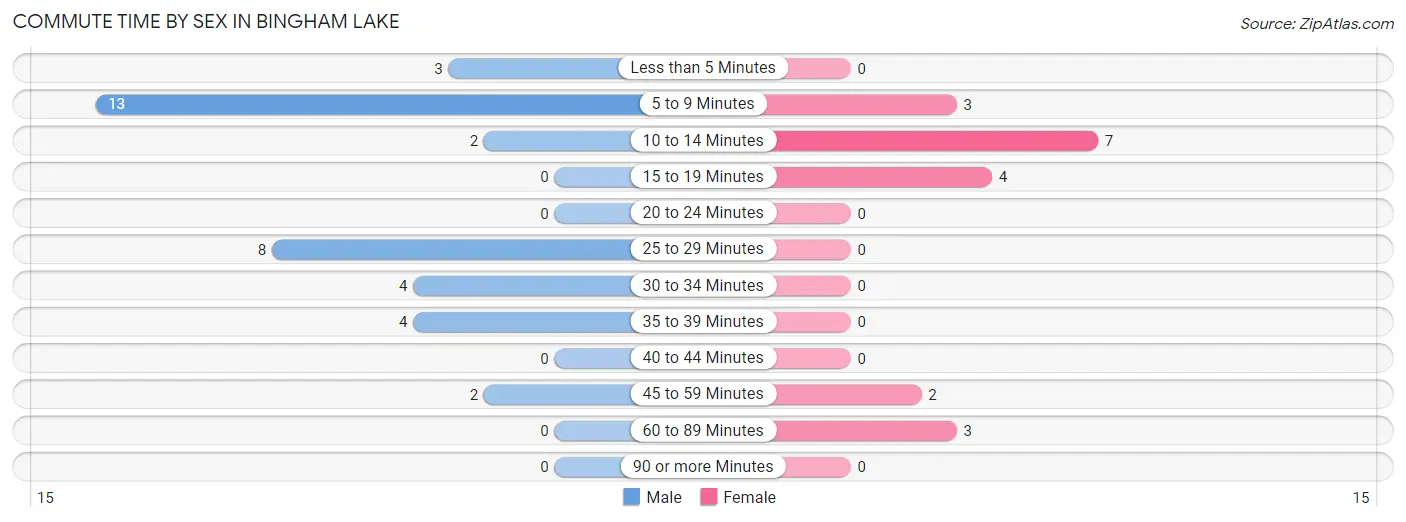
| Commute Time | Male | Female |
| Less than 5 Minutes | 3 (8.3%) | 0 (0.0%) |
| 5 to 9 Minutes | 13 (36.1%) | 3 (15.8%) |
| 10 to 14 Minutes | 2 (5.6%) | 7 (36.8%) |
| 15 to 19 Minutes | 0 (0.0%) | 4 (21.0%) |
| 20 to 24 Minutes | 0 (0.0%) | 0 (0.0%) |
| 25 to 29 Minutes | 8 (22.2%) | 0 (0.0%) |
| 30 to 34 Minutes | 4 (11.1%) | 0 (0.0%) |
| 35 to 39 Minutes | 4 (11.1%) | 0 (0.0%) |
| 40 to 44 Minutes | 0 (0.0%) | 0 (0.0%) |
| 45 to 59 Minutes | 2 (5.6%) | 2 (10.5%) |
| 60 to 89 Minutes | 0 (0.0%) | 3 (15.8%) |
| 90 or more Minutes | 0 (0.0%) | 0 (0.0%) |
Time of Departure to Work by Sex in Bingham Lake
The most frequent times of departure to work in Bingham Lake are 6:00 AM to 6:29 AM (10, 27.8%) for males and 7:30 AM to 7:59 AM (7, 36.8%) for females.
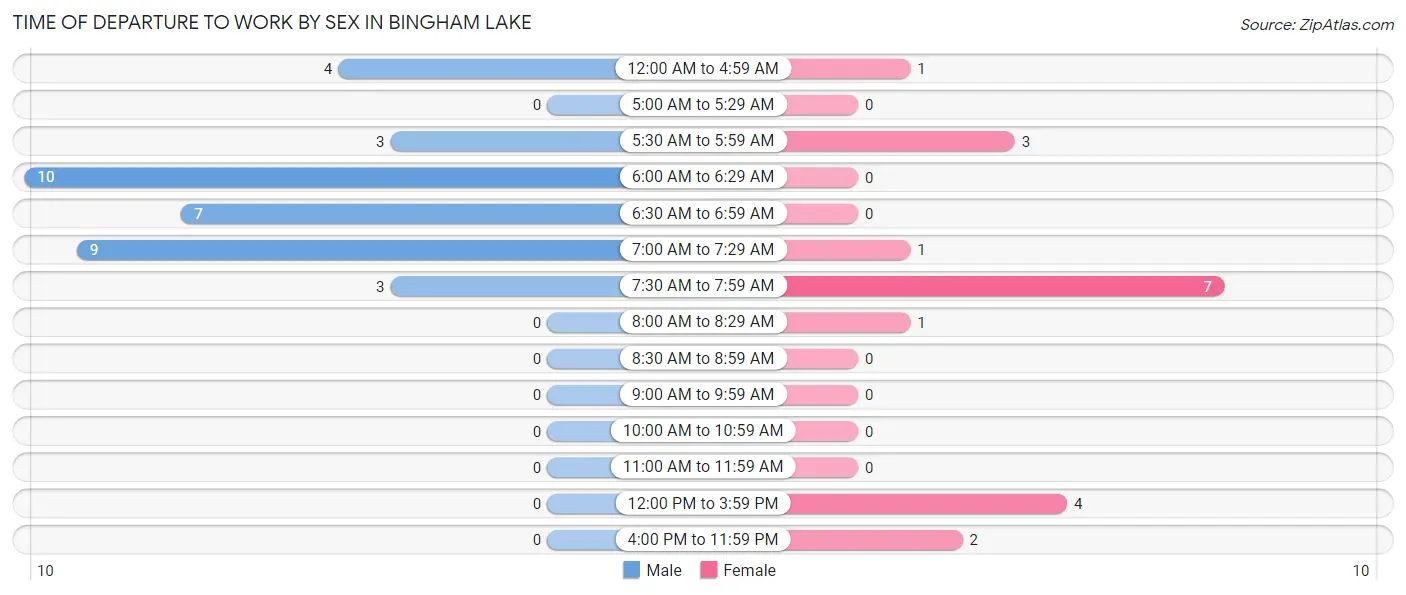
| Time of Departure | Male | Female |
| 12:00 AM to 4:59 AM | 4 (11.1%) | 1 (5.3%) |
| 5:00 AM to 5:29 AM | 0 (0.0%) | 0 (0.0%) |
| 5:30 AM to 5:59 AM | 3 (8.3%) | 3 (15.8%) |
| 6:00 AM to 6:29 AM | 10 (27.8%) | 0 (0.0%) |
| 6:30 AM to 6:59 AM | 7 (19.4%) | 0 (0.0%) |
| 7:00 AM to 7:29 AM | 9 (25.0%) | 1 (5.3%) |
| 7:30 AM to 7:59 AM | 3 (8.3%) | 7 (36.8%) |
| 8:00 AM to 8:29 AM | 0 (0.0%) | 1 (5.3%) |
| 8:30 AM to 8:59 AM | 0 (0.0%) | 0 (0.0%) |
| 9:00 AM to 9:59 AM | 0 (0.0%) | 0 (0.0%) |
| 10:00 AM to 10:59 AM | 0 (0.0%) | 0 (0.0%) |
| 11:00 AM to 11:59 AM | 0 (0.0%) | 0 (0.0%) |
| 12:00 PM to 3:59 PM | 0 (0.0%) | 4 (21.0%) |
| 4:00 PM to 11:59 PM | 0 (0.0%) | 2 (10.5%) |
| Total | 36 (100.0%) | 19 (100.0%) |
Housing Occupancy in Bingham Lake
Occupancy by Ownership in Bingham Lake
Of the total 45 dwellings in Bingham Lake, owner-occupied units account for 41 (91.1%), while renter-occupied units make up 4 (8.9%).
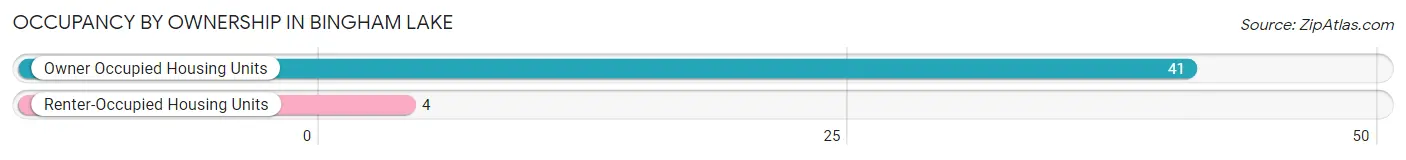
| Occupancy | # Housing Units | % Housing Units |
| Owner Occupied Housing Units | 41 | 91.1% |
| Renter-Occupied Housing Units | 4 | 8.9% |
| Total Occupied Housing Units | 45 | 100.0% |
Occupancy by Household Size in Bingham Lake
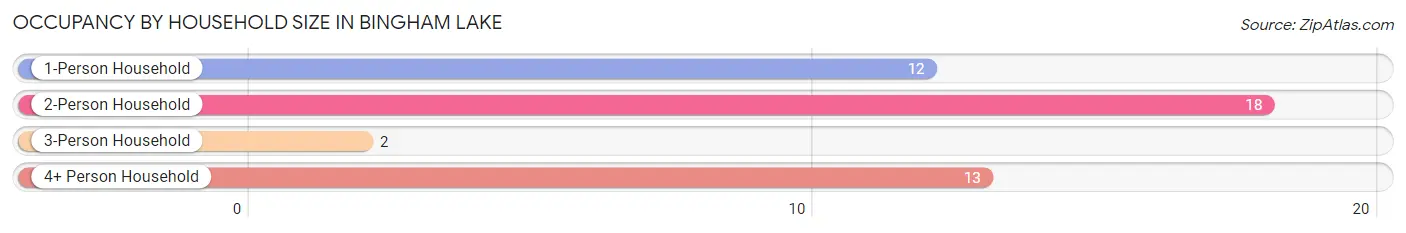
| Household Size | # Housing Units | % Housing Units |
| 1-Person Household | 12 | 26.7% |
| 2-Person Household | 18 | 40.0% |
| 3-Person Household | 2 | 4.4% |
| 4+ Person Household | 13 | 28.9% |
| Total Housing Units | 45 | 100.0% |
Occupancy by Ownership by Household Size in Bingham Lake
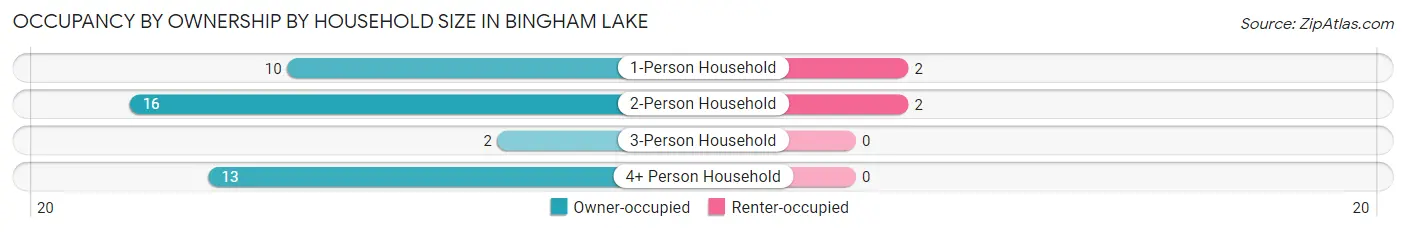
| Household Size | Owner-occupied | Renter-occupied |
| 1-Person Household | 10 (83.3%) | 2 (16.7%) |
| 2-Person Household | 16 (88.9%) | 2 (11.1%) |
| 3-Person Household | 2 (100.0%) | 0 (0.0%) |
| 4+ Person Household | 13 (100.0%) | 0 (0.0%) |
| Total Housing Units | 41 (91.1%) | 4 (8.9%) |
Occupancy by Educational Attainment in Bingham Lake
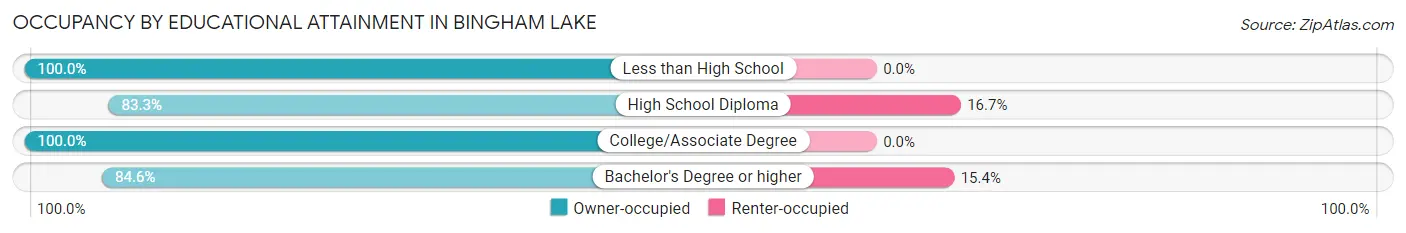
| Household Size | Owner-occupied | Renter-occupied |
| Less than High School | 6 (100.0%) | 0 (0.0%) |
| High School Diploma | 10 (83.3%) | 2 (16.7%) |
| College/Associate Degree | 14 (100.0%) | 0 (0.0%) |
| Bachelor's Degree or higher | 11 (84.6%) | 2 (15.4%) |
Occupancy by Age of Householder in Bingham Lake
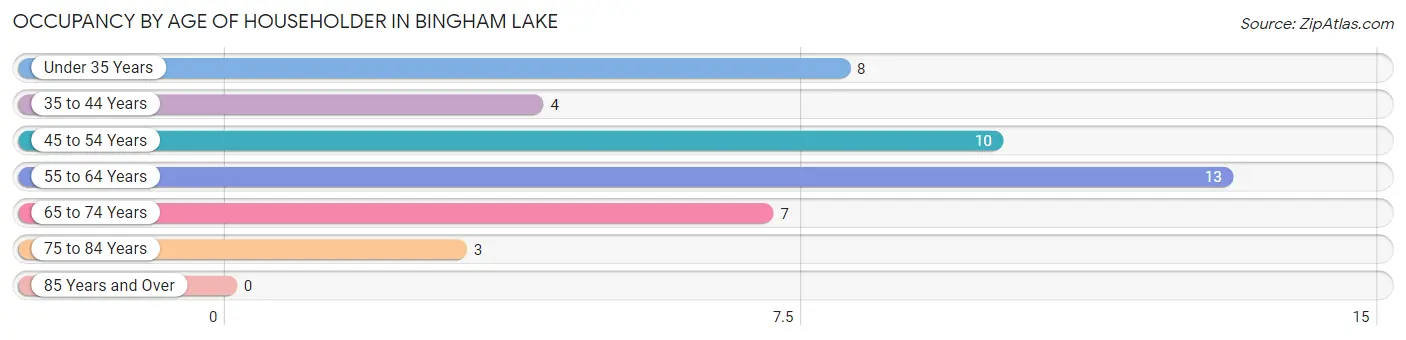
| Age Bracket | # Households | % Households |
| Under 35 Years | 8 | 17.8% |
| 35 to 44 Years | 4 | 8.9% |
| 45 to 54 Years | 10 | 22.2% |
| 55 to 64 Years | 13 | 28.9% |
| 65 to 74 Years | 7 | 15.6% |
| 75 to 84 Years | 3 | 6.7% |
| 85 Years and Over | 0 | 0.0% |
| Total | 45 | 100.0% |
Housing Finances in Bingham Lake
Median Income by Occupancy in Bingham Lake
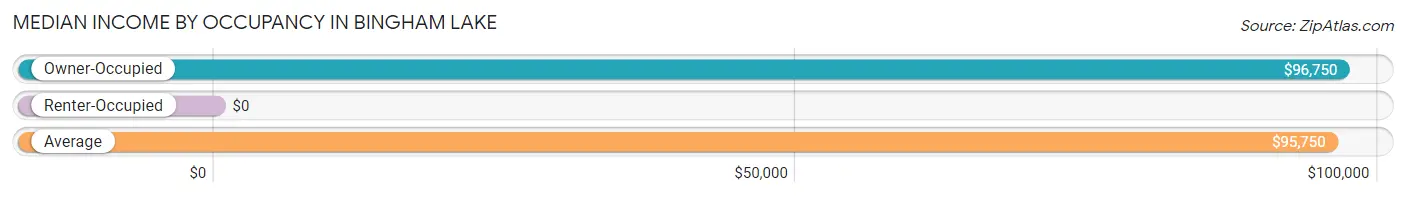
| Occupancy Type | # Households | Median Income |
| Owner-Occupied | 41 (91.1%) | $96,750 |
| Renter-Occupied | 4 (8.9%) | $0 |
| Average | 45 (100.0%) | $95,750 |
Occupancy by Householder Income Bracket in Bingham Lake
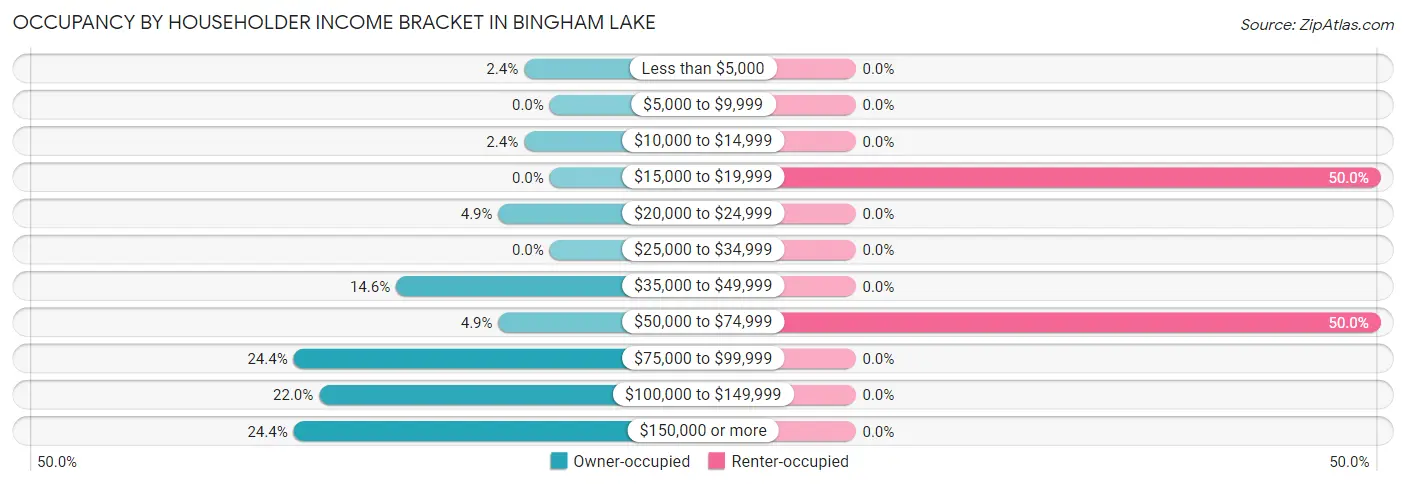
| Income Bracket | Owner-occupied | Renter-occupied |
| Less than $5,000 | 1 (2.4%) | 0 (0.0%) |
| $5,000 to $9,999 | 0 (0.0%) | 0 (0.0%) |
| $10,000 to $14,999 | 1 (2.4%) | 0 (0.0%) |
| $15,000 to $19,999 | 0 (0.0%) | 2 (50.0%) |
| $20,000 to $24,999 | 2 (4.9%) | 0 (0.0%) |
| $25,000 to $34,999 | 0 (0.0%) | 0 (0.0%) |
| $35,000 to $49,999 | 6 (14.6%) | 0 (0.0%) |
| $50,000 to $74,999 | 2 (4.9%) | 2 (50.0%) |
| $75,000 to $99,999 | 10 (24.4%) | 0 (0.0%) |
| $100,000 to $149,999 | 9 (22.0%) | 0 (0.0%) |
| $150,000 or more | 10 (24.4%) | 0 (0.0%) |
| Total | 41 (100.0%) | 4 (100.0%) |
Monthly Housing Cost Tiers in Bingham Lake
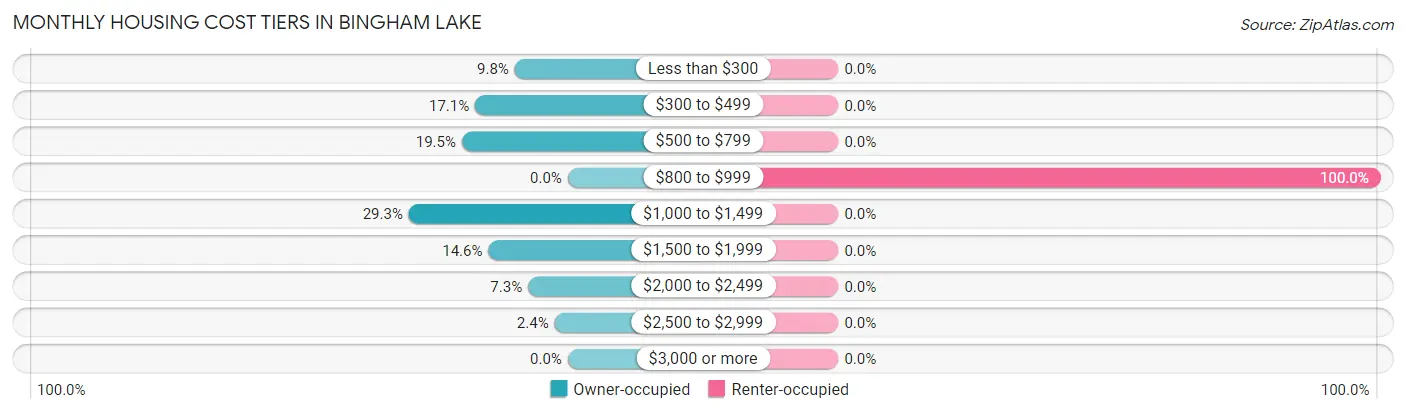
| Monthly Cost | Owner-occupied | Renter-occupied |
| Less than $300 | 4 (9.8%) | 0 (0.0%) |
| $300 to $499 | 7 (17.1%) | 0 (0.0%) |
| $500 to $799 | 8 (19.5%) | 0 (0.0%) |
| $800 to $999 | 0 (0.0%) | 4 (100.0%) |
| $1,000 to $1,499 | 12 (29.3%) | 0 (0.0%) |
| $1,500 to $1,999 | 6 (14.6%) | 0 (0.0%) |
| $2,000 to $2,499 | 3 (7.3%) | 0 (0.0%) |
| $2,500 to $2,999 | 1 (2.4%) | 0 (0.0%) |
| $3,000 or more | 0 (0.0%) | 0 (0.0%) |
| Total | 41 (100.0%) | 4 (100.0%) |
Physical Housing Characteristics in Bingham Lake
Housing Structures in Bingham Lake
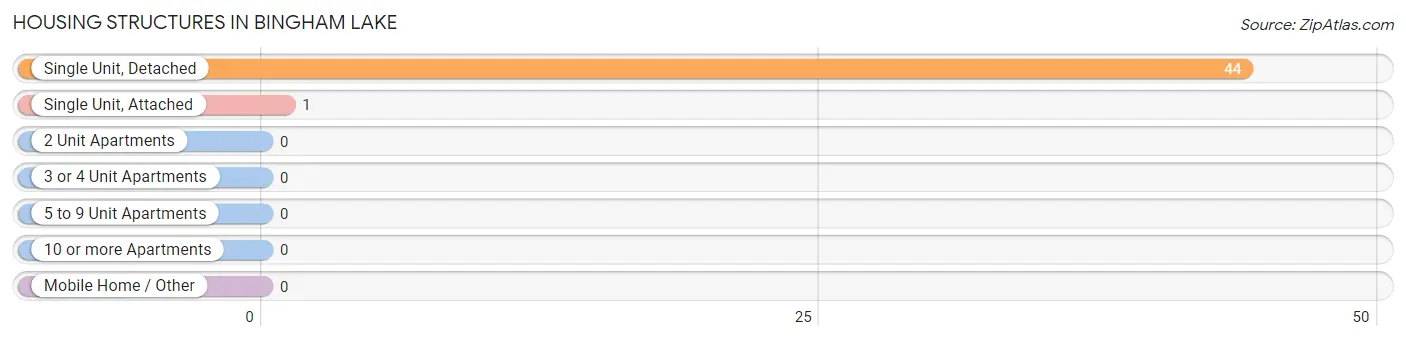
| Structure Type | # Housing Units | % Housing Units |
| Single Unit, Detached | 44 | 97.8% |
| Single Unit, Attached | 1 | 2.2% |
| 2 Unit Apartments | 0 | 0.0% |
| 3 or 4 Unit Apartments | 0 | 0.0% |
| 5 to 9 Unit Apartments | 0 | 0.0% |
| 10 or more Apartments | 0 | 0.0% |
| Mobile Home / Other | 0 | 0.0% |
| Total | 45 | 100.0% |
Housing Structures by Occupancy in Bingham Lake
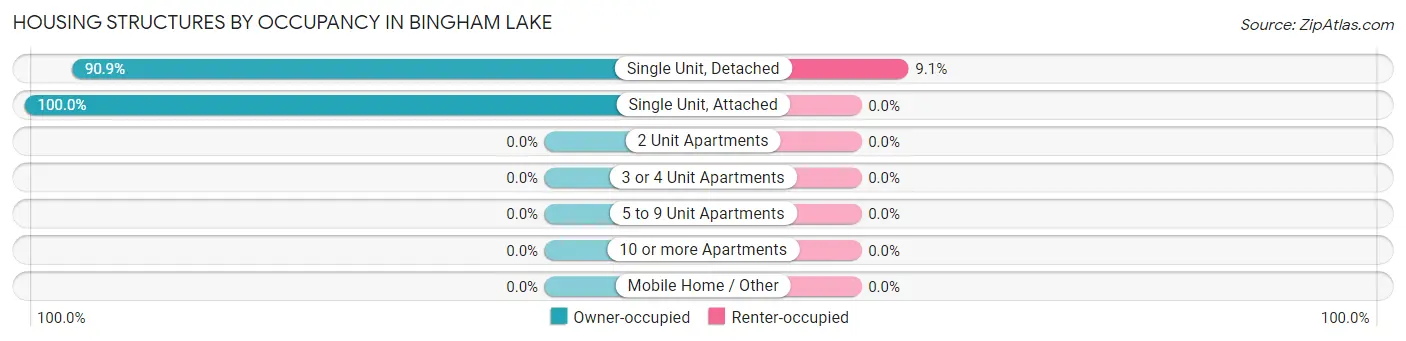
| Structure Type | Owner-occupied | Renter-occupied |
| Single Unit, Detached | 40 (90.9%) | 4 (9.1%) |
| Single Unit, Attached | 1 (100.0%) | 0 (0.0%) |
| 2 Unit Apartments | 0 (0.0%) | 0 (0.0%) |
| 3 or 4 Unit Apartments | 0 (0.0%) | 0 (0.0%) |
| 5 to 9 Unit Apartments | 0 (0.0%) | 0 (0.0%) |
| 10 or more Apartments | 0 (0.0%) | 0 (0.0%) |
| Mobile Home / Other | 0 (0.0%) | 0 (0.0%) |
| Total | 41 (91.1%) | 4 (8.9%) |
Housing Structures by Number of Rooms in Bingham Lake
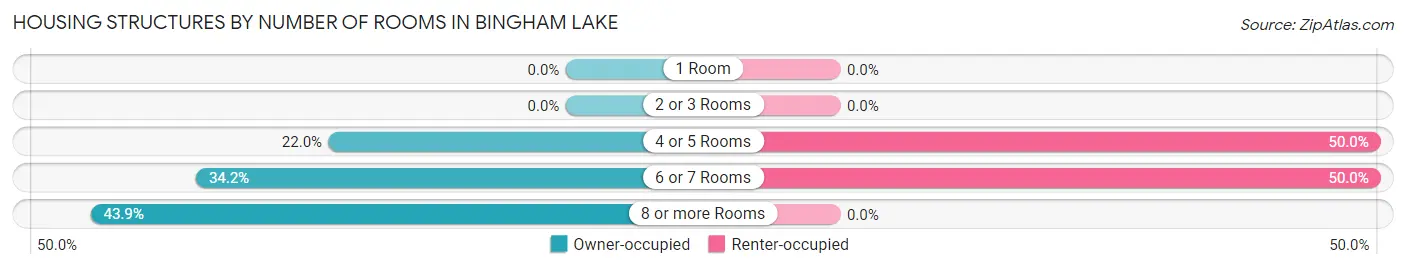
| Number of Rooms | Owner-occupied | Renter-occupied |
| 1 Room | 0 (0.0%) | 0 (0.0%) |
| 2 or 3 Rooms | 0 (0.0%) | 0 (0.0%) |
| 4 or 5 Rooms | 9 (22.0%) | 2 (50.0%) |
| 6 or 7 Rooms | 14 (34.2%) | 2 (50.0%) |
| 8 or more Rooms | 18 (43.9%) | 0 (0.0%) |
| Total | 41 (100.0%) | 4 (100.0%) |
Housing Structure by Heating Type in Bingham Lake
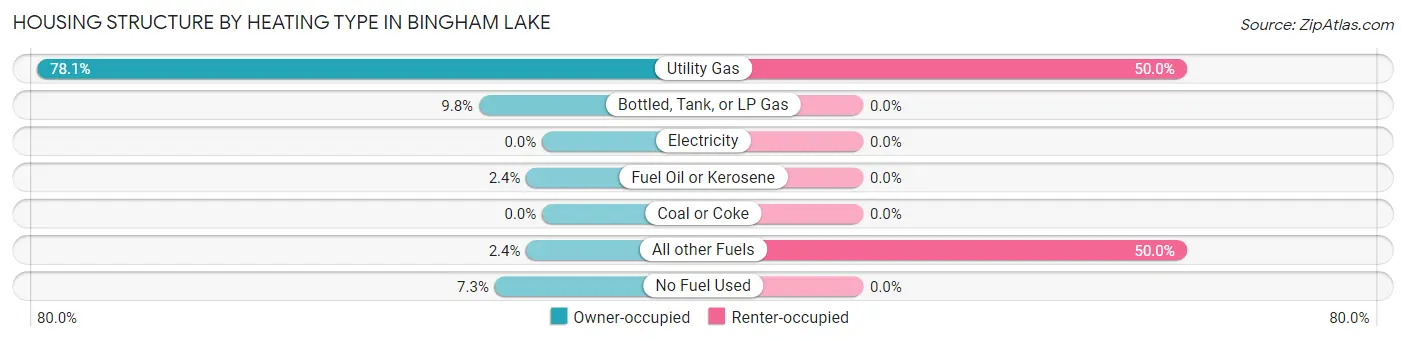
| Heating Type | Owner-occupied | Renter-occupied |
| Utility Gas | 32 (78.0%) | 2 (50.0%) |
| Bottled, Tank, or LP Gas | 4 (9.8%) | 0 (0.0%) |
| Electricity | 0 (0.0%) | 0 (0.0%) |
| Fuel Oil or Kerosene | 1 (2.4%) | 0 (0.0%) |
| Coal or Coke | 0 (0.0%) | 0 (0.0%) |
| All other Fuels | 1 (2.4%) | 2 (50.0%) |
| No Fuel Used | 3 (7.3%) | 0 (0.0%) |
| Total | 41 (100.0%) | 4 (100.0%) |
Household Vehicle Usage in Bingham Lake
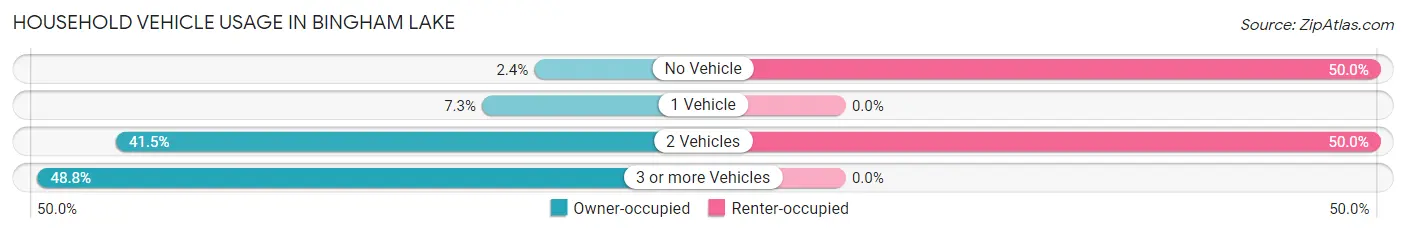
| Vehicles per Household | Owner-occupied | Renter-occupied |
| No Vehicle | 1 (2.4%) | 2 (50.0%) |
| 1 Vehicle | 3 (7.3%) | 0 (0.0%) |
| 2 Vehicles | 17 (41.5%) | 2 (50.0%) |
| 3 or more Vehicles | 20 (48.8%) | 0 (0.0%) |
| Total | 41 (100.0%) | 4 (100.0%) |
Real Estate & Mortgages in Bingham Lake
Real Estate and Mortgage Overview in Bingham Lake
| Characteristic | Without Mortgage | With Mortgage |
| Housing Units | 13 | 28 |
| Median Property Value | - | - |
| Median Household Income | - | - |
| Monthly Housing Costs | $450 | $0 |
| Real Estate Taxes | $500 | $0 |
Property Value by Mortgage Status in Bingham Lake
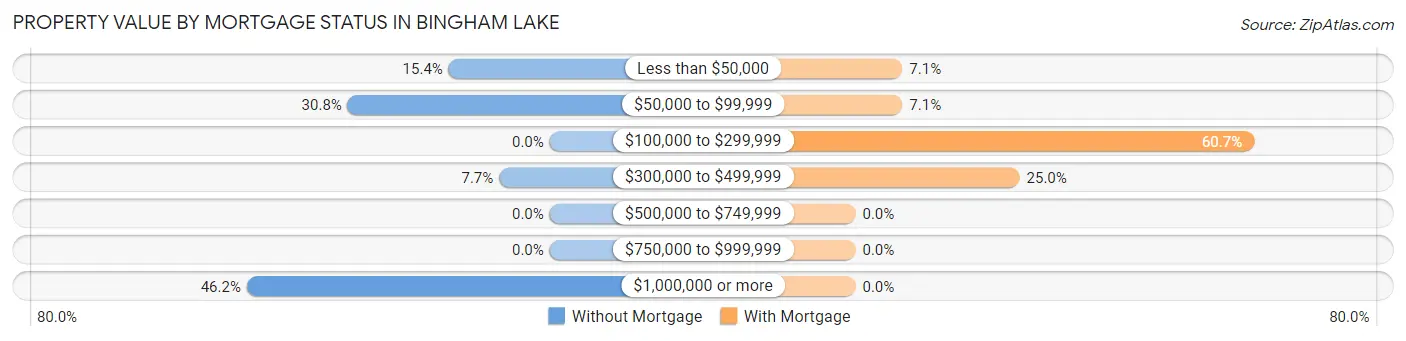
| Property Value | Without Mortgage | With Mortgage |
| Less than $50,000 | 2 (15.4%) | 2 (7.1%) |
| $50,000 to $99,999 | 4 (30.8%) | 2 (7.1%) |
| $100,000 to $299,999 | 0 (0.0%) | 17 (60.7%) |
| $300,000 to $499,999 | 1 (7.7%) | 7 (25.0%) |
| $500,000 to $749,999 | 0 (0.0%) | 0 (0.0%) |
| $750,000 to $999,999 | 0 (0.0%) | 0 (0.0%) |
| $1,000,000 or more | 6 (46.2%) | 0 (0.0%) |
| Total | 13 (100.0%) | 28 (100.0%) |
Household Income by Mortgage Status in Bingham Lake
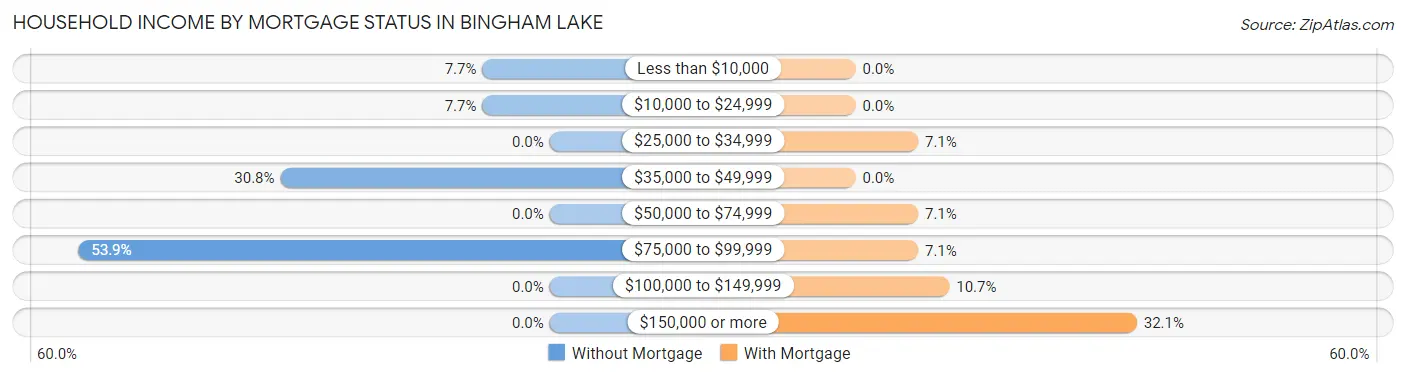
| Household Income | Without Mortgage | With Mortgage |
| Less than $10,000 | 1 (7.7%) | 0 (0.0%) |
| $10,000 to $24,999 | 1 (7.7%) | 0 (0.0%) |
| $25,000 to $34,999 | 0 (0.0%) | 2 (7.1%) |
| $35,000 to $49,999 | 4 (30.8%) | 0 (0.0%) |
| $50,000 to $74,999 | 0 (0.0%) | 2 (7.1%) |
| $75,000 to $99,999 | 7 (53.8%) | 2 (7.1%) |
| $100,000 to $149,999 | 0 (0.0%) | 3 (10.7%) |
| $150,000 or more | 0 (0.0%) | 9 (32.1%) |
| Total | 13 (100.0%) | 28 (100.0%) |
Property Value to Household Income Ratio in Bingham Lake
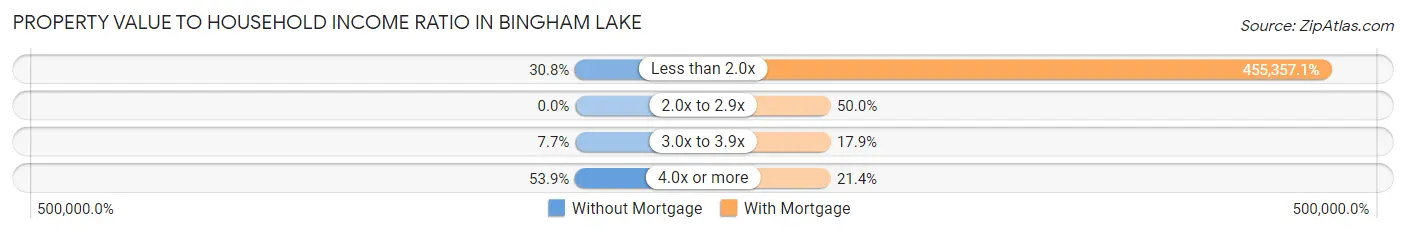
| Value-to-Income Ratio | Without Mortgage | With Mortgage |
| Less than 2.0x | 4 (30.8%) | 127,500 (455,357.1%) |
| 2.0x to 2.9x | 0 (0.0%) | 14 (50.0%) |
| 3.0x to 3.9x | 1 (7.7%) | 5 (17.9%) |
| 4.0x or more | 7 (53.8%) | 6 (21.4%) |
| Total | 13 (100.0%) | 28 (100.0%) |
Real Estate Taxes by Mortgage Status in Bingham Lake
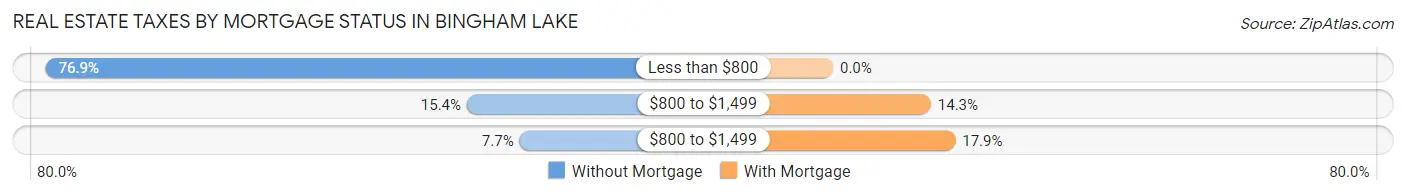
| Property Taxes | Without Mortgage | With Mortgage |
| Less than $800 | 10 (76.9%) | 0 (0.0%) |
| $800 to $1,499 | 2 (15.4%) | 4 (14.3%) |
| $800 to $1,499 | 1 (7.7%) | 5 (17.9%) |
| Total | 13 (100.0%) | 28 (100.0%) |
Health & Disability in Bingham Lake
Health Insurance Coverage by Age in Bingham Lake
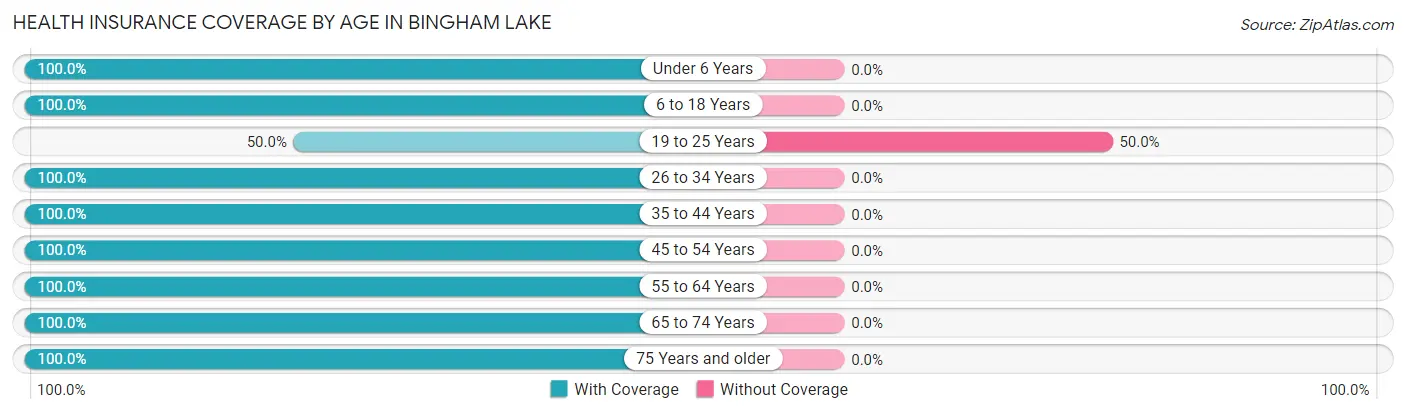
| Age Bracket | With Coverage | Without Coverage |
| Under 6 Years | 11 (100.0%) | 0 (0.0%) |
| 6 to 18 Years | 39 (100.0%) | 0 (0.0%) |
| 19 to 25 Years | 2 (50.0%) | 2 (50.0%) |
| 26 to 34 Years | 8 (100.0%) | 0 (0.0%) |
| 35 to 44 Years | 9 (100.0%) | 0 (0.0%) |
| 45 to 54 Years | 20 (100.0%) | 0 (0.0%) |
| 55 to 64 Years | 18 (100.0%) | 0 (0.0%) |
| 65 to 74 Years | 12 (100.0%) | 0 (0.0%) |
| 75 Years and older | 4 (100.0%) | 0 (0.0%) |
| Total | 123 (98.4%) | 2 (1.6%) |
Health Insurance Coverage by Citizenship Status in Bingham Lake
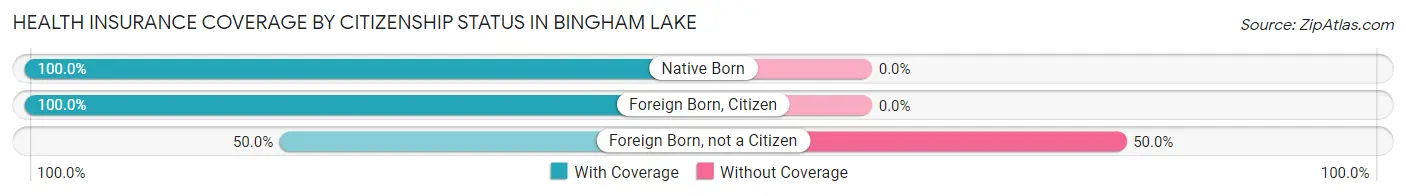
| Citizenship Status | With Coverage | Without Coverage |
| Native Born | 11 (100.0%) | 0 (0.0%) |
| Foreign Born, Citizen | 39 (100.0%) | 0 (0.0%) |
| Foreign Born, not a Citizen | 2 (50.0%) | 2 (50.0%) |
Health Insurance Coverage by Household Income in Bingham Lake
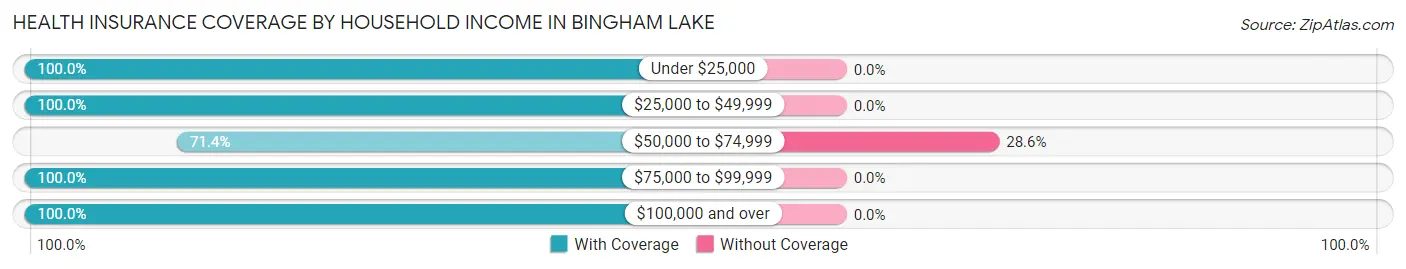
| Household Income | With Coverage | Without Coverage |
| Under $25,000 | 6 (100.0%) | 0 (0.0%) |
| $25,000 to $49,999 | 11 (100.0%) | 0 (0.0%) |
| $50,000 to $74,999 | 5 (71.4%) | 2 (28.6%) |
| $75,000 to $99,999 | 46 (100.0%) | 0 (0.0%) |
| $100,000 and over | 55 (100.0%) | 0 (0.0%) |
Public vs Private Health Insurance Coverage by Age in Bingham Lake
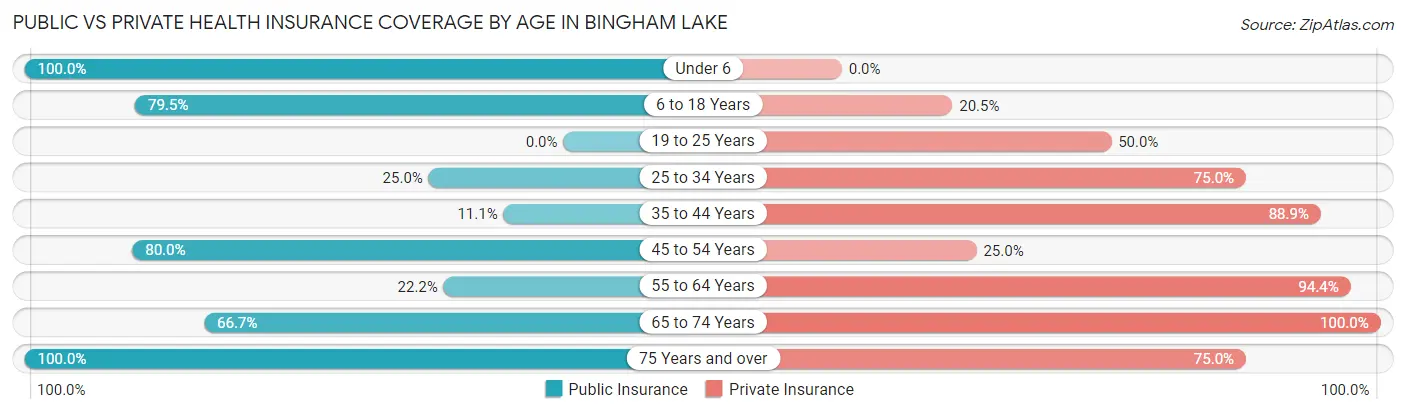
| Age Bracket | Public Insurance | Private Insurance |
| Under 6 | 11 (100.0%) | 0 (0.0%) |
| 6 to 18 Years | 31 (79.5%) | 8 (20.5%) |
| 19 to 25 Years | 0 (0.0%) | 2 (50.0%) |
| 25 to 34 Years | 2 (25.0%) | 6 (75.0%) |
| 35 to 44 Years | 1 (11.1%) | 8 (88.9%) |
| 45 to 54 Years | 16 (80.0%) | 5 (25.0%) |
| 55 to 64 Years | 4 (22.2%) | 17 (94.4%) |
| 65 to 74 Years | 8 (66.7%) | 12 (100.0%) |
| 75 Years and over | 4 (100.0%) | 3 (75.0%) |
| Total | 77 (61.6%) | 61 (48.8%) |
Disability Status by Sex by Age in Bingham Lake
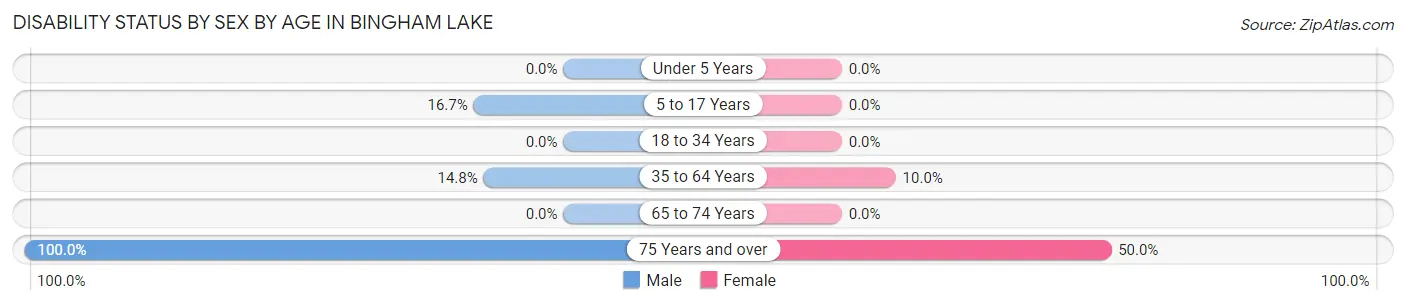
| Age Bracket | Male | Female |
| Under 5 Years | 0 (0.0%) | 0 (0.0%) |
| 5 to 17 Years | 5 (16.7%) | 0 (0.0%) |
| 18 to 34 Years | 0 (0.0%) | 0 (0.0%) |
| 35 to 64 Years | 4 (14.8%) | 2 (10.0%) |
| 65 to 74 Years | 0 (0.0%) | 0 (0.0%) |
| 75 Years and over | 2 (100.0%) | 1 (50.0%) |
Disability Class by Sex by Age in Bingham Lake
Disability Class: Hearing Difficulty
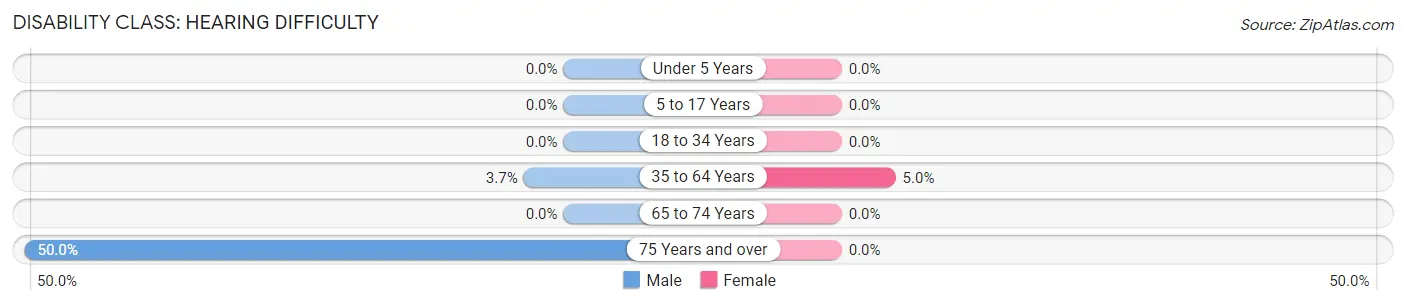
| Age Bracket | Male | Female |
| Under 5 Years | 0 (0.0%) | 0 (0.0%) |
| 5 to 17 Years | 0 (0.0%) | 0 (0.0%) |
| 18 to 34 Years | 0 (0.0%) | 0 (0.0%) |
| 35 to 64 Years | 1 (3.7%) | 1 (5.0%) |
| 65 to 74 Years | 0 (0.0%) | 0 (0.0%) |
| 75 Years and over | 1 (50.0%) | 0 (0.0%) |
Disability Class: Vision Difficulty
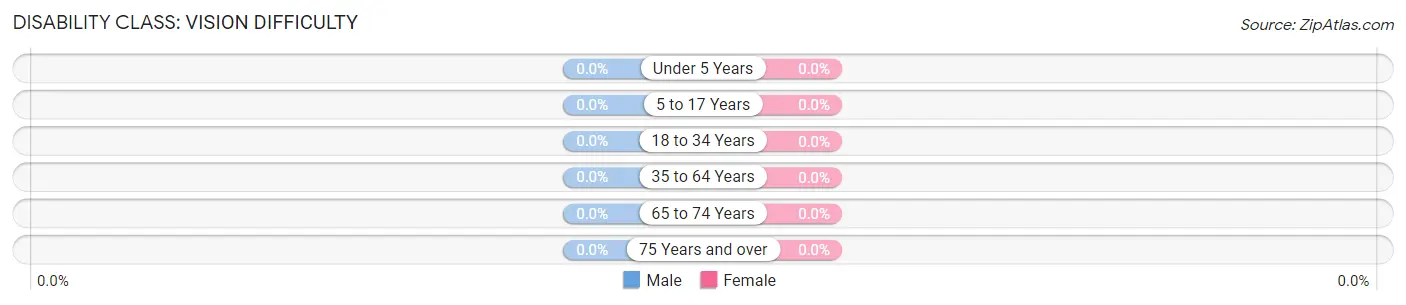
| Age Bracket | Male | Female |
| Under 5 Years | 0 (0.0%) | 0 (0.0%) |
| 5 to 17 Years | 0 (0.0%) | 0 (0.0%) |
| 18 to 34 Years | 0 (0.0%) | 0 (0.0%) |
| 35 to 64 Years | 0 (0.0%) | 0 (0.0%) |
| 65 to 74 Years | 0 (0.0%) | 0 (0.0%) |
| 75 Years and over | 0 (0.0%) | 0 (0.0%) |
Disability Class: Cognitive Difficulty
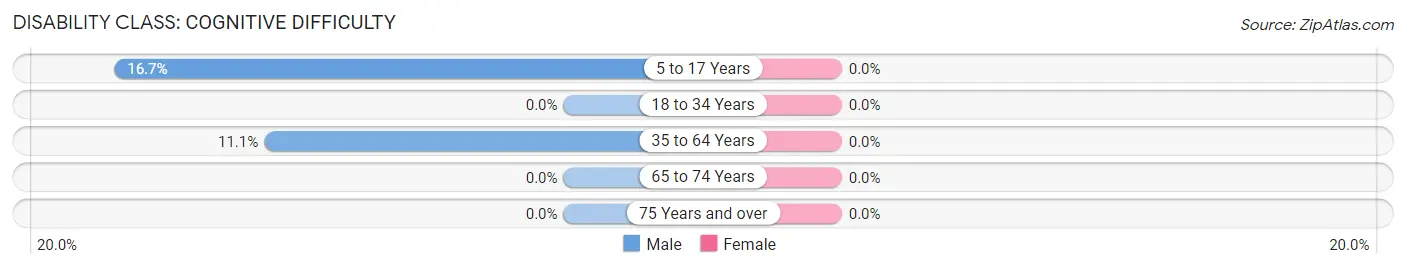
| Age Bracket | Male | Female |
| 5 to 17 Years | 5 (16.7%) | 0 (0.0%) |
| 18 to 34 Years | 0 (0.0%) | 0 (0.0%) |
| 35 to 64 Years | 3 (11.1%) | 0 (0.0%) |
| 65 to 74 Years | 0 (0.0%) | 0 (0.0%) |
| 75 Years and over | 0 (0.0%) | 0 (0.0%) |
Disability Class: Ambulatory Difficulty
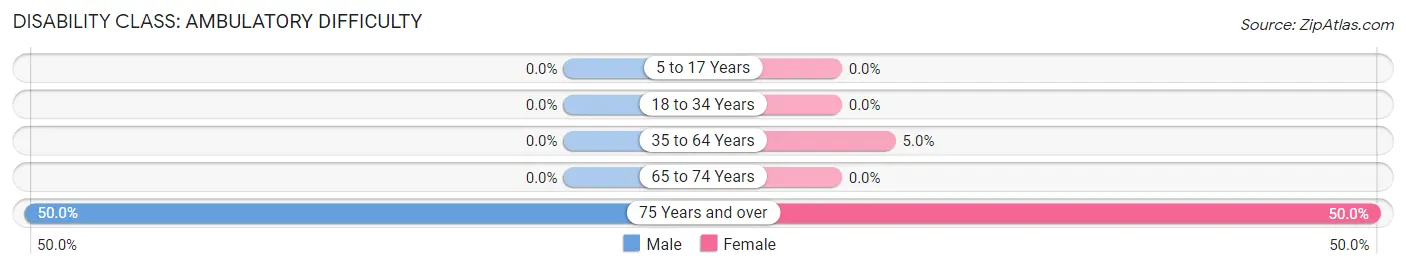
| Age Bracket | Male | Female |
| 5 to 17 Years | 0 (0.0%) | 0 (0.0%) |
| 18 to 34 Years | 0 (0.0%) | 0 (0.0%) |
| 35 to 64 Years | 0 (0.0%) | 1 (5.0%) |
| 65 to 74 Years | 0 (0.0%) | 0 (0.0%) |
| 75 Years and over | 1 (50.0%) | 1 (50.0%) |
Disability Class: Self-Care Difficulty
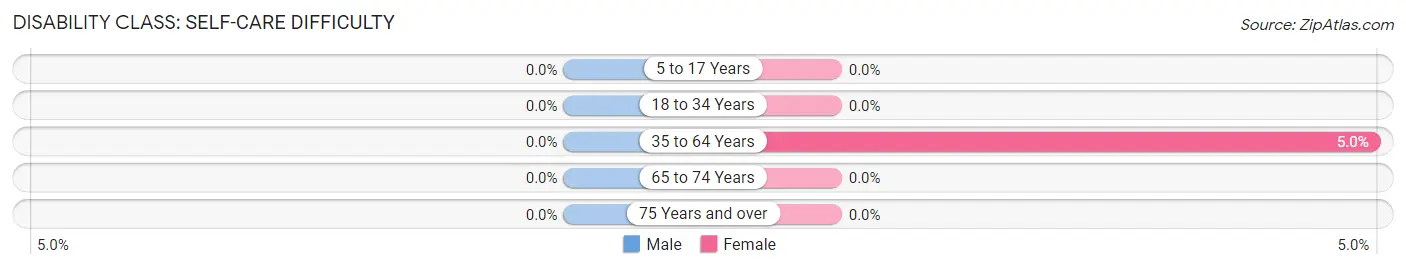
| Age Bracket | Male | Female |
| 5 to 17 Years | 0 (0.0%) | 0 (0.0%) |
| 18 to 34 Years | 0 (0.0%) | 0 (0.0%) |
| 35 to 64 Years | 0 (0.0%) | 1 (5.0%) |
| 65 to 74 Years | 0 (0.0%) | 0 (0.0%) |
| 75 Years and over | 0 (0.0%) | 0 (0.0%) |
Technology Access in Bingham Lake
Computing Device Access in Bingham Lake
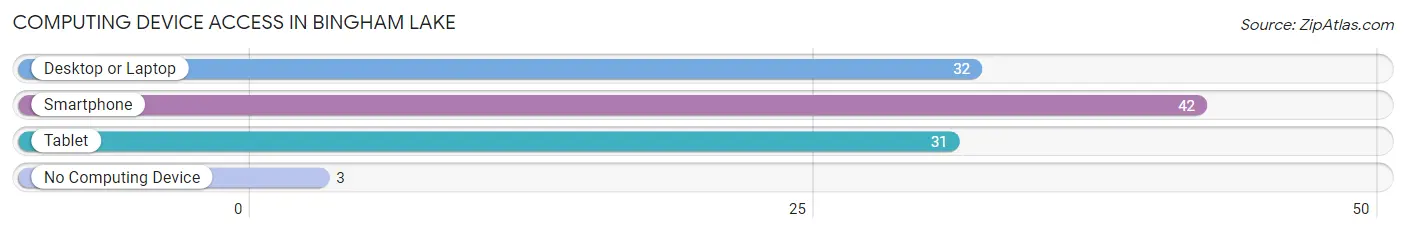
| Device Type | # Households | % Households |
| Desktop or Laptop | 32 | 71.1% |
| Smartphone | 42 | 93.3% |
| Tablet | 31 | 68.9% |
| No Computing Device | 3 | 6.7% |
| Total | 45 | 100.0% |
Internet Access in Bingham Lake
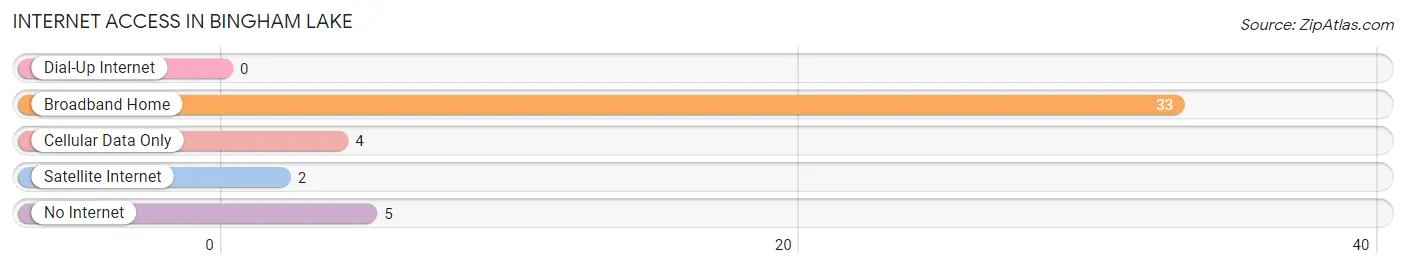
| Internet Type | # Households | % Households |
| Dial-Up Internet | 0 | 0.0% |
| Broadband Home | 33 | 73.3% |
| Cellular Data Only | 4 | 8.9% |
| Satellite Internet | 2 | 4.4% |
| No Internet | 5 | 11.1% |
| Total | 45 | 100.0% |
Bingham Lake Summary
Bingham Lake is a small town located in the southwestern corner of Minnesota, in the United States. It is situated in the southwestern corner of Jackson County, and is part of the Worthington Micropolitan Statistical Area. The town has a population of approximately 200 people, and is located on the shores of Lake Shetek.
History
The area around Bingham Lake was first settled in the late 1800s, when a group of settlers from Sweden arrived in the area. The settlers were attracted to the area due to its abundance of natural resources, including timber and fish. The settlers established a small community, which they named after the lake. The town was officially incorporated in 1887.
In the early 1900s, the town began to grow and develop. A post office was established in 1906, and a school was built in 1908. The town also had a general store, a blacksmith shop, and a hotel.
In the 1920s, the town began to experience a decline in population. This was due to the Great Depression, as well as the fact that the town was not connected to any major transportation routes. The population continued to decline until the 1950s, when the town began to experience a resurgence. This was due to the construction of a new highway, which connected the town to the larger cities of Worthington and Jackson.
Geography
Bingham Lake is located in the southwestern corner of Minnesota, in the United States. It is situated in the southwestern corner of Jackson County, and is part of the Worthington Micropolitan Statistical Area. The town has a total area of 0.6 square miles, all of which is land.
The town is located on the shores of Lake Shetek, which is a large lake that covers an area of approximately 4,000 acres. The lake is a popular destination for fishing, boating, and swimming. The town is also located near the Des Moines River, which is a tributary of the Mississippi River.
Economy
The economy of Bingham Lake is largely based on agriculture and tourism. The town is home to several farms, which produce a variety of crops, including corn, soybeans, and wheat. The town is also home to several small businesses, including a general store, a hardware store, and a restaurant.
The town is also a popular destination for tourists, due to its proximity to Lake Shetek. The lake is a popular destination for fishing, boating, and swimming. The town also hosts several festivals throughout the year, including the annual Shetek Days Festival.
Demographics
As of the 2010 census, the population of Bingham Lake was approximately 200 people. The town has a median household income of $41,250, and a median family income of $50,000. The town is predominantly white, with approximately 95% of the population being white. The town also has a small Hispanic population, with approximately 5% of the population being Hispanic.
Common Questions
What is Per Capita Income in Bingham Lake?
Per Capita income in Bingham Lake is $37,122.
What is the Median Family Income in Bingham Lake?
Median Family Income in Bingham Lake is $121,250.
What is the Median Household income in Bingham Lake?
Median Household Income in Bingham Lake is $95,750.
What is Income or Wage Gap in Bingham Lake?
Income or Wage Gap in Bingham Lake is 27.7%.
Women in Bingham Lake earn 72.3 cents for every dollar earned by a man.
What is Inequality or Gini Index in Bingham Lake?
Inequality or Gini Index in Bingham Lake is 0.38.
What is the Total Population of Bingham Lake?
Total Population of Bingham Lake is 125.
What is the Total Male Population of Bingham Lake?
Total Male Population of Bingham Lake is 79.
What is the Total Female Population of Bingham Lake?
Total Female Population of Bingham Lake is 46.
What is the Ratio of Males per 100 Females in Bingham Lake?
There are 171.74 Males per 100 Females in Bingham Lake.
What is the Ratio of Females per 100 Males in Bingham Lake?
There are 58.23 Females per 100 Males in Bingham Lake.
What is the Median Population Age in Bingham Lake?
Median Population Age in Bingham Lake is 41.3 Years.
What is the Average Family Size in Bingham Lake
Average Family Size in Bingham Lake is 3.5 People.
What is the Average Household Size in Bingham Lake
Average Household Size in Bingham Lake is 2.8 People.
How Large is the Labor Force in Bingham Lake?
There are 64 People in the Labor Forcein in Bingham Lake.
What is the Percentage of People in the Labor Force in Bingham Lake?
75.3% of People are in the Labor Force in Bingham Lake.
What is the Unemployment Rate in Bingham Lake?
Unemployment Rate in Bingham Lake is 6.3%.