Benson, MN Map & Demographics
Benson Map
Benson Overview
$32,971
PER CAPITA INCOME
$56,364
AVG FAMILY INCOME
$50,435
AVG HOUSEHOLD INCOME
42.2%
WAGE / INCOME GAP [ % ]
57.8¢/ $1
WAGE / INCOME GAP [ $ ]
0.48
INEQUALITY / GINI INDEX
3,453
TOTAL POPULATION
1,714
MALE POPULATION
1,739
FEMALE POPULATION
98.56
MALES / 100 FEMALES
101.46
FEMALES / 100 MALES
41.0
MEDIAN AGE
2.8
AVG FAMILY SIZE
2.2
AVG HOUSEHOLD SIZE
1,652
LABOR FORCE [ PEOPLE ]
59.0%
PERCENT IN LABOR FORCE
2.5%
UNEMPLOYMENT RATE
Benson Zip Codes
Benson Area Codes
Income in Benson
Income Overview in Benson
Per Capita Income in Benson is $32,971, while median incomes of families and households are $56,364 and $50,435 respectively.
| Characteristic | Number | Measure |
| Per Capita Income | 3,453 | $32,971 |
| Median Family Income | 984 | $56,364 |
| Mean Family Income | 984 | $87,934 |
| Median Household Income | 1,486 | $50,435 |
| Mean Household Income | 1,486 | $74,999 |
| Income Deficit | 984 | $0 |
| Wage / Income Gap (%) | 3,453 | 42.24% |
| Wage / Income Gap ($) | 3,453 | 57.76¢ per $1 |
| Gini / Inequality Index | 3,453 | 0.48 |
Earnings by Sex in Benson
Average Earnings in Benson are $36,007, $49,583 for men and $28,640 for women, a difference of 42.2%.
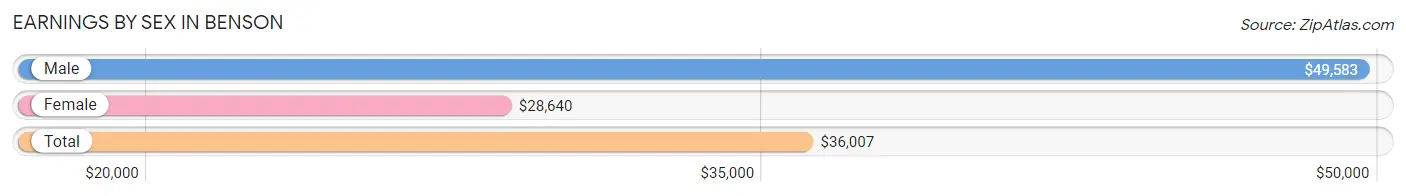
| Sex | Number | Average Earnings |
| Male | 905 (52.2%) | $49,583 |
| Female | 828 (47.8%) | $28,640 |
| Total | 1,733 (100.0%) | $36,007 |
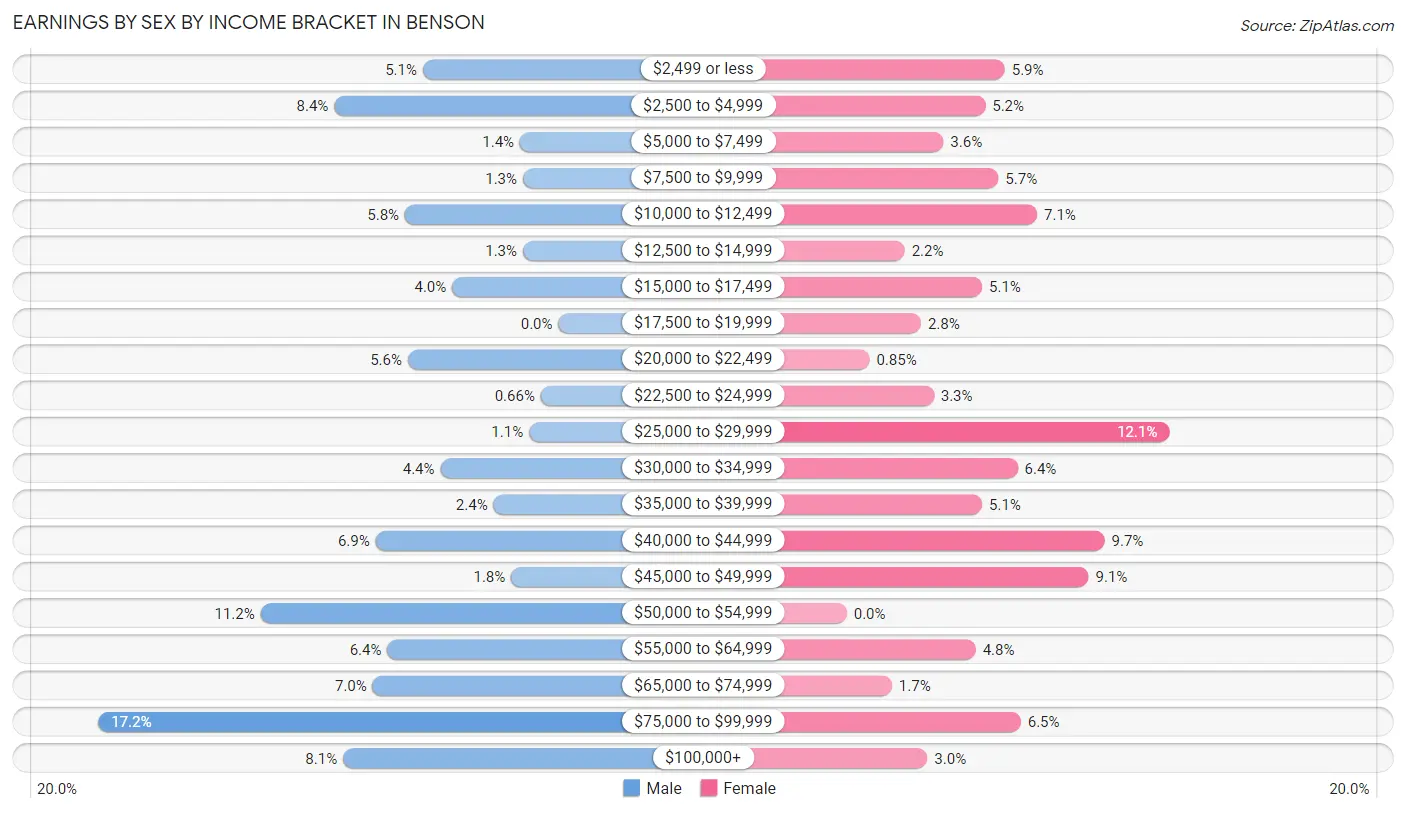
Earnings by Sex by Income Bracket in Benson
The most common earnings brackets in Benson are $75,000 to $99,999 for men (156 | 17.2%) and $25,000 to $29,999 for women (100 | 12.1%).
| Income | Male | Female |
| $2,499 or less | 46 (5.1%) | 49 (5.9%) |
| $2,500 to $4,999 | 76 (8.4%) | 43 (5.2%) |
| $5,000 to $7,499 | 13 (1.4%) | 30 (3.6%) |
| $7,500 to $9,999 | 12 (1.3%) | 47 (5.7%) |
| $10,000 to $12,499 | 52 (5.8%) | 59 (7.1%) |
| $12,500 to $14,999 | 12 (1.3%) | 18 (2.2%) |
| $15,000 to $17,499 | 36 (4.0%) | 42 (5.1%) |
| $17,500 to $19,999 | 0 (0.0%) | 23 (2.8%) |
| $20,000 to $22,499 | 51 (5.6%) | 7 (0.9%) |
| $22,500 to $24,999 | 6 (0.7%) | 27 (3.3%) |
| $25,000 to $29,999 | 10 (1.1%) | 100 (12.1%) |
| $30,000 to $34,999 | 40 (4.4%) | 53 (6.4%) |
| $35,000 to $39,999 | 22 (2.4%) | 42 (5.1%) |
| $40,000 to $44,999 | 62 (6.9%) | 80 (9.7%) |
| $45,000 to $49,999 | 16 (1.8%) | 75 (9.1%) |
| $50,000 to $54,999 | 101 (11.2%) | 0 (0.0%) |
| $55,000 to $64,999 | 58 (6.4%) | 40 (4.8%) |
| $65,000 to $74,999 | 63 (7.0%) | 14 (1.7%) |
| $75,000 to $99,999 | 156 (17.2%) | 54 (6.5%) |
| $100,000+ | 73 (8.1%) | 25 (3.0%) |
| Total | 905 (100.0%) | 828 (100.0%) |
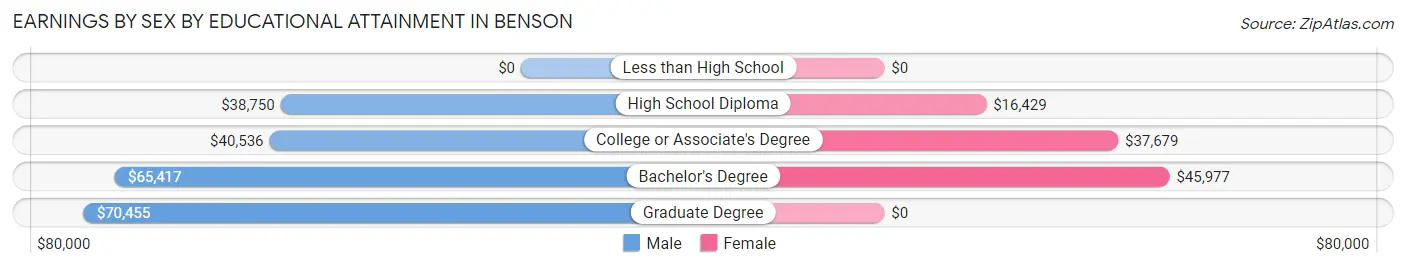
Earnings by Sex by Educational Attainment in Benson
Average earnings in Benson are $51,311 for men and $34,835 for women, a difference of 32.1%. Men with an educational attainment of graduate degree enjoy the highest average annual earnings of $70,455, while those with high school diploma education earn the least with $38,750. Women with an educational attainment of bachelor's degree earn the most with the average annual earnings of $45,977, while those with high school diploma education have the smallest earnings of $16,429.
| Educational Attainment | Male Income | Female Income |
| Less than High School | - | - |
| High School Diploma | $38,750 | $16,429 |
| College or Associate's Degree | $40,536 | $37,679 |
| Bachelor's Degree | $65,417 | $45,977 |
| Graduate Degree | $70,455 | $0 |
| Total | $51,311 | $34,835 |
Family Income in Benson
Family Income Brackets in Benson
According to the Benson family income data, there are 233 families falling into the $50,000 to $74,999 income range, which is the most common income bracket and makes up 23.7% of all families.
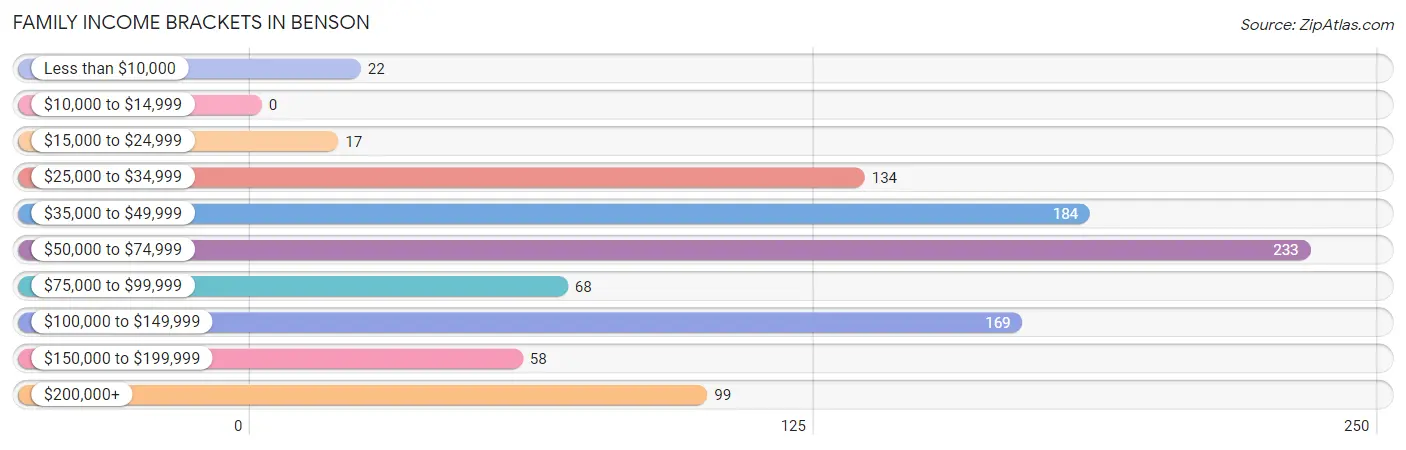
| Income Bracket | # Families | % Families |
| Less than $10,000 | 22 | 2.2% |
| $10,000 to $14,999 | 0 | 0.0% |
| $15,000 to $24,999 | 17 | 1.7% |
| $25,000 to $34,999 | 134 | 13.6% |
| $35,000 to $49,999 | 184 | 18.7% |
| $50,000 to $74,999 | 233 | 23.7% |
| $75,000 to $99,999 | 68 | 6.9% |
| $100,000 to $149,999 | 169 | 17.2% |
| $150,000 to $199,999 | 58 | 5.9% |
| $200,000+ | 99 | 10.1% |
Family Income by Famaliy Size in Benson
4-person families (88 | 8.9%) account for the highest median family income in Benson with $116,250 per family, while 2-person families (510 | 51.8%) have the highest median income of $30,834 per family member.
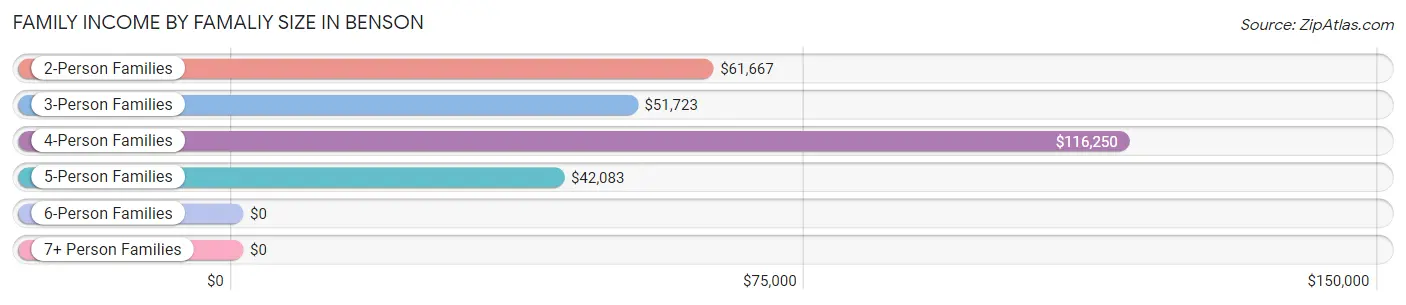
| Income Bracket | # Families | Median Income |
| 2-Person Families | 510 (51.8%) | $61,667 |
| 3-Person Families | 293 (29.8%) | $51,723 |
| 4-Person Families | 88 (8.9%) | $116,250 |
| 5-Person Families | 93 (9.5%) | $42,083 |
| 6-Person Families | 0 (0.0%) | $0 |
| 7+ Person Families | 0 (0.0%) | $0 |
| Total | 984 (100.0%) | $56,364 |
Family Income by Number of Earners in Benson
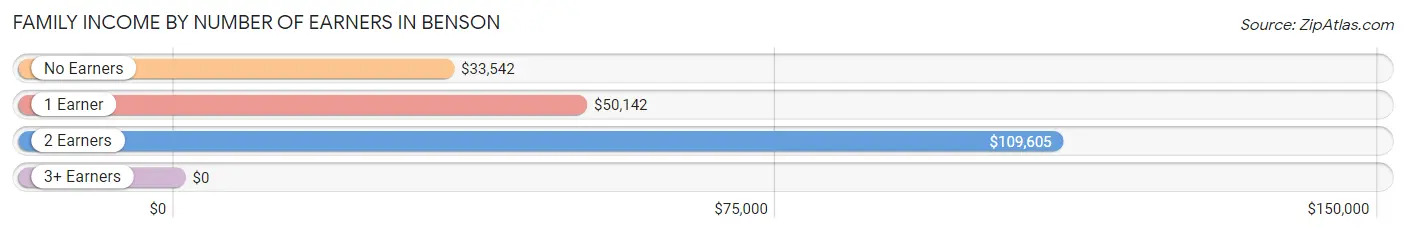
| Number of Earners | # Families | Median Income |
| No Earners | 80 (8.1%) | $33,542 |
| 1 Earner | 512 (52.0%) | $50,142 |
| 2 Earners | 310 (31.5%) | $109,605 |
| 3+ Earners | 82 (8.3%) | $0 |
| Total | 984 (100.0%) | $56,364 |
Household Income in Benson
Household Income Brackets in Benson
With 270 households falling in the category, the $50,000 to $74,999 income range is the most frequent in Benson, accounting for 18.2% of all households. In contrast, only 58 households (3.9%) fall into the $150,000 to $199,999 income bracket, making it the least populous group.
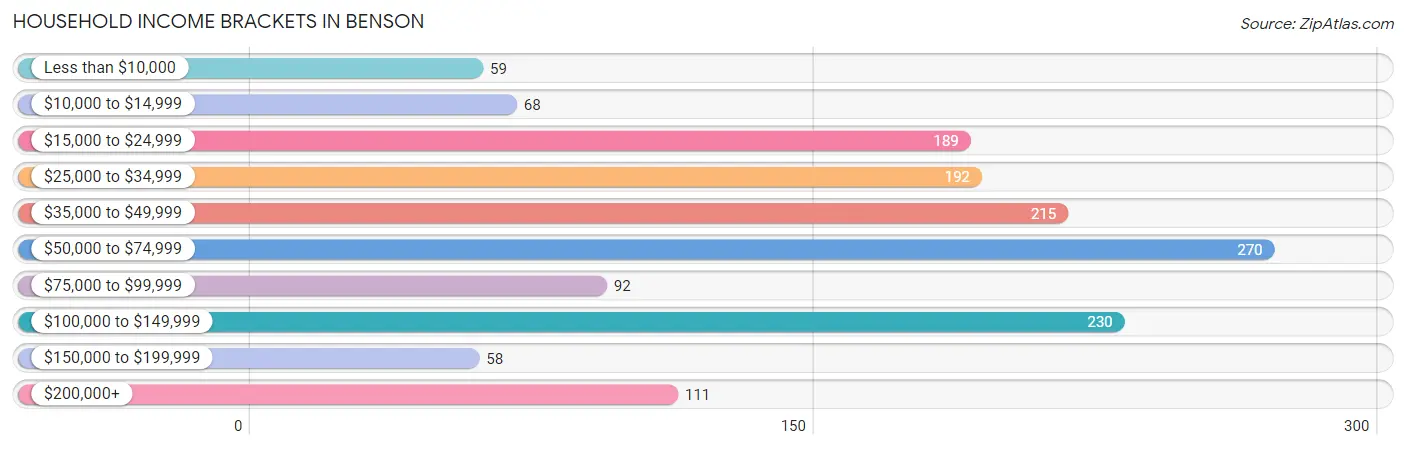
| Income Bracket | # Households | % Households |
| Less than $10,000 | 59 | 4.0% |
| $10,000 to $14,999 | 68 | 4.6% |
| $15,000 to $24,999 | 189 | 12.7% |
| $25,000 to $34,999 | 192 | 12.9% |
| $35,000 to $49,999 | 215 | 14.5% |
| $50,000 to $74,999 | 270 | 18.2% |
| $75,000 to $99,999 | 92 | 6.2% |
| $100,000 to $149,999 | 230 | 15.5% |
| $150,000 to $199,999 | 58 | 3.9% |
| $200,000+ | 111 | 7.5% |
Household Income by Householder Age in Benson
The median household income in Benson is $50,435, with the highest median household income of $61,563 found in the 45 to 64 years age bracket for the primary householder. A total of 463 households (31.2%) fall into this category. Meanwhile, the 15 to 24 years age bracket for the primary householder has the lowest median household income of $0, with 41 households (2.8%) in this group.
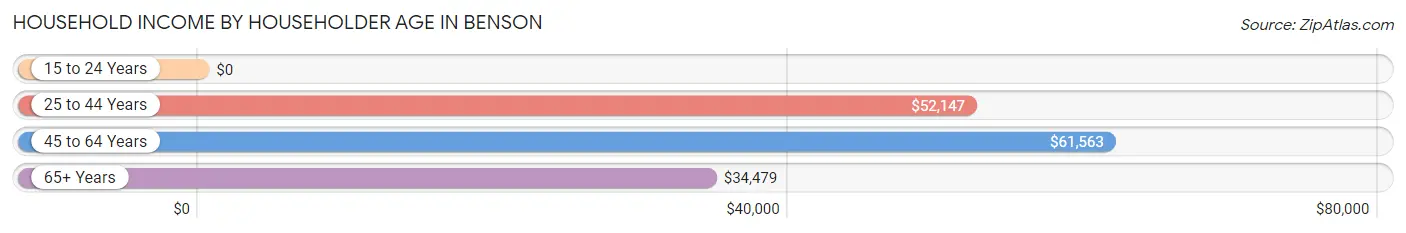
| Income Bracket | # Households | Median Income |
| 15 to 24 Years | 41 (2.8%) | $0 |
| 25 to 44 Years | 466 (31.4%) | $52,147 |
| 45 to 64 Years | 463 (31.2%) | $61,563 |
| 65+ Years | 516 (34.7%) | $34,479 |
| Total | 1,486 (100.0%) | $50,435 |
Poverty in Benson
Income Below Poverty by Sex and Age in Benson
With 11.6% poverty level for males and 5.2% for females among the residents of Benson, 18 to 24 year old males and 12 to 14 year old females are the most vulnerable to poverty, with 60 males (35.7%) and 8 females (14.8%) in their respective age groups living below the poverty level.
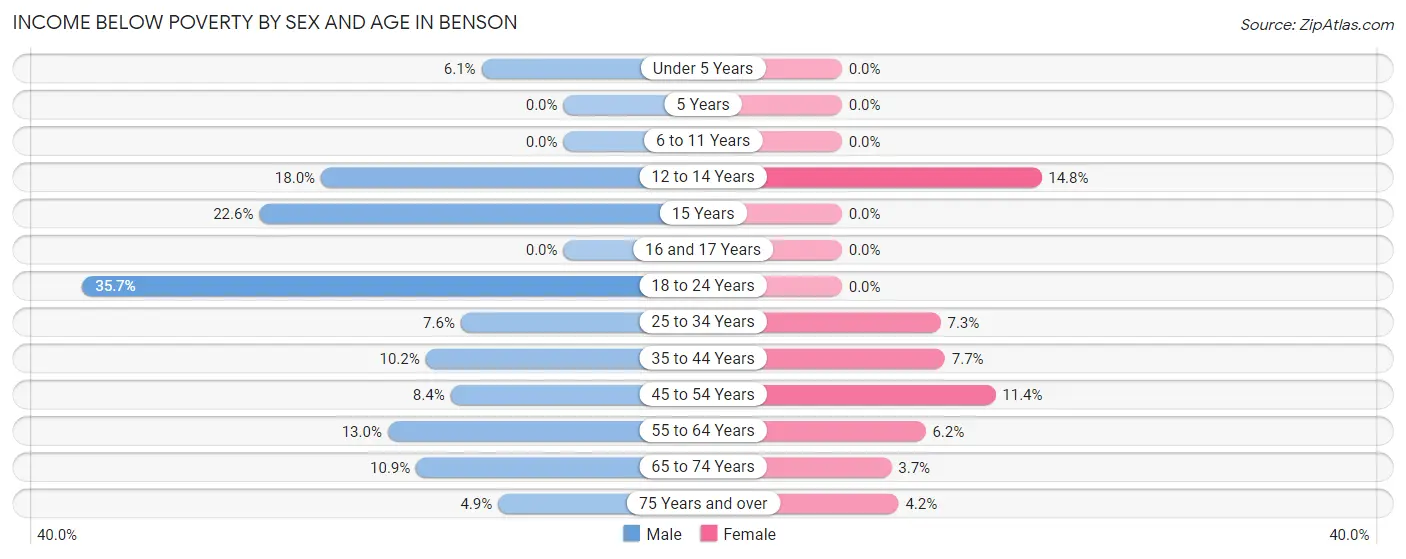
| Age Bracket | Male | Female |
| Under 5 Years | 9 (6.1%) | 0 (0.0%) |
| 5 Years | 0 (0.0%) | 0 (0.0%) |
| 6 to 11 Years | 0 (0.0%) | 0 (0.0%) |
| 12 to 14 Years | 9 (18.0%) | 8 (14.8%) |
| 15 Years | 14 (22.6%) | 0 (0.0%) |
| 16 and 17 Years | 0 (0.0%) | 0 (0.0%) |
| 18 to 24 Years | 60 (35.7%) | 0 (0.0%) |
| 25 to 34 Years | 16 (7.6%) | 14 (7.3%) |
| 35 to 44 Years | 22 (10.2%) | 13 (7.6%) |
| 45 to 54 Years | 14 (8.4%) | 26 (11.4%) |
| 55 to 64 Years | 27 (13.0%) | 9 (6.2%) |
| 65 to 74 Years | 20 (10.9%) | 7 (3.7%) |
| 75 Years and over | 5 (4.9%) | 11 (4.2%) |
| Total | 196 (11.6%) | 88 (5.2%) |
Income Above Poverty by Sex and Age in Benson
According to the poverty statistics in Benson, males aged 6 to 11 years and females aged under 5 years are the age groups that are most secure financially, with 100.0% of males and 100.0% of females in these age groups living above the poverty line.
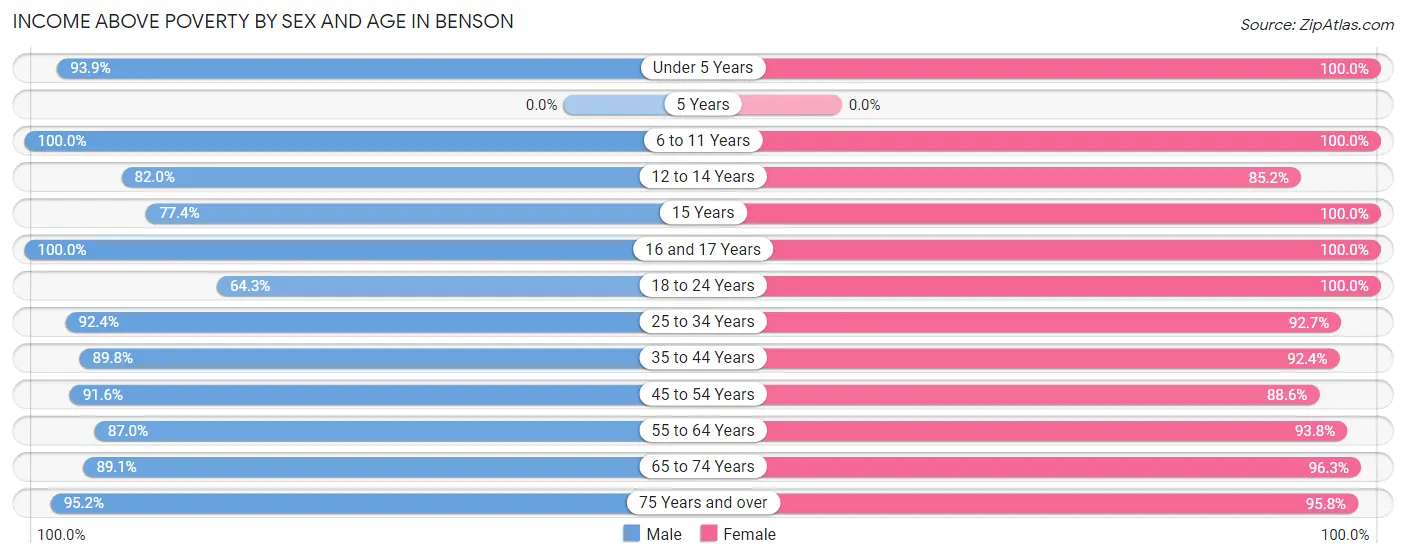
| Age Bracket | Male | Female |
| Under 5 Years | 139 (93.9%) | 121 (100.0%) |
| 5 Years | 0 (0.0%) | 0 (0.0%) |
| 6 to 11 Years | 96 (100.0%) | 105 (100.0%) |
| 12 to 14 Years | 41 (82.0%) | 46 (85.2%) |
| 15 Years | 48 (77.4%) | 16 (100.0%) |
| 16 and 17 Years | 83 (100.0%) | 68 (100.0%) |
| 18 to 24 Years | 108 (64.3%) | 126 (100.0%) |
| 25 to 34 Years | 194 (92.4%) | 177 (92.7%) |
| 35 to 44 Years | 193 (89.8%) | 157 (92.3%) |
| 45 to 54 Years | 153 (91.6%) | 202 (88.6%) |
| 55 to 64 Years | 180 (87.0%) | 136 (93.8%) |
| 65 to 74 Years | 163 (89.1%) | 183 (96.3%) |
| 75 Years and over | 98 (95.2%) | 250 (95.8%) |
| Total | 1,496 (88.4%) | 1,587 (94.8%) |
Income Below Poverty Among Married-Couple Families in Benson
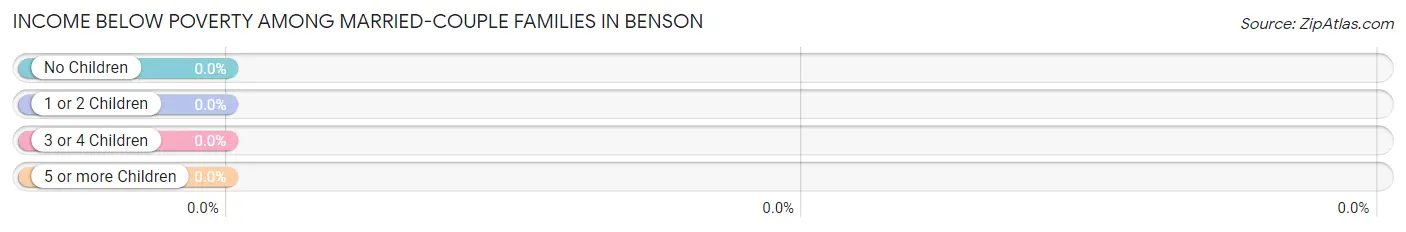
| Children | Above Poverty | Below Poverty |
| No Children | 377 (100.0%) | 0 (0.0%) |
| 1 or 2 Children | 182 (100.0%) | 0 (0.0%) |
| 3 or 4 Children | 57 (100.0%) | 0 (0.0%) |
| 5 or more Children | 0 (0.0%) | 0 (0.0%) |
| Total | 616 (100.0%) | 0 (0.0%) |
Income Below Poverty Among Single-Parent Households in Benson
According to the poverty data in Benson, 4.8% or 8 single-father households and 17.5% or 35 single-mother households are living below the poverty line. Among single-father households, those with 1 or 2 children have the highest poverty rate, with 8 households (8.5%) experiencing poverty. Likewise, among single-mother households, those with 3 or 4 children have the highest poverty rate, with 13 households (100.0%) falling below the poverty line.
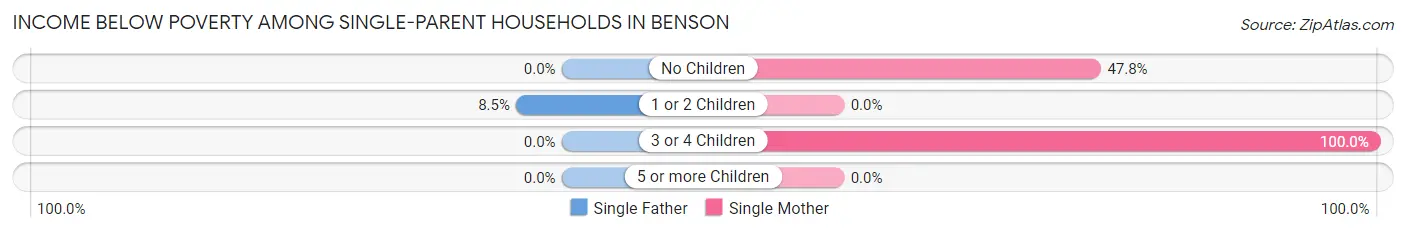
| Children | Single Father | Single Mother |
| No Children | 0 (0.0%) | 22 (47.8%) |
| 1 or 2 Children | 8 (8.5%) | 0 (0.0%) |
| 3 or 4 Children | 0 (0.0%) | 13 (100.0%) |
| 5 or more Children | 0 (0.0%) | 0 (0.0%) |
| Total | 8 (4.8%) | 35 (17.5%) |
Income Below Poverty Among Married-Couple vs Single-Parent Households in Benson
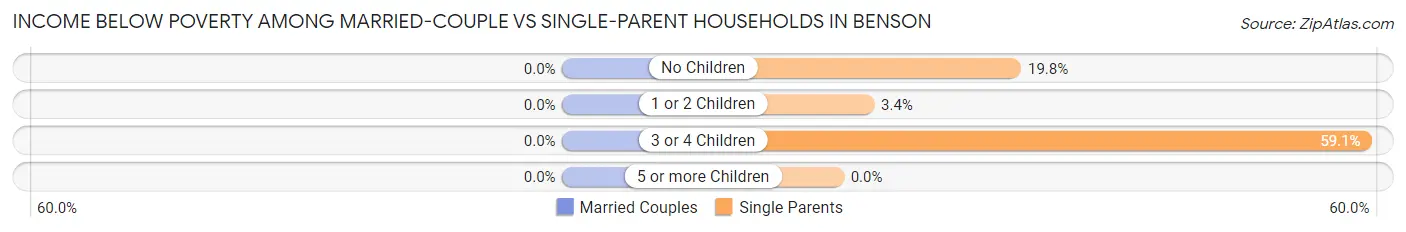
| Children | Married-Couple Families | Single-Parent Households |
| No Children | 0 (0.0%) | 22 (19.8%) |
| 1 or 2 Children | 0 (0.0%) | 8 (3.4%) |
| 3 or 4 Children | 0 (0.0%) | 13 (59.1%) |
| 5 or more Children | 0 (0.0%) | 0 (0.0%) |
| Total | 0 (0.0%) | 43 (11.7%) |
Race in Benson
The most populous races in Benson are White / Caucasian (3,267 | 94.6%), Hispanic or Latino (180 | 5.2%), and Two or more Races (166 | 4.8%).
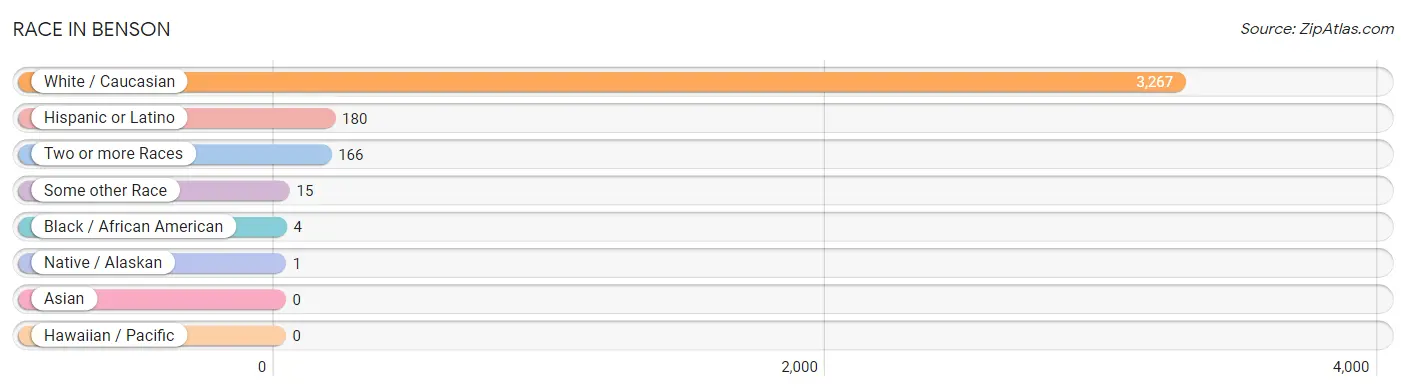
| Race | # Population | % Population |
| Asian | 0 | 0.0% |
| Black / African American | 4 | 0.1% |
| Hawaiian / Pacific | 0 | 0.0% |
| Hispanic or Latino | 180 | 5.2% |
| Native / Alaskan | 1 | 0.0% |
| White / Caucasian | 3,267 | 94.6% |
| Two or more Races | 166 | 4.8% |
| Some other Race | 15 | 0.4% |
| Total | 3,453 | 100.0% |
Ancestry in Benson
The most populous ancestries reported in Benson are German (1,178 | 34.1%), Norwegian (980 | 28.4%), Irish (338 | 9.8%), Swedish (329 | 9.5%), and English (308 | 8.9%), together accounting for 90.7% of all Benson residents.
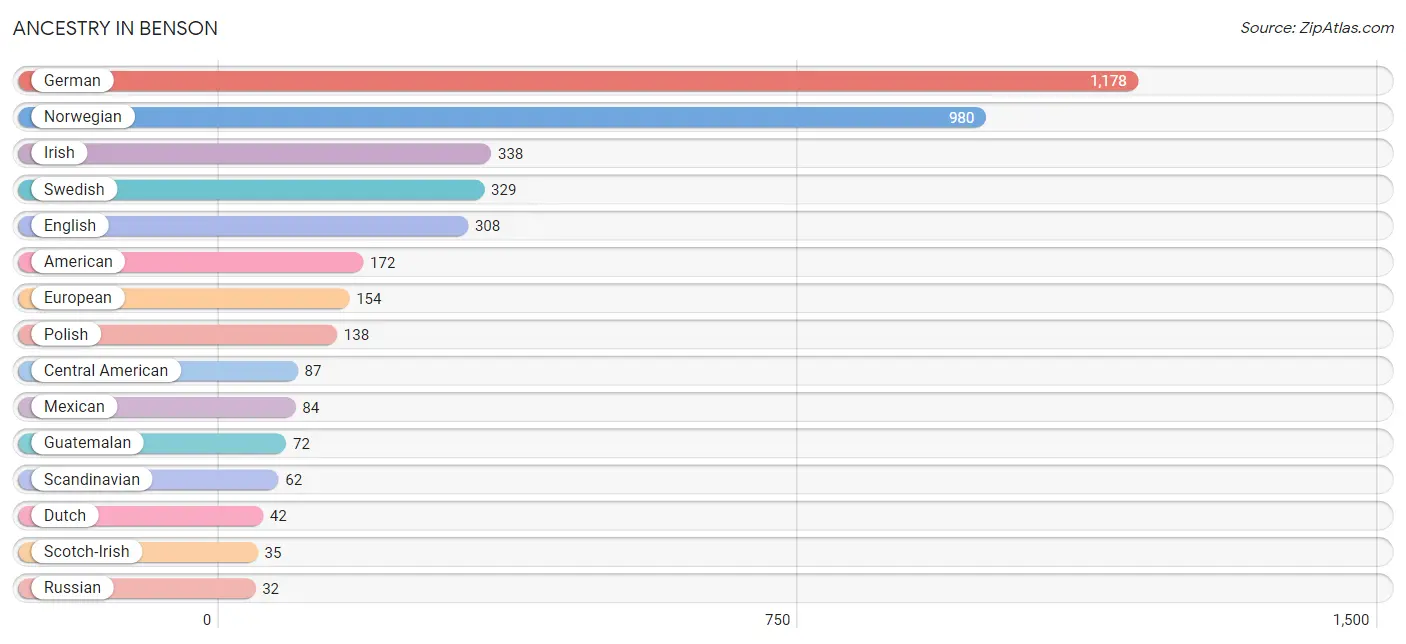
| Ancestry | # Population | % Population |
| American | 172 | 5.0% |
| Belgian | 26 | 0.7% |
| Bolivian | 1 | 0.0% |
| Central American | 87 | 2.5% |
| Chippewa | 1 | 0.0% |
| Costa Rican | 15 | 0.4% |
| Creek | 4 | 0.1% |
| Czech | 12 | 0.4% |
| Danish | 25 | 0.7% |
| Dutch | 42 | 1.2% |
| English | 308 | 8.9% |
| European | 154 | 4.5% |
| Finnish | 8 | 0.2% |
| French | 29 | 0.8% |
| French Canadian | 6 | 0.2% |
| German | 1,178 | 34.1% |
| Guatemalan | 72 | 2.1% |
| Hungarian | 8 | 0.2% |
| Irish | 338 | 9.8% |
| Italian | 6 | 0.2% |
| Luxembourger | 13 | 0.4% |
| Mexican | 84 | 2.4% |
| Norwegian | 980 | 28.4% |
| Polish | 138 | 4.0% |
| Russian | 32 | 0.9% |
| Scandinavian | 62 | 1.8% |
| Scotch-Irish | 35 | 1.0% |
| Scottish | 5 | 0.1% |
| Serbian | 20 | 0.6% |
| South American | 1 | 0.0% |
| Spanish | 8 | 0.2% |
| Swedish | 329 | 9.5% |
| Welsh | 4 | 0.1% | View All 33 Rows |
Immigrants in Benson
The most numerous immigrant groups reported in Benson came from Latin America (16 | 0.5%), Central America (15 | 0.4%), Costa Rica (15 | 0.4%), Canada (6 | 0.2%), and Bolivia (1 | 0.0%), together accounting for 1.5% of all Benson residents.
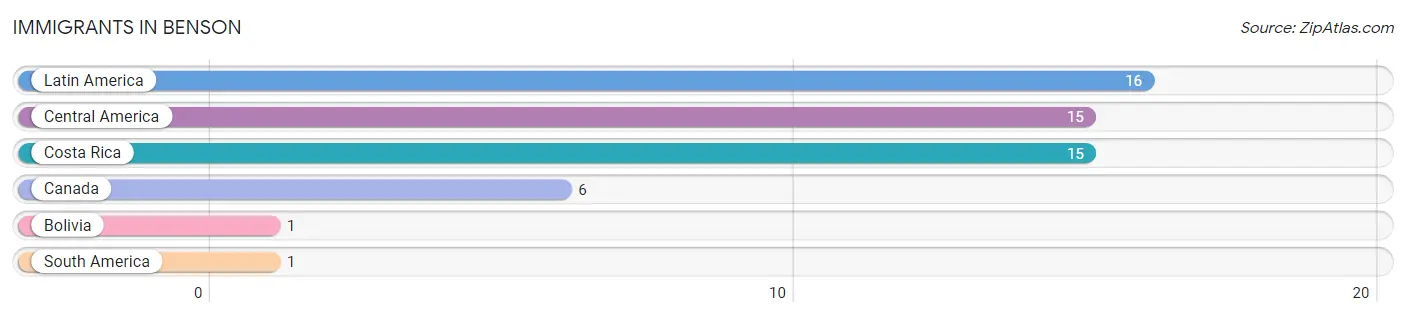
| Immigration Origin | # Population | % Population |
| Bolivia | 1 | 0.0% |
| Canada | 6 | 0.2% |
| Central America | 15 | 0.4% |
| Costa Rica | 15 | 0.4% |
| Latin America | 16 | 0.5% |
| South America | 1 | 0.0% | View All 6 Rows |
Sex and Age in Benson
Sex and Age in Benson
The most populous age groups in Benson are 15 to 19 Years (232 | 13.5%) for men and 70 to 74 Years (132 | 7.6%) for women.
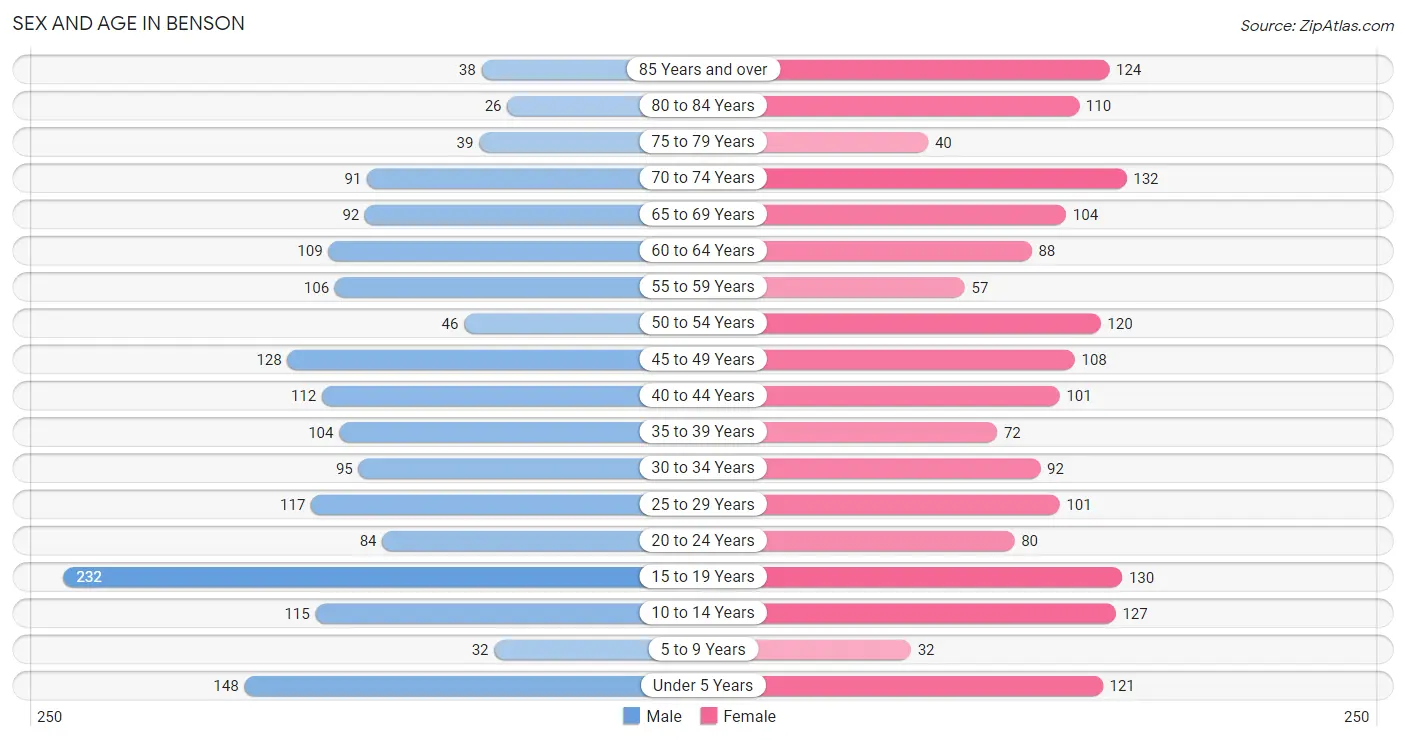
| Age Bracket | Male | Female |
| Under 5 Years | 148 (8.6%) | 121 (7.0%) |
| 5 to 9 Years | 32 (1.9%) | 32 (1.8%) |
| 10 to 14 Years | 115 (6.7%) | 127 (7.3%) |
| 15 to 19 Years | 232 (13.5%) | 130 (7.5%) |
| 20 to 24 Years | 84 (4.9%) | 80 (4.6%) |
| 25 to 29 Years | 117 (6.8%) | 101 (5.8%) |
| 30 to 34 Years | 95 (5.5%) | 92 (5.3%) |
| 35 to 39 Years | 104 (6.1%) | 72 (4.1%) |
| 40 to 44 Years | 112 (6.5%) | 101 (5.8%) |
| 45 to 49 Years | 128 (7.5%) | 108 (6.2%) |
| 50 to 54 Years | 46 (2.7%) | 120 (6.9%) |
| 55 to 59 Years | 106 (6.2%) | 57 (3.3%) |
| 60 to 64 Years | 109 (6.4%) | 88 (5.1%) |
| 65 to 69 Years | 92 (5.4%) | 104 (6.0%) |
| 70 to 74 Years | 91 (5.3%) | 132 (7.6%) |
| 75 to 79 Years | 39 (2.3%) | 40 (2.3%) |
| 80 to 84 Years | 26 (1.5%) | 110 (6.3%) |
| 85 Years and over | 38 (2.2%) | 124 (7.1%) |
| Total | 1,714 (100.0%) | 1,739 (100.0%) |
Families and Households in Benson
Median Family Size in Benson
The median family size in Benson is 2.76 persons per family, with married-couple families (616 | 62.6%) accounting for the largest median family size of 2.88 persons per family. On the other hand, single male/father families (168 | 17.1%) represent the smallest median family size with 2.42 persons per family.
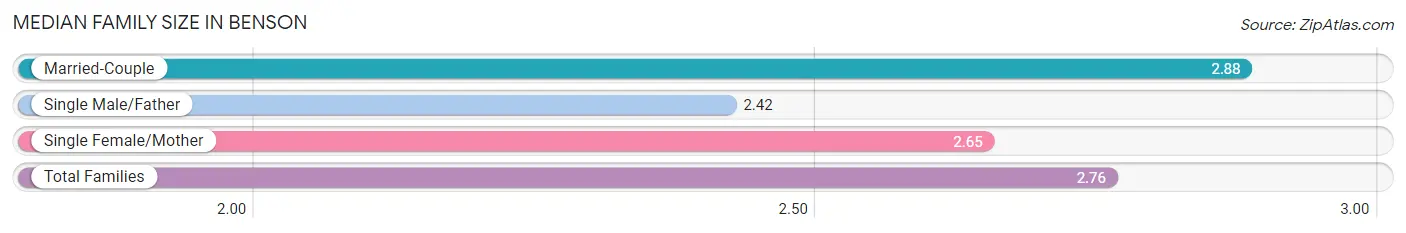
| Family Type | # Families | Family Size |
| Married-Couple | 616 (62.6%) | 2.88 |
| Single Male/Father | 168 (17.1%) | 2.42 |
| Single Female/Mother | 200 (20.3%) | 2.65 |
| Total Families | 984 (100.0%) | 2.76 |
Median Household Size in Benson
The median household size in Benson is 2.24 persons per household, with single female/mother households (200 | 13.5%) accounting for the largest median household size of 2.94 persons per household. non-family households (502 | 33.8%) represent the smallest median household size with 1.10 persons per household.
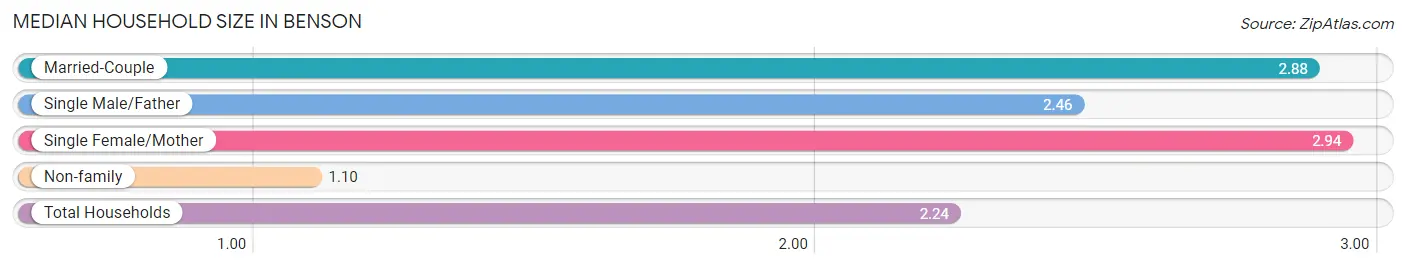
| Household Type | # Households | Household Size |
| Married-Couple | 616 (41.4%) | 2.88 |
| Single Male/Father | 168 (11.3%) | 2.46 |
| Single Female/Mother | 200 (13.5%) | 2.94 |
| Non-family | 502 (33.8%) | 1.10 |
| Total Households | 1,486 (100.0%) | 2.24 |
Household Size by Marriage Status in Benson
Out of a total of 1,486 households in Benson, 984 (66.2%) are family households, while 502 (33.8%) are nonfamily households. The most numerous type of family households are 2-person households, comprising 467, and the most common type of nonfamily households are 1-person households, comprising 452.
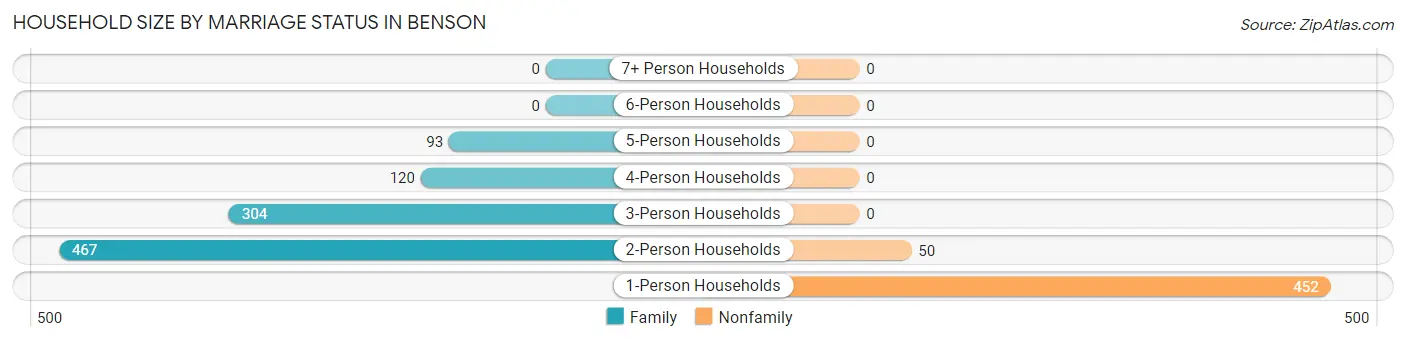
| Household Size | Family Households | Nonfamily Households |
| 1-Person Households | - | 452 (30.4%) |
| 2-Person Households | 467 (31.4%) | 50 (3.4%) |
| 3-Person Households | 304 (20.5%) | 0 (0.0%) |
| 4-Person Households | 120 (8.1%) | 0 (0.0%) |
| 5-Person Households | 93 (6.3%) | 0 (0.0%) |
| 6-Person Households | 0 (0.0%) | 0 (0.0%) |
| 7+ Person Households | 0 (0.0%) | 0 (0.0%) |
| Total | 984 (66.2%) | 502 (33.8%) |
Female Fertility in Benson
Fertility by Age in Benson
Average fertility rate in Benson is 123.0 births per 1,000 women. Women in the age bracket of 20 to 34 years have the highest fertility rate with 216.0 births per 1,000 women. Women in the age bracket of 20 to 34 years acount for 67.0% of all women with births.
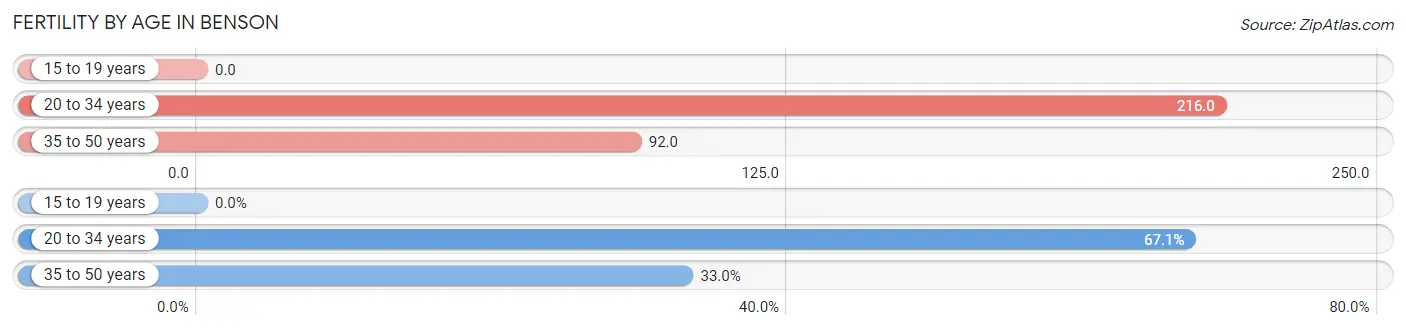
| Age Bracket | Women with Births | Births / 1,000 Women |
| 15 to 19 years | 0 (0.0%) | 0.0 |
| 20 to 34 years | 59 (67.0%) | 216.0 |
| 35 to 50 years | 29 (33.0%) | 92.0 |
| Total | 88 (100.0%) | 123.0 |
Fertility by Age by Marriage Status in Benson
81.8% of women with births (88) in Benson are married. The highest percentage of unmarried women with births falls into 35 to 50 years age bracket with 55.2% of them unmarried at the time of birth, while the lowest percentage of unmarried women with births belong to 20 to 34 years age bracket with 0.0% of them unmarried.
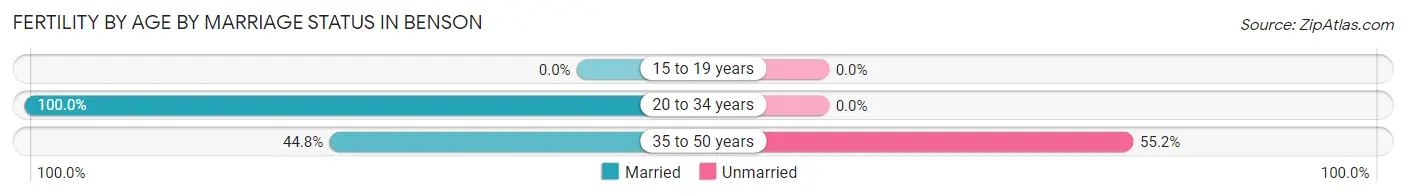
| Age Bracket | Married | Unmarried |
| 15 to 19 years | 0 (0.0%) | 0 (0.0%) |
| 20 to 34 years | 59 (100.0%) | 0 (0.0%) |
| 35 to 50 years | 13 (44.8%) | 16 (55.2%) |
| Total | 72 (81.8%) | 16 (18.2%) |
Fertility by Education in Benson
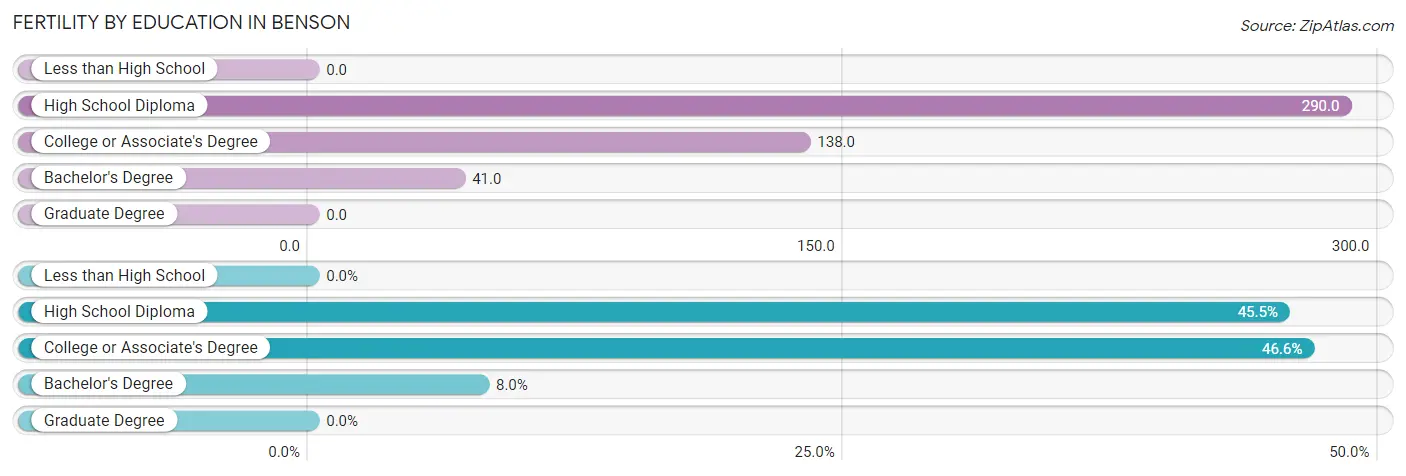
| Educational Attainment | Women with Births | Births / 1,000 Women |
| Less than High School | 0 (0.0%) | 0.0 |
| High School Diploma | 40 (45.5%) | 290.0 |
| College or Associate's Degree | 41 (46.6%) | 138.0 |
| Bachelor's Degree | 7 (8.0%) | 41.0 |
| Graduate Degree | 0 (0.0%) | 0.0 |
| Total | 88 (100.0%) | 123.0 |
Fertility by Education by Marriage Status in Benson
18.2% of women with births in Benson are unmarried. Women with the educational attainment of high school diploma are most likely to be married with 100.0% of them married at childbirth, while women with the educational attainment of college or associate's degree are least likely to be married with 39.0% of them unmarried at childbirth.
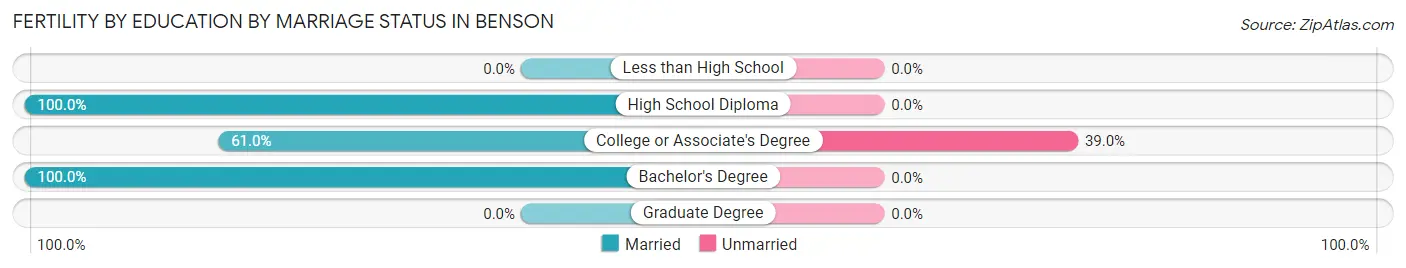
| Educational Attainment | Married | Unmarried |
| Less than High School | 0 (0.0%) | 0 (0.0%) |
| High School Diploma | 40 (100.0%) | 0 (0.0%) |
| College or Associate's Degree | 25 (61.0%) | 16 (39.0%) |
| Bachelor's Degree | 7 (100.0%) | 0 (0.0%) |
| Graduate Degree | 0 (0.0%) | 0 (0.0%) |
| Total | 72 (81.8%) | 16 (18.2%) |
Employment Characteristics in Benson
Employment by Class of Employer in Benson
Among the 1,589 employed individuals in Benson, private company employees (826 | 52.0%), not-for-profit organizations (250 | 15.7%), and local government employees (204 | 12.8%) make up the most common classes of employment.
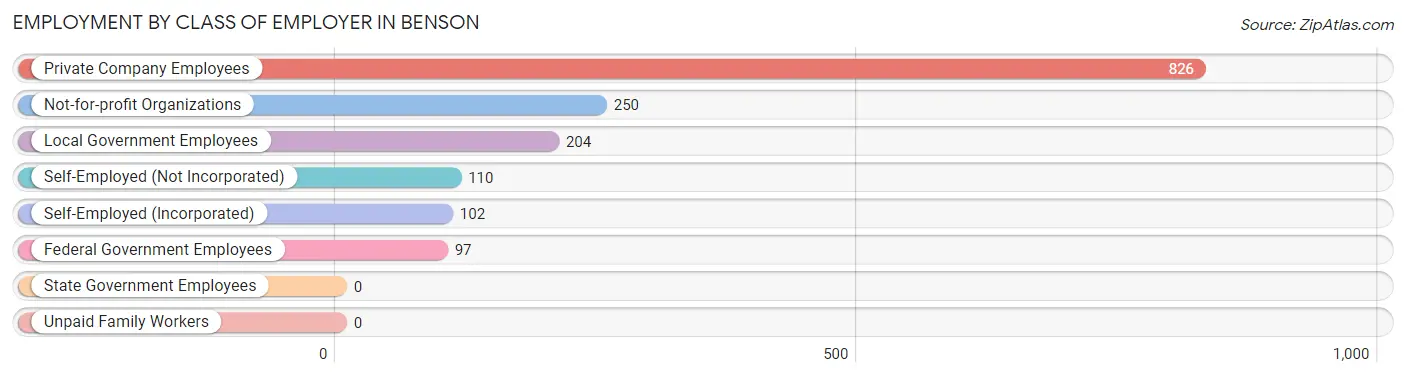
| Employer Class | # Employees | % Employees |
| Private Company Employees | 826 | 52.0% |
| Self-Employed (Incorporated) | 102 | 6.4% |
| Self-Employed (Not Incorporated) | 110 | 6.9% |
| Not-for-profit Organizations | 250 | 15.7% |
| Local Government Employees | 204 | 12.8% |
| State Government Employees | 0 | 0.0% |
| Federal Government Employees | 97 | 6.1% |
| Unpaid Family Workers | 0 | 0.0% |
| Total | 1,589 | 100.0% |
Employment Status by Age in Benson
According to the labor force statistics for Benson, out of the total population over 16 years of age (2,800), 59.0% or 1,652 individuals are in the labor force, with 2.5% or 41 of them unemployed. The age group with the highest labor force participation rate is 20 to 24 years, with 98.8% or 162 individuals in the labor force. Within the labor force, the 20 to 24 years age range has the highest percentage of unemployed individuals, with 17.9% or 29 of them being unemployed.
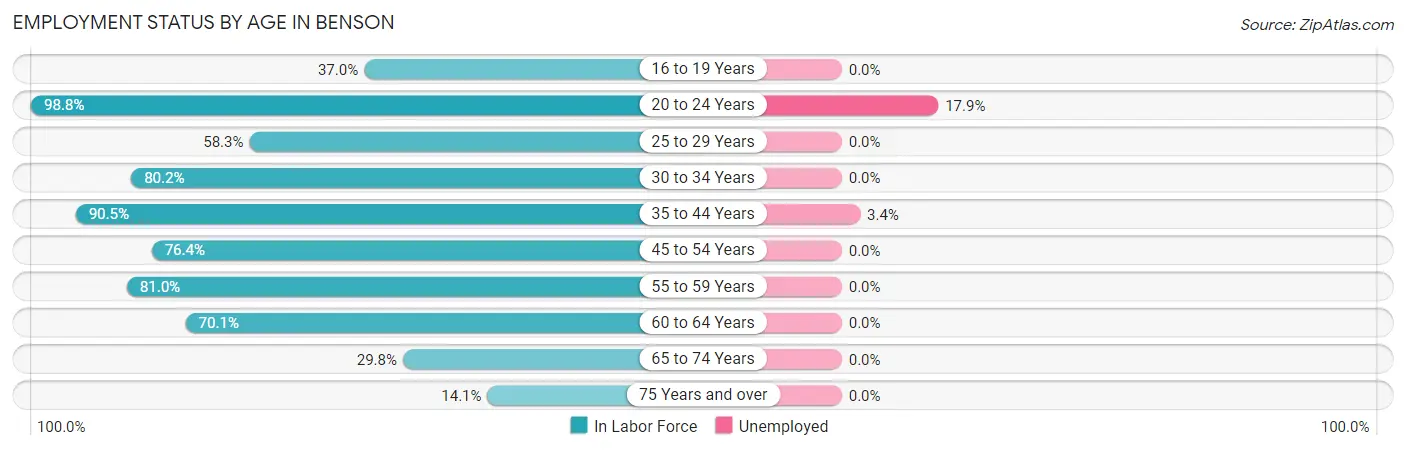
| Age Bracket | In Labor Force | Unemployed |
| 16 to 19 Years | 105 (37.0%) | 0 (0.0%) |
| 20 to 24 Years | 162 (98.8%) | 29 (17.9%) |
| 25 to 29 Years | 127 (58.3%) | 0 (0.0%) |
| 30 to 34 Years | 150 (80.2%) | 0 (0.0%) |
| 35 to 44 Years | 352 (90.5%) | 12 (3.4%) |
| 45 to 54 Years | 307 (76.4%) | 0 (0.0%) |
| 55 to 59 Years | 132 (81.0%) | 0 (0.0%) |
| 60 to 64 Years | 138 (70.1%) | 0 (0.0%) |
| 65 to 74 Years | 125 (29.8%) | 0 (0.0%) |
| 75 Years and over | 53 (14.1%) | 0 (0.0%) |
| Total | 1,652 (59.0%) | 41 (2.5%) |
Employment Status by Educational Attainment in Benson
According to labor force statistics for Benson, 77.5% of individuals (1,206) out of the total population between 25 and 64 years of age (1,556) are in the labor force, with 1.0% or 12 of them being unemployed. The group with the highest labor force participation rate are those with the educational attainment of bachelor's degree or higher, with 86.0% or 484 individuals in the labor force. Within the labor force, individuals with college / associate degree education have the highest percentage of unemployment, with 2.7% or 12 of them being unemployed.
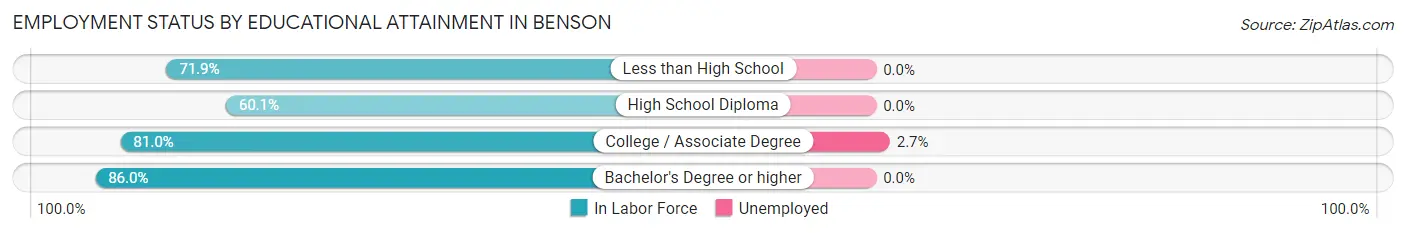
| Educational Attainment | In Labor Force | Unemployed |
| Less than High School | 41 (71.9%) | 0 (0.0%) |
| High School Diploma | 221 (60.1%) | 0 (0.0%) |
| College / Associate Degree | 460 (81.0%) | 15 (2.7%) |
| Bachelor's Degree or higher | 484 (86.0%) | 0 (0.0%) |
| Total | 1,206 (77.5%) | 16 (1.0%) |
Employment Occupations by Sex in Benson
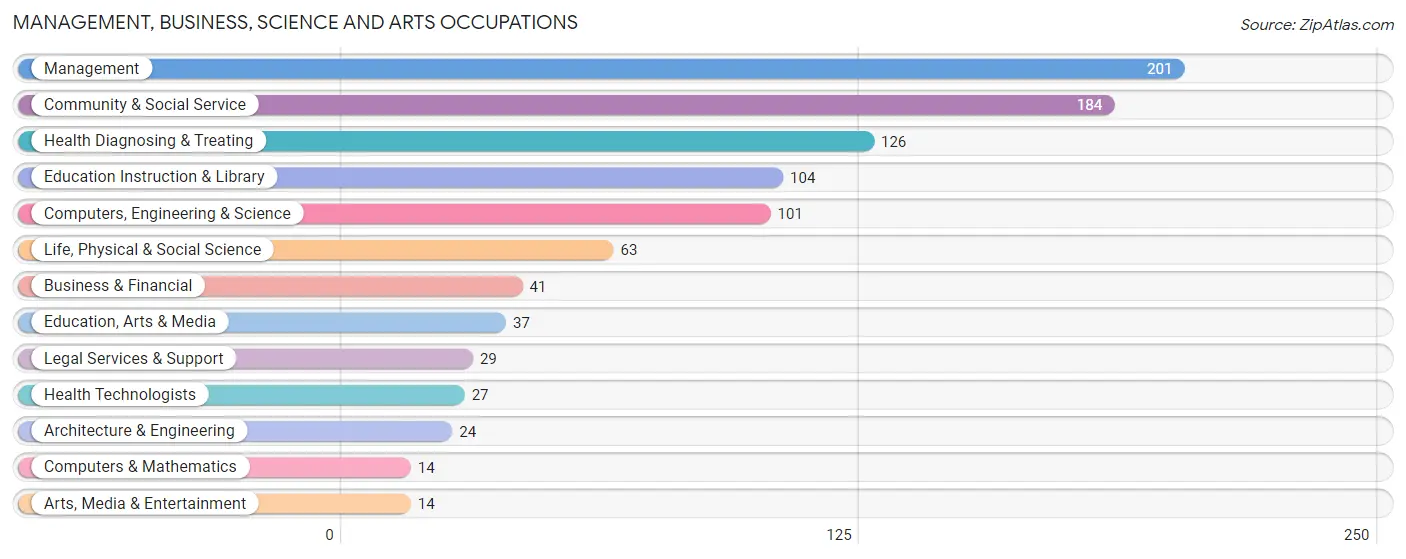
Management, Business, Science and Arts Occupations
The most common Management, Business, Science and Arts occupations in Benson are Management (201 | 12.6%), Community & Social Service (184 | 11.5%), Health Diagnosing & Treating (126 | 7.9%), Education Instruction & Library (104 | 6.5%), and Computers, Engineering & Science (101 | 6.3%).
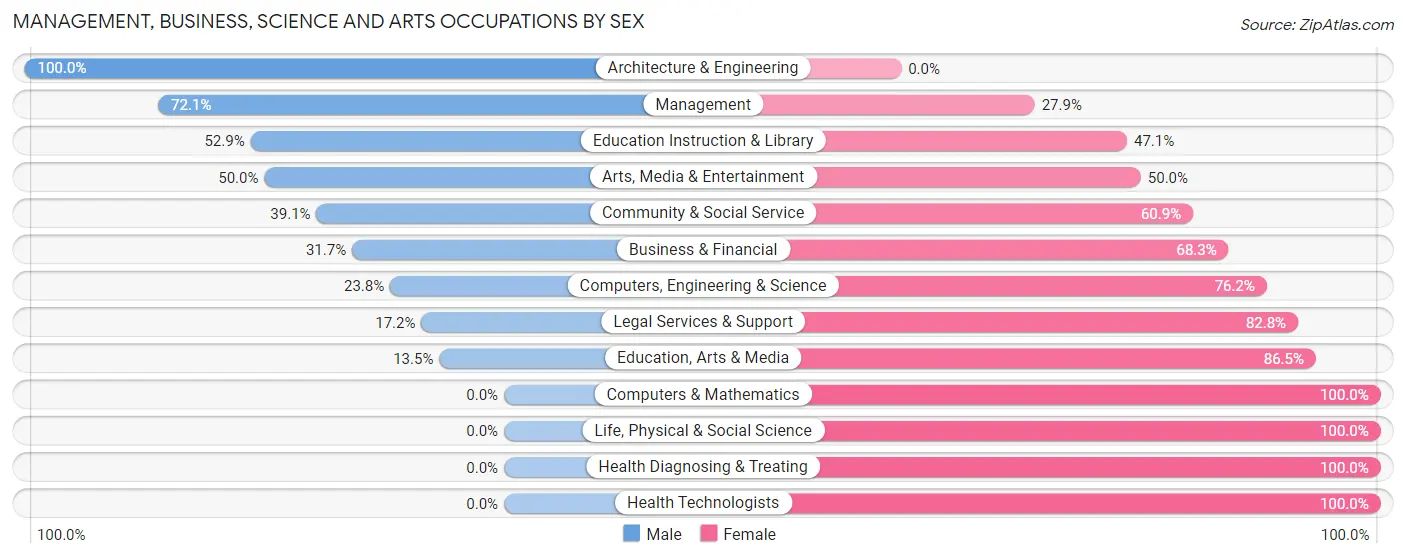
Management, Business, Science and Arts Occupations by Sex
Within the Management, Business, Science and Arts occupations in Benson, the most male-oriented occupations are Architecture & Engineering (100.0%), Management (72.1%), and Education Instruction & Library (52.9%), while the most female-oriented occupations are Computers & Mathematics (100.0%), Life, Physical & Social Science (100.0%), and Health Diagnosing & Treating (100.0%).
| Occupation | Male | Female |
| Management | 145 (72.1%) | 56 (27.9%) |
| Business & Financial | 13 (31.7%) | 28 (68.3%) |
| Computers, Engineering & Science | 24 (23.8%) | 77 (76.2%) |
| Computers & Mathematics | 0 (0.0%) | 14 (100.0%) |
| Architecture & Engineering | 24 (100.0%) | 0 (0.0%) |
| Life, Physical & Social Science | 0 (0.0%) | 63 (100.0%) |
| Community & Social Service | 72 (39.1%) | 112 (60.9%) |
| Education, Arts & Media | 5 (13.5%) | 32 (86.5%) |
| Legal Services & Support | 5 (17.2%) | 24 (82.8%) |
| Education Instruction & Library | 55 (52.9%) | 49 (47.1%) |
| Arts, Media & Entertainment | 7 (50.0%) | 7 (50.0%) |
| Health Diagnosing & Treating | 0 (0.0%) | 126 (100.0%) |
| Health Technologists | 0 (0.0%) | 27 (100.0%) |
| Total (Category) | 254 (38.9%) | 399 (61.1%) |
| Total (Overall) | 811 (50.7%) | 789 (49.3%) |
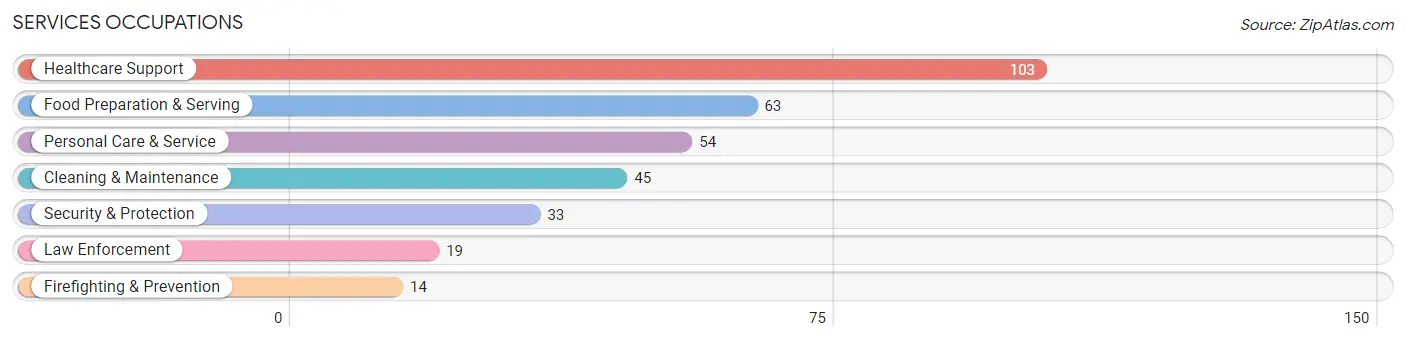
Services Occupations
The most common Services occupations in Benson are Healthcare Support (103 | 6.4%), Food Preparation & Serving (63 | 3.9%), Personal Care & Service (54 | 3.4%), Cleaning & Maintenance (45 | 2.8%), and Security & Protection (33 | 2.1%).
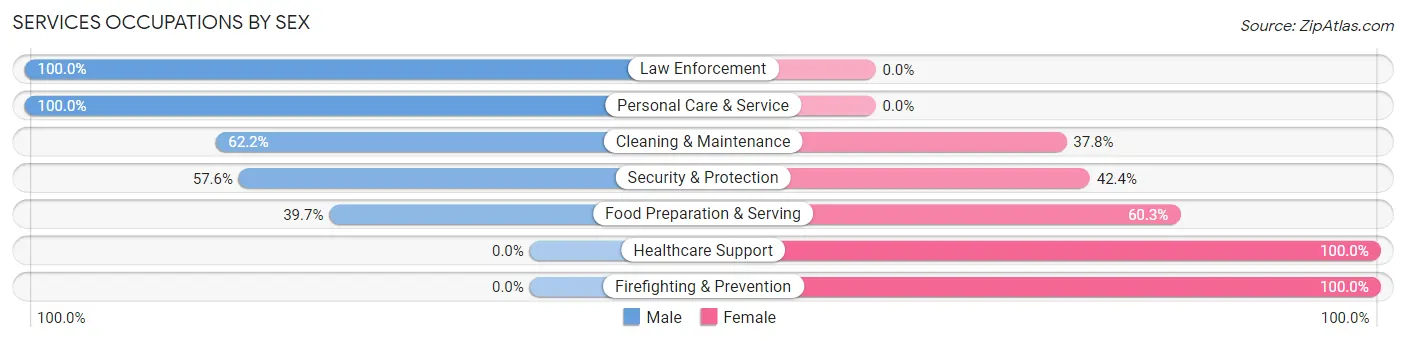
Services Occupations by Sex
Within the Services occupations in Benson, the most male-oriented occupations are Law Enforcement (100.0%), Personal Care & Service (100.0%), and Cleaning & Maintenance (62.2%), while the most female-oriented occupations are Healthcare Support (100.0%), Firefighting & Prevention (100.0%), and Food Preparation & Serving (60.3%).
| Occupation | Male | Female |
| Healthcare Support | 0 (0.0%) | 103 (100.0%) |
| Security & Protection | 19 (57.6%) | 14 (42.4%) |
| Firefighting & Prevention | 0 (0.0%) | 14 (100.0%) |
| Law Enforcement | 19 (100.0%) | 0 (0.0%) |
| Food Preparation & Serving | 25 (39.7%) | 38 (60.3%) |
| Cleaning & Maintenance | 28 (62.2%) | 17 (37.8%) |
| Personal Care & Service | 54 (100.0%) | 0 (0.0%) |
| Total (Category) | 126 (42.3%) | 172 (57.7%) |
| Total (Overall) | 811 (50.7%) | 789 (49.3%) |
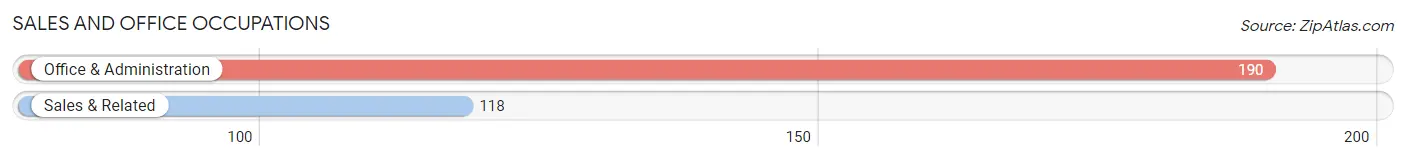
Sales and Office Occupations
The most common Sales and Office occupations in Benson are Office & Administration (190 | 11.9%), and Sales & Related (118 | 7.4%).
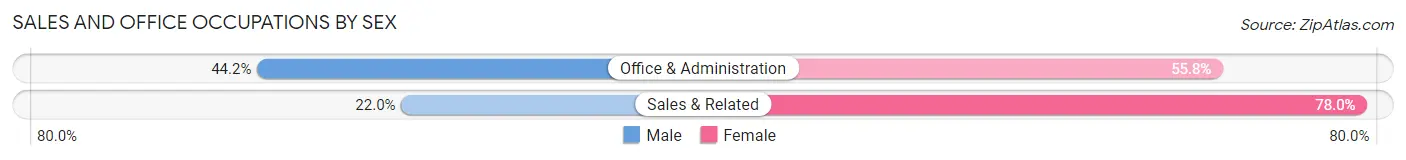
Sales and Office Occupations by Sex
| Occupation | Male | Female |
| Sales & Related | 26 (22.0%) | 92 (78.0%) |
| Office & Administration | 84 (44.2%) | 106 (55.8%) |
| Total (Category) | 110 (35.7%) | 198 (64.3%) |
| Total (Overall) | 811 (50.7%) | 789 (49.3%) |
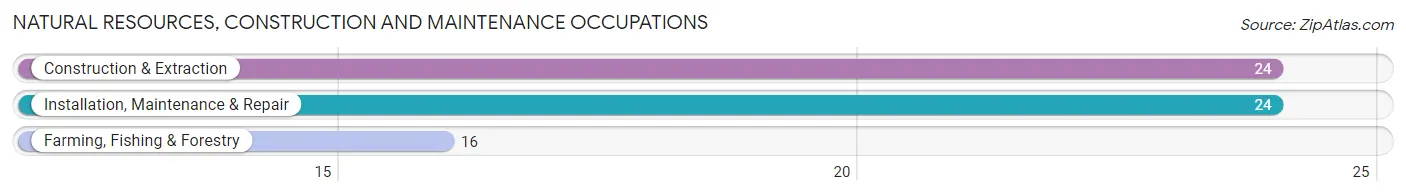
Natural Resources, Construction and Maintenance Occupations
The most common Natural Resources, Construction and Maintenance occupations in Benson are Construction & Extraction (24 | 1.5%), Installation, Maintenance & Repair (24 | 1.5%), and Farming, Fishing & Forestry (16 | 1.0%).
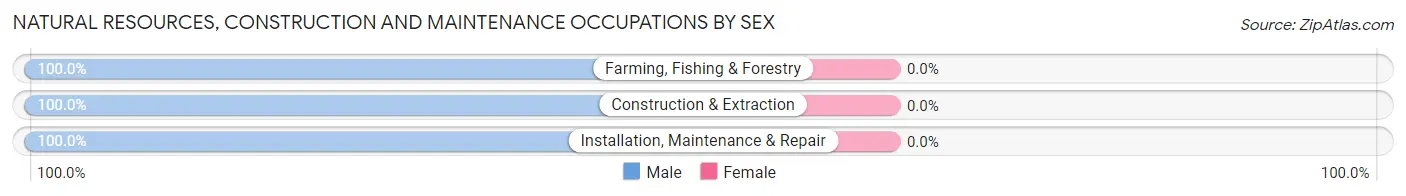
Natural Resources, Construction and Maintenance Occupations by Sex
| Occupation | Male | Female |
| Farming, Fishing & Forestry | 16 (100.0%) | 0 (0.0%) |
| Construction & Extraction | 24 (100.0%) | 0 (0.0%) |
| Installation, Maintenance & Repair | 24 (100.0%) | 0 (0.0%) |
| Total (Category) | 64 (100.0%) | 0 (0.0%) |
| Total (Overall) | 811 (50.7%) | 789 (49.3%) |
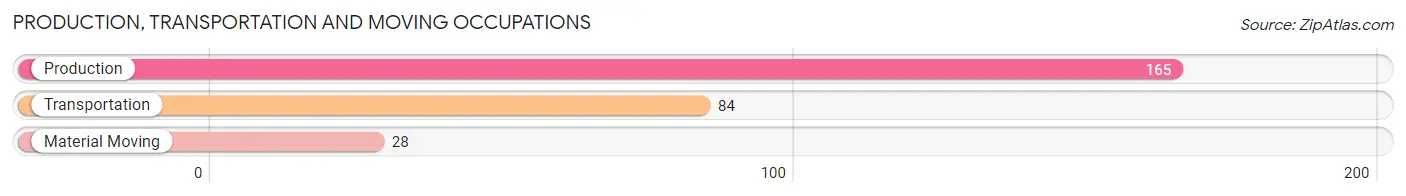
Production, Transportation and Moving Occupations
The most common Production, Transportation and Moving occupations in Benson are Production (165 | 10.3%), Transportation (84 | 5.2%), and Material Moving (28 | 1.8%).
Production, Transportation and Moving Occupations by Sex
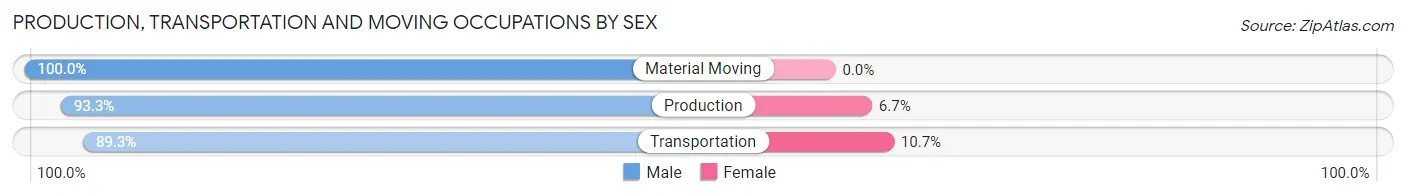
| Occupation | Male | Female |
| Production | 154 (93.3%) | 11 (6.7%) |
| Transportation | 75 (89.3%) | 9 (10.7%) |
| Material Moving | 28 (100.0%) | 0 (0.0%) |
| Total (Category) | 257 (92.8%) | 20 (7.2%) |
| Total (Overall) | 811 (50.7%) | 789 (49.3%) |
Employment Industries by Sex in Benson
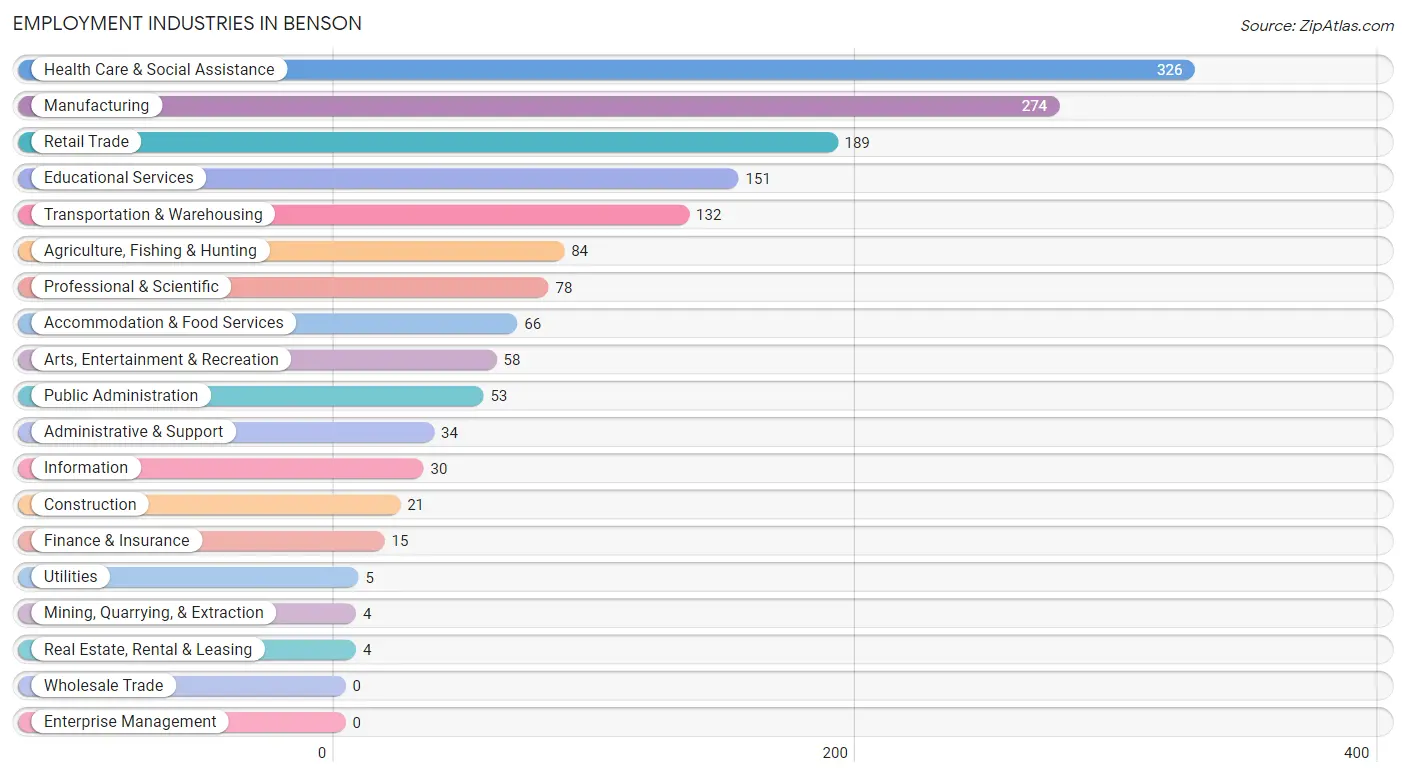
Employment Industries in Benson
The major employment industries in Benson include Health Care & Social Assistance (326 | 20.4%), Manufacturing (274 | 17.1%), Retail Trade (189 | 11.8%), Educational Services (151 | 9.4%), and Transportation & Warehousing (132 | 8.3%).
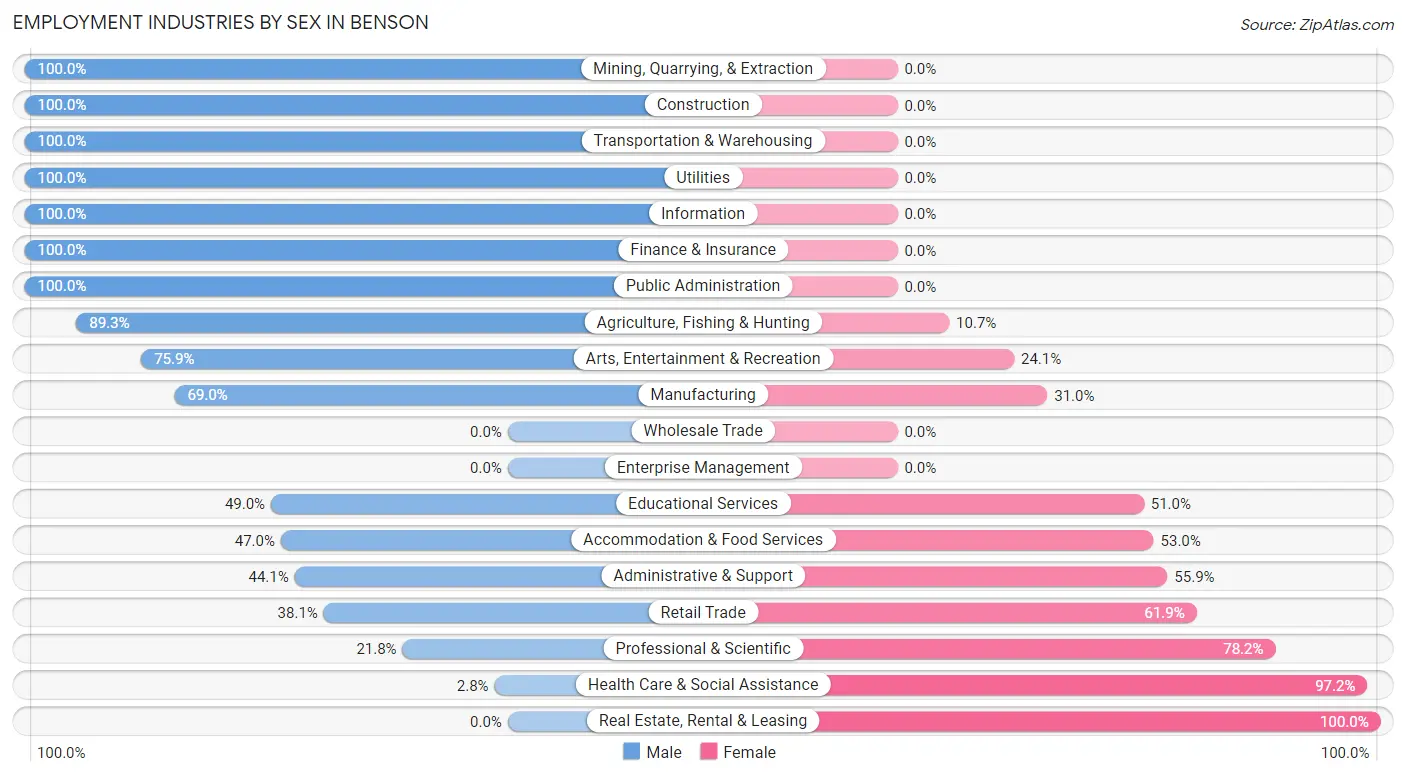
Employment Industries by Sex in Benson
The Benson industries that see more men than women are Mining, Quarrying, & Extraction (100.0%), Construction (100.0%), and Transportation & Warehousing (100.0%), whereas the industries that tend to have a higher number of women are Real Estate, Rental & Leasing (100.0%), Health Care & Social Assistance (97.2%), and Professional & Scientific (78.2%).
| Industry | Male | Female |
| Agriculture, Fishing & Hunting | 75 (89.3%) | 9 (10.7%) |
| Mining, Quarrying, & Extraction | 4 (100.0%) | 0 (0.0%) |
| Construction | 21 (100.0%) | 0 (0.0%) |
| Manufacturing | 189 (69.0%) | 85 (31.0%) |
| Wholesale Trade | 0 (0.0%) | 0 (0.0%) |
| Retail Trade | 72 (38.1%) | 117 (61.9%) |
| Transportation & Warehousing | 132 (100.0%) | 0 (0.0%) |
| Utilities | 5 (100.0%) | 0 (0.0%) |
| Information | 30 (100.0%) | 0 (0.0%) |
| Finance & Insurance | 15 (100.0%) | 0 (0.0%) |
| Real Estate, Rental & Leasing | 0 (0.0%) | 4 (100.0%) |
| Professional & Scientific | 17 (21.8%) | 61 (78.2%) |
| Enterprise Management | 0 (0.0%) | 0 (0.0%) |
| Administrative & Support | 15 (44.1%) | 19 (55.9%) |
| Educational Services | 74 (49.0%) | 77 (51.0%) |
| Health Care & Social Assistance | 9 (2.8%) | 317 (97.2%) |
| Arts, Entertainment & Recreation | 44 (75.9%) | 14 (24.1%) |
| Accommodation & Food Services | 31 (47.0%) | 35 (53.0%) |
| Public Administration | 53 (100.0%) | 0 (0.0%) |
| Total | 811 (50.7%) | 789 (49.3%) |
Education in Benson
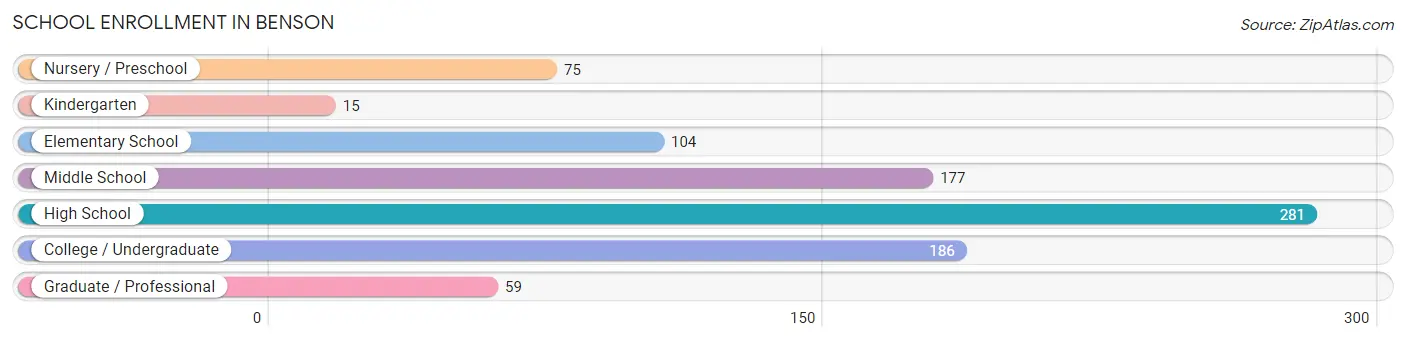
School Enrollment in Benson
The most common levels of schooling among the 897 students in Benson are high school (281 | 31.3%), college / undergraduate (186 | 20.7%), and middle school (177 | 19.7%).
| School Level | # Students | % Students |
| Nursery / Preschool | 75 | 8.4% |
| Kindergarten | 15 | 1.7% |
| Elementary School | 104 | 11.6% |
| Middle School | 177 | 19.7% |
| High School | 281 | 31.3% |
| College / Undergraduate | 186 | 20.7% |
| Graduate / Professional | 59 | 6.6% |
| Total | 897 | 100.0% |
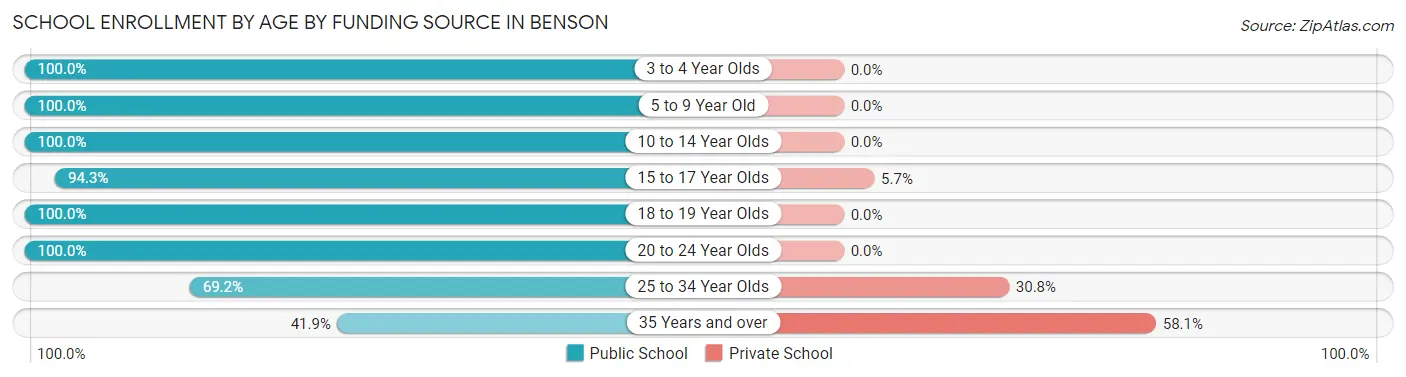
School Enrollment by Age by Funding Source in Benson
Out of a total of 897 students who are enrolled in schools in Benson, 62 (6.9%) attend a private institution, while the remaining 835 (93.1%) are enrolled in public schools. The age group of 35 years and over has the highest likelihood of being enrolled in private schools, with 25 (58.1% in the age bracket) enrolled. Conversely, the age group of 3 to 4 year olds has the lowest likelihood of being enrolled in a private school, with 75 (100.0% in the age bracket) attending a public institution.
| Age Bracket | Public School | Private School |
| 3 to 4 Year Olds | 75 (100.0%) | 0 (0.0%) |
| 5 to 9 Year Old | 64 (100.0%) | 0 (0.0%) |
| 10 to 14 Year Olds | 242 (100.0%) | 0 (0.0%) |
| 15 to 17 Year Olds | 216 (94.3%) | 13 (5.7%) |
| 18 to 19 Year Olds | 90 (100.0%) | 0 (0.0%) |
| 20 to 24 Year Olds | 76 (100.0%) | 0 (0.0%) |
| 25 to 34 Year Olds | 54 (69.2%) | 24 (30.8%) |
| 35 Years and over | 18 (41.9%) | 25 (58.1%) |
| Total | 835 (93.1%) | 62 (6.9%) |
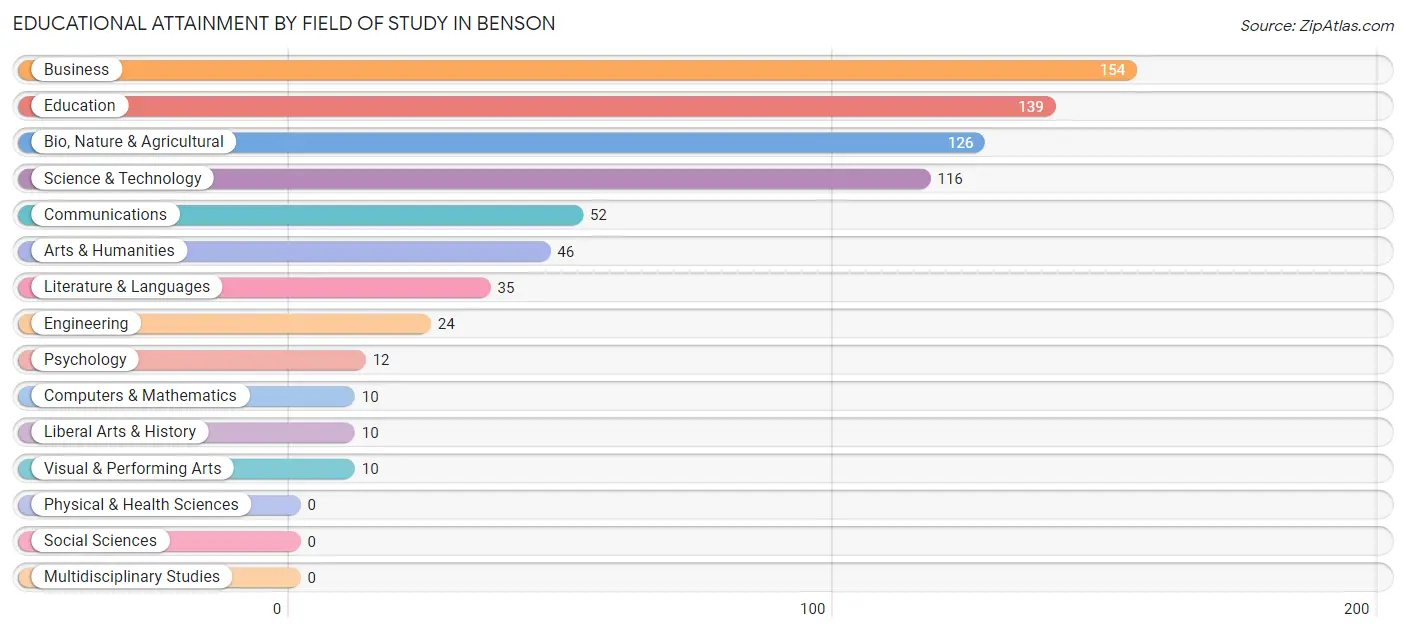
Educational Attainment by Field of Study in Benson
Business (154 | 21.0%), education (139 | 18.9%), bio, nature & agricultural (126 | 17.2%), science & technology (116 | 15.8%), and communications (52 | 7.1%) are the most common fields of study among 734 individuals in Benson who have obtained a bachelor's degree or higher.
| Field of Study | # Graduates | % Graduates |
| Computers & Mathematics | 10 | 1.4% |
| Bio, Nature & Agricultural | 126 | 17.2% |
| Physical & Health Sciences | 0 | 0.0% |
| Psychology | 12 | 1.6% |
| Social Sciences | 0 | 0.0% |
| Engineering | 24 | 3.3% |
| Multidisciplinary Studies | 0 | 0.0% |
| Science & Technology | 116 | 15.8% |
| Business | 154 | 21.0% |
| Education | 139 | 18.9% |
| Literature & Languages | 35 | 4.8% |
| Liberal Arts & History | 10 | 1.4% |
| Visual & Performing Arts | 10 | 1.4% |
| Communications | 52 | 7.1% |
| Arts & Humanities | 46 | 6.3% |
| Total | 734 | 100.0% |
Transportation & Commute in Benson
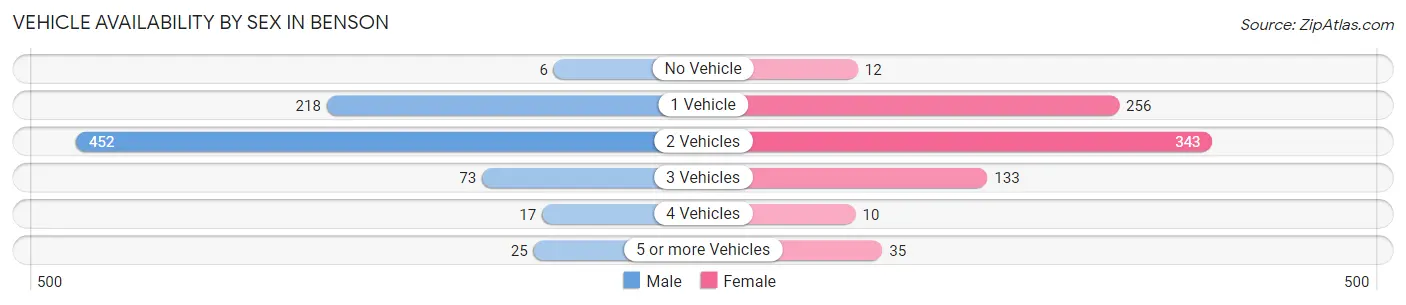
Vehicle Availability by Sex in Benson
The most prevalent vehicle ownership categories in Benson are males with 2 vehicles (452, accounting for 57.1%) and females with 2 vehicles (343, making up 57.3%).
| Vehicles Available | Male | Female |
| No Vehicle | 6 (0.8%) | 12 (1.5%) |
| 1 Vehicle | 218 (27.6%) | 256 (32.5%) |
| 2 Vehicles | 452 (57.1%) | 343 (43.5%) |
| 3 Vehicles | 73 (9.2%) | 133 (16.9%) |
| 4 Vehicles | 17 (2.1%) | 10 (1.3%) |
| 5 or more Vehicles | 25 (3.2%) | 35 (4.4%) |
| Total | 791 (100.0%) | 789 (100.0%) |
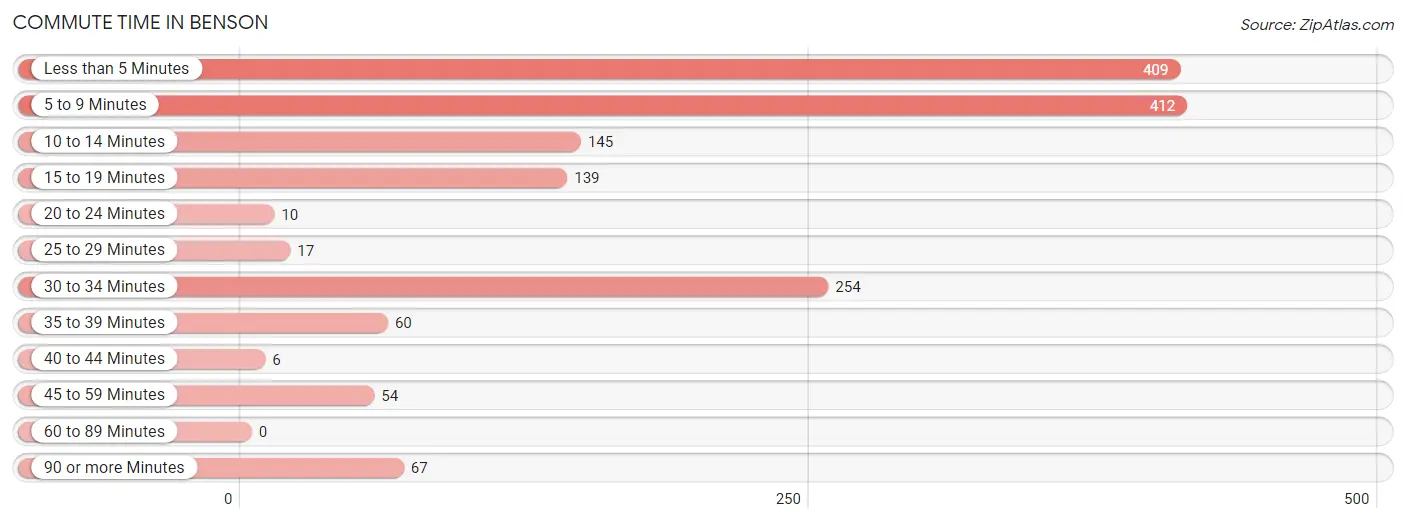
Commute Time in Benson
The most frequently occuring commute durations in Benson are 5 to 9 minutes (412 commuters, 26.2%), less than 5 minutes (409 commuters, 26.0%), and 30 to 34 minutes (254 commuters, 16.2%).
| Commute Time | # Commuters | % Commuters |
| Less than 5 Minutes | 409 | 26.0% |
| 5 to 9 Minutes | 412 | 26.2% |
| 10 to 14 Minutes | 145 | 9.2% |
| 15 to 19 Minutes | 139 | 8.8% |
| 20 to 24 Minutes | 10 | 0.6% |
| 25 to 29 Minutes | 17 | 1.1% |
| 30 to 34 Minutes | 254 | 16.2% |
| 35 to 39 Minutes | 60 | 3.8% |
| 40 to 44 Minutes | 6 | 0.4% |
| 45 to 59 Minutes | 54 | 3.4% |
| 60 to 89 Minutes | 0 | 0.0% |
| 90 or more Minutes | 67 | 4.3% |
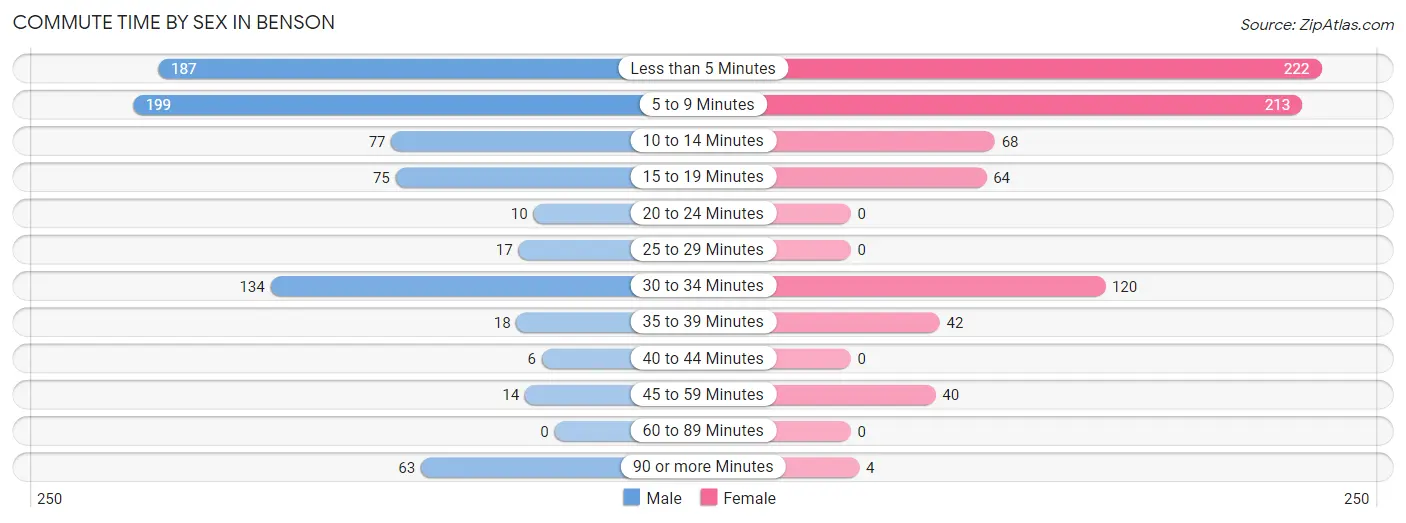
Commute Time by Sex in Benson
The most common commute times in Benson are 5 to 9 minutes (199 commuters, 24.9%) for males and less than 5 minutes (222 commuters, 28.7%) for females.
| Commute Time | Male | Female |
| Less than 5 Minutes | 187 (23.4%) | 222 (28.7%) |
| 5 to 9 Minutes | 199 (24.9%) | 213 (27.6%) |
| 10 to 14 Minutes | 77 (9.6%) | 68 (8.8%) |
| 15 to 19 Minutes | 75 (9.4%) | 64 (8.3%) |
| 20 to 24 Minutes | 10 (1.3%) | 0 (0.0%) |
| 25 to 29 Minutes | 17 (2.1%) | 0 (0.0%) |
| 30 to 34 Minutes | 134 (16.8%) | 120 (15.5%) |
| 35 to 39 Minutes | 18 (2.2%) | 42 (5.4%) |
| 40 to 44 Minutes | 6 (0.7%) | 0 (0.0%) |
| 45 to 59 Minutes | 14 (1.8%) | 40 (5.2%) |
| 60 to 89 Minutes | 0 (0.0%) | 0 (0.0%) |
| 90 or more Minutes | 63 (7.9%) | 4 (0.5%) |
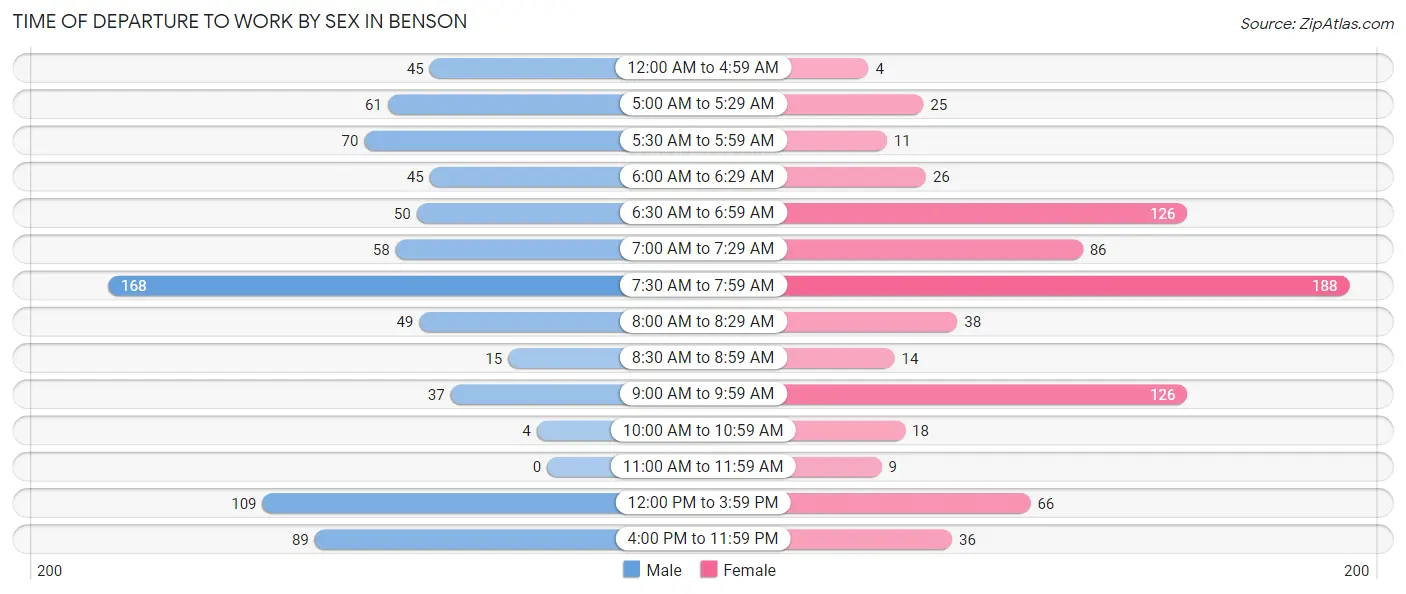
Time of Departure to Work by Sex in Benson
The most frequent times of departure to work in Benson are 7:30 AM to 7:59 AM (168, 21.0%) for males and 7:30 AM to 7:59 AM (188, 24.3%) for females.
| Time of Departure | Male | Female |
| 12:00 AM to 4:59 AM | 45 (5.6%) | 4 (0.5%) |
| 5:00 AM to 5:29 AM | 61 (7.6%) | 25 (3.2%) |
| 5:30 AM to 5:59 AM | 70 (8.7%) | 11 (1.4%) |
| 6:00 AM to 6:29 AM | 45 (5.6%) | 26 (3.4%) |
| 6:30 AM to 6:59 AM | 50 (6.2%) | 126 (16.3%) |
| 7:00 AM to 7:29 AM | 58 (7.2%) | 86 (11.1%) |
| 7:30 AM to 7:59 AM | 168 (21.0%) | 188 (24.3%) |
| 8:00 AM to 8:29 AM | 49 (6.1%) | 38 (4.9%) |
| 8:30 AM to 8:59 AM | 15 (1.9%) | 14 (1.8%) |
| 9:00 AM to 9:59 AM | 37 (4.6%) | 126 (16.3%) |
| 10:00 AM to 10:59 AM | 4 (0.5%) | 18 (2.3%) |
| 11:00 AM to 11:59 AM | 0 (0.0%) | 9 (1.2%) |
| 12:00 PM to 3:59 PM | 109 (13.6%) | 66 (8.5%) |
| 4:00 PM to 11:59 PM | 89 (11.1%) | 36 (4.7%) |
| Total | 800 (100.0%) | 773 (100.0%) |
Housing Occupancy in Benson
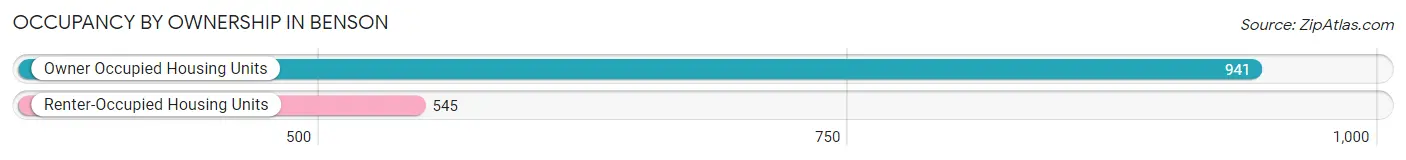
Occupancy by Ownership in Benson
Of the total 1,486 dwellings in Benson, owner-occupied units account for 941 (63.3%), while renter-occupied units make up 545 (36.7%).
| Occupancy | # Housing Units | % Housing Units |
| Owner Occupied Housing Units | 941 | 63.3% |
| Renter-Occupied Housing Units | 545 | 36.7% |
| Total Occupied Housing Units | 1,486 | 100.0% |
Occupancy by Household Size in Benson
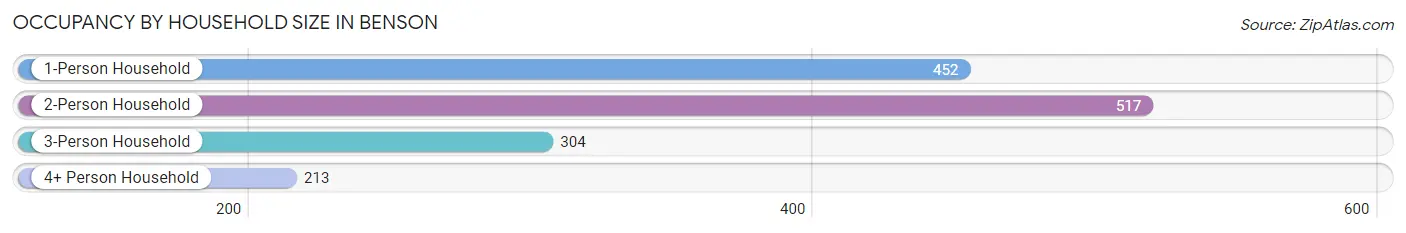
| Household Size | # Housing Units | % Housing Units |
| 1-Person Household | 452 | 30.4% |
| 2-Person Household | 517 | 34.8% |
| 3-Person Household | 304 | 20.5% |
| 4+ Person Household | 213 | 14.3% |
| Total Housing Units | 1,486 | 100.0% |
Occupancy by Ownership by Household Size in Benson
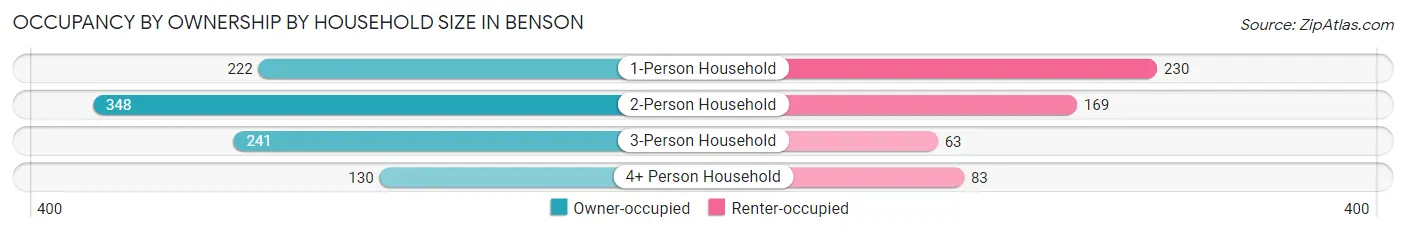
| Household Size | Owner-occupied | Renter-occupied |
| 1-Person Household | 222 (49.1%) | 230 (50.9%) |
| 2-Person Household | 348 (67.3%) | 169 (32.7%) |
| 3-Person Household | 241 (79.3%) | 63 (20.7%) |
| 4+ Person Household | 130 (61.0%) | 83 (39.0%) |
| Total Housing Units | 941 (63.3%) | 545 (36.7%) |
Occupancy by Educational Attainment in Benson
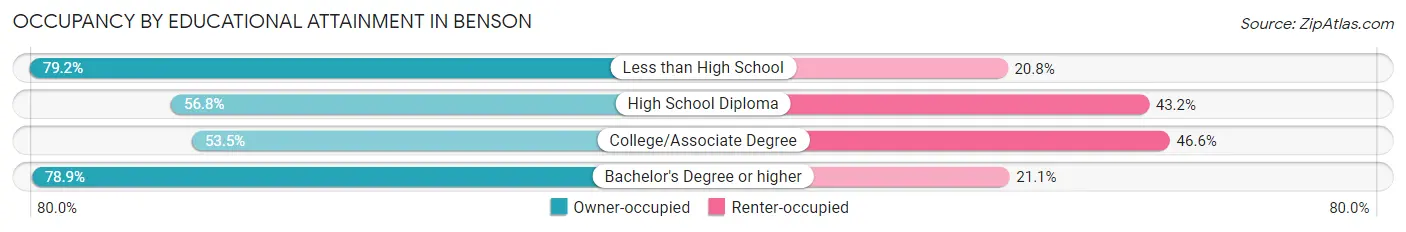
| Household Size | Owner-occupied | Renter-occupied |
| Less than High School | 76 (79.2%) | 20 (20.8%) |
| High School Diploma | 235 (56.8%) | 179 (43.2%) |
| College/Associate Degree | 294 (53.4%) | 256 (46.6%) |
| Bachelor's Degree or higher | 336 (78.9%) | 90 (21.1%) |
Occupancy by Age of Householder in Benson
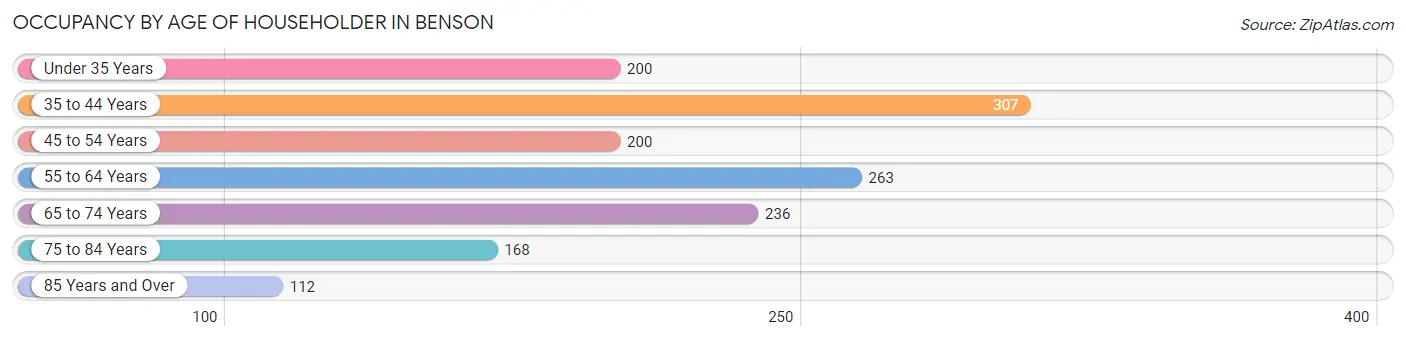
| Age Bracket | # Households | % Households |
| Under 35 Years | 200 | 13.5% |
| 35 to 44 Years | 307 | 20.7% |
| 45 to 54 Years | 200 | 13.5% |
| 55 to 64 Years | 263 | 17.7% |
| 65 to 74 Years | 236 | 15.9% |
| 75 to 84 Years | 168 | 11.3% |
| 85 Years and Over | 112 | 7.5% |
| Total | 1,486 | 100.0% |
Housing Finances in Benson
Median Income by Occupancy in Benson
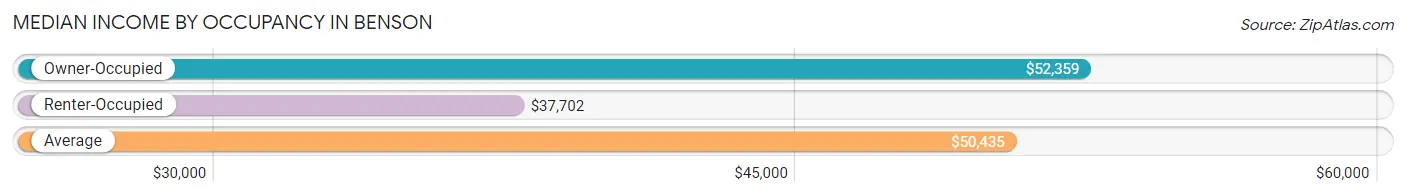
| Occupancy Type | # Households | Median Income |
| Owner-Occupied | 941 (63.3%) | $52,359 |
| Renter-Occupied | 545 (36.7%) | $37,702 |
| Average | 1,486 (100.0%) | $50,435 |
Occupancy by Householder Income Bracket in Benson
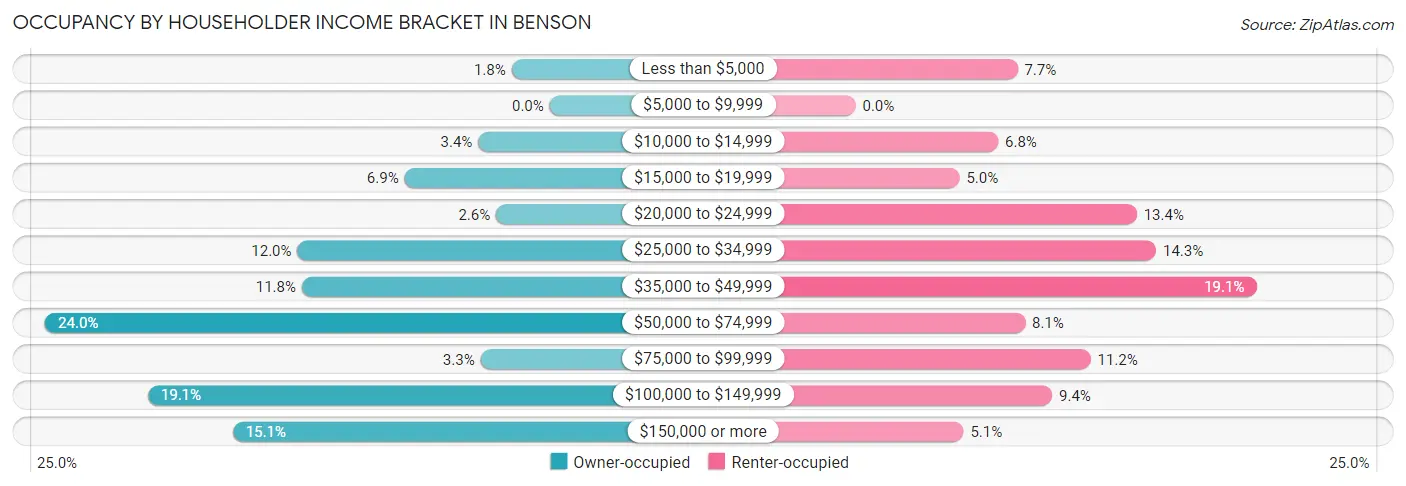
| Income Bracket | Owner-occupied | Renter-occupied |
| Less than $5,000 | 17 (1.8%) | 42 (7.7%) |
| $5,000 to $9,999 | 0 (0.0%) | 0 (0.0%) |
| $10,000 to $14,999 | 32 (3.4%) | 37 (6.8%) |
| $15,000 to $19,999 | 65 (6.9%) | 27 (5.0%) |
| $20,000 to $24,999 | 24 (2.5%) | 73 (13.4%) |
| $25,000 to $34,999 | 113 (12.0%) | 78 (14.3%) |
| $35,000 to $49,999 | 111 (11.8%) | 104 (19.1%) |
| $50,000 to $74,999 | 226 (24.0%) | 44 (8.1%) |
| $75,000 to $99,999 | 31 (3.3%) | 61 (11.2%) |
| $100,000 to $149,999 | 180 (19.1%) | 51 (9.4%) |
| $150,000 or more | 142 (15.1%) | 28 (5.1%) |
| Total | 941 (100.0%) | 545 (100.0%) |
Monthly Housing Cost Tiers in Benson
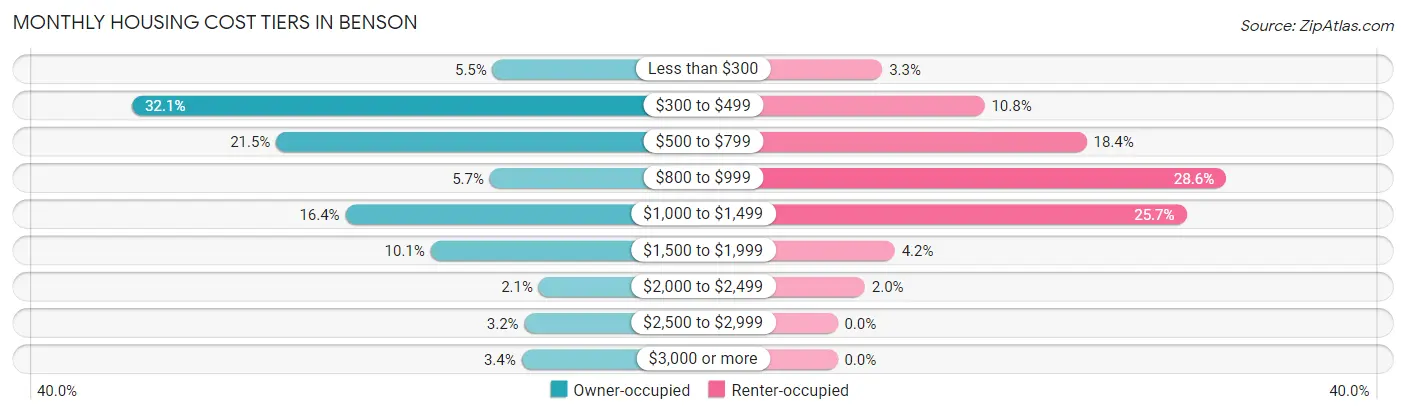
| Monthly Cost | Owner-occupied | Renter-occupied |
| Less than $300 | 52 (5.5%) | 18 (3.3%) |
| $300 to $499 | 302 (32.1%) | 59 (10.8%) |
| $500 to $799 | 202 (21.5%) | 100 (18.3%) |
| $800 to $999 | 54 (5.7%) | 156 (28.6%) |
| $1,000 to $1,499 | 154 (16.4%) | 140 (25.7%) |
| $1,500 to $1,999 | 95 (10.1%) | 23 (4.2%) |
| $2,000 to $2,499 | 20 (2.1%) | 11 (2.0%) |
| $2,500 to $2,999 | 30 (3.2%) | 0 (0.0%) |
| $3,000 or more | 32 (3.4%) | 0 (0.0%) |
| Total | 941 (100.0%) | 545 (100.0%) |
Physical Housing Characteristics in Benson
Housing Structures in Benson
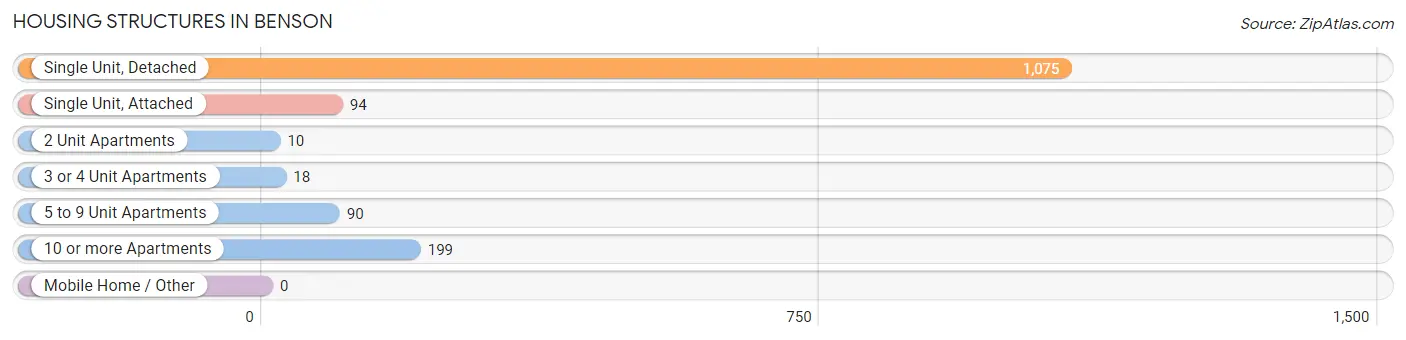
| Structure Type | # Housing Units | % Housing Units |
| Single Unit, Detached | 1,075 | 72.3% |
| Single Unit, Attached | 94 | 6.3% |
| 2 Unit Apartments | 10 | 0.7% |
| 3 or 4 Unit Apartments | 18 | 1.2% |
| 5 to 9 Unit Apartments | 90 | 6.1% |
| 10 or more Apartments | 199 | 13.4% |
| Mobile Home / Other | 0 | 0.0% |
| Total | 1,486 | 100.0% |
Housing Structures by Occupancy in Benson
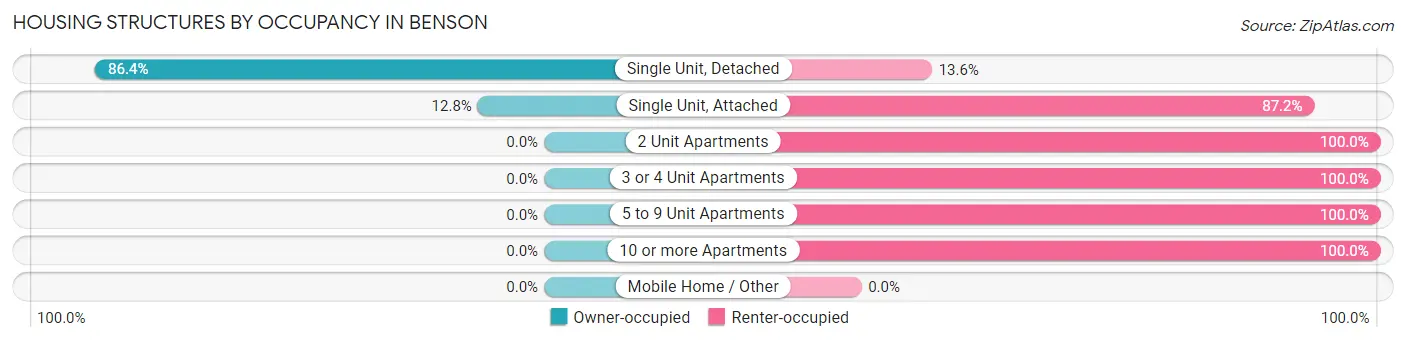
| Structure Type | Owner-occupied | Renter-occupied |
| Single Unit, Detached | 929 (86.4%) | 146 (13.6%) |
| Single Unit, Attached | 12 (12.8%) | 82 (87.2%) |
| 2 Unit Apartments | 0 (0.0%) | 10 (100.0%) |
| 3 or 4 Unit Apartments | 0 (0.0%) | 18 (100.0%) |
| 5 to 9 Unit Apartments | 0 (0.0%) | 90 (100.0%) |
| 10 or more Apartments | 0 (0.0%) | 199 (100.0%) |
| Mobile Home / Other | 0 (0.0%) | 0 (0.0%) |
| Total | 941 (63.3%) | 545 (36.7%) |
Housing Structures by Number of Rooms in Benson
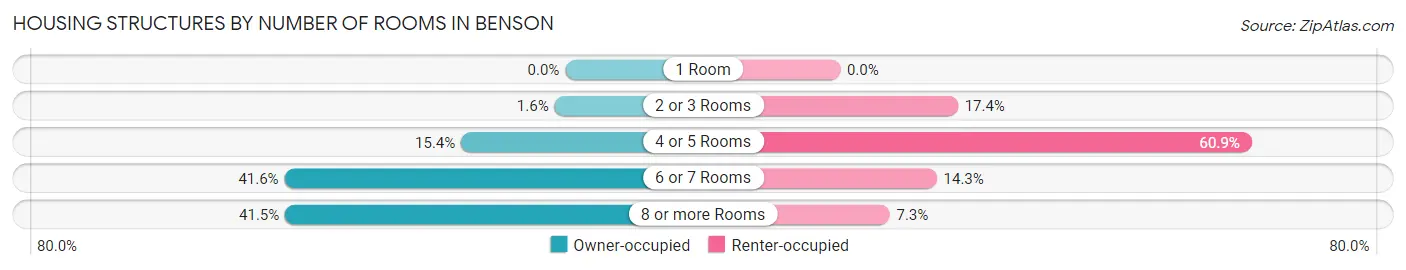
| Number of Rooms | Owner-occupied | Renter-occupied |
| 1 Room | 0 (0.0%) | 0 (0.0%) |
| 2 or 3 Rooms | 15 (1.6%) | 95 (17.4%) |
| 4 or 5 Rooms | 145 (15.4%) | 332 (60.9%) |
| 6 or 7 Rooms | 391 (41.5%) | 78 (14.3%) |
| 8 or more Rooms | 390 (41.4%) | 40 (7.3%) |
| Total | 941 (100.0%) | 545 (100.0%) |
Housing Structure by Heating Type in Benson
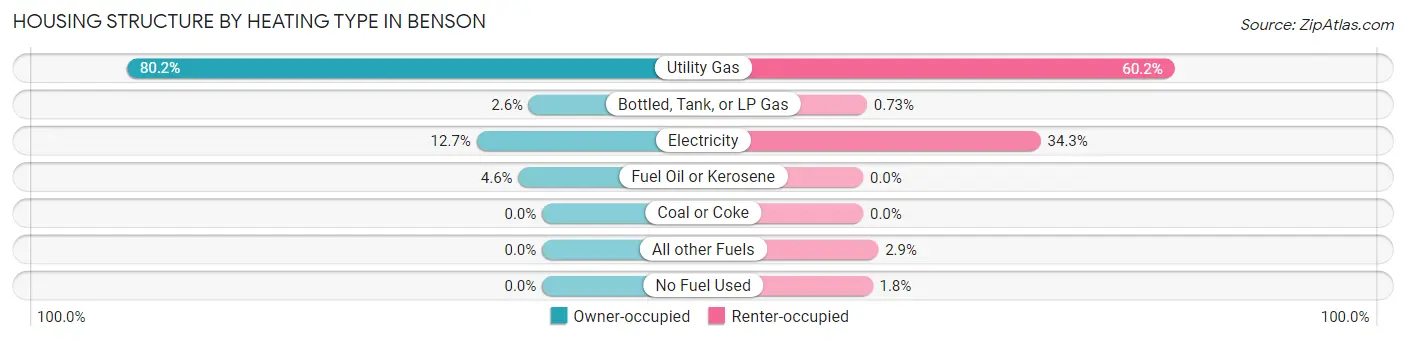
| Heating Type | Owner-occupied | Renter-occupied |
| Utility Gas | 755 (80.2%) | 328 (60.2%) |
| Bottled, Tank, or LP Gas | 24 (2.5%) | 4 (0.7%) |
| Electricity | 119 (12.7%) | 187 (34.3%) |
| Fuel Oil or Kerosene | 43 (4.6%) | 0 (0.0%) |
| Coal or Coke | 0 (0.0%) | 0 (0.0%) |
| All other Fuels | 0 (0.0%) | 16 (2.9%) |
| No Fuel Used | 0 (0.0%) | 10 (1.8%) |
| Total | 941 (100.0%) | 545 (100.0%) |
Household Vehicle Usage in Benson
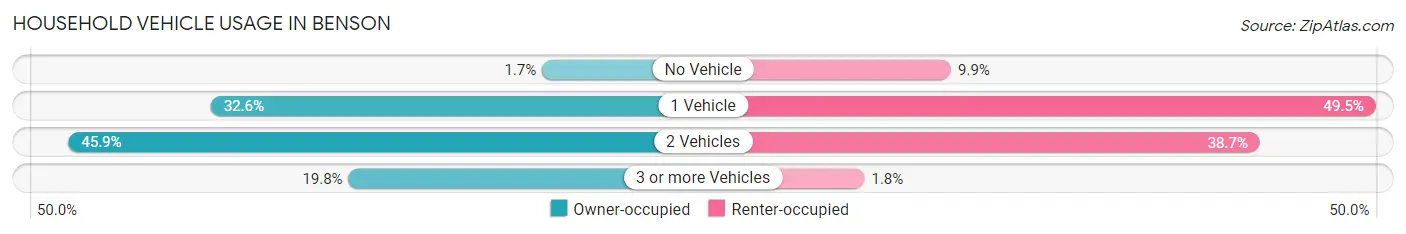
| Vehicles per Household | Owner-occupied | Renter-occupied |
| No Vehicle | 16 (1.7%) | 54 (9.9%) |
| 1 Vehicle | 307 (32.6%) | 270 (49.5%) |
| 2 Vehicles | 432 (45.9%) | 211 (38.7%) |
| 3 or more Vehicles | 186 (19.8%) | 10 (1.8%) |
| Total | 941 (100.0%) | 545 (100.0%) |
Real Estate & Mortgages in Benson
Real Estate and Mortgage Overview in Benson
| Characteristic | Without Mortgage | With Mortgage |
| Housing Units | 518 | 423 |
| Median Property Value | $114,400 | $156,500 |
| Median Household Income | $51,168 | $100 |
| Monthly Housing Costs | $442 | $32 |
| Real Estate Taxes | $1,061 | $0 |
Property Value by Mortgage Status in Benson
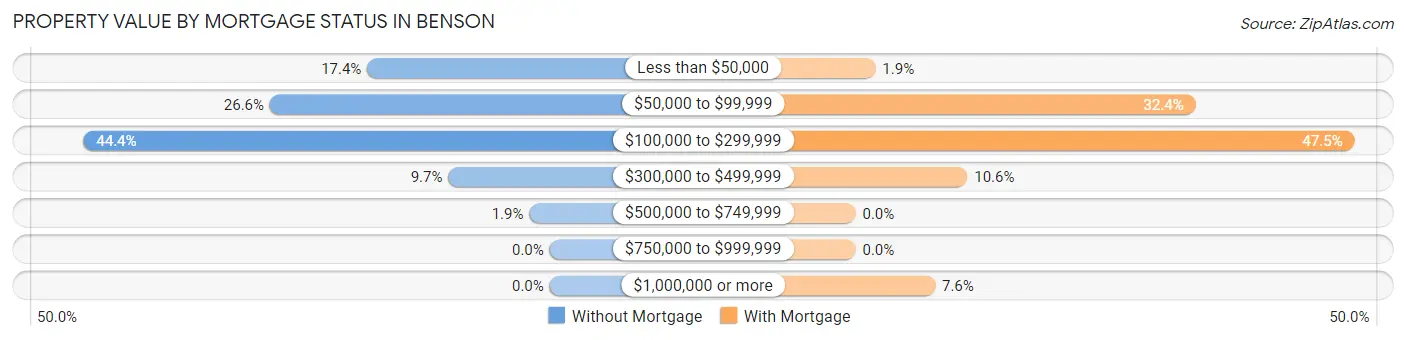
| Property Value | Without Mortgage | With Mortgage |
| Less than $50,000 | 90 (17.4%) | 8 (1.9%) |
| $50,000 to $99,999 | 138 (26.6%) | 137 (32.4%) |
| $100,000 to $299,999 | 230 (44.4%) | 201 (47.5%) |
| $300,000 to $499,999 | 50 (9.7%) | 45 (10.6%) |
| $500,000 to $749,999 | 10 (1.9%) | 0 (0.0%) |
| $750,000 to $999,999 | 0 (0.0%) | 0 (0.0%) |
| $1,000,000 or more | 0 (0.0%) | 32 (7.6%) |
| Total | 518 (100.0%) | 423 (100.0%) |
Household Income by Mortgage Status in Benson
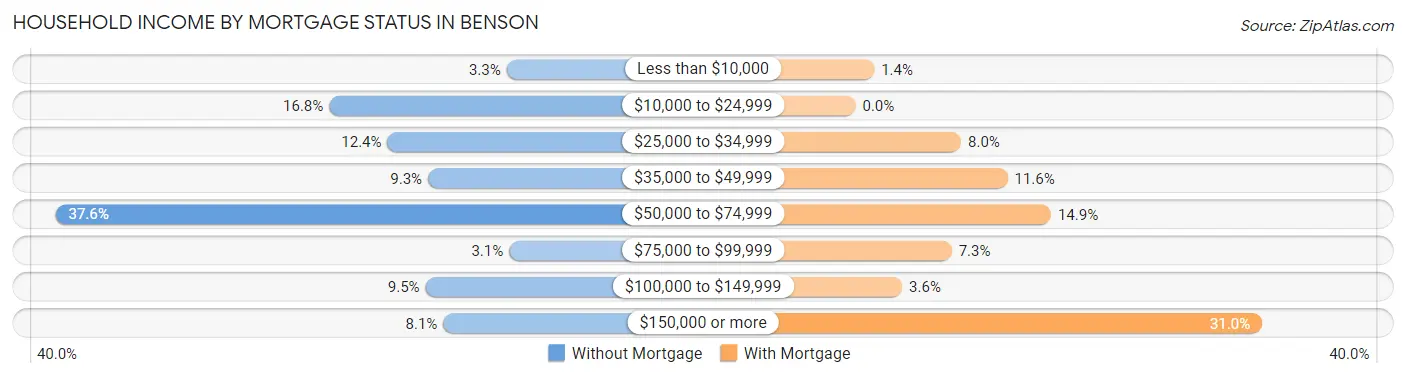
| Household Income | Without Mortgage | With Mortgage |
| Less than $10,000 | 17 (3.3%) | 6 (1.4%) |
| $10,000 to $24,999 | 87 (16.8%) | 0 (0.0%) |
| $25,000 to $34,999 | 64 (12.4%) | 34 (8.0%) |
| $35,000 to $49,999 | 48 (9.3%) | 49 (11.6%) |
| $50,000 to $74,999 | 195 (37.6%) | 63 (14.9%) |
| $75,000 to $99,999 | 16 (3.1%) | 31 (7.3%) |
| $100,000 to $149,999 | 49 (9.5%) | 15 (3.5%) |
| $150,000 or more | 42 (8.1%) | 131 (31.0%) |
| Total | 518 (100.0%) | 423 (100.0%) |
Property Value to Household Income Ratio in Benson
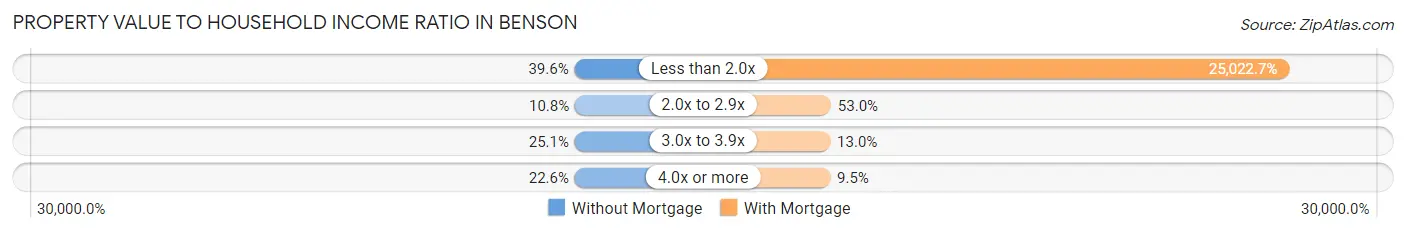
| Value-to-Income Ratio | Without Mortgage | With Mortgage |
| Less than 2.0x | 205 (39.6%) | 105,846 (25,022.7%) |
| 2.0x to 2.9x | 56 (10.8%) | 224 (53.0%) |
| 3.0x to 3.9x | 130 (25.1%) | 55 (13.0%) |
| 4.0x or more | 117 (22.6%) | 40 (9.5%) |
| Total | 518 (100.0%) | 423 (100.0%) |
Real Estate Taxes by Mortgage Status in Benson
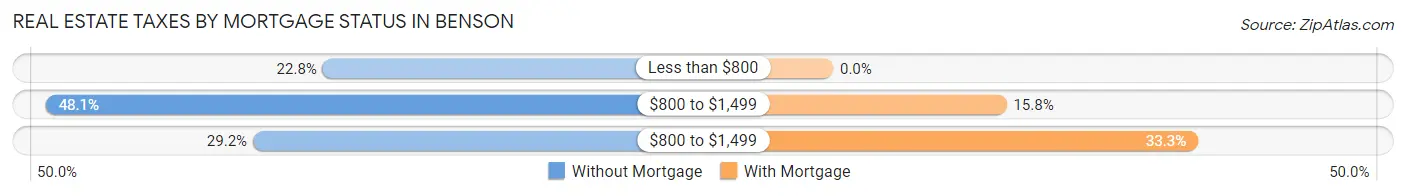
| Property Taxes | Without Mortgage | With Mortgage |
| Less than $800 | 118 (22.8%) | 0 (0.0%) |
| $800 to $1,499 | 249 (48.1%) | 67 (15.8%) |
| $800 to $1,499 | 151 (29.1%) | 141 (33.3%) |
| Total | 518 (100.0%) | 423 (100.0%) |
Health & Disability in Benson
Health Insurance Coverage by Age in Benson
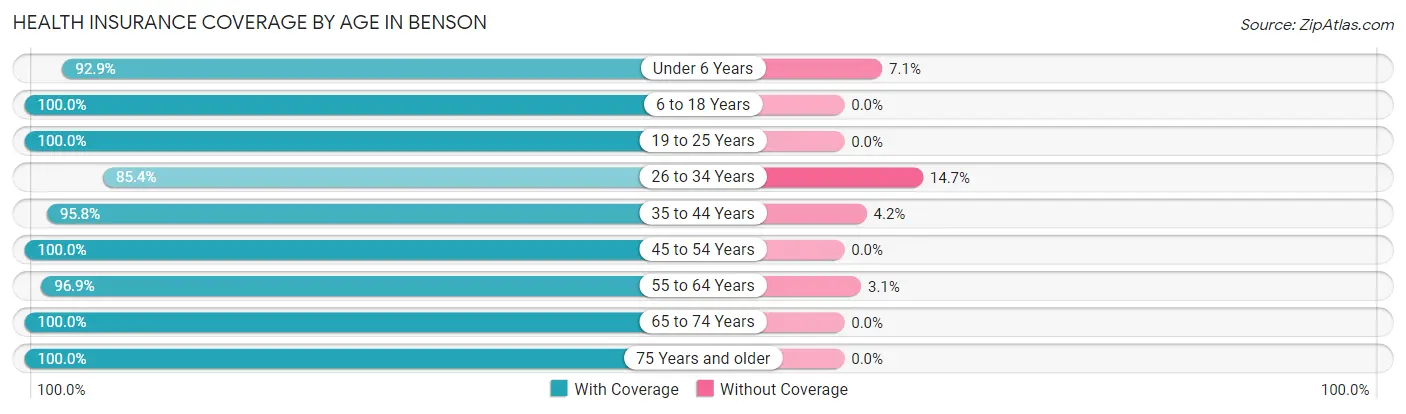
| Age Bracket | With Coverage | Without Coverage |
| Under 6 Years | 250 (92.9%) | 19 (7.1%) |
| 6 to 18 Years | 599 (100.0%) | 0 (0.0%) |
| 19 to 25 Years | 265 (100.0%) | 0 (0.0%) |
| 26 to 34 Years | 303 (85.4%) | 52 (14.6%) |
| 35 to 44 Years | 369 (95.8%) | 16 (4.2%) |
| 45 to 54 Years | 395 (100.0%) | 0 (0.0%) |
| 55 to 64 Years | 341 (96.9%) | 11 (3.1%) |
| 65 to 74 Years | 373 (100.0%) | 0 (0.0%) |
| 75 Years and older | 364 (100.0%) | 0 (0.0%) |
| Total | 3,259 (97.1%) | 98 (2.9%) |
Health Insurance Coverage by Citizenship Status in Benson
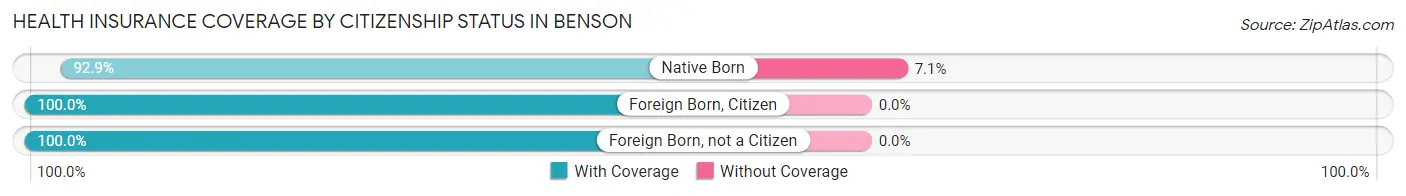
| Citizenship Status | With Coverage | Without Coverage |
| Native Born | 250 (92.9%) | 19 (7.1%) |
| Foreign Born, Citizen | 599 (100.0%) | 0 (0.0%) |
| Foreign Born, not a Citizen | 265 (100.0%) | 0 (0.0%) |
Health Insurance Coverage by Household Income in Benson
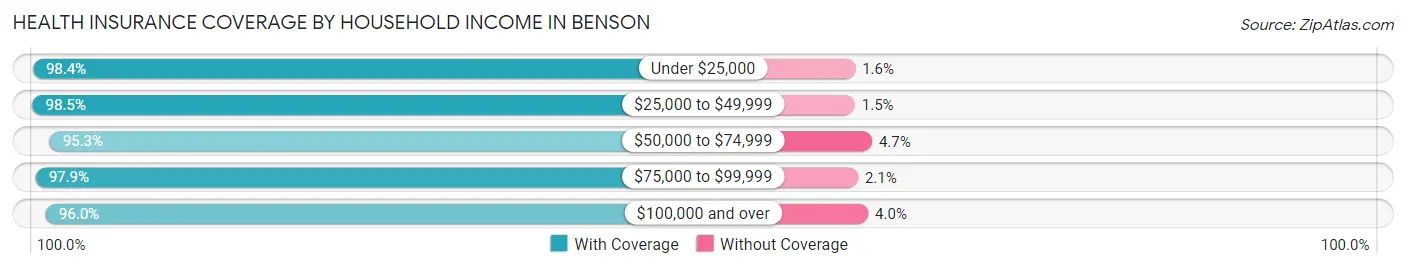
| Household Income | With Coverage | Without Coverage |
| Under $25,000 | 376 (98.4%) | 6 (1.6%) |
| $25,000 to $49,999 | 1,043 (98.5%) | 16 (1.5%) |
| $50,000 to $74,999 | 587 (95.3%) | 29 (4.7%) |
| $75,000 to $99,999 | 187 (97.9%) | 4 (2.1%) |
| $100,000 and over | 1,031 (96.0%) | 43 (4.0%) |
Public vs Private Health Insurance Coverage by Age in Benson
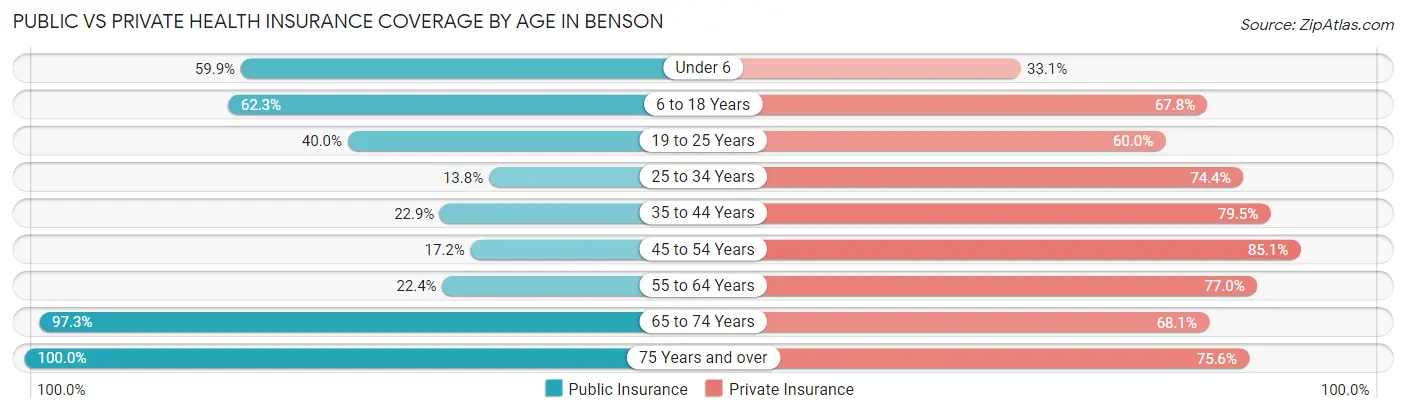
| Age Bracket | Public Insurance | Private Insurance |
| Under 6 | 161 (59.9%) | 89 (33.1%) |
| 6 to 18 Years | 373 (62.3%) | 406 (67.8%) |
| 19 to 25 Years | 106 (40.0%) | 159 (60.0%) |
| 25 to 34 Years | 49 (13.8%) | 264 (74.4%) |
| 35 to 44 Years | 88 (22.9%) | 306 (79.5%) |
| 45 to 54 Years | 68 (17.2%) | 336 (85.1%) |
| 55 to 64 Years | 79 (22.4%) | 271 (77.0%) |
| 65 to 74 Years | 363 (97.3%) | 254 (68.1%) |
| 75 Years and over | 364 (100.0%) | 275 (75.5%) |
| Total | 1,651 (49.2%) | 2,360 (70.3%) |
Disability Status by Sex by Age in Benson
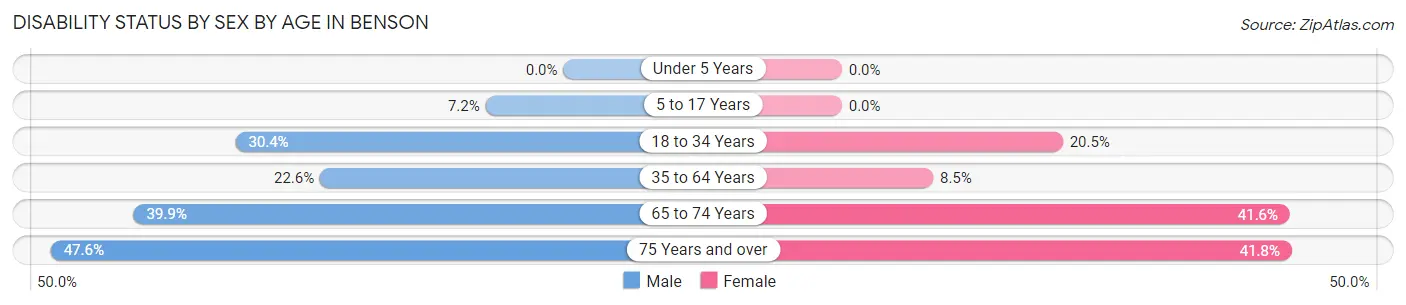
| Age Bracket | Male | Female |
| Under 5 Years | 0 (0.0%) | 0 (0.0%) |
| 5 to 17 Years | 21 (7.2%) | 0 (0.0%) |
| 18 to 34 Years | 112 (30.4%) | 65 (20.5%) |
| 35 to 64 Years | 133 (22.6%) | 46 (8.5%) |
| 65 to 74 Years | 73 (39.9%) | 79 (41.6%) |
| 75 Years and over | 49 (47.6%) | 109 (41.8%) |
Disability Class by Sex by Age in Benson
Disability Class: Hearing Difficulty
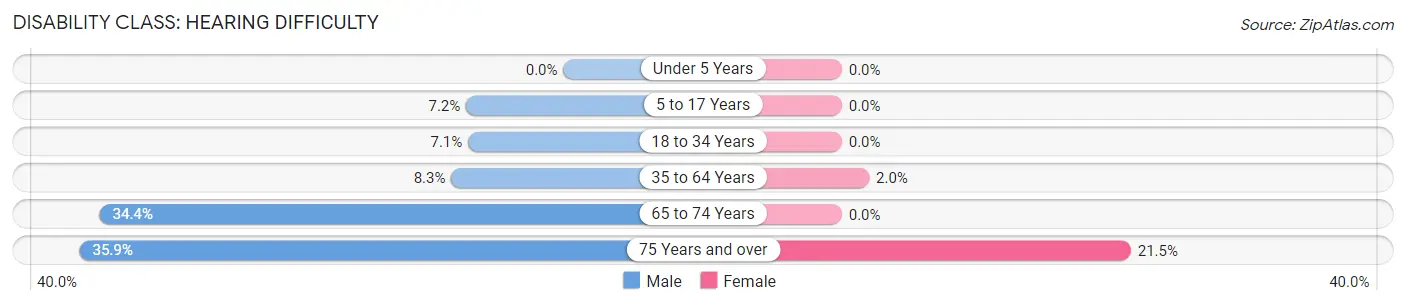
| Age Bracket | Male | Female |
| Under 5 Years | 0 (0.0%) | 0 (0.0%) |
| 5 to 17 Years | 21 (7.2%) | 0 (0.0%) |
| 18 to 34 Years | 26 (7.1%) | 0 (0.0%) |
| 35 to 64 Years | 49 (8.3%) | 11 (2.0%) |
| 65 to 74 Years | 63 (34.4%) | 0 (0.0%) |
| 75 Years and over | 37 (35.9%) | 56 (21.5%) |
Disability Class: Vision Difficulty
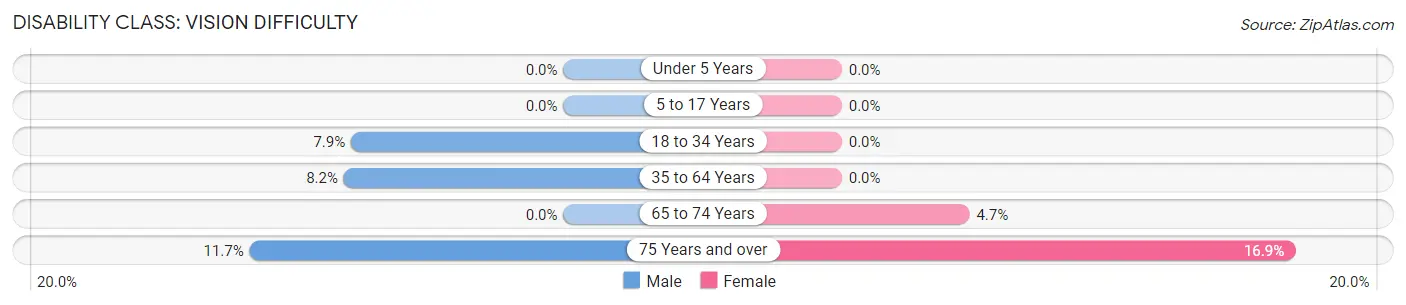
| Age Bracket | Male | Female |
| Under 5 Years | 0 (0.0%) | 0 (0.0%) |
| 5 to 17 Years | 0 (0.0%) | 0 (0.0%) |
| 18 to 34 Years | 29 (7.9%) | 0 (0.0%) |
| 35 to 64 Years | 48 (8.2%) | 0 (0.0%) |
| 65 to 74 Years | 0 (0.0%) | 9 (4.7%) |
| 75 Years and over | 12 (11.7%) | 44 (16.9%) |
Disability Class: Cognitive Difficulty
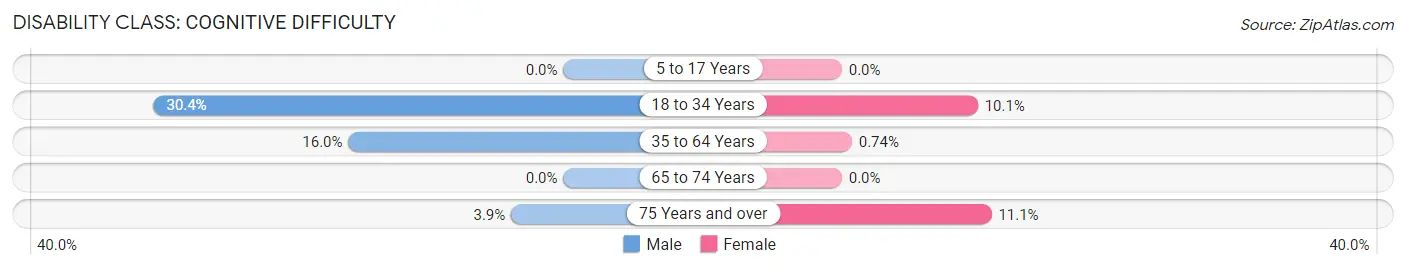
| Age Bracket | Male | Female |
| 5 to 17 Years | 0 (0.0%) | 0 (0.0%) |
| 18 to 34 Years | 112 (30.4%) | 32 (10.1%) |
| 35 to 64 Years | 94 (16.0%) | 4 (0.7%) |
| 65 to 74 Years | 0 (0.0%) | 0 (0.0%) |
| 75 Years and over | 4 (3.9%) | 29 (11.1%) |
Disability Class: Ambulatory Difficulty
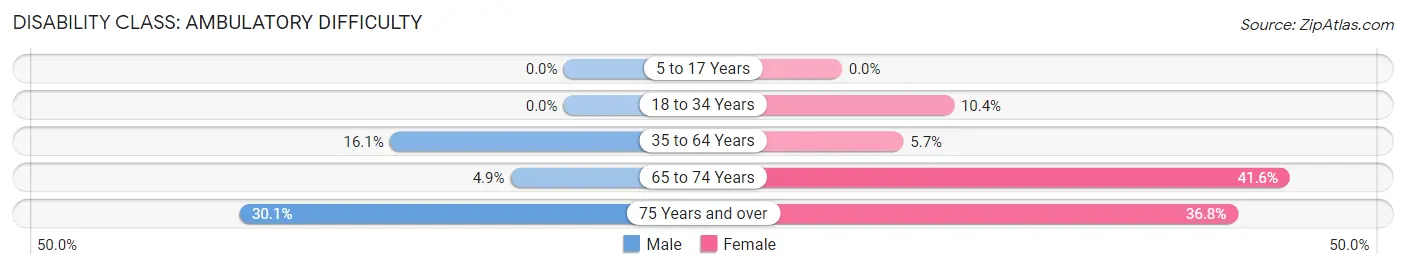
| Age Bracket | Male | Female |
| 5 to 17 Years | 0 (0.0%) | 0 (0.0%) |
| 18 to 34 Years | 0 (0.0%) | 33 (10.4%) |
| 35 to 64 Years | 95 (16.1%) | 31 (5.7%) |
| 65 to 74 Years | 9 (4.9%) | 79 (41.6%) |
| 75 Years and over | 31 (30.1%) | 96 (36.8%) |
Disability Class: Self-Care Difficulty
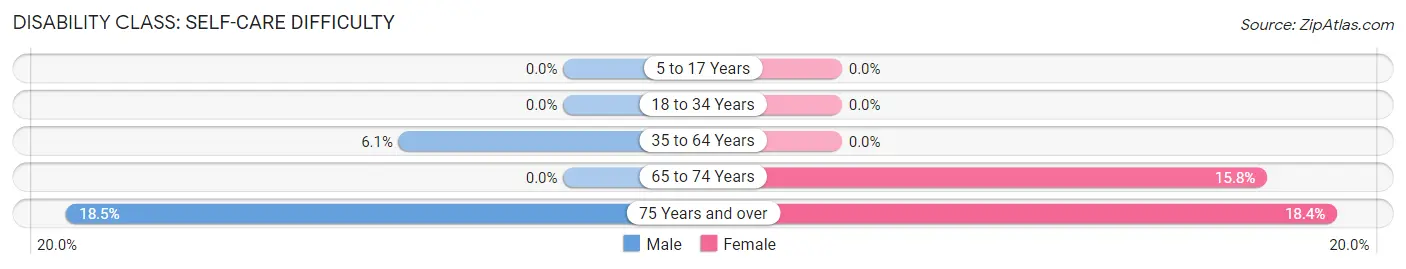
| Age Bracket | Male | Female |
| 5 to 17 Years | 0 (0.0%) | 0 (0.0%) |
| 18 to 34 Years | 0 (0.0%) | 0 (0.0%) |
| 35 to 64 Years | 36 (6.1%) | 0 (0.0%) |
| 65 to 74 Years | 0 (0.0%) | 30 (15.8%) |
| 75 Years and over | 19 (18.4%) | 48 (18.4%) |
Technology Access in Benson
Computing Device Access in Benson
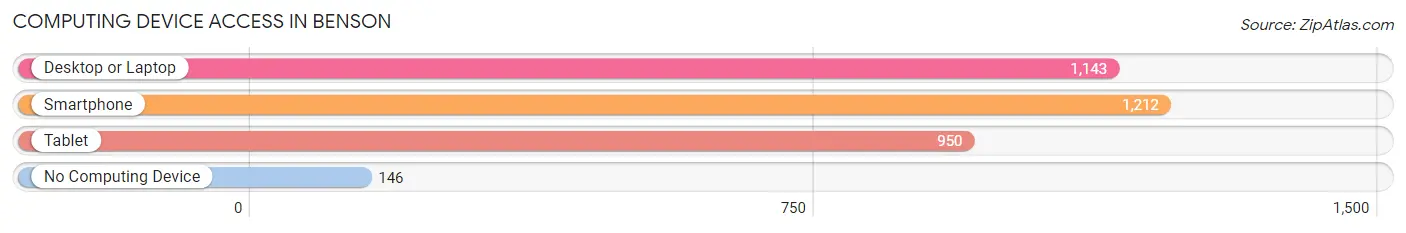
| Device Type | # Households | % Households |
| Desktop or Laptop | 1,143 | 76.9% |
| Smartphone | 1,212 | 81.6% |
| Tablet | 950 | 63.9% |
| No Computing Device | 146 | 9.8% |
| Total | 1,486 | 100.0% |
Internet Access in Benson
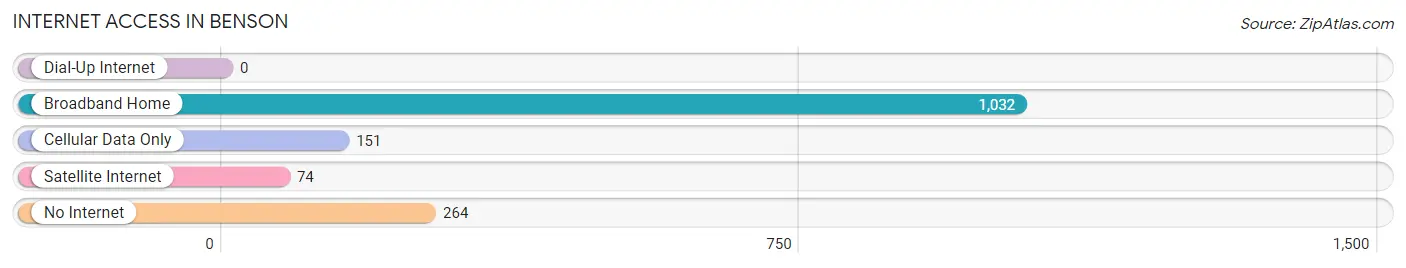
| Internet Type | # Households | % Households |
| Dial-Up Internet | 0 | 0.0% |
| Broadband Home | 1,032 | 69.5% |
| Cellular Data Only | 151 | 10.2% |
| Satellite Internet | 74 | 5.0% |
| No Internet | 264 | 17.8% |
| Total | 1,486 | 100.0% |
Benson Summary
Benson, Minnesota is a small city located in Swift County, in the west-central part of the state. It is situated on the banks of the Chippewa River, and is home to a population of approximately 3,400 people. Benson is a rural community, with a strong agricultural base, and is known for its friendly, welcoming atmosphere.
History
Benson was founded in 1879 by Swedish immigrants, who named the city after their hometown of Benson, Sweden. The city was incorporated in 1881, and the first post office was established in 1882. The city grew rapidly in the late 19th and early 20th centuries, and by 1910, the population had grown to over 1,000 people.
In the early 20th century, Benson was a thriving agricultural center, with a variety of crops being grown in the area. The city was also home to a number of businesses, including a flour mill, a creamery, a brickyard, and a lumberyard.
In the 1950s, Benson began to experience a decline in population, as many of its residents moved away in search of better economic opportunities. The city’s population has remained relatively stable since then, and today, Benson is a quiet, rural community.
Geography
Benson is located in the west-central part of Minnesota, in Swift County. The city is situated on the banks of the Chippewa River, and is surrounded by rolling hills and farmland. The city is located approximately 50 miles west of St. Cloud, and is about a two-hour drive from Minneapolis.
The climate in Benson is typical of the Midwest, with cold winters and hot, humid summers. The average annual temperature is around 40 degrees Fahrenheit, and the average annual precipitation is around 30 inches.
Economy
Benson’s economy is largely based on agriculture, with a variety of crops being grown in the area. The city is also home to a number of businesses, including a lumberyard, a grain elevator, and a variety of retail stores.
The city is also home to a number of manufacturing companies, including a plastics manufacturer, a metal fabricator, and a food processing plant. Benson is also home to a number of healthcare facilities, including a hospital, a nursing home, and a number of clinics.
Demographics
As of the 2010 census, Benson had a population of 3,400 people. The racial makeup of the city was 94.3% White, 0.7% African American, 0.3% Native American, 0.2% Asian, 0.1% Pacific Islander, and 4.4% from other races. The median household income was $41,250, and the median family income was $50,000.
Benson is a small, rural community, with a strong agricultural base. The city is known for its friendly, welcoming atmosphere, and is a great place to live and work.
Common Questions
What is Per Capita Income in Benson?
Per Capita income in Benson is $32,971.
What is the Median Family Income in Benson?
Median Family Income in Benson is $56,364.
What is the Median Household income in Benson?
Median Household Income in Benson is $50,435.
What is Income or Wage Gap in Benson?
Income or Wage Gap in Benson is 42.2%.
Women in Benson earn 57.8 cents for every dollar earned by a man.
What is Inequality or Gini Index in Benson?
Inequality or Gini Index in Benson is 0.48.
What is the Total Population of Benson?
Total Population of Benson is 3,453.
What is the Total Male Population of Benson?
Total Male Population of Benson is 1,714.
What is the Total Female Population of Benson?
Total Female Population of Benson is 1,739.
What is the Ratio of Males per 100 Females in Benson?
There are 98.56 Males per 100 Females in Benson.
What is the Ratio of Females per 100 Males in Benson?
There are 101.46 Females per 100 Males in Benson.
What is the Median Population Age in Benson?
Median Population Age in Benson is 41.0 Years.
What is the Average Family Size in Benson
Average Family Size in Benson is 2.8 People.
What is the Average Household Size in Benson
Average Household Size in Benson is 2.2 People.
How Large is the Labor Force in Benson?
There are 1,652 People in the Labor Forcein in Benson.
What is the Percentage of People in the Labor Force in Benson?
59.0% of People are in the Labor Force in Benson.
What is the Unemployment Rate in Benson?
Unemployment Rate in Benson is 2.5%.