Bellingham, MN Map & Demographics
Bellingham Map
Bellingham Overview
$22,473
PER CAPITA INCOME
$78,365
AVG FAMILY INCOME
$50,833
AVG HOUSEHOLD INCOME
0.36
INEQUALITY / GINI INDEX
183
TOTAL POPULATION
88
MALE POPULATION
95
FEMALE POPULATION
92.63
MALES / 100 FEMALES
107.95
FEMALES / 100 MALES
35.5
MEDIAN AGE
3.5
AVG FAMILY SIZE
2.6
AVG HOUSEHOLD SIZE
79
LABOR FORCE [ PEOPLE ]
57.7%
PERCENT IN LABOR FORCE
1.3%
UNEMPLOYMENT RATE
Bellingham Zip Codes
Bellingham Area Codes
Income in Bellingham
Income Overview in Bellingham
Per Capita Income in Bellingham is $22,473, while median incomes of families and households are $78,365 and $50,833 respectively.
| Characteristic | Number | Measure |
| Per Capita Income | 183 | $22,473 |
| Median Family Income | 41 | $78,365 |
| Mean Family Income | 41 | $77,666 |
| Median Household Income | 70 | $50,833 |
| Mean Household Income | 70 | $57,041 |
| Income Deficit | 41 | $0 |
| Wage / Income Gap (%) | 183 | 0.00% |
| Wage / Income Gap ($) | 183 | 100.00¢ per $1 |
| Gini / Inequality Index | 183 | 0.36 |
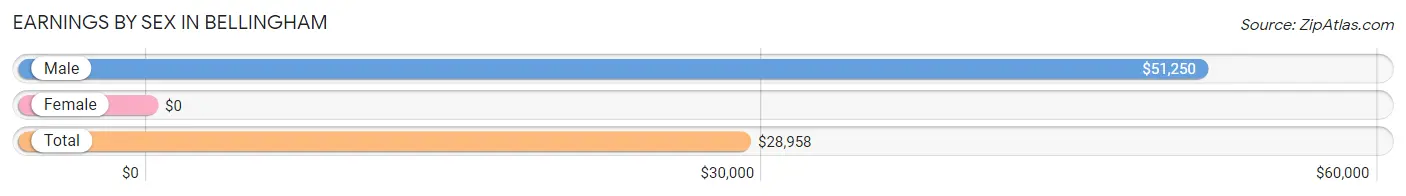
Earnings by Sex in Bellingham
| Sex | Number | Average Earnings |
| Male | 42 (49.4%) | $51,250 |
| Female | 43 (50.6%) | $0 |
| Total | 85 (100.0%) | $28,958 |
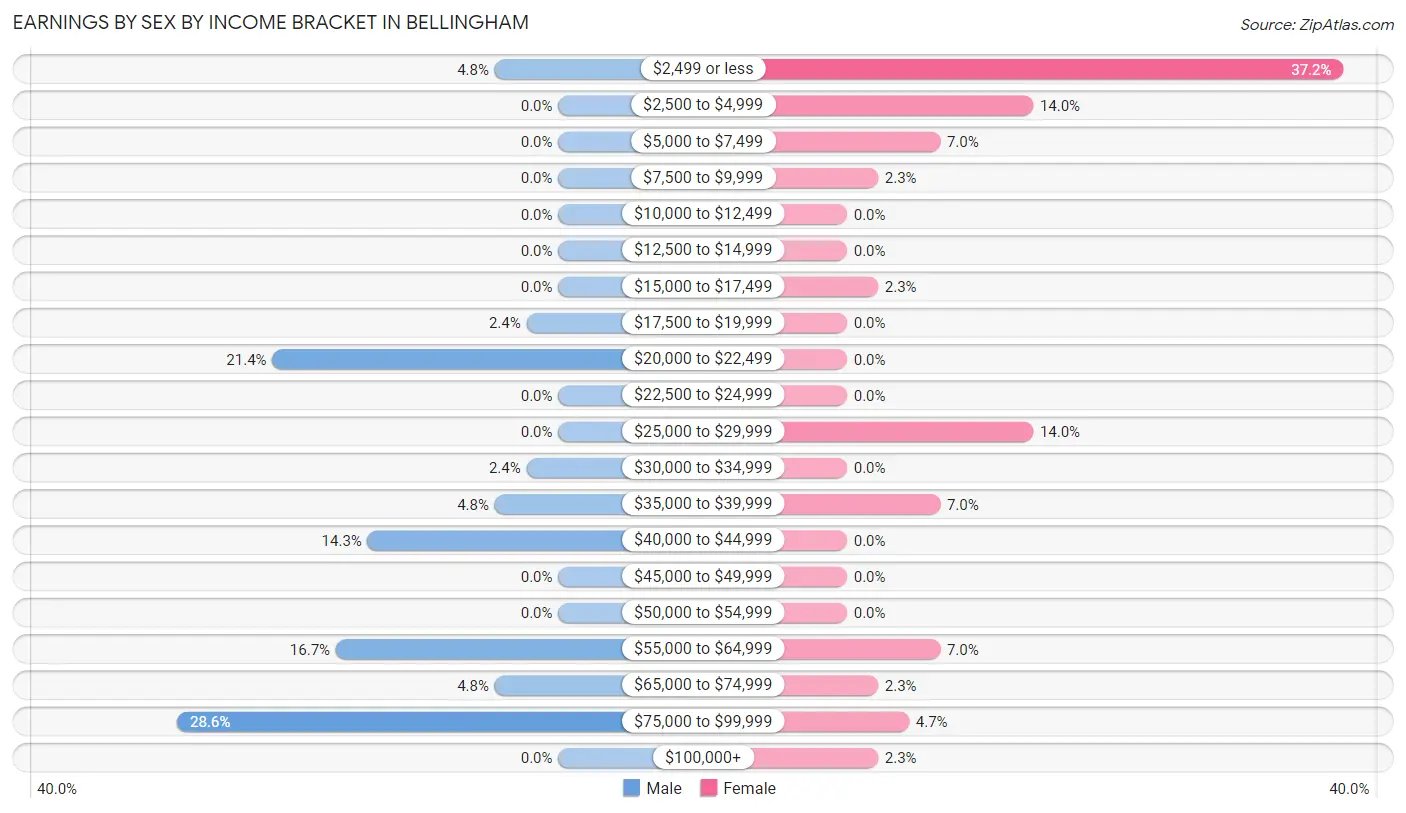
Earnings by Sex by Income Bracket in Bellingham
The most common earnings brackets in Bellingham are $75,000 to $99,999 for men (12 | 28.6%) and $2,499 or less for women (16 | 37.2%).
| Income | Male | Female |
| $2,499 or less | 2 (4.8%) | 16 (37.2%) |
| $2,500 to $4,999 | 0 (0.0%) | 6 (14.0%) |
| $5,000 to $7,499 | 0 (0.0%) | 3 (7.0%) |
| $7,500 to $9,999 | 0 (0.0%) | 1 (2.3%) |
| $10,000 to $12,499 | 0 (0.0%) | 0 (0.0%) |
| $12,500 to $14,999 | 0 (0.0%) | 0 (0.0%) |
| $15,000 to $17,499 | 0 (0.0%) | 1 (2.3%) |
| $17,500 to $19,999 | 1 (2.4%) | 0 (0.0%) |
| $20,000 to $22,499 | 9 (21.4%) | 0 (0.0%) |
| $22,500 to $24,999 | 0 (0.0%) | 0 (0.0%) |
| $25,000 to $29,999 | 0 (0.0%) | 6 (14.0%) |
| $30,000 to $34,999 | 1 (2.4%) | 0 (0.0%) |
| $35,000 to $39,999 | 2 (4.8%) | 3 (7.0%) |
| $40,000 to $44,999 | 6 (14.3%) | 0 (0.0%) |
| $45,000 to $49,999 | 0 (0.0%) | 0 (0.0%) |
| $50,000 to $54,999 | 0 (0.0%) | 0 (0.0%) |
| $55,000 to $64,999 | 7 (16.7%) | 3 (7.0%) |
| $65,000 to $74,999 | 2 (4.8%) | 1 (2.3%) |
| $75,000 to $99,999 | 12 (28.6%) | 2 (4.6%) |
| $100,000+ | 0 (0.0%) | 1 (2.3%) |
| Total | 42 (100.0%) | 43 (100.0%) |
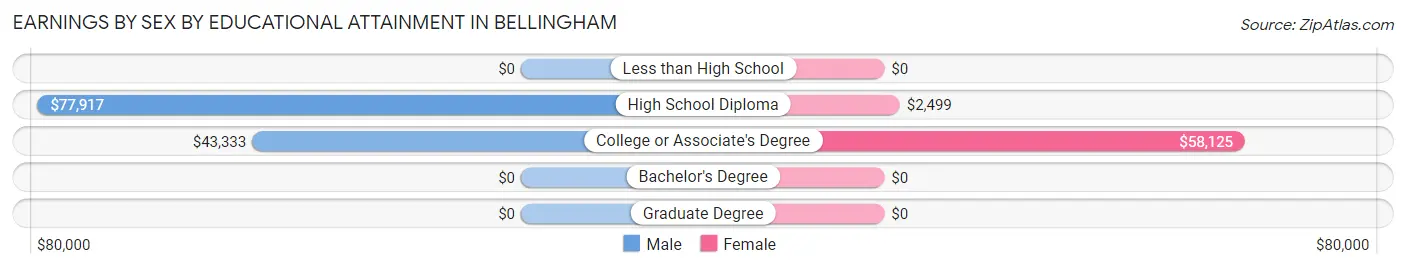
Earnings by Sex by Educational Attainment in Bellingham
| Educational Attainment | Male Income | Female Income |
| Less than High School | - | - |
| High School Diploma | $77,917 | $2,499 |
| College or Associate's Degree | $43,333 | $58,125 |
| Bachelor's Degree | - | - |
| Graduate Degree | - | - |
| Total | $59,286 | $0 |
Family Income in Bellingham
Family Income Brackets in Bellingham
According to the Bellingham family income data, there are 13 families falling into the $75,000 to $99,999 income range, which is the most common income bracket and makes up 31.7% of all families.
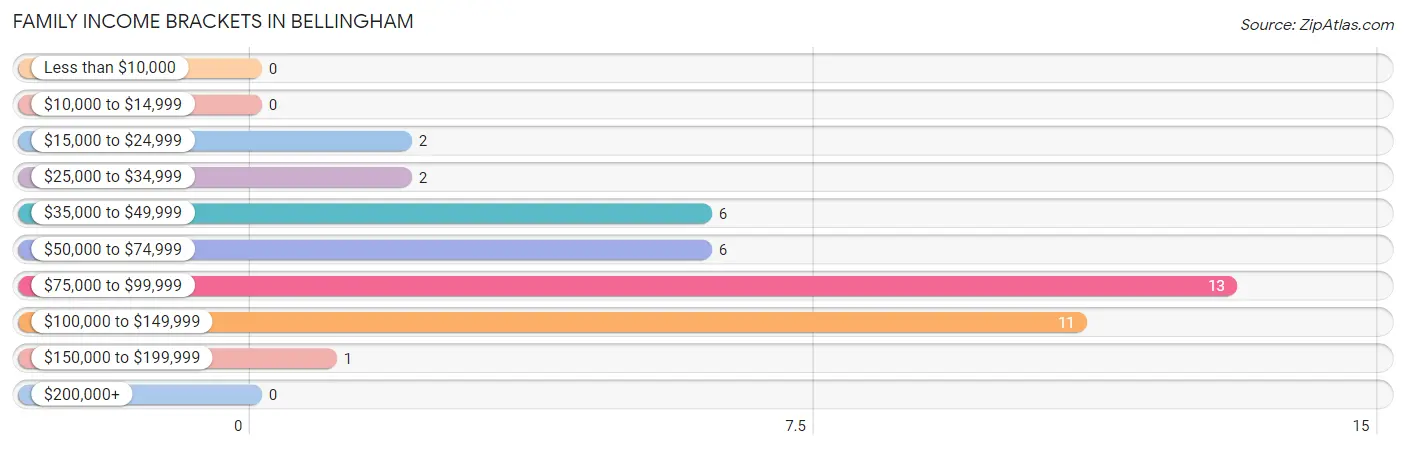
| Income Bracket | # Families | % Families |
| Less than $10,000 | 0 | 0.0% |
| $10,000 to $14,999 | 0 | 0.0% |
| $15,000 to $24,999 | 2 | 4.9% |
| $25,000 to $34,999 | 2 | 4.9% |
| $35,000 to $49,999 | 6 | 14.6% |
| $50,000 to $74,999 | 6 | 14.6% |
| $75,000 to $99,999 | 13 | 31.7% |
| $100,000 to $149,999 | 11 | 26.8% |
| $150,000 to $199,999 | 1 | 2.4% |
| $200,000+ | 0 | 0.0% |
Family Income by Famaliy Size in Bellingham
5-person families (19 | 46.3%) account for the highest median family income in Bellingham with $79,327 per family, while 2-person families (15 | 36.6%) have the highest median income of $25,938 per family member.
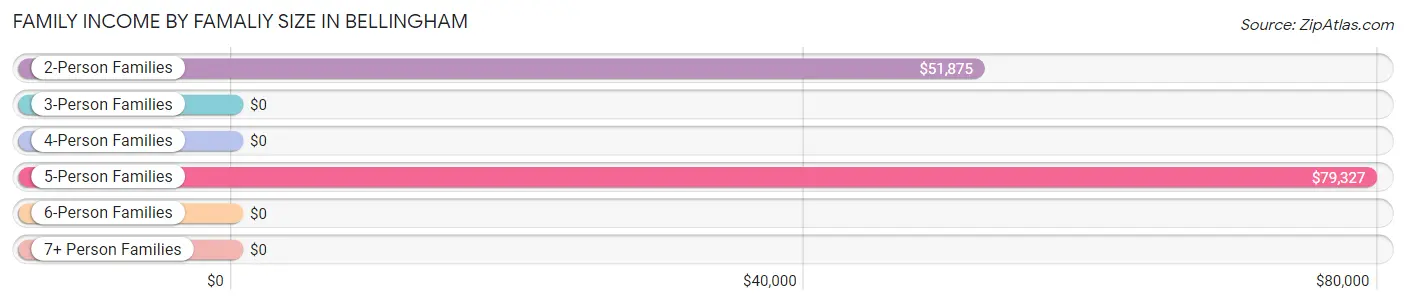
| Income Bracket | # Families | Median Income |
| 2-Person Families | 15 (36.6%) | $51,875 |
| 3-Person Families | 6 (14.6%) | $0 |
| 4-Person Families | 1 (2.4%) | $0 |
| 5-Person Families | 19 (46.3%) | $79,327 |
| 6-Person Families | 0 (0.0%) | $0 |
| 7+ Person Families | 0 (0.0%) | $0 |
| Total | 41 (100.0%) | $78,365 |
Family Income by Number of Earners in Bellingham
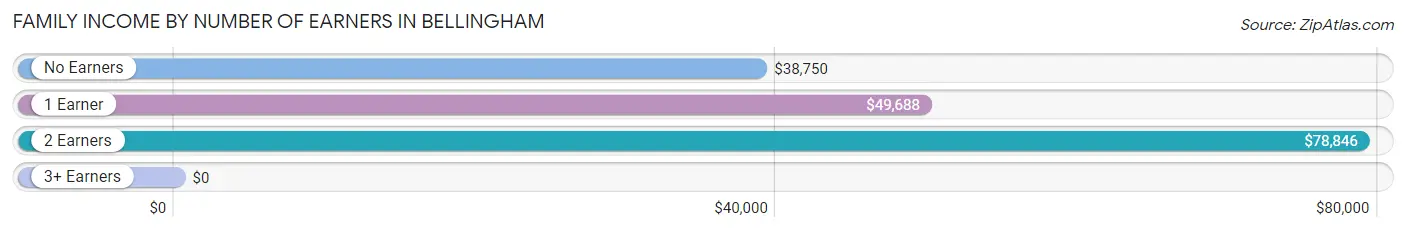
| Number of Earners | # Families | Median Income |
| No Earners | 7 (17.1%) | $38,750 |
| 1 Earner | 11 (26.8%) | $49,688 |
| 2 Earners | 16 (39.0%) | $78,846 |
| 3+ Earners | 7 (17.1%) | $0 |
| Total | 41 (100.0%) | $78,365 |
Household Income in Bellingham
Household Income Brackets in Bellingham
With 13 households falling in the category, the $75,000 to $99,999 income range is the most frequent in Bellingham, accounting for 18.6% of all households.
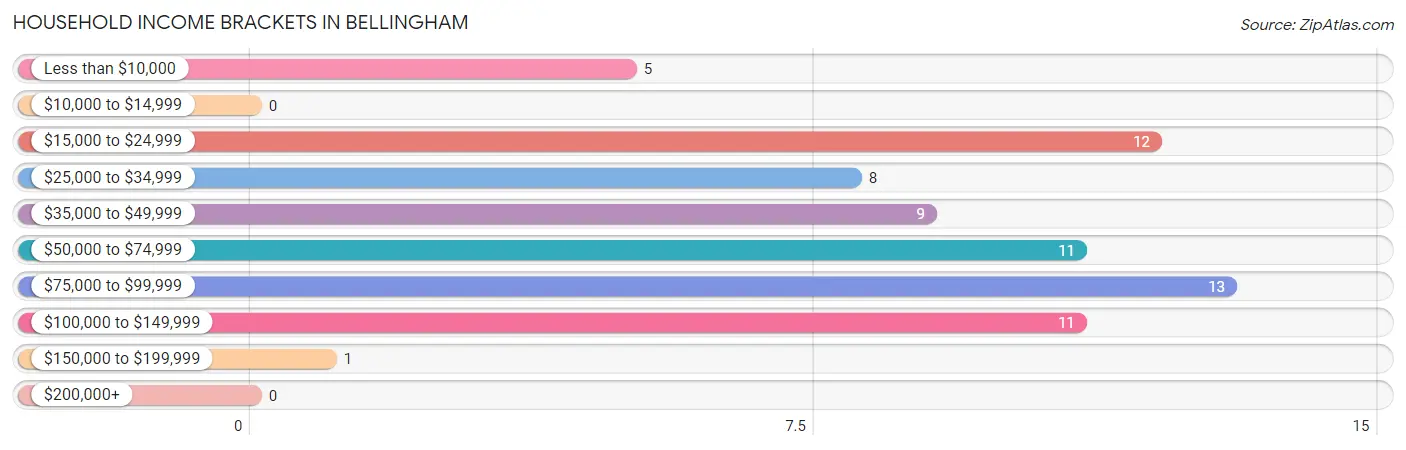
| Income Bracket | # Households | % Households |
| Less than $10,000 | 5 | 7.1% |
| $10,000 to $14,999 | 0 | 0.0% |
| $15,000 to $24,999 | 12 | 17.1% |
| $25,000 to $34,999 | 8 | 11.4% |
| $35,000 to $49,999 | 9 | 12.9% |
| $50,000 to $74,999 | 11 | 15.7% |
| $75,000 to $99,999 | 13 | 18.6% |
| $100,000 to $149,999 | 11 | 15.7% |
| $150,000 to $199,999 | 1 | 1.4% |
| $200,000+ | 0 | 0.0% |
Household Income by Householder Age in Bellingham
The median household income in Bellingham is $50,833, with the highest median household income of $78,846 found in the 25 to 44 years age bracket for the primary householder. A total of 24 households (34.3%) fall into this category. Meanwhile, the 15 to 24 years age bracket for the primary householder has the lowest median household income of $0, with 3 households (4.3%) in this group.
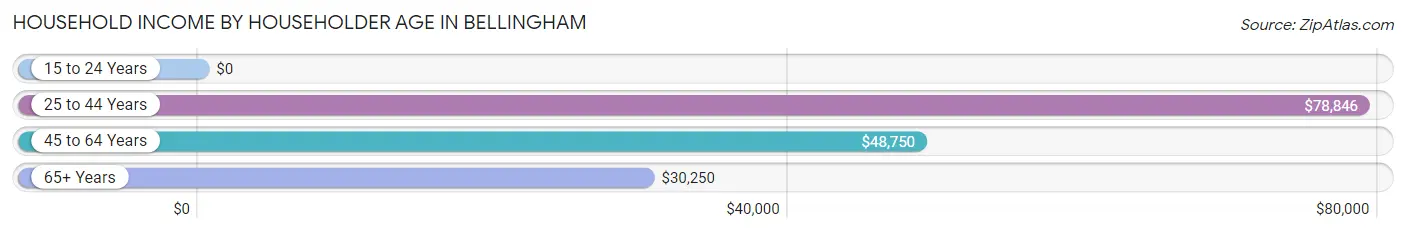
| Income Bracket | # Households | Median Income |
| 15 to 24 Years | 3 (4.3%) | $0 |
| 25 to 44 Years | 24 (34.3%) | $78,846 |
| 45 to 64 Years | 18 (25.7%) | $48,750 |
| 65+ Years | 25 (35.7%) | $30,250 |
| Total | 70 (100.0%) | $50,833 |
Poverty in Bellingham
Income Below Poverty by Sex and Age in Bellingham
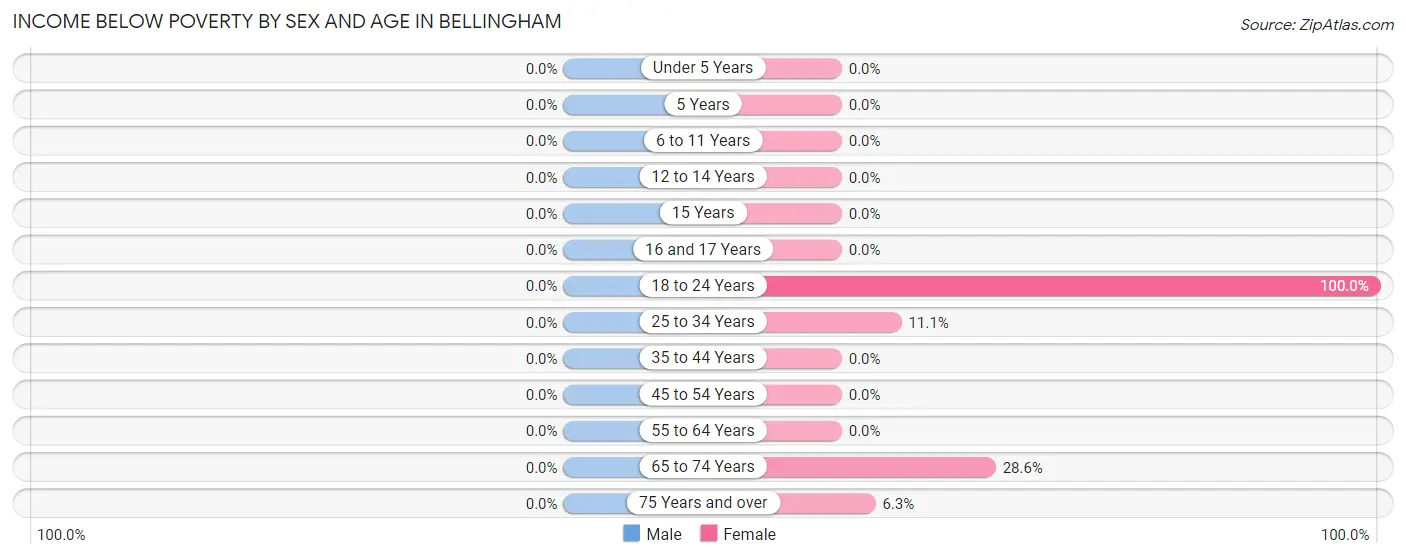
| Age Bracket | Male | Female |
| Under 5 Years | 0 (0.0%) | 0 (0.0%) |
| 5 Years | 0 (0.0%) | 0 (0.0%) |
| 6 to 11 Years | 0 (0.0%) | 0 (0.0%) |
| 12 to 14 Years | 0 (0.0%) | 0 (0.0%) |
| 15 Years | 0 (0.0%) | 0 (0.0%) |
| 16 and 17 Years | 0 (0.0%) | 0 (0.0%) |
| 18 to 24 Years | 0 (0.0%) | 3 (100.0%) |
| 25 to 34 Years | 0 (0.0%) | 1 (11.1%) |
| 35 to 44 Years | 0 (0.0%) | 0 (0.0%) |
| 45 to 54 Years | 0 (0.0%) | 0 (0.0%) |
| 55 to 64 Years | 0 (0.0%) | 0 (0.0%) |
| 65 to 74 Years | 0 (0.0%) | 2 (28.6%) |
| 75 Years and over | 0 (0.0%) | 1 (6.2%) |
| Total | 0 (0.0%) | 7 (7.4%) |
Income Above Poverty by Sex and Age in Bellingham
According to the poverty statistics in Bellingham, males aged under 5 years and females aged under 5 years are the age groups that are most secure financially, with 100.0% of males and 100.0% of females in these age groups living above the poverty line.
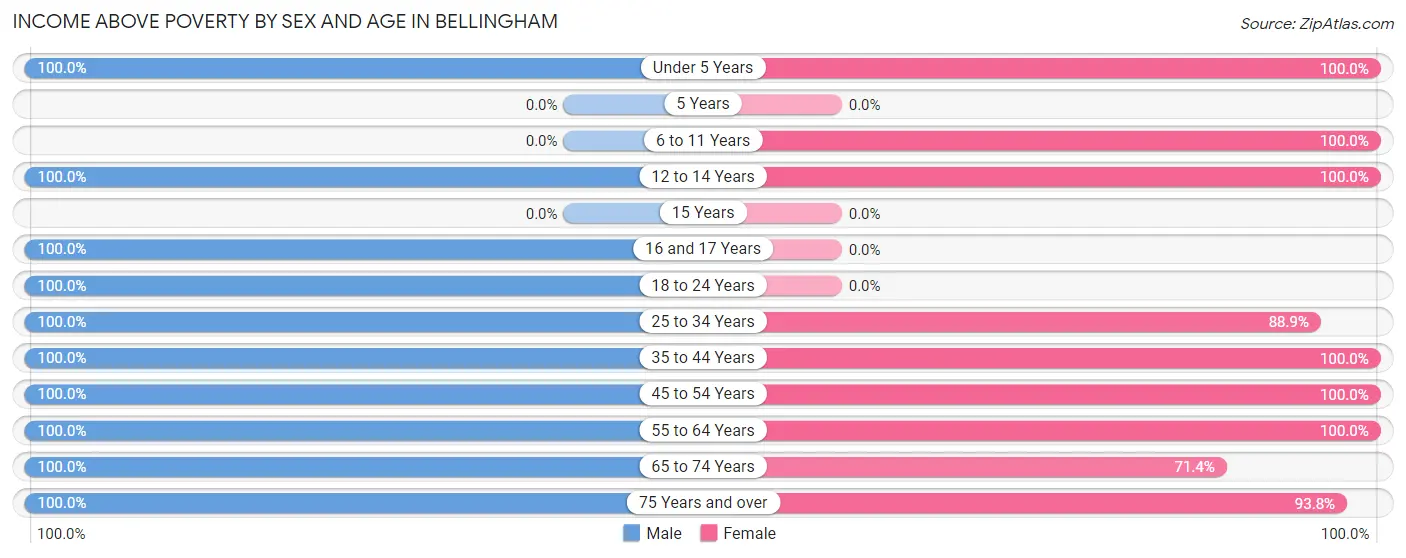
| Age Bracket | Male | Female |
| Under 5 Years | 3 (100.0%) | 3 (100.0%) |
| 5 Years | 0 (0.0%) | 0 (0.0%) |
| 6 to 11 Years | 0 (0.0%) | 13 (100.0%) |
| 12 to 14 Years | 16 (100.0%) | 5 (100.0%) |
| 15 Years | 0 (0.0%) | 0 (0.0%) |
| 16 and 17 Years | 6 (100.0%) | 0 (0.0%) |
| 18 to 24 Years | 9 (100.0%) | 0 (0.0%) |
| 25 to 34 Years | 5 (100.0%) | 8 (88.9%) |
| 35 to 44 Years | 19 (100.0%) | 19 (100.0%) |
| 45 to 54 Years | 5 (100.0%) | 11 (100.0%) |
| 55 to 64 Years | 8 (100.0%) | 9 (100.0%) |
| 65 to 74 Years | 6 (100.0%) | 5 (71.4%) |
| 75 Years and over | 5 (100.0%) | 15 (93.8%) |
| Total | 82 (100.0%) | 88 (92.6%) |
Income Below Poverty Among Married-Couple Families in Bellingham
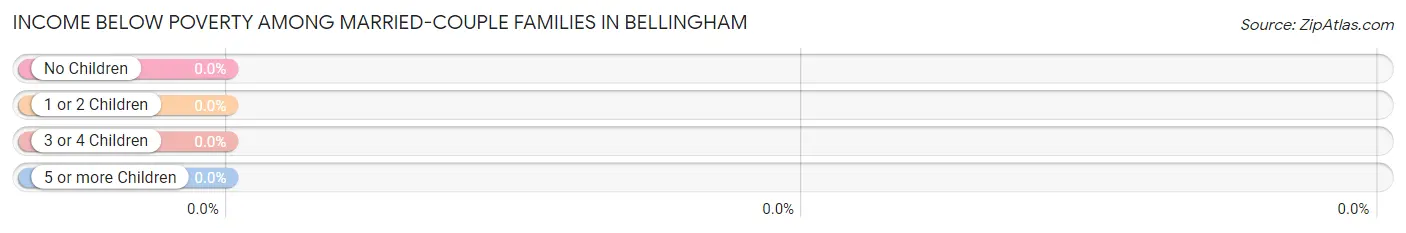
| Children | Above Poverty | Below Poverty |
| No Children | 18 (100.0%) | 0 (0.0%) |
| 1 or 2 Children | 8 (100.0%) | 0 (0.0%) |
| 3 or 4 Children | 14 (100.0%) | 0 (0.0%) |
| 5 or more Children | 0 (0.0%) | 0 (0.0%) |
| Total | 40 (100.0%) | 0 (0.0%) |
Income Below Poverty Among Single-Parent Households in Bellingham
| Children | Single Father | Single Mother |
| No Children | 0 (0.0%) | 0 (0.0%) |
| 1 or 2 Children | 0 (0.0%) | 0 (0.0%) |
| 3 or 4 Children | 0 (0.0%) | 0 (0.0%) |
| 5 or more Children | 0 (0.0%) | 0 (0.0%) |
| Total | 0 (0.0%) | 0 (0.0%) |
Income Below Poverty Among Married-Couple vs Single-Parent Households in Bellingham
| Children | Married-Couple Families | Single-Parent Households |
| No Children | 0 (0.0%) | 0 (0.0%) |
| 1 or 2 Children | 0 (0.0%) | 0 (0.0%) |
| 3 or 4 Children | 0 (0.0%) | 0 (0.0%) |
| 5 or more Children | 0 (0.0%) | 0 (0.0%) |
| Total | 0 (0.0%) | 0 (0.0%) |
Race in Bellingham
The most populous races in Bellingham are White / Caucasian (180 | 98.4%), and Two or more Races (3 | 1.6%).
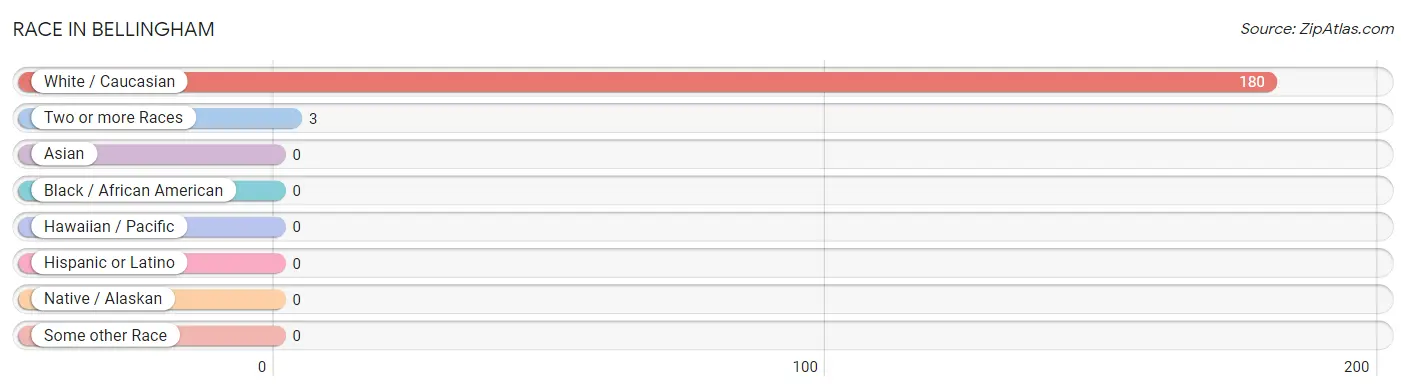
| Race | # Population | % Population |
| Asian | 0 | 0.0% |
| Black / African American | 0 | 0.0% |
| Hawaiian / Pacific | 0 | 0.0% |
| Hispanic or Latino | 0 | 0.0% |
| Native / Alaskan | 0 | 0.0% |
| White / Caucasian | 180 | 98.4% |
| Two or more Races | 3 | 1.6% |
| Some other Race | 0 | 0.0% |
| Total | 183 | 100.0% |
Ancestry in Bellingham
The most populous ancestries reported in Bellingham are German (92 | 50.3%), Swiss (41 | 22.4%), Norwegian (17 | 9.3%), Irish (8 | 4.4%), and Russian (4 | 2.2%), together accounting for 88.5% of all Bellingham residents.
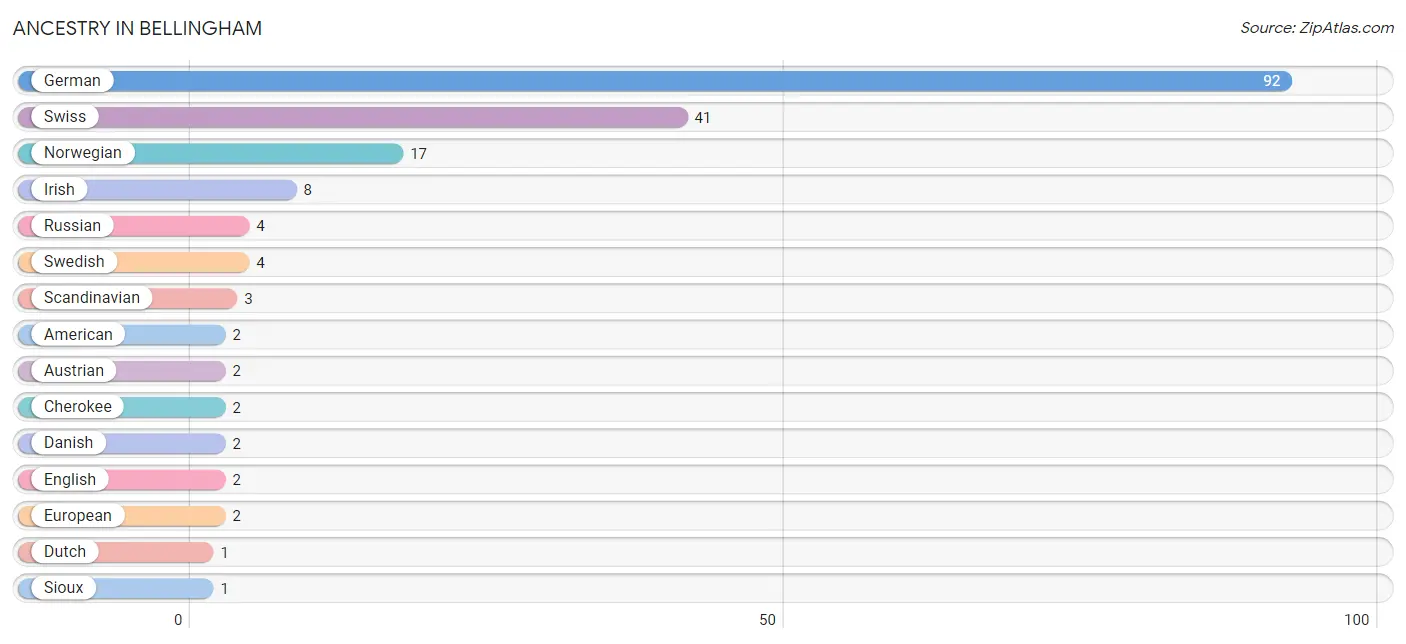
| Ancestry | # Population | % Population |
| American | 2 | 1.1% |
| Austrian | 2 | 1.1% |
| Cherokee | 2 | 1.1% |
| Danish | 2 | 1.1% |
| Dutch | 1 | 0.5% |
| English | 2 | 1.1% |
| European | 2 | 1.1% |
| German | 92 | 50.3% |
| Irish | 8 | 4.4% |
| Norwegian | 17 | 9.3% |
| Russian | 4 | 2.2% |
| Scandinavian | 3 | 1.6% |
| Sioux | 1 | 0.5% |
| Swedish | 4 | 2.2% |
| Swiss | 41 | 22.4% | View All 15 Rows |
Immigrants in Bellingham

| Immigration Origin | # Population | % Population | View All 0 Rows |
Sex and Age in Bellingham
Sex and Age in Bellingham
The most populous age groups in Bellingham are 10 to 14 Years (16 | 18.2%) for men and 35 to 39 Years (19 | 20.0%) for women.
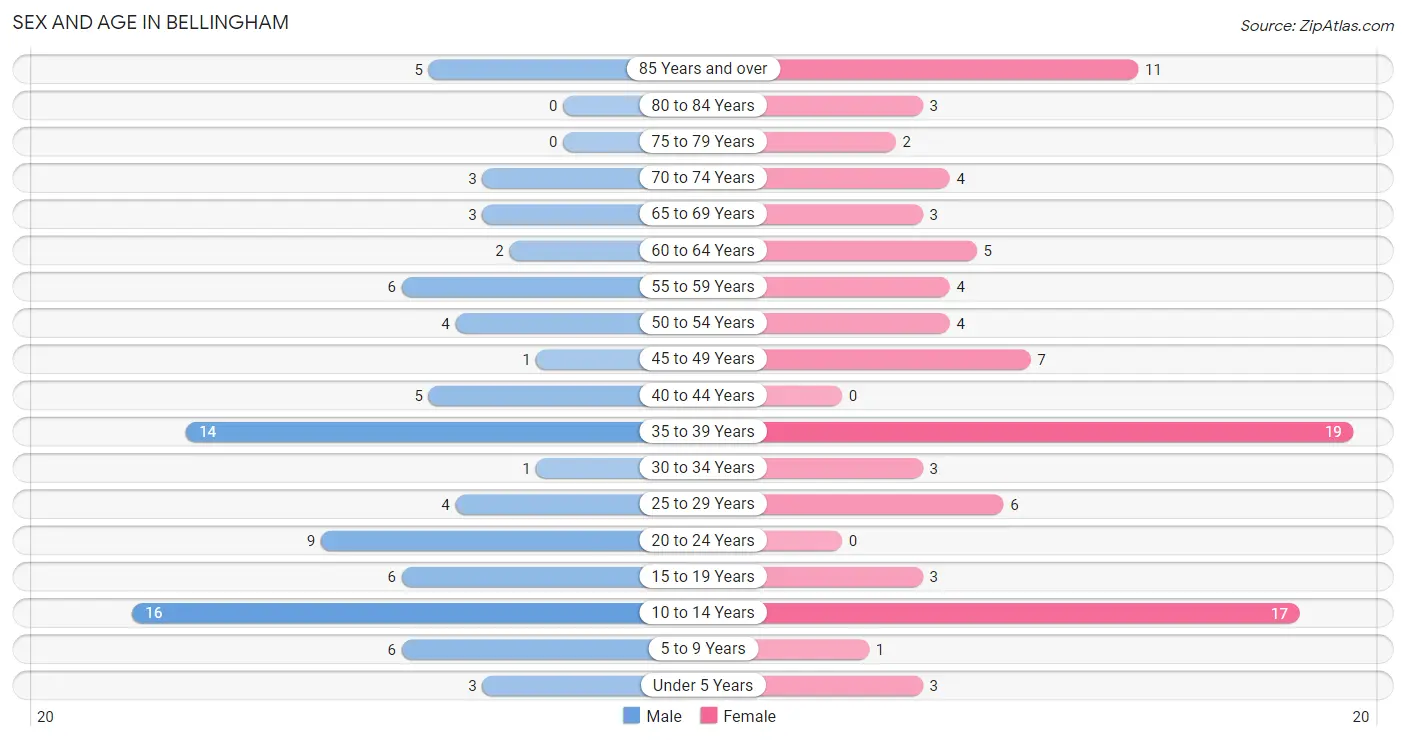
| Age Bracket | Male | Female |
| Under 5 Years | 3 (3.4%) | 3 (3.2%) |
| 5 to 9 Years | 6 (6.8%) | 1 (1.1%) |
| 10 to 14 Years | 16 (18.2%) | 17 (17.9%) |
| 15 to 19 Years | 6 (6.8%) | 3 (3.2%) |
| 20 to 24 Years | 9 (10.2%) | 0 (0.0%) |
| 25 to 29 Years | 4 (4.5%) | 6 (6.3%) |
| 30 to 34 Years | 1 (1.1%) | 3 (3.2%) |
| 35 to 39 Years | 14 (15.9%) | 19 (20.0%) |
| 40 to 44 Years | 5 (5.7%) | 0 (0.0%) |
| 45 to 49 Years | 1 (1.1%) | 7 (7.4%) |
| 50 to 54 Years | 4 (4.5%) | 4 (4.2%) |
| 55 to 59 Years | 6 (6.8%) | 4 (4.2%) |
| 60 to 64 Years | 2 (2.3%) | 5 (5.3%) |
| 65 to 69 Years | 3 (3.4%) | 3 (3.2%) |
| 70 to 74 Years | 3 (3.4%) | 4 (4.2%) |
| 75 to 79 Years | 0 (0.0%) | 2 (2.1%) |
| 80 to 84 Years | 0 (0.0%) | 3 (3.2%) |
| 85 Years and over | 5 (5.7%) | 11 (11.6%) |
| Total | 88 (100.0%) | 95 (100.0%) |
Families and Households in Bellingham
Median Family Size in Bellingham
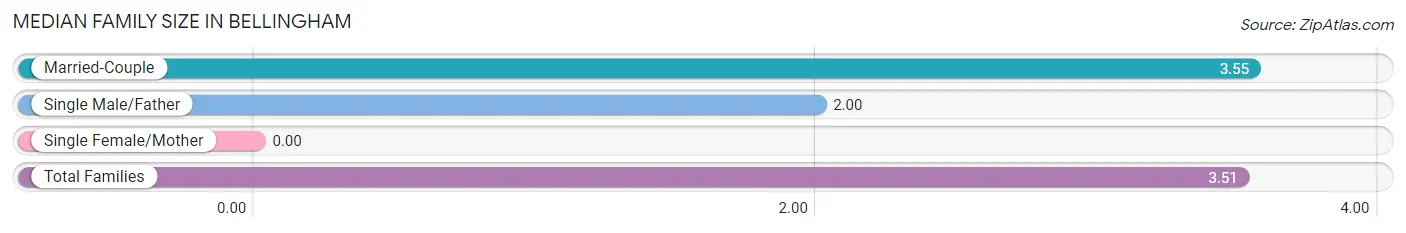
| Family Type | # Families | Family Size |
| Married-Couple | 40 (97.6%) | 3.55 |
| Single Male/Father | 1 (2.4%) | 2.00 |
| Single Female/Mother | 0 (0.0%) | - |
| Total Families | 41 (100.0%) | 3.51 |
Median Household Size in Bellingham
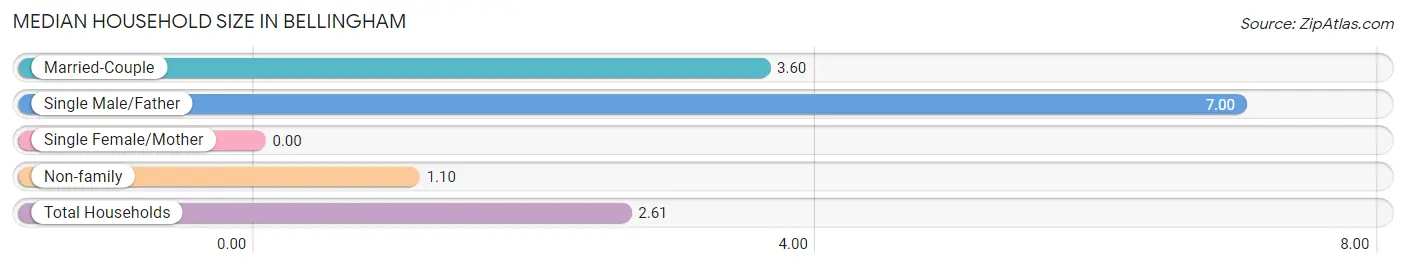
| Household Type | # Households | Household Size |
| Married-Couple | 40 (57.1%) | 3.60 |
| Single Male/Father | 1 (1.4%) | 7.00 |
| Single Female/Mother | 0 (0.0%) | - |
| Non-family | 29 (41.4%) | 1.10 |
| Total Households | 70 (100.0%) | 2.61 |
Household Size by Marriage Status in Bellingham
Out of a total of 70 households in Bellingham, 41 (58.6%) are family households, while 29 (41.4%) are nonfamily households. The most numerous type of family households are 5-person households, comprising 19, and the most common type of nonfamily households are 1-person households, comprising 25.
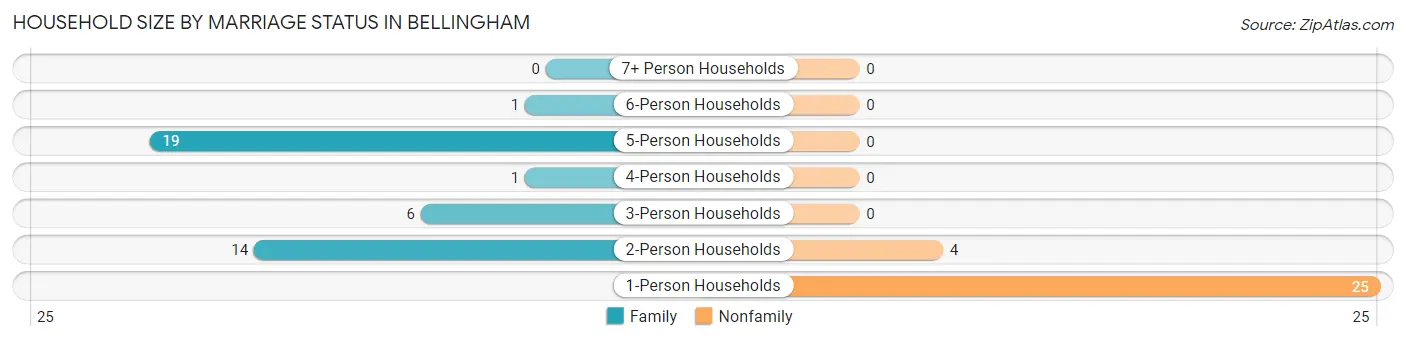
| Household Size | Family Households | Nonfamily Households |
| 1-Person Households | - | 25 (35.7%) |
| 2-Person Households | 14 (20.0%) | 4 (5.7%) |
| 3-Person Households | 6 (8.6%) | 0 (0.0%) |
| 4-Person Households | 1 (1.4%) | 0 (0.0%) |
| 5-Person Households | 19 (27.1%) | 0 (0.0%) |
| 6-Person Households | 1 (1.4%) | 0 (0.0%) |
| 7+ Person Households | 0 (0.0%) | 0 (0.0%) |
| Total | 41 (58.6%) | 29 (41.4%) |
Female Fertility in Bellingham
Fertility by Age in Bellingham
Average fertility rate in Bellingham is 79.0 births per 1,000 women. Women in the age bracket of 20 to 34 years have the highest fertility rate with 222.0 births per 1,000 women. Women in the age bracket of 20 to 34 years acount for 66.7% of all women with births.
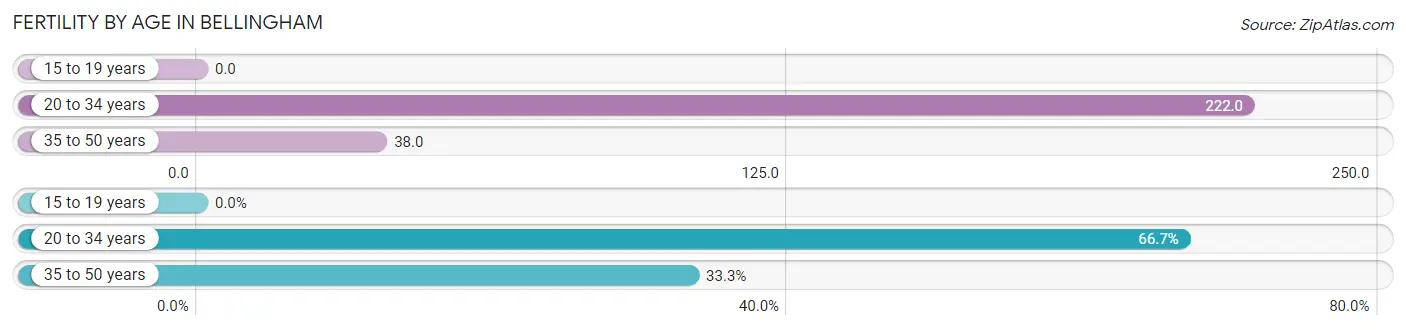
| Age Bracket | Women with Births | Births / 1,000 Women |
| 15 to 19 years | 0 (0.0%) | 0.0 |
| 20 to 34 years | 2 (66.7%) | 222.0 |
| 35 to 50 years | 1 (33.3%) | 38.0 |
| Total | 3 (100.0%) | 79.0 |
Fertility by Age by Marriage Status in Bellingham
66.7% of women with births (3) in Bellingham are married. The highest percentage of unmarried women with births falls into 20 to 34 years age bracket with 50.0% of them unmarried at the time of birth, while the lowest percentage of unmarried women with births belong to 35 to 50 years age bracket with 0.0% of them unmarried.
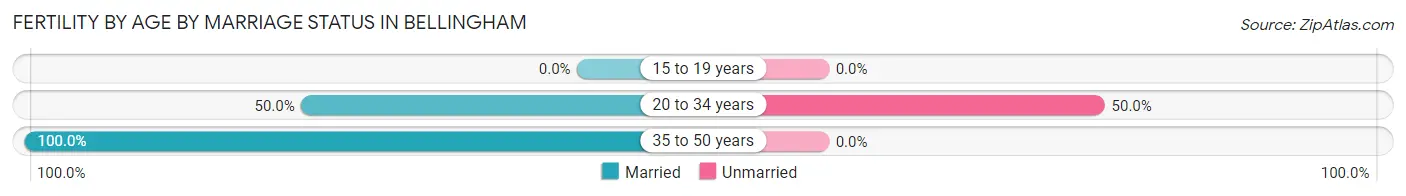
| Age Bracket | Married | Unmarried |
| 15 to 19 years | 0 (0.0%) | 0 (0.0%) |
| 20 to 34 years | 1 (50.0%) | 1 (50.0%) |
| 35 to 50 years | 1 (100.0%) | 0 (0.0%) |
| Total | 2 (66.7%) | 1 (33.3%) |
Fertility by Education in Bellingham
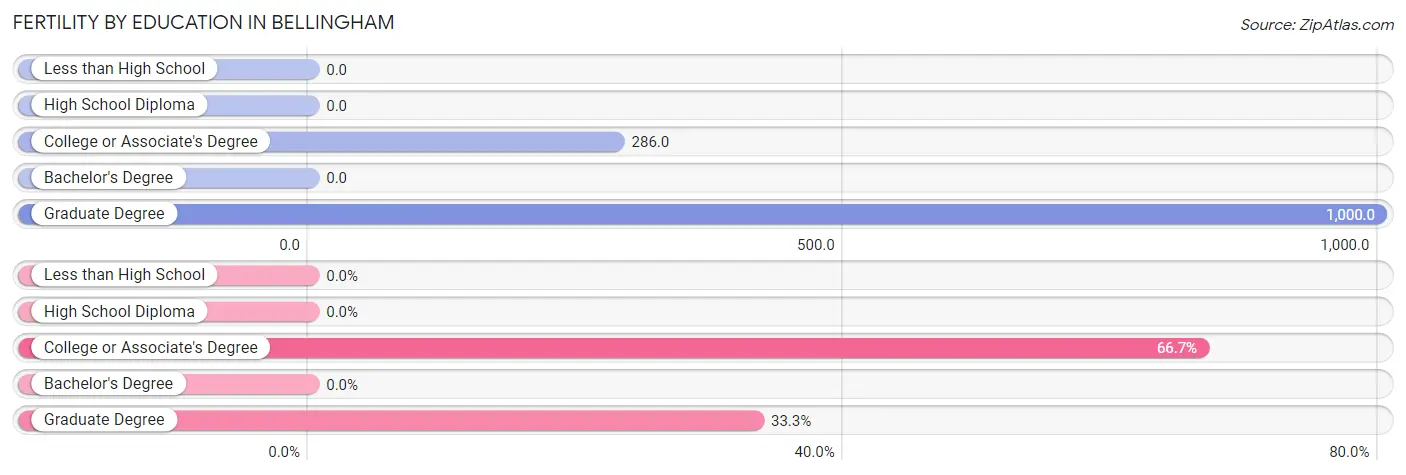
| Educational Attainment | Women with Births | Births / 1,000 Women |
| Less than High School | 0 (0.0%) | 0.0 |
| High School Diploma | 0 (0.0%) | 0.0 |
| College or Associate's Degree | 2 (66.7%) | 286.0 |
| Bachelor's Degree | 0 (0.0%) | 0.0 |
| Graduate Degree | 1 (33.3%) | 1,000.0 |
| Total | 3 (100.0%) | 79.0 |
Fertility by Education by Marriage Status in Bellingham
33.3% of women with births in Bellingham are unmarried. Women with the educational attainment of graduate degree are most likely to be married with 100.0% of them married at childbirth, while women with the educational attainment of college or associate's degree are least likely to be married with 50.0% of them unmarried at childbirth.
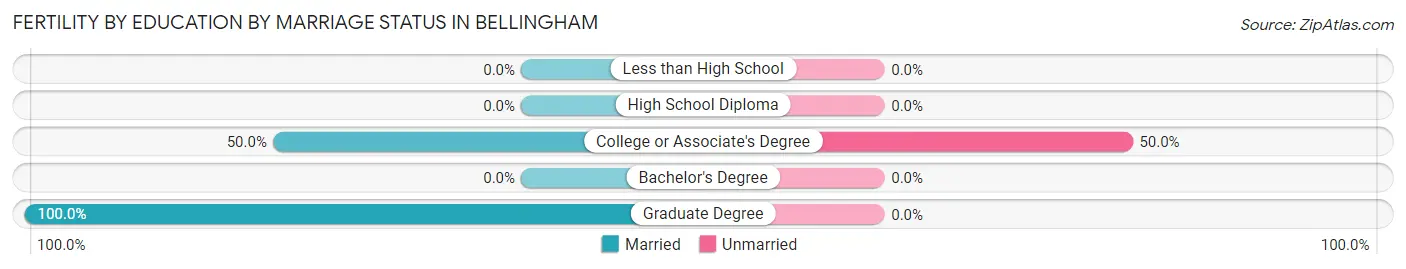
| Educational Attainment | Married | Unmarried |
| Less than High School | 0 (0.0%) | 0 (0.0%) |
| High School Diploma | 0 (0.0%) | 0 (0.0%) |
| College or Associate's Degree | 1 (50.0%) | 1 (50.0%) |
| Bachelor's Degree | 0 (0.0%) | 0 (0.0%) |
| Graduate Degree | 1 (100.0%) | 0 (0.0%) |
| Total | 2 (66.7%) | 1 (33.3%) |
Employment Characteristics in Bellingham
Employment by Class of Employer in Bellingham
Among the 76 employed individuals in Bellingham, private company employees (39 | 51.3%), self-employed (not incorporated) (15 | 19.7%), and local government employees (15 | 19.7%) make up the most common classes of employment.
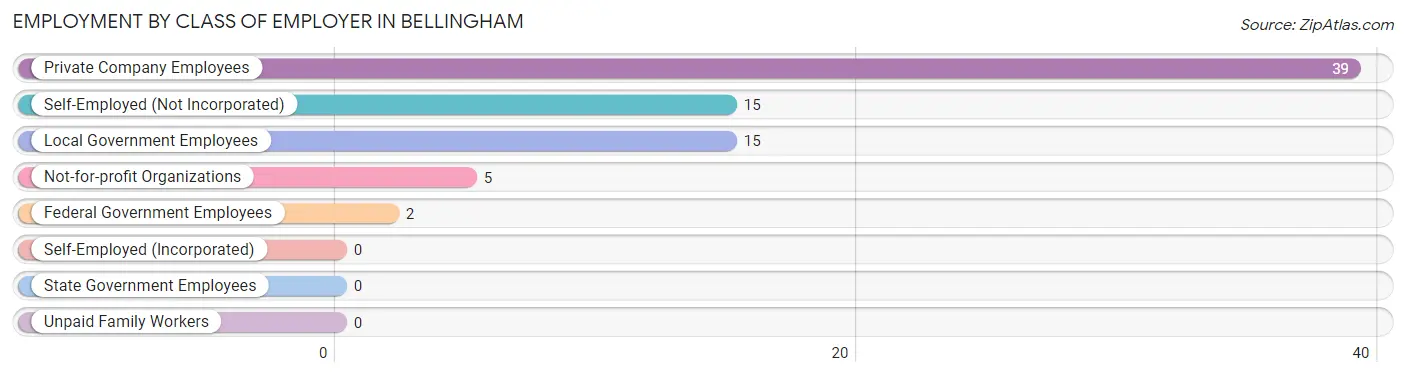
| Employer Class | # Employees | % Employees |
| Private Company Employees | 39 | 51.3% |
| Self-Employed (Incorporated) | 0 | 0.0% |
| Self-Employed (Not Incorporated) | 15 | 19.7% |
| Not-for-profit Organizations | 5 | 6.6% |
| Local Government Employees | 15 | 19.7% |
| State Government Employees | 0 | 0.0% |
| Federal Government Employees | 2 | 2.6% |
| Unpaid Family Workers | 0 | 0.0% |
| Total | 76 | 100.0% |
Employment Status by Age in Bellingham
According to the labor force statistics for Bellingham, out of the total population over 16 years of age (137), 57.7% or 79 individuals are in the labor force, with 1.3% or 1 of them unemployed. The age group with the highest labor force participation rate is 20 to 24 years, with 100.0% or 9 individuals in the labor force. Within the labor force, the 30 to 34 years age range has the highest percentage of unemployed individuals, with 50.0% or 1 of them being unemployed.
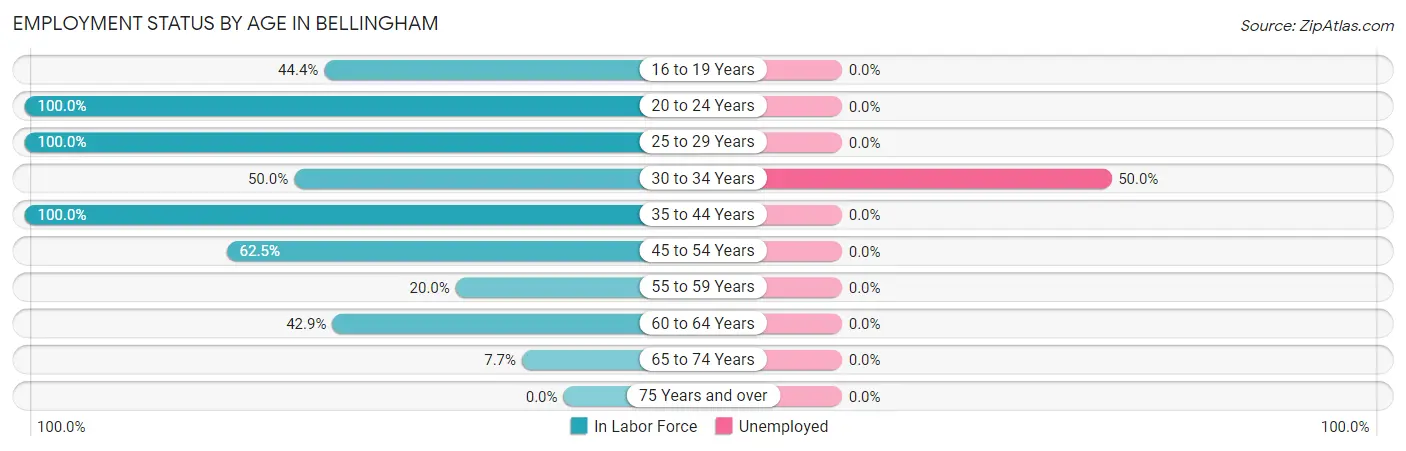
| Age Bracket | In Labor Force | Unemployed |
| 16 to 19 Years | 4 (44.4%) | 0 (0.0%) |
| 20 to 24 Years | 9 (100.0%) | 0 (0.0%) |
| 25 to 29 Years | 10 (100.0%) | 0 (0.0%) |
| 30 to 34 Years | 2 (50.0%) | 1 (50.0%) |
| 35 to 44 Years | 38 (100.0%) | 0 (0.0%) |
| 45 to 54 Years | 10 (62.5%) | 0 (0.0%) |
| 55 to 59 Years | 2 (20.0%) | 0 (0.0%) |
| 60 to 64 Years | 3 (42.9%) | 0 (0.0%) |
| 65 to 74 Years | 1 (7.7%) | 0 (0.0%) |
| 75 Years and over | 0 (0.0%) | 0 (0.0%) |
| Total | 79 (57.7%) | 1 (1.3%) |
Employment Status by Educational Attainment in Bellingham
According to labor force statistics for Bellingham, 76.5% of individuals (65) out of the total population between 25 and 64 years of age (85) are in the labor force, with 1.5% or 1 of them being unemployed. The group with the highest labor force participation rate are those with the educational attainment of bachelor's degree or higher, with 100.0% or 5 individuals in the labor force. Within the labor force, individuals with high school diploma education have the highest percentage of unemployment, with 2.5% or 1 of them being unemployed.
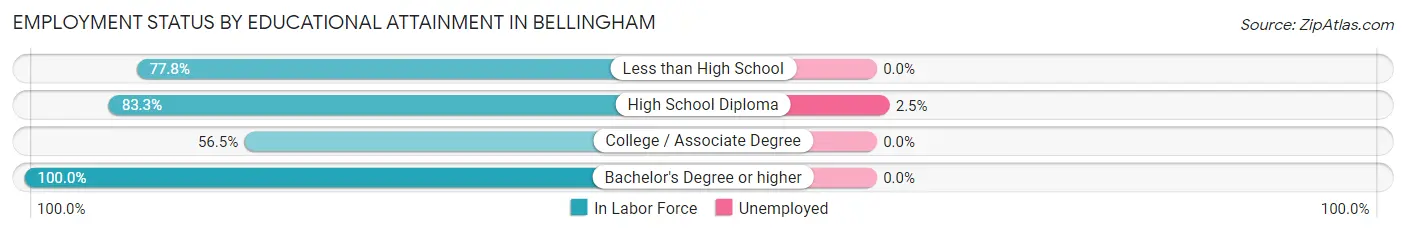
| Educational Attainment | In Labor Force | Unemployed |
| Less than High School | 7 (77.8%) | 0 (0.0%) |
| High School Diploma | 40 (83.3%) | 1 (2.5%) |
| College / Associate Degree | 13 (56.5%) | 0 (0.0%) |
| Bachelor's Degree or higher | 5 (100.0%) | 0 (0.0%) |
| Total | 65 (76.5%) | 1 (1.5%) |
Employment Occupations by Sex in Bellingham
Management, Business, Science and Arts Occupations
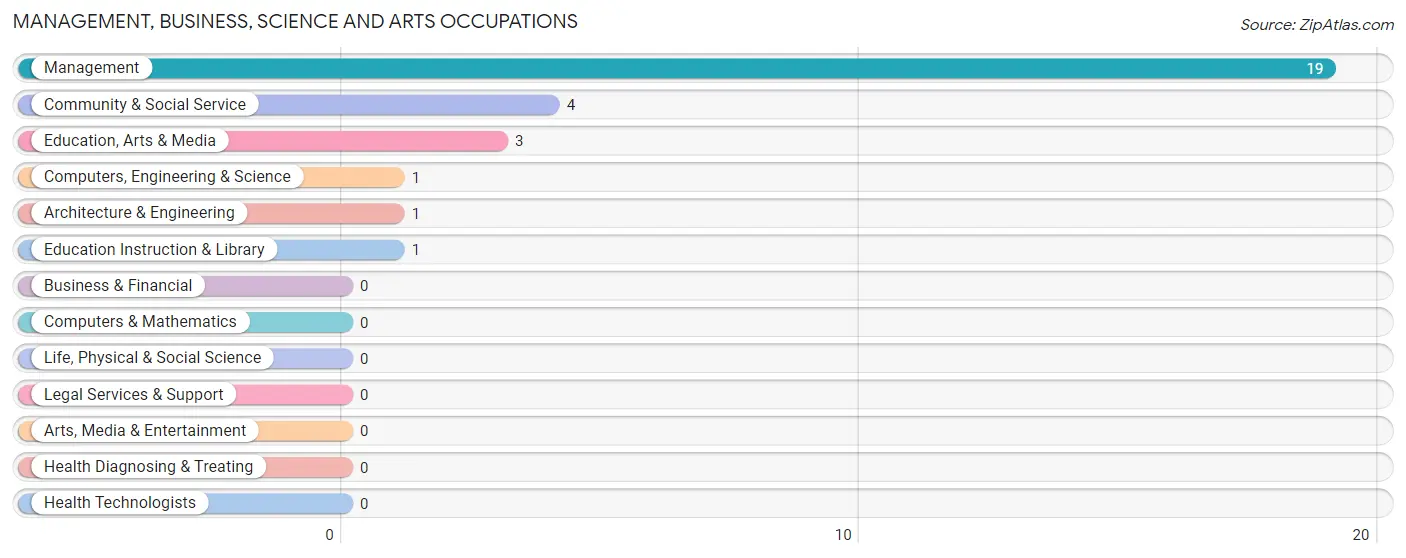
The most common Management, Business, Science and Arts occupations in Bellingham are Management (19 | 24.4%), Community & Social Service (4 | 5.1%), Education, Arts & Media (3 | 3.8%), Computers, Engineering & Science (1 | 1.3%), and Architecture & Engineering (1 | 1.3%).
Management, Business, Science and Arts Occupations by Sex
Within the Management, Business, Science and Arts occupations in Bellingham, the most male-oriented occupations are Computers, Engineering & Science (100.0%), Architecture & Engineering (100.0%), and Education, Arts & Media (66.7%), while the most female-oriented occupations are Education Instruction & Library (100.0%), Management (84.2%), and Community & Social Service (50.0%).
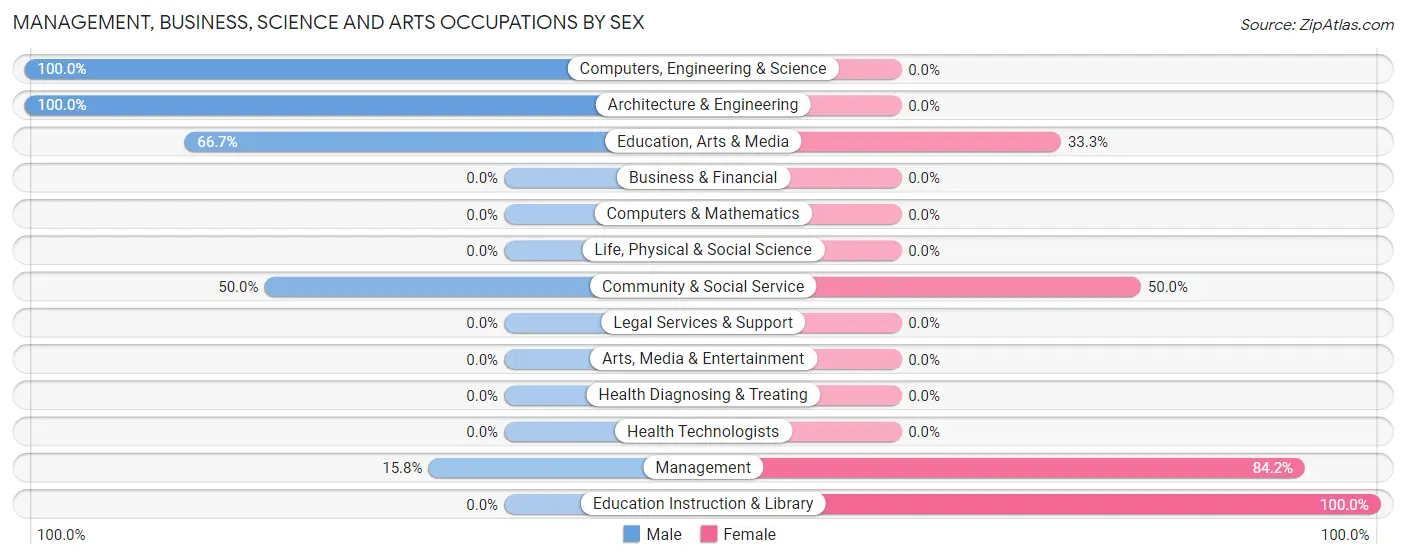
| Occupation | Male | Female |
| Management | 3 (15.8%) | 16 (84.2%) |
| Business & Financial | 0 (0.0%) | 0 (0.0%) |
| Computers, Engineering & Science | 1 (100.0%) | 0 (0.0%) |
| Computers & Mathematics | 0 (0.0%) | 0 (0.0%) |
| Architecture & Engineering | 1 (100.0%) | 0 (0.0%) |
| Life, Physical & Social Science | 0 (0.0%) | 0 (0.0%) |
| Community & Social Service | 2 (50.0%) | 2 (50.0%) |
| Education, Arts & Media | 2 (66.7%) | 1 (33.3%) |
| Legal Services & Support | 0 (0.0%) | 0 (0.0%) |
| Education Instruction & Library | 0 (0.0%) | 1 (100.0%) |
| Arts, Media & Entertainment | 0 (0.0%) | 0 (0.0%) |
| Health Diagnosing & Treating | 0 (0.0%) | 0 (0.0%) |
| Health Technologists | 0 (0.0%) | 0 (0.0%) |
| Total (Category) | 6 (25.0%) | 18 (75.0%) |
| Total (Overall) | 41 (52.6%) | 37 (47.4%) |
Services Occupations
The most common Services occupations in Bellingham are Healthcare Support (11 | 14.1%), and Personal Care & Service (5 | 6.4%).
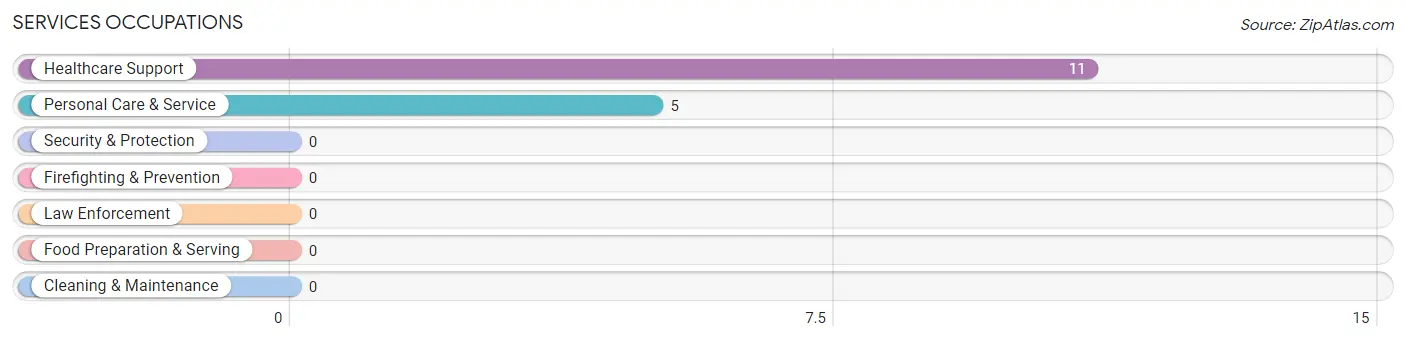
Services Occupations by Sex
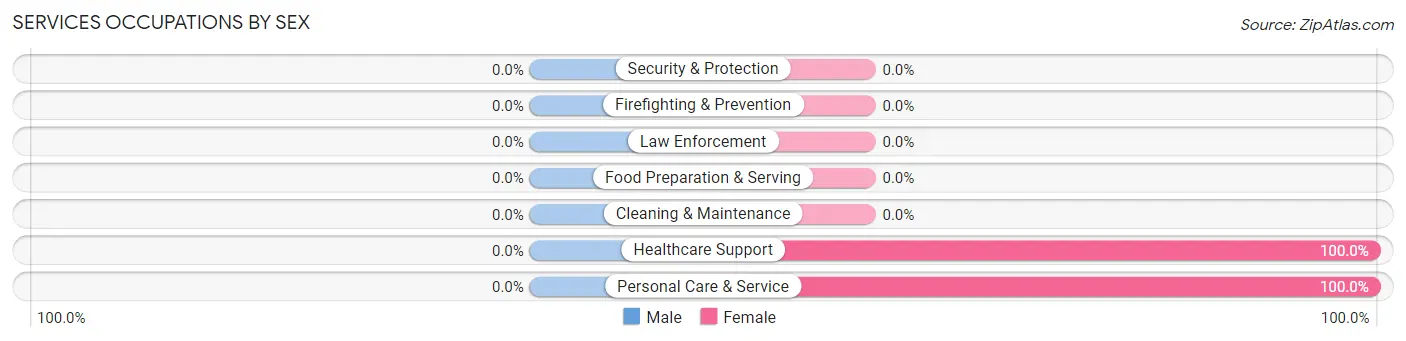
| Occupation | Male | Female |
| Healthcare Support | 0 (0.0%) | 11 (100.0%) |
| Security & Protection | 0 (0.0%) | 0 (0.0%) |
| Firefighting & Prevention | 0 (0.0%) | 0 (0.0%) |
| Law Enforcement | 0 (0.0%) | 0 (0.0%) |
| Food Preparation & Serving | 0 (0.0%) | 0 (0.0%) |
| Cleaning & Maintenance | 0 (0.0%) | 0 (0.0%) |
| Personal Care & Service | 0 (0.0%) | 5 (100.0%) |
| Total (Category) | 0 (0.0%) | 16 (100.0%) |
| Total (Overall) | 41 (52.6%) | 37 (47.4%) |
Sales and Office Occupations
The most common Sales and Office occupations in Bellingham are Sales & Related (10 | 12.8%), and Office & Administration (3 | 3.8%).
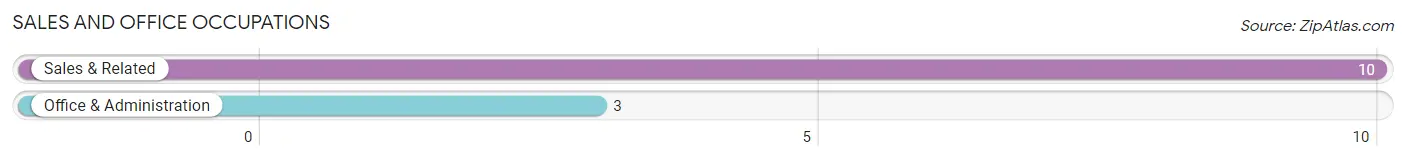
Sales and Office Occupations by Sex
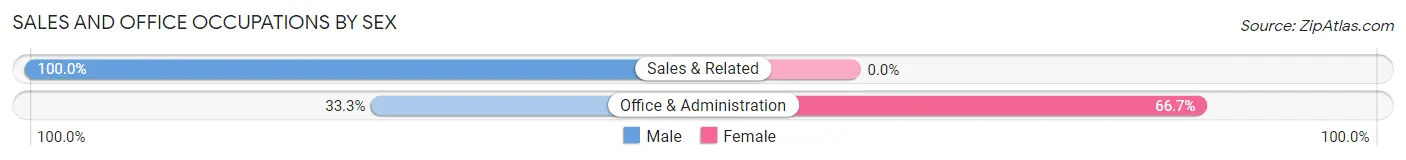
| Occupation | Male | Female |
| Sales & Related | 10 (100.0%) | 0 (0.0%) |
| Office & Administration | 1 (33.3%) | 2 (66.7%) |
| Total (Category) | 11 (84.6%) | 2 (15.4%) |
| Total (Overall) | 41 (52.6%) | 37 (47.4%) |
Natural Resources, Construction and Maintenance Occupations
The most common Natural Resources, Construction and Maintenance occupations in Bellingham are Construction & Extraction (12 | 15.4%), and Installation, Maintenance & Repair (5 | 6.4%).
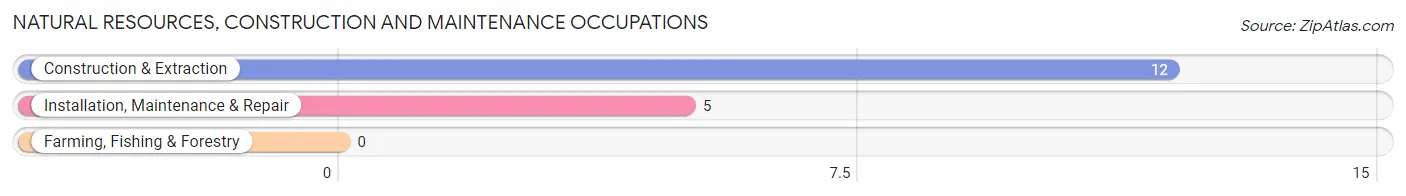
Natural Resources, Construction and Maintenance Occupations by Sex
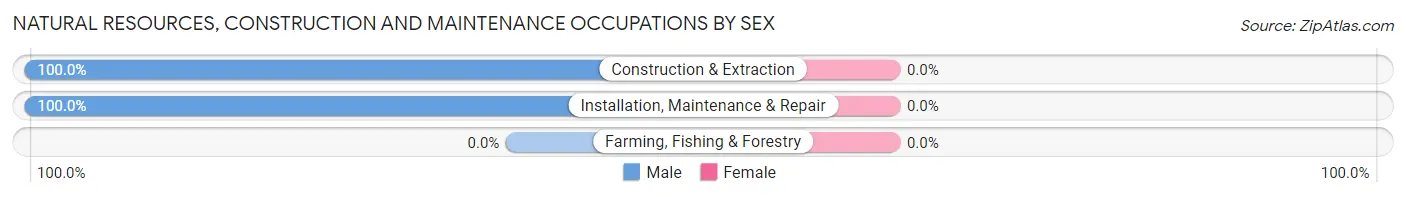
| Occupation | Male | Female |
| Farming, Fishing & Forestry | 0 (0.0%) | 0 (0.0%) |
| Construction & Extraction | 12 (100.0%) | 0 (0.0%) |
| Installation, Maintenance & Repair | 5 (100.0%) | 0 (0.0%) |
| Total (Category) | 17 (100.0%) | 0 (0.0%) |
| Total (Overall) | 41 (52.6%) | 37 (47.4%) |
Production, Transportation and Moving Occupations
The most common Production, Transportation and Moving occupations in Bellingham are Transportation (6 | 7.7%), Production (1 | 1.3%), and Material Moving (1 | 1.3%).
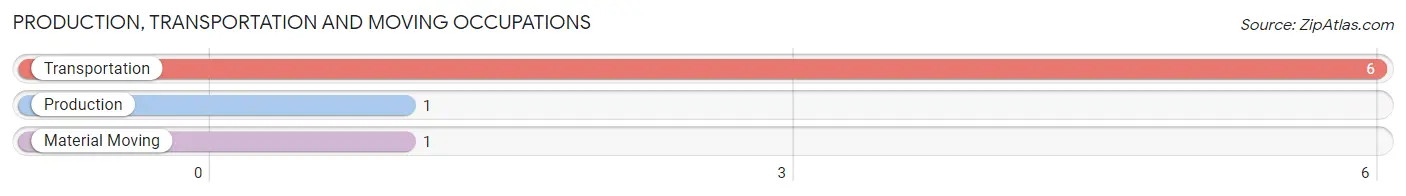
Production, Transportation and Moving Occupations by Sex
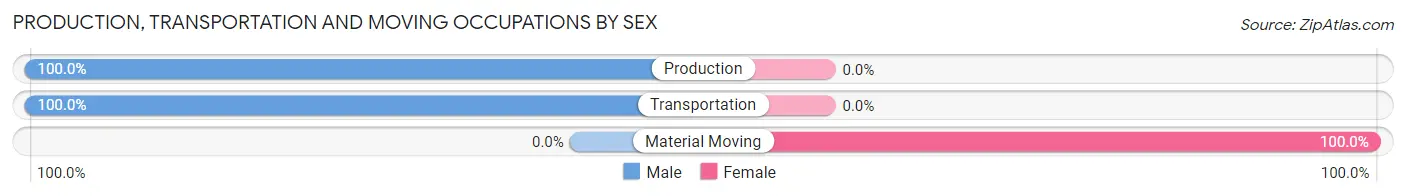
| Occupation | Male | Female |
| Production | 1 (100.0%) | 0 (0.0%) |
| Transportation | 6 (100.0%) | 0 (0.0%) |
| Material Moving | 0 (0.0%) | 1 (100.0%) |
| Total (Category) | 7 (87.5%) | 1 (12.5%) |
| Total (Overall) | 41 (52.6%) | 37 (47.4%) |
Employment Industries by Sex in Bellingham
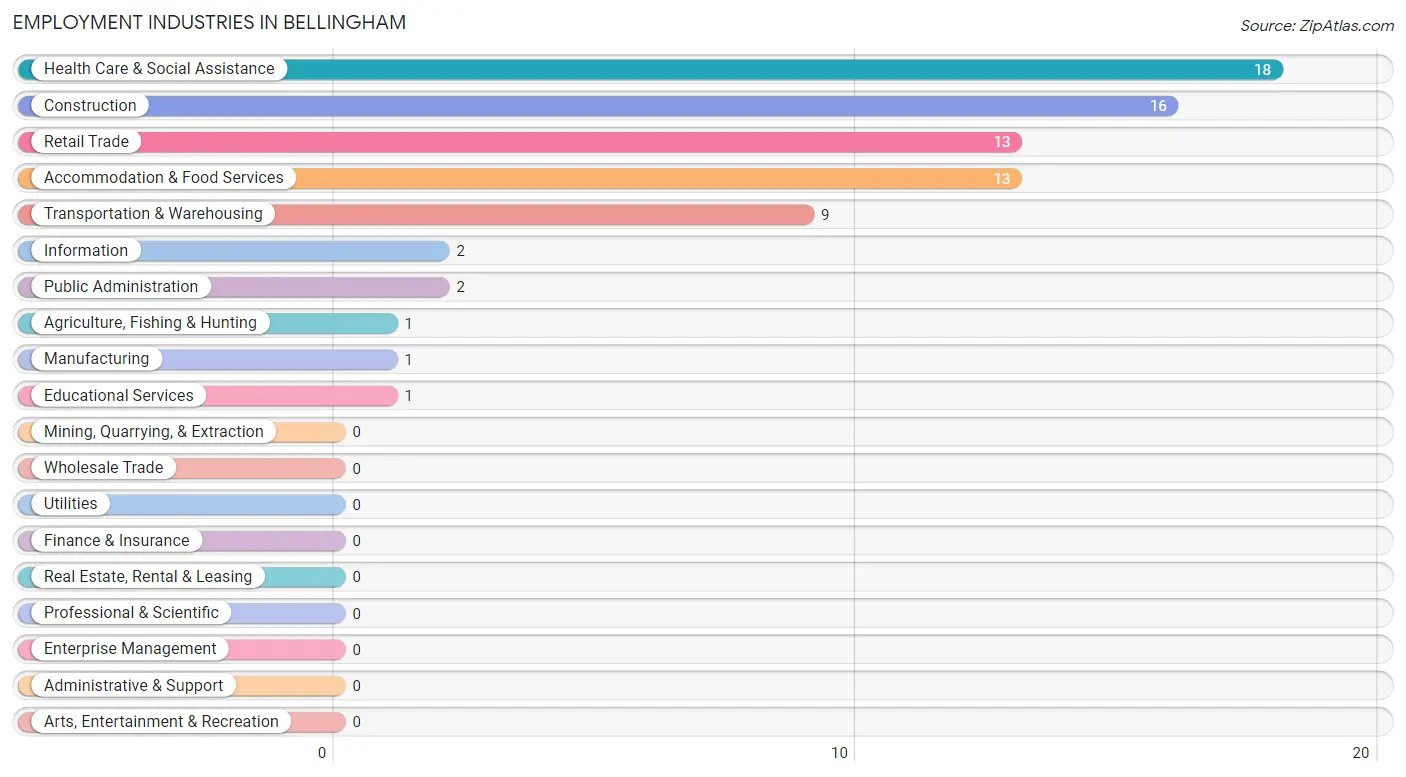
Employment Industries in Bellingham
The major employment industries in Bellingham include Health Care & Social Assistance (18 | 23.1%), Construction (16 | 20.5%), Retail Trade (13 | 16.7%), Accommodation & Food Services (13 | 16.7%), and Transportation & Warehousing (9 | 11.5%).
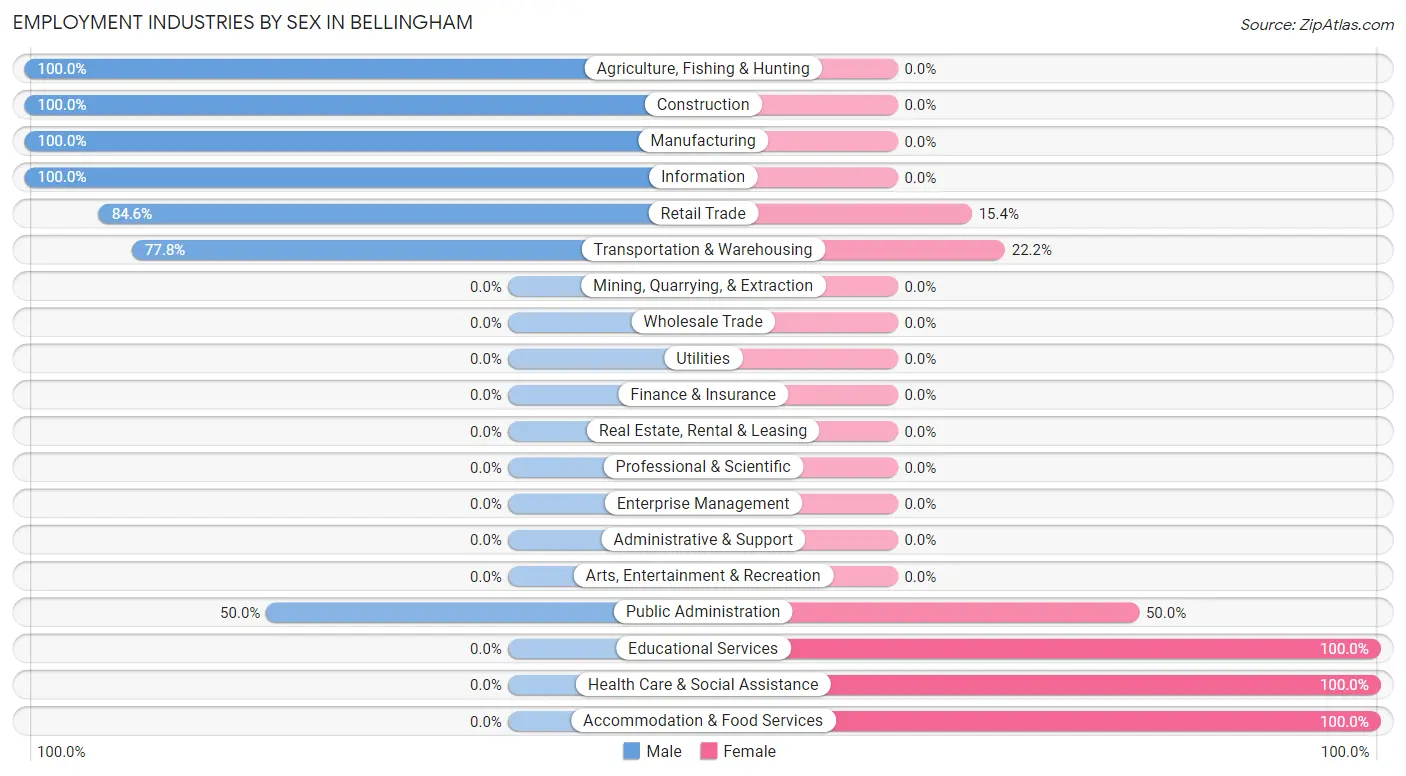
Employment Industries by Sex in Bellingham
The Bellingham industries that see more men than women are Agriculture, Fishing & Hunting (100.0%), Construction (100.0%), and Manufacturing (100.0%), whereas the industries that tend to have a higher number of women are Educational Services (100.0%), Health Care & Social Assistance (100.0%), and Accommodation & Food Services (100.0%).
| Industry | Male | Female |
| Agriculture, Fishing & Hunting | 1 (100.0%) | 0 (0.0%) |
| Mining, Quarrying, & Extraction | 0 (0.0%) | 0 (0.0%) |
| Construction | 16 (100.0%) | 0 (0.0%) |
| Manufacturing | 1 (100.0%) | 0 (0.0%) |
| Wholesale Trade | 0 (0.0%) | 0 (0.0%) |
| Retail Trade | 11 (84.6%) | 2 (15.4%) |
| Transportation & Warehousing | 7 (77.8%) | 2 (22.2%) |
| Utilities | 0 (0.0%) | 0 (0.0%) |
| Information | 2 (100.0%) | 0 (0.0%) |
| Finance & Insurance | 0 (0.0%) | 0 (0.0%) |
| Real Estate, Rental & Leasing | 0 (0.0%) | 0 (0.0%) |
| Professional & Scientific | 0 (0.0%) | 0 (0.0%) |
| Enterprise Management | 0 (0.0%) | 0 (0.0%) |
| Administrative & Support | 0 (0.0%) | 0 (0.0%) |
| Educational Services | 0 (0.0%) | 1 (100.0%) |
| Health Care & Social Assistance | 0 (0.0%) | 18 (100.0%) |
| Arts, Entertainment & Recreation | 0 (0.0%) | 0 (0.0%) |
| Accommodation & Food Services | 0 (0.0%) | 13 (100.0%) |
| Public Administration | 1 (50.0%) | 1 (50.0%) |
| Total | 41 (52.6%) | 37 (47.4%) |
Education in Bellingham
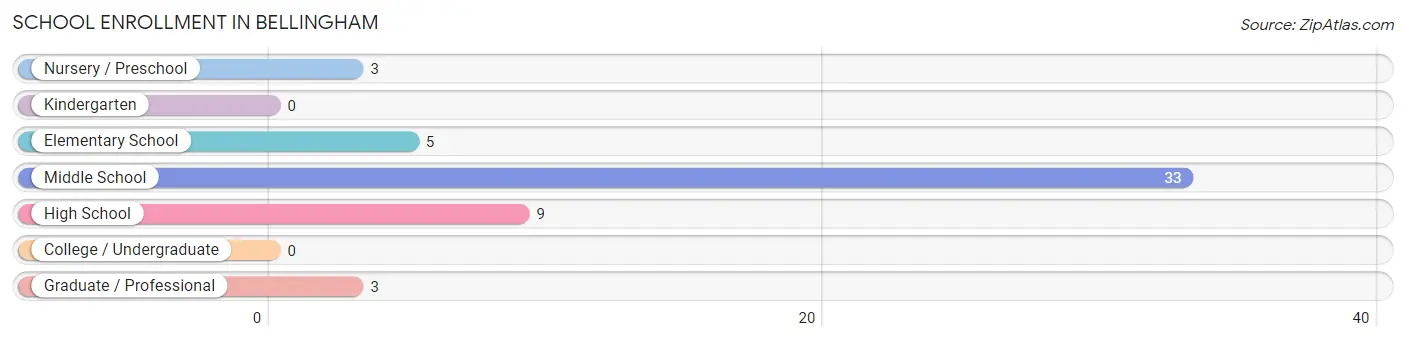
School Enrollment in Bellingham
The most common levels of schooling among the 53 students in Bellingham are middle school (33 | 62.3%), high school (9 | 17.0%), and elementary school (5 | 9.4%).
| School Level | # Students | % Students |
| Nursery / Preschool | 3 | 5.7% |
| Kindergarten | 0 | 0.0% |
| Elementary School | 5 | 9.4% |
| Middle School | 33 | 62.3% |
| High School | 9 | 17.0% |
| College / Undergraduate | 0 | 0.0% |
| Graduate / Professional | 3 | 5.7% |
| Total | 53 | 100.0% |
School Enrollment by Age by Funding Source in Bellingham
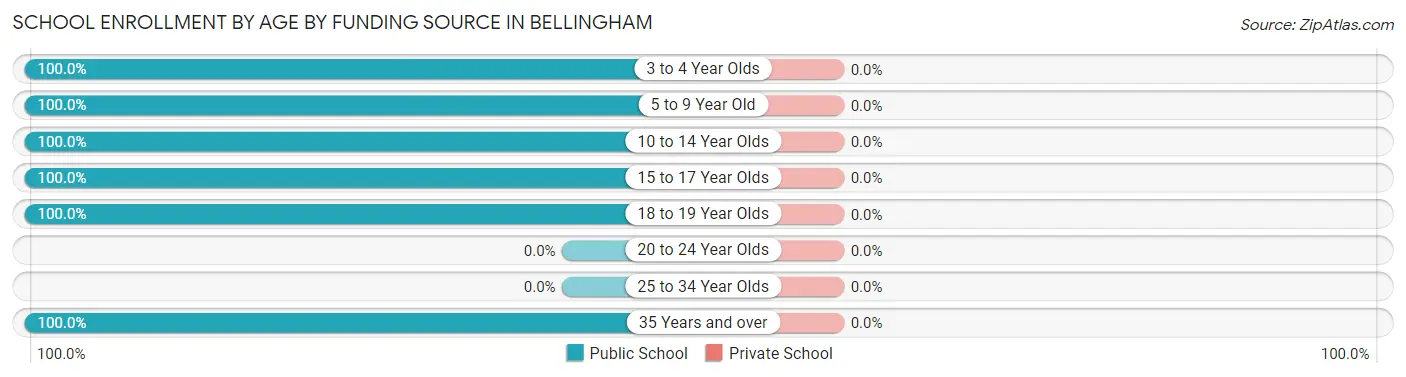
| Age Bracket | Public School | Private School |
| 3 to 4 Year Olds | 1 (100.0%) | 0 (0.0%) |
| 5 to 9 Year Old | 7 (100.0%) | 0 (0.0%) |
| 10 to 14 Year Olds | 33 (100.0%) | 0 (0.0%) |
| 15 to 17 Year Olds | 6 (100.0%) | 0 (0.0%) |
| 18 to 19 Year Olds | 3 (100.0%) | 0 (0.0%) |
| 20 to 24 Year Olds | 0 (0.0%) | 0 (0.0%) |
| 25 to 34 Year Olds | 0 (0.0%) | 0 (0.0%) |
| 35 Years and over | 3 (100.0%) | 0 (0.0%) |
| Total | 53 (100.0%) | 0 (0.0%) |
Educational Attainment by Field of Study in Bellingham
Social sciences (2 | 28.6%), science & technology (2 | 28.6%), education (2 | 28.6%), and psychology (1 | 14.3%) are the most common fields of study among 7 individuals in Bellingham who have obtained a bachelor's degree or higher.
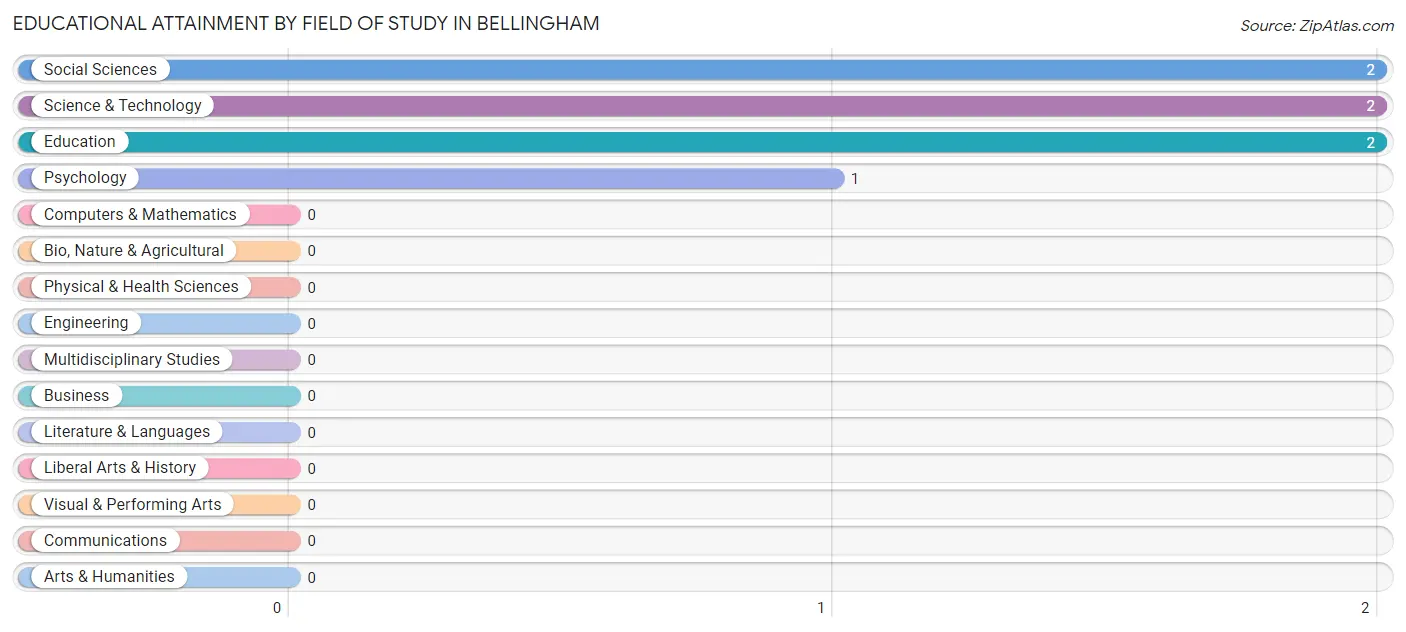
| Field of Study | # Graduates | % Graduates |
| Computers & Mathematics | 0 | 0.0% |
| Bio, Nature & Agricultural | 0 | 0.0% |
| Physical & Health Sciences | 0 | 0.0% |
| Psychology | 1 | 14.3% |
| Social Sciences | 2 | 28.6% |
| Engineering | 0 | 0.0% |
| Multidisciplinary Studies | 0 | 0.0% |
| Science & Technology | 2 | 28.6% |
| Business | 0 | 0.0% |
| Education | 2 | 28.6% |
| Literature & Languages | 0 | 0.0% |
| Liberal Arts & History | 0 | 0.0% |
| Visual & Performing Arts | 0 | 0.0% |
| Communications | 0 | 0.0% |
| Arts & Humanities | 0 | 0.0% |
| Total | 7 | 100.0% |
Transportation & Commute in Bellingham
Vehicle Availability by Sex in Bellingham
The most prevalent vehicle ownership categories in Bellingham are males with 4 vehicles (17, accounting for 43.6%) and females with 4 vehicles (6, making up 46.0%).
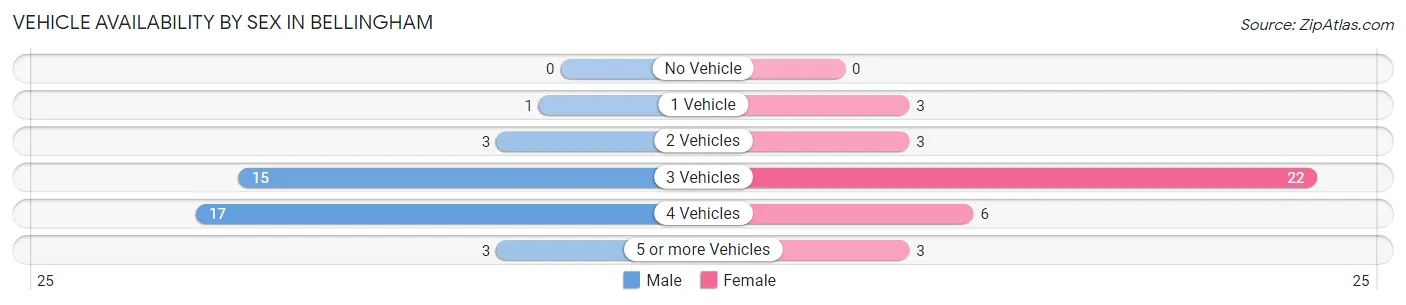
| Vehicles Available | Male | Female |
| No Vehicle | 0 (0.0%) | 0 (0.0%) |
| 1 Vehicle | 1 (2.6%) | 3 (8.1%) |
| 2 Vehicles | 3 (7.7%) | 3 (8.1%) |
| 3 Vehicles | 15 (38.5%) | 22 (59.5%) |
| 4 Vehicles | 17 (43.6%) | 6 (16.2%) |
| 5 or more Vehicles | 3 (7.7%) | 3 (8.1%) |
| Total | 39 (100.0%) | 37 (100.0%) |
Commute Time in Bellingham
The most frequently occuring commute durations in Bellingham are less than 5 minutes (30 commuters, 40.5%), 30 to 34 minutes (19 commuters, 25.7%), and 10 to 14 minutes (11 commuters, 14.9%).
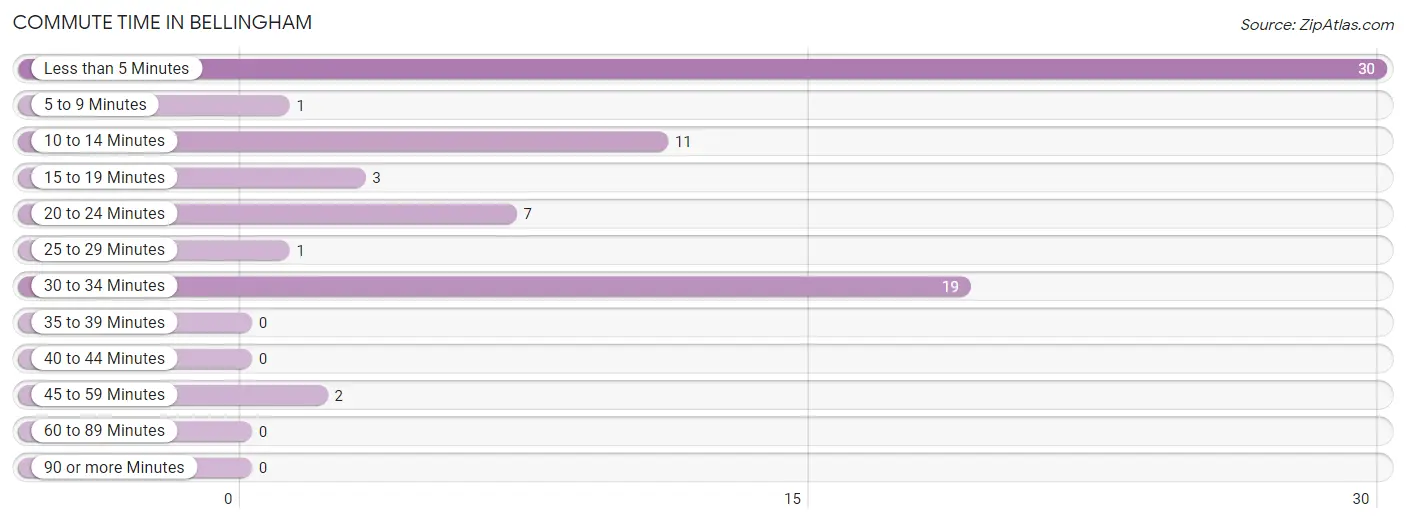
| Commute Time | # Commuters | % Commuters |
| Less than 5 Minutes | 30 | 40.5% |
| 5 to 9 Minutes | 1 | 1.3% |
| 10 to 14 Minutes | 11 | 14.9% |
| 15 to 19 Minutes | 3 | 4.1% |
| 20 to 24 Minutes | 7 | 9.5% |
| 25 to 29 Minutes | 1 | 1.3% |
| 30 to 34 Minutes | 19 | 25.7% |
| 35 to 39 Minutes | 0 | 0.0% |
| 40 to 44 Minutes | 0 | 0.0% |
| 45 to 59 Minutes | 2 | 2.7% |
| 60 to 89 Minutes | 0 | 0.0% |
| 90 or more Minutes | 0 | 0.0% |
Commute Time by Sex in Bellingham
The most common commute times in Bellingham are less than 5 minutes (17 commuters, 44.7%) for males and less than 5 minutes (13 commuters, 36.1%) for females.
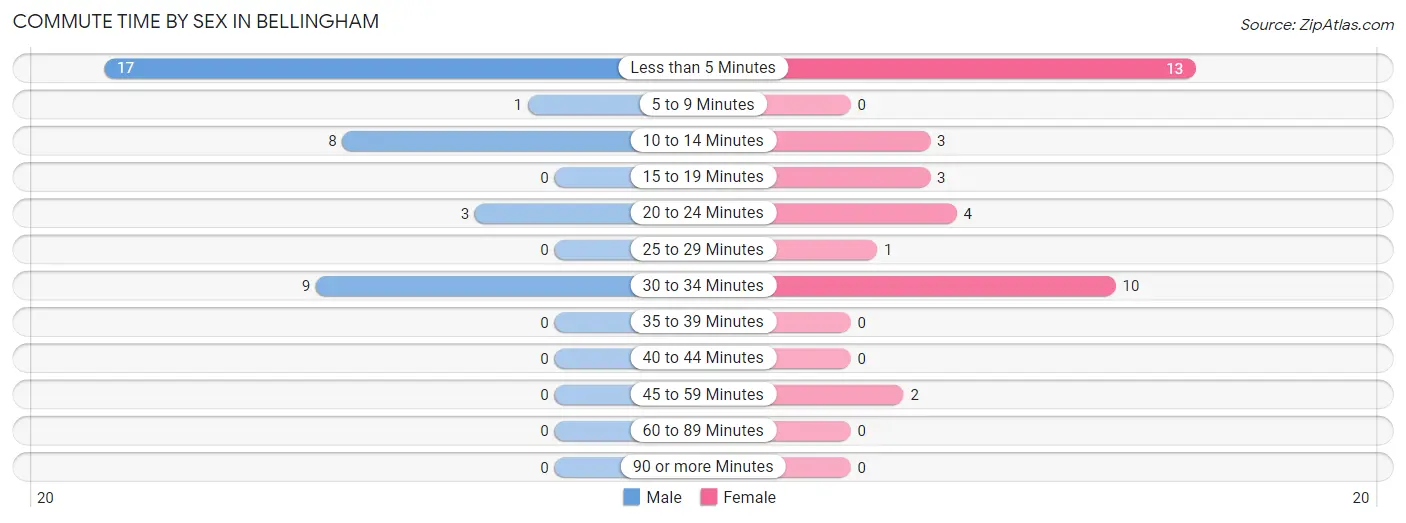
| Commute Time | Male | Female |
| Less than 5 Minutes | 17 (44.7%) | 13 (36.1%) |
| 5 to 9 Minutes | 1 (2.6%) | 0 (0.0%) |
| 10 to 14 Minutes | 8 (21.0%) | 3 (8.3%) |
| 15 to 19 Minutes | 0 (0.0%) | 3 (8.3%) |
| 20 to 24 Minutes | 3 (7.9%) | 4 (11.1%) |
| 25 to 29 Minutes | 0 (0.0%) | 1 (2.8%) |
| 30 to 34 Minutes | 9 (23.7%) | 10 (27.8%) |
| 35 to 39 Minutes | 0 (0.0%) | 0 (0.0%) |
| 40 to 44 Minutes | 0 (0.0%) | 0 (0.0%) |
| 45 to 59 Minutes | 0 (0.0%) | 2 (5.6%) |
| 60 to 89 Minutes | 0 (0.0%) | 0 (0.0%) |
| 90 or more Minutes | 0 (0.0%) | 0 (0.0%) |
Time of Departure to Work by Sex in Bellingham
The most frequent times of departure to work in Bellingham are 7:30 AM to 7:59 AM (14, 36.8%) for males and 8:00 AM to 8:29 AM (18, 50.0%) for females.
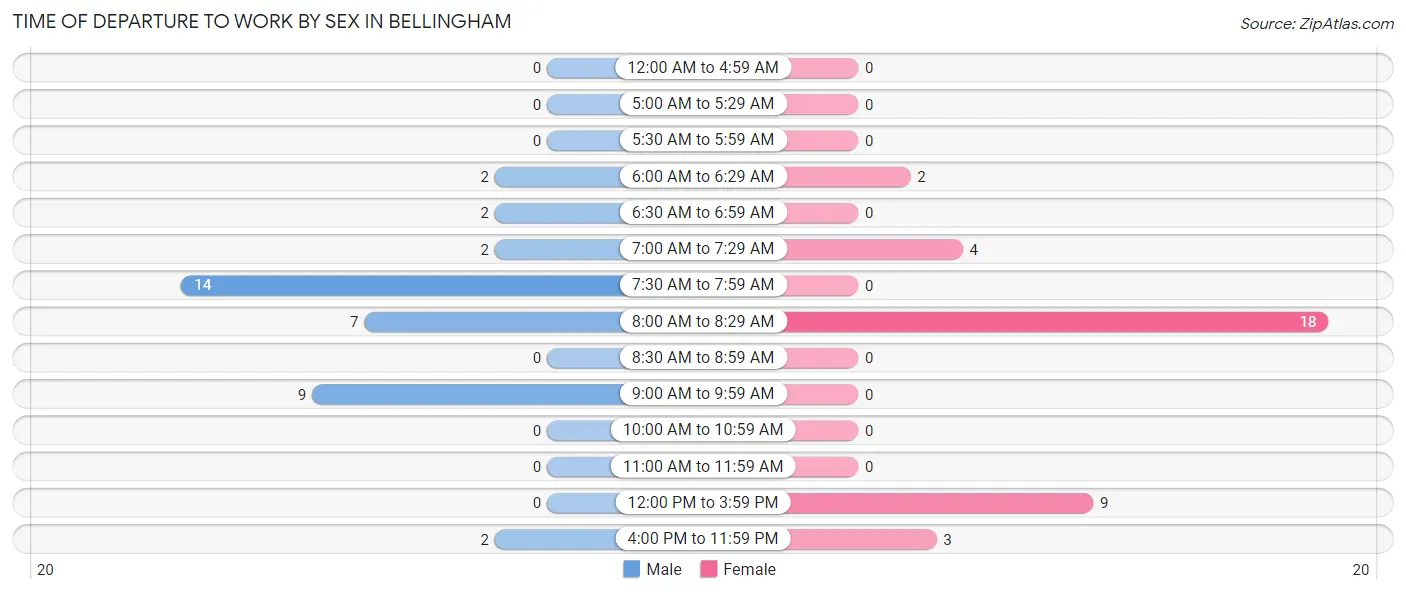
| Time of Departure | Male | Female |
| 12:00 AM to 4:59 AM | 0 (0.0%) | 0 (0.0%) |
| 5:00 AM to 5:29 AM | 0 (0.0%) | 0 (0.0%) |
| 5:30 AM to 5:59 AM | 0 (0.0%) | 0 (0.0%) |
| 6:00 AM to 6:29 AM | 2 (5.3%) | 2 (5.6%) |
| 6:30 AM to 6:59 AM | 2 (5.3%) | 0 (0.0%) |
| 7:00 AM to 7:29 AM | 2 (5.3%) | 4 (11.1%) |
| 7:30 AM to 7:59 AM | 14 (36.8%) | 0 (0.0%) |
| 8:00 AM to 8:29 AM | 7 (18.4%) | 18 (50.0%) |
| 8:30 AM to 8:59 AM | 0 (0.0%) | 0 (0.0%) |
| 9:00 AM to 9:59 AM | 9 (23.7%) | 0 (0.0%) |
| 10:00 AM to 10:59 AM | 0 (0.0%) | 0 (0.0%) |
| 11:00 AM to 11:59 AM | 0 (0.0%) | 0 (0.0%) |
| 12:00 PM to 3:59 PM | 0 (0.0%) | 9 (25.0%) |
| 4:00 PM to 11:59 PM | 2 (5.3%) | 3 (8.3%) |
| Total | 38 (100.0%) | 36 (100.0%) |
Housing Occupancy in Bellingham
Occupancy by Ownership in Bellingham
Of the total 70 dwellings in Bellingham, owner-occupied units account for 64 (91.4%), while renter-occupied units make up 6 (8.6%).
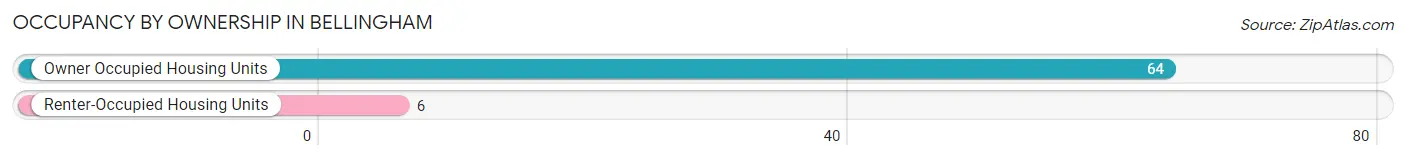
| Occupancy | # Housing Units | % Housing Units |
| Owner Occupied Housing Units | 64 | 91.4% |
| Renter-Occupied Housing Units | 6 | 8.6% |
| Total Occupied Housing Units | 70 | 100.0% |
Occupancy by Household Size in Bellingham
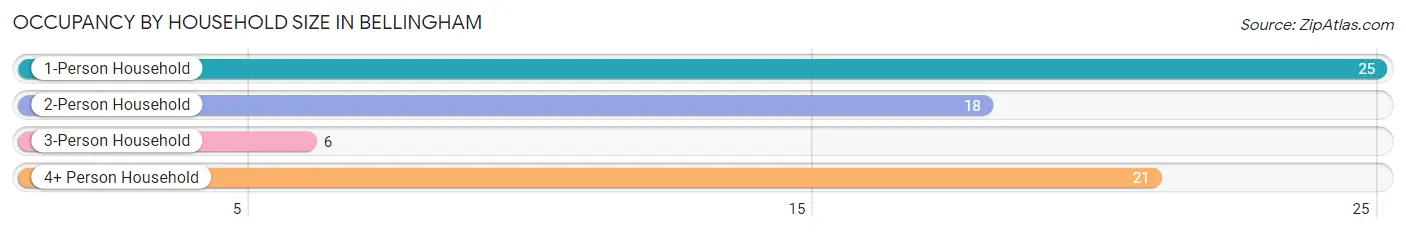
| Household Size | # Housing Units | % Housing Units |
| 1-Person Household | 25 | 35.7% |
| 2-Person Household | 18 | 25.7% |
| 3-Person Household | 6 | 8.6% |
| 4+ Person Household | 21 | 30.0% |
| Total Housing Units | 70 | 100.0% |
Occupancy by Ownership by Household Size in Bellingham
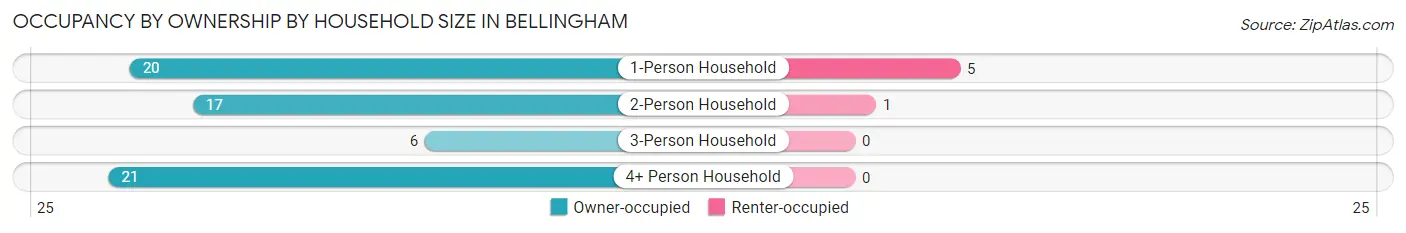
| Household Size | Owner-occupied | Renter-occupied |
| 1-Person Household | 20 (80.0%) | 5 (20.0%) |
| 2-Person Household | 17 (94.4%) | 1 (5.6%) |
| 3-Person Household | 6 (100.0%) | 0 (0.0%) |
| 4+ Person Household | 21 (100.0%) | 0 (0.0%) |
| Total Housing Units | 64 (91.4%) | 6 (8.6%) |
Occupancy by Educational Attainment in Bellingham
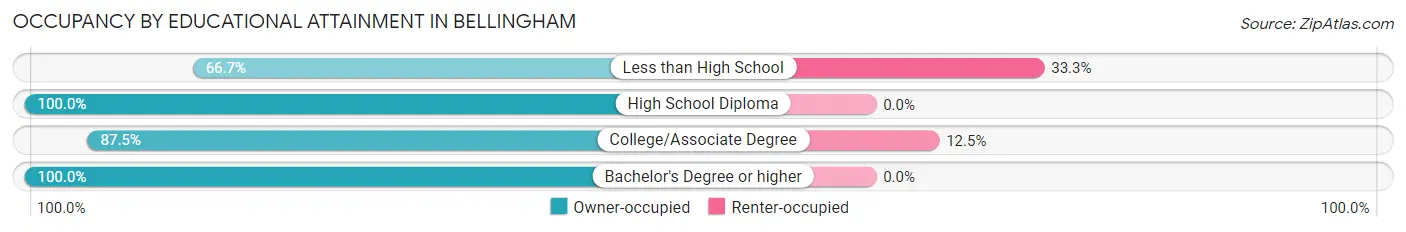
| Household Size | Owner-occupied | Renter-occupied |
| Less than High School | 6 (66.7%) | 3 (33.3%) |
| High School Diploma | 34 (100.0%) | 0 (0.0%) |
| College/Associate Degree | 21 (87.5%) | 3 (12.5%) |
| Bachelor's Degree or higher | 3 (100.0%) | 0 (0.0%) |
Occupancy by Age of Householder in Bellingham
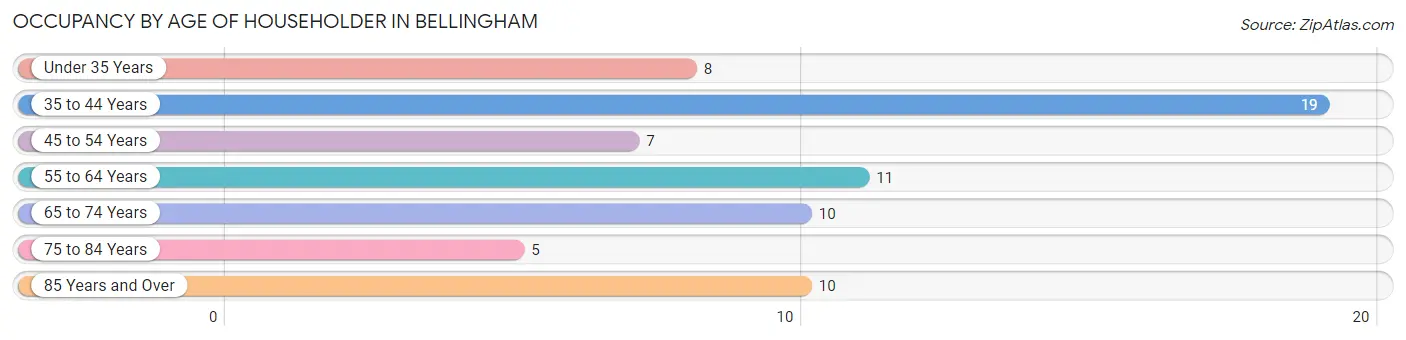
| Age Bracket | # Households | % Households |
| Under 35 Years | 8 | 11.4% |
| 35 to 44 Years | 19 | 27.1% |
| 45 to 54 Years | 7 | 10.0% |
| 55 to 64 Years | 11 | 15.7% |
| 65 to 74 Years | 10 | 14.3% |
| 75 to 84 Years | 5 | 7.1% |
| 85 Years and Over | 10 | 14.3% |
| Total | 70 | 100.0% |
Housing Finances in Bellingham
Median Income by Occupancy in Bellingham
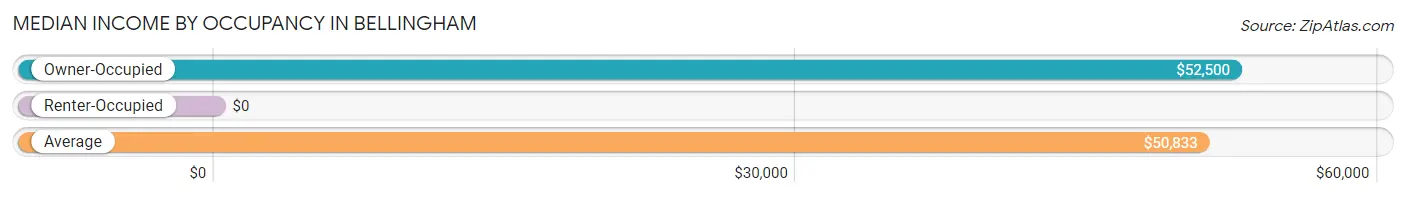
| Occupancy Type | # Households | Median Income |
| Owner-Occupied | 64 (91.4%) | $52,500 |
| Renter-Occupied | 6 (8.6%) | $0 |
| Average | 70 (100.0%) | $50,833 |
Occupancy by Householder Income Bracket in Bellingham
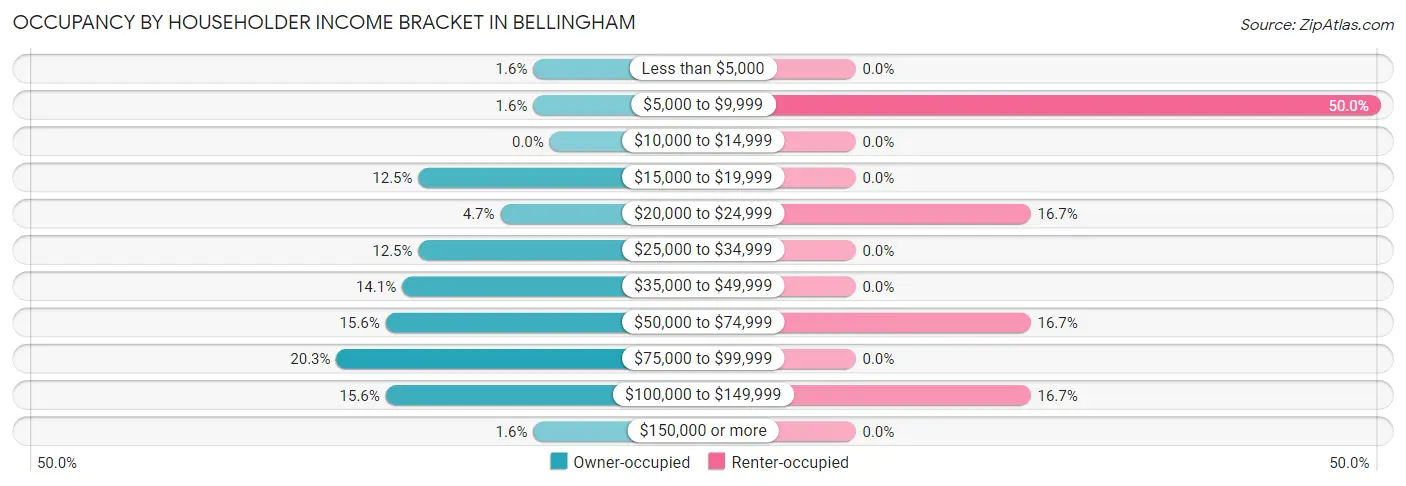
| Income Bracket | Owner-occupied | Renter-occupied |
| Less than $5,000 | 1 (1.6%) | 0 (0.0%) |
| $5,000 to $9,999 | 1 (1.6%) | 3 (50.0%) |
| $10,000 to $14,999 | 0 (0.0%) | 0 (0.0%) |
| $15,000 to $19,999 | 8 (12.5%) | 0 (0.0%) |
| $20,000 to $24,999 | 3 (4.7%) | 1 (16.7%) |
| $25,000 to $34,999 | 8 (12.5%) | 0 (0.0%) |
| $35,000 to $49,999 | 9 (14.1%) | 0 (0.0%) |
| $50,000 to $74,999 | 10 (15.6%) | 1 (16.7%) |
| $75,000 to $99,999 | 13 (20.3%) | 0 (0.0%) |
| $100,000 to $149,999 | 10 (15.6%) | 1 (16.7%) |
| $150,000 or more | 1 (1.6%) | 0 (0.0%) |
| Total | 64 (100.0%) | 6 (100.0%) |
Monthly Housing Cost Tiers in Bellingham
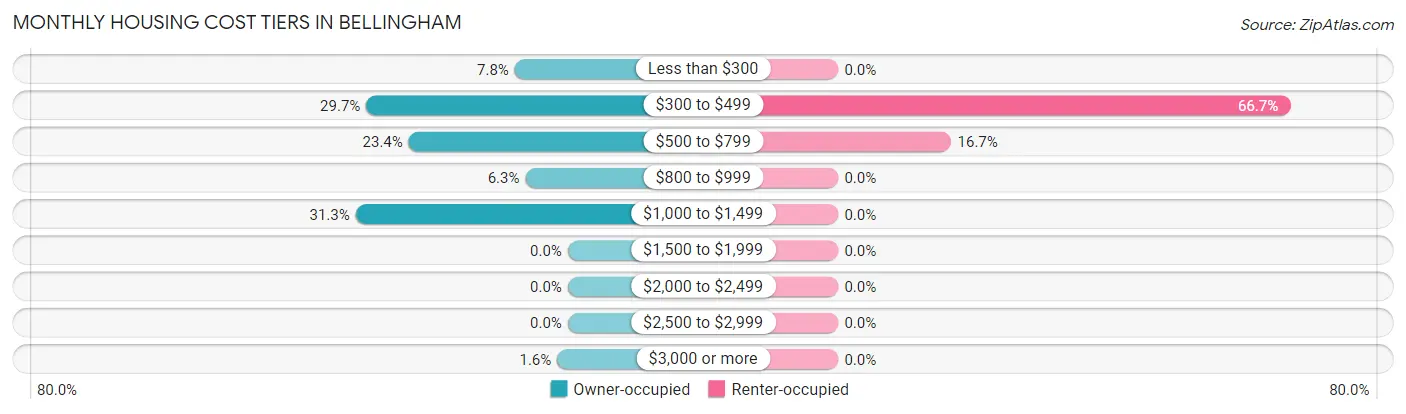
| Monthly Cost | Owner-occupied | Renter-occupied |
| Less than $300 | 5 (7.8%) | 0 (0.0%) |
| $300 to $499 | 19 (29.7%) | 4 (66.7%) |
| $500 to $799 | 15 (23.4%) | 1 (16.7%) |
| $800 to $999 | 4 (6.2%) | 0 (0.0%) |
| $1,000 to $1,499 | 20 (31.2%) | 0 (0.0%) |
| $1,500 to $1,999 | 0 (0.0%) | 0 (0.0%) |
| $2,000 to $2,499 | 0 (0.0%) | 0 (0.0%) |
| $2,500 to $2,999 | 0 (0.0%) | 0 (0.0%) |
| $3,000 or more | 1 (1.6%) | 0 (0.0%) |
| Total | 64 (100.0%) | 6 (100.0%) |
Physical Housing Characteristics in Bellingham
Housing Structures in Bellingham
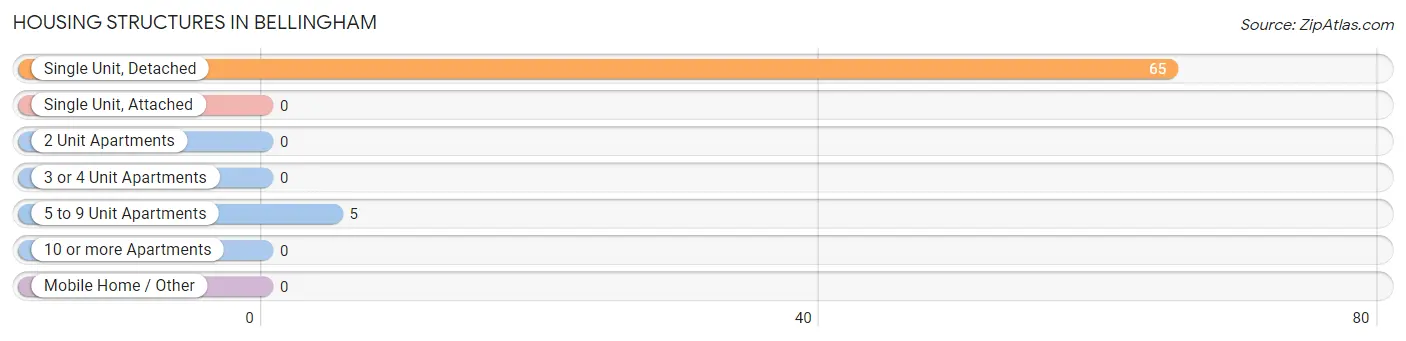
| Structure Type | # Housing Units | % Housing Units |
| Single Unit, Detached | 65 | 92.9% |
| Single Unit, Attached | 0 | 0.0% |
| 2 Unit Apartments | 0 | 0.0% |
| 3 or 4 Unit Apartments | 0 | 0.0% |
| 5 to 9 Unit Apartments | 5 | 7.1% |
| 10 or more Apartments | 0 | 0.0% |
| Mobile Home / Other | 0 | 0.0% |
| Total | 70 | 100.0% |
Housing Structures by Occupancy in Bellingham
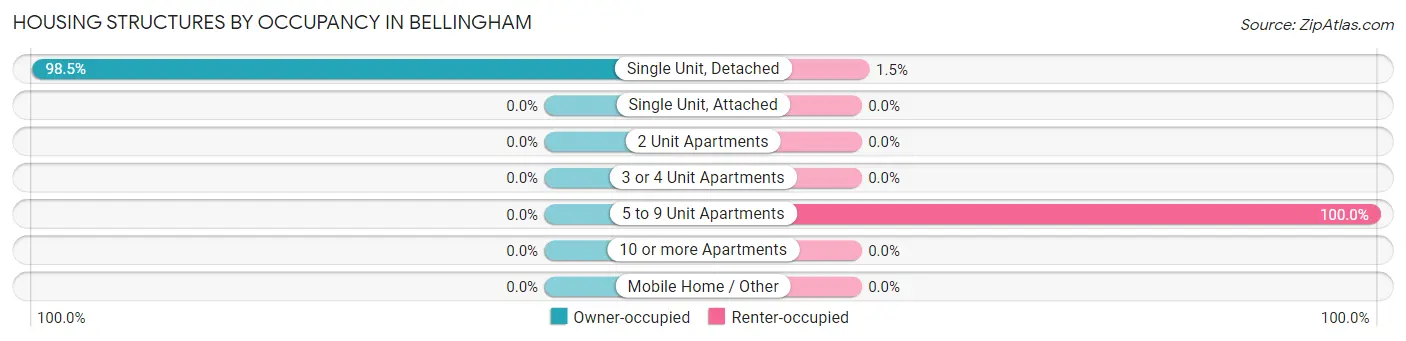
| Structure Type | Owner-occupied | Renter-occupied |
| Single Unit, Detached | 64 (98.5%) | 1 (1.5%) |
| Single Unit, Attached | 0 (0.0%) | 0 (0.0%) |
| 2 Unit Apartments | 0 (0.0%) | 0 (0.0%) |
| 3 or 4 Unit Apartments | 0 (0.0%) | 0 (0.0%) |
| 5 to 9 Unit Apartments | 0 (0.0%) | 5 (100.0%) |
| 10 or more Apartments | 0 (0.0%) | 0 (0.0%) |
| Mobile Home / Other | 0 (0.0%) | 0 (0.0%) |
| Total | 64 (91.4%) | 6 (8.6%) |
Housing Structures by Number of Rooms in Bellingham
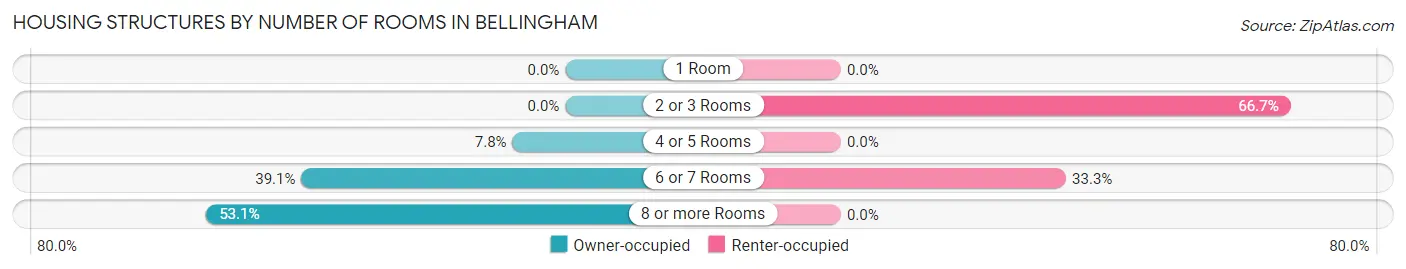
| Number of Rooms | Owner-occupied | Renter-occupied |
| 1 Room | 0 (0.0%) | 0 (0.0%) |
| 2 or 3 Rooms | 0 (0.0%) | 4 (66.7%) |
| 4 or 5 Rooms | 5 (7.8%) | 0 (0.0%) |
| 6 or 7 Rooms | 25 (39.1%) | 2 (33.3%) |
| 8 or more Rooms | 34 (53.1%) | 0 (0.0%) |
| Total | 64 (100.0%) | 6 (100.0%) |
Housing Structure by Heating Type in Bellingham
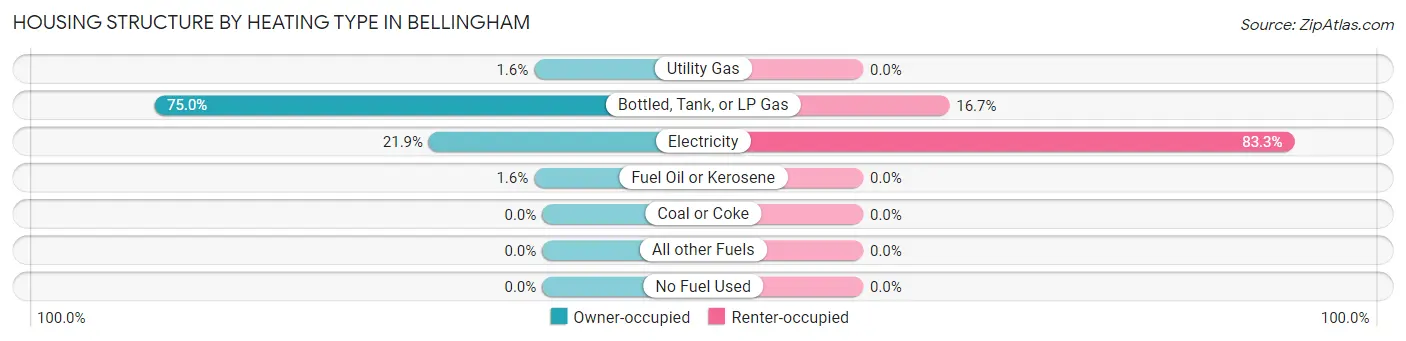
| Heating Type | Owner-occupied | Renter-occupied |
| Utility Gas | 1 (1.6%) | 0 (0.0%) |
| Bottled, Tank, or LP Gas | 48 (75.0%) | 1 (16.7%) |
| Electricity | 14 (21.9%) | 5 (83.3%) |
| Fuel Oil or Kerosene | 1 (1.6%) | 0 (0.0%) |
| Coal or Coke | 0 (0.0%) | 0 (0.0%) |
| All other Fuels | 0 (0.0%) | 0 (0.0%) |
| No Fuel Used | 0 (0.0%) | 0 (0.0%) |
| Total | 64 (100.0%) | 6 (100.0%) |
Household Vehicle Usage in Bellingham
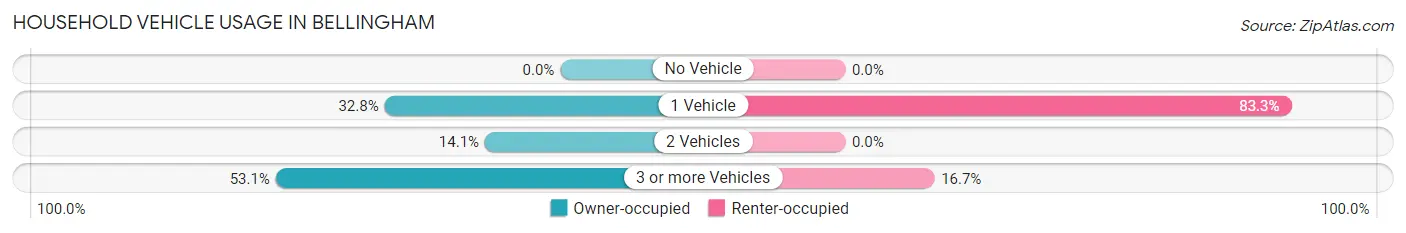
| Vehicles per Household | Owner-occupied | Renter-occupied |
| No Vehicle | 0 (0.0%) | 0 (0.0%) |
| 1 Vehicle | 21 (32.8%) | 5 (83.3%) |
| 2 Vehicles | 9 (14.1%) | 0 (0.0%) |
| 3 or more Vehicles | 34 (53.1%) | 1 (16.7%) |
| Total | 64 (100.0%) | 6 (100.0%) |
Real Estate & Mortgages in Bellingham
Real Estate and Mortgage Overview in Bellingham
| Characteristic | Without Mortgage | With Mortgage |
| Housing Units | 36 | 28 |
| Median Property Value | $40,000 | $58,000 |
| Median Household Income | $48,750 | $0 |
| Monthly Housing Costs | $438 | $1 |
| Real Estate Taxes | $275 | $1 |
Property Value by Mortgage Status in Bellingham
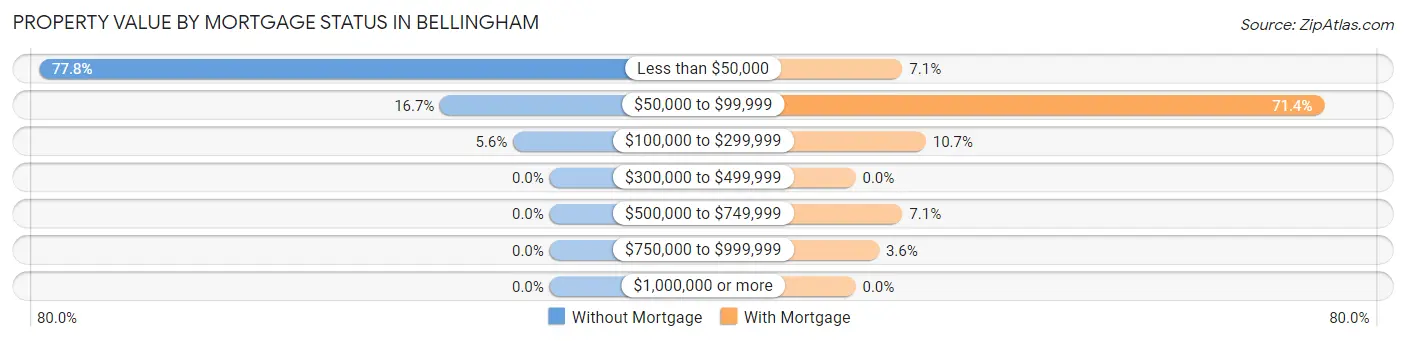
| Property Value | Without Mortgage | With Mortgage |
| Less than $50,000 | 28 (77.8%) | 2 (7.1%) |
| $50,000 to $99,999 | 6 (16.7%) | 20 (71.4%) |
| $100,000 to $299,999 | 2 (5.6%) | 3 (10.7%) |
| $300,000 to $499,999 | 0 (0.0%) | 0 (0.0%) |
| $500,000 to $749,999 | 0 (0.0%) | 2 (7.1%) |
| $750,000 to $999,999 | 0 (0.0%) | 1 (3.6%) |
| $1,000,000 or more | 0 (0.0%) | 0 (0.0%) |
| Total | 36 (100.0%) | 28 (100.0%) |
Household Income by Mortgage Status in Bellingham
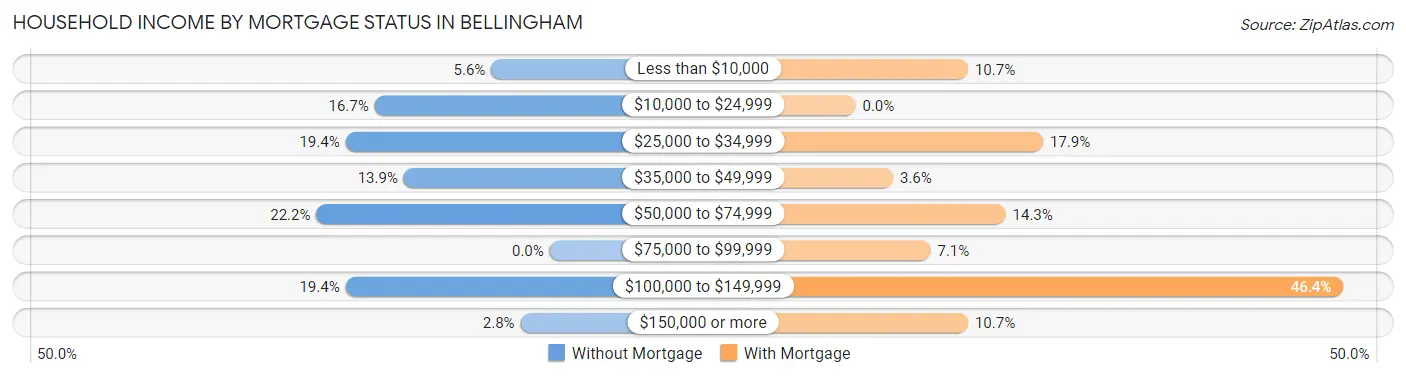
| Household Income | Without Mortgage | With Mortgage |
| Less than $10,000 | 2 (5.6%) | 3 (10.7%) |
| $10,000 to $24,999 | 6 (16.7%) | 0 (0.0%) |
| $25,000 to $34,999 | 7 (19.4%) | 5 (17.9%) |
| $35,000 to $49,999 | 5 (13.9%) | 1 (3.6%) |
| $50,000 to $74,999 | 8 (22.2%) | 4 (14.3%) |
| $75,000 to $99,999 | 0 (0.0%) | 2 (7.1%) |
| $100,000 to $149,999 | 7 (19.4%) | 13 (46.4%) |
| $150,000 or more | 1 (2.8%) | 3 (10.7%) |
| Total | 36 (100.0%) | 28 (100.0%) |
Property Value to Household Income Ratio in Bellingham
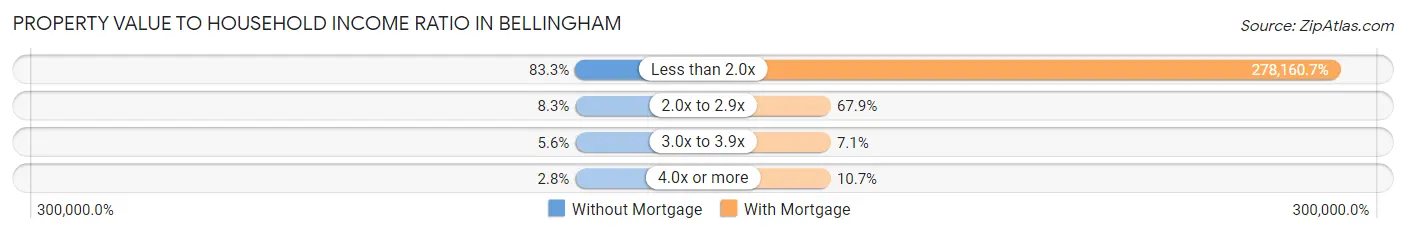
| Value-to-Income Ratio | Without Mortgage | With Mortgage |
| Less than 2.0x | 30 (83.3%) | 77,885 (278,160.7%) |
| 2.0x to 2.9x | 3 (8.3%) | 19 (67.9%) |
| 3.0x to 3.9x | 2 (5.6%) | 2 (7.1%) |
| 4.0x or more | 1 (2.8%) | 3 (10.7%) |
| Total | 36 (100.0%) | 28 (100.0%) |
Real Estate Taxes by Mortgage Status in Bellingham
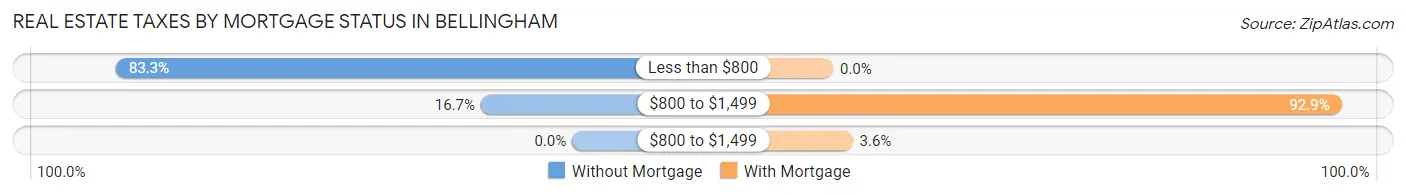
| Property Taxes | Without Mortgage | With Mortgage |
| Less than $800 | 30 (83.3%) | 0 (0.0%) |
| $800 to $1,499 | 6 (16.7%) | 26 (92.9%) |
| $800 to $1,499 | 0 (0.0%) | 1 (3.6%) |
| Total | 36 (100.0%) | 28 (100.0%) |
Health & Disability in Bellingham
Health Insurance Coverage by Age in Bellingham
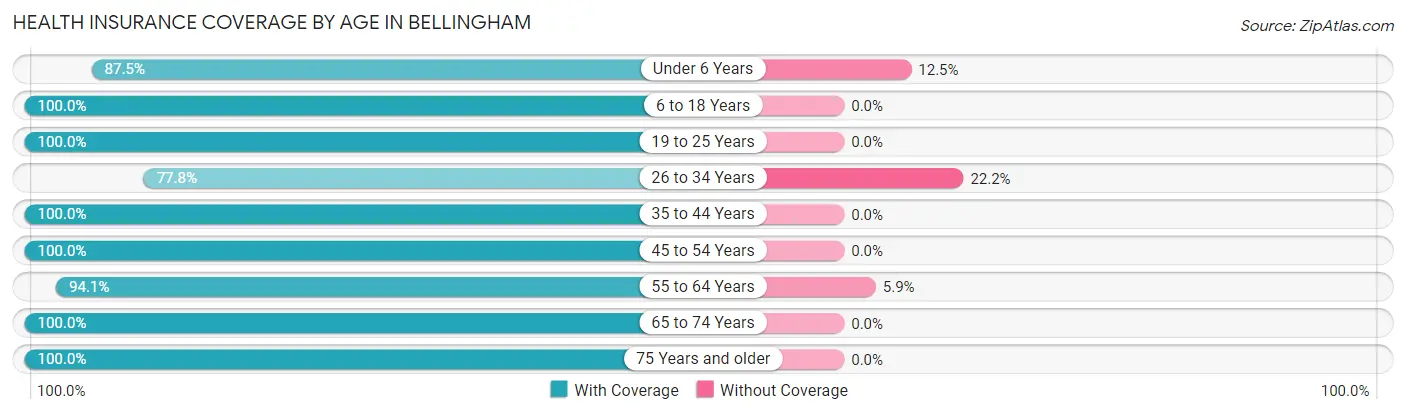
| Age Bracket | With Coverage | Without Coverage |
| Under 6 Years | 7 (87.5%) | 1 (12.5%) |
| 6 to 18 Years | 47 (100.0%) | 0 (0.0%) |
| 19 to 25 Years | 14 (100.0%) | 0 (0.0%) |
| 26 to 34 Years | 7 (77.8%) | 2 (22.2%) |
| 35 to 44 Years | 38 (100.0%) | 0 (0.0%) |
| 45 to 54 Years | 16 (100.0%) | 0 (0.0%) |
| 55 to 64 Years | 16 (94.1%) | 1 (5.9%) |
| 65 to 74 Years | 13 (100.0%) | 0 (0.0%) |
| 75 Years and older | 21 (100.0%) | 0 (0.0%) |
| Total | 179 (97.8%) | 4 (2.2%) |
Health Insurance Coverage by Citizenship Status in Bellingham
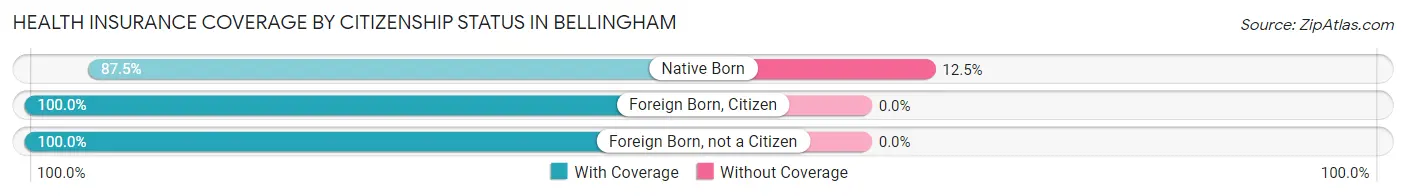
| Citizenship Status | With Coverage | Without Coverage |
| Native Born | 7 (87.5%) | 1 (12.5%) |
| Foreign Born, Citizen | 47 (100.0%) | 0 (0.0%) |
| Foreign Born, not a Citizen | 14 (100.0%) | 0 (0.0%) |
Health Insurance Coverage by Household Income in Bellingham
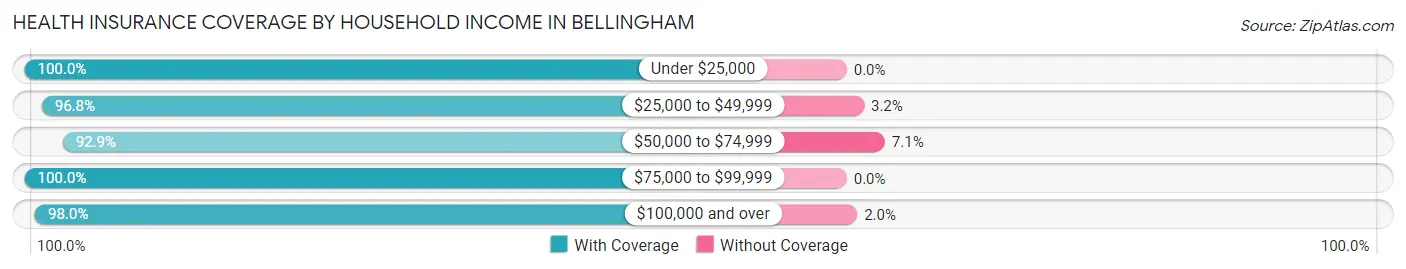
| Household Income | With Coverage | Without Coverage |
| Under $25,000 | 20 (100.0%) | 0 (0.0%) |
| $25,000 to $49,999 | 30 (96.8%) | 1 (3.2%) |
| $50,000 to $74,999 | 26 (92.9%) | 2 (7.1%) |
| $75,000 to $99,999 | 53 (100.0%) | 0 (0.0%) |
| $100,000 and over | 50 (98.0%) | 1 (2.0%) |
Public vs Private Health Insurance Coverage by Age in Bellingham
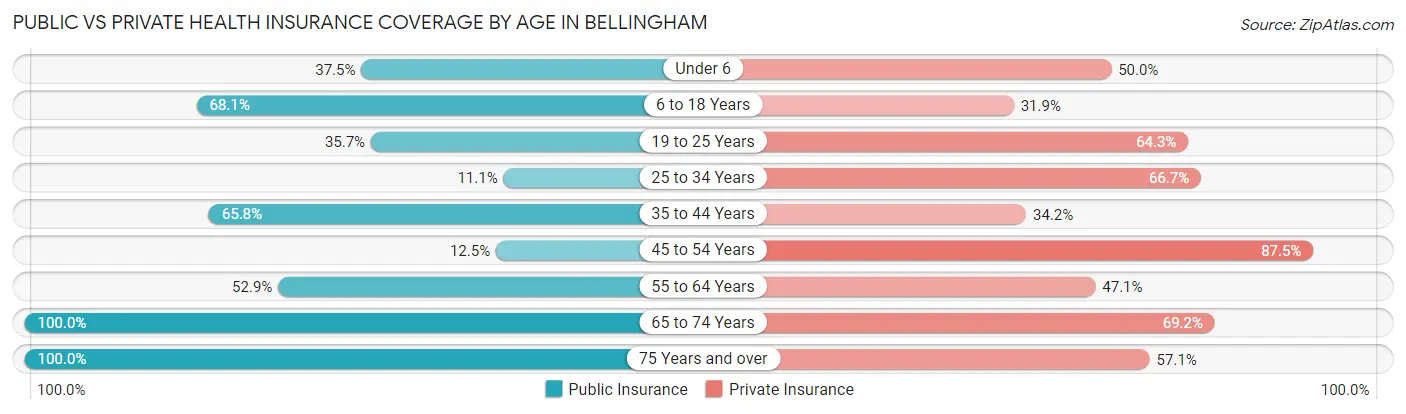
| Age Bracket | Public Insurance | Private Insurance |
| Under 6 | 3 (37.5%) | 4 (50.0%) |
| 6 to 18 Years | 32 (68.1%) | 15 (31.9%) |
| 19 to 25 Years | 5 (35.7%) | 9 (64.3%) |
| 25 to 34 Years | 1 (11.1%) | 6 (66.7%) |
| 35 to 44 Years | 25 (65.8%) | 13 (34.2%) |
| 45 to 54 Years | 2 (12.5%) | 14 (87.5%) |
| 55 to 64 Years | 9 (52.9%) | 8 (47.1%) |
| 65 to 74 Years | 13 (100.0%) | 9 (69.2%) |
| 75 Years and over | 21 (100.0%) | 12 (57.1%) |
| Total | 111 (60.7%) | 90 (49.2%) |
Disability Status by Sex by Age in Bellingham
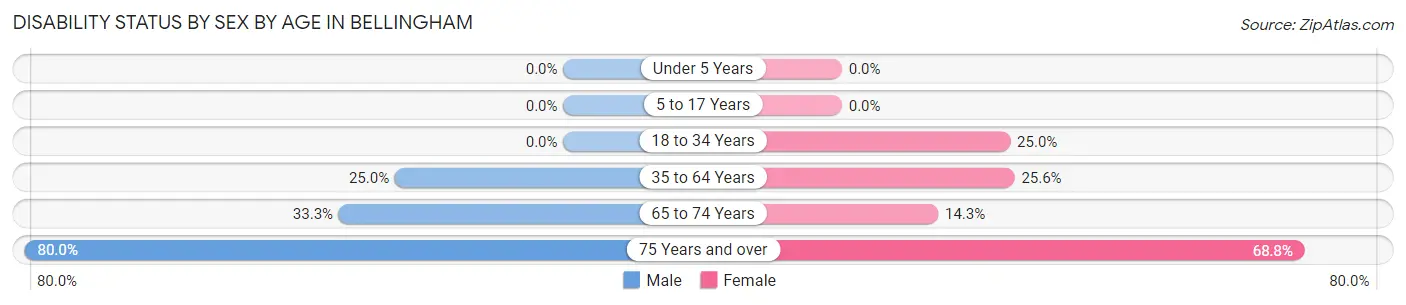
| Age Bracket | Male | Female |
| Under 5 Years | 0 (0.0%) | 0 (0.0%) |
| 5 to 17 Years | 0 (0.0%) | 0 (0.0%) |
| 18 to 34 Years | 0 (0.0%) | 3 (25.0%) |
| 35 to 64 Years | 8 (25.0%) | 10 (25.6%) |
| 65 to 74 Years | 2 (33.3%) | 1 (14.3%) |
| 75 Years and over | 4 (80.0%) | 11 (68.8%) |
Disability Class by Sex by Age in Bellingham
Disability Class: Hearing Difficulty
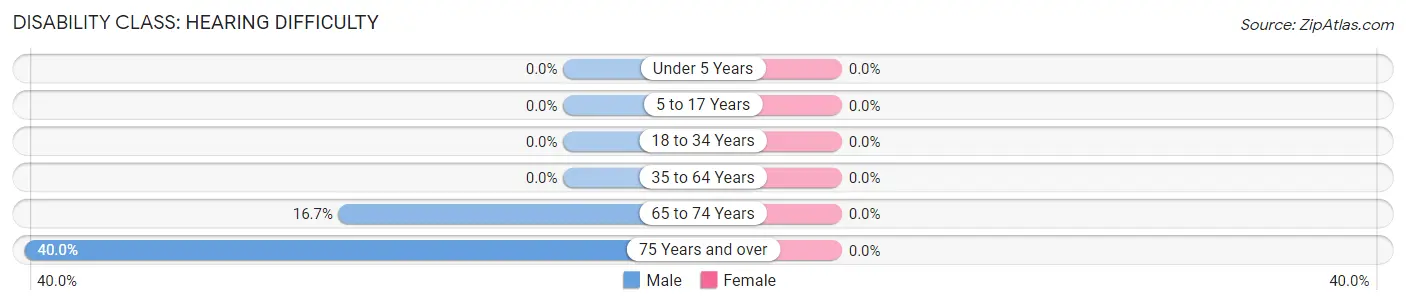
| Age Bracket | Male | Female |
| Under 5 Years | 0 (0.0%) | 0 (0.0%) |
| 5 to 17 Years | 0 (0.0%) | 0 (0.0%) |
| 18 to 34 Years | 0 (0.0%) | 0 (0.0%) |
| 35 to 64 Years | 0 (0.0%) | 0 (0.0%) |
| 65 to 74 Years | 1 (16.7%) | 0 (0.0%) |
| 75 Years and over | 2 (40.0%) | 0 (0.0%) |
Disability Class: Vision Difficulty
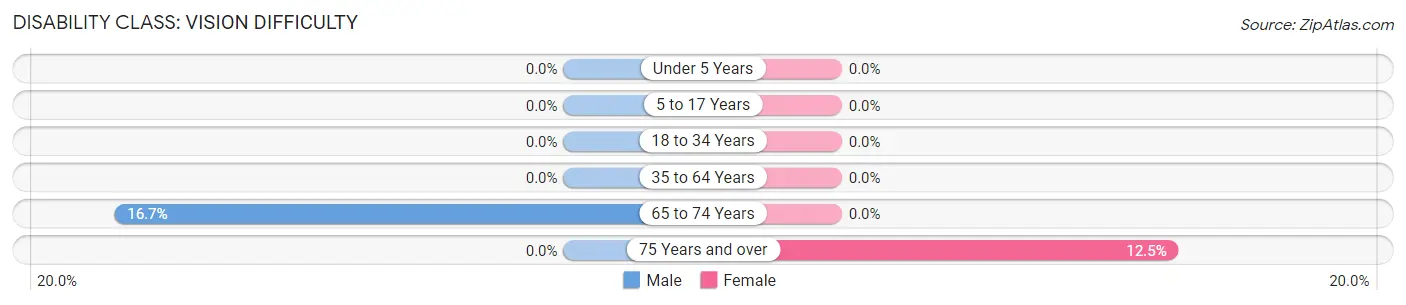
| Age Bracket | Male | Female |
| Under 5 Years | 0 (0.0%) | 0 (0.0%) |
| 5 to 17 Years | 0 (0.0%) | 0 (0.0%) |
| 18 to 34 Years | 0 (0.0%) | 0 (0.0%) |
| 35 to 64 Years | 0 (0.0%) | 0 (0.0%) |
| 65 to 74 Years | 1 (16.7%) | 0 (0.0%) |
| 75 Years and over | 0 (0.0%) | 2 (12.5%) |
Disability Class: Cognitive Difficulty
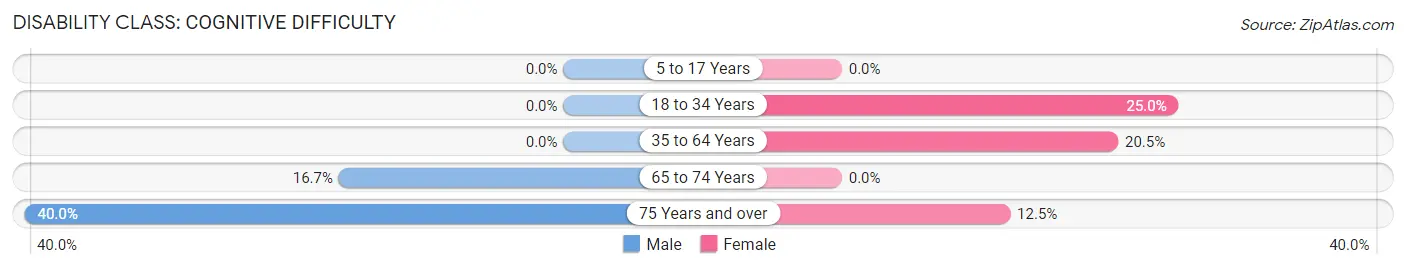
| Age Bracket | Male | Female |
| 5 to 17 Years | 0 (0.0%) | 0 (0.0%) |
| 18 to 34 Years | 0 (0.0%) | 3 (25.0%) |
| 35 to 64 Years | 0 (0.0%) | 8 (20.5%) |
| 65 to 74 Years | 1 (16.7%) | 0 (0.0%) |
| 75 Years and over | 2 (40.0%) | 2 (12.5%) |
Disability Class: Ambulatory Difficulty
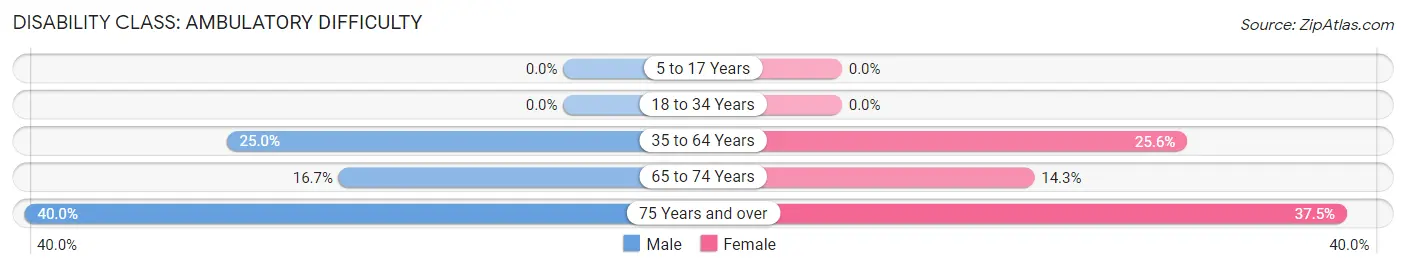
| Age Bracket | Male | Female |
| 5 to 17 Years | 0 (0.0%) | 0 (0.0%) |
| 18 to 34 Years | 0 (0.0%) | 0 (0.0%) |
| 35 to 64 Years | 8 (25.0%) | 10 (25.6%) |
| 65 to 74 Years | 1 (16.7%) | 1 (14.3%) |
| 75 Years and over | 2 (40.0%) | 6 (37.5%) |
Disability Class: Self-Care Difficulty
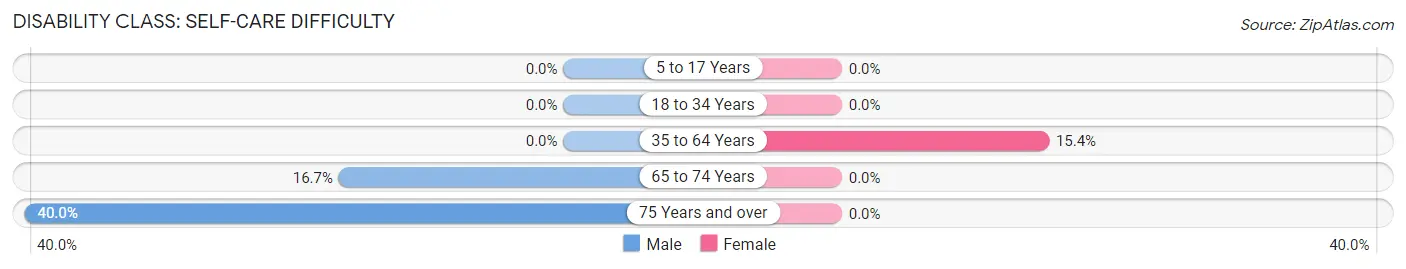
| Age Bracket | Male | Female |
| 5 to 17 Years | 0 (0.0%) | 0 (0.0%) |
| 18 to 34 Years | 0 (0.0%) | 0 (0.0%) |
| 35 to 64 Years | 0 (0.0%) | 6 (15.4%) |
| 65 to 74 Years | 1 (16.7%) | 0 (0.0%) |
| 75 Years and over | 2 (40.0%) | 0 (0.0%) |
Technology Access in Bellingham
Computing Device Access in Bellingham
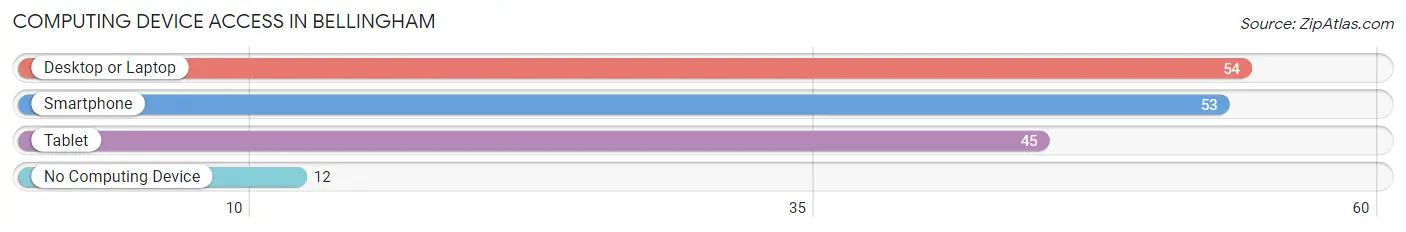
| Device Type | # Households | % Households |
| Desktop or Laptop | 54 | 77.1% |
| Smartphone | 53 | 75.7% |
| Tablet | 45 | 64.3% |
| No Computing Device | 12 | 17.1% |
| Total | 70 | 100.0% |
Internet Access in Bellingham
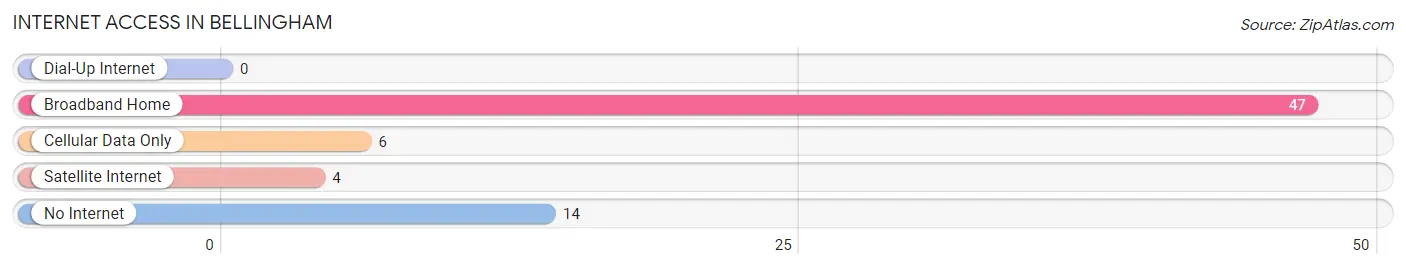
| Internet Type | # Households | % Households |
| Dial-Up Internet | 0 | 0.0% |
| Broadband Home | 47 | 67.1% |
| Cellular Data Only | 6 | 8.6% |
| Satellite Internet | 4 | 5.7% |
| No Internet | 14 | 20.0% |
| Total | 70 | 100.0% |
Bellingham Summary
Bellingham, Minnesota is a small city located in Stearns County, Minnesota, United States. It is situated on the banks of the Sauk River, approximately 25 miles northwest of St. Cloud. The city has a population of approximately 1,500 people and is part of the St. Cloud Metropolitan Statistical Area.
History
The area that is now Bellingham was first settled in 1856 by a group of German immigrants. The town was originally named “New Munich” after the city of Munich in Germany. The name was changed to Bellingham in 1872, after the town of Bellingham in England.
The city was incorporated in 1887 and was named after the Bellingham family, who were prominent in the area. The city was originally a farming community, but in the early 1900s, the economy shifted to focus on the lumber industry. The city was home to several sawmills and lumber yards, which provided employment for many of the residents.
In the 1950s, the economy shifted again, this time to focus on manufacturing. The city was home to several factories, including a paper mill, a canning factory, and a furniture factory. These factories provided employment for many of the residents and helped to spur the city’s growth.
Geography
Bellingham is located in Stearns County, Minnesota, approximately 25 miles northwest of St. Cloud. The city is situated on the banks of the Sauk River and is surrounded by rolling hills and farmland. The city has a total area of 1.2 square miles, all of which is land.
The climate in Bellingham is classified as humid continental, with warm summers and cold winters. The average temperature in the summer is around 75 degrees Fahrenheit, while the average temperature in the winter is around 20 degrees Fahrenheit. The city receives an average of 33 inches of precipitation per year.
Economy
The economy of Bellingham is largely based on manufacturing and agriculture. The city is home to several factories, including a paper mill, a canning factory, and a furniture factory. These factories provide employment for many of the residents and help to spur the city’s growth.
Agriculture is also an important part of the economy. The city is surrounded by farmland and is home to several dairy farms and crop farms. These farms provide employment for many of the residents and help to keep the local economy strong.
Demographics
As of the 2010 census, the population of Bellingham was 1,500. The racial makeup of the city was 97.3% White, 0.7% African American, 0.3% Native American, 0.3% Asian, 0.3% from other races, and 1.3% from two or more races. Hispanic or Latino of any race were 1.3% of the population.
The median household income in Bellingham was $45,000, and the median family income was $50,000. The per capita income was $20,000. About 8.3% of the population was below the poverty line.
Bellingham is a small city with a rich history and a strong economy. The city is home to several factories and farms, which provide employment for many of the residents. The city is also home to a diverse population, with a mix of races and ethnicities. Bellingham is a great place to live and work, and is a great example of a small city with a big heart.
Common Questions
What is Per Capita Income in Bellingham?
Per Capita income in Bellingham is $22,473.
What is the Median Family Income in Bellingham?
Median Family Income in Bellingham is $78,365.
What is the Median Household income in Bellingham?
Median Household Income in Bellingham is $50,833.
What is Inequality or Gini Index in Bellingham?
Inequality or Gini Index in Bellingham is 0.36.
What is the Total Population of Bellingham?
Total Population of Bellingham is 183.
What is the Total Male Population of Bellingham?
Total Male Population of Bellingham is 88.
What is the Total Female Population of Bellingham?
Total Female Population of Bellingham is 95.
What is the Ratio of Males per 100 Females in Bellingham?
There are 92.63 Males per 100 Females in Bellingham.
What is the Ratio of Females per 100 Males in Bellingham?
There are 107.95 Females per 100 Males in Bellingham.
What is the Median Population Age in Bellingham?
Median Population Age in Bellingham is 35.5 Years.
What is the Average Family Size in Bellingham
Average Family Size in Bellingham is 3.5 People.
What is the Average Household Size in Bellingham
Average Household Size in Bellingham is 2.6 People.
How Large is the Labor Force in Bellingham?
There are 79 People in the Labor Forcein in Bellingham.
What is the Percentage of People in the Labor Force in Bellingham?
57.7% of People are in the Labor Force in Bellingham.
What is the Unemployment Rate in Bellingham?
Unemployment Rate in Bellingham is 1.3%.