Beardsley, MN Map & Demographics
Beardsley Map
Beardsley Overview
$30,197
PER CAPITA INCOME
$80,469
AVG FAMILY INCOME
$63,750
AVG HOUSEHOLD INCOME
17.3%
WAGE / INCOME GAP [ % ]
82.7¢/ $1
WAGE / INCOME GAP [ $ ]
0.37
INEQUALITY / GINI INDEX
241
TOTAL POPULATION
140
MALE POPULATION
101
FEMALE POPULATION
138.61
MALES / 100 FEMALES
72.14
FEMALES / 100 MALES
39.2
MEDIAN AGE
3.0
AVG FAMILY SIZE
2.5
AVG HOUSEHOLD SIZE
129
LABOR FORCE [ PEOPLE ]
71.7%
PERCENT IN LABOR FORCE
5.4%
UNEMPLOYMENT RATE
Beardsley Zip Codes
Beardsley Area Codes
Income in Beardsley
Income Overview in Beardsley
Per Capita Income in Beardsley is $30,197, while median incomes of families and households are $80,469 and $63,750 respectively.
| Characteristic | Number | Measure |
| Per Capita Income | 241 | $30,197 |
| Median Family Income | 65 | $80,469 |
| Mean Family Income | 65 | $82,448 |
| Median Household Income | 98 | $63,750 |
| Mean Household Income | 98 | $71,962 |
| Income Deficit | 65 | $0 |
| Wage / Income Gap (%) | 241 | 17.30% |
| Wage / Income Gap ($) | 241 | 82.70¢ per $1 |
| Gini / Inequality Index | 241 | 0.37 |
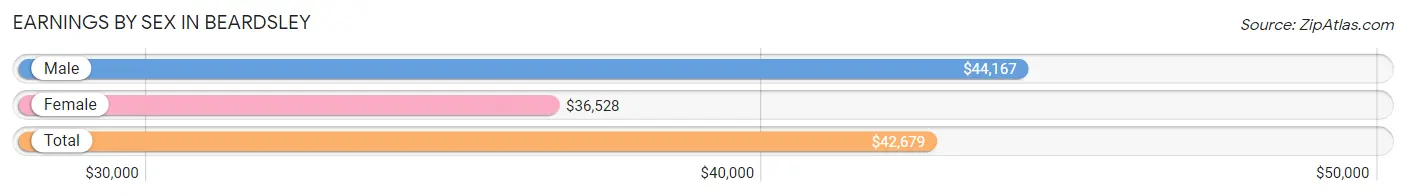
Earnings by Sex in Beardsley
Average Earnings in Beardsley are $42,679, $44,167 for men and $36,528 for women, a difference of 17.3%.
| Sex | Number | Average Earnings |
| Male | 84 (60.4%) | $44,167 |
| Female | 55 (39.6%) | $36,528 |
| Total | 139 (100.0%) | $42,679 |
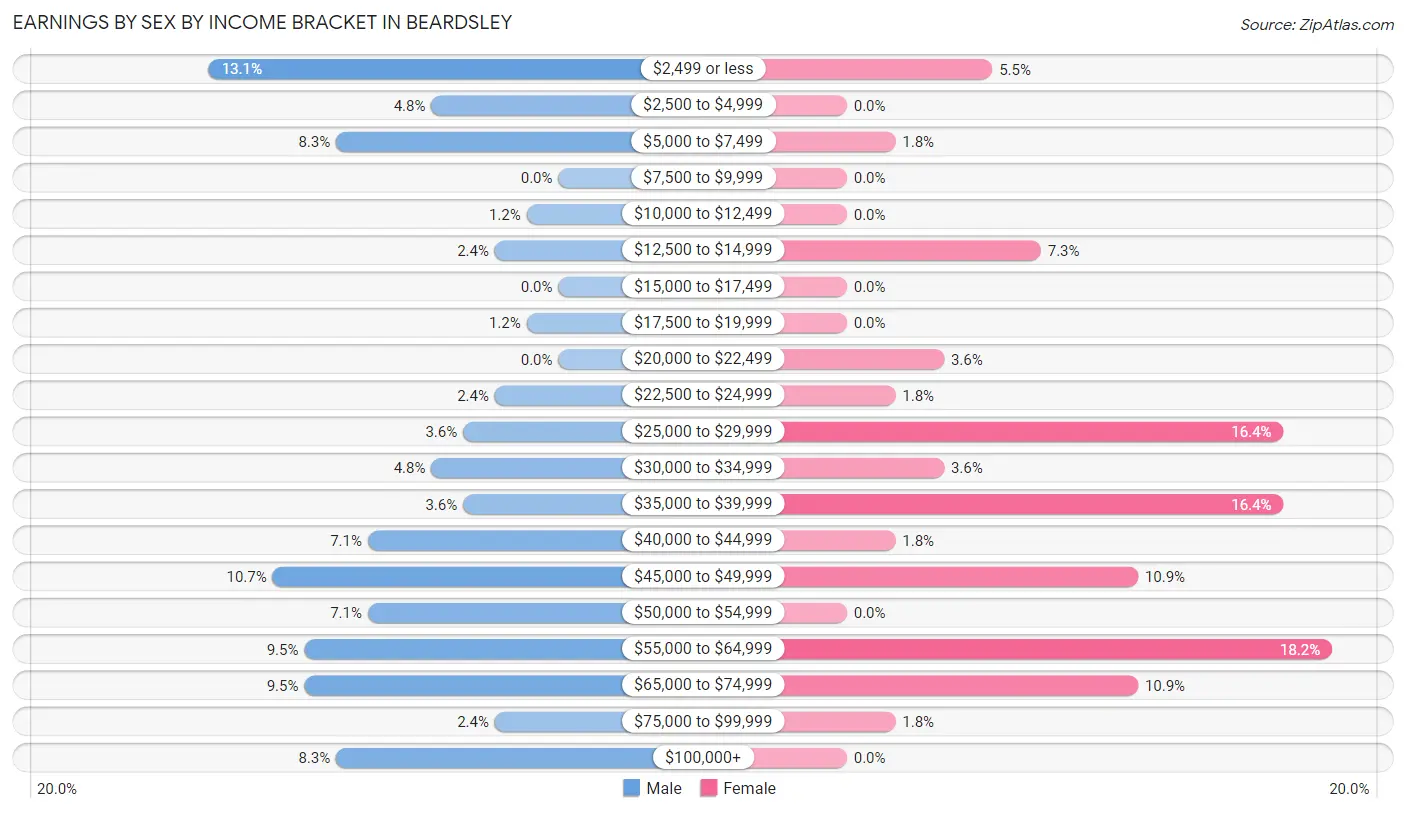
Earnings by Sex by Income Bracket in Beardsley
The most common earnings brackets in Beardsley are $2,499 or less for men (11 | 13.1%) and $55,000 to $64,999 for women (10 | 18.2%).
| Income | Male | Female |
| $2,499 or less | 11 (13.1%) | 3 (5.4%) |
| $2,500 to $4,999 | 4 (4.8%) | 0 (0.0%) |
| $5,000 to $7,499 | 7 (8.3%) | 1 (1.8%) |
| $7,500 to $9,999 | 0 (0.0%) | 0 (0.0%) |
| $10,000 to $12,499 | 1 (1.2%) | 0 (0.0%) |
| $12,500 to $14,999 | 2 (2.4%) | 4 (7.3%) |
| $15,000 to $17,499 | 0 (0.0%) | 0 (0.0%) |
| $17,500 to $19,999 | 1 (1.2%) | 0 (0.0%) |
| $20,000 to $22,499 | 0 (0.0%) | 2 (3.6%) |
| $22,500 to $24,999 | 2 (2.4%) | 1 (1.8%) |
| $25,000 to $29,999 | 3 (3.6%) | 9 (16.4%) |
| $30,000 to $34,999 | 4 (4.8%) | 2 (3.6%) |
| $35,000 to $39,999 | 3 (3.6%) | 9 (16.4%) |
| $40,000 to $44,999 | 6 (7.1%) | 1 (1.8%) |
| $45,000 to $49,999 | 9 (10.7%) | 6 (10.9%) |
| $50,000 to $54,999 | 6 (7.1%) | 0 (0.0%) |
| $55,000 to $64,999 | 8 (9.5%) | 10 (18.2%) |
| $65,000 to $74,999 | 8 (9.5%) | 6 (10.9%) |
| $75,000 to $99,999 | 2 (2.4%) | 1 (1.8%) |
| $100,000+ | 7 (8.3%) | 0 (0.0%) |
| Total | 84 (100.0%) | 55 (100.0%) |
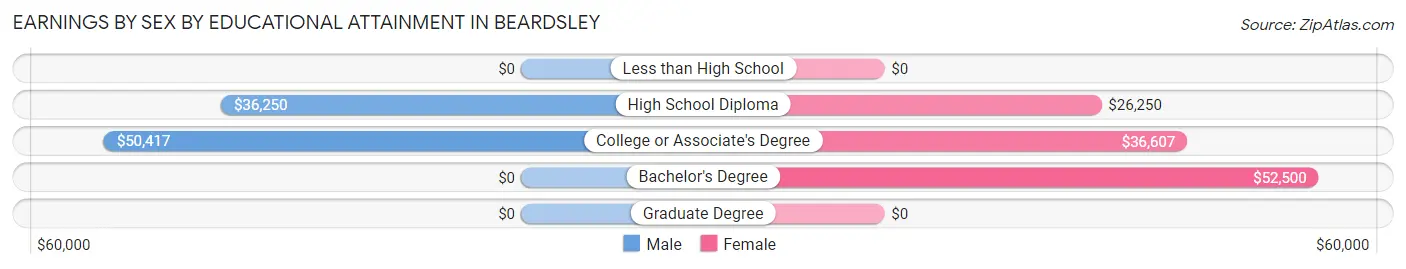
Earnings by Sex by Educational Attainment in Beardsley
Average earnings in Beardsley are $48,333 for men and $36,944 for women, a difference of 23.6%. Men with an educational attainment of college or associate's degree enjoy the highest average annual earnings of $50,417, while those with high school diploma education earn the least with $36,250. Women with an educational attainment of bachelor's degree earn the most with the average annual earnings of $52,500, while those with high school diploma education have the smallest earnings of $26,250.
| Educational Attainment | Male Income | Female Income |
| Less than High School | - | - |
| High School Diploma | $36,250 | $26,250 |
| College or Associate's Degree | $50,417 | $36,607 |
| Bachelor's Degree | - | - |
| Graduate Degree | - | - |
| Total | $48,333 | $36,944 |
Family Income in Beardsley
Family Income Brackets in Beardsley
According to the Beardsley family income data, there are 16 families falling into the $75,000 to $99,999 income range, which is the most common income bracket and makes up 24.6% of all families. Conversely, the $35,000 to $49,999 income bracket is the least frequent group with only 2 families (3.1%) belonging to this category.
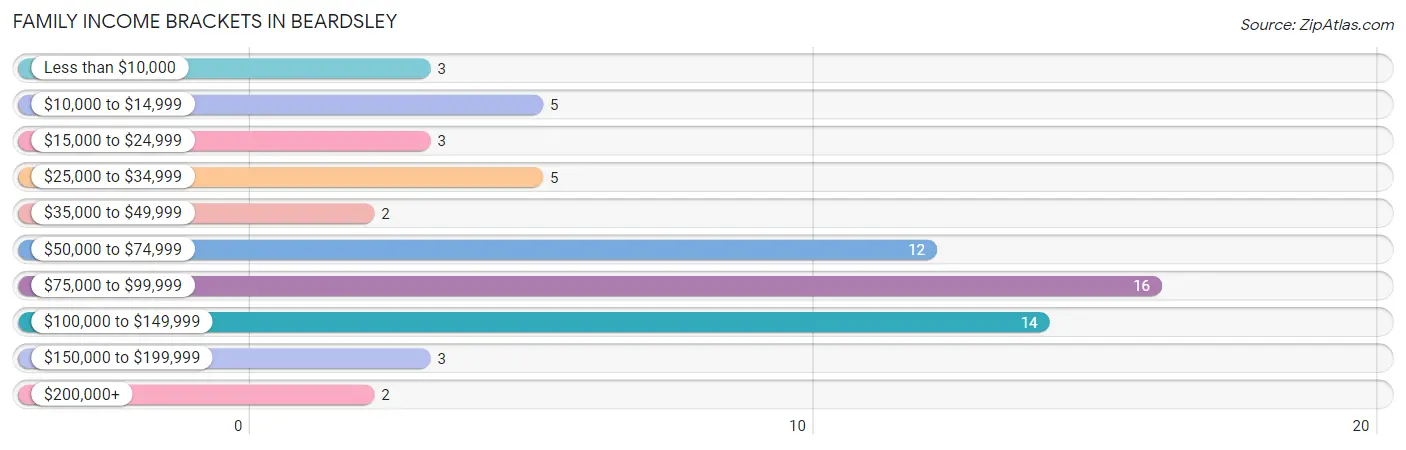
| Income Bracket | # Families | % Families |
| Less than $10,000 | 3 | 4.6% |
| $10,000 to $14,999 | 5 | 7.7% |
| $15,000 to $24,999 | 3 | 4.6% |
| $25,000 to $34,999 | 5 | 7.7% |
| $35,000 to $49,999 | 2 | 3.1% |
| $50,000 to $74,999 | 12 | 18.5% |
| $75,000 to $99,999 | 16 | 24.6% |
| $100,000 to $149,999 | 14 | 21.5% |
| $150,000 to $199,999 | 3 | 4.6% |
| $200,000+ | 2 | 3.1% |
Family Income by Famaliy Size in Beardsley
5-person families (11 | 16.9%) account for the highest median family income in Beardsley with $104,688 per family, while 2-person families (37 | 56.9%) have the highest median income of $31,125 per family member.
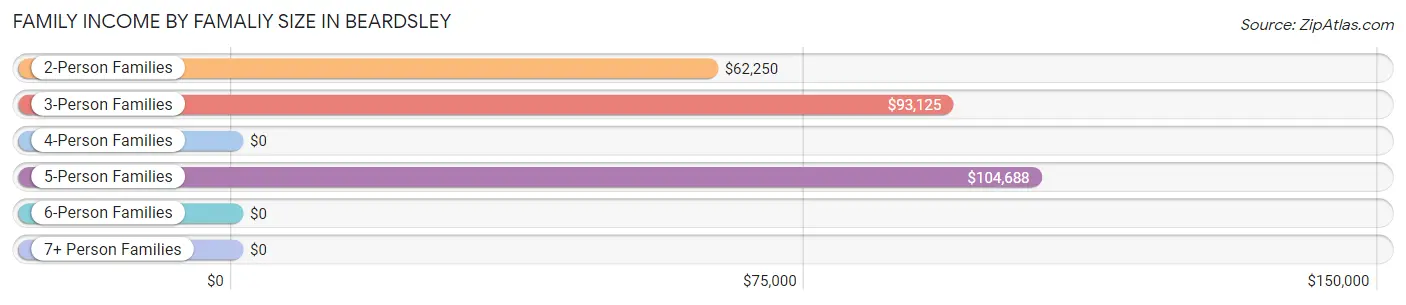
| Income Bracket | # Families | Median Income |
| 2-Person Families | 37 (56.9%) | $62,250 |
| 3-Person Families | 9 (13.9%) | $93,125 |
| 4-Person Families | 8 (12.3%) | $0 |
| 5-Person Families | 11 (16.9%) | $104,688 |
| 6-Person Families | 0 (0.0%) | $0 |
| 7+ Person Families | 0 (0.0%) | $0 |
| Total | 65 (100.0%) | $80,469 |
Family Income by Number of Earners in Beardsley
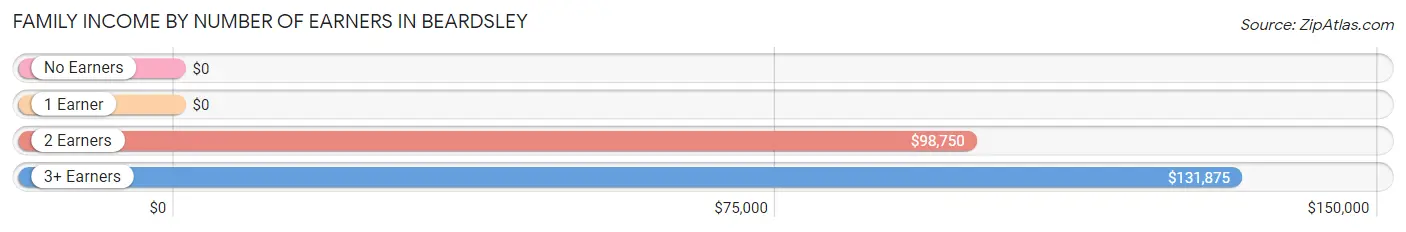
| Number of Earners | # Families | Median Income |
| No Earners | 3 (4.6%) | $0 |
| 1 Earner | 27 (41.5%) | $0 |
| 2 Earners | 30 (46.2%) | $98,750 |
| 3+ Earners | 5 (7.7%) | $131,875 |
| Total | 65 (100.0%) | $80,469 |
Household Income in Beardsley
Household Income Brackets in Beardsley
With 24 households falling in the category, the $50,000 to $74,999 income range is the most frequent in Beardsley, accounting for 24.5% of all households. In contrast, only 1 households (1.0%) fall into the less than $10,000 income bracket, making it the least populous group.
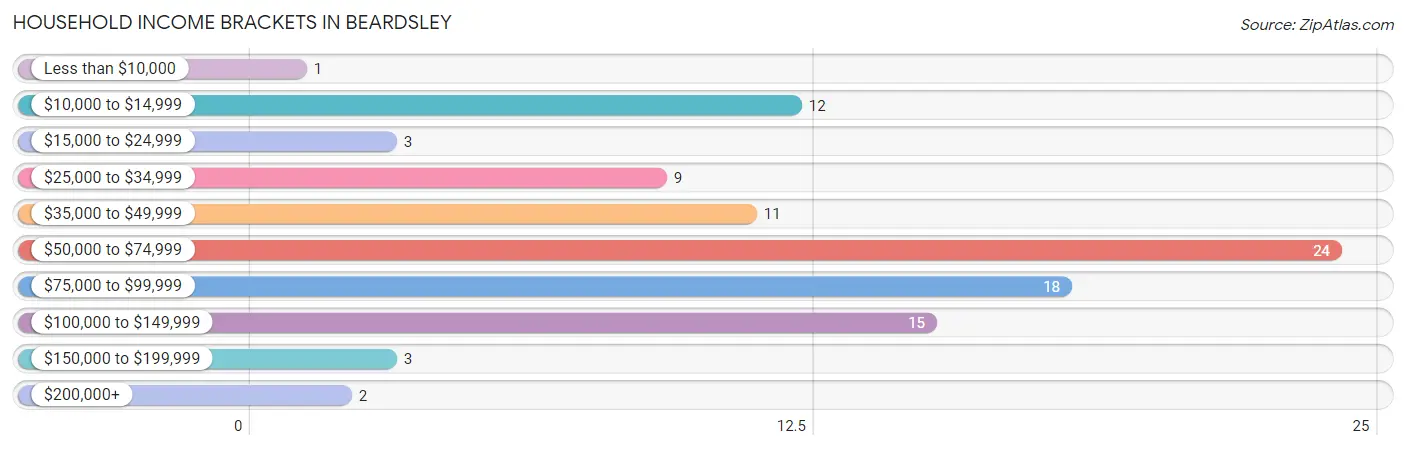
| Income Bracket | # Households | % Households |
| Less than $10,000 | 1 | 1.0% |
| $10,000 to $14,999 | 12 | 12.2% |
| $15,000 to $24,999 | 3 | 3.1% |
| $25,000 to $34,999 | 9 | 9.2% |
| $35,000 to $49,999 | 11 | 11.2% |
| $50,000 to $74,999 | 24 | 24.5% |
| $75,000 to $99,999 | 18 | 18.4% |
| $100,000 to $149,999 | 15 | 15.3% |
| $150,000 to $199,999 | 3 | 3.1% |
| $200,000+ | 2 | 2.0% |
Household Income by Householder Age in Beardsley
The median household income in Beardsley is $63,750, with the highest median household income of $65,625 found in the 25 to 44 years age bracket for the primary householder. A total of 39 households (39.8%) fall into this category. Meanwhile, the 15 to 24 years age bracket for the primary householder has the lowest median household income of $0, with 3 households (3.1%) in this group.
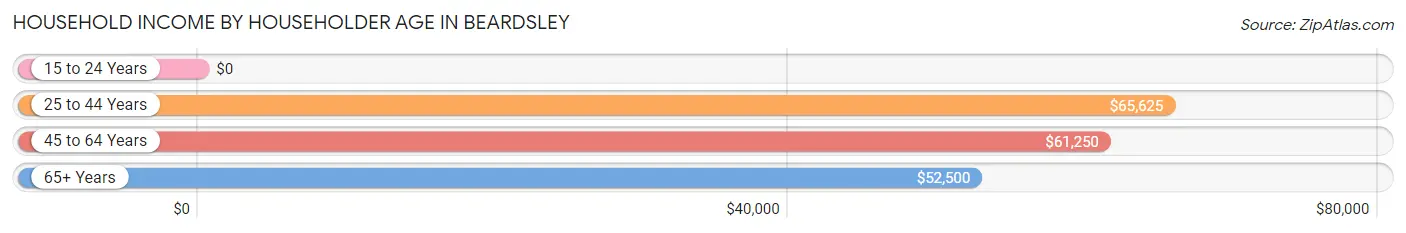
| Income Bracket | # Households | Median Income |
| 15 to 24 Years | 3 (3.1%) | $0 |
| 25 to 44 Years | 39 (39.8%) | $65,625 |
| 45 to 64 Years | 36 (36.7%) | $61,250 |
| 65+ Years | 20 (20.4%) | $52,500 |
| Total | 98 (100.0%) | $63,750 |
Poverty in Beardsley
Income Below Poverty by Sex and Age in Beardsley
With 10.7% poverty level for males and 11.9% for females among the residents of Beardsley, 55 to 64 year old males and 25 to 34 year old females are the most vulnerable to poverty, with 9 males (60.0%) and 4 females (57.1%) in their respective age groups living below the poverty level.
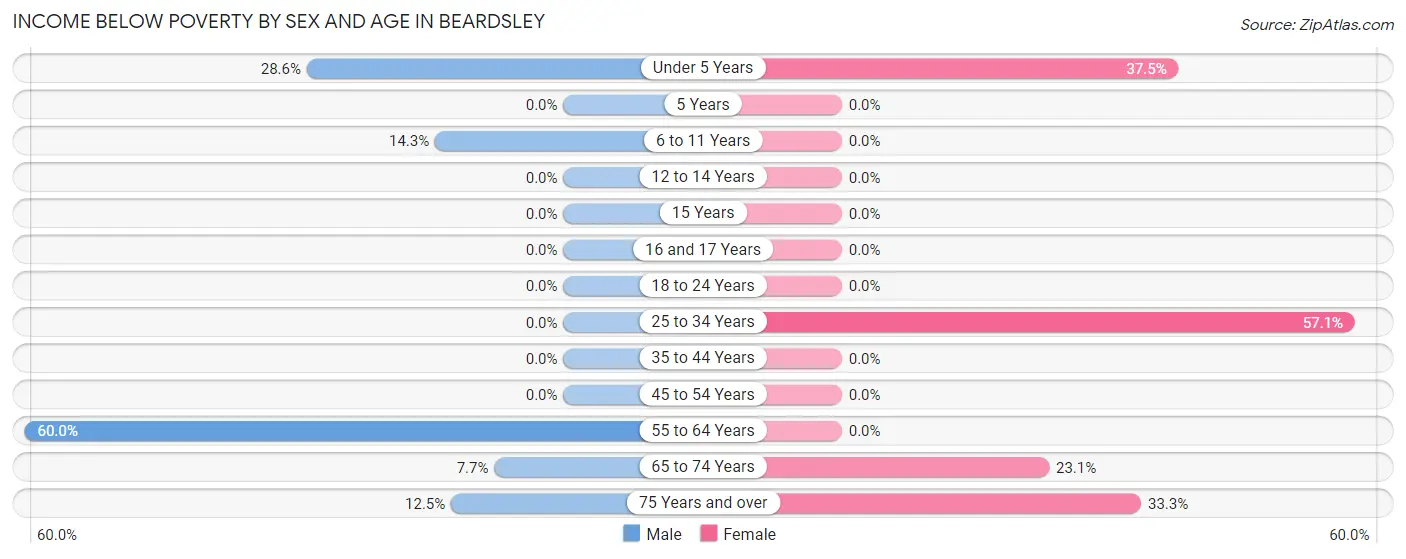
| Age Bracket | Male | Female |
| Under 5 Years | 2 (28.6%) | 3 (37.5%) |
| 5 Years | 0 (0.0%) | 0 (0.0%) |
| 6 to 11 Years | 2 (14.3%) | 0 (0.0%) |
| 12 to 14 Years | 0 (0.0%) | 0 (0.0%) |
| 15 Years | 0 (0.0%) | 0 (0.0%) |
| 16 and 17 Years | 0 (0.0%) | 0 (0.0%) |
| 18 to 24 Years | 0 (0.0%) | 0 (0.0%) |
| 25 to 34 Years | 0 (0.0%) | 4 (57.1%) |
| 35 to 44 Years | 0 (0.0%) | 0 (0.0%) |
| 45 to 54 Years | 0 (0.0%) | 0 (0.0%) |
| 55 to 64 Years | 9 (60.0%) | 0 (0.0%) |
| 65 to 74 Years | 1 (7.7%) | 3 (23.1%) |
| 75 Years and over | 1 (12.5%) | 2 (33.3%) |
| Total | 15 (10.7%) | 12 (11.9%) |
Income Above Poverty by Sex and Age in Beardsley
According to the poverty statistics in Beardsley, males aged 12 to 14 years and females aged 6 to 11 years are the age groups that are most secure financially, with 100.0% of males and 100.0% of females in these age groups living above the poverty line.
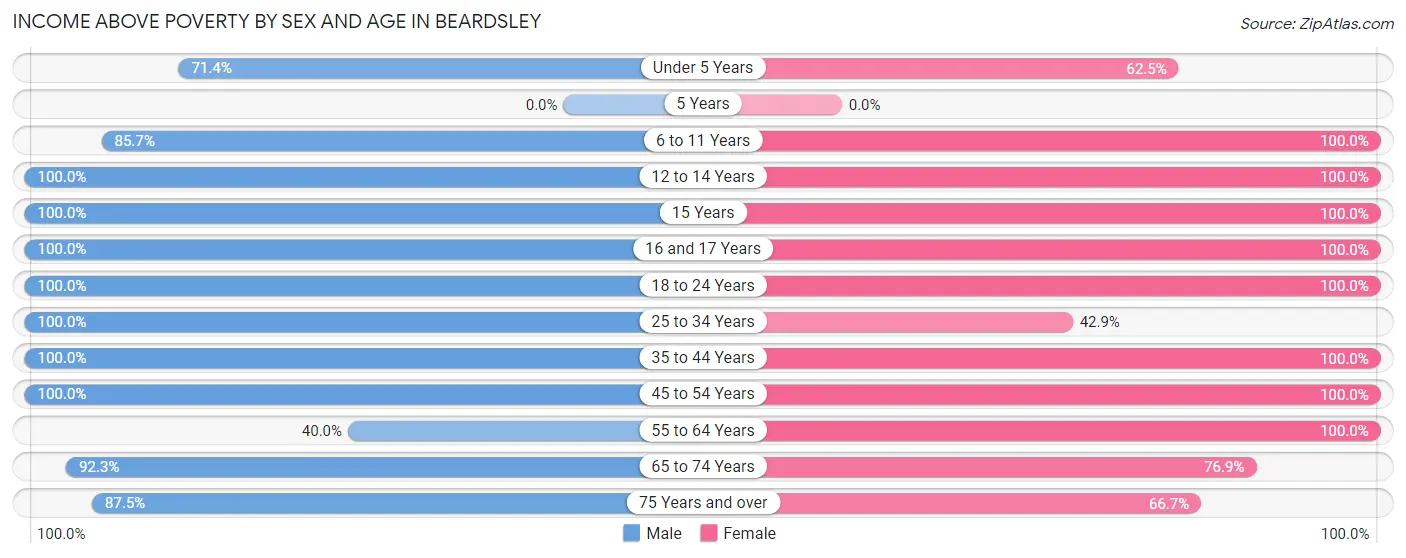
| Age Bracket | Male | Female |
| Under 5 Years | 5 (71.4%) | 5 (62.5%) |
| 5 Years | 0 (0.0%) | 0 (0.0%) |
| 6 to 11 Years | 12 (85.7%) | 4 (100.0%) |
| 12 to 14 Years | 5 (100.0%) | 10 (100.0%) |
| 15 Years | 7 (100.0%) | 6 (100.0%) |
| 16 and 17 Years | 3 (100.0%) | 2 (100.0%) |
| 18 to 24 Years | 17 (100.0%) | 3 (100.0%) |
| 25 to 34 Years | 9 (100.0%) | 3 (42.9%) |
| 35 to 44 Years | 28 (100.0%) | 20 (100.0%) |
| 45 to 54 Years | 14 (100.0%) | 12 (100.0%) |
| 55 to 64 Years | 6 (40.0%) | 10 (100.0%) |
| 65 to 74 Years | 12 (92.3%) | 10 (76.9%) |
| 75 Years and over | 7 (87.5%) | 4 (66.7%) |
| Total | 125 (89.3%) | 89 (88.1%) |
Income Below Poverty Among Married-Couple Families in Beardsley
The poverty statistics for married-couple families in Beardsley show that 12.0% or 6 of the total 50 families live below the poverty line. Families with no children have the highest poverty rate of 21.4%, comprising of 6 families. On the other hand, families with 1 or 2 children have the lowest poverty rate of 0.0%, which includes 0 families.
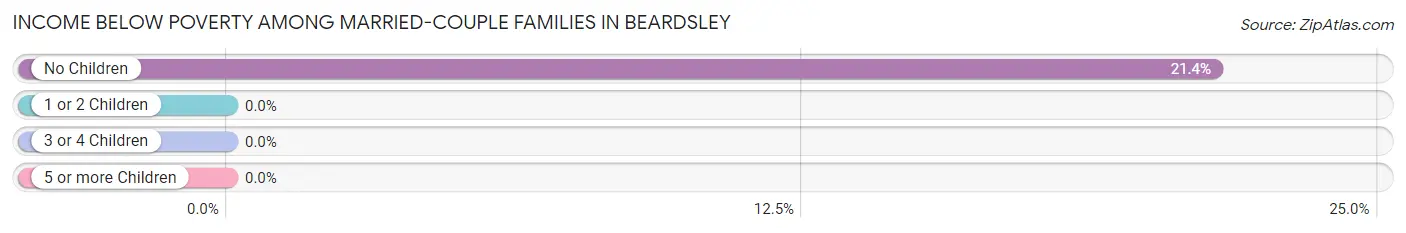
| Children | Above Poverty | Below Poverty |
| No Children | 22 (78.6%) | 6 (21.4%) |
| 1 or 2 Children | 16 (100.0%) | 0 (0.0%) |
| 3 or 4 Children | 6 (100.0%) | 0 (0.0%) |
| 5 or more Children | 0 (0.0%) | 0 (0.0%) |
| Total | 44 (88.0%) | 6 (12.0%) |
Income Below Poverty Among Single-Parent Households in Beardsley
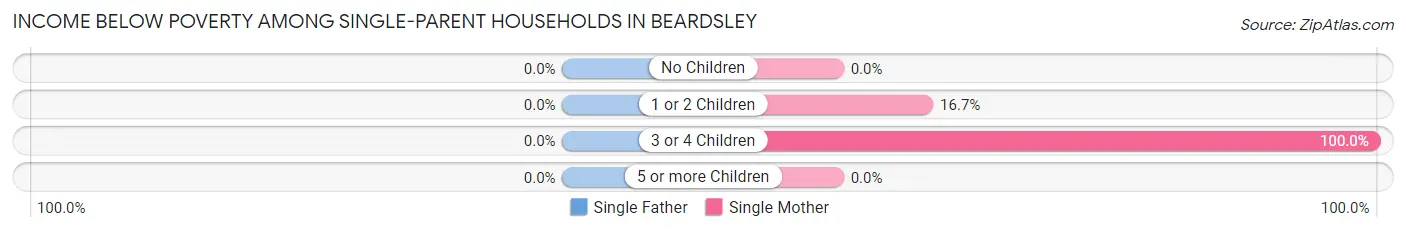
| Children | Single Father | Single Mother |
| No Children | 0 (0.0%) | 0 (0.0%) |
| 1 or 2 Children | 0 (0.0%) | 2 (16.7%) |
| 3 or 4 Children | 0 (0.0%) | 2 (100.0%) |
| 5 or more Children | 0 (0.0%) | 0 (0.0%) |
| Total | 0 (0.0%) | 4 (26.7%) |
Income Below Poverty Among Married-Couple vs Single-Parent Households in Beardsley
The poverty data for Beardsley shows that 6 of the married-couple family households (12.0%) and 4 of the single-parent households (26.7%) are living below the poverty level. Within the married-couple family households, those with no children have the highest poverty rate, with 6 households (21.4%) falling below the poverty line. Among the single-parent households, those with 3 or 4 children have the highest poverty rate, with 2 household (100.0%) living below poverty.
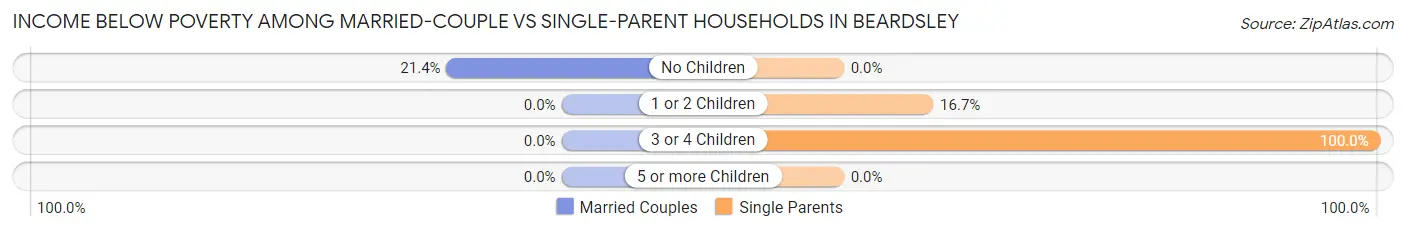
| Children | Married-Couple Families | Single-Parent Households |
| No Children | 6 (21.4%) | 0 (0.0%) |
| 1 or 2 Children | 0 (0.0%) | 2 (16.7%) |
| 3 or 4 Children | 0 (0.0%) | 2 (100.0%) |
| 5 or more Children | 0 (0.0%) | 0 (0.0%) |
| Total | 6 (12.0%) | 4 (26.7%) |
Race in Beardsley
The most populous races in Beardsley are White / Caucasian (227 | 94.2%), Hispanic or Latino (12 | 5.0%), and Two or more Races (11 | 4.6%).
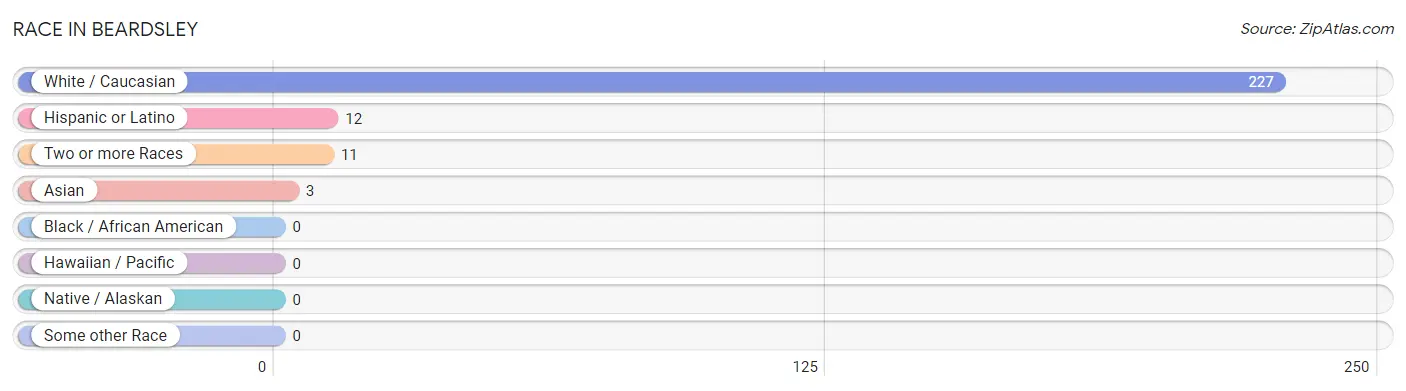
| Race | # Population | % Population |
| Asian | 3 | 1.2% |
| Black / African American | 0 | 0.0% |
| Hawaiian / Pacific | 0 | 0.0% |
| Hispanic or Latino | 12 | 5.0% |
| Native / Alaskan | 0 | 0.0% |
| White / Caucasian | 227 | 94.2% |
| Two or more Races | 11 | 4.6% |
| Some other Race | 0 | 0.0% |
| Total | 241 | 100.0% |
Ancestry in Beardsley
The most populous ancestries reported in Beardsley are German (122 | 50.6%), Irish (35 | 14.5%), Swedish (32 | 13.3%), Norwegian (25 | 10.4%), and Finnish (20 | 8.3%), together accounting for 97.1% of all Beardsley residents.
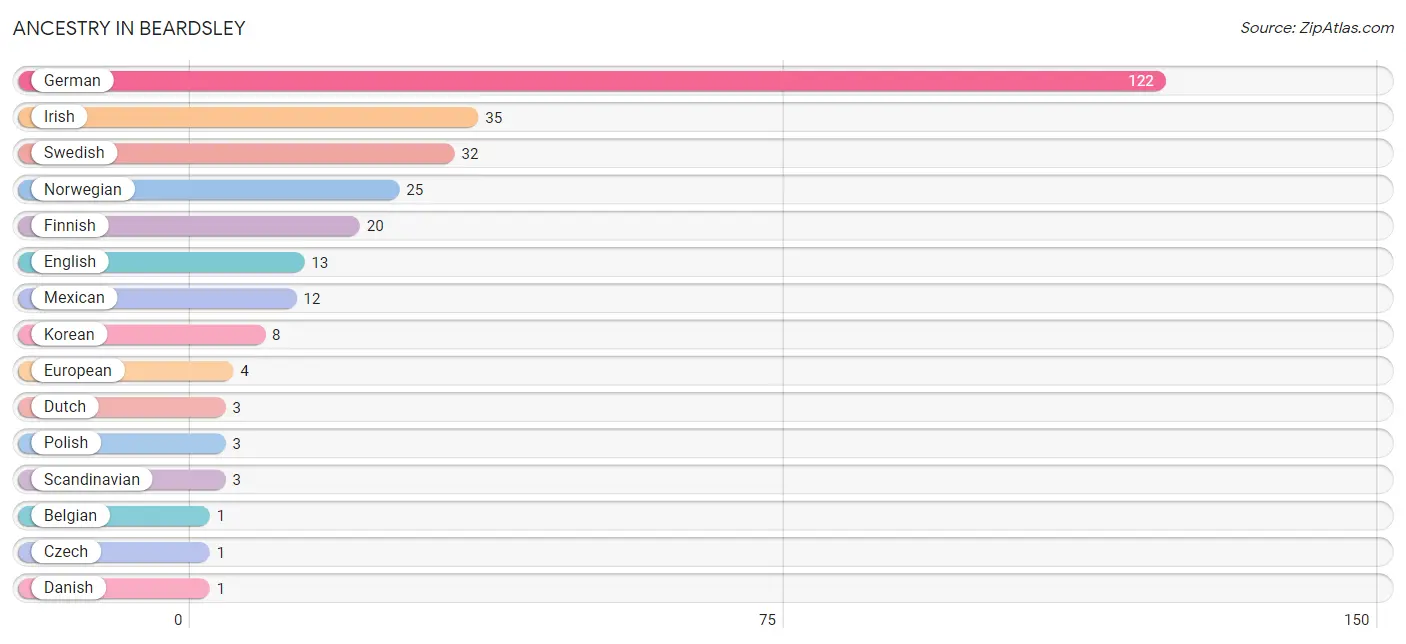
| Ancestry | # Population | % Population |
| Belgian | 1 | 0.4% |
| Czech | 1 | 0.4% |
| Danish | 1 | 0.4% |
| Dutch | 3 | 1.2% |
| English | 13 | 5.4% |
| European | 4 | 1.7% |
| Finnish | 20 | 8.3% |
| German | 122 | 50.6% |
| Irish | 35 | 14.5% |
| Korean | 8 | 3.3% |
| Mexican | 12 | 5.0% |
| Norwegian | 25 | 10.4% |
| Polish | 3 | 1.2% |
| Scandinavian | 3 | 1.2% |
| Swedish | 32 | 13.3% | View All 15 Rows |
Immigrants in Beardsley

| Immigration Origin | # Population | % Population | View All 0 Rows |
Sex and Age in Beardsley
Sex and Age in Beardsley
The most populous age groups in Beardsley are 15 to 19 Years (17 | 12.1%) for men and 35 to 39 Years (13 | 12.9%) for women.
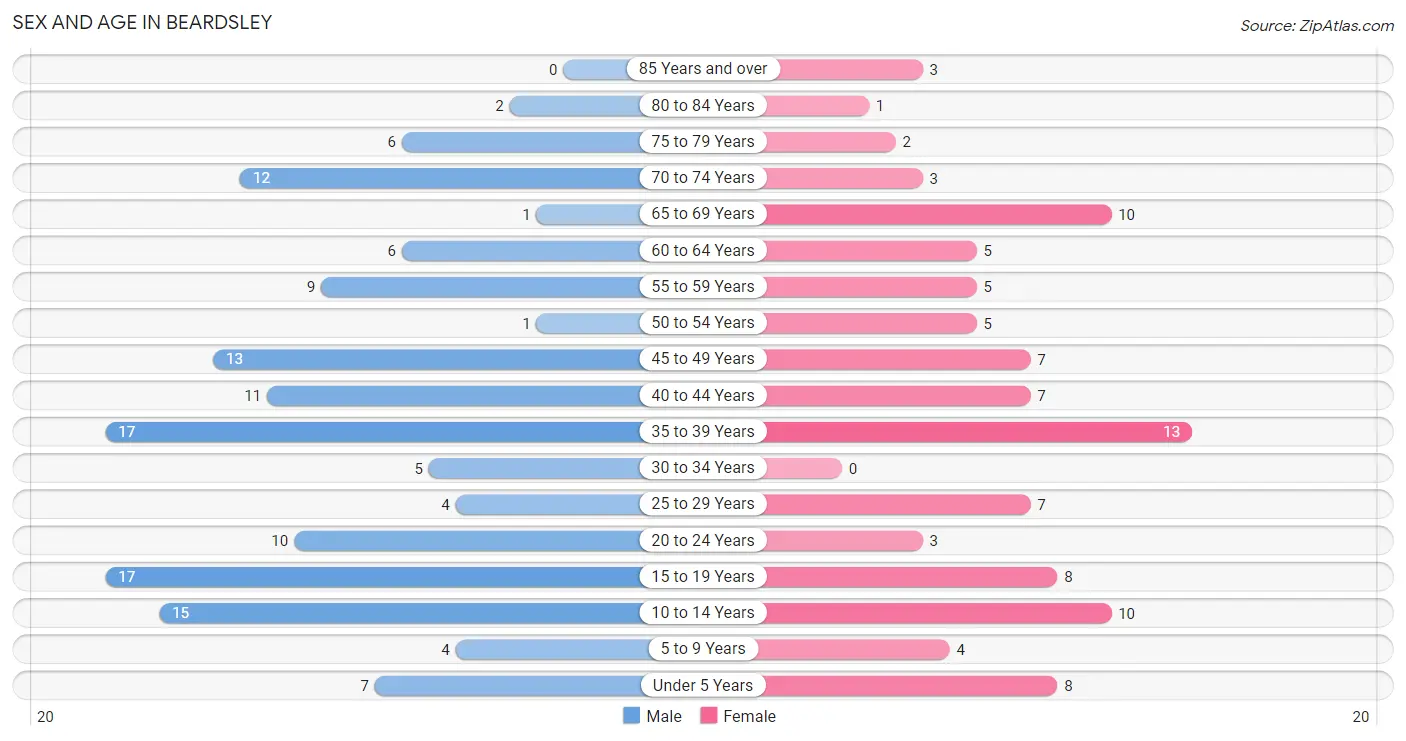
| Age Bracket | Male | Female |
| Under 5 Years | 7 (5.0%) | 8 (7.9%) |
| 5 to 9 Years | 4 (2.9%) | 4 (4.0%) |
| 10 to 14 Years | 15 (10.7%) | 10 (9.9%) |
| 15 to 19 Years | 17 (12.1%) | 8 (7.9%) |
| 20 to 24 Years | 10 (7.1%) | 3 (3.0%) |
| 25 to 29 Years | 4 (2.9%) | 7 (6.9%) |
| 30 to 34 Years | 5 (3.6%) | 0 (0.0%) |
| 35 to 39 Years | 17 (12.1%) | 13 (12.9%) |
| 40 to 44 Years | 11 (7.9%) | 7 (6.9%) |
| 45 to 49 Years | 13 (9.3%) | 7 (6.9%) |
| 50 to 54 Years | 1 (0.7%) | 5 (5.0%) |
| 55 to 59 Years | 9 (6.4%) | 5 (5.0%) |
| 60 to 64 Years | 6 (4.3%) | 5 (5.0%) |
| 65 to 69 Years | 1 (0.7%) | 10 (9.9%) |
| 70 to 74 Years | 12 (8.6%) | 3 (3.0%) |
| 75 to 79 Years | 6 (4.3%) | 2 (2.0%) |
| 80 to 84 Years | 2 (1.4%) | 1 (1.0%) |
| 85 Years and over | 0 (0.0%) | 3 (3.0%) |
| Total | 140 (100.0%) | 101 (100.0%) |
Families and Households in Beardsley
Median Family Size in Beardsley
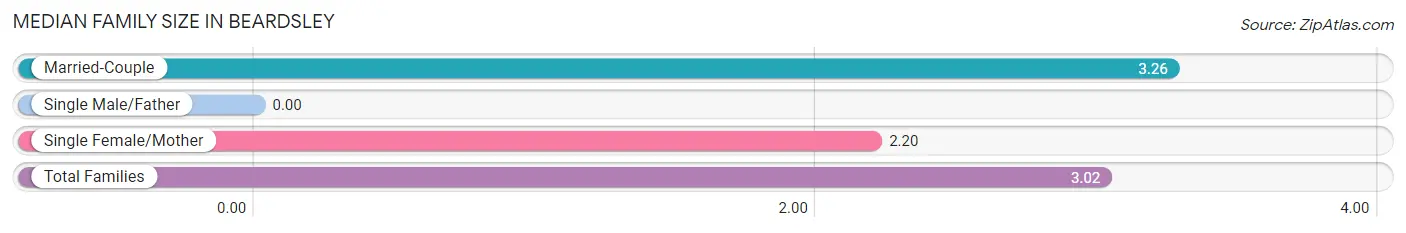
| Family Type | # Families | Family Size |
| Married-Couple | 50 (76.9%) | 3.26 |
| Single Male/Father | 0 (0.0%) | - |
| Single Female/Mother | 15 (23.1%) | 2.20 |
| Total Families | 65 (100.0%) | 3.02 |
Median Household Size in Beardsley
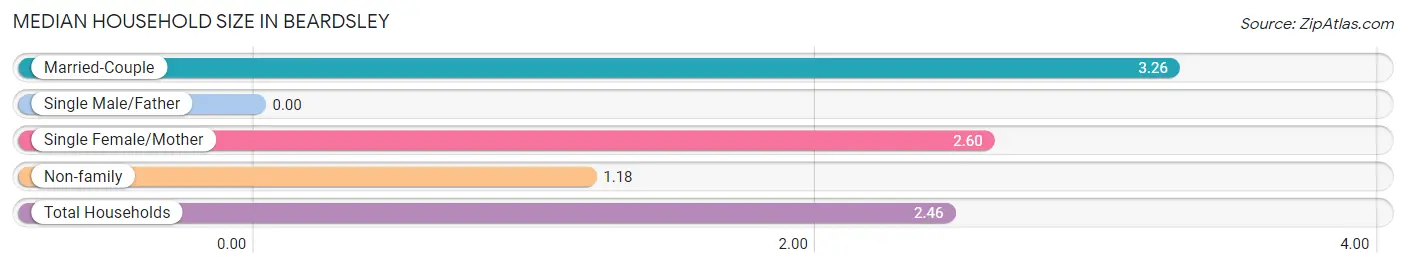
| Household Type | # Households | Household Size |
| Married-Couple | 50 (51.0%) | 3.26 |
| Single Male/Father | 0 (0.0%) | - |
| Single Female/Mother | 15 (15.3%) | 2.60 |
| Non-family | 33 (33.7%) | 1.18 |
| Total Households | 98 (100.0%) | 2.46 |
Household Size by Marriage Status in Beardsley
Out of a total of 98 households in Beardsley, 65 (66.3%) are family households, while 33 (33.7%) are nonfamily households. The most numerous type of family households are 2-person households, comprising 35, and the most common type of nonfamily households are 1-person households, comprising 27.
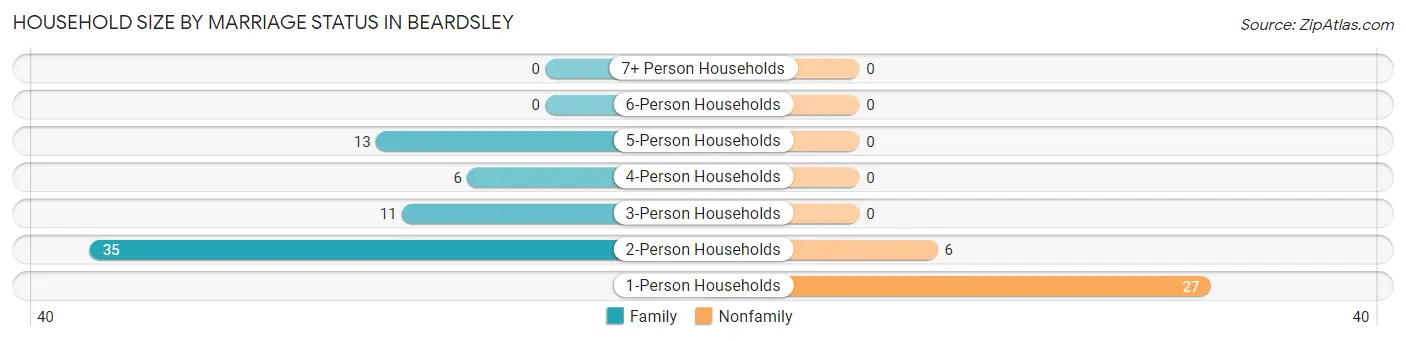
| Household Size | Family Households | Nonfamily Households |
| 1-Person Households | - | 27 (27.6%) |
| 2-Person Households | 35 (35.7%) | 6 (6.1%) |
| 3-Person Households | 11 (11.2%) | 0 (0.0%) |
| 4-Person Households | 6 (6.1%) | 0 (0.0%) |
| 5-Person Households | 13 (13.3%) | 0 (0.0%) |
| 6-Person Households | 0 (0.0%) | 0 (0.0%) |
| 7+ Person Households | 0 (0.0%) | 0 (0.0%) |
| Total | 65 (66.3%) | 33 (33.7%) |
Female Fertility in Beardsley
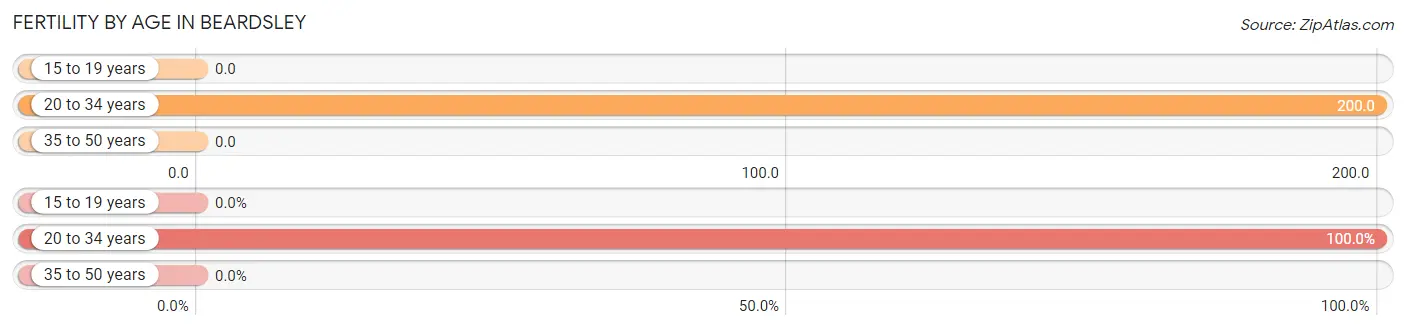
Fertility by Age in Beardsley
Average fertility rate in Beardsley is 40.0 births per 1,000 women. Women in the age bracket of 20 to 34 years have the highest fertility rate with 200.0 births per 1,000 women. Women in the age bracket of 20 to 34 years acount for 100.0% of all women with births.
| Age Bracket | Women with Births | Births / 1,000 Women |
| 15 to 19 years | 0 (0.0%) | 0.0 |
| 20 to 34 years | 2 (100.0%) | 200.0 |
| 35 to 50 years | 0 (0.0%) | 0.0 |
| Total | 2 (100.0%) | 40.0 |
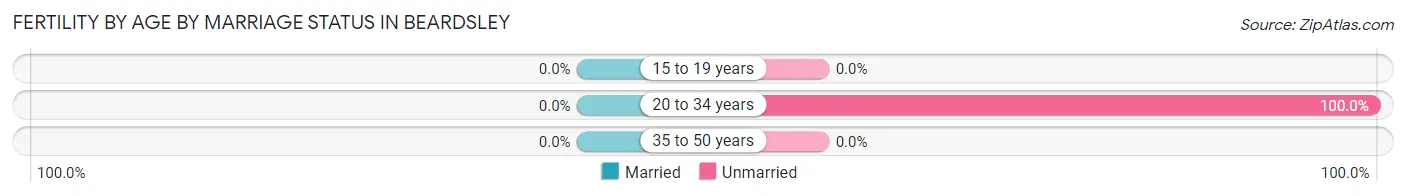
Fertility by Age by Marriage Status in Beardsley
| Age Bracket | Married | Unmarried |
| 15 to 19 years | 0 (0.0%) | 0 (0.0%) |
| 20 to 34 years | 0 (0.0%) | 2 (100.0%) |
| 35 to 50 years | 0 (0.0%) | 0 (0.0%) |
| Total | 0 (0.0%) | 2 (100.0%) |
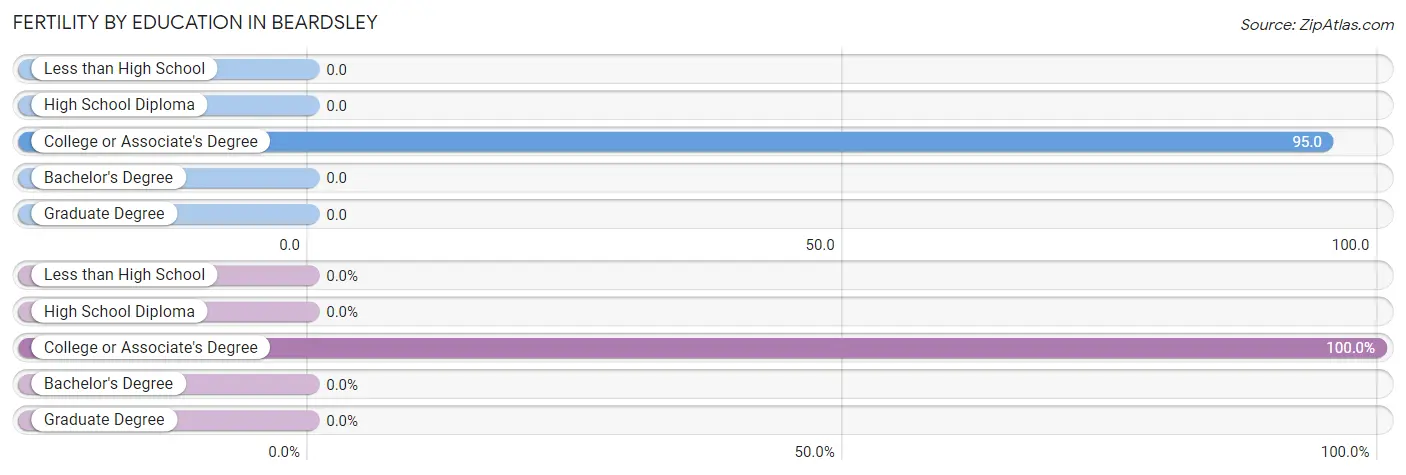
Fertility by Education in Beardsley
| Educational Attainment | Women with Births | Births / 1,000 Women |
| Less than High School | 0 (0.0%) | 0.0 |
| High School Diploma | 0 (0.0%) | 0.0 |
| College or Associate's Degree | 2 (100.0%) | 95.0 |
| Bachelor's Degree | 0 (0.0%) | 0.0 |
| Graduate Degree | 0 (0.0%) | 0.0 |
| Total | 2 (100.0%) | 40.0 |
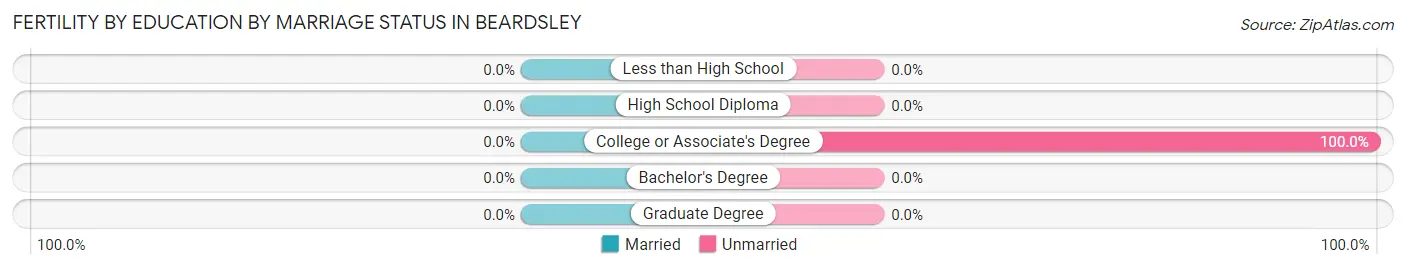
Fertility by Education by Marriage Status in Beardsley
| Educational Attainment | Married | Unmarried |
| Less than High School | 0 (0.0%) | 0 (0.0%) |
| High School Diploma | 0 (0.0%) | 0 (0.0%) |
| College or Associate's Degree | 0 (0.0%) | 2 (100.0%) |
| Bachelor's Degree | 0 (0.0%) | 0 (0.0%) |
| Graduate Degree | 0 (0.0%) | 0 (0.0%) |
| Total | 0 (0.0%) | 2 (100.0%) |
Employment Characteristics in Beardsley
Employment by Class of Employer in Beardsley
Among the 122 employed individuals in Beardsley, private company employees (72 | 59.0%), self-employed (not incorporated) (20 | 16.4%), and not-for-profit organizations (13 | 10.7%) make up the most common classes of employment.
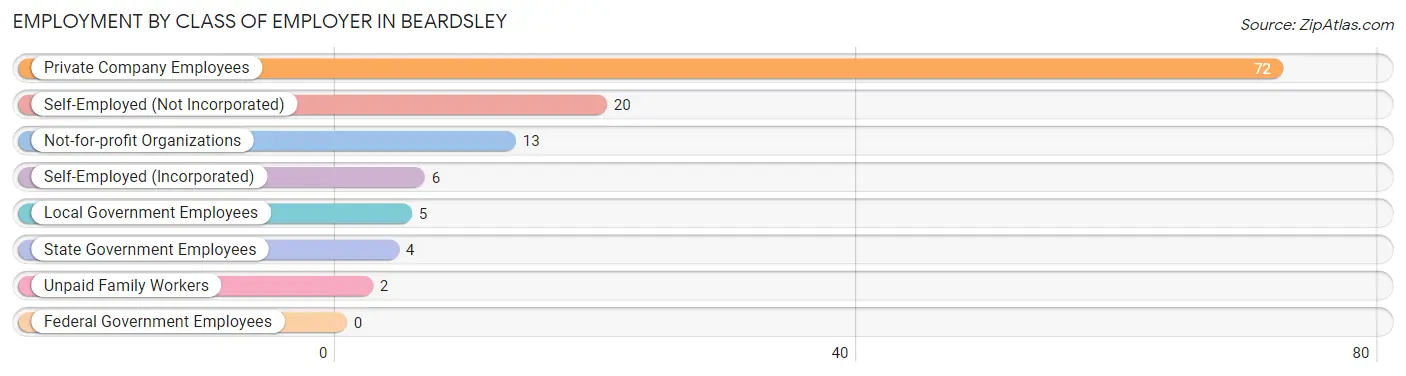
| Employer Class | # Employees | % Employees |
| Private Company Employees | 72 | 59.0% |
| Self-Employed (Incorporated) | 6 | 4.9% |
| Self-Employed (Not Incorporated) | 20 | 16.4% |
| Not-for-profit Organizations | 13 | 10.7% |
| Local Government Employees | 5 | 4.1% |
| State Government Employees | 4 | 3.3% |
| Federal Government Employees | 0 | 0.0% |
| Unpaid Family Workers | 2 | 1.6% |
| Total | 122 | 100.0% |
Employment Status by Age in Beardsley
According to the labor force statistics for Beardsley, out of the total population over 16 years of age (180), 71.7% or 129 individuals are in the labor force, with 5.4% or 7 of them unemployed. The age group with the highest labor force participation rate is 25 to 29 years, with 100.0% or 11 individuals in the labor force. Within the labor force, the 45 to 54 years age range has the highest percentage of unemployed individuals, with 20.8% or 5 of them being unemployed.
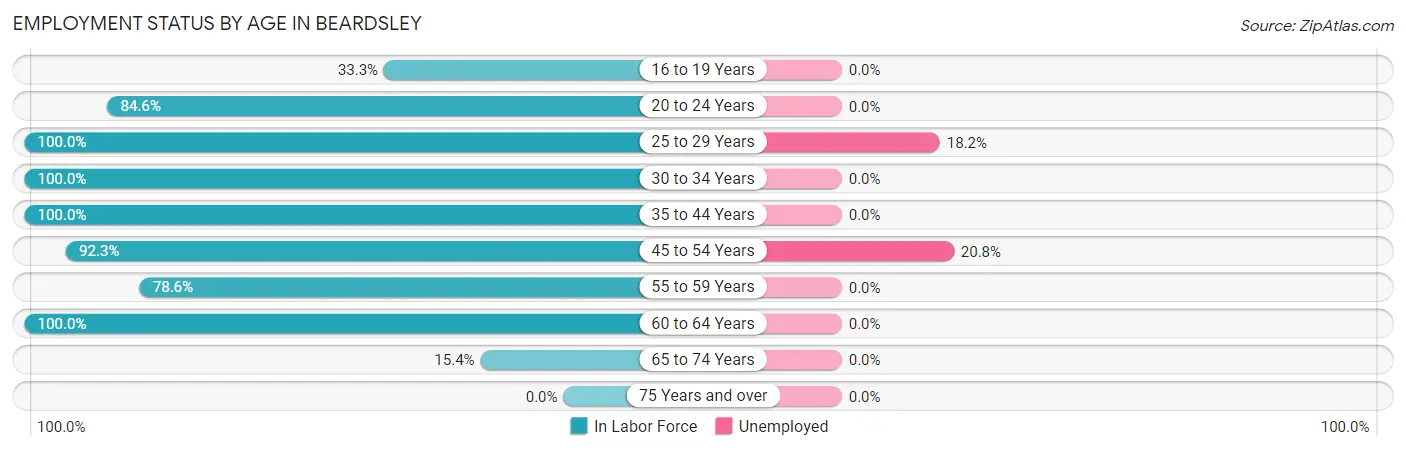
| Age Bracket | In Labor Force | Unemployed |
| 16 to 19 Years | 4 (33.3%) | 0 (0.0%) |
| 20 to 24 Years | 11 (84.6%) | 0 (0.0%) |
| 25 to 29 Years | 11 (100.0%) | 2 (18.2%) |
| 30 to 34 Years | 5 (100.0%) | 0 (0.0%) |
| 35 to 44 Years | 48 (100.0%) | 0 (0.0%) |
| 45 to 54 Years | 24 (92.3%) | 5 (20.8%) |
| 55 to 59 Years | 11 (78.6%) | 0 (0.0%) |
| 60 to 64 Years | 11 (100.0%) | 0 (0.0%) |
| 65 to 74 Years | 4 (15.4%) | 0 (0.0%) |
| 75 Years and over | 0 (0.0%) | 0 (0.0%) |
| Total | 129 (71.7%) | 7 (5.4%) |
Employment Status by Educational Attainment in Beardsley
According to labor force statistics for Beardsley, 95.7% of individuals (110) out of the total population between 25 and 64 years of age (115) are in the labor force, with 6.4% or 7 of them being unemployed. The group with the highest labor force participation rate are those with the educational attainment of less than high school, with 100.0% or 4 individuals in the labor force. Within the labor force, individuals with college / associate degree education have the highest percentage of unemployment, with 10.9% or 7 of them being unemployed.
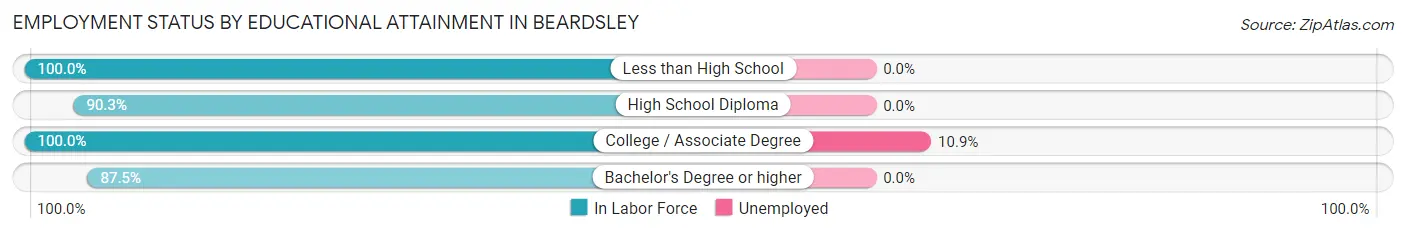
| Educational Attainment | In Labor Force | Unemployed |
| Less than High School | 4 (100.0%) | 0 (0.0%) |
| High School Diploma | 28 (90.3%) | 0 (0.0%) |
| College / Associate Degree | 64 (100.0%) | 7 (10.9%) |
| Bachelor's Degree or higher | 14 (87.5%) | 0 (0.0%) |
| Total | 110 (95.7%) | 7 (6.4%) |
Employment Occupations by Sex in Beardsley
Management, Business, Science and Arts Occupations
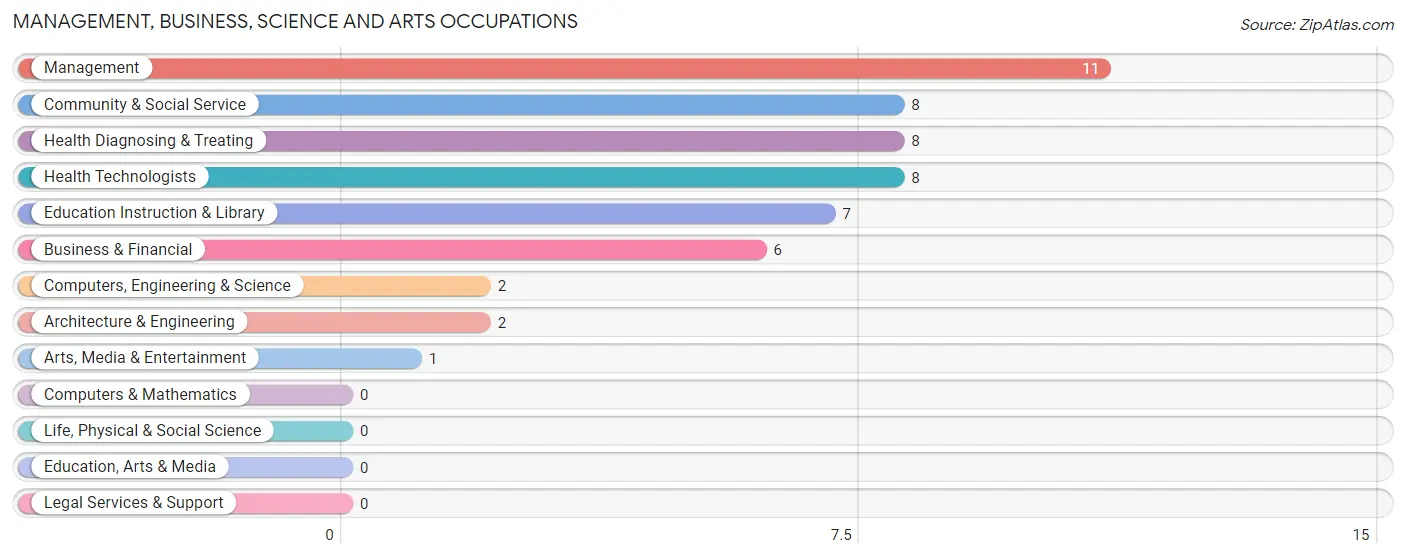
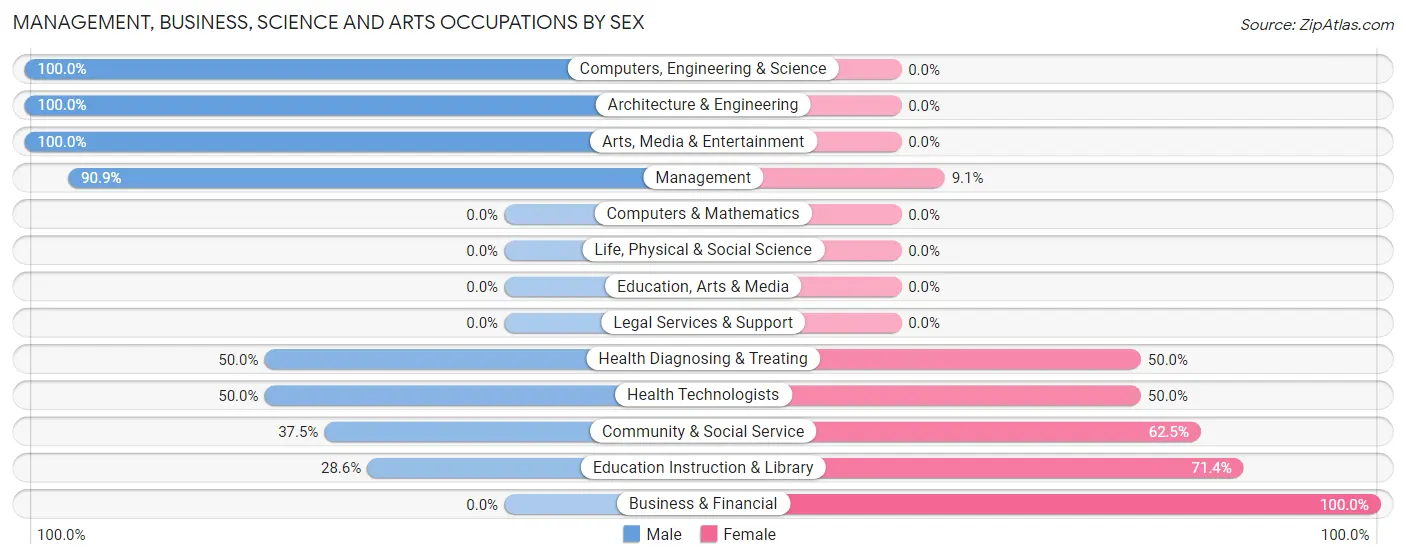
The most common Management, Business, Science and Arts occupations in Beardsley are Management (11 | 9.0%), Community & Social Service (8 | 6.6%), Health Diagnosing & Treating (8 | 6.6%), Health Technologists (8 | 6.6%), and Education Instruction & Library (7 | 5.7%).
Management, Business, Science and Arts Occupations by Sex
Within the Management, Business, Science and Arts occupations in Beardsley, the most male-oriented occupations are Computers, Engineering & Science (100.0%), Architecture & Engineering (100.0%), and Arts, Media & Entertainment (100.0%), while the most female-oriented occupations are Business & Financial (100.0%), Education Instruction & Library (71.4%), and Community & Social Service (62.5%).
| Occupation | Male | Female |
| Management | 10 (90.9%) | 1 (9.1%) |
| Business & Financial | 0 (0.0%) | 6 (100.0%) |
| Computers, Engineering & Science | 2 (100.0%) | 0 (0.0%) |
| Computers & Mathematics | 0 (0.0%) | 0 (0.0%) |
| Architecture & Engineering | 2 (100.0%) | 0 (0.0%) |
| Life, Physical & Social Science | 0 (0.0%) | 0 (0.0%) |
| Community & Social Service | 3 (37.5%) | 5 (62.5%) |
| Education, Arts & Media | 0 (0.0%) | 0 (0.0%) |
| Legal Services & Support | 0 (0.0%) | 0 (0.0%) |
| Education Instruction & Library | 2 (28.6%) | 5 (71.4%) |
| Arts, Media & Entertainment | 1 (100.0%) | 0 (0.0%) |
| Health Diagnosing & Treating | 4 (50.0%) | 4 (50.0%) |
| Health Technologists | 4 (50.0%) | 4 (50.0%) |
| Total (Category) | 19 (54.3%) | 16 (45.7%) |
| Total (Overall) | 72 (59.0%) | 50 (41.0%) |
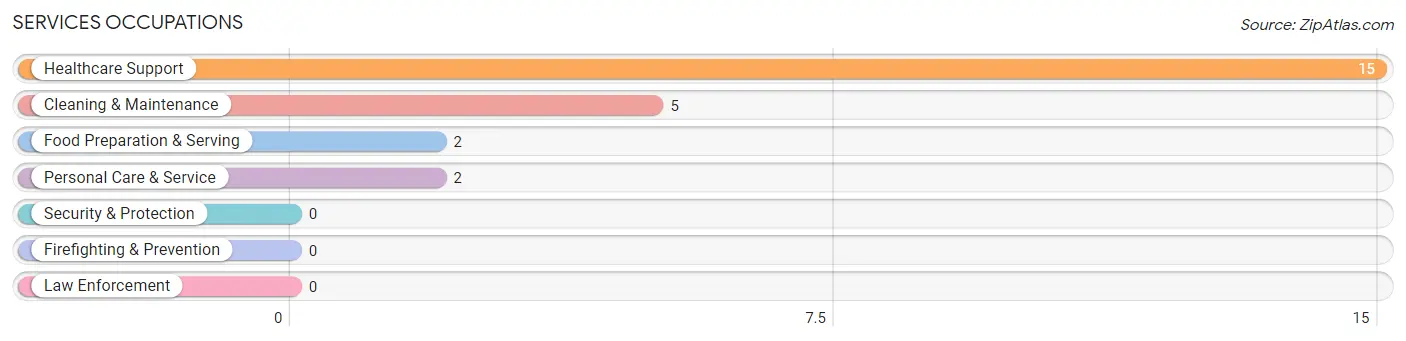
Services Occupations
The most common Services occupations in Beardsley are Healthcare Support (15 | 12.3%), Cleaning & Maintenance (5 | 4.1%), Food Preparation & Serving (2 | 1.6%), and Personal Care & Service (2 | 1.6%).
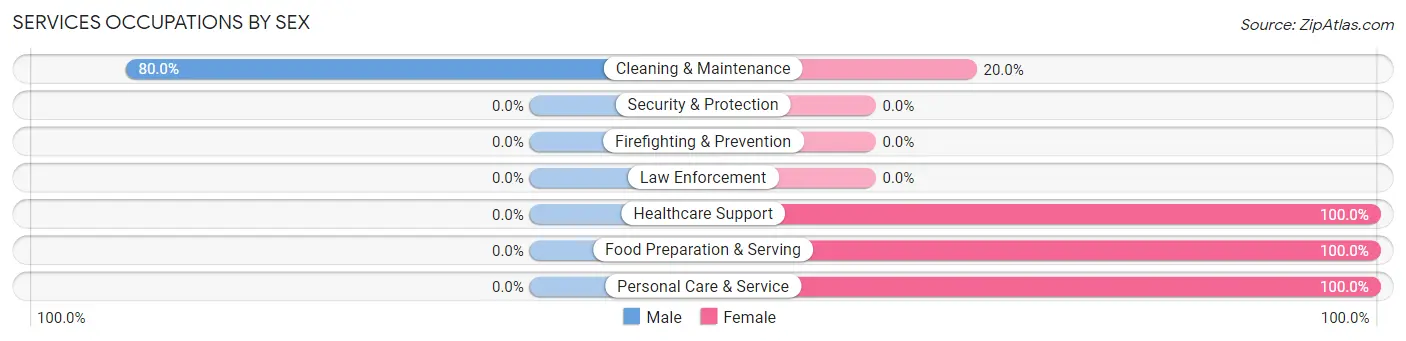
Services Occupations by Sex
| Occupation | Male | Female |
| Healthcare Support | 0 (0.0%) | 15 (100.0%) |
| Security & Protection | 0 (0.0%) | 0 (0.0%) |
| Firefighting & Prevention | 0 (0.0%) | 0 (0.0%) |
| Law Enforcement | 0 (0.0%) | 0 (0.0%) |
| Food Preparation & Serving | 0 (0.0%) | 2 (100.0%) |
| Cleaning & Maintenance | 4 (80.0%) | 1 (20.0%) |
| Personal Care & Service | 0 (0.0%) | 2 (100.0%) |
| Total (Category) | 4 (16.7%) | 20 (83.3%) |
| Total (Overall) | 72 (59.0%) | 50 (41.0%) |
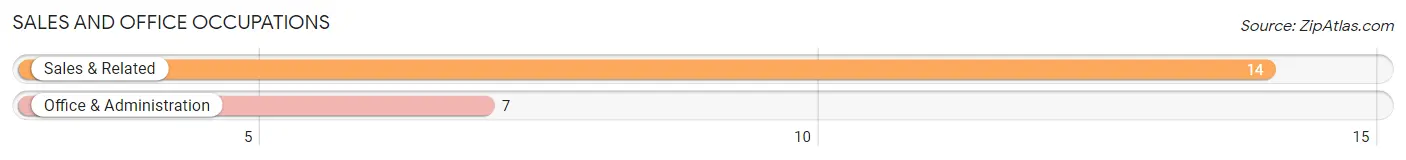
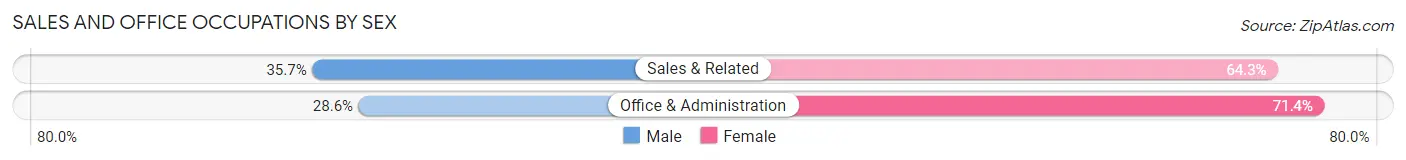
Sales and Office Occupations
The most common Sales and Office occupations in Beardsley are Sales & Related (14 | 11.5%), and Office & Administration (7 | 5.7%).
Sales and Office Occupations by Sex
| Occupation | Male | Female |
| Sales & Related | 5 (35.7%) | 9 (64.3%) |
| Office & Administration | 2 (28.6%) | 5 (71.4%) |
| Total (Category) | 7 (33.3%) | 14 (66.7%) |
| Total (Overall) | 72 (59.0%) | 50 (41.0%) |
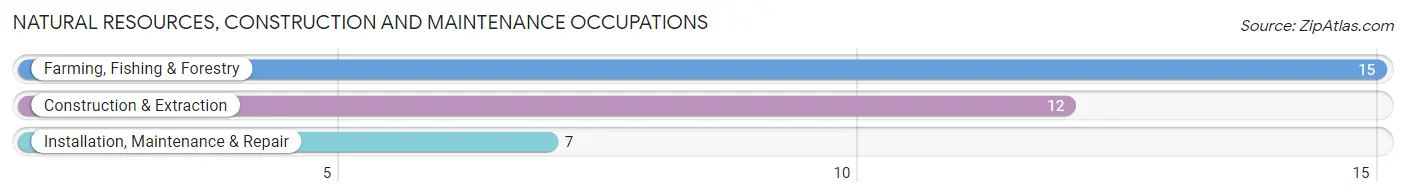
Natural Resources, Construction and Maintenance Occupations
The most common Natural Resources, Construction and Maintenance occupations in Beardsley are Farming, Fishing & Forestry (15 | 12.3%), Construction & Extraction (12 | 9.8%), and Installation, Maintenance & Repair (7 | 5.7%).
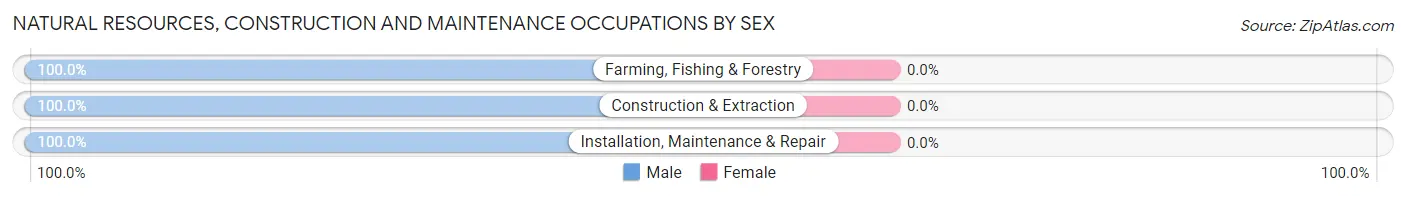
Natural Resources, Construction and Maintenance Occupations by Sex
| Occupation | Male | Female |
| Farming, Fishing & Forestry | 15 (100.0%) | 0 (0.0%) |
| Construction & Extraction | 12 (100.0%) | 0 (0.0%) |
| Installation, Maintenance & Repair | 7 (100.0%) | 0 (0.0%) |
| Total (Category) | 34 (100.0%) | 0 (0.0%) |
| Total (Overall) | 72 (59.0%) | 50 (41.0%) |
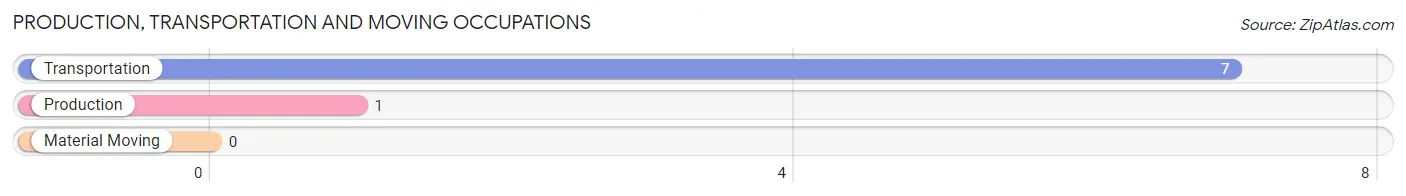
Production, Transportation and Moving Occupations
The most common Production, Transportation and Moving occupations in Beardsley are Transportation (7 | 5.7%), and Production (1 | 0.8%).
Production, Transportation and Moving Occupations by Sex
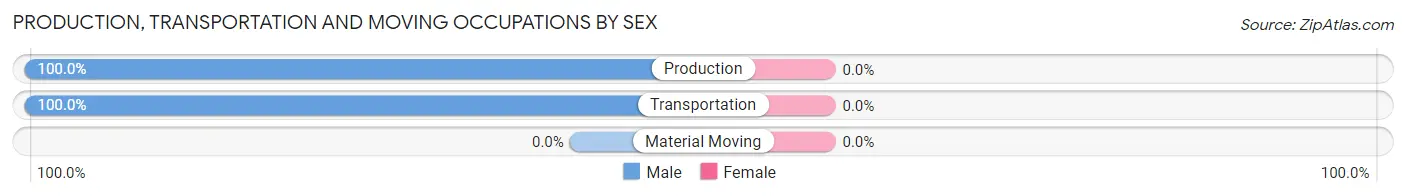
| Occupation | Male | Female |
| Production | 1 (100.0%) | 0 (0.0%) |
| Transportation | 7 (100.0%) | 0 (0.0%) |
| Material Moving | 0 (0.0%) | 0 (0.0%) |
| Total (Category) | 8 (100.0%) | 0 (0.0%) |
| Total (Overall) | 72 (59.0%) | 50 (41.0%) |
Employment Industries by Sex in Beardsley
Employment Industries in Beardsley
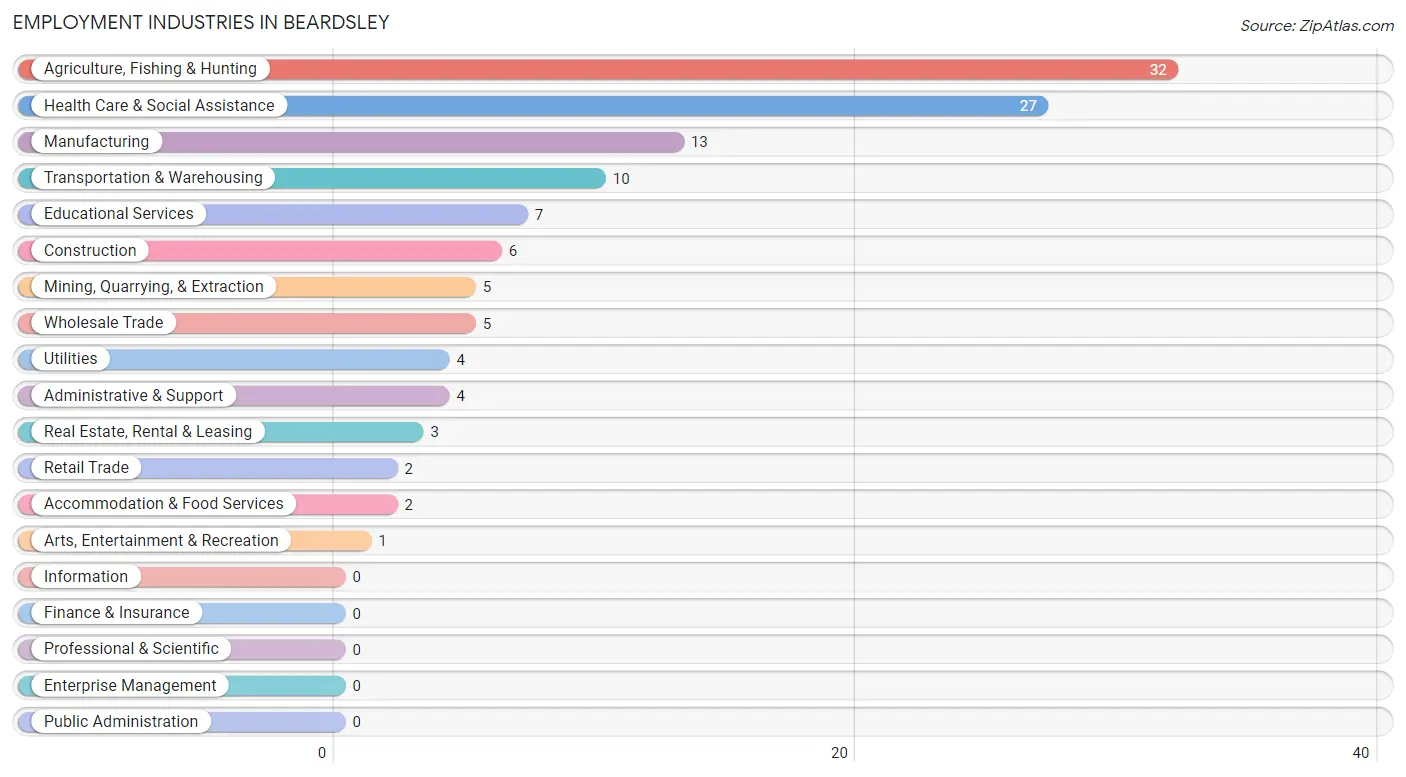
The major employment industries in Beardsley include Agriculture, Fishing & Hunting (32 | 26.2%), Health Care & Social Assistance (27 | 22.1%), Manufacturing (13 | 10.7%), Transportation & Warehousing (10 | 8.2%), and Educational Services (7 | 5.7%).
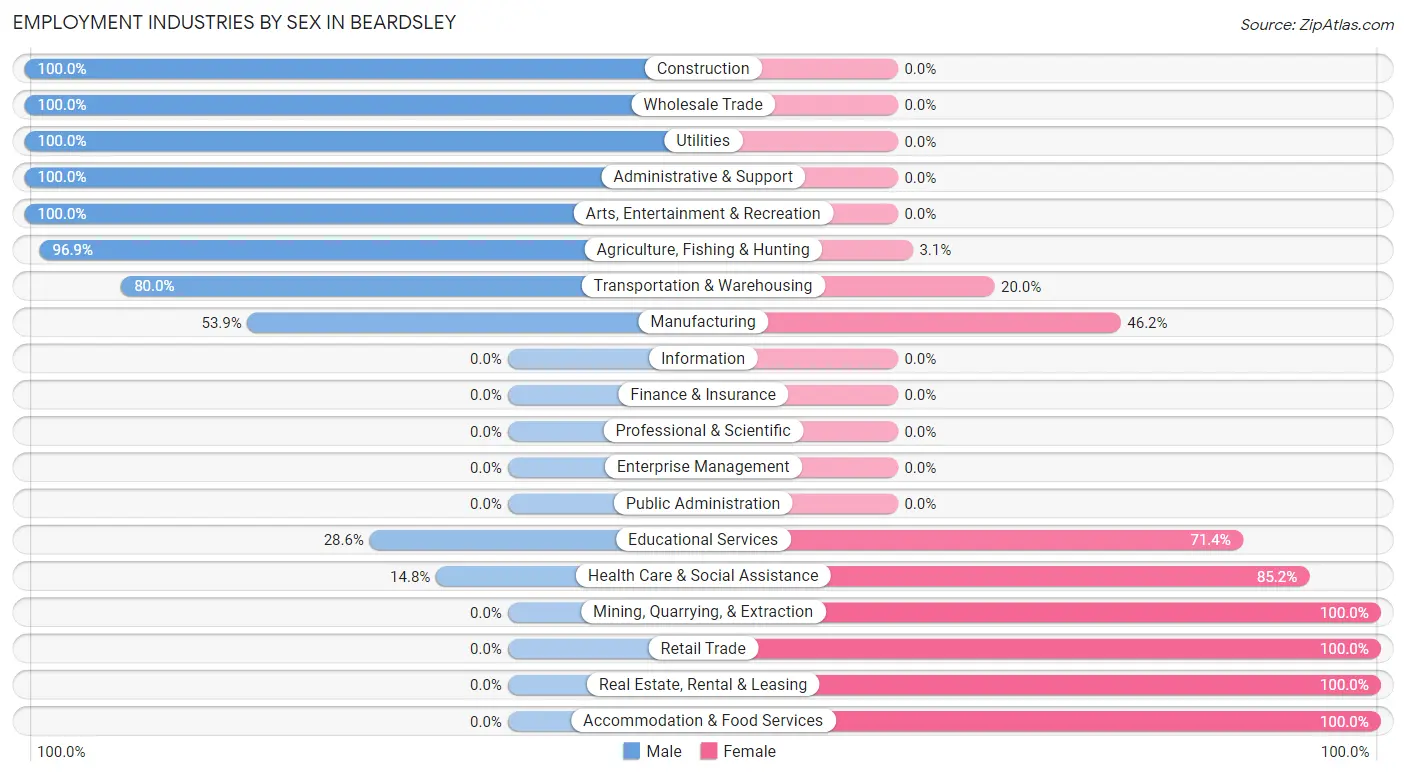
Employment Industries by Sex in Beardsley
The Beardsley industries that see more men than women are Construction (100.0%), Wholesale Trade (100.0%), and Utilities (100.0%), whereas the industries that tend to have a higher number of women are Mining, Quarrying, & Extraction (100.0%), Retail Trade (100.0%), and Real Estate, Rental & Leasing (100.0%).
| Industry | Male | Female |
| Agriculture, Fishing & Hunting | 31 (96.9%) | 1 (3.1%) |
| Mining, Quarrying, & Extraction | 0 (0.0%) | 5 (100.0%) |
| Construction | 6 (100.0%) | 0 (0.0%) |
| Manufacturing | 7 (53.8%) | 6 (46.2%) |
| Wholesale Trade | 5 (100.0%) | 0 (0.0%) |
| Retail Trade | 0 (0.0%) | 2 (100.0%) |
| Transportation & Warehousing | 8 (80.0%) | 2 (20.0%) |
| Utilities | 4 (100.0%) | 0 (0.0%) |
| Information | 0 (0.0%) | 0 (0.0%) |
| Finance & Insurance | 0 (0.0%) | 0 (0.0%) |
| Real Estate, Rental & Leasing | 0 (0.0%) | 3 (100.0%) |
| Professional & Scientific | 0 (0.0%) | 0 (0.0%) |
| Enterprise Management | 0 (0.0%) | 0 (0.0%) |
| Administrative & Support | 4 (100.0%) | 0 (0.0%) |
| Educational Services | 2 (28.6%) | 5 (71.4%) |
| Health Care & Social Assistance | 4 (14.8%) | 23 (85.2%) |
| Arts, Entertainment & Recreation | 1 (100.0%) | 0 (0.0%) |
| Accommodation & Food Services | 0 (0.0%) | 2 (100.0%) |
| Public Administration | 0 (0.0%) | 0 (0.0%) |
| Total | 72 (59.0%) | 50 (41.0%) |
Education in Beardsley
School Enrollment in Beardsley
The most common levels of schooling among the 75 students in Beardsley are high school (22 | 29.3%), elementary school (17 | 22.7%), and middle school (16 | 21.3%).
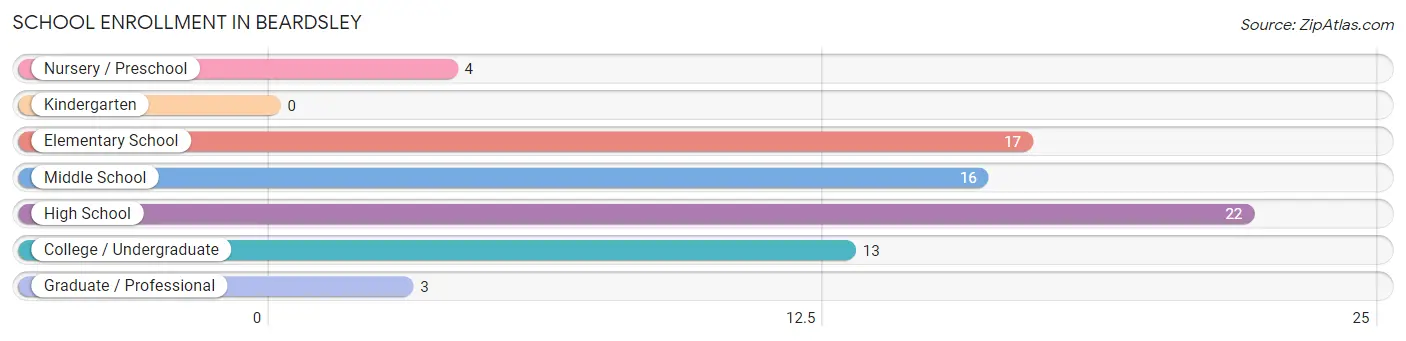
| School Level | # Students | % Students |
| Nursery / Preschool | 4 | 5.3% |
| Kindergarten | 0 | 0.0% |
| Elementary School | 17 | 22.7% |
| Middle School | 16 | 21.3% |
| High School | 22 | 29.3% |
| College / Undergraduate | 13 | 17.3% |
| Graduate / Professional | 3 | 4.0% |
| Total | 75 | 100.0% |
School Enrollment by Age by Funding Source in Beardsley
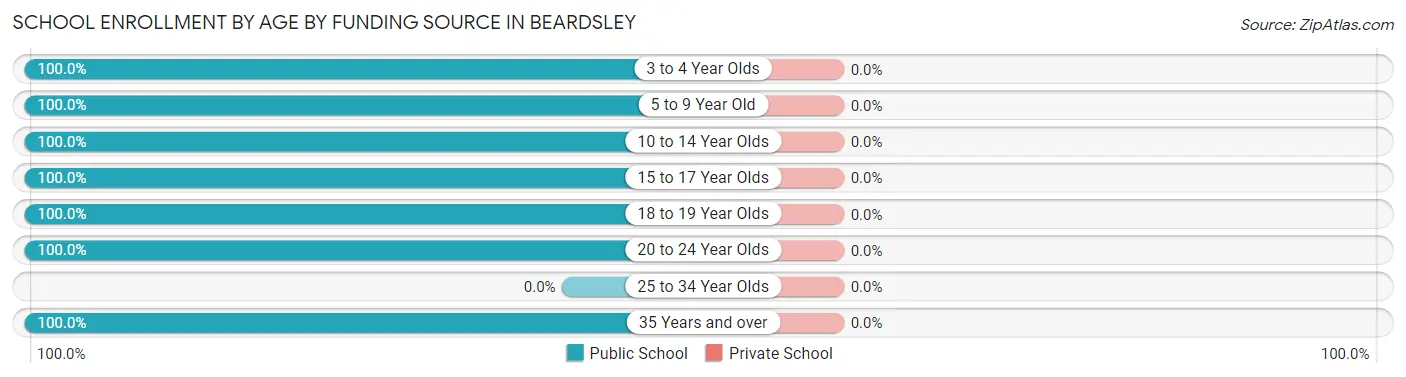
| Age Bracket | Public School | Private School |
| 3 to 4 Year Olds | 4 (100.0%) | 0 (0.0%) |
| 5 to 9 Year Old | 8 (100.0%) | 0 (0.0%) |
| 10 to 14 Year Olds | 25 (100.0%) | 0 (0.0%) |
| 15 to 17 Year Olds | 18 (100.0%) | 0 (0.0%) |
| 18 to 19 Year Olds | 7 (100.0%) | 0 (0.0%) |
| 20 to 24 Year Olds | 6 (100.0%) | 0 (0.0%) |
| 25 to 34 Year Olds | 0 (0.0%) | 0 (0.0%) |
| 35 Years and over | 7 (100.0%) | 0 (0.0%) |
| Total | 75 (100.0%) | 0 (0.0%) |
Educational Attainment by Field of Study in Beardsley
Arts & humanities (8 | 29.6%), education (7 | 25.9%), science & technology (4 | 14.8%), engineering (2 | 7.4%), and business (2 | 7.4%) are the most common fields of study among 27 individuals in Beardsley who have obtained a bachelor's degree or higher.
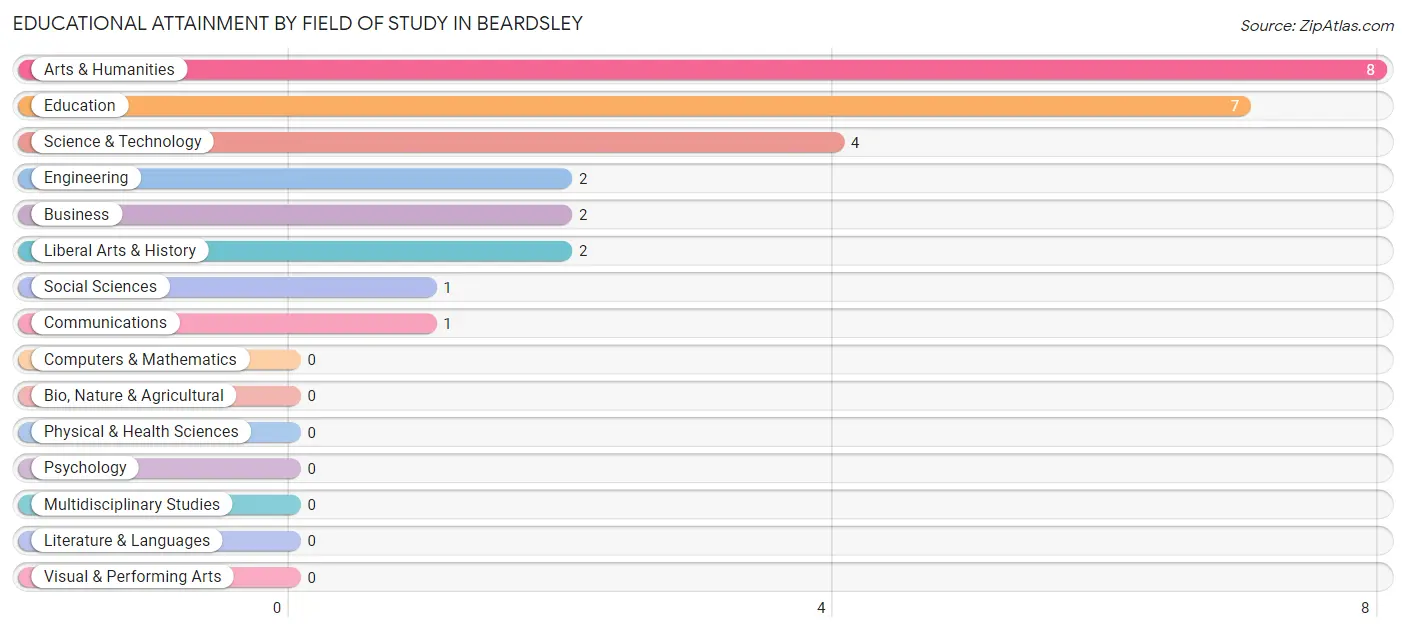
| Field of Study | # Graduates | % Graduates |
| Computers & Mathematics | 0 | 0.0% |
| Bio, Nature & Agricultural | 0 | 0.0% |
| Physical & Health Sciences | 0 | 0.0% |
| Psychology | 0 | 0.0% |
| Social Sciences | 1 | 3.7% |
| Engineering | 2 | 7.4% |
| Multidisciplinary Studies | 0 | 0.0% |
| Science & Technology | 4 | 14.8% |
| Business | 2 | 7.4% |
| Education | 7 | 25.9% |
| Literature & Languages | 0 | 0.0% |
| Liberal Arts & History | 2 | 7.4% |
| Visual & Performing Arts | 0 | 0.0% |
| Communications | 1 | 3.7% |
| Arts & Humanities | 8 | 29.6% |
| Total | 27 | 100.0% |
Transportation & Commute in Beardsley
Vehicle Availability by Sex in Beardsley
The most prevalent vehicle ownership categories in Beardsley are males with 2 vehicles (33, accounting for 45.8%) and females with 2 vehicles (23, making up 66.0%).
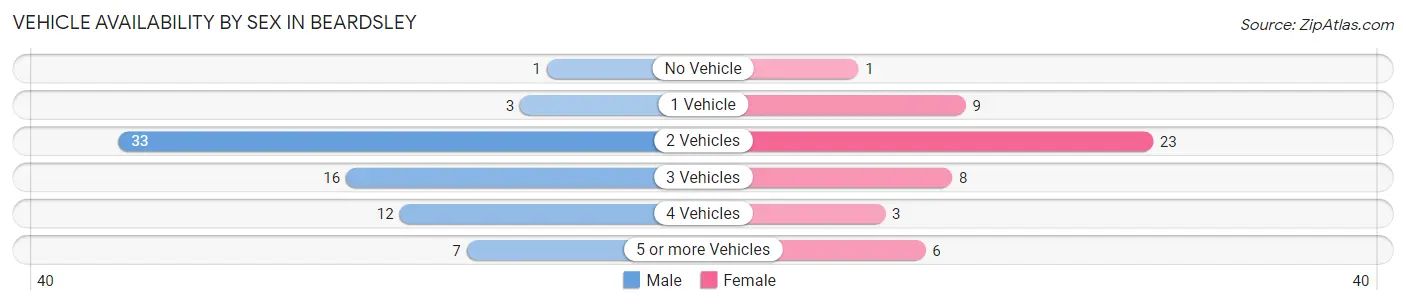
| Vehicles Available | Male | Female |
| No Vehicle | 1 (1.4%) | 1 (2.0%) |
| 1 Vehicle | 3 (4.2%) | 9 (18.0%) |
| 2 Vehicles | 33 (45.8%) | 23 (46.0%) |
| 3 Vehicles | 16 (22.2%) | 8 (16.0%) |
| 4 Vehicles | 12 (16.7%) | 3 (6.0%) |
| 5 or more Vehicles | 7 (9.7%) | 6 (12.0%) |
| Total | 72 (100.0%) | 50 (100.0%) |
Commute Time in Beardsley
The most frequently occuring commute durations in Beardsley are 10 to 14 minutes (27 commuters, 24.5%), 45 to 59 minutes (25 commuters, 22.7%), and 5 to 9 minutes (12 commuters, 10.9%).
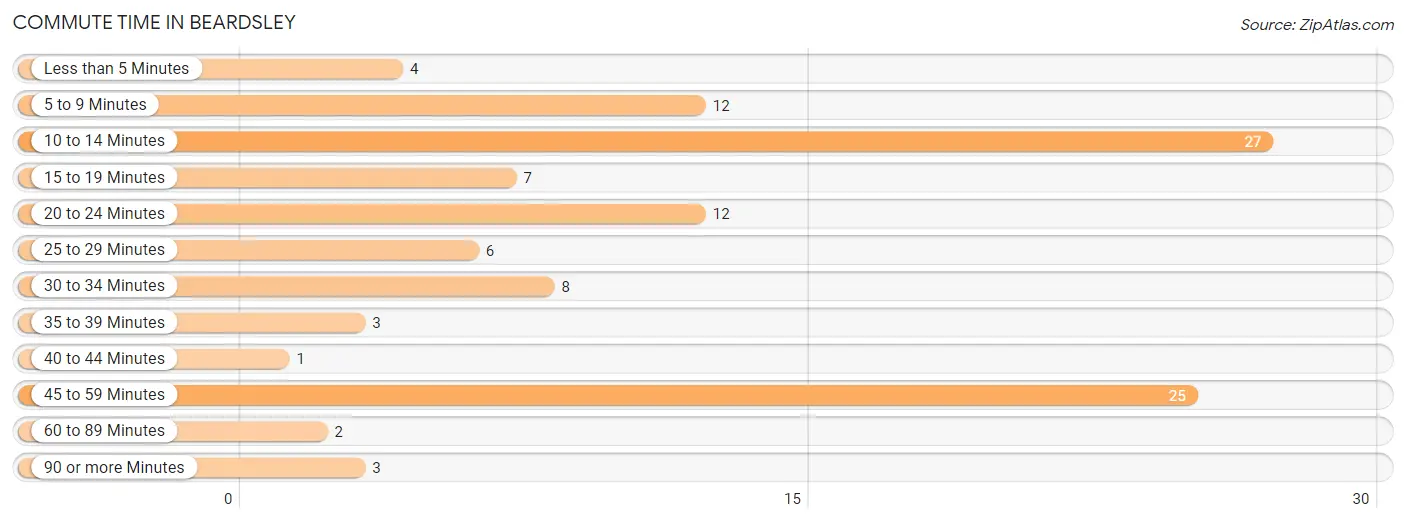
| Commute Time | # Commuters | % Commuters |
| Less than 5 Minutes | 4 | 3.6% |
| 5 to 9 Minutes | 12 | 10.9% |
| 10 to 14 Minutes | 27 | 24.5% |
| 15 to 19 Minutes | 7 | 6.4% |
| 20 to 24 Minutes | 12 | 10.9% |
| 25 to 29 Minutes | 6 | 5.4% |
| 30 to 34 Minutes | 8 | 7.3% |
| 35 to 39 Minutes | 3 | 2.7% |
| 40 to 44 Minutes | 1 | 0.9% |
| 45 to 59 Minutes | 25 | 22.7% |
| 60 to 89 Minutes | 2 | 1.8% |
| 90 or more Minutes | 3 | 2.7% |
Commute Time by Sex in Beardsley
The most common commute times in Beardsley are 10 to 14 minutes (19 commuters, 31.1%) for males and 45 to 59 minutes (10 commuters, 20.4%) for females.
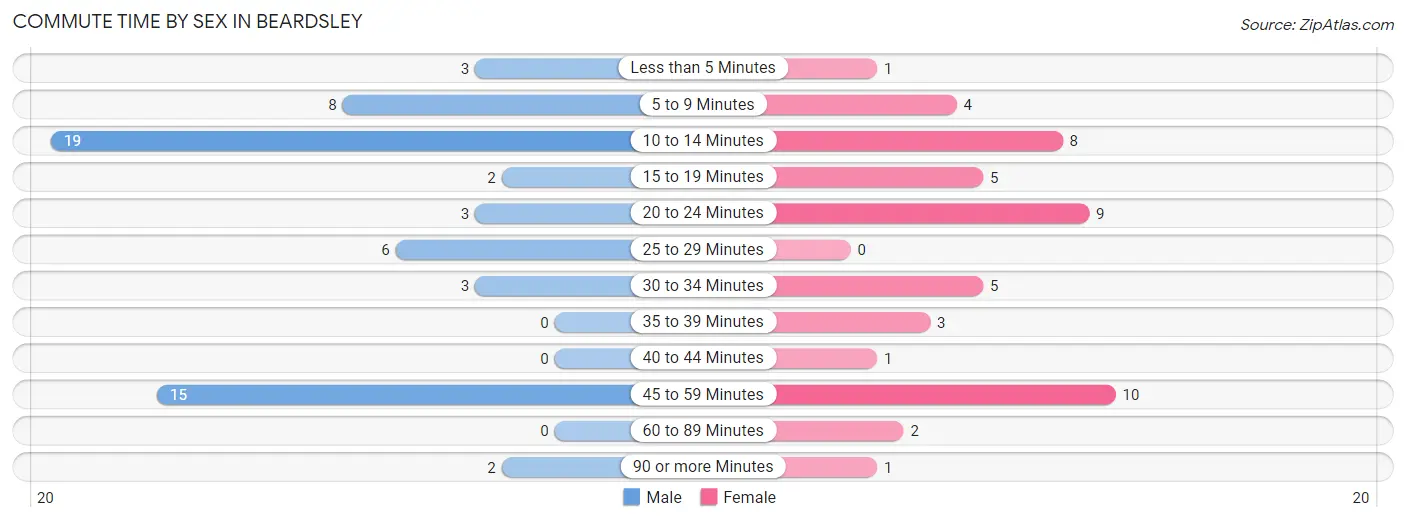
| Commute Time | Male | Female |
| Less than 5 Minutes | 3 (4.9%) | 1 (2.0%) |
| 5 to 9 Minutes | 8 (13.1%) | 4 (8.2%) |
| 10 to 14 Minutes | 19 (31.1%) | 8 (16.3%) |
| 15 to 19 Minutes | 2 (3.3%) | 5 (10.2%) |
| 20 to 24 Minutes | 3 (4.9%) | 9 (18.4%) |
| 25 to 29 Minutes | 6 (9.8%) | 0 (0.0%) |
| 30 to 34 Minutes | 3 (4.9%) | 5 (10.2%) |
| 35 to 39 Minutes | 0 (0.0%) | 3 (6.1%) |
| 40 to 44 Minutes | 0 (0.0%) | 1 (2.0%) |
| 45 to 59 Minutes | 15 (24.6%) | 10 (20.4%) |
| 60 to 89 Minutes | 0 (0.0%) | 2 (4.1%) |
| 90 or more Minutes | 2 (3.3%) | 1 (2.0%) |
Time of Departure to Work by Sex in Beardsley
The most frequent times of departure to work in Beardsley are 6:30 AM to 6:59 AM (11, 18.0%) for males and 6:00 AM to 6:29 AM (17, 34.7%) for females.
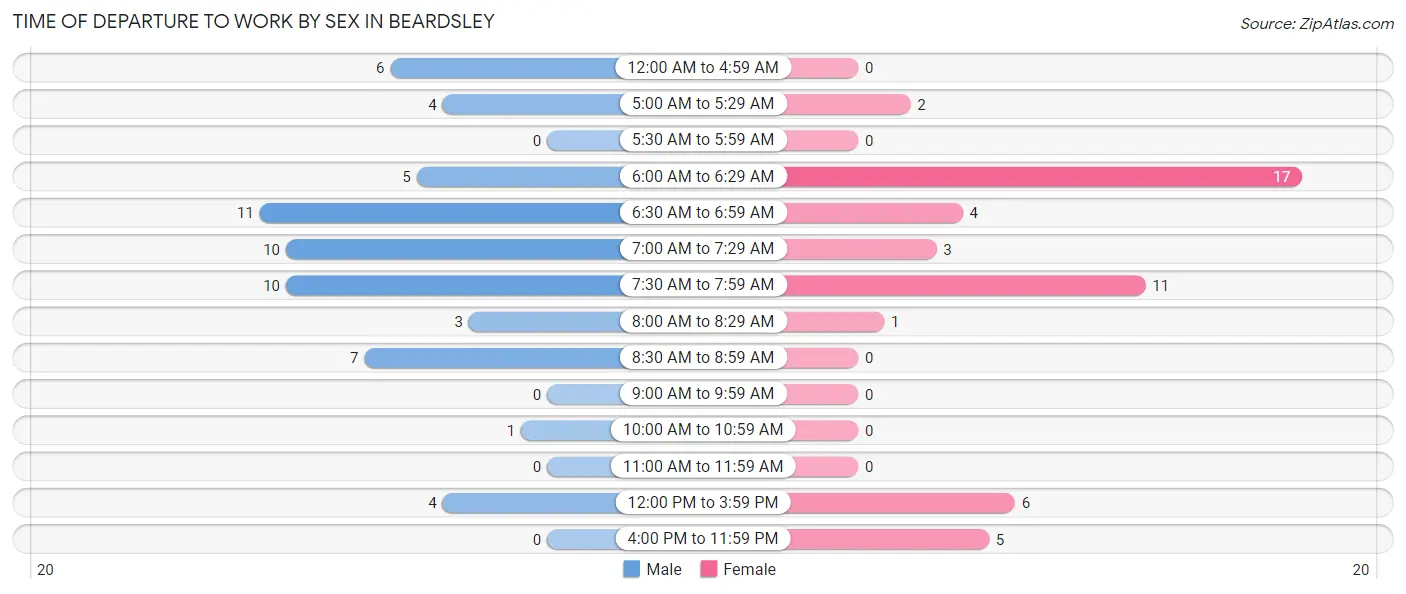
| Time of Departure | Male | Female |
| 12:00 AM to 4:59 AM | 6 (9.8%) | 0 (0.0%) |
| 5:00 AM to 5:29 AM | 4 (6.6%) | 2 (4.1%) |
| 5:30 AM to 5:59 AM | 0 (0.0%) | 0 (0.0%) |
| 6:00 AM to 6:29 AM | 5 (8.2%) | 17 (34.7%) |
| 6:30 AM to 6:59 AM | 11 (18.0%) | 4 (8.2%) |
| 7:00 AM to 7:29 AM | 10 (16.4%) | 3 (6.1%) |
| 7:30 AM to 7:59 AM | 10 (16.4%) | 11 (22.5%) |
| 8:00 AM to 8:29 AM | 3 (4.9%) | 1 (2.0%) |
| 8:30 AM to 8:59 AM | 7 (11.5%) | 0 (0.0%) |
| 9:00 AM to 9:59 AM | 0 (0.0%) | 0 (0.0%) |
| 10:00 AM to 10:59 AM | 1 (1.6%) | 0 (0.0%) |
| 11:00 AM to 11:59 AM | 0 (0.0%) | 0 (0.0%) |
| 12:00 PM to 3:59 PM | 4 (6.6%) | 6 (12.2%) |
| 4:00 PM to 11:59 PM | 0 (0.0%) | 5 (10.2%) |
| Total | 61 (100.0%) | 49 (100.0%) |
Housing Occupancy in Beardsley
Occupancy by Ownership in Beardsley
Of the total 98 dwellings in Beardsley, owner-occupied units account for 84 (85.7%), while renter-occupied units make up 14 (14.3%).
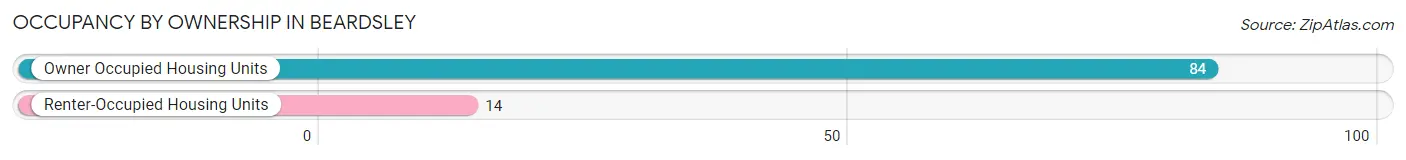
| Occupancy | # Housing Units | % Housing Units |
| Owner Occupied Housing Units | 84 | 85.7% |
| Renter-Occupied Housing Units | 14 | 14.3% |
| Total Occupied Housing Units | 98 | 100.0% |
Occupancy by Household Size in Beardsley
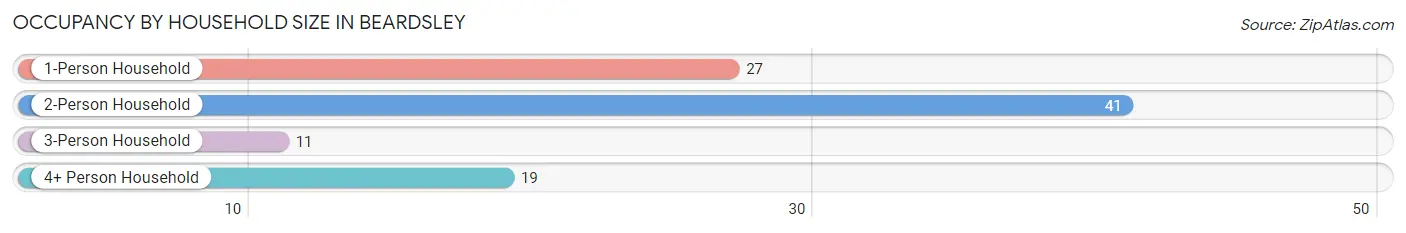
| Household Size | # Housing Units | % Housing Units |
| 1-Person Household | 27 | 27.6% |
| 2-Person Household | 41 | 41.8% |
| 3-Person Household | 11 | 11.2% |
| 4+ Person Household | 19 | 19.4% |
| Total Housing Units | 98 | 100.0% |
Occupancy by Ownership by Household Size in Beardsley
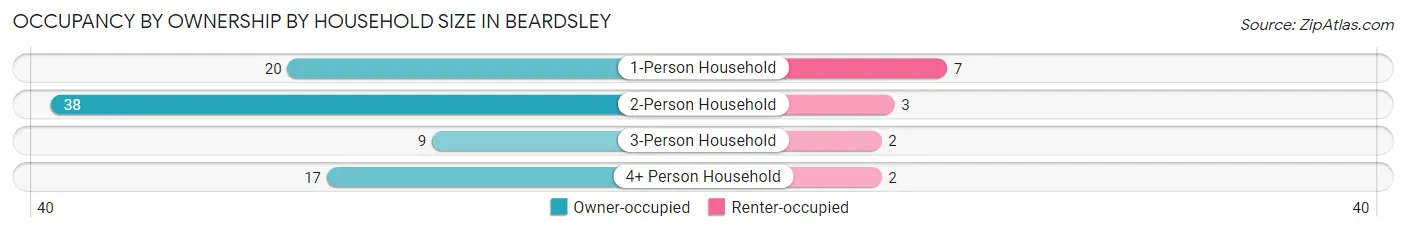
| Household Size | Owner-occupied | Renter-occupied |
| 1-Person Household | 20 (74.1%) | 7 (25.9%) |
| 2-Person Household | 38 (92.7%) | 3 (7.3%) |
| 3-Person Household | 9 (81.8%) | 2 (18.2%) |
| 4+ Person Household | 17 (89.5%) | 2 (10.5%) |
| Total Housing Units | 84 (85.7%) | 14 (14.3%) |
Occupancy by Educational Attainment in Beardsley
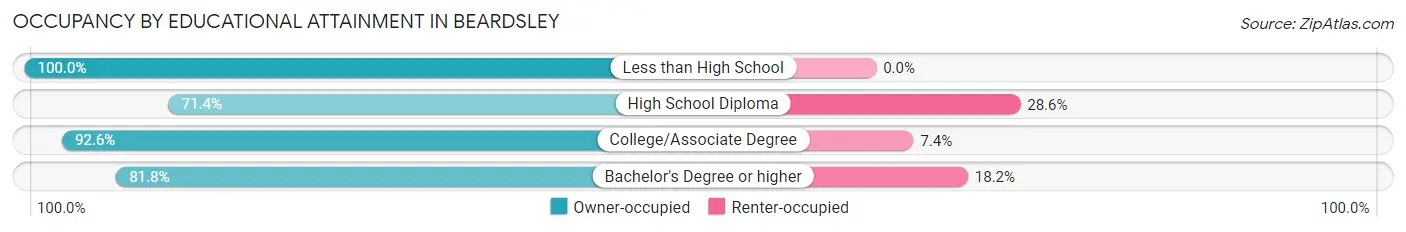
| Household Size | Owner-occupied | Renter-occupied |
| Less than High School | 5 (100.0%) | 0 (0.0%) |
| High School Diploma | 20 (71.4%) | 8 (28.6%) |
| College/Associate Degree | 50 (92.6%) | 4 (7.4%) |
| Bachelor's Degree or higher | 9 (81.8%) | 2 (18.2%) |
Occupancy by Age of Householder in Beardsley
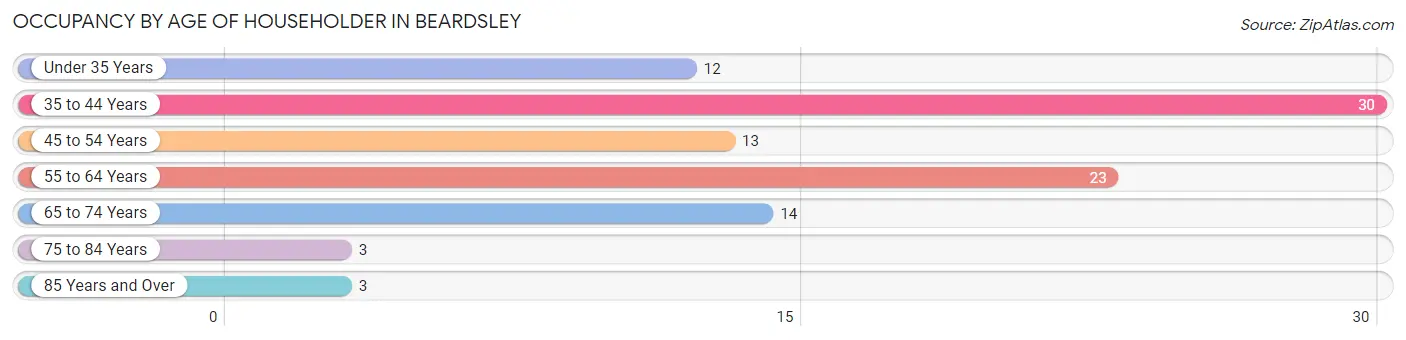
| Age Bracket | # Households | % Households |
| Under 35 Years | 12 | 12.2% |
| 35 to 44 Years | 30 | 30.6% |
| 45 to 54 Years | 13 | 13.3% |
| 55 to 64 Years | 23 | 23.5% |
| 65 to 74 Years | 14 | 14.3% |
| 75 to 84 Years | 3 | 3.1% |
| 85 Years and Over | 3 | 3.1% |
| Total | 98 | 100.0% |
Housing Finances in Beardsley
Median Income by Occupancy in Beardsley
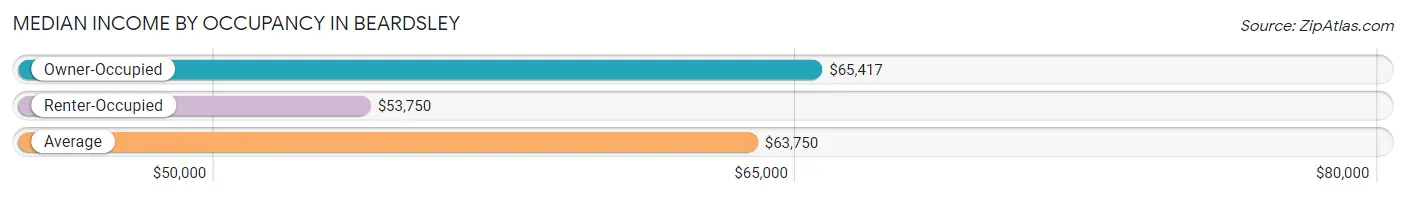
| Occupancy Type | # Households | Median Income |
| Owner-Occupied | 84 (85.7%) | $65,417 |
| Renter-Occupied | 14 (14.3%) | $53,750 |
| Average | 98 (100.0%) | $63,750 |
Occupancy by Householder Income Bracket in Beardsley
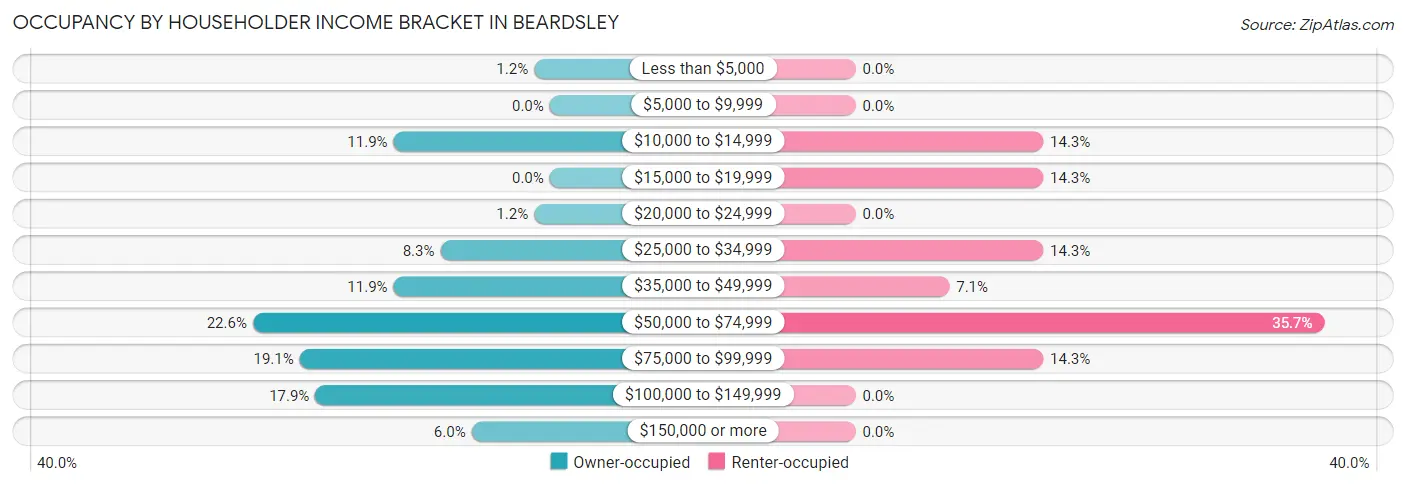
| Income Bracket | Owner-occupied | Renter-occupied |
| Less than $5,000 | 1 (1.2%) | 0 (0.0%) |
| $5,000 to $9,999 | 0 (0.0%) | 0 (0.0%) |
| $10,000 to $14,999 | 10 (11.9%) | 2 (14.3%) |
| $15,000 to $19,999 | 0 (0.0%) | 2 (14.3%) |
| $20,000 to $24,999 | 1 (1.2%) | 0 (0.0%) |
| $25,000 to $34,999 | 7 (8.3%) | 2 (14.3%) |
| $35,000 to $49,999 | 10 (11.9%) | 1 (7.1%) |
| $50,000 to $74,999 | 19 (22.6%) | 5 (35.7%) |
| $75,000 to $99,999 | 16 (19.1%) | 2 (14.3%) |
| $100,000 to $149,999 | 15 (17.9%) | 0 (0.0%) |
| $150,000 or more | 5 (5.9%) | 0 (0.0%) |
| Total | 84 (100.0%) | 14 (100.0%) |
Monthly Housing Cost Tiers in Beardsley
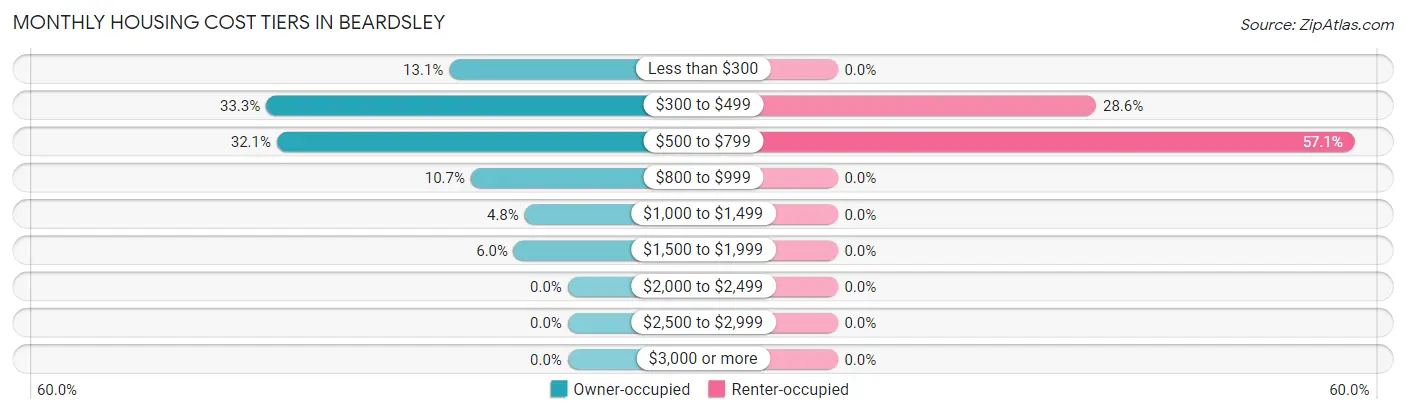
| Monthly Cost | Owner-occupied | Renter-occupied |
| Less than $300 | 11 (13.1%) | 0 (0.0%) |
| $300 to $499 | 28 (33.3%) | 4 (28.6%) |
| $500 to $799 | 27 (32.1%) | 8 (57.1%) |
| $800 to $999 | 9 (10.7%) | 0 (0.0%) |
| $1,000 to $1,499 | 4 (4.8%) | 0 (0.0%) |
| $1,500 to $1,999 | 5 (5.9%) | 0 (0.0%) |
| $2,000 to $2,499 | 0 (0.0%) | 0 (0.0%) |
| $2,500 to $2,999 | 0 (0.0%) | 0 (0.0%) |
| $3,000 or more | 0 (0.0%) | 0 (0.0%) |
| Total | 84 (100.0%) | 14 (100.0%) |
Physical Housing Characteristics in Beardsley
Housing Structures in Beardsley
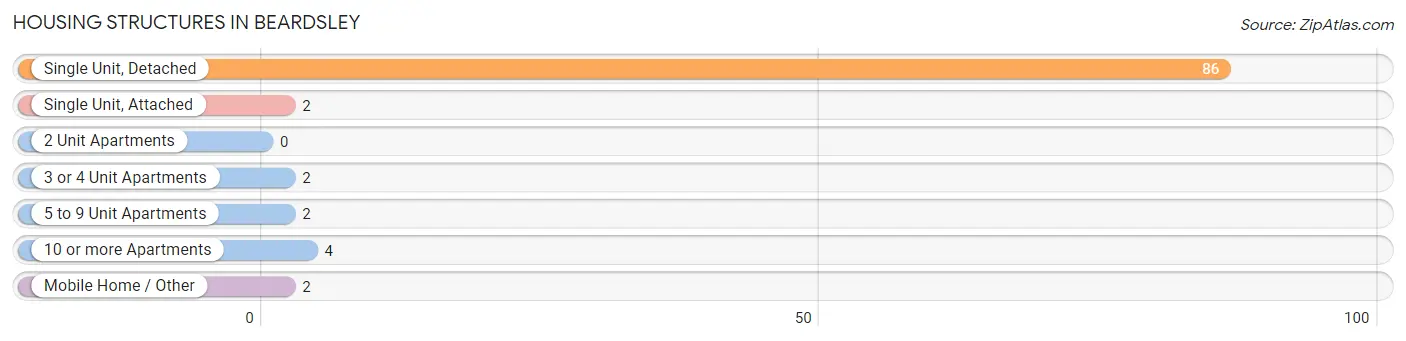
| Structure Type | # Housing Units | % Housing Units |
| Single Unit, Detached | 86 | 87.8% |
| Single Unit, Attached | 2 | 2.0% |
| 2 Unit Apartments | 0 | 0.0% |
| 3 or 4 Unit Apartments | 2 | 2.0% |
| 5 to 9 Unit Apartments | 2 | 2.0% |
| 10 or more Apartments | 4 | 4.1% |
| Mobile Home / Other | 2 | 2.0% |
| Total | 98 | 100.0% |
Housing Structures by Occupancy in Beardsley

| Structure Type | Owner-occupied | Renter-occupied |
| Single Unit, Detached | 80 (93.0%) | 6 (7.0%) |
| Single Unit, Attached | 2 (100.0%) | 0 (0.0%) |
| 2 Unit Apartments | 0 (0.0%) | 0 (0.0%) |
| 3 or 4 Unit Apartments | 0 (0.0%) | 2 (100.0%) |
| 5 to 9 Unit Apartments | 0 (0.0%) | 2 (100.0%) |
| 10 or more Apartments | 0 (0.0%) | 4 (100.0%) |
| Mobile Home / Other | 2 (100.0%) | 0 (0.0%) |
| Total | 84 (85.7%) | 14 (14.3%) |
Housing Structures by Number of Rooms in Beardsley
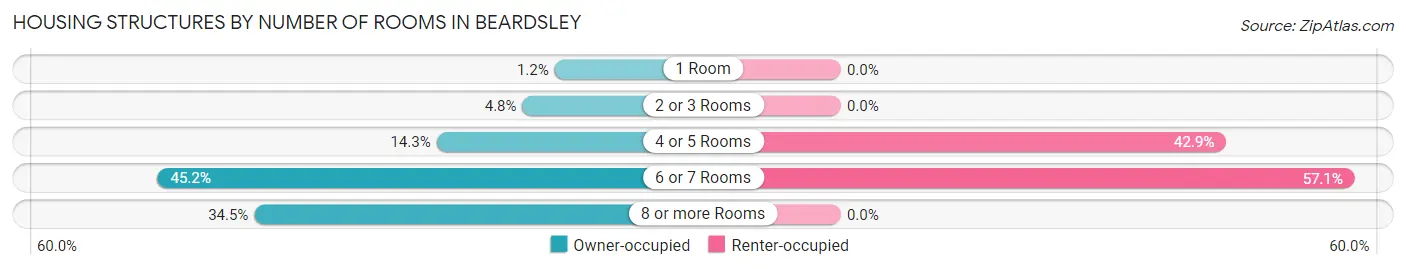
| Number of Rooms | Owner-occupied | Renter-occupied |
| 1 Room | 1 (1.2%) | 0 (0.0%) |
| 2 or 3 Rooms | 4 (4.8%) | 0 (0.0%) |
| 4 or 5 Rooms | 12 (14.3%) | 6 (42.9%) |
| 6 or 7 Rooms | 38 (45.2%) | 8 (57.1%) |
| 8 or more Rooms | 29 (34.5%) | 0 (0.0%) |
| Total | 84 (100.0%) | 14 (100.0%) |
Housing Structure by Heating Type in Beardsley
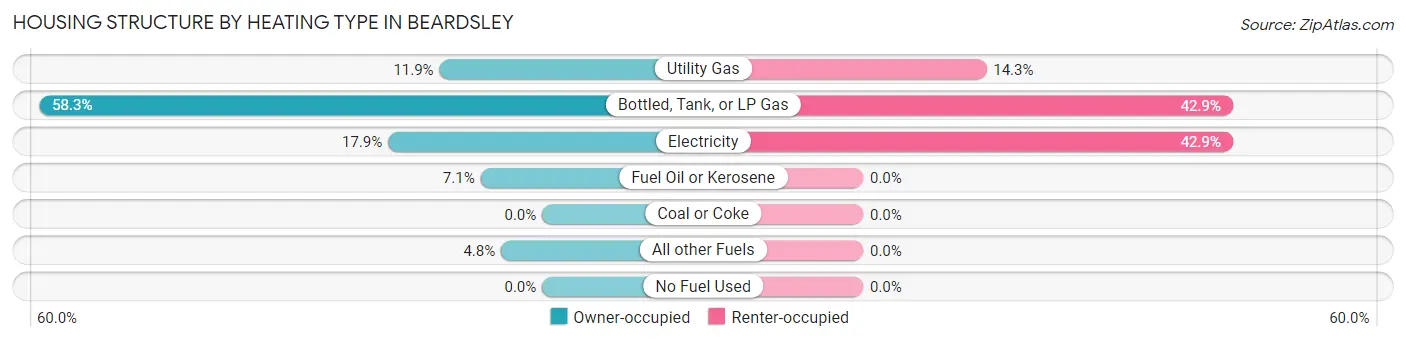
| Heating Type | Owner-occupied | Renter-occupied |
| Utility Gas | 10 (11.9%) | 2 (14.3%) |
| Bottled, Tank, or LP Gas | 49 (58.3%) | 6 (42.9%) |
| Electricity | 15 (17.9%) | 6 (42.9%) |
| Fuel Oil or Kerosene | 6 (7.1%) | 0 (0.0%) |
| Coal or Coke | 0 (0.0%) | 0 (0.0%) |
| All other Fuels | 4 (4.8%) | 0 (0.0%) |
| No Fuel Used | 0 (0.0%) | 0 (0.0%) |
| Total | 84 (100.0%) | 14 (100.0%) |
Household Vehicle Usage in Beardsley
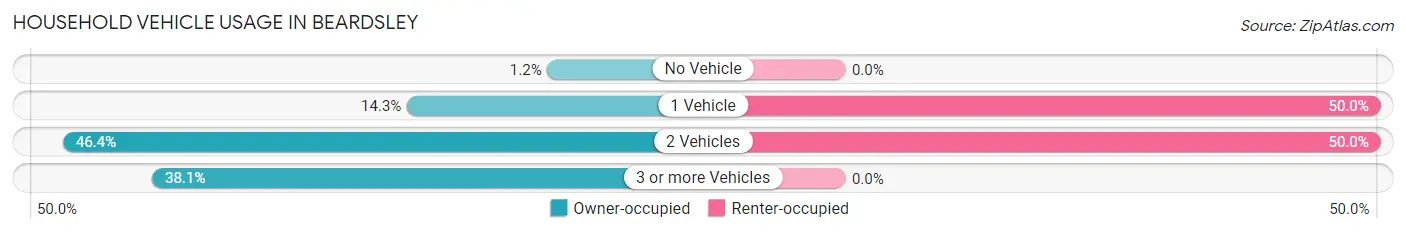
| Vehicles per Household | Owner-occupied | Renter-occupied |
| No Vehicle | 1 (1.2%) | 0 (0.0%) |
| 1 Vehicle | 12 (14.3%) | 7 (50.0%) |
| 2 Vehicles | 39 (46.4%) | 7 (50.0%) |
| 3 or more Vehicles | 32 (38.1%) | 0 (0.0%) |
| Total | 84 (100.0%) | 14 (100.0%) |
Real Estate & Mortgages in Beardsley
Real Estate and Mortgage Overview in Beardsley
| Characteristic | Without Mortgage | With Mortgage |
| Housing Units | 61 | 23 |
| Median Property Value | $37,500 | $89,500 |
| Median Household Income | $55,625 | $5 |
| Monthly Housing Costs | $423 | $0 |
| Real Estate Taxes | $270 | $0 |
Property Value by Mortgage Status in Beardsley
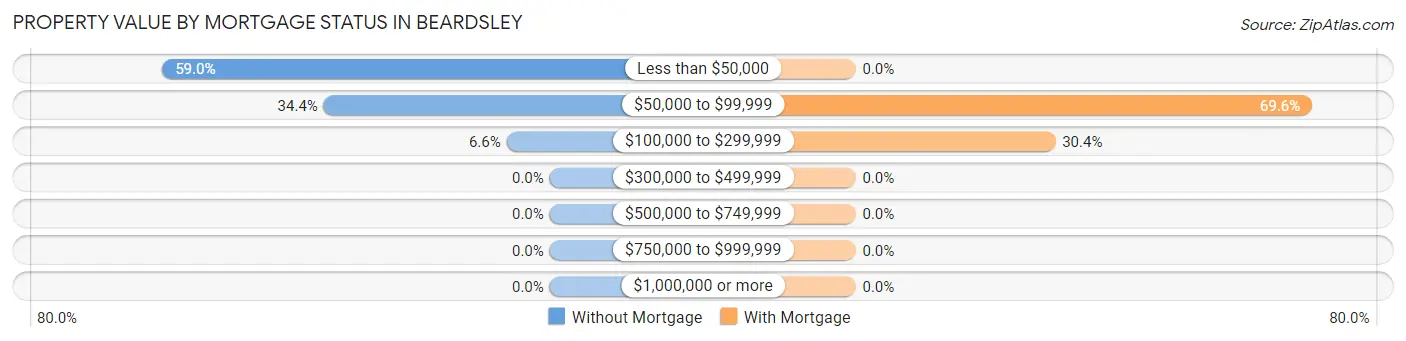
| Property Value | Without Mortgage | With Mortgage |
| Less than $50,000 | 36 (59.0%) | 0 (0.0%) |
| $50,000 to $99,999 | 21 (34.4%) | 16 (69.6%) |
| $100,000 to $299,999 | 4 (6.6%) | 7 (30.4%) |
| $300,000 to $499,999 | 0 (0.0%) | 0 (0.0%) |
| $500,000 to $749,999 | 0 (0.0%) | 0 (0.0%) |
| $750,000 to $999,999 | 0 (0.0%) | 0 (0.0%) |
| $1,000,000 or more | 0 (0.0%) | 0 (0.0%) |
| Total | 61 (100.0%) | 23 (100.0%) |
Household Income by Mortgage Status in Beardsley
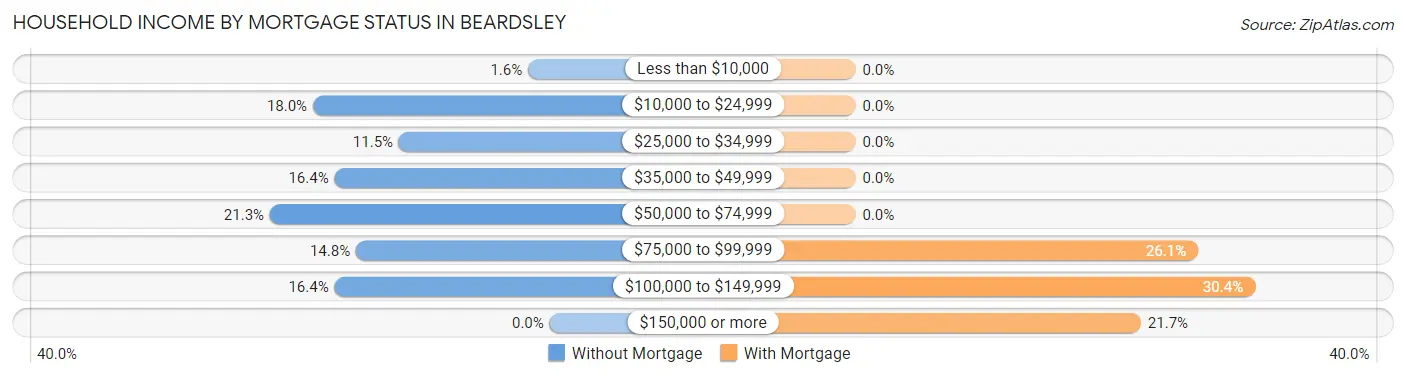
| Household Income | Without Mortgage | With Mortgage |
| Less than $10,000 | 1 (1.6%) | 0 (0.0%) |
| $10,000 to $24,999 | 11 (18.0%) | 0 (0.0%) |
| $25,000 to $34,999 | 7 (11.5%) | 0 (0.0%) |
| $35,000 to $49,999 | 10 (16.4%) | 0 (0.0%) |
| $50,000 to $74,999 | 13 (21.3%) | 0 (0.0%) |
| $75,000 to $99,999 | 9 (14.7%) | 6 (26.1%) |
| $100,000 to $149,999 | 10 (16.4%) | 7 (30.4%) |
| $150,000 or more | 0 (0.0%) | 5 (21.7%) |
| Total | 61 (100.0%) | 23 (100.0%) |
Property Value to Household Income Ratio in Beardsley
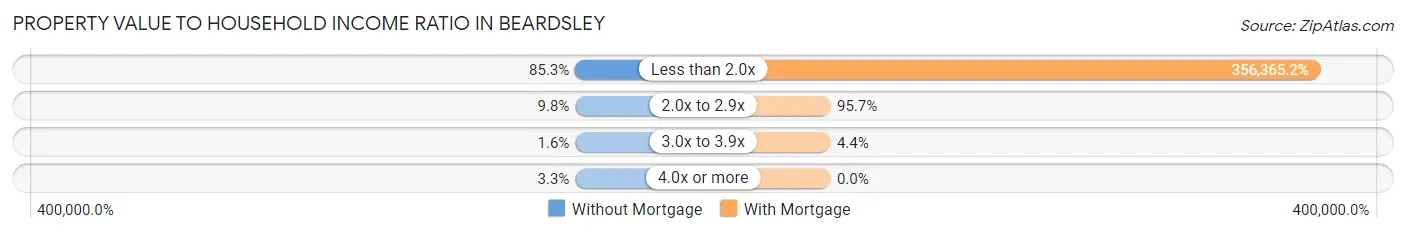
| Value-to-Income Ratio | Without Mortgage | With Mortgage |
| Less than 2.0x | 52 (85.3%) | 81,964 (356,365.2%) |
| 2.0x to 2.9x | 6 (9.8%) | 22 (95.7%) |
| 3.0x to 3.9x | 1 (1.6%) | 1 (4.3%) |
| 4.0x or more | 2 (3.3%) | 0 (0.0%) |
| Total | 61 (100.0%) | 23 (100.0%) |
Real Estate Taxes by Mortgage Status in Beardsley
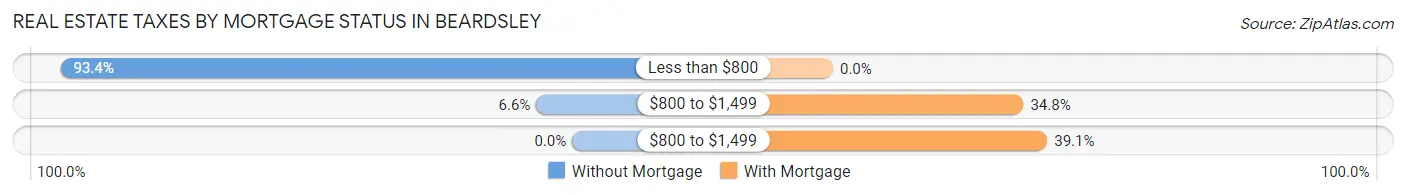
| Property Taxes | Without Mortgage | With Mortgage |
| Less than $800 | 57 (93.4%) | 0 (0.0%) |
| $800 to $1,499 | 4 (6.6%) | 8 (34.8%) |
| $800 to $1,499 | 0 (0.0%) | 9 (39.1%) |
| Total | 61 (100.0%) | 23 (100.0%) |
Health & Disability in Beardsley
Health Insurance Coverage by Age in Beardsley
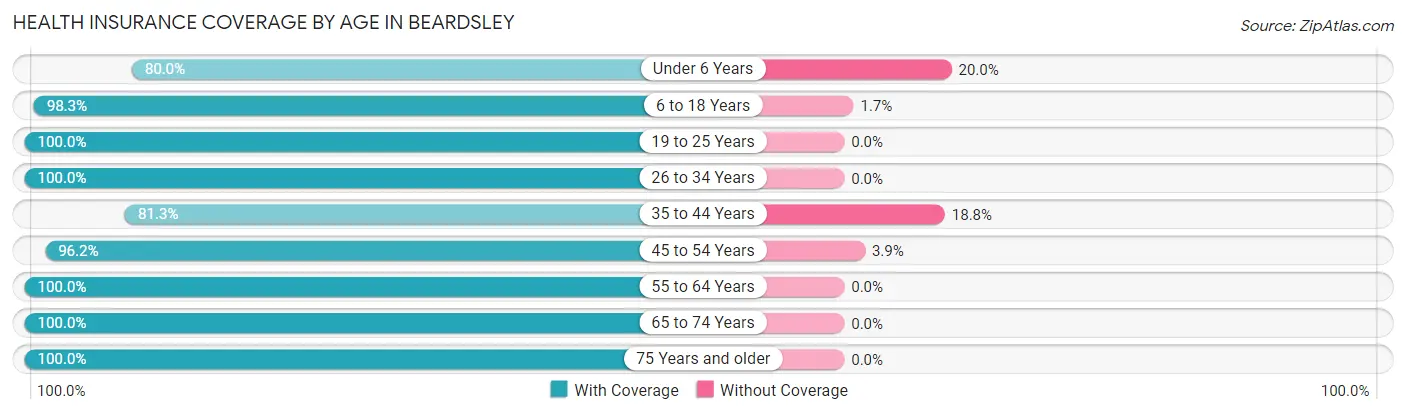
| Age Bracket | With Coverage | Without Coverage |
| Under 6 Years | 12 (80.0%) | 3 (20.0%) |
| 6 to 18 Years | 57 (98.3%) | 1 (1.7%) |
| 19 to 25 Years | 15 (100.0%) | 0 (0.0%) |
| 26 to 34 Years | 14 (100.0%) | 0 (0.0%) |
| 35 to 44 Years | 39 (81.2%) | 9 (18.8%) |
| 45 to 54 Years | 25 (96.2%) | 1 (3.8%) |
| 55 to 64 Years | 25 (100.0%) | 0 (0.0%) |
| 65 to 74 Years | 26 (100.0%) | 0 (0.0%) |
| 75 Years and older | 14 (100.0%) | 0 (0.0%) |
| Total | 227 (94.2%) | 14 (5.8%) |
Health Insurance Coverage by Citizenship Status in Beardsley
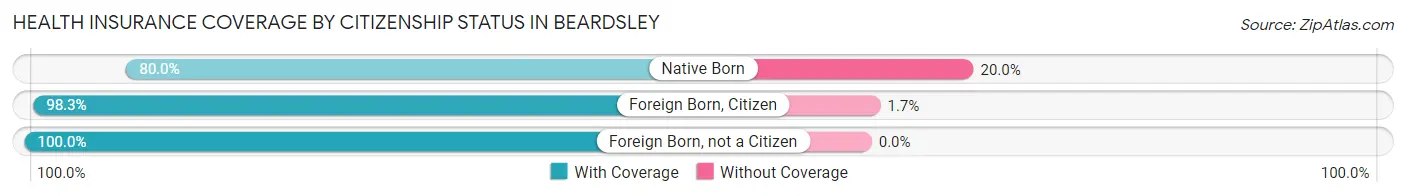
| Citizenship Status | With Coverage | Without Coverage |
| Native Born | 12 (80.0%) | 3 (20.0%) |
| Foreign Born, Citizen | 57 (98.3%) | 1 (1.7%) |
| Foreign Born, not a Citizen | 15 (100.0%) | 0 (0.0%) |
Health Insurance Coverage by Household Income in Beardsley
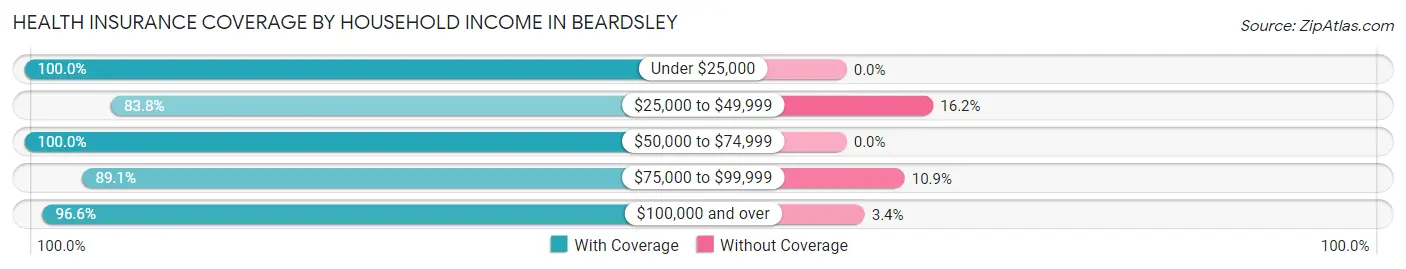
| Household Income | With Coverage | Without Coverage |
| Under $25,000 | 21 (100.0%) | 0 (0.0%) |
| $25,000 to $49,999 | 31 (83.8%) | 6 (16.2%) |
| $50,000 to $74,999 | 48 (100.0%) | 0 (0.0%) |
| $75,000 to $99,999 | 41 (89.1%) | 5 (10.9%) |
| $100,000 and over | 86 (96.6%) | 3 (3.4%) |
Public vs Private Health Insurance Coverage by Age in Beardsley
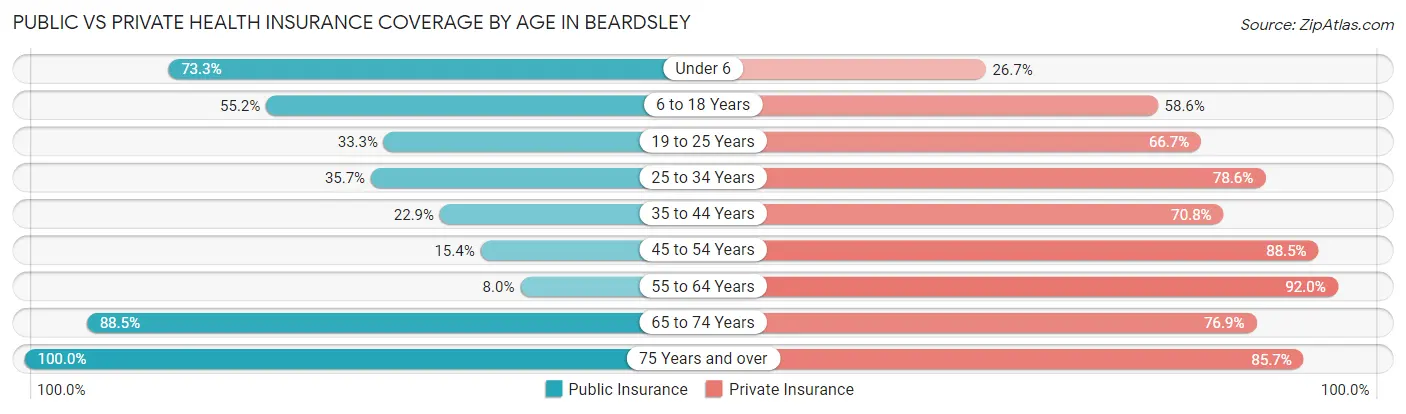
| Age Bracket | Public Insurance | Private Insurance |
| Under 6 | 11 (73.3%) | 4 (26.7%) |
| 6 to 18 Years | 32 (55.2%) | 34 (58.6%) |
| 19 to 25 Years | 5 (33.3%) | 10 (66.7%) |
| 25 to 34 Years | 5 (35.7%) | 11 (78.6%) |
| 35 to 44 Years | 11 (22.9%) | 34 (70.8%) |
| 45 to 54 Years | 4 (15.4%) | 23 (88.5%) |
| 55 to 64 Years | 2 (8.0%) | 23 (92.0%) |
| 65 to 74 Years | 23 (88.5%) | 20 (76.9%) |
| 75 Years and over | 14 (100.0%) | 12 (85.7%) |
| Total | 107 (44.4%) | 171 (71.0%) |
Disability Status by Sex by Age in Beardsley
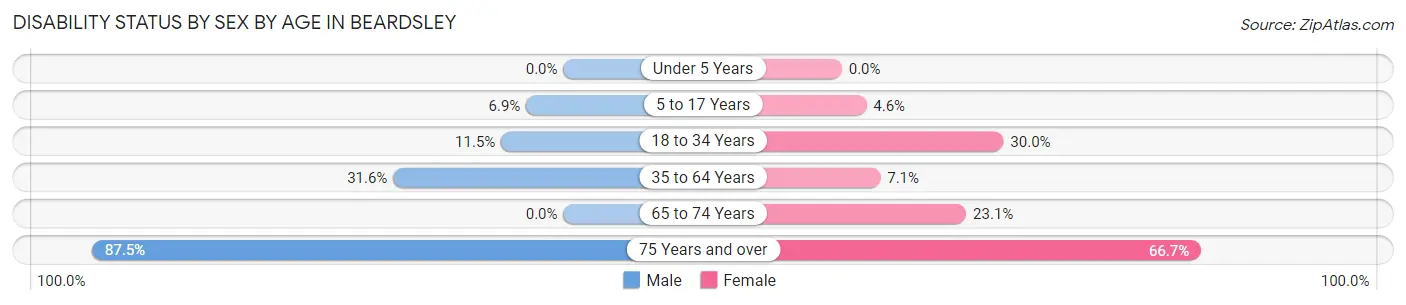
| Age Bracket | Male | Female |
| Under 5 Years | 0 (0.0%) | 0 (0.0%) |
| 5 to 17 Years | 2 (6.9%) | 1 (4.5%) |
| 18 to 34 Years | 3 (11.5%) | 3 (30.0%) |
| 35 to 64 Years | 18 (31.6%) | 3 (7.1%) |
| 65 to 74 Years | 0 (0.0%) | 3 (23.1%) |
| 75 Years and over | 7 (87.5%) | 4 (66.7%) |
Disability Class by Sex by Age in Beardsley
Disability Class: Hearing Difficulty
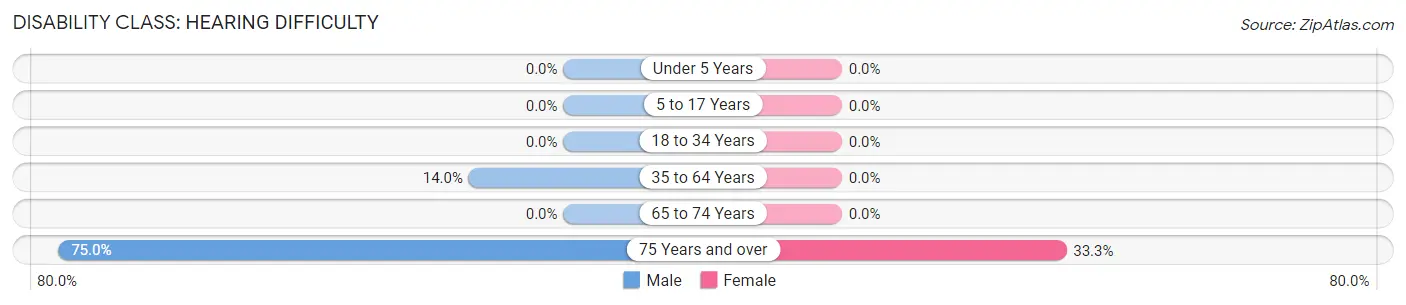
| Age Bracket | Male | Female |
| Under 5 Years | 0 (0.0%) | 0 (0.0%) |
| 5 to 17 Years | 0 (0.0%) | 0 (0.0%) |
| 18 to 34 Years | 0 (0.0%) | 0 (0.0%) |
| 35 to 64 Years | 8 (14.0%) | 0 (0.0%) |
| 65 to 74 Years | 0 (0.0%) | 0 (0.0%) |
| 75 Years and over | 6 (75.0%) | 2 (33.3%) |
Disability Class: Vision Difficulty
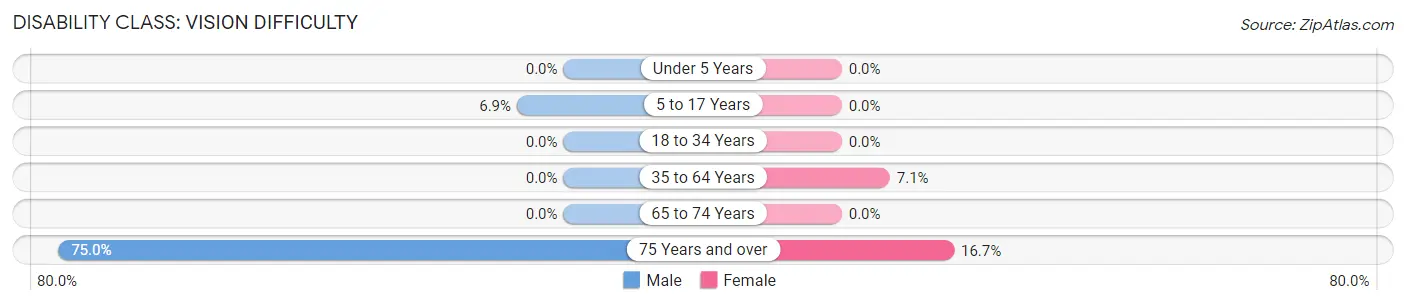
| Age Bracket | Male | Female |
| Under 5 Years | 0 (0.0%) | 0 (0.0%) |
| 5 to 17 Years | 2 (6.9%) | 0 (0.0%) |
| 18 to 34 Years | 0 (0.0%) | 0 (0.0%) |
| 35 to 64 Years | 0 (0.0%) | 3 (7.1%) |
| 65 to 74 Years | 0 (0.0%) | 0 (0.0%) |
| 75 Years and over | 6 (75.0%) | 1 (16.7%) |
Disability Class: Cognitive Difficulty
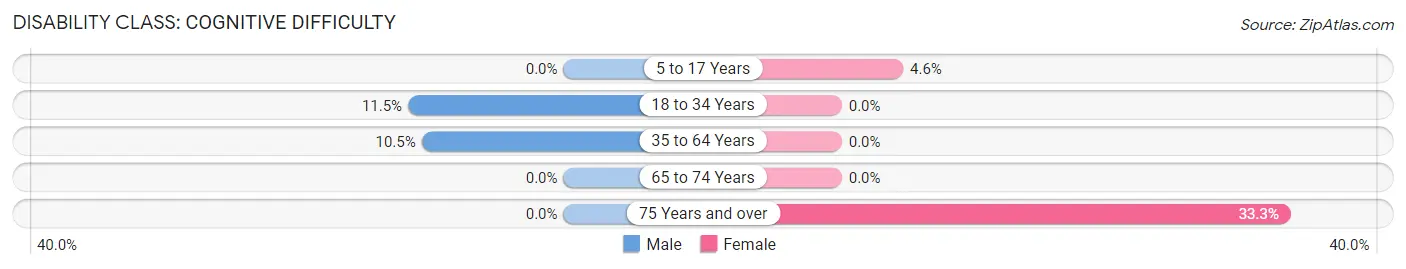
| Age Bracket | Male | Female |
| 5 to 17 Years | 0 (0.0%) | 1 (4.5%) |
| 18 to 34 Years | 3 (11.5%) | 0 (0.0%) |
| 35 to 64 Years | 6 (10.5%) | 0 (0.0%) |
| 65 to 74 Years | 0 (0.0%) | 0 (0.0%) |
| 75 Years and over | 0 (0.0%) | 2 (33.3%) |
Disability Class: Ambulatory Difficulty
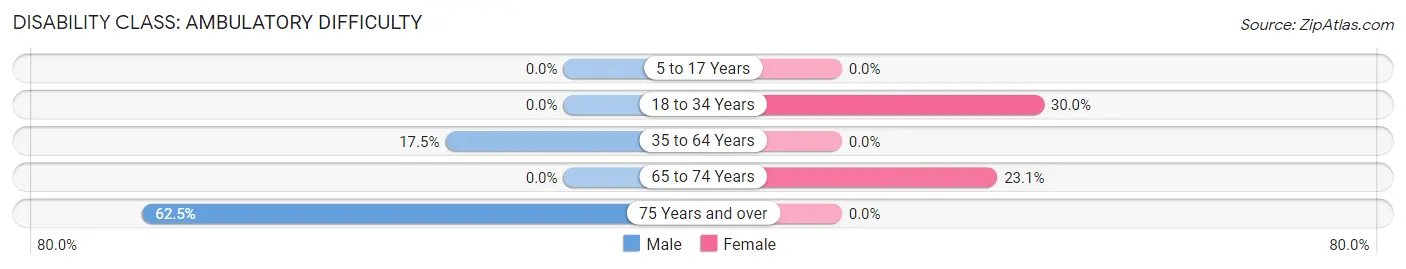
| Age Bracket | Male | Female |
| 5 to 17 Years | 0 (0.0%) | 0 (0.0%) |
| 18 to 34 Years | 0 (0.0%) | 3 (30.0%) |
| 35 to 64 Years | 10 (17.5%) | 0 (0.0%) |
| 65 to 74 Years | 0 (0.0%) | 3 (23.1%) |
| 75 Years and over | 5 (62.5%) | 0 (0.0%) |
Disability Class: Self-Care Difficulty
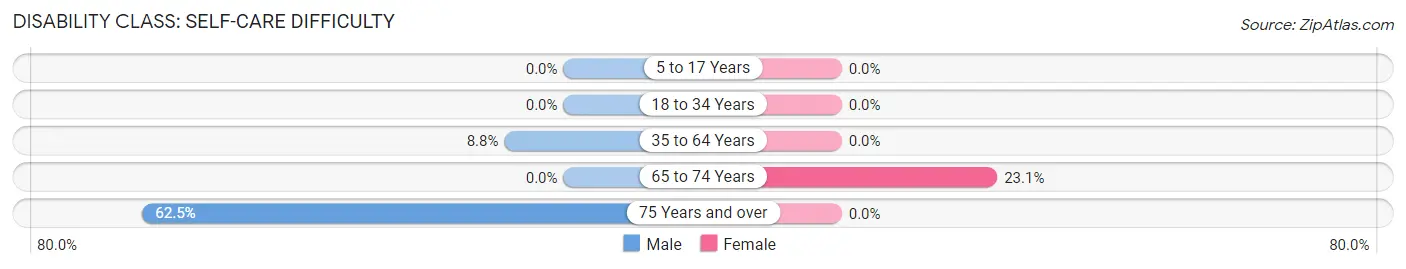
| Age Bracket | Male | Female |
| 5 to 17 Years | 0 (0.0%) | 0 (0.0%) |
| 18 to 34 Years | 0 (0.0%) | 0 (0.0%) |
| 35 to 64 Years | 5 (8.8%) | 0 (0.0%) |
| 65 to 74 Years | 0 (0.0%) | 3 (23.1%) |
| 75 Years and over | 5 (62.5%) | 0 (0.0%) |
Technology Access in Beardsley
Computing Device Access in Beardsley
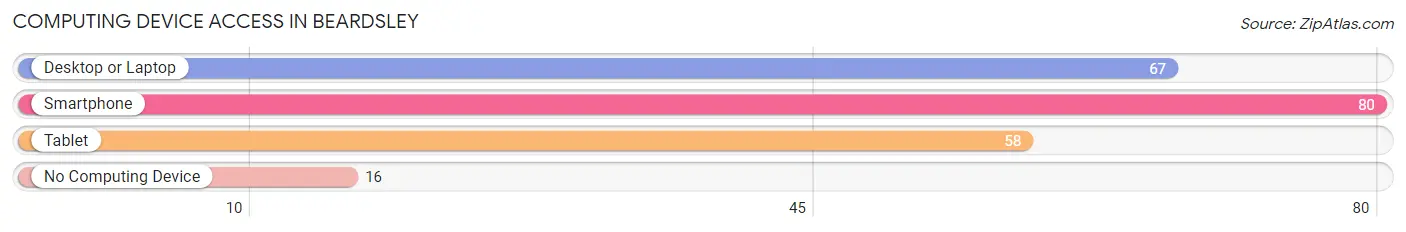
| Device Type | # Households | % Households |
| Desktop or Laptop | 67 | 68.4% |
| Smartphone | 80 | 81.6% |
| Tablet | 58 | 59.2% |
| No Computing Device | 16 | 16.3% |
| Total | 98 | 100.0% |
Internet Access in Beardsley
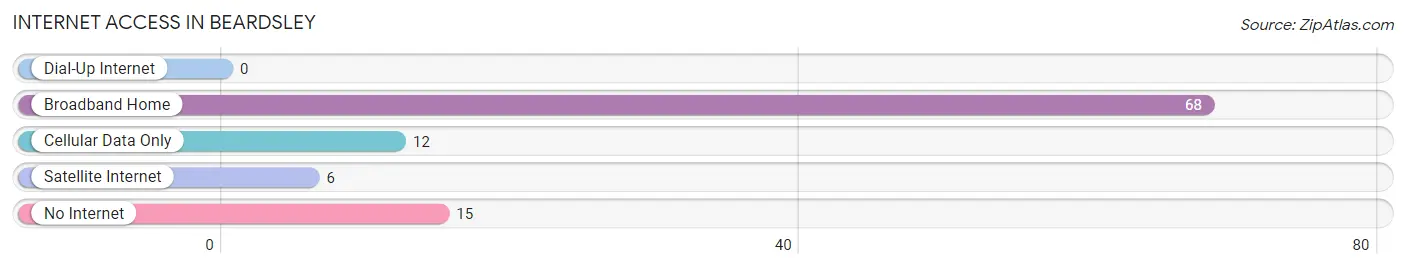
| Internet Type | # Households | % Households |
| Dial-Up Internet | 0 | 0.0% |
| Broadband Home | 68 | 69.4% |
| Cellular Data Only | 12 | 12.2% |
| Satellite Internet | 6 | 6.1% |
| No Internet | 15 | 15.3% |
| Total | 98 | 100.0% |
Beardsley Summary
Beardsley, Minnesota is a small city located in Big Stone County in the western part of the state. It is situated on the banks of the Minnesota River, about 25 miles east of the South Dakota border. The city has a population of just over 1,000 people, and is the county seat of Big Stone County.
Beardsley was founded in 1872 by a group of settlers from Wisconsin. The city was named after the first settler, William Beardsley, who was a prominent businessman in the area. The city was incorporated in 1887 and has remained a small, rural community ever since.
Geographically, Beardsley is located in the western part of Minnesota, in the Minnesota River Valley. The city is surrounded by rolling hills and prairies, and is situated on the banks of the Minnesota River. The city is located about 25 miles east of the South Dakota border, and is about an hour and a half drive from Minneapolis.
The economy of Beardsley is largely based on agriculture. The city is home to several large farms, and the surrounding area is known for its production of corn, soybeans, and other crops. The city also has a few small businesses, including a grocery store, a hardware store, and a few restaurants.
Demographically, Beardsley is a predominantly white city, with a population that is 97.3% white. The median household income is $41,000, and the median age is 44. The city has a low unemployment rate of 3.2%, and the poverty rate is 8.3%.
Beardsley is a small, rural community that has remained largely unchanged for the past century. The city is known for its friendly atmosphere and its strong sense of community. The city is home to several parks and recreational areas, and is a popular destination for outdoor activities such as fishing, hunting, and camping. The city also hosts several annual events, including the Beardsley Days Festival and the Big Stone County Fair.
Beardsley is a small city with a rich history and a strong sense of community. The city is home to a diverse population, and is a great place to live and work. The city is surrounded by beautiful scenery and offers a variety of outdoor activities. Beardsley is a great place to call home.
Common Questions
What is Per Capita Income in Beardsley?
Per Capita income in Beardsley is $30,197.
What is the Median Family Income in Beardsley?
Median Family Income in Beardsley is $80,469.
What is the Median Household income in Beardsley?
Median Household Income in Beardsley is $63,750.
What is Income or Wage Gap in Beardsley?
Income or Wage Gap in Beardsley is 17.3%.
Women in Beardsley earn 82.7 cents for every dollar earned by a man.
What is Inequality or Gini Index in Beardsley?
Inequality or Gini Index in Beardsley is 0.37.
What is the Total Population of Beardsley?
Total Population of Beardsley is 241.
What is the Total Male Population of Beardsley?
Total Male Population of Beardsley is 140.
What is the Total Female Population of Beardsley?
Total Female Population of Beardsley is 101.
What is the Ratio of Males per 100 Females in Beardsley?
There are 138.61 Males per 100 Females in Beardsley.
What is the Ratio of Females per 100 Males in Beardsley?
There are 72.14 Females per 100 Males in Beardsley.
What is the Median Population Age in Beardsley?
Median Population Age in Beardsley is 39.2 Years.
What is the Average Family Size in Beardsley
Average Family Size in Beardsley is 3.0 People.
What is the Average Household Size in Beardsley
Average Household Size in Beardsley is 2.5 People.
How Large is the Labor Force in Beardsley?
There are 129 People in the Labor Forcein in Beardsley.
What is the Percentage of People in the Labor Force in Beardsley?
71.7% of People are in the Labor Force in Beardsley.
What is the Unemployment Rate in Beardsley?
Unemployment Rate in Beardsley is 5.4%.