Battle Lake, MN Map & Demographics
Battle Lake Map
Battle Lake Overview
$34,590
PER CAPITA INCOME
$81,667
AVG FAMILY INCOME
$57,917
AVG HOUSEHOLD INCOME
57.0%
WAGE / INCOME GAP [ % ]
43.0¢/ $1
WAGE / INCOME GAP [ $ ]
0.42
INEQUALITY / GINI INDEX
744
TOTAL POPULATION
357
MALE POPULATION
387
FEMALE POPULATION
92.25
MALES / 100 FEMALES
108.40
FEMALES / 100 MALES
57.0
MEDIAN AGE
2.8
AVG FAMILY SIZE
2.0
AVG HOUSEHOLD SIZE
290
LABOR FORCE [ PEOPLE ]
46.3%
PERCENT IN LABOR FORCE
8.3%
UNEMPLOYMENT RATE
Battle Lake Zip Codes
Battle Lake Area Codes
Income in Battle Lake
Income Overview in Battle Lake
Per Capita Income in Battle Lake is $34,590, while median incomes of families and households are $81,667 and $57,917 respectively.
| Characteristic | Number | Measure |
| Per Capita Income | 744 | $34,590 |
| Median Family Income | 182 | $81,667 |
| Mean Family Income | 182 | $107,086 |
| Median Household Income | 332 | $57,917 |
| Mean Household Income | 332 | $76,880 |
| Income Deficit | 182 | $0 |
| Wage / Income Gap (%) | 744 | 56.98% |
| Wage / Income Gap ($) | 744 | 43.02¢ per $1 |
| Gini / Inequality Index | 744 | 0.42 |
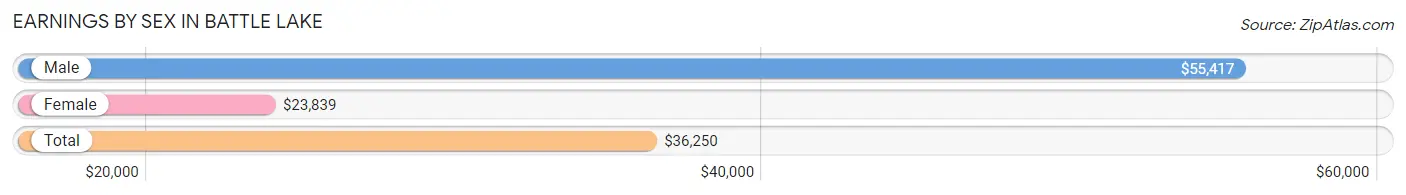
Earnings by Sex in Battle Lake
Average Earnings in Battle Lake are $36,250, $55,417 for men and $23,839 for women, a difference of 57.0%.
| Sex | Number | Average Earnings |
| Male | 156 (50.2%) | $55,417 |
| Female | 155 (49.8%) | $23,839 |
| Total | 311 (100.0%) | $36,250 |
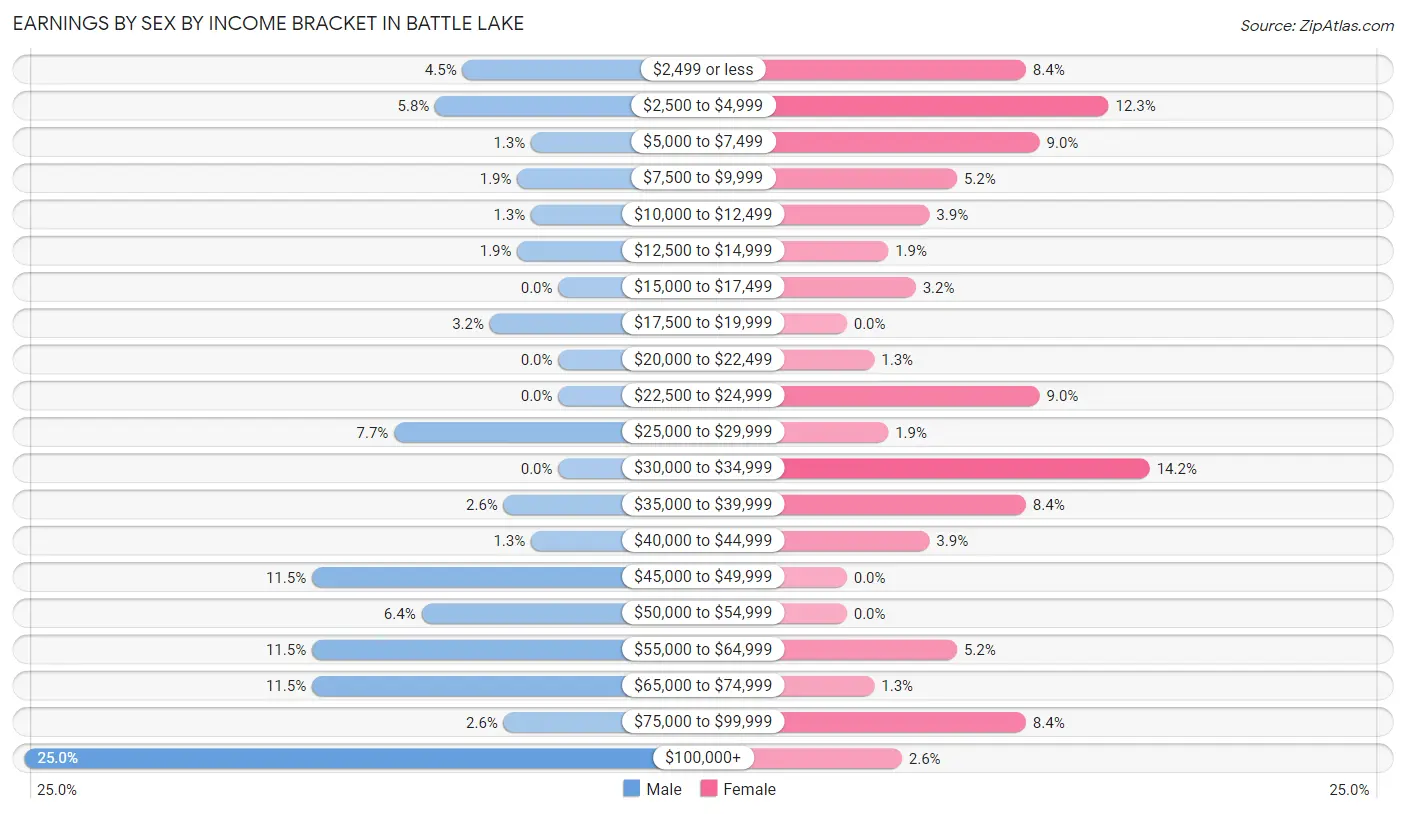
Earnings by Sex by Income Bracket in Battle Lake
The most common earnings brackets in Battle Lake are $100,000+ for men (39 | 25.0%) and $30,000 to $34,999 for women (22 | 14.2%).
| Income | Male | Female |
| $2,499 or less | 7 (4.5%) | 13 (8.4%) |
| $2,500 to $4,999 | 9 (5.8%) | 19 (12.3%) |
| $5,000 to $7,499 | 2 (1.3%) | 14 (9.0%) |
| $7,500 to $9,999 | 3 (1.9%) | 8 (5.2%) |
| $10,000 to $12,499 | 2 (1.3%) | 6 (3.9%) |
| $12,500 to $14,999 | 3 (1.9%) | 3 (1.9%) |
| $15,000 to $17,499 | 0 (0.0%) | 5 (3.2%) |
| $17,500 to $19,999 | 5 (3.2%) | 0 (0.0%) |
| $20,000 to $22,499 | 0 (0.0%) | 2 (1.3%) |
| $22,500 to $24,999 | 0 (0.0%) | 14 (9.0%) |
| $25,000 to $29,999 | 12 (7.7%) | 3 (1.9%) |
| $30,000 to $34,999 | 0 (0.0%) | 22 (14.2%) |
| $35,000 to $39,999 | 4 (2.6%) | 13 (8.4%) |
| $40,000 to $44,999 | 2 (1.3%) | 6 (3.9%) |
| $45,000 to $49,999 | 18 (11.5%) | 0 (0.0%) |
| $50,000 to $54,999 | 10 (6.4%) | 0 (0.0%) |
| $55,000 to $64,999 | 18 (11.5%) | 8 (5.2%) |
| $65,000 to $74,999 | 18 (11.5%) | 2 (1.3%) |
| $75,000 to $99,999 | 4 (2.6%) | 13 (8.4%) |
| $100,000+ | 39 (25.0%) | 4 (2.6%) |
| Total | 156 (100.0%) | 155 (100.0%) |
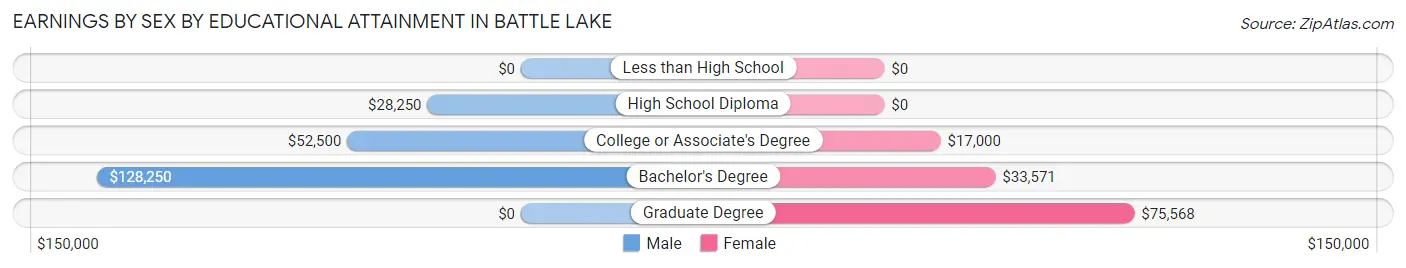
Earnings by Sex by Educational Attainment in Battle Lake
Average earnings in Battle Lake are $54,250 for men and $24,554 for women, a difference of 54.7%. Men with an educational attainment of bachelor's degree enjoy the highest average annual earnings of $128,250, while those with high school diploma education earn the least with $28,250. Women with an educational attainment of graduate degree earn the most with the average annual earnings of $75,568, while those with college or associate's degree education have the smallest earnings of $17,000.
| Educational Attainment | Male Income | Female Income |
| Less than High School | - | - |
| High School Diploma | $28,250 | $0 |
| College or Associate's Degree | $52,500 | $17,000 |
| Bachelor's Degree | $128,250 | $33,571 |
| Graduate Degree | - | - |
| Total | $54,250 | $24,554 |
Family Income in Battle Lake
Family Income Brackets in Battle Lake
According to the Battle Lake family income data, there are 42 families falling into the $50,000 to $74,999 income range, which is the most common income bracket and makes up 23.1% of all families.
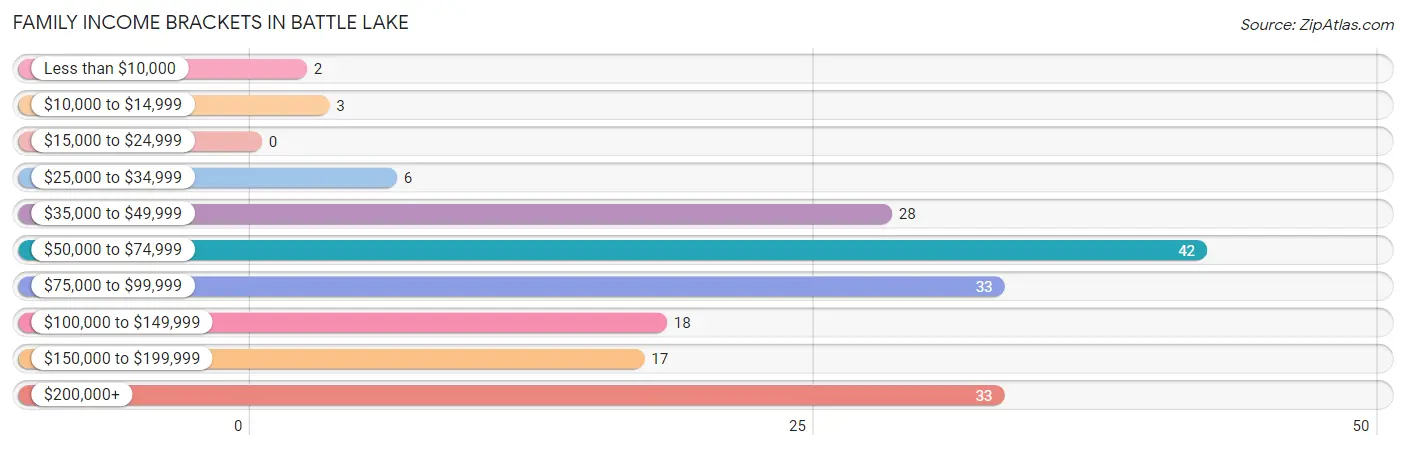
| Income Bracket | # Families | % Families |
| Less than $10,000 | 2 | 1.1% |
| $10,000 to $14,999 | 3 | 1.6% |
| $15,000 to $24,999 | 0 | 0.0% |
| $25,000 to $34,999 | 6 | 3.3% |
| $35,000 to $49,999 | 28 | 15.4% |
| $50,000 to $74,999 | 42 | 23.1% |
| $75,000 to $99,999 | 33 | 18.1% |
| $100,000 to $149,999 | 18 | 9.9% |
| $150,000 to $199,999 | 17 | 9.3% |
| $200,000+ | 33 | 18.1% |
Family Income by Famaliy Size in Battle Lake
4-person families (11 | 6.0%) account for the highest median family income in Battle Lake with $245,781 per family, while 4-person families (11 | 6.0%) have the highest median income of $61,445 per family member.
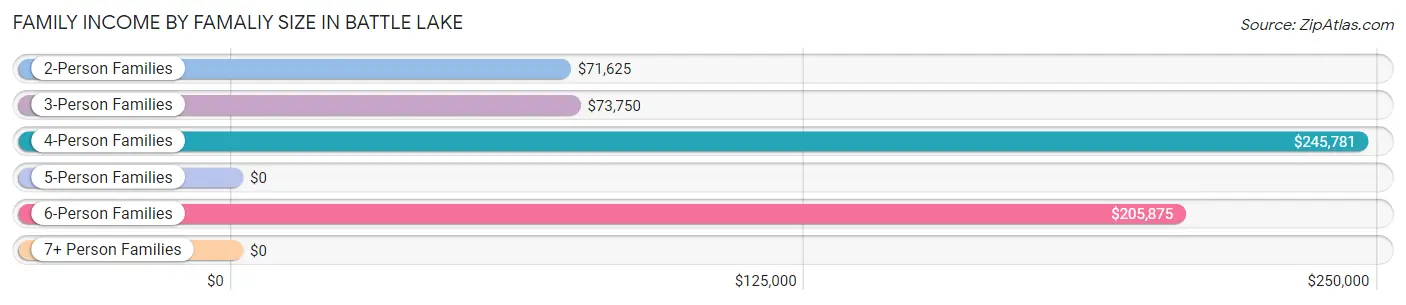
| Income Bracket | # Families | Median Income |
| 2-Person Families | 118 (64.8%) | $71,625 |
| 3-Person Families | 18 (9.9%) | $73,750 |
| 4-Person Families | 11 (6.0%) | $245,781 |
| 5-Person Families | 9 (5.0%) | $0 |
| 6-Person Families | 26 (14.3%) | $205,875 |
| 7+ Person Families | 0 (0.0%) | $0 |
| Total | 182 (100.0%) | $81,667 |
Family Income by Number of Earners in Battle Lake
The median family income in Battle Lake is $81,667, with families comprising 2 earners (70) having the highest median family income of $149,167, while families with 1 earner (45) have the lowest median family income of $56,964, accounting for 38.5% and 24.7% of families, respectively.
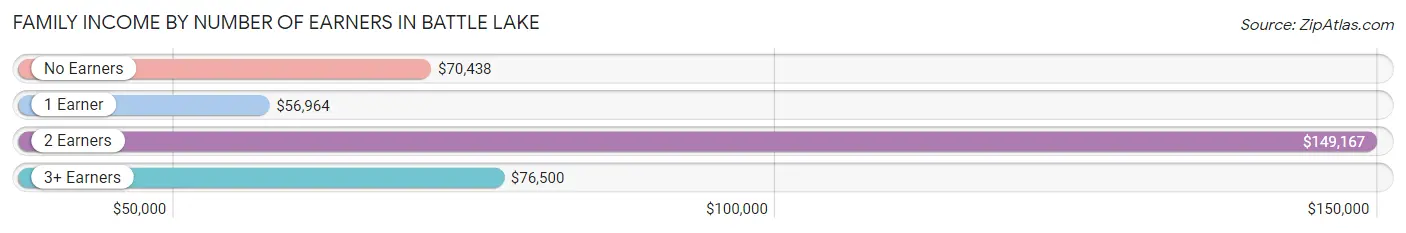
| Number of Earners | # Families | Median Income |
| No Earners | 53 (29.1%) | $70,438 |
| 1 Earner | 45 (24.7%) | $56,964 |
| 2 Earners | 70 (38.5%) | $149,167 |
| 3+ Earners | 14 (7.7%) | $76,500 |
| Total | 182 (100.0%) | $81,667 |
Household Income in Battle Lake
Household Income Brackets in Battle Lake
With 73 households falling in the category, the $50,000 to $74,999 income range is the most frequent in Battle Lake, accounting for 22.0% of all households. In contrast, only 8 households (2.4%) fall into the less than $10,000 income bracket, making it the least populous group.
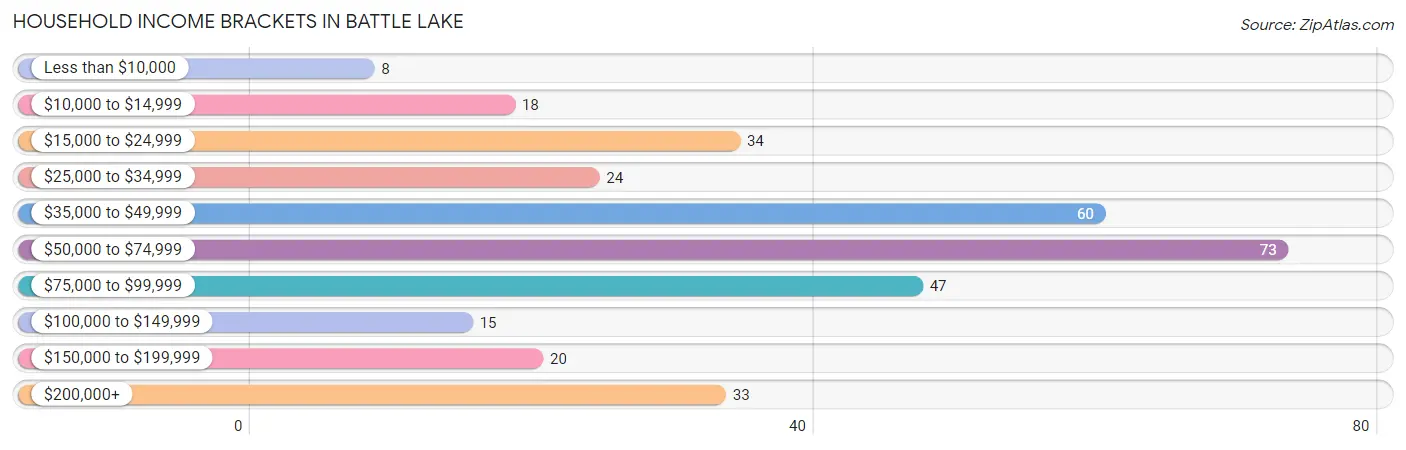
| Income Bracket | # Households | % Households |
| Less than $10,000 | 8 | 2.4% |
| $10,000 to $14,999 | 18 | 5.4% |
| $15,000 to $24,999 | 34 | 10.2% |
| $25,000 to $34,999 | 24 | 7.2% |
| $35,000 to $49,999 | 60 | 18.1% |
| $50,000 to $74,999 | 73 | 22.0% |
| $75,000 to $99,999 | 47 | 14.2% |
| $100,000 to $149,999 | 15 | 4.5% |
| $150,000 to $199,999 | 20 | 6.0% |
| $200,000+ | 33 | 9.9% |
Household Income by Householder Age in Battle Lake
The median household income in Battle Lake is $57,917, with the highest median household income of $132,500 found in the 45 to 64 years age bracket for the primary householder. A total of 64 households (19.3%) fall into this category. Meanwhile, the 15 to 24 years age bracket for the primary householder has the lowest median household income of $0, with 2 households (0.6%) in this group.
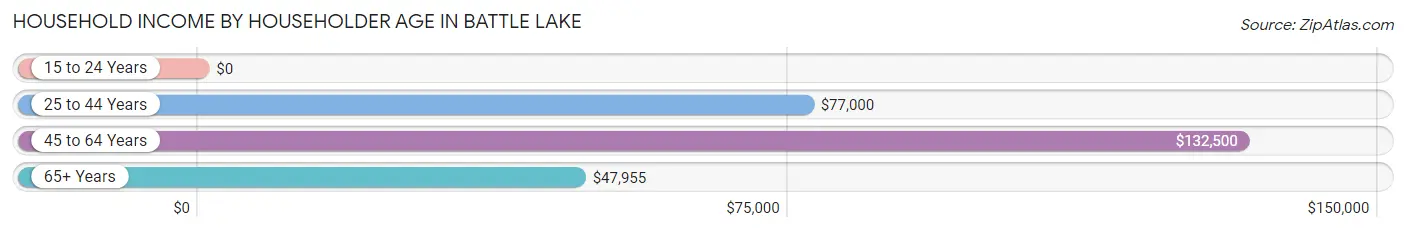
| Income Bracket | # Households | Median Income |
| 15 to 24 Years | 2 (0.6%) | $0 |
| 25 to 44 Years | 100 (30.1%) | $77,000 |
| 45 to 64 Years | 64 (19.3%) | $132,500 |
| 65+ Years | 166 (50.0%) | $47,955 |
| Total | 332 (100.0%) | $57,917 |
Poverty in Battle Lake
Income Below Poverty by Sex and Age in Battle Lake
With 4.2% poverty level for males and 6.8% for females among the residents of Battle Lake, under 5 year old males and 18 to 24 year old females are the most vulnerable to poverty, with 4 males (30.8%) and 6 females (30.0%) in their respective age groups living below the poverty level.
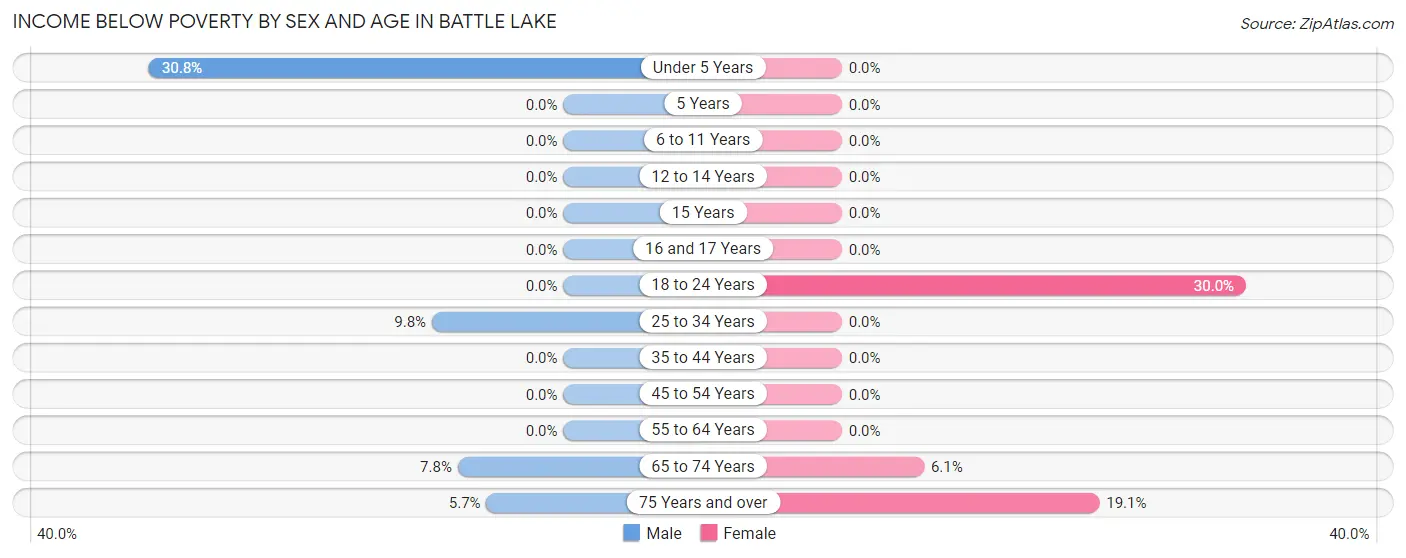
| Age Bracket | Male | Female |
| Under 5 Years | 4 (30.8%) | 0 (0.0%) |
| 5 Years | 0 (0.0%) | 0 (0.0%) |
| 6 to 11 Years | 0 (0.0%) | 0 (0.0%) |
| 12 to 14 Years | 0 (0.0%) | 0 (0.0%) |
| 15 Years | 0 (0.0%) | 0 (0.0%) |
| 16 and 17 Years | 0 (0.0%) | 0 (0.0%) |
| 18 to 24 Years | 0 (0.0%) | 6 (30.0%) |
| 25 to 34 Years | 4 (9.8%) | 0 (0.0%) |
| 35 to 44 Years | 0 (0.0%) | 0 (0.0%) |
| 45 to 54 Years | 0 (0.0%) | 0 (0.0%) |
| 55 to 64 Years | 0 (0.0%) | 0 (0.0%) |
| 65 to 74 Years | 4 (7.8%) | 5 (6.1%) |
| 75 Years and over | 2 (5.7%) | 13 (19.1%) |
| Total | 14 (4.2%) | 24 (6.8%) |
Income Above Poverty by Sex and Age in Battle Lake
According to the poverty statistics in Battle Lake, males aged 5 years and females aged under 5 years are the age groups that are most secure financially, with 100.0% of males and 100.0% of females in these age groups living above the poverty line.
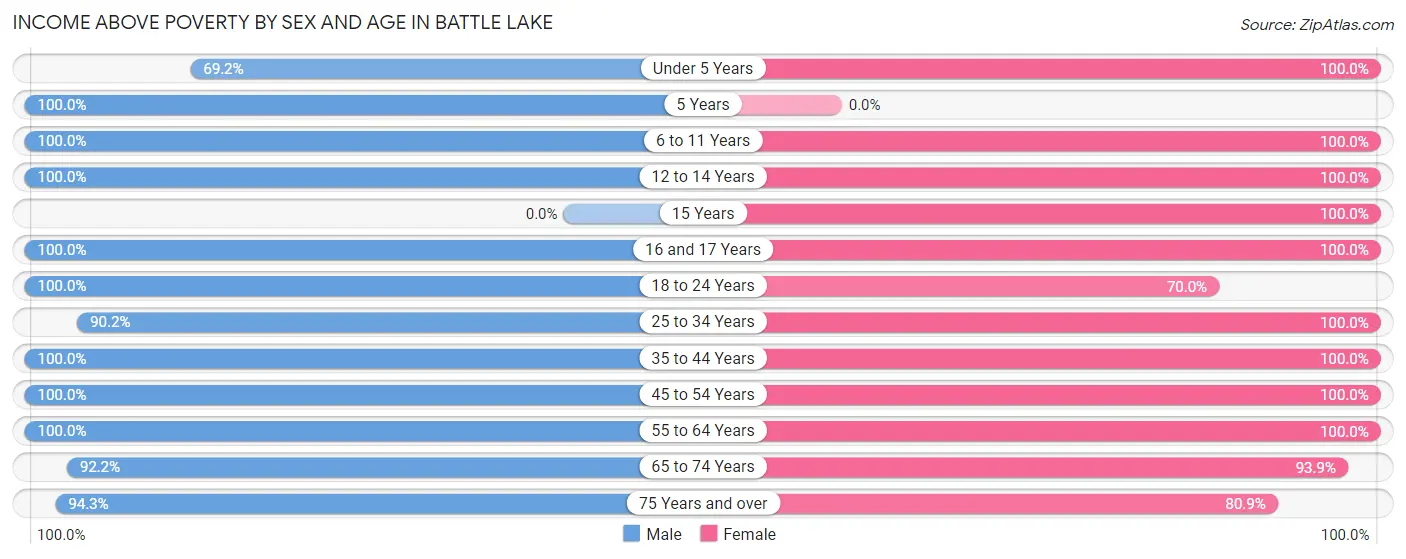
| Age Bracket | Male | Female |
| Under 5 Years | 9 (69.2%) | 6 (100.0%) |
| 5 Years | 15 (100.0%) | 0 (0.0%) |
| 6 to 11 Years | 31 (100.0%) | 13 (100.0%) |
| 12 to 14 Years | 20 (100.0%) | 9 (100.0%) |
| 15 Years | 0 (0.0%) | 11 (100.0%) |
| 16 and 17 Years | 11 (100.0%) | 10 (100.0%) |
| 18 to 24 Years | 22 (100.0%) | 14 (70.0%) |
| 25 to 34 Years | 37 (90.2%) | 29 (100.0%) |
| 35 to 44 Years | 39 (100.0%) | 47 (100.0%) |
| 45 to 54 Years | 20 (100.0%) | 11 (100.0%) |
| 55 to 64 Years | 33 (100.0%) | 45 (100.0%) |
| 65 to 74 Years | 47 (92.2%) | 77 (93.9%) |
| 75 Years and over | 33 (94.3%) | 55 (80.9%) |
| Total | 317 (95.8%) | 327 (93.2%) |
Income Below Poverty Among Married-Couple Families in Battle Lake
The poverty statistics for married-couple families in Battle Lake show that 1.8% or 3 of the total 168 families live below the poverty line. Families with no children have the highest poverty rate of 2.5%, comprising of 3 families. On the other hand, families with 1 or 2 children have the lowest poverty rate of 0.0%, which includes 0 families.
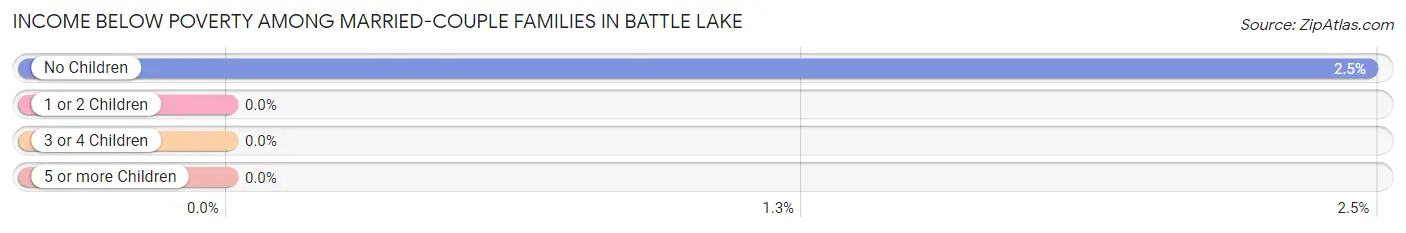
| Children | Above Poverty | Below Poverty |
| No Children | 118 (97.5%) | 3 (2.5%) |
| 1 or 2 Children | 13 (100.0%) | 0 (0.0%) |
| 3 or 4 Children | 34 (100.0%) | 0 (0.0%) |
| 5 or more Children | 0 (0.0%) | 0 (0.0%) |
| Total | 165 (98.2%) | 3 (1.8%) |
Income Below Poverty Among Single-Parent Households in Battle Lake
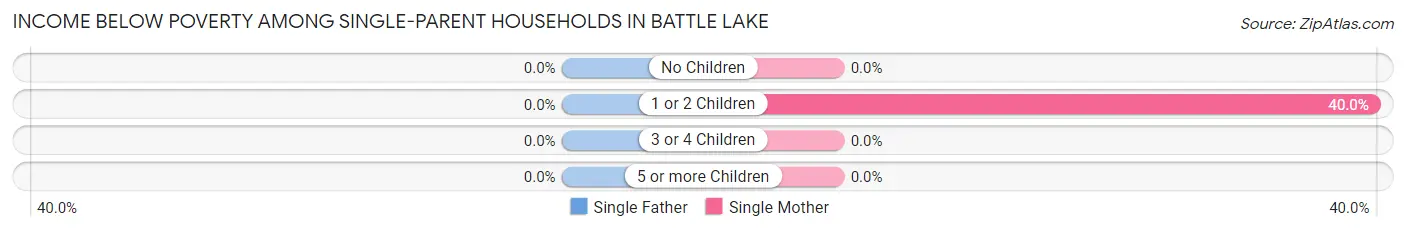
| Children | Single Father | Single Mother |
| No Children | 0 (0.0%) | 0 (0.0%) |
| 1 or 2 Children | 0 (0.0%) | 2 (40.0%) |
| 3 or 4 Children | 0 (0.0%) | 0 (0.0%) |
| 5 or more Children | 0 (0.0%) | 0 (0.0%) |
| Total | 0 (0.0%) | 2 (18.2%) |
Income Below Poverty Among Married-Couple vs Single-Parent Households in Battle Lake
The poverty data for Battle Lake shows that 3 of the married-couple family households (1.8%) and 2 of the single-parent households (14.3%) are living below the poverty level. Within the married-couple family households, those with no children have the highest poverty rate, with 3 households (2.5%) falling below the poverty line. Among the single-parent households, those with 1 or 2 children have the highest poverty rate, with 2 household (25.0%) living below poverty.
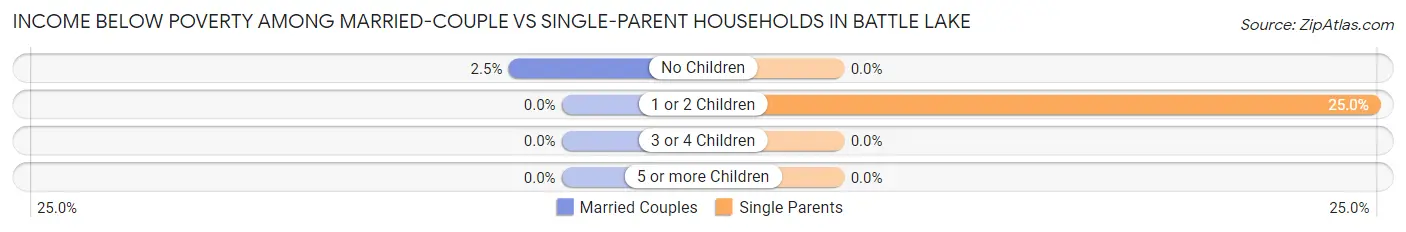
| Children | Married-Couple Families | Single-Parent Households |
| No Children | 3 (2.5%) | 0 (0.0%) |
| 1 or 2 Children | 0 (0.0%) | 2 (25.0%) |
| 3 or 4 Children | 0 (0.0%) | 0 (0.0%) |
| 5 or more Children | 0 (0.0%) | 0 (0.0%) |
| Total | 3 (1.8%) | 2 (14.3%) |
Race in Battle Lake
The most populous races in Battle Lake are White / Caucasian (656 | 88.2%), Hispanic or Latino (72 | 9.7%), and Some other Race (72 | 9.7%).
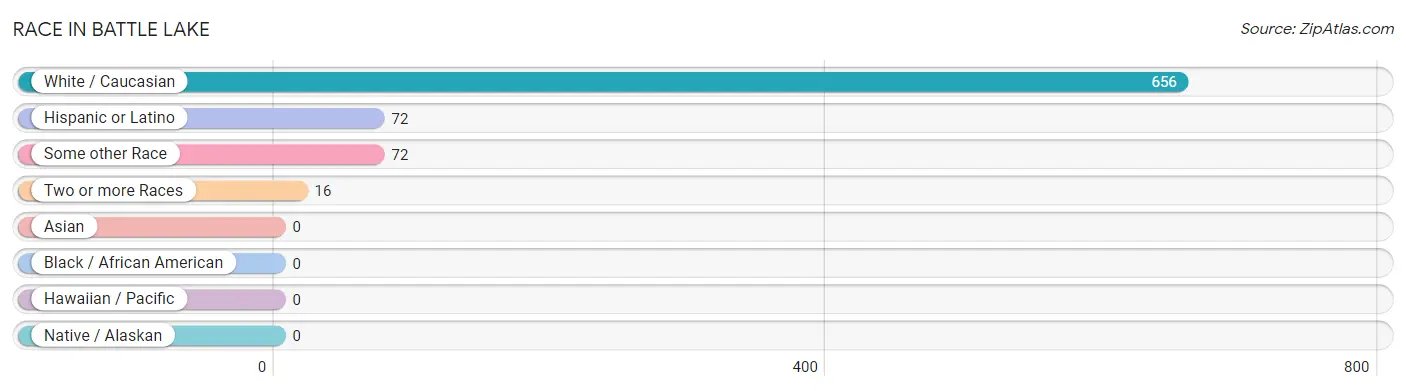
| Race | # Population | % Population |
| Asian | 0 | 0.0% |
| Black / African American | 0 | 0.0% |
| Hawaiian / Pacific | 0 | 0.0% |
| Hispanic or Latino | 72 | 9.7% |
| Native / Alaskan | 0 | 0.0% |
| White / Caucasian | 656 | 88.2% |
| Two or more Races | 16 | 2.1% |
| Some other Race | 72 | 9.7% |
| Total | 744 | 100.0% |
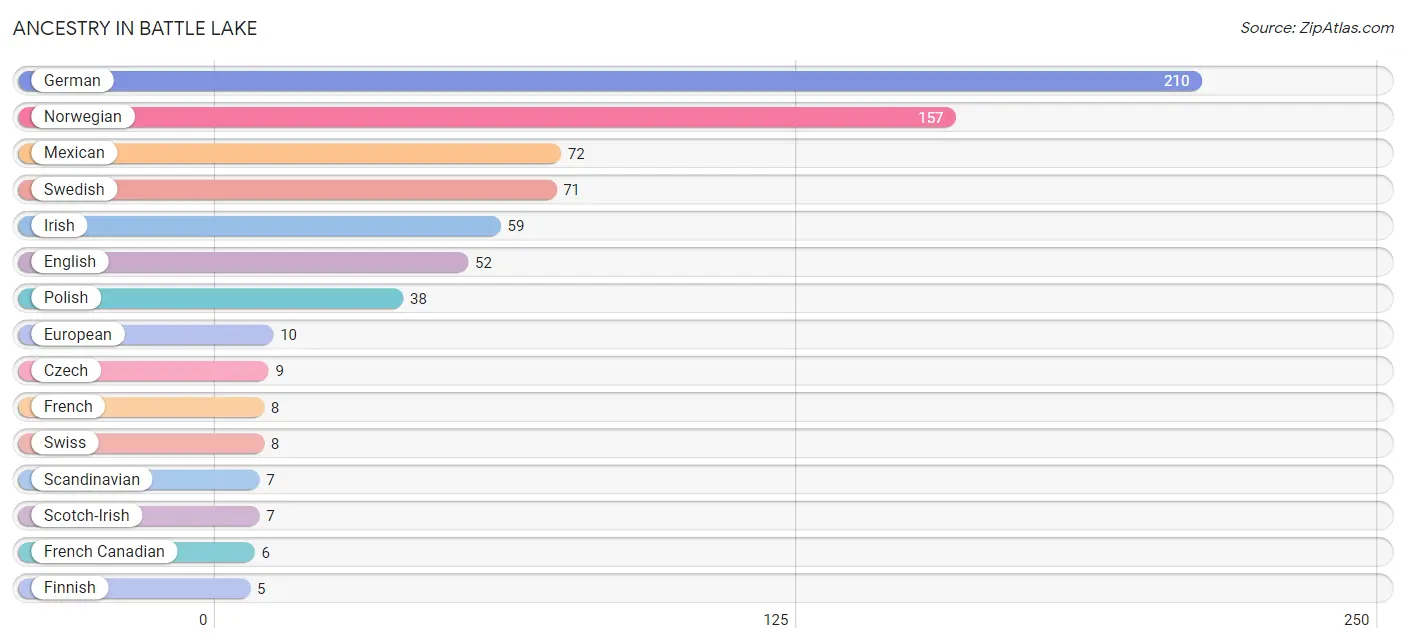
Ancestry in Battle Lake
The most populous ancestries reported in Battle Lake are German (210 | 28.2%), Norwegian (157 | 21.1%), Mexican (72 | 9.7%), Swedish (71 | 9.5%), and Irish (59 | 7.9%), together accounting for 76.5% of all Battle Lake residents.
| Ancestry | # Population | % Population |
| American | 2 | 0.3% |
| Arab | 3 | 0.4% |
| British | 3 | 0.4% |
| Czech | 9 | 1.2% |
| Danish | 3 | 0.4% |
| English | 52 | 7.0% |
| European | 10 | 1.3% |
| Finnish | 5 | 0.7% |
| French | 8 | 1.1% |
| French Canadian | 6 | 0.8% |
| German | 210 | 28.2% |
| Iranian | 4 | 0.5% |
| Irish | 59 | 7.9% |
| Lebanese | 3 | 0.4% |
| Mexican | 72 | 9.7% |
| Northern European | 3 | 0.4% |
| Norwegian | 157 | 21.1% |
| Polish | 38 | 5.1% |
| Scandinavian | 7 | 0.9% |
| Scotch-Irish | 7 | 0.9% |
| Swedish | 71 | 9.5% |
| Swiss | 8 | 1.1% |
| Thai | 5 | 0.7% |
| Welsh | 3 | 0.4% | View All 24 Rows |
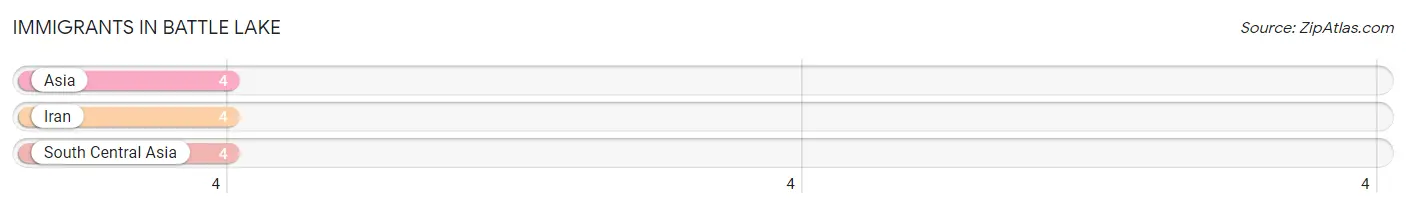
Immigrants in Battle Lake
The most numerous immigrant groups reported in Battle Lake came from Asia (4 | 0.5%), Iran (4 | 0.5%), and South Central Asia (4 | 0.5%), together accounting for 1.6% of all Battle Lake residents.
| Immigration Origin | # Population | % Population |
| Asia | 4 | 0.5% |
| Iran | 4 | 0.5% |
| South Central Asia | 4 | 0.5% | View All 3 Rows |
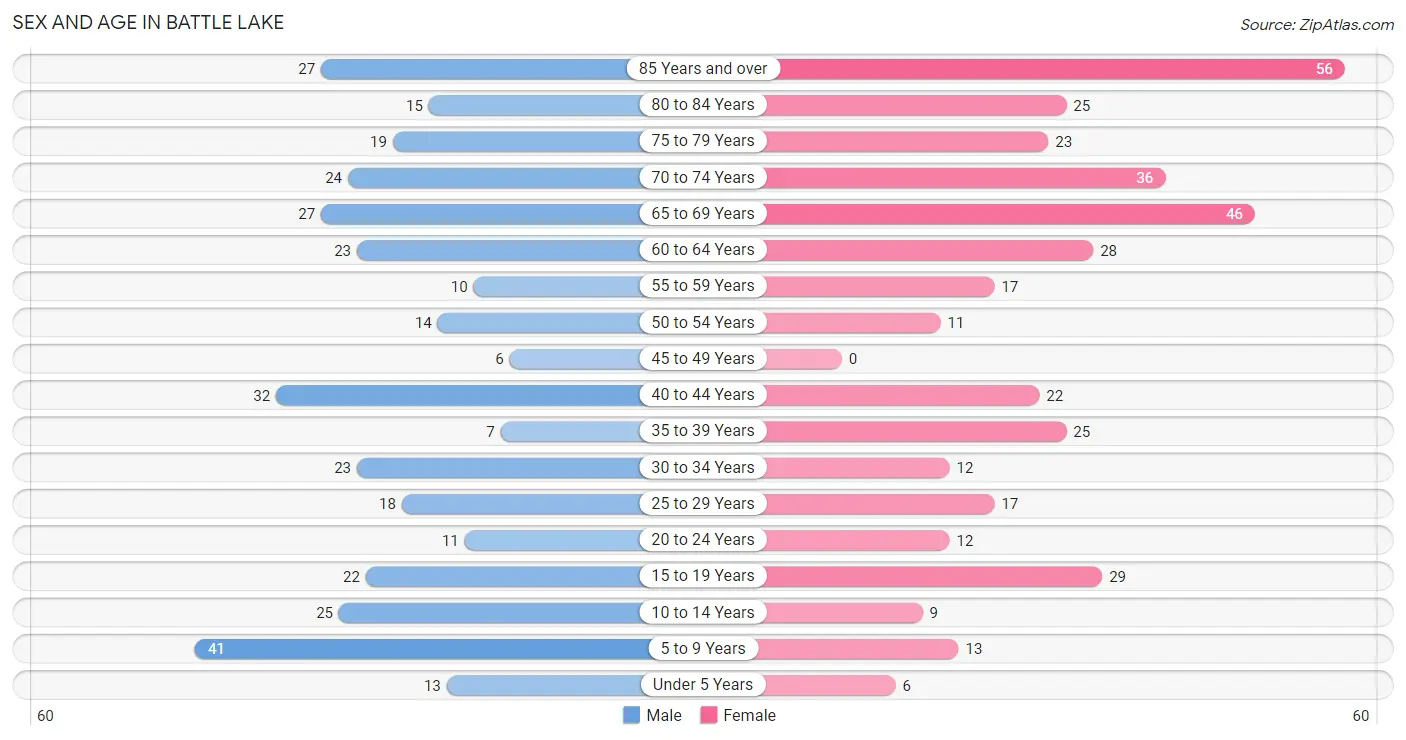
Sex and Age in Battle Lake
Sex and Age in Battle Lake
The most populous age groups in Battle Lake are 5 to 9 Years (41 | 11.5%) for men and 85 Years and over (56 | 14.5%) for women.
| Age Bracket | Male | Female |
| Under 5 Years | 13 (3.6%) | 6 (1.5%) |
| 5 to 9 Years | 41 (11.5%) | 13 (3.4%) |
| 10 to 14 Years | 25 (7.0%) | 9 (2.3%) |
| 15 to 19 Years | 22 (6.2%) | 29 (7.5%) |
| 20 to 24 Years | 11 (3.1%) | 12 (3.1%) |
| 25 to 29 Years | 18 (5.0%) | 17 (4.4%) |
| 30 to 34 Years | 23 (6.4%) | 12 (3.1%) |
| 35 to 39 Years | 7 (2.0%) | 25 (6.5%) |
| 40 to 44 Years | 32 (9.0%) | 22 (5.7%) |
| 45 to 49 Years | 6 (1.7%) | 0 (0.0%) |
| 50 to 54 Years | 14 (3.9%) | 11 (2.8%) |
| 55 to 59 Years | 10 (2.8%) | 17 (4.4%) |
| 60 to 64 Years | 23 (6.4%) | 28 (7.2%) |
| 65 to 69 Years | 27 (7.6%) | 46 (11.9%) |
| 70 to 74 Years | 24 (6.7%) | 36 (9.3%) |
| 75 to 79 Years | 19 (5.3%) | 23 (5.9%) |
| 80 to 84 Years | 15 (4.2%) | 25 (6.5%) |
| 85 Years and over | 27 (7.6%) | 56 (14.5%) |
| Total | 357 (100.0%) | 387 (100.0%) |
Families and Households in Battle Lake
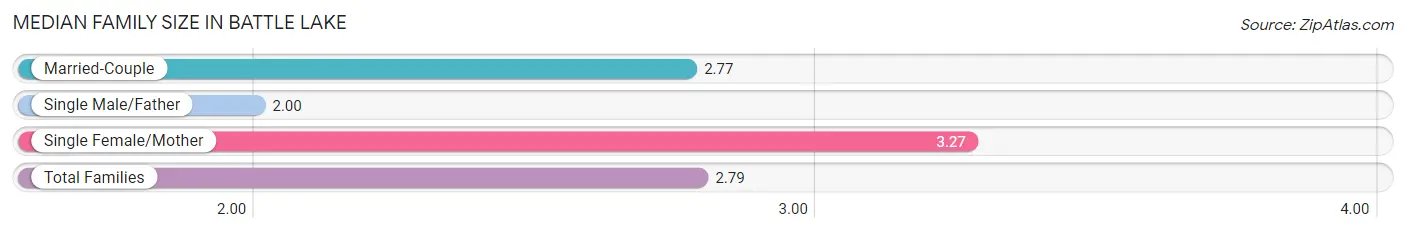
Median Family Size in Battle Lake
The median family size in Battle Lake is 2.79 persons per family, with single female/mother families (11 | 6.0%) accounting for the largest median family size of 3.27 persons per family. On the other hand, single male/father families (3 | 1.7%) represent the smallest median family size with 2.00 persons per family.
| Family Type | # Families | Family Size |
| Married-Couple | 168 (92.3%) | 2.77 |
| Single Male/Father | 3 (1.7%) | 2.00 |
| Single Female/Mother | 11 (6.0%) | 3.27 |
| Total Families | 182 (100.0%) | 2.79 |
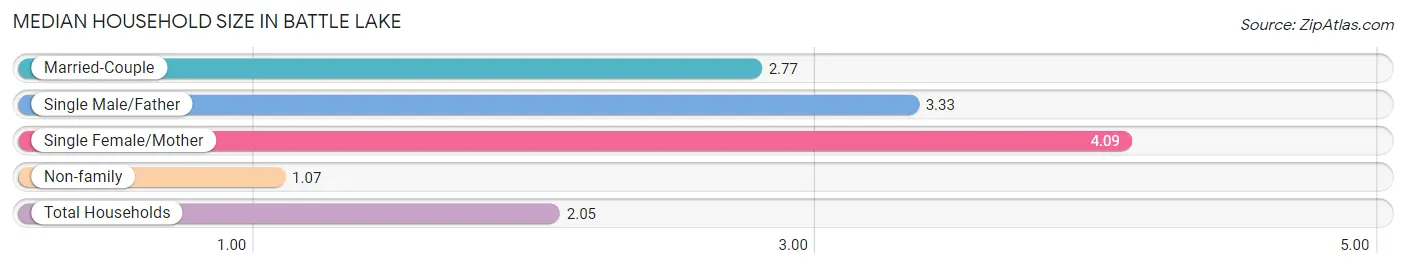
Median Household Size in Battle Lake
The median household size in Battle Lake is 2.05 persons per household, with single female/mother households (11 | 3.3%) accounting for the largest median household size of 4.09 persons per household. non-family households (150 | 45.2%) represent the smallest median household size with 1.07 persons per household.
| Household Type | # Households | Household Size |
| Married-Couple | 168 (50.6%) | 2.77 |
| Single Male/Father | 3 (0.9%) | 3.33 |
| Single Female/Mother | 11 (3.3%) | 4.09 |
| Non-family | 150 (45.2%) | 1.07 |
| Total Households | 332 (100.0%) | 2.05 |
Household Size by Marriage Status in Battle Lake
Out of a total of 332 households in Battle Lake, 182 (54.8%) are family households, while 150 (45.2%) are nonfamily households. The most numerous type of family households are 2-person households, comprising 112, and the most common type of nonfamily households are 1-person households, comprising 140.
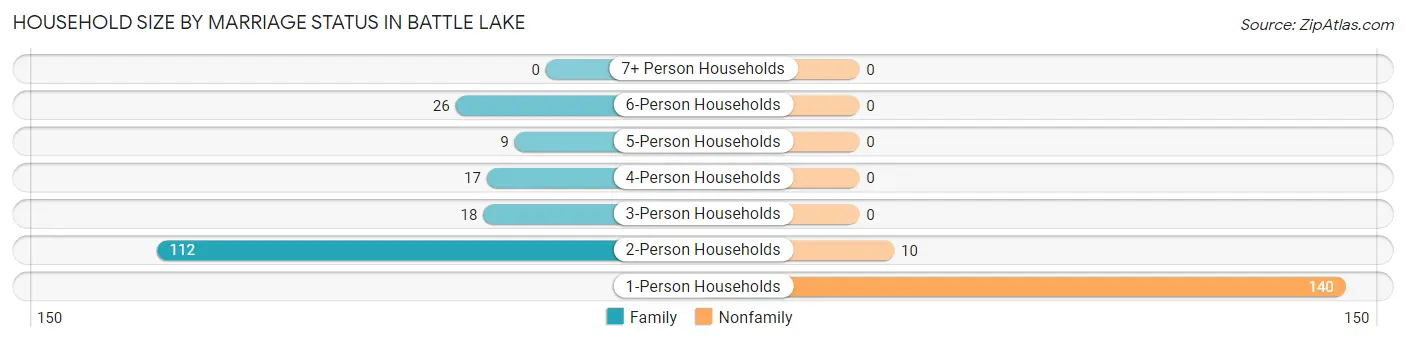
| Household Size | Family Households | Nonfamily Households |
| 1-Person Households | - | 140 (42.2%) |
| 2-Person Households | 112 (33.7%) | 10 (3.0%) |
| 3-Person Households | 18 (5.4%) | 0 (0.0%) |
| 4-Person Households | 17 (5.1%) | 0 (0.0%) |
| 5-Person Households | 9 (2.7%) | 0 (0.0%) |
| 6-Person Households | 26 (7.8%) | 0 (0.0%) |
| 7+ Person Households | 0 (0.0%) | 0 (0.0%) |
| Total | 182 (54.8%) | 150 (45.2%) |
Female Fertility in Battle Lake
Fertility by Age in Battle Lake
Average fertility rate in Battle Lake is 17.0 births per 1,000 women. Women in the age bracket of 15 to 19 years have the highest fertility rate with 69.0 births per 1,000 women. Women in the age bracket of 15 to 19 years acount for 100.0% of all women with births.
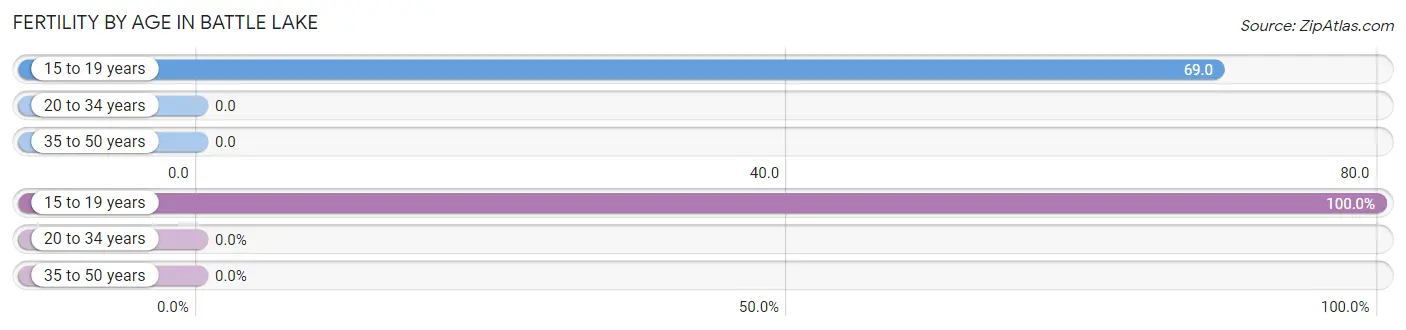
| Age Bracket | Women with Births | Births / 1,000 Women |
| 15 to 19 years | 2 (100.0%) | 69.0 |
| 20 to 34 years | 0 (0.0%) | 0.0 |
| 35 to 50 years | 0 (0.0%) | 0.0 |
| Total | 2 (100.0%) | 17.0 |
Fertility by Age by Marriage Status in Battle Lake
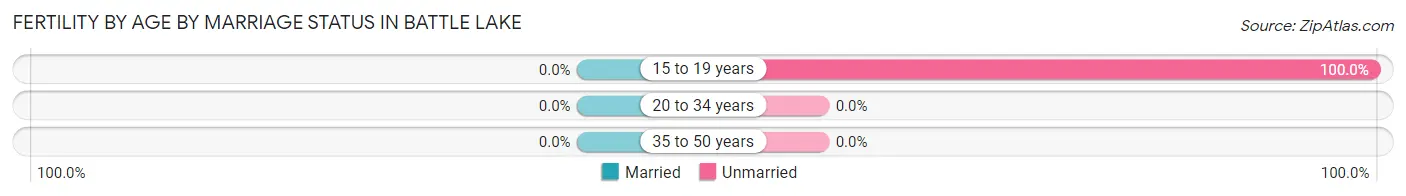
| Age Bracket | Married | Unmarried |
| 15 to 19 years | 0 (0.0%) | 2 (100.0%) |
| 20 to 34 years | 0 (0.0%) | 0 (0.0%) |
| 35 to 50 years | 0 (0.0%) | 0 (0.0%) |
| Total | 0 (0.0%) | 2 (100.0%) |
Fertility by Education in Battle Lake
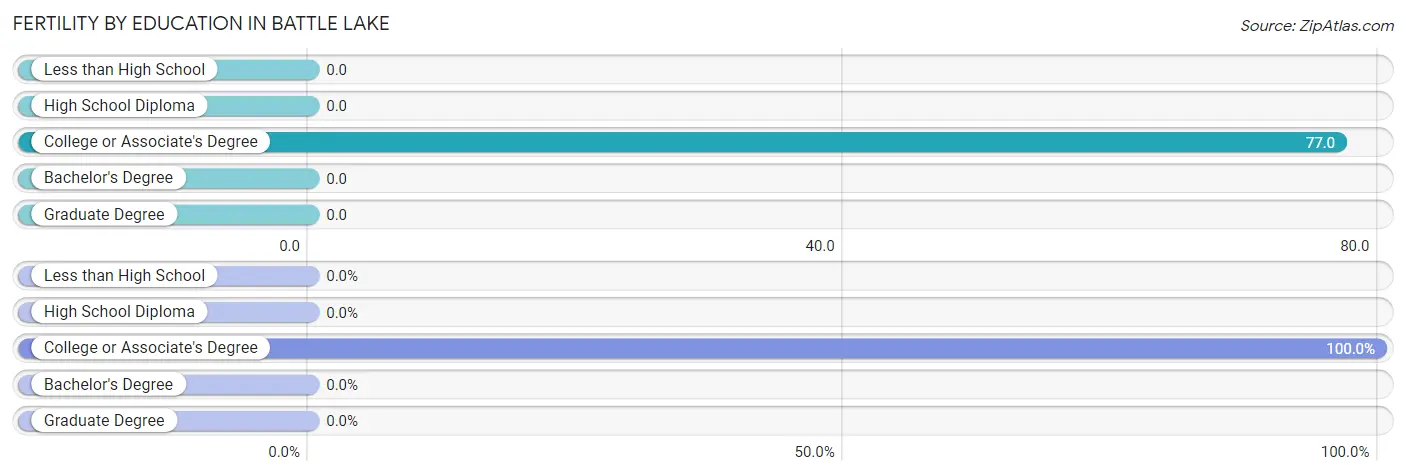
| Educational Attainment | Women with Births | Births / 1,000 Women |
| Less than High School | 0 (0.0%) | 0.0 |
| High School Diploma | 0 (0.0%) | 0.0 |
| College or Associate's Degree | 2 (100.0%) | 77.0 |
| Bachelor's Degree | 0 (0.0%) | 0.0 |
| Graduate Degree | 0 (0.0%) | 0.0 |
| Total | 2 (100.0%) | 17.0 |
Fertility by Education by Marriage Status in Battle Lake
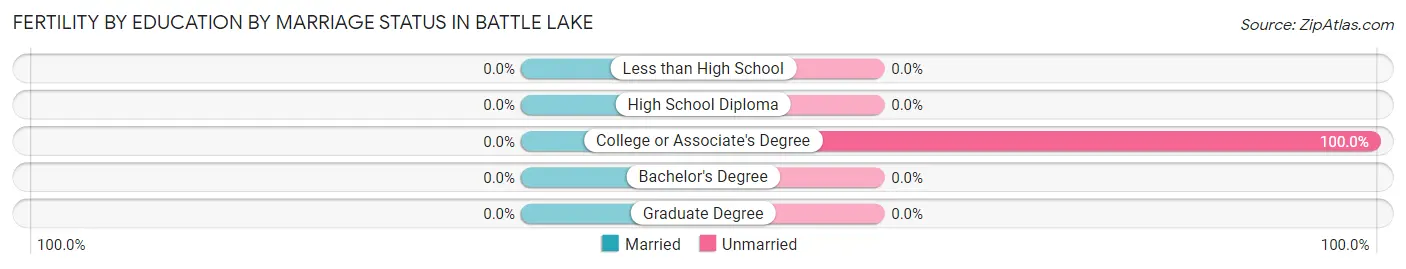
| Educational Attainment | Married | Unmarried |
| Less than High School | 0 (0.0%) | 0 (0.0%) |
| High School Diploma | 0 (0.0%) | 0 (0.0%) |
| College or Associate's Degree | 0 (0.0%) | 2 (100.0%) |
| Bachelor's Degree | 0 (0.0%) | 0 (0.0%) |
| Graduate Degree | 0 (0.0%) | 0 (0.0%) |
| Total | 0 (0.0%) | 2 (100.0%) |
Employment Characteristics in Battle Lake
Employment by Class of Employer in Battle Lake
Among the 263 employed individuals in Battle Lake, private company employees (141 | 53.6%), local government employees (40 | 15.2%), and self-employed (not incorporated) (34 | 12.9%) make up the most common classes of employment.
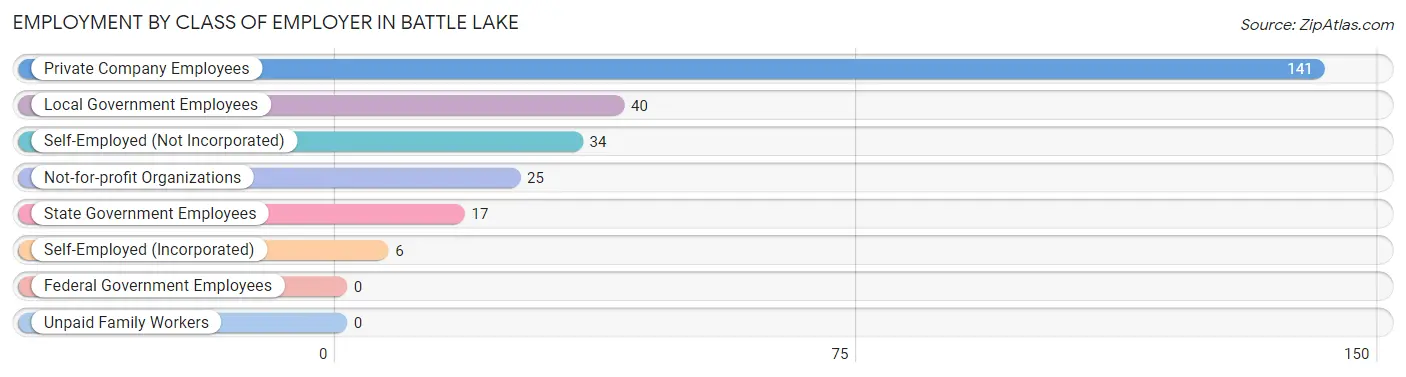
| Employer Class | # Employees | % Employees |
| Private Company Employees | 141 | 53.6% |
| Self-Employed (Incorporated) | 6 | 2.3% |
| Self-Employed (Not Incorporated) | 34 | 12.9% |
| Not-for-profit Organizations | 25 | 9.5% |
| Local Government Employees | 40 | 15.2% |
| State Government Employees | 17 | 6.5% |
| Federal Government Employees | 0 | 0.0% |
| Unpaid Family Workers | 0 | 0.0% |
| Total | 263 | 100.0% |
Employment Status by Age in Battle Lake
According to the labor force statistics for Battle Lake, out of the total population over 16 years of age (626), 46.3% or 290 individuals are in the labor force, with 8.3% or 24 of them unemployed. The age group with the highest labor force participation rate is 25 to 29 years, with 100.0% or 35 individuals in the labor force. Within the labor force, the 20 to 24 years age range has the highest percentage of unemployed individuals, with 55.0% or 11 of them being unemployed.
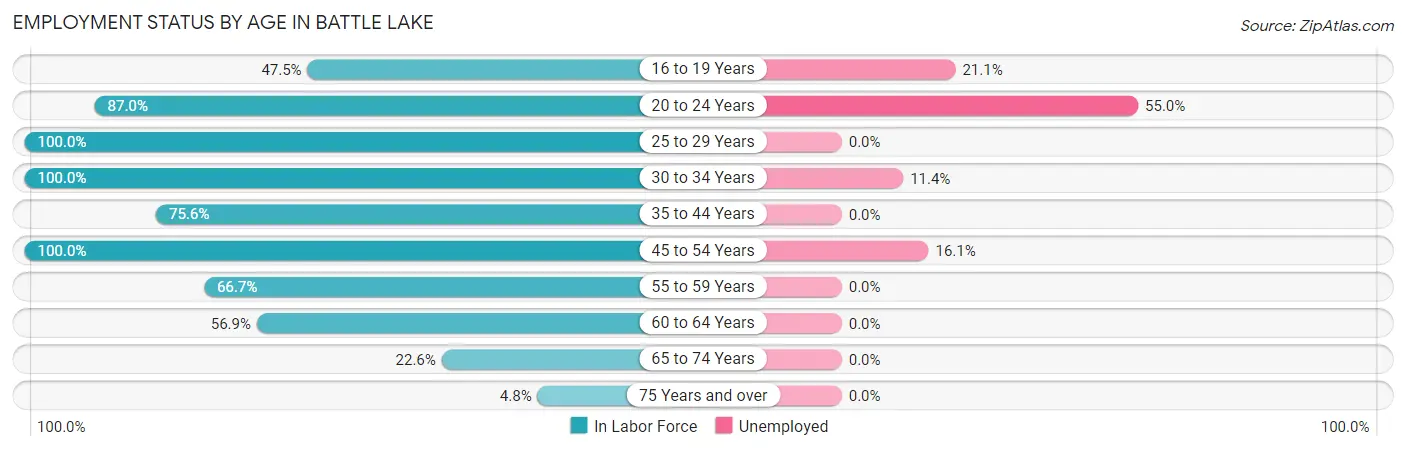
| Age Bracket | In Labor Force | Unemployed |
| 16 to 19 Years | 19 (47.5%) | 4 (21.1%) |
| 20 to 24 Years | 20 (87.0%) | 11 (55.0%) |
| 25 to 29 Years | 35 (100.0%) | 0 (0.0%) |
| 30 to 34 Years | 35 (100.0%) | 4 (11.4%) |
| 35 to 44 Years | 65 (75.6%) | 0 (0.0%) |
| 45 to 54 Years | 31 (100.0%) | 5 (16.1%) |
| 55 to 59 Years | 18 (66.7%) | 0 (0.0%) |
| 60 to 64 Years | 29 (56.9%) | 0 (0.0%) |
| 65 to 74 Years | 30 (22.6%) | 0 (0.0%) |
| 75 Years and over | 8 (4.8%) | 0 (0.0%) |
| Total | 290 (46.3%) | 24 (8.3%) |
Employment Status by Educational Attainment in Battle Lake
According to labor force statistics for Battle Lake, 80.4% of individuals (213) out of the total population between 25 and 64 years of age (265) are in the labor force, with 4.2% or 9 of them being unemployed. The group with the highest labor force participation rate are those with the educational attainment of less than high school, with 100.0% or 3 individuals in the labor force. Within the labor force, individuals with college / associate degree education have the highest percentage of unemployment, with 10.0% or 9 of them being unemployed.
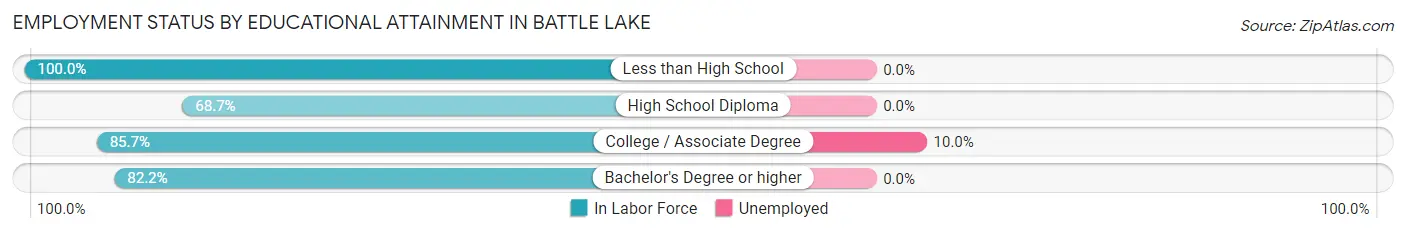
| Educational Attainment | In Labor Force | Unemployed |
| Less than High School | 3 (100.0%) | 0 (0.0%) |
| High School Diploma | 46 (68.7%) | 0 (0.0%) |
| College / Associate Degree | 90 (85.7%) | 10 (10.0%) |
| Bachelor's Degree or higher | 74 (82.2%) | 0 (0.0%) |
| Total | 213 (80.4%) | 11 (4.2%) |
Employment Occupations by Sex in Battle Lake
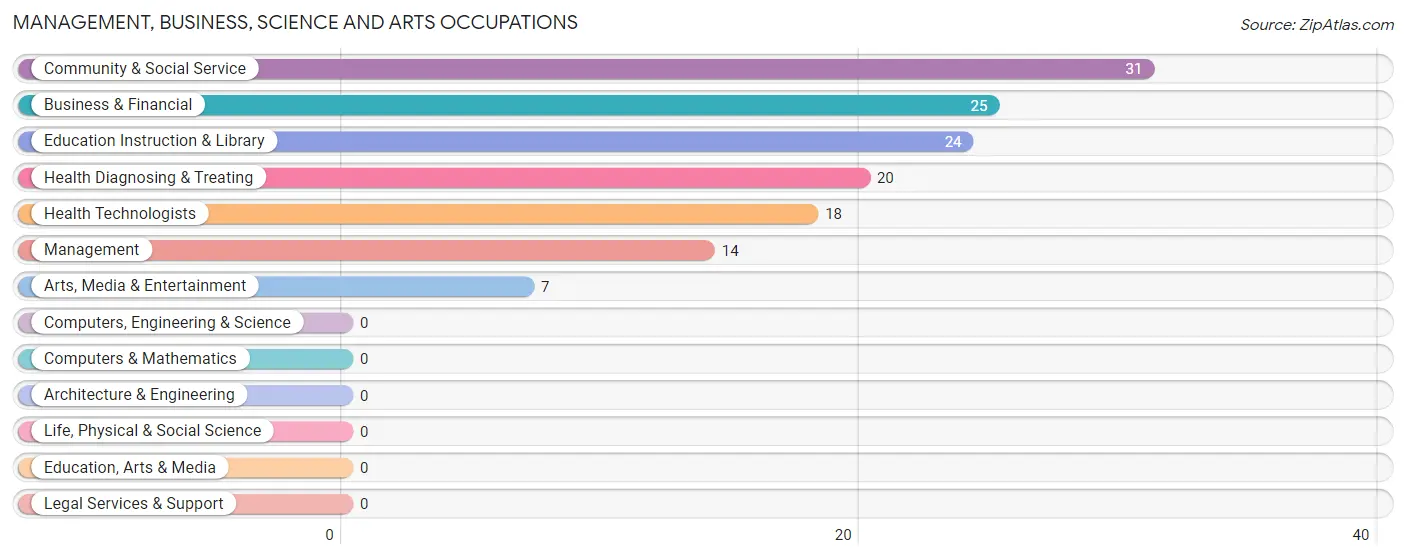
Management, Business, Science and Arts Occupations
The most common Management, Business, Science and Arts occupations in Battle Lake are Community & Social Service (31 | 11.7%), Business & Financial (25 | 9.4%), Education Instruction & Library (24 | 9.0%), Health Diagnosing & Treating (20 | 7.5%), and Health Technologists (18 | 6.8%).
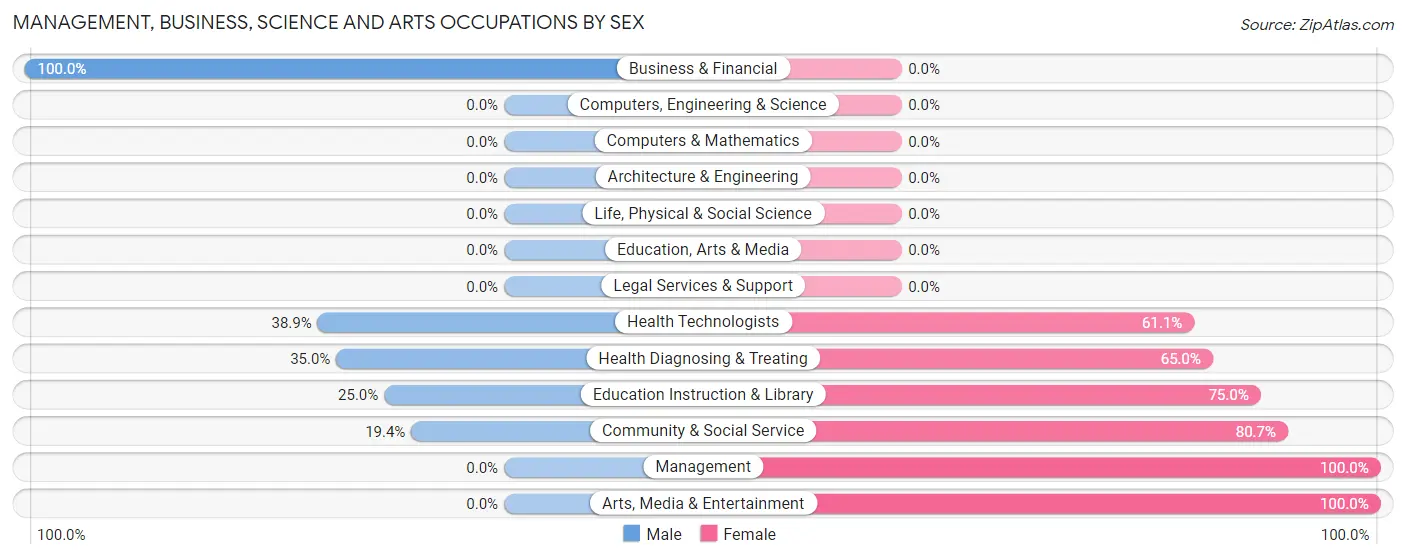
Management, Business, Science and Arts Occupations by Sex
Within the Management, Business, Science and Arts occupations in Battle Lake, the most male-oriented occupations are Business & Financial (100.0%), Health Technologists (38.9%), and Health Diagnosing & Treating (35.0%), while the most female-oriented occupations are Management (100.0%), Arts, Media & Entertainment (100.0%), and Community & Social Service (80.6%).
| Occupation | Male | Female |
| Management | 0 (0.0%) | 14 (100.0%) |
| Business & Financial | 25 (100.0%) | 0 (0.0%) |
| Computers, Engineering & Science | 0 (0.0%) | 0 (0.0%) |
| Computers & Mathematics | 0 (0.0%) | 0 (0.0%) |
| Architecture & Engineering | 0 (0.0%) | 0 (0.0%) |
| Life, Physical & Social Science | 0 (0.0%) | 0 (0.0%) |
| Community & Social Service | 6 (19.4%) | 25 (80.6%) |
| Education, Arts & Media | 0 (0.0%) | 0 (0.0%) |
| Legal Services & Support | 0 (0.0%) | 0 (0.0%) |
| Education Instruction & Library | 6 (25.0%) | 18 (75.0%) |
| Arts, Media & Entertainment | 0 (0.0%) | 7 (100.0%) |
| Health Diagnosing & Treating | 7 (35.0%) | 13 (65.0%) |
| Health Technologists | 7 (38.9%) | 11 (61.1%) |
| Total (Category) | 38 (42.2%) | 52 (57.8%) |
| Total (Overall) | 139 (52.3%) | 127 (47.7%) |
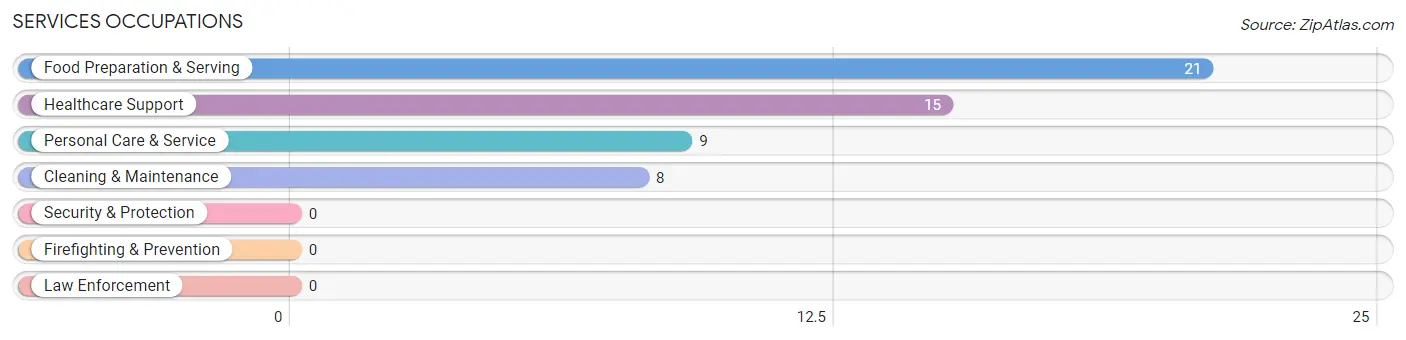
Services Occupations
The most common Services occupations in Battle Lake are Food Preparation & Serving (21 | 7.9%), Healthcare Support (15 | 5.6%), Personal Care & Service (9 | 3.4%), and Cleaning & Maintenance (8 | 3.0%).
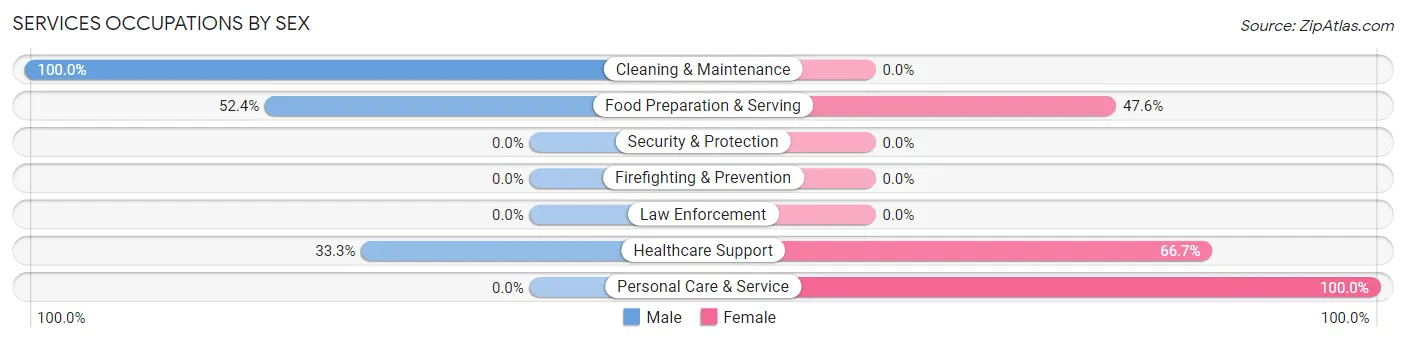
Services Occupations by Sex
Within the Services occupations in Battle Lake, the most male-oriented occupations are Cleaning & Maintenance (100.0%), Food Preparation & Serving (52.4%), and Healthcare Support (33.3%), while the most female-oriented occupations are Personal Care & Service (100.0%), Healthcare Support (66.7%), and Food Preparation & Serving (47.6%).
| Occupation | Male | Female |
| Healthcare Support | 5 (33.3%) | 10 (66.7%) |
| Security & Protection | 0 (0.0%) | 0 (0.0%) |
| Firefighting & Prevention | 0 (0.0%) | 0 (0.0%) |
| Law Enforcement | 0 (0.0%) | 0 (0.0%) |
| Food Preparation & Serving | 11 (52.4%) | 10 (47.6%) |
| Cleaning & Maintenance | 8 (100.0%) | 0 (0.0%) |
| Personal Care & Service | 0 (0.0%) | 9 (100.0%) |
| Total (Category) | 24 (45.3%) | 29 (54.7%) |
| Total (Overall) | 139 (52.3%) | 127 (47.7%) |
Sales and Office Occupations
The most common Sales and Office occupations in Battle Lake are Office & Administration (23 | 8.6%), and Sales & Related (21 | 7.9%).
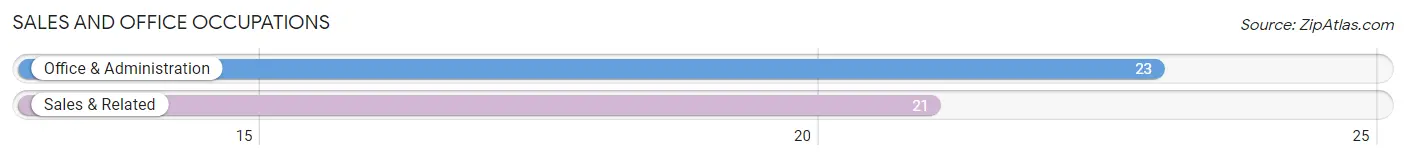
Sales and Office Occupations by Sex
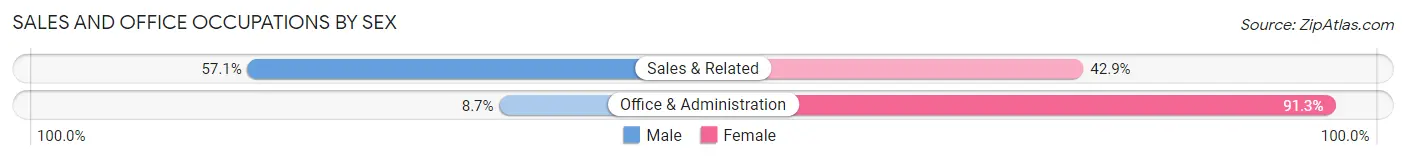
| Occupation | Male | Female |
| Sales & Related | 12 (57.1%) | 9 (42.9%) |
| Office & Administration | 2 (8.7%) | 21 (91.3%) |
| Total (Category) | 14 (31.8%) | 30 (68.2%) |
| Total (Overall) | 139 (52.3%) | 127 (47.7%) |
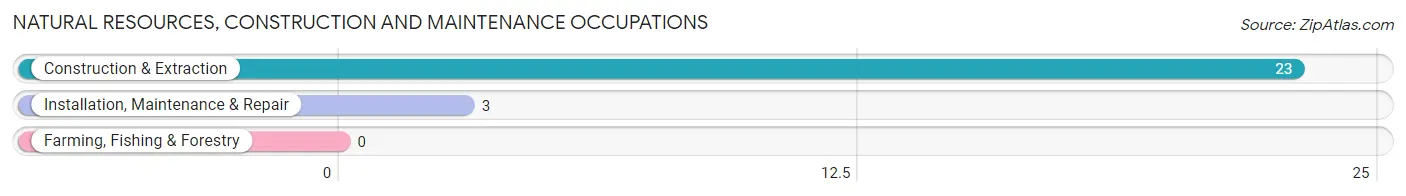
Natural Resources, Construction and Maintenance Occupations
The most common Natural Resources, Construction and Maintenance occupations in Battle Lake are Construction & Extraction (23 | 8.6%), and Installation, Maintenance & Repair (3 | 1.1%).
Natural Resources, Construction and Maintenance Occupations by Sex
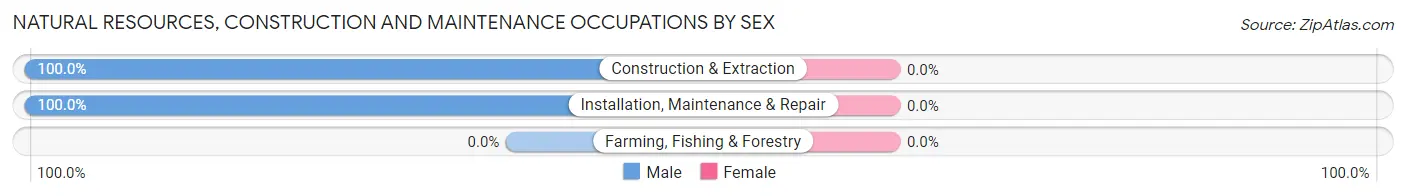
| Occupation | Male | Female |
| Farming, Fishing & Forestry | 0 (0.0%) | 0 (0.0%) |
| Construction & Extraction | 23 (100.0%) | 0 (0.0%) |
| Installation, Maintenance & Repair | 3 (100.0%) | 0 (0.0%) |
| Total (Category) | 26 (100.0%) | 0 (0.0%) |
| Total (Overall) | 139 (52.3%) | 127 (47.7%) |
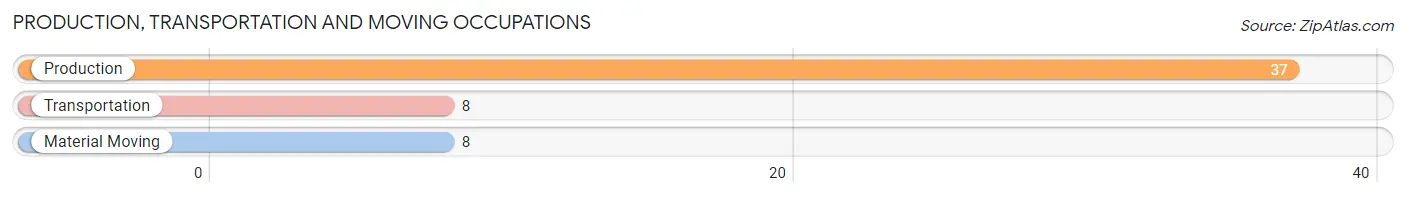
Production, Transportation and Moving Occupations
The most common Production, Transportation and Moving occupations in Battle Lake are Production (37 | 13.9%), Transportation (8 | 3.0%), and Material Moving (8 | 3.0%).
Production, Transportation and Moving Occupations by Sex
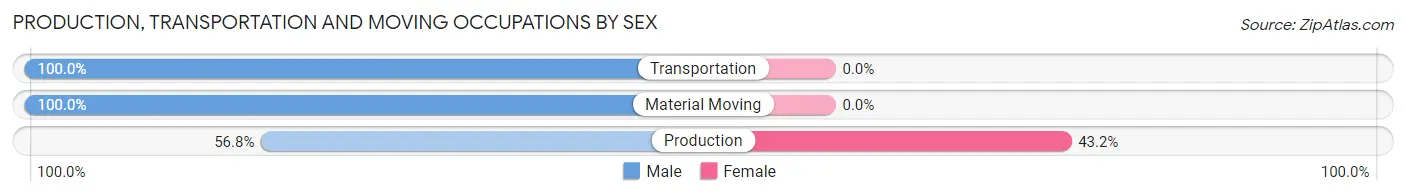
| Occupation | Male | Female |
| Production | 21 (56.8%) | 16 (43.2%) |
| Transportation | 8 (100.0%) | 0 (0.0%) |
| Material Moving | 8 (100.0%) | 0 (0.0%) |
| Total (Category) | 37 (69.8%) | 16 (30.2%) |
| Total (Overall) | 139 (52.3%) | 127 (47.7%) |
Employment Industries by Sex in Battle Lake
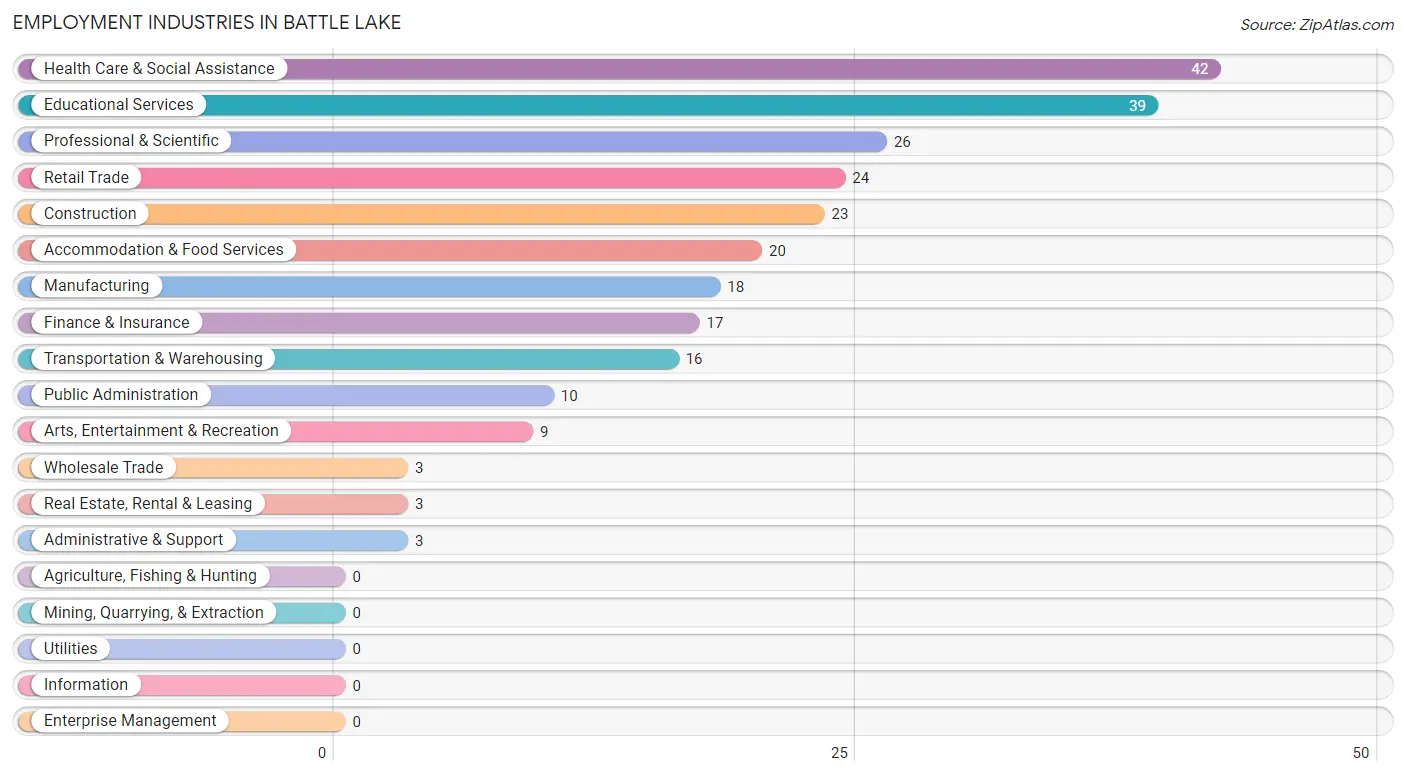
Employment Industries in Battle Lake
The major employment industries in Battle Lake include Health Care & Social Assistance (42 | 15.8%), Educational Services (39 | 14.7%), Professional & Scientific (26 | 9.8%), Retail Trade (24 | 9.0%), and Construction (23 | 8.6%).
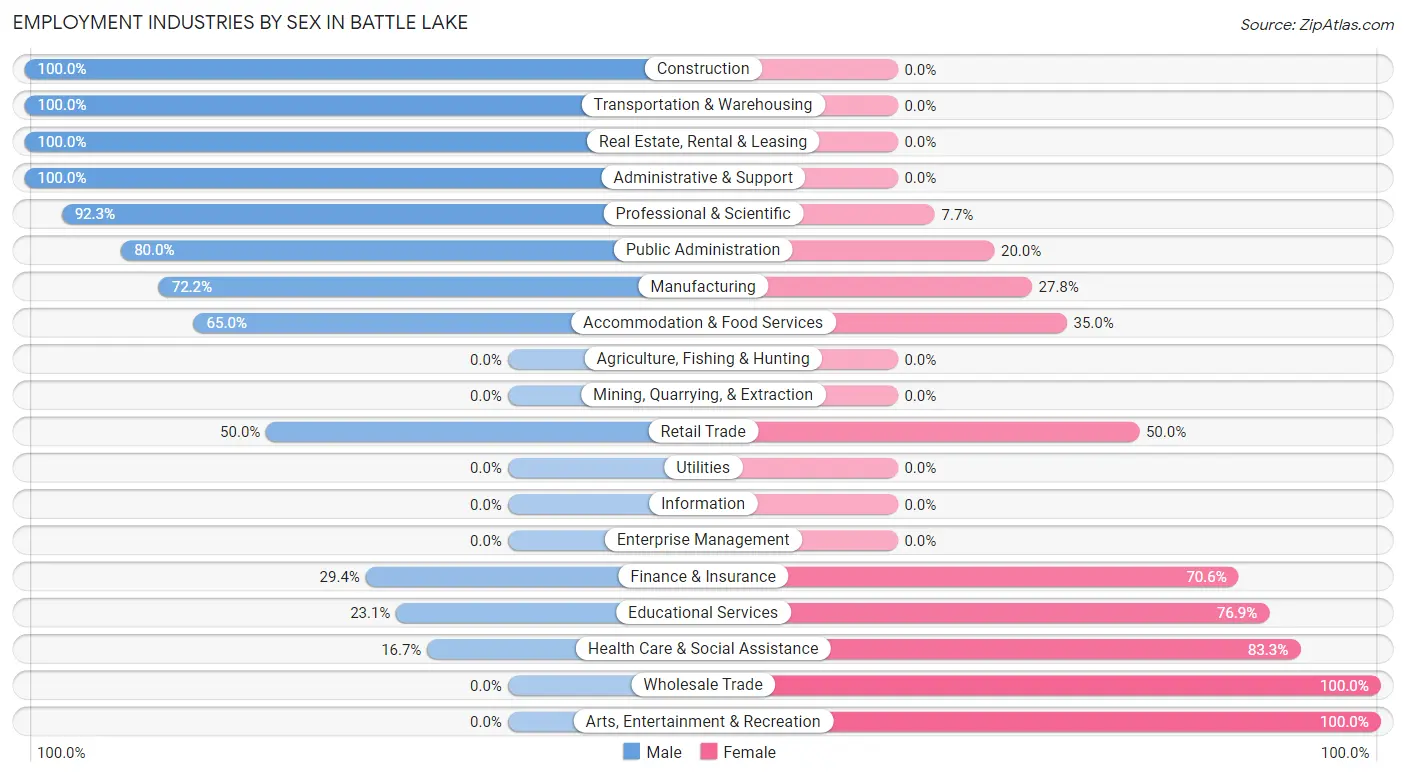
Employment Industries by Sex in Battle Lake
The Battle Lake industries that see more men than women are Construction (100.0%), Transportation & Warehousing (100.0%), and Real Estate, Rental & Leasing (100.0%), whereas the industries that tend to have a higher number of women are Wholesale Trade (100.0%), Arts, Entertainment & Recreation (100.0%), and Health Care & Social Assistance (83.3%).
| Industry | Male | Female |
| Agriculture, Fishing & Hunting | 0 (0.0%) | 0 (0.0%) |
| Mining, Quarrying, & Extraction | 0 (0.0%) | 0 (0.0%) |
| Construction | 23 (100.0%) | 0 (0.0%) |
| Manufacturing | 13 (72.2%) | 5 (27.8%) |
| Wholesale Trade | 0 (0.0%) | 3 (100.0%) |
| Retail Trade | 12 (50.0%) | 12 (50.0%) |
| Transportation & Warehousing | 16 (100.0%) | 0 (0.0%) |
| Utilities | 0 (0.0%) | 0 (0.0%) |
| Information | 0 (0.0%) | 0 (0.0%) |
| Finance & Insurance | 5 (29.4%) | 12 (70.6%) |
| Real Estate, Rental & Leasing | 3 (100.0%) | 0 (0.0%) |
| Professional & Scientific | 24 (92.3%) | 2 (7.7%) |
| Enterprise Management | 0 (0.0%) | 0 (0.0%) |
| Administrative & Support | 3 (100.0%) | 0 (0.0%) |
| Educational Services | 9 (23.1%) | 30 (76.9%) |
| Health Care & Social Assistance | 7 (16.7%) | 35 (83.3%) |
| Arts, Entertainment & Recreation | 0 (0.0%) | 9 (100.0%) |
| Accommodation & Food Services | 13 (65.0%) | 7 (35.0%) |
| Public Administration | 8 (80.0%) | 2 (20.0%) |
| Total | 139 (52.3%) | 127 (47.7%) |
Education in Battle Lake
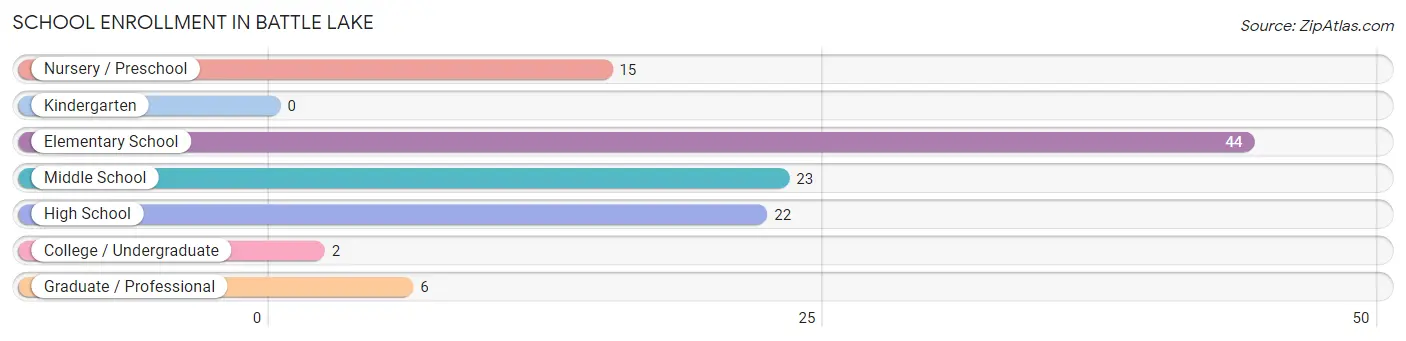
School Enrollment in Battle Lake
The most common levels of schooling among the 112 students in Battle Lake are elementary school (44 | 39.3%), middle school (23 | 20.5%), and high school (22 | 19.6%).
| School Level | # Students | % Students |
| Nursery / Preschool | 15 | 13.4% |
| Kindergarten | 0 | 0.0% |
| Elementary School | 44 | 39.3% |
| Middle School | 23 | 20.5% |
| High School | 22 | 19.6% |
| College / Undergraduate | 2 | 1.8% |
| Graduate / Professional | 6 | 5.4% |
| Total | 112 | 100.0% |
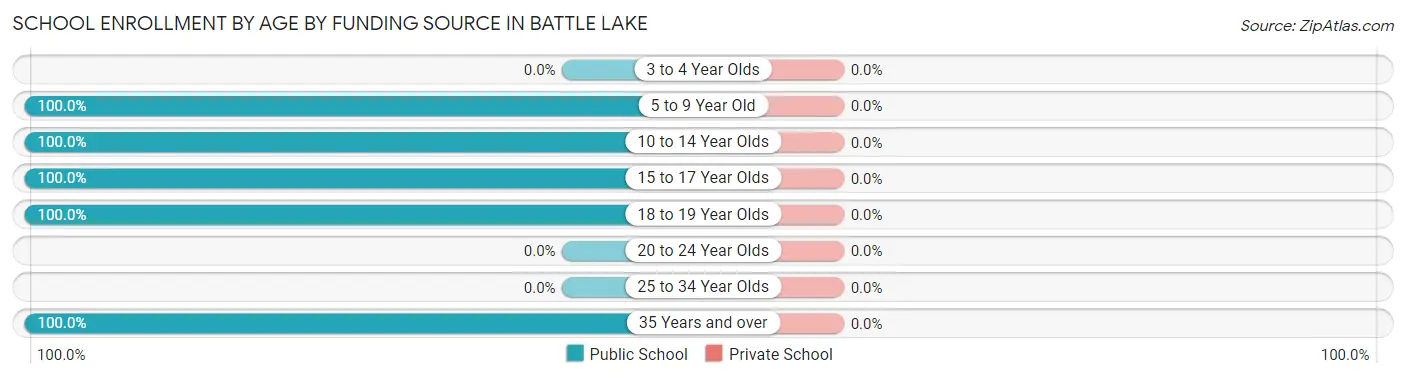
School Enrollment by Age by Funding Source in Battle Lake
| Age Bracket | Public School | Private School |
| 3 to 4 Year Olds | 0 (0.0%) | 0 (0.0%) |
| 5 to 9 Year Old | 54 (100.0%) | 0 (0.0%) |
| 10 to 14 Year Olds | 19 (100.0%) | 0 (0.0%) |
| 15 to 17 Year Olds | 27 (100.0%) | 0 (0.0%) |
| 18 to 19 Year Olds | 4 (100.0%) | 0 (0.0%) |
| 20 to 24 Year Olds | 0 (0.0%) | 0 (0.0%) |
| 25 to 34 Year Olds | 0 (0.0%) | 0 (0.0%) |
| 35 Years and over | 8 (100.0%) | 0 (0.0%) |
| Total | 112 (100.0%) | 0 (0.0%) |
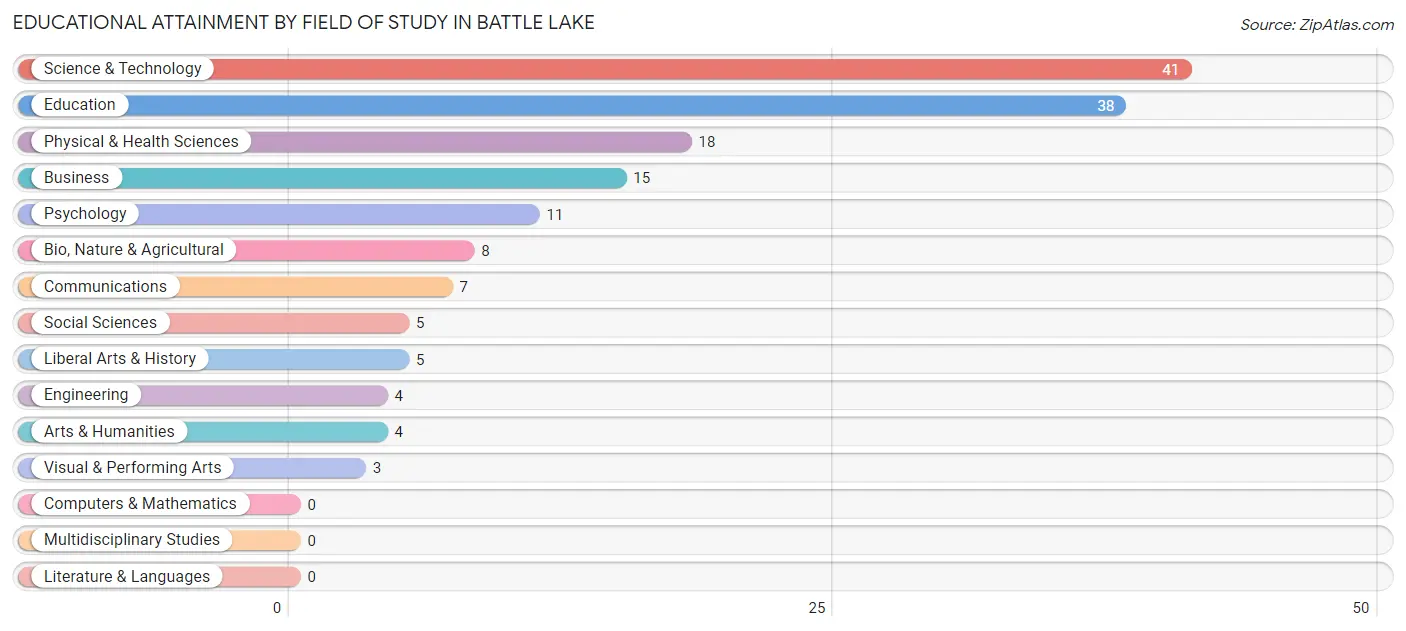
Educational Attainment by Field of Study in Battle Lake
Science & technology (41 | 25.8%), education (38 | 23.9%), physical & health sciences (18 | 11.3%), business (15 | 9.4%), and psychology (11 | 6.9%) are the most common fields of study among 159 individuals in Battle Lake who have obtained a bachelor's degree or higher.
| Field of Study | # Graduates | % Graduates |
| Computers & Mathematics | 0 | 0.0% |
| Bio, Nature & Agricultural | 8 | 5.0% |
| Physical & Health Sciences | 18 | 11.3% |
| Psychology | 11 | 6.9% |
| Social Sciences | 5 | 3.1% |
| Engineering | 4 | 2.5% |
| Multidisciplinary Studies | 0 | 0.0% |
| Science & Technology | 41 | 25.8% |
| Business | 15 | 9.4% |
| Education | 38 | 23.9% |
| Literature & Languages | 0 | 0.0% |
| Liberal Arts & History | 5 | 3.1% |
| Visual & Performing Arts | 3 | 1.9% |
| Communications | 7 | 4.4% |
| Arts & Humanities | 4 | 2.5% |
| Total | 159 | 100.0% |
Transportation & Commute in Battle Lake
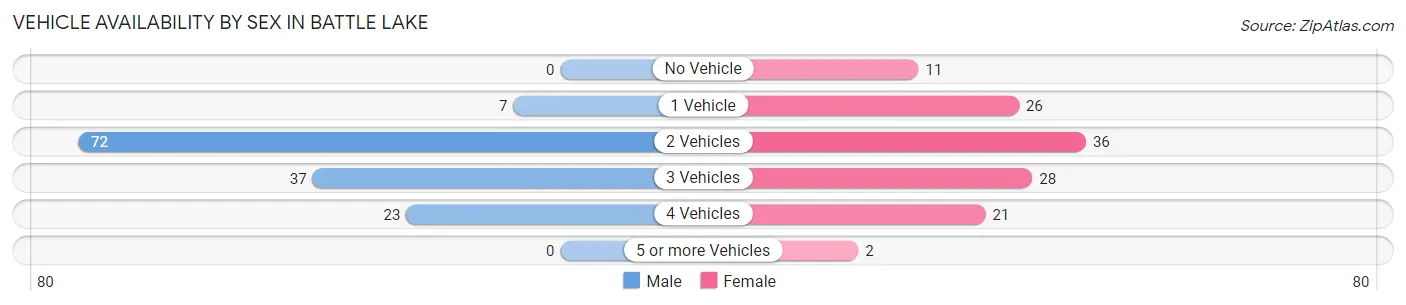
Vehicle Availability by Sex in Battle Lake
The most prevalent vehicle ownership categories in Battle Lake are males with 2 vehicles (72, accounting for 51.8%) and females with 2 vehicles (36, making up 58.1%).
| Vehicles Available | Male | Female |
| No Vehicle | 0 (0.0%) | 11 (8.9%) |
| 1 Vehicle | 7 (5.0%) | 26 (21.0%) |
| 2 Vehicles | 72 (51.8%) | 36 (29.0%) |
| 3 Vehicles | 37 (26.6%) | 28 (22.6%) |
| 4 Vehicles | 23 (16.6%) | 21 (16.9%) |
| 5 or more Vehicles | 0 (0.0%) | 2 (1.6%) |
| Total | 139 (100.0%) | 124 (100.0%) |
Commute Time in Battle Lake
The most frequently occuring commute durations in Battle Lake are 5 to 9 minutes (70 commuters, 27.7%), 30 to 34 minutes (41 commuters, 16.2%), and less than 5 minutes (30 commuters, 11.9%).
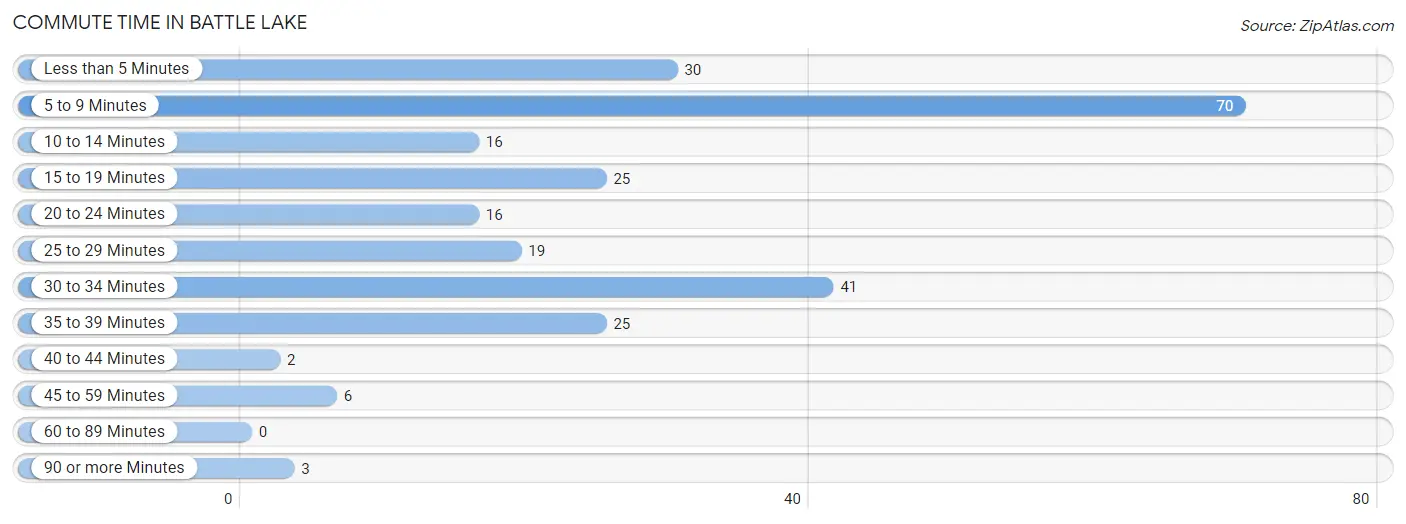
| Commute Time | # Commuters | % Commuters |
| Less than 5 Minutes | 30 | 11.9% |
| 5 to 9 Minutes | 70 | 27.7% |
| 10 to 14 Minutes | 16 | 6.3% |
| 15 to 19 Minutes | 25 | 9.9% |
| 20 to 24 Minutes | 16 | 6.3% |
| 25 to 29 Minutes | 19 | 7.5% |
| 30 to 34 Minutes | 41 | 16.2% |
| 35 to 39 Minutes | 25 | 9.9% |
| 40 to 44 Minutes | 2 | 0.8% |
| 45 to 59 Minutes | 6 | 2.4% |
| 60 to 89 Minutes | 0 | 0.0% |
| 90 or more Minutes | 3 | 1.2% |
Commute Time by Sex in Battle Lake
The most common commute times in Battle Lake are 5 to 9 minutes (34 commuters, 24.5%) for males and 5 to 9 minutes (36 commuters, 31.6%) for females.
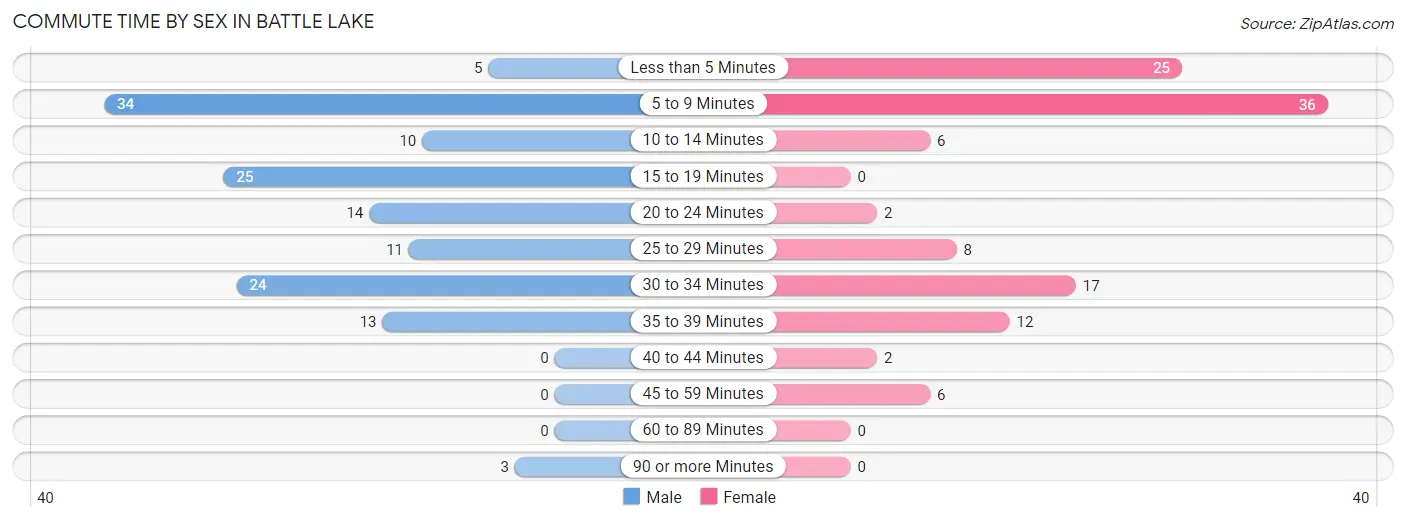
| Commute Time | Male | Female |
| Less than 5 Minutes | 5 (3.6%) | 25 (21.9%) |
| 5 to 9 Minutes | 34 (24.5%) | 36 (31.6%) |
| 10 to 14 Minutes | 10 (7.2%) | 6 (5.3%) |
| 15 to 19 Minutes | 25 (18.0%) | 0 (0.0%) |
| 20 to 24 Minutes | 14 (10.1%) | 2 (1.8%) |
| 25 to 29 Minutes | 11 (7.9%) | 8 (7.0%) |
| 30 to 34 Minutes | 24 (17.3%) | 17 (14.9%) |
| 35 to 39 Minutes | 13 (9.3%) | 12 (10.5%) |
| 40 to 44 Minutes | 0 (0.0%) | 2 (1.8%) |
| 45 to 59 Minutes | 0 (0.0%) | 6 (5.3%) |
| 60 to 89 Minutes | 0 (0.0%) | 0 (0.0%) |
| 90 or more Minutes | 3 (2.2%) | 0 (0.0%) |
Time of Departure to Work by Sex in Battle Lake
The most frequent times of departure to work in Battle Lake are 7:00 AM to 7:29 AM (41, 29.5%) for males and 4:00 PM to 11:59 PM (32, 28.1%) for females.
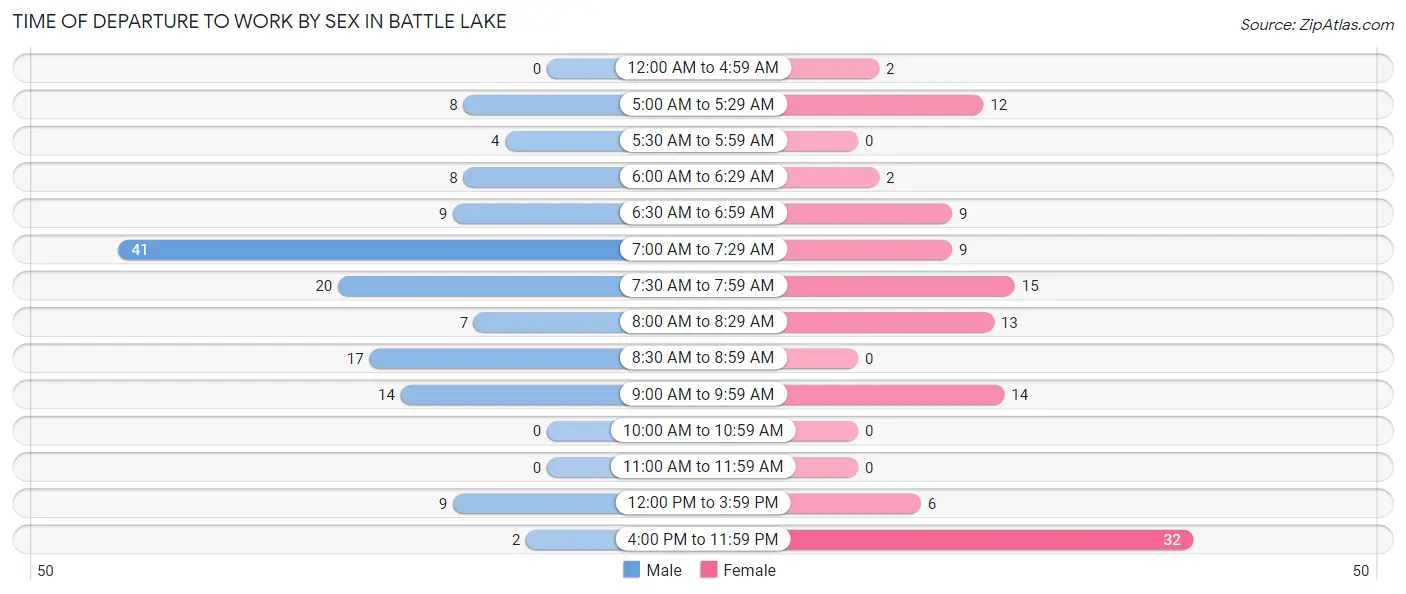
| Time of Departure | Male | Female |
| 12:00 AM to 4:59 AM | 0 (0.0%) | 2 (1.8%) |
| 5:00 AM to 5:29 AM | 8 (5.8%) | 12 (10.5%) |
| 5:30 AM to 5:59 AM | 4 (2.9%) | 0 (0.0%) |
| 6:00 AM to 6:29 AM | 8 (5.8%) | 2 (1.8%) |
| 6:30 AM to 6:59 AM | 9 (6.5%) | 9 (7.9%) |
| 7:00 AM to 7:29 AM | 41 (29.5%) | 9 (7.9%) |
| 7:30 AM to 7:59 AM | 20 (14.4%) | 15 (13.2%) |
| 8:00 AM to 8:29 AM | 7 (5.0%) | 13 (11.4%) |
| 8:30 AM to 8:59 AM | 17 (12.2%) | 0 (0.0%) |
| 9:00 AM to 9:59 AM | 14 (10.1%) | 14 (12.3%) |
| 10:00 AM to 10:59 AM | 0 (0.0%) | 0 (0.0%) |
| 11:00 AM to 11:59 AM | 0 (0.0%) | 0 (0.0%) |
| 12:00 PM to 3:59 PM | 9 (6.5%) | 6 (5.3%) |
| 4:00 PM to 11:59 PM | 2 (1.4%) | 32 (28.1%) |
| Total | 139 (100.0%) | 114 (100.0%) |
Housing Occupancy in Battle Lake
Occupancy by Ownership in Battle Lake
Of the total 332 dwellings in Battle Lake, owner-occupied units account for 224 (67.5%), while renter-occupied units make up 108 (32.5%).
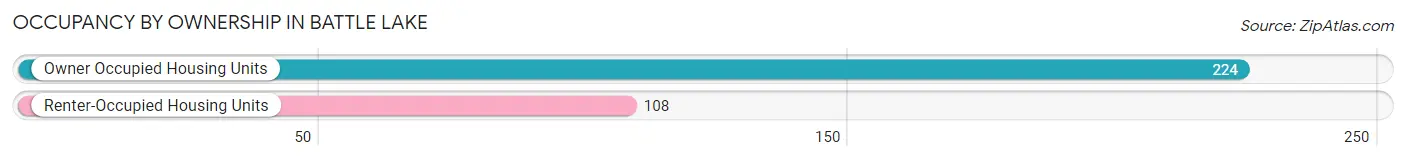
| Occupancy | # Housing Units | % Housing Units |
| Owner Occupied Housing Units | 224 | 67.5% |
| Renter-Occupied Housing Units | 108 | 32.5% |
| Total Occupied Housing Units | 332 | 100.0% |
Occupancy by Household Size in Battle Lake
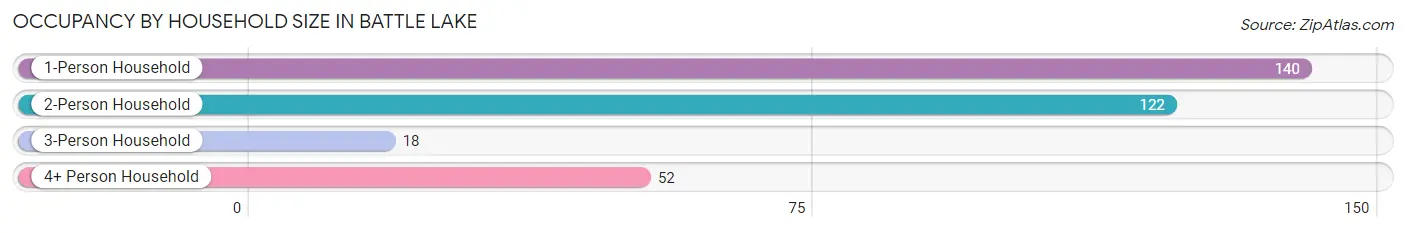
| Household Size | # Housing Units | % Housing Units |
| 1-Person Household | 140 | 42.2% |
| 2-Person Household | 122 | 36.7% |
| 3-Person Household | 18 | 5.4% |
| 4+ Person Household | 52 | 15.7% |
| Total Housing Units | 332 | 100.0% |
Occupancy by Ownership by Household Size in Battle Lake
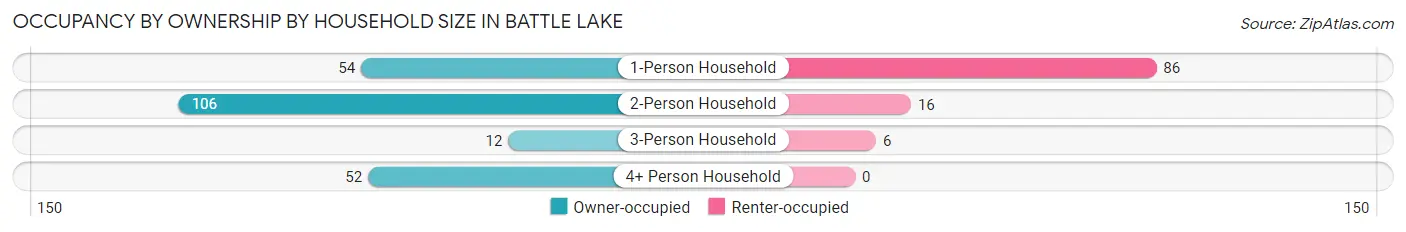
| Household Size | Owner-occupied | Renter-occupied |
| 1-Person Household | 54 (38.6%) | 86 (61.4%) |
| 2-Person Household | 106 (86.9%) | 16 (13.1%) |
| 3-Person Household | 12 (66.7%) | 6 (33.3%) |
| 4+ Person Household | 52 (100.0%) | 0 (0.0%) |
| Total Housing Units | 224 (67.5%) | 108 (32.5%) |
Occupancy by Educational Attainment in Battle Lake
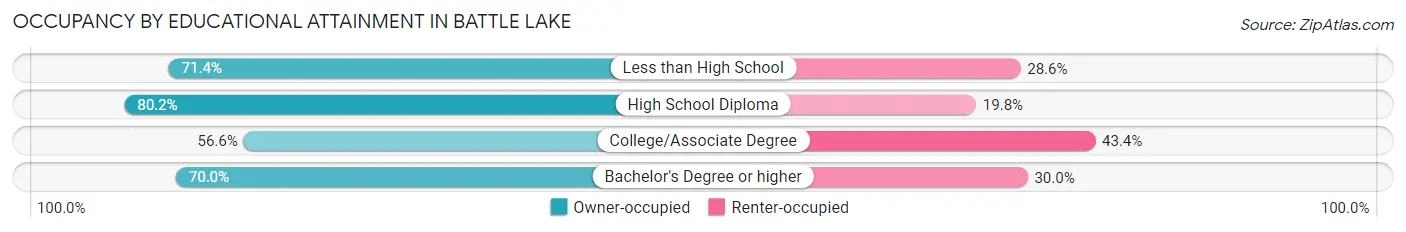
| Household Size | Owner-occupied | Renter-occupied |
| Less than High School | 5 (71.4%) | 2 (28.6%) |
| High School Diploma | 69 (80.2%) | 17 (19.8%) |
| College/Associate Degree | 73 (56.6%) | 56 (43.4%) |
| Bachelor's Degree or higher | 77 (70.0%) | 33 (30.0%) |
Occupancy by Age of Householder in Battle Lake
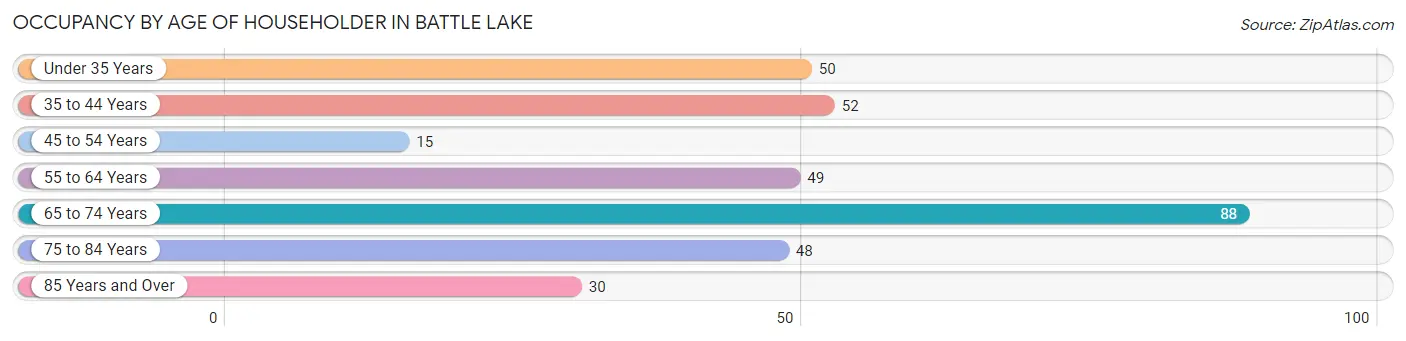
| Age Bracket | # Households | % Households |
| Under 35 Years | 50 | 15.1% |
| 35 to 44 Years | 52 | 15.7% |
| 45 to 54 Years | 15 | 4.5% |
| 55 to 64 Years | 49 | 14.8% |
| 65 to 74 Years | 88 | 26.5% |
| 75 to 84 Years | 48 | 14.5% |
| 85 Years and Over | 30 | 9.0% |
| Total | 332 | 100.0% |
Housing Finances in Battle Lake
Median Income by Occupancy in Battle Lake
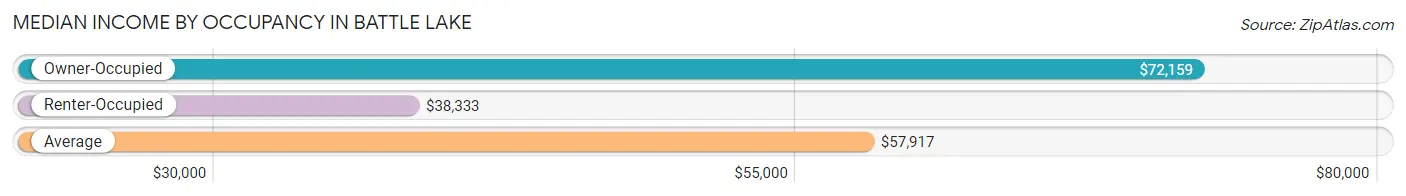
| Occupancy Type | # Households | Median Income |
| Owner-Occupied | 224 (67.5%) | $72,159 |
| Renter-Occupied | 108 (32.5%) | $38,333 |
| Average | 332 (100.0%) | $57,917 |
Occupancy by Householder Income Bracket in Battle Lake
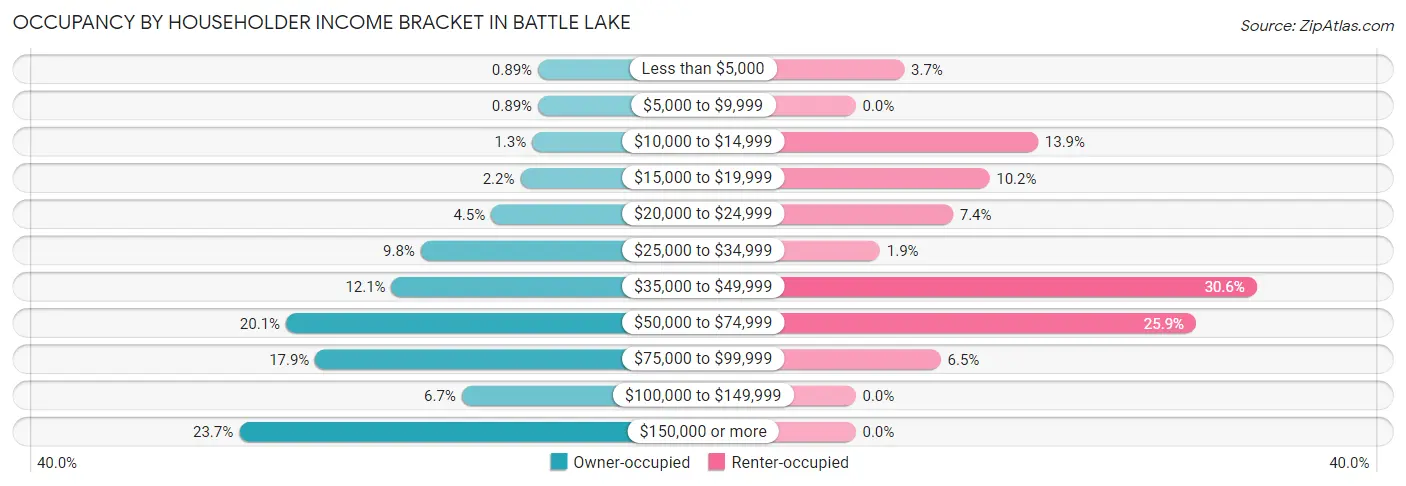
| Income Bracket | Owner-occupied | Renter-occupied |
| Less than $5,000 | 2 (0.9%) | 4 (3.7%) |
| $5,000 to $9,999 | 2 (0.9%) | 0 (0.0%) |
| $10,000 to $14,999 | 3 (1.3%) | 15 (13.9%) |
| $15,000 to $19,999 | 5 (2.2%) | 11 (10.2%) |
| $20,000 to $24,999 | 10 (4.5%) | 8 (7.4%) |
| $25,000 to $34,999 | 22 (9.8%) | 2 (1.8%) |
| $35,000 to $49,999 | 27 (12.0%) | 33 (30.6%) |
| $50,000 to $74,999 | 45 (20.1%) | 28 (25.9%) |
| $75,000 to $99,999 | 40 (17.9%) | 7 (6.5%) |
| $100,000 to $149,999 | 15 (6.7%) | 0 (0.0%) |
| $150,000 or more | 53 (23.7%) | 0 (0.0%) |
| Total | 224 (100.0%) | 108 (100.0%) |
Monthly Housing Cost Tiers in Battle Lake
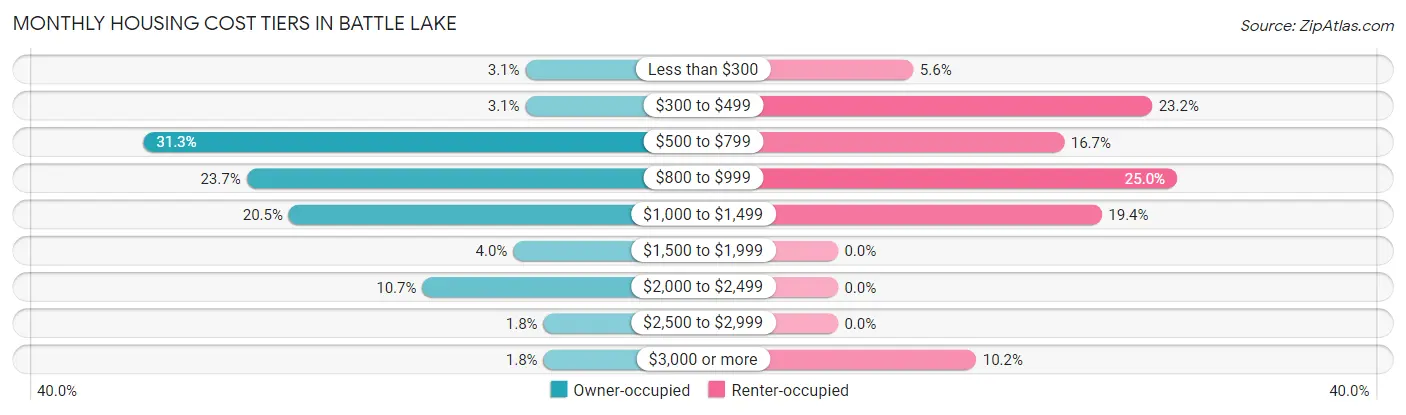
| Monthly Cost | Owner-occupied | Renter-occupied |
| Less than $300 | 7 (3.1%) | 6 (5.6%) |
| $300 to $499 | 7 (3.1%) | 25 (23.2%) |
| $500 to $799 | 70 (31.2%) | 18 (16.7%) |
| $800 to $999 | 53 (23.7%) | 27 (25.0%) |
| $1,000 to $1,499 | 46 (20.5%) | 21 (19.4%) |
| $1,500 to $1,999 | 9 (4.0%) | 0 (0.0%) |
| $2,000 to $2,499 | 24 (10.7%) | 0 (0.0%) |
| $2,500 to $2,999 | 4 (1.8%) | 0 (0.0%) |
| $3,000 or more | 4 (1.8%) | 11 (10.2%) |
| Total | 224 (100.0%) | 108 (100.0%) |
Physical Housing Characteristics in Battle Lake
Housing Structures in Battle Lake
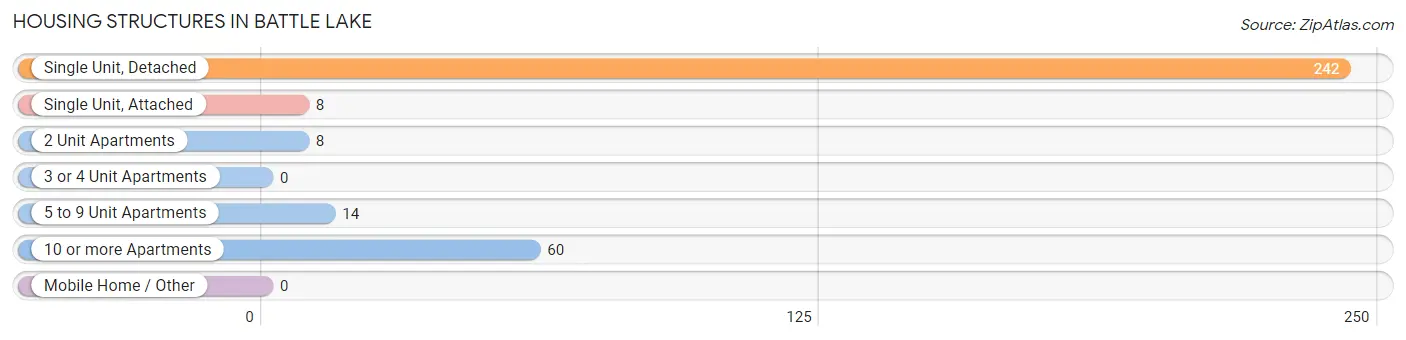
| Structure Type | # Housing Units | % Housing Units |
| Single Unit, Detached | 242 | 72.9% |
| Single Unit, Attached | 8 | 2.4% |
| 2 Unit Apartments | 8 | 2.4% |
| 3 or 4 Unit Apartments | 0 | 0.0% |
| 5 to 9 Unit Apartments | 14 | 4.2% |
| 10 or more Apartments | 60 | 18.1% |
| Mobile Home / Other | 0 | 0.0% |
| Total | 332 | 100.0% |
Housing Structures by Occupancy in Battle Lake
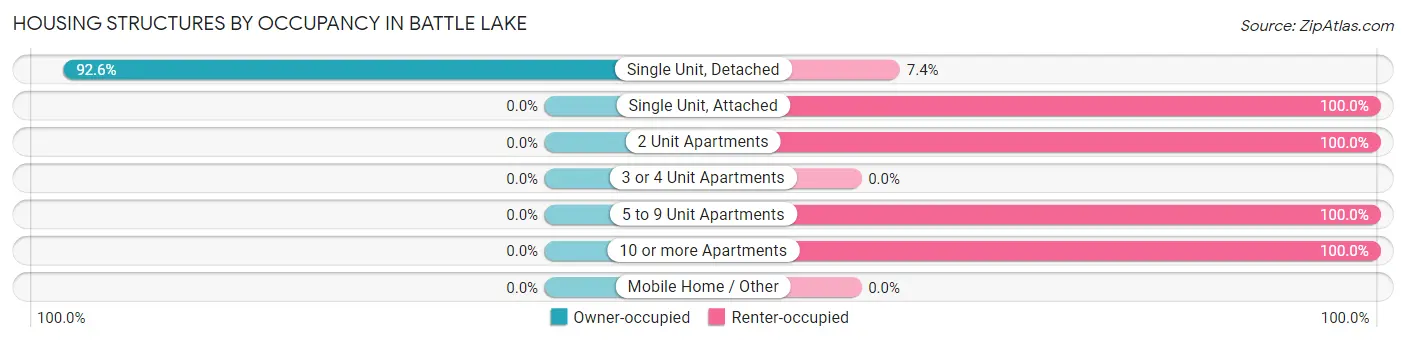
| Structure Type | Owner-occupied | Renter-occupied |
| Single Unit, Detached | 224 (92.6%) | 18 (7.4%) |
| Single Unit, Attached | 0 (0.0%) | 8 (100.0%) |
| 2 Unit Apartments | 0 (0.0%) | 8 (100.0%) |
| 3 or 4 Unit Apartments | 0 (0.0%) | 0 (0.0%) |
| 5 to 9 Unit Apartments | 0 (0.0%) | 14 (100.0%) |
| 10 or more Apartments | 0 (0.0%) | 60 (100.0%) |
| Mobile Home / Other | 0 (0.0%) | 0 (0.0%) |
| Total | 224 (67.5%) | 108 (32.5%) |
Housing Structures by Number of Rooms in Battle Lake
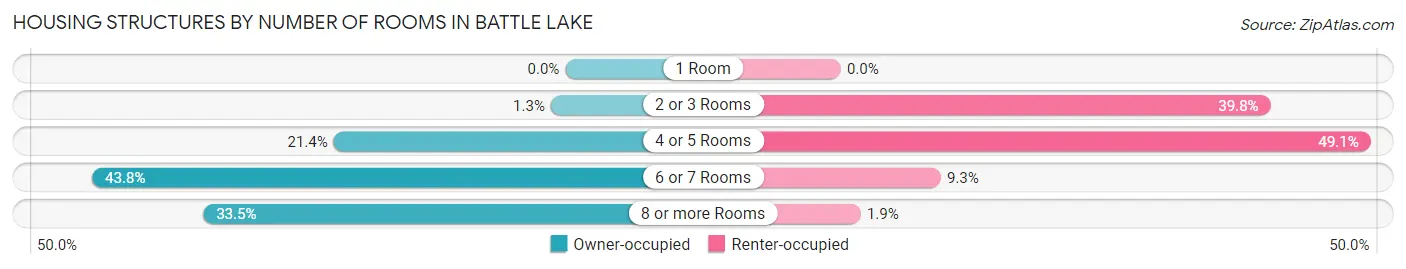
| Number of Rooms | Owner-occupied | Renter-occupied |
| 1 Room | 0 (0.0%) | 0 (0.0%) |
| 2 or 3 Rooms | 3 (1.3%) | 43 (39.8%) |
| 4 or 5 Rooms | 48 (21.4%) | 53 (49.1%) |
| 6 or 7 Rooms | 98 (43.8%) | 10 (9.3%) |
| 8 or more Rooms | 75 (33.5%) | 2 (1.8%) |
| Total | 224 (100.0%) | 108 (100.0%) |
Housing Structure by Heating Type in Battle Lake
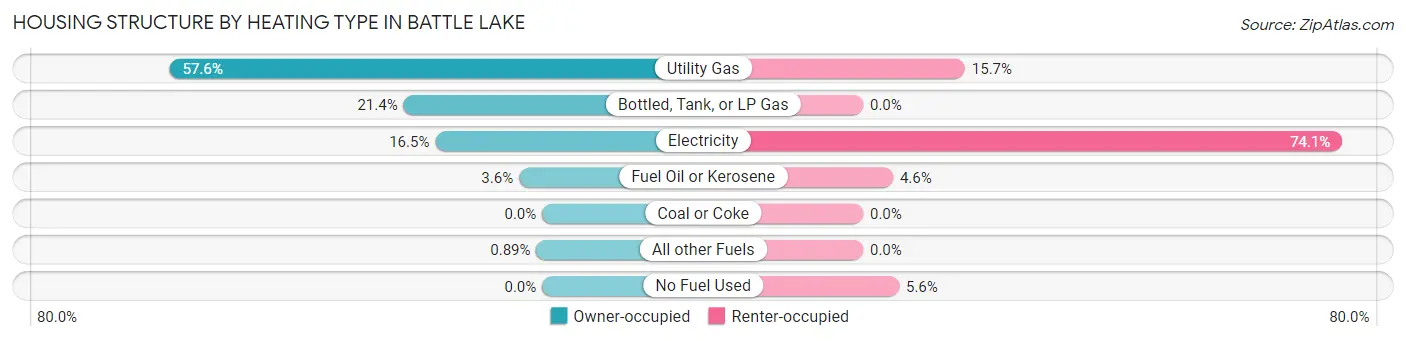
| Heating Type | Owner-occupied | Renter-occupied |
| Utility Gas | 129 (57.6%) | 17 (15.7%) |
| Bottled, Tank, or LP Gas | 48 (21.4%) | 0 (0.0%) |
| Electricity | 37 (16.5%) | 80 (74.1%) |
| Fuel Oil or Kerosene | 8 (3.6%) | 5 (4.6%) |
| Coal or Coke | 0 (0.0%) | 0 (0.0%) |
| All other Fuels | 2 (0.9%) | 0 (0.0%) |
| No Fuel Used | 0 (0.0%) | 6 (5.6%) |
| Total | 224 (100.0%) | 108 (100.0%) |
Household Vehicle Usage in Battle Lake
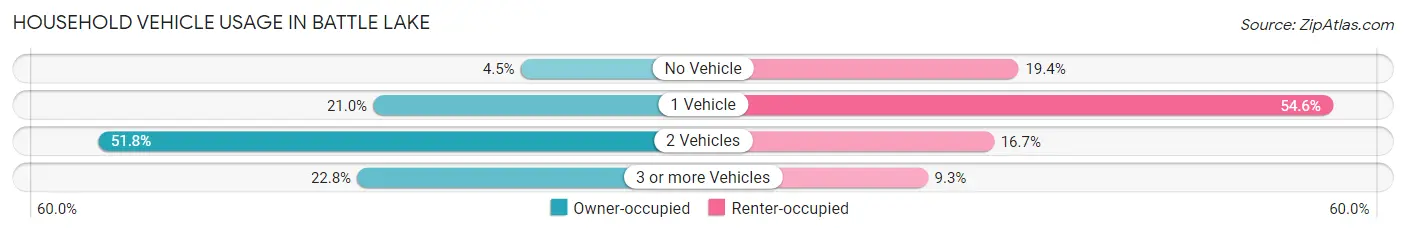
| Vehicles per Household | Owner-occupied | Renter-occupied |
| No Vehicle | 10 (4.5%) | 21 (19.4%) |
| 1 Vehicle | 47 (21.0%) | 59 (54.6%) |
| 2 Vehicles | 116 (51.8%) | 18 (16.7%) |
| 3 or more Vehicles | 51 (22.8%) | 10 (9.3%) |
| Total | 224 (100.0%) | 108 (100.0%) |
Real Estate & Mortgages in Battle Lake
Real Estate and Mortgage Overview in Battle Lake
| Characteristic | Without Mortgage | With Mortgage |
| Housing Units | 99 | 125 |
| Median Property Value | $259,400 | $201,500 |
| Median Household Income | $70,966 | $35 |
| Monthly Housing Costs | $613 | $0 |
| Real Estate Taxes | $2,557 | $1 |
Property Value by Mortgage Status in Battle Lake
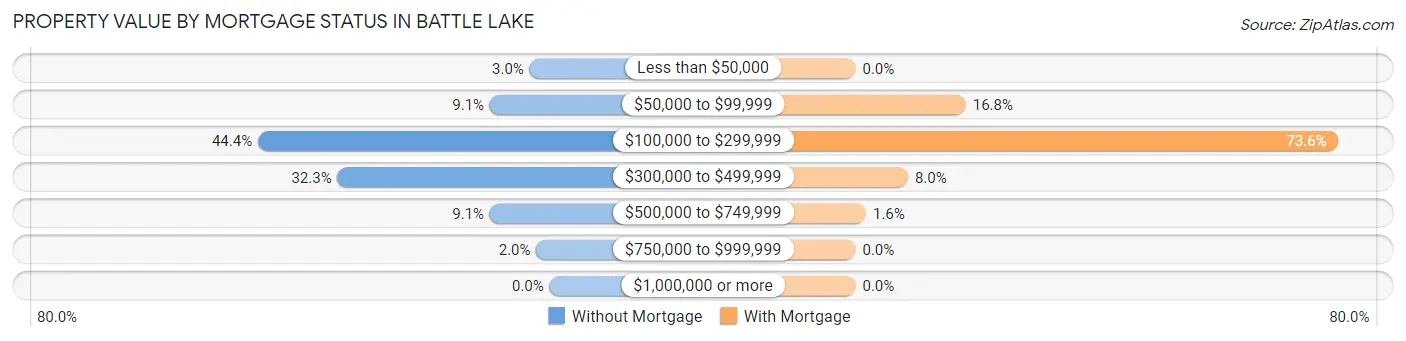
| Property Value | Without Mortgage | With Mortgage |
| Less than $50,000 | 3 (3.0%) | 0 (0.0%) |
| $50,000 to $99,999 | 9 (9.1%) | 21 (16.8%) |
| $100,000 to $299,999 | 44 (44.4%) | 92 (73.6%) |
| $300,000 to $499,999 | 32 (32.3%) | 10 (8.0%) |
| $500,000 to $749,999 | 9 (9.1%) | 2 (1.6%) |
| $750,000 to $999,999 | 2 (2.0%) | 0 (0.0%) |
| $1,000,000 or more | 0 (0.0%) | 0 (0.0%) |
| Total | 99 (100.0%) | 125 (100.0%) |
Household Income by Mortgage Status in Battle Lake
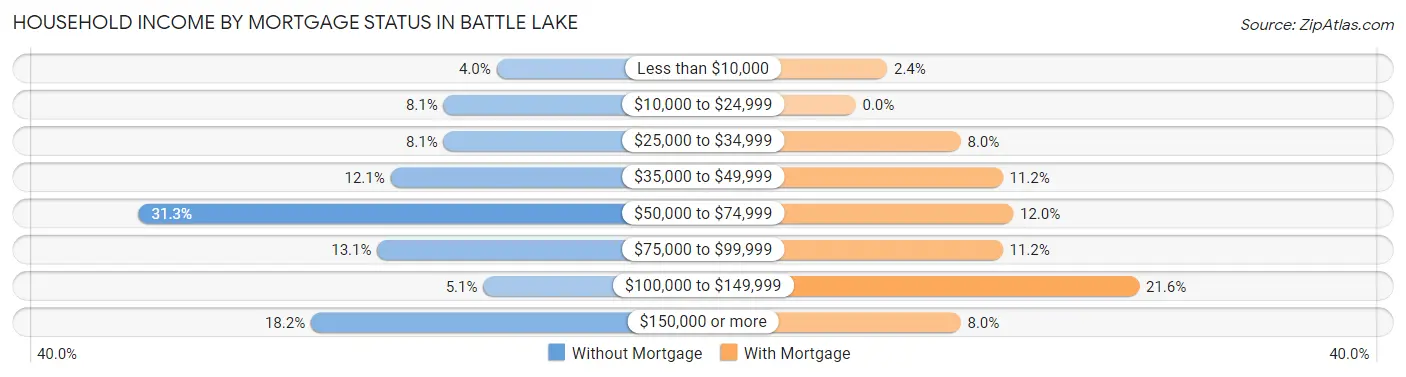
| Household Income | Without Mortgage | With Mortgage |
| Less than $10,000 | 4 (4.0%) | 3 (2.4%) |
| $10,000 to $24,999 | 8 (8.1%) | 0 (0.0%) |
| $25,000 to $34,999 | 8 (8.1%) | 10 (8.0%) |
| $35,000 to $49,999 | 12 (12.1%) | 14 (11.2%) |
| $50,000 to $74,999 | 31 (31.3%) | 15 (12.0%) |
| $75,000 to $99,999 | 13 (13.1%) | 14 (11.2%) |
| $100,000 to $149,999 | 5 (5.1%) | 27 (21.6%) |
| $150,000 or more | 18 (18.2%) | 10 (8.0%) |
| Total | 99 (100.0%) | 125 (100.0%) |
Property Value to Household Income Ratio in Battle Lake
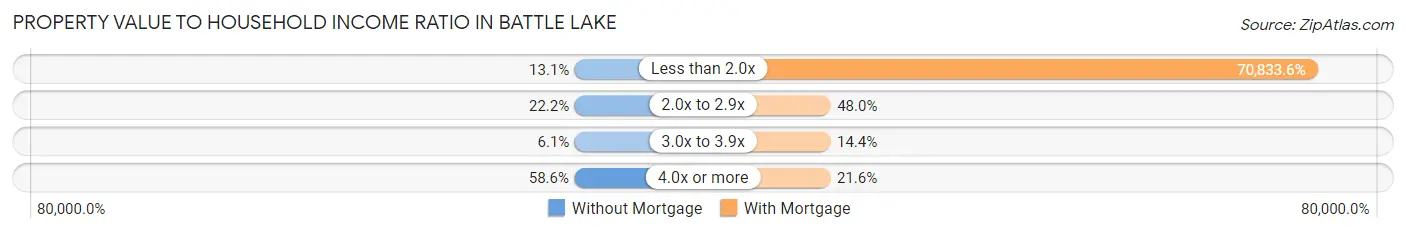
| Value-to-Income Ratio | Without Mortgage | With Mortgage |
| Less than 2.0x | 13 (13.1%) | 88,542 (70,833.6%) |
| 2.0x to 2.9x | 22 (22.2%) | 60 (48.0%) |
| 3.0x to 3.9x | 6 (6.1%) | 18 (14.4%) |
| 4.0x or more | 58 (58.6%) | 27 (21.6%) |
| Total | 99 (100.0%) | 125 (100.0%) |
Real Estate Taxes by Mortgage Status in Battle Lake
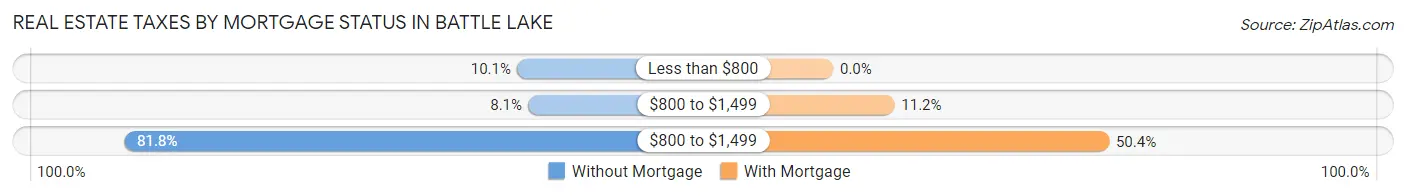
| Property Taxes | Without Mortgage | With Mortgage |
| Less than $800 | 10 (10.1%) | 0 (0.0%) |
| $800 to $1,499 | 8 (8.1%) | 14 (11.2%) |
| $800 to $1,499 | 81 (81.8%) | 63 (50.4%) |
| Total | 99 (100.0%) | 125 (100.0%) |
Health & Disability in Battle Lake
Health Insurance Coverage by Age in Battle Lake
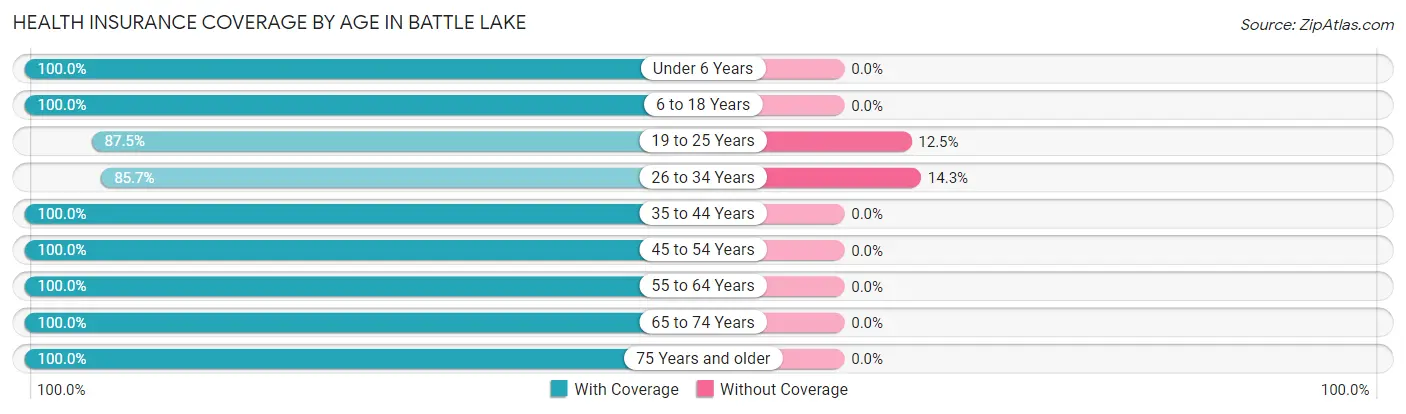
| Age Bracket | With Coverage | Without Coverage |
| Under 6 Years | 34 (100.0%) | 0 (0.0%) |
| 6 to 18 Years | 122 (100.0%) | 0 (0.0%) |
| 19 to 25 Years | 28 (87.5%) | 4 (12.5%) |
| 26 to 34 Years | 54 (85.7%) | 9 (14.3%) |
| 35 to 44 Years | 86 (100.0%) | 0 (0.0%) |
| 45 to 54 Years | 31 (100.0%) | 0 (0.0%) |
| 55 to 64 Years | 78 (100.0%) | 0 (0.0%) |
| 65 to 74 Years | 133 (100.0%) | 0 (0.0%) |
| 75 Years and older | 103 (100.0%) | 0 (0.0%) |
| Total | 669 (98.1%) | 13 (1.9%) |
Health Insurance Coverage by Citizenship Status in Battle Lake
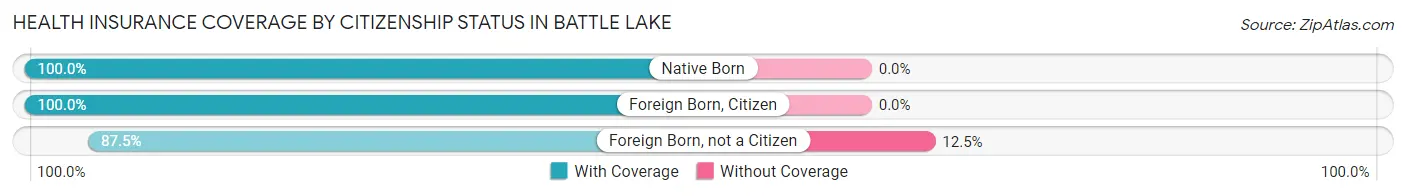
| Citizenship Status | With Coverage | Without Coverage |
| Native Born | 34 (100.0%) | 0 (0.0%) |
| Foreign Born, Citizen | 122 (100.0%) | 0 (0.0%) |
| Foreign Born, not a Citizen | 28 (87.5%) | 4 (12.5%) |
Health Insurance Coverage by Household Income in Battle Lake
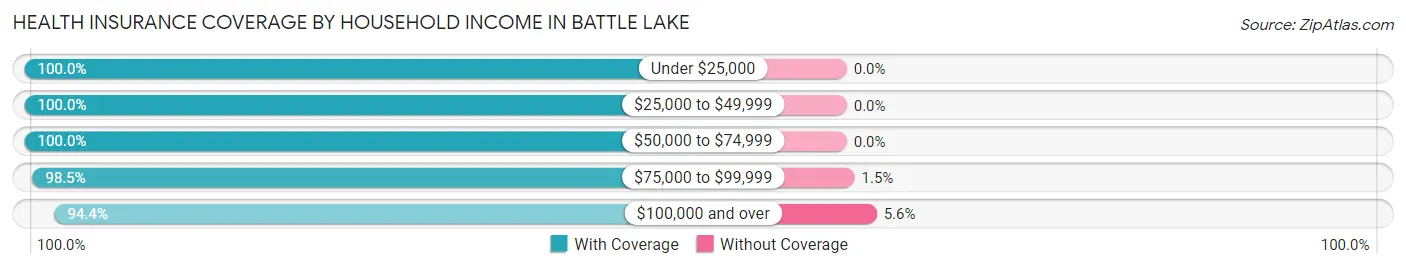
| Household Income | With Coverage | Without Coverage |
| Under $25,000 | 68 (100.0%) | 0 (0.0%) |
| $25,000 to $49,999 | 127 (100.0%) | 0 (0.0%) |
| $50,000 to $74,999 | 154 (100.0%) | 0 (0.0%) |
| $75,000 to $99,999 | 135 (98.5%) | 2 (1.5%) |
| $100,000 and over | 185 (94.4%) | 11 (5.6%) |
Public vs Private Health Insurance Coverage by Age in Battle Lake
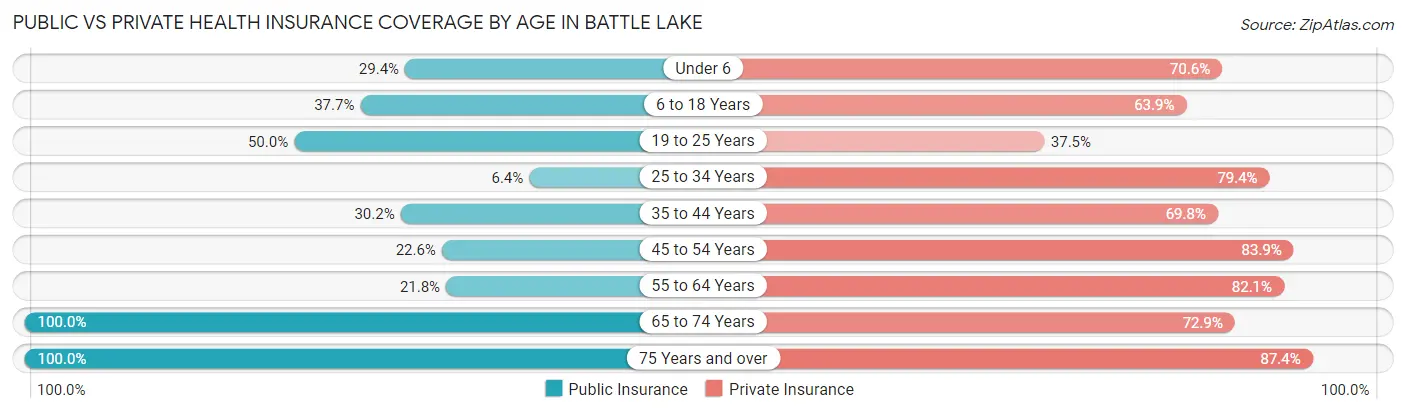
| Age Bracket | Public Insurance | Private Insurance |
| Under 6 | 10 (29.4%) | 24 (70.6%) |
| 6 to 18 Years | 46 (37.7%) | 78 (63.9%) |
| 19 to 25 Years | 16 (50.0%) | 12 (37.5%) |
| 25 to 34 Years | 4 (6.4%) | 50 (79.4%) |
| 35 to 44 Years | 26 (30.2%) | 60 (69.8%) |
| 45 to 54 Years | 7 (22.6%) | 26 (83.9%) |
| 55 to 64 Years | 17 (21.8%) | 64 (82.1%) |
| 65 to 74 Years | 133 (100.0%) | 97 (72.9%) |
| 75 Years and over | 103 (100.0%) | 90 (87.4%) |
| Total | 362 (53.1%) | 501 (73.5%) |
Disability Status by Sex by Age in Battle Lake
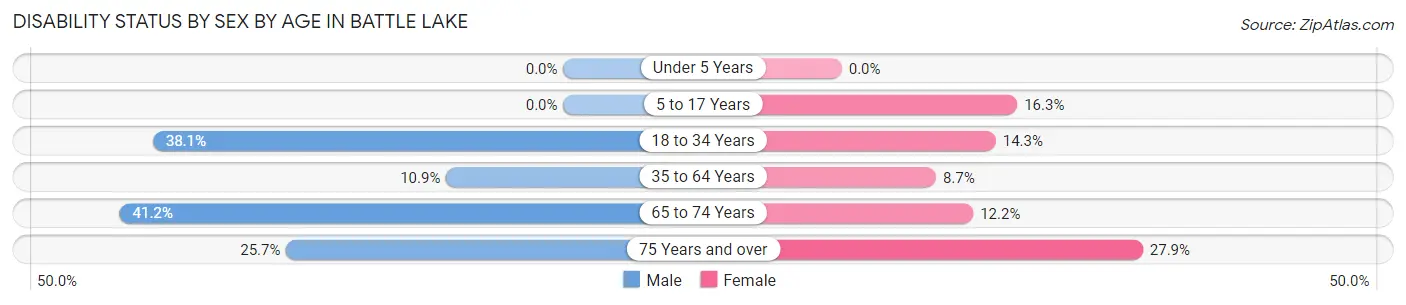
| Age Bracket | Male | Female |
| Under 5 Years | 0 (0.0%) | 0 (0.0%) |
| 5 to 17 Years | 0 (0.0%) | 7 (16.3%) |
| 18 to 34 Years | 24 (38.1%) | 7 (14.3%) |
| 35 to 64 Years | 10 (10.9%) | 9 (8.7%) |
| 65 to 74 Years | 21 (41.2%) | 10 (12.2%) |
| 75 Years and over | 9 (25.7%) | 19 (27.9%) |
Disability Class by Sex by Age in Battle Lake
Disability Class: Hearing Difficulty
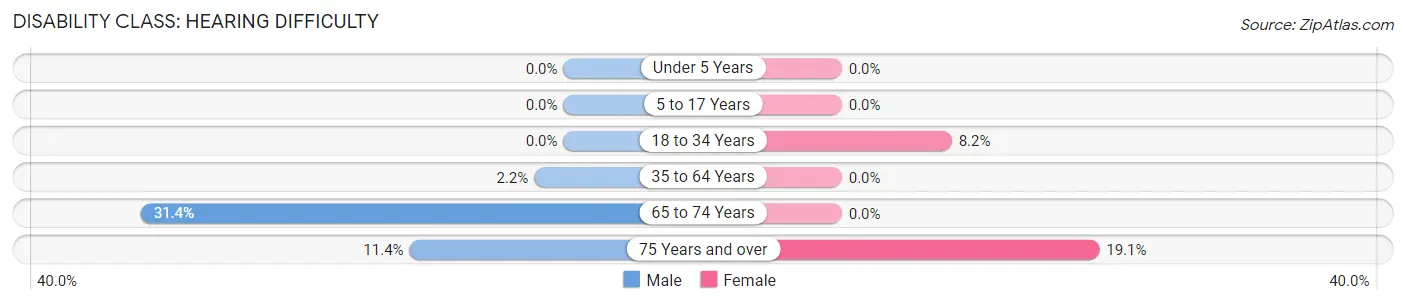
| Age Bracket | Male | Female |
| Under 5 Years | 0 (0.0%) | 0 (0.0%) |
| 5 to 17 Years | 0 (0.0%) | 0 (0.0%) |
| 18 to 34 Years | 0 (0.0%) | 4 (8.2%) |
| 35 to 64 Years | 2 (2.2%) | 0 (0.0%) |
| 65 to 74 Years | 16 (31.4%) | 0 (0.0%) |
| 75 Years and over | 4 (11.4%) | 13 (19.1%) |
Disability Class: Vision Difficulty
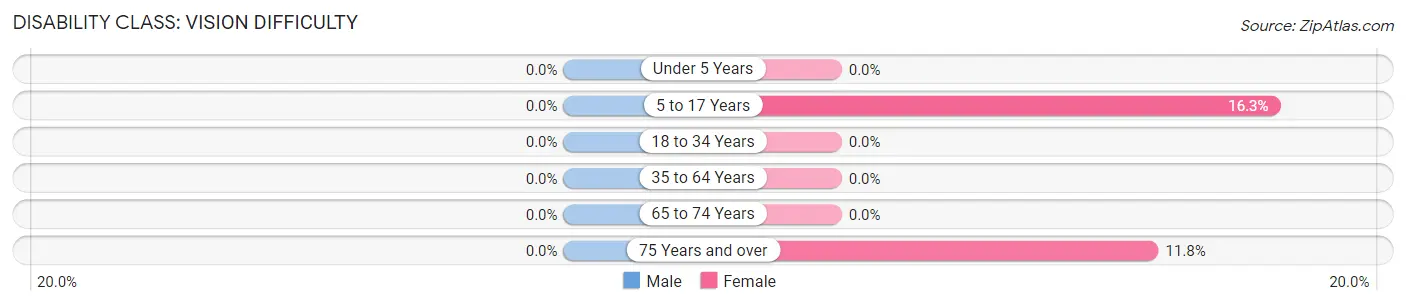
| Age Bracket | Male | Female |
| Under 5 Years | 0 (0.0%) | 0 (0.0%) |
| 5 to 17 Years | 0 (0.0%) | 7 (16.3%) |
| 18 to 34 Years | 0 (0.0%) | 0 (0.0%) |
| 35 to 64 Years | 0 (0.0%) | 0 (0.0%) |
| 65 to 74 Years | 0 (0.0%) | 0 (0.0%) |
| 75 Years and over | 0 (0.0%) | 8 (11.8%) |
Disability Class: Cognitive Difficulty
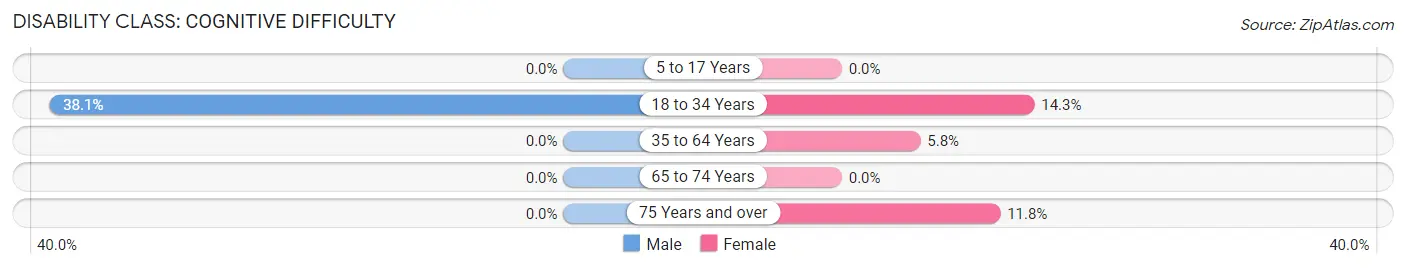
| Age Bracket | Male | Female |
| 5 to 17 Years | 0 (0.0%) | 0 (0.0%) |
| 18 to 34 Years | 24 (38.1%) | 7 (14.3%) |
| 35 to 64 Years | 0 (0.0%) | 6 (5.8%) |
| 65 to 74 Years | 0 (0.0%) | 0 (0.0%) |
| 75 Years and over | 0 (0.0%) | 8 (11.8%) |
Disability Class: Ambulatory Difficulty
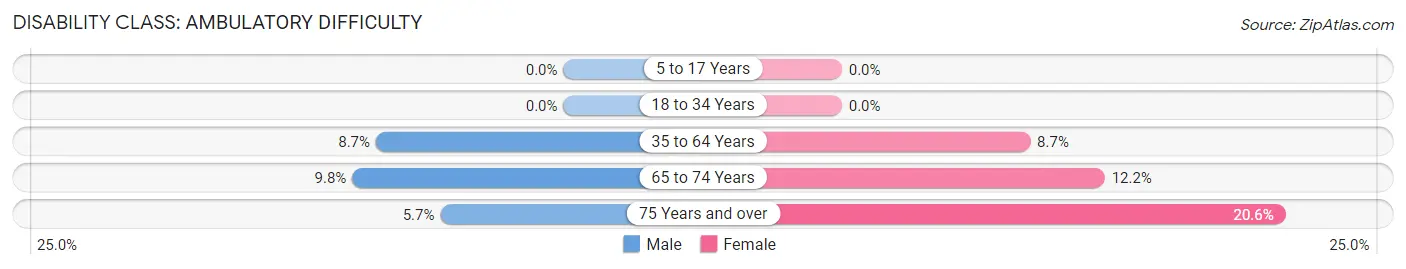
| Age Bracket | Male | Female |
| 5 to 17 Years | 0 (0.0%) | 0 (0.0%) |
| 18 to 34 Years | 0 (0.0%) | 0 (0.0%) |
| 35 to 64 Years | 8 (8.7%) | 9 (8.7%) |
| 65 to 74 Years | 5 (9.8%) | 10 (12.2%) |
| 75 Years and over | 2 (5.7%) | 14 (20.6%) |
Disability Class: Self-Care Difficulty
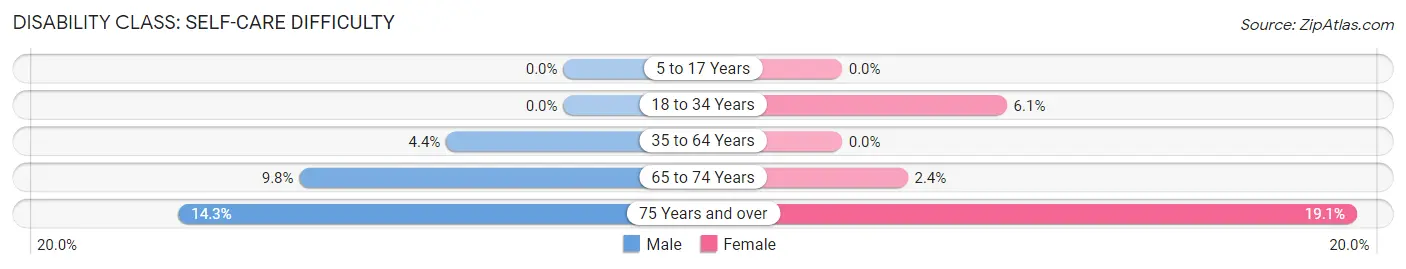
| Age Bracket | Male | Female |
| 5 to 17 Years | 0 (0.0%) | 0 (0.0%) |
| 18 to 34 Years | 0 (0.0%) | 3 (6.1%) |
| 35 to 64 Years | 4 (4.3%) | 0 (0.0%) |
| 65 to 74 Years | 5 (9.8%) | 2 (2.4%) |
| 75 Years and over | 5 (14.3%) | 13 (19.1%) |
Technology Access in Battle Lake
Computing Device Access in Battle Lake
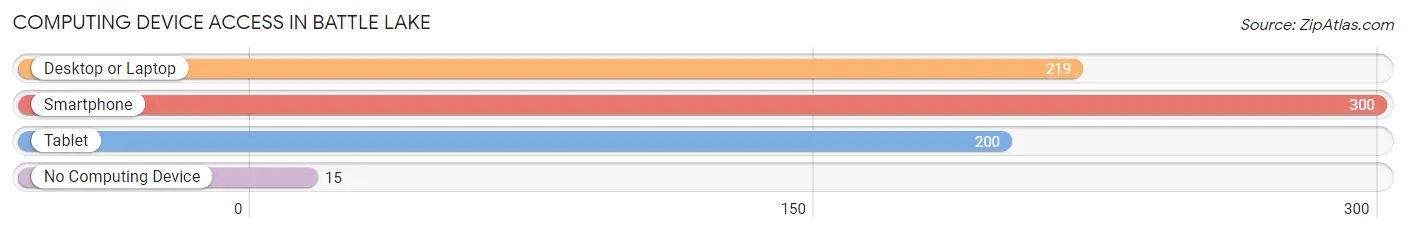
| Device Type | # Households | % Households |
| Desktop or Laptop | 219 | 66.0% |
| Smartphone | 300 | 90.4% |
| Tablet | 200 | 60.2% |
| No Computing Device | 15 | 4.5% |
| Total | 332 | 100.0% |
Internet Access in Battle Lake
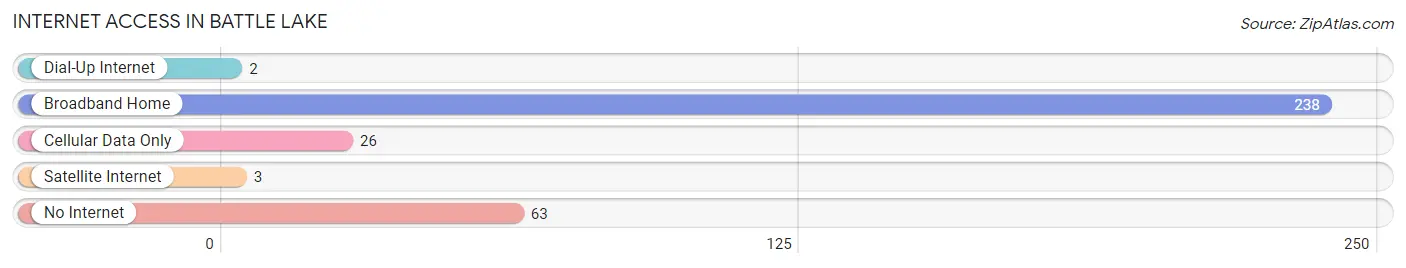
| Internet Type | # Households | % Households |
| Dial-Up Internet | 2 | 0.6% |
| Broadband Home | 238 | 71.7% |
| Cellular Data Only | 26 | 7.8% |
| Satellite Internet | 3 | 0.9% |
| No Internet | 63 | 19.0% |
| Total | 332 | 100.0% |
Battle Lake Summary
History
The small town of Battle Lake, Minnesota is located in Otter Tail County, in the west-central part of the state. It is situated on the south shore of West Battle Lake, a popular recreational area. The town was first settled in 1871 by a group of Norwegian immigrants, who named it after the lake. The first post office was established in 1872, and the town was officially incorporated in 1881.
The town was originally a farming community, but it soon became a popular tourist destination. The lake was a popular spot for fishing, swimming, and boating, and the town was known for its resorts and summer homes. In the early 1900s, the town was home to a number of businesses, including a hotel, a general store, a blacksmith shop, and a sawmill.
In the 1950s, the town began to experience a decline in population as people moved away to larger cities. However, in the 1970s, the town began to experience a resurgence as people began to move back to the area. The town has since become a popular destination for tourists, with a number of resorts, restaurants, and other businesses.
Geography
Battle Lake is located in the west-central part of Minnesota, in Otter Tail County. It is situated on the south shore of West Battle Lake, a popular recreational area. The town is located about 25 miles east of the city of Fergus Falls, and about 50 miles northwest of the city of Detroit Lakes.
The town is situated in a rural area, with rolling hills and forests. The lake is a popular spot for fishing, swimming, and boating, and the town is known for its resorts and summer homes. The town is also home to a number of parks, including the Battle Lake State Wildlife Management Area.
Economy
The economy of Battle Lake is largely based on tourism. The town is a popular destination for tourists, with a number of resorts, restaurants, and other businesses. The lake is a popular spot for fishing, swimming, and boating, and the town is known for its resorts and summer homes.
The town is also home to a number of manufacturing businesses, including a furniture factory, a plastics factory, and a printing company. The town is also home to a number of retail businesses, including a grocery store, a hardware store, and a number of gift shops.
Demographics
As of the 2010 census, the population of Battle Lake was 1,072. The town has a total area of 1.2 square miles, all of which is land. The median household income in the town was $41,250, and the median family income was $50,000. The per capita income in the town was $20,945.
The population of Battle Lake is predominantly white, with about 95% of the population identifying as white. The town also has a small Hispanic population, with about 4% of the population identifying as Hispanic or Latino. The town also has a small Native American population, with about 1% of the population identifying as Native American.
Conclusion
Battle Lake, Minnesota is a small town located in Otter Tail County, in the west-central part of the state. It is situated on the south shore of West Battle Lake, a popular recreational area. The town was first settled in 1871 by a group of Norwegian immigrants, and it has since become a popular destination for tourists, with a number of resorts, restaurants, and other businesses. The town has a predominantly white population, with a small Hispanic and Native American population. The economy of the town is largely based on tourism, with a number of manufacturing and retail businesses.
Common Questions
What is Per Capita Income in Battle Lake?
Per Capita income in Battle Lake is $34,590.
What is the Median Family Income in Battle Lake?
Median Family Income in Battle Lake is $81,667.
What is the Median Household income in Battle Lake?
Median Household Income in Battle Lake is $57,917.
What is Income or Wage Gap in Battle Lake?
Income or Wage Gap in Battle Lake is 57.0%.
Women in Battle Lake earn 43.0 cents for every dollar earned by a man.
What is Inequality or Gini Index in Battle Lake?
Inequality or Gini Index in Battle Lake is 0.42.
What is the Total Population of Battle Lake?
Total Population of Battle Lake is 744.
What is the Total Male Population of Battle Lake?
Total Male Population of Battle Lake is 357.
What is the Total Female Population of Battle Lake?
Total Female Population of Battle Lake is 387.
What is the Ratio of Males per 100 Females in Battle Lake?
There are 92.25 Males per 100 Females in Battle Lake.
What is the Ratio of Females per 100 Males in Battle Lake?
There are 108.40 Females per 100 Males in Battle Lake.
What is the Median Population Age in Battle Lake?
Median Population Age in Battle Lake is 57.0 Years.
What is the Average Family Size in Battle Lake
Average Family Size in Battle Lake is 2.8 People.
What is the Average Household Size in Battle Lake
Average Household Size in Battle Lake is 2.0 People.
How Large is the Labor Force in Battle Lake?
There are 290 People in the Labor Forcein in Battle Lake.
What is the Percentage of People in the Labor Force in Battle Lake?
46.3% of People are in the Labor Force in Battle Lake.
What is the Unemployment Rate in Battle Lake?
Unemployment Rate in Battle Lake is 8.3%.