Barnesville, MN Map & Demographics
Barnesville Map
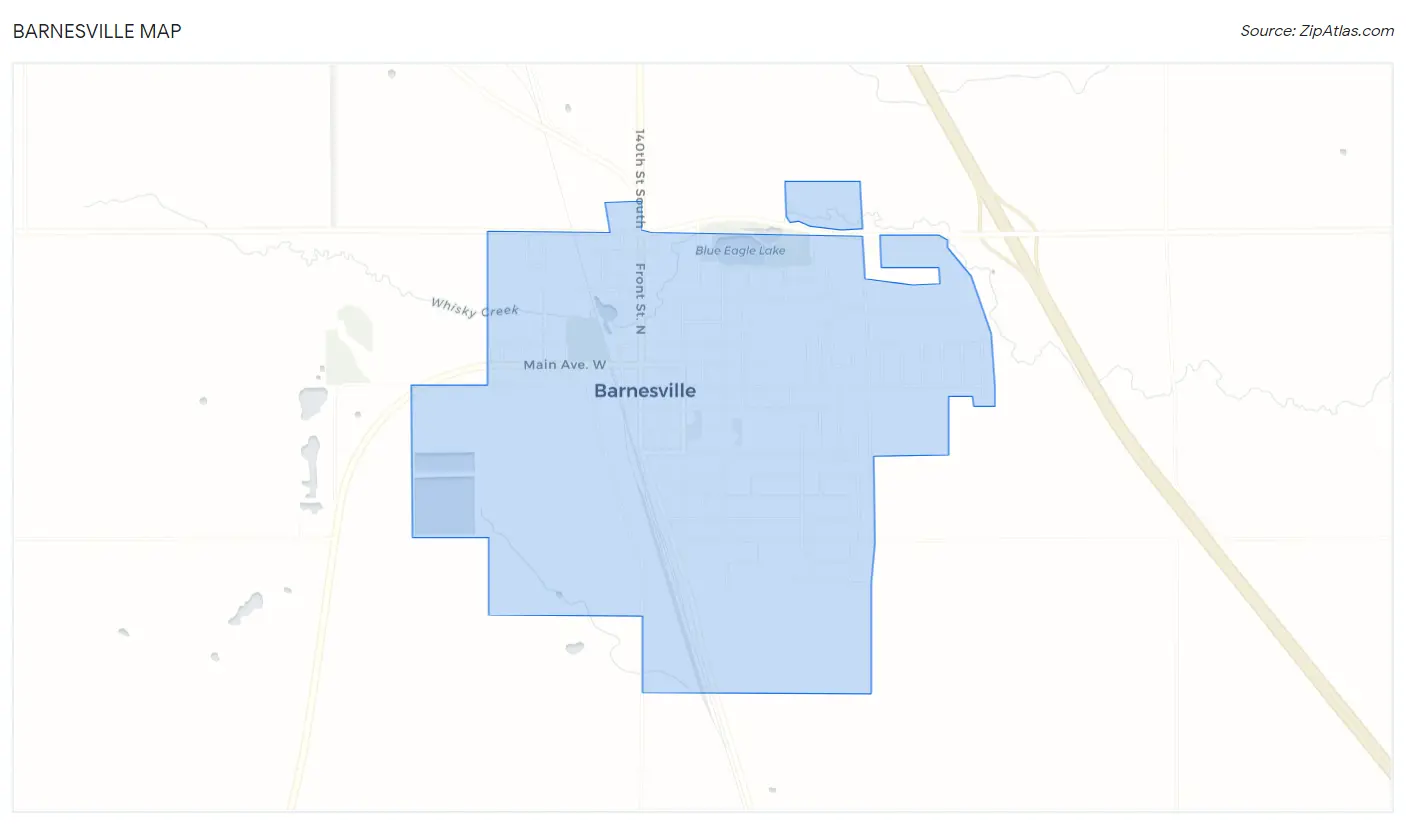
Barnesville Overview
$42,922
PER CAPITA INCOME
$89,792
AVG FAMILY INCOME
$68,750
AVG HOUSEHOLD INCOME
21.2%
WAGE / INCOME GAP [ % ]
78.8¢/ $1
WAGE / INCOME GAP [ $ ]
0.49
INEQUALITY / GINI INDEX
2,773
TOTAL POPULATION
1,348
MALE POPULATION
1,425
FEMALE POPULATION
94.60
MALES / 100 FEMALES
105.71
FEMALES / 100 MALES
34.1
MEDIAN AGE
3.1
AVG FAMILY SIZE
2.6
AVG HOUSEHOLD SIZE
1,490
LABOR FORCE [ PEOPLE ]
72.1%
PERCENT IN LABOR FORCE
1.3%
UNEMPLOYMENT RATE
Barnesville Zip Codes
Barnesville Area Codes
Income in Barnesville
Income Overview in Barnesville
Per Capita Income in Barnesville is $42,922, while median incomes of families and households are $89,792 and $68,750 respectively.
| Characteristic | Number | Measure |
| Per Capita Income | 2,773 | $42,922 |
| Median Family Income | 717 | $89,792 |
| Mean Family Income | 717 | $112,276 |
| Median Household Income | 1,040 | $68,750 |
| Mean Household Income | 1,040 | $108,787 |
| Income Deficit | 717 | $0 |
| Wage / Income Gap (%) | 2,773 | 21.24% |
| Wage / Income Gap ($) | 2,773 | 78.76¢ per $1 |
| Gini / Inequality Index | 2,773 | 0.49 |
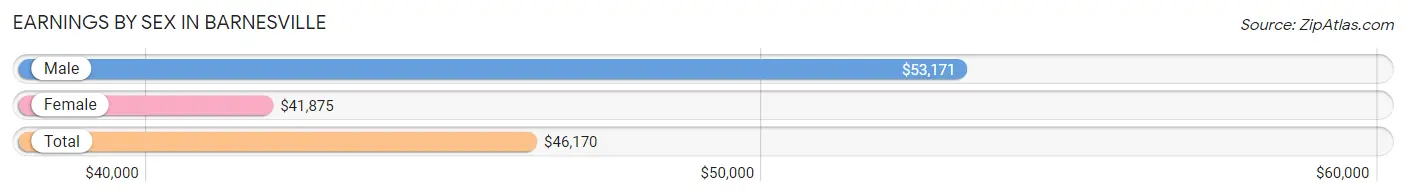
Earnings by Sex in Barnesville
Average Earnings in Barnesville are $46,170, $53,171 for men and $41,875 for women, a difference of 21.2%.
| Sex | Number | Average Earnings |
| Male | 860 (54.8%) | $53,171 |
| Female | 710 (45.2%) | $41,875 |
| Total | 1,570 (100.0%) | $46,170 |
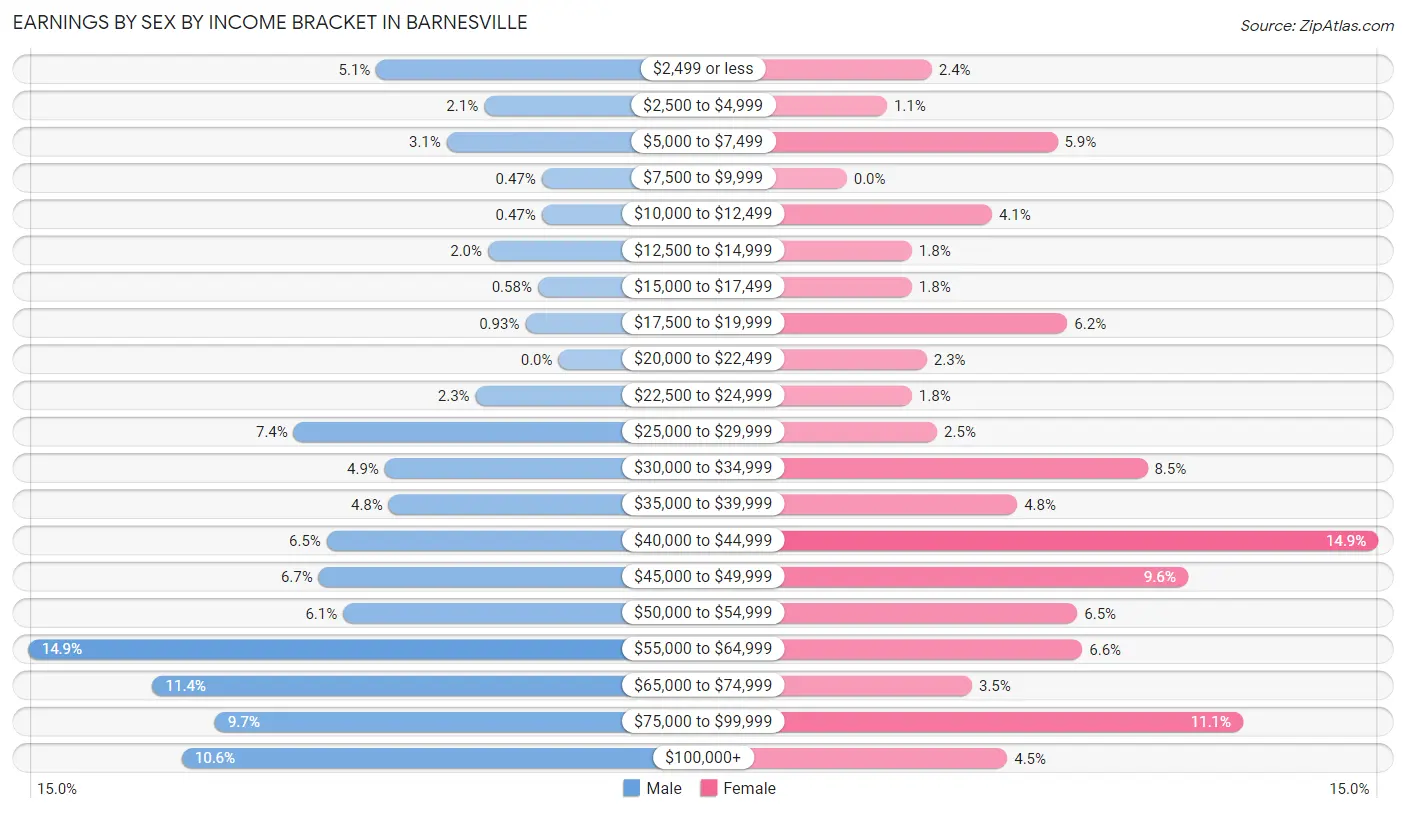
Earnings by Sex by Income Bracket in Barnesville
The most common earnings brackets in Barnesville are $55,000 to $64,999 for men (128 | 14.9%) and $40,000 to $44,999 for women (106 | 14.9%).
| Income | Male | Female |
| $2,499 or less | 44 (5.1%) | 17 (2.4%) |
| $2,500 to $4,999 | 18 (2.1%) | 8 (1.1%) |
| $5,000 to $7,499 | 27 (3.1%) | 42 (5.9%) |
| $7,500 to $9,999 | 4 (0.5%) | 0 (0.0%) |
| $10,000 to $12,499 | 4 (0.5%) | 29 (4.1%) |
| $12,500 to $14,999 | 17 (2.0%) | 13 (1.8%) |
| $15,000 to $17,499 | 5 (0.6%) | 13 (1.8%) |
| $17,500 to $19,999 | 8 (0.9%) | 44 (6.2%) |
| $20,000 to $22,499 | 0 (0.0%) | 16 (2.2%) |
| $22,500 to $24,999 | 20 (2.3%) | 13 (1.8%) |
| $25,000 to $29,999 | 64 (7.4%) | 18 (2.5%) |
| $30,000 to $34,999 | 42 (4.9%) | 60 (8.5%) |
| $35,000 to $39,999 | 41 (4.8%) | 34 (4.8%) |
| $40,000 to $44,999 | 56 (6.5%) | 106 (14.9%) |
| $45,000 to $49,999 | 58 (6.7%) | 68 (9.6%) |
| $50,000 to $54,999 | 52 (6.0%) | 46 (6.5%) |
| $55,000 to $64,999 | 128 (14.9%) | 47 (6.6%) |
| $65,000 to $74,999 | 98 (11.4%) | 25 (3.5%) |
| $75,000 to $99,999 | 83 (9.7%) | 79 (11.1%) |
| $100,000+ | 91 (10.6%) | 32 (4.5%) |
| Total | 860 (100.0%) | 710 (100.0%) |
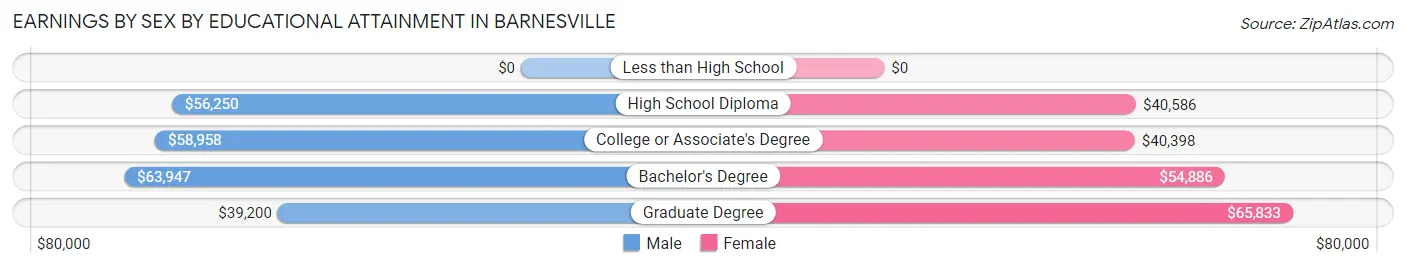
Earnings by Sex by Educational Attainment in Barnesville
Average earnings in Barnesville are $58,043 for men and $42,478 for women, a difference of 26.8%. Men with an educational attainment of bachelor's degree enjoy the highest average annual earnings of $63,947, while those with graduate degree education earn the least with $39,200. Women with an educational attainment of graduate degree earn the most with the average annual earnings of $65,833, while those with college or associate's degree education have the smallest earnings of $40,398.
| Educational Attainment | Male Income | Female Income |
| Less than High School | - | - |
| High School Diploma | $56,250 | $40,586 |
| College or Associate's Degree | $58,958 | $40,398 |
| Bachelor's Degree | $63,947 | $54,886 |
| Graduate Degree | $39,200 | $65,833 |
| Total | $58,043 | $42,478 |
Family Income in Barnesville
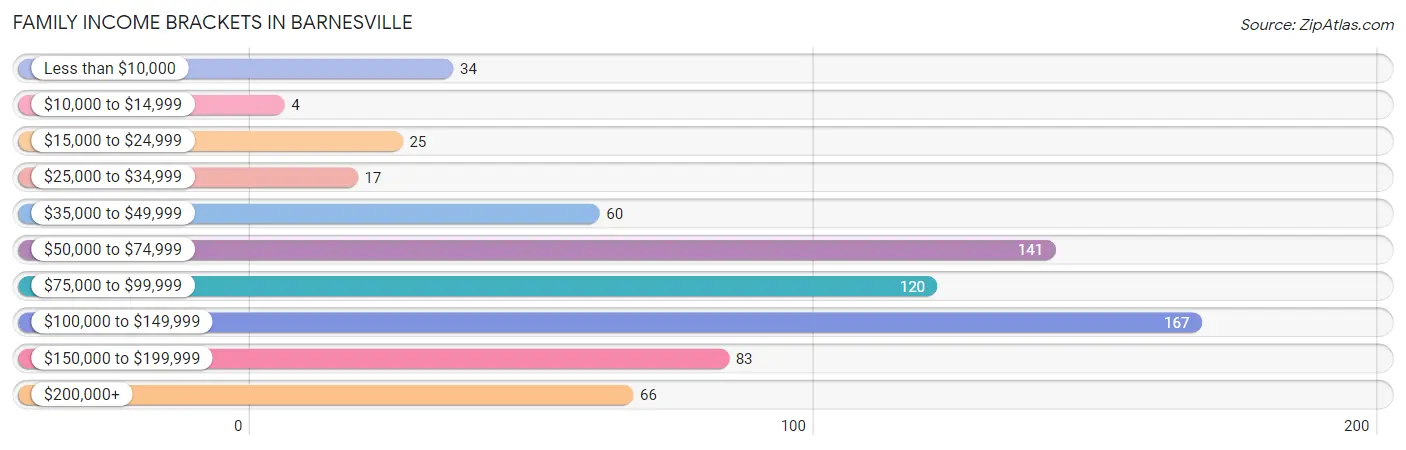
Family Income Brackets in Barnesville
According to the Barnesville family income data, there are 167 families falling into the $100,000 to $149,999 income range, which is the most common income bracket and makes up 23.3% of all families. Conversely, the $10,000 to $14,999 income bracket is the least frequent group with only 4 families (0.6%) belonging to this category.
| Income Bracket | # Families | % Families |
| Less than $10,000 | 34 | 4.7% |
| $10,000 to $14,999 | 4 | 0.6% |
| $15,000 to $24,999 | 25 | 3.5% |
| $25,000 to $34,999 | 17 | 2.4% |
| $35,000 to $49,999 | 60 | 8.4% |
| $50,000 to $74,999 | 141 | 19.7% |
| $75,000 to $99,999 | 120 | 16.7% |
| $100,000 to $149,999 | 167 | 23.3% |
| $150,000 to $199,999 | 83 | 11.6% |
| $200,000+ | 66 | 9.2% |
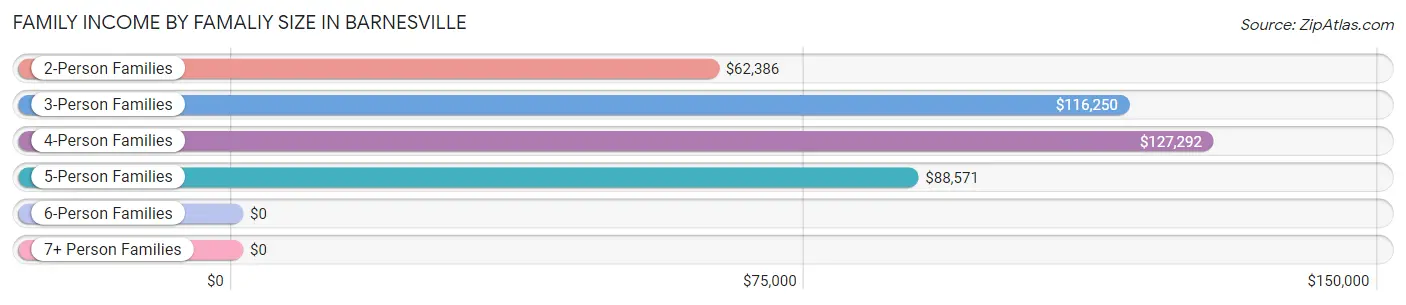
Family Income by Famaliy Size in Barnesville
4-person families (201 | 28.0%) account for the highest median family income in Barnesville with $127,292 per family, while 3-person families (92 | 12.8%) have the highest median income of $38,750 per family member.
| Income Bracket | # Families | Median Income |
| 2-Person Families | 339 (47.3%) | $62,386 |
| 3-Person Families | 92 (12.8%) | $116,250 |
| 4-Person Families | 201 (28.0%) | $127,292 |
| 5-Person Families | 80 (11.2%) | $88,571 |
| 6-Person Families | 5 (0.7%) | $0 |
| 7+ Person Families | 0 (0.0%) | $0 |
| Total | 717 (100.0%) | $89,792 |
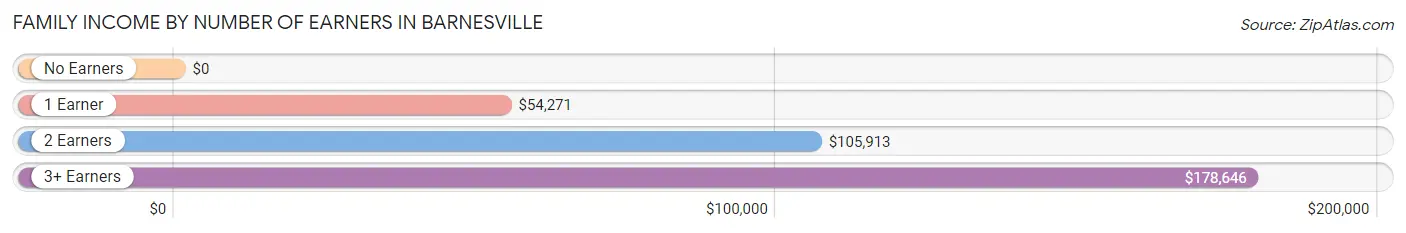
Family Income by Number of Earners in Barnesville
| Number of Earners | # Families | Median Income |
| No Earners | 95 (13.3%) | $0 |
| 1 Earner | 159 (22.2%) | $54,271 |
| 2 Earners | 384 (53.6%) | $105,913 |
| 3+ Earners | 79 (11.0%) | $178,646 |
| Total | 717 (100.0%) | $89,792 |
Household Income in Barnesville
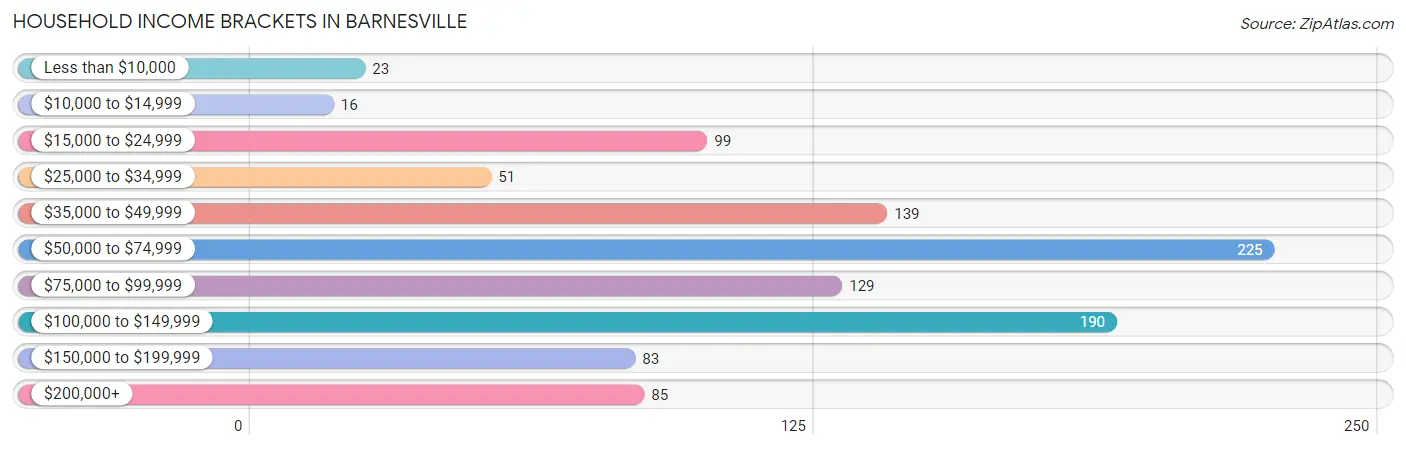
Household Income Brackets in Barnesville
With 225 households falling in the category, the $50,000 to $74,999 income range is the most frequent in Barnesville, accounting for 21.6% of all households. In contrast, only 16 households (1.5%) fall into the $10,000 to $14,999 income bracket, making it the least populous group.
| Income Bracket | # Households | % Households |
| Less than $10,000 | 23 | 2.2% |
| $10,000 to $14,999 | 16 | 1.5% |
| $15,000 to $24,999 | 99 | 9.5% |
| $25,000 to $34,999 | 51 | 4.9% |
| $35,000 to $49,999 | 139 | 13.4% |
| $50,000 to $74,999 | 225 | 21.6% |
| $75,000 to $99,999 | 129 | 12.4% |
| $100,000 to $149,999 | 190 | 18.3% |
| $150,000 to $199,999 | 83 | 8.0% |
| $200,000+ | 85 | 8.2% |
Household Income by Householder Age in Barnesville
The median household income in Barnesville is $68,750, with the highest median household income of $93,295 found in the 25 to 44 years age bracket for the primary householder. A total of 387 households (37.2%) fall into this category. Meanwhile, the 65+ years age bracket for the primary householder has the lowest median household income of $34,423, with 236 households (22.7%) in this group.
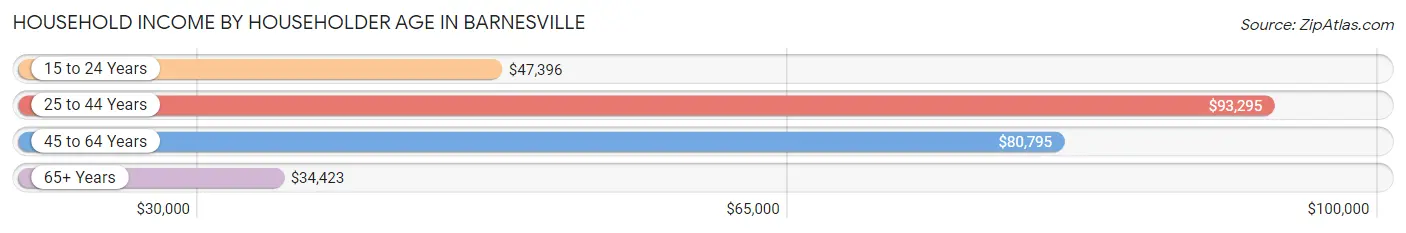
| Income Bracket | # Households | Median Income |
| 15 to 24 Years | 23 (2.2%) | $47,396 |
| 25 to 44 Years | 387 (37.2%) | $93,295 |
| 45 to 64 Years | 394 (37.9%) | $80,795 |
| 65+ Years | 236 (22.7%) | $34,423 |
| Total | 1,040 (100.0%) | $68,750 |
Poverty in Barnesville
Income Below Poverty by Sex and Age in Barnesville
With 3.4% poverty level for males and 9.1% for females among the residents of Barnesville, under 5 year old males and 18 to 24 year old females are the most vulnerable to poverty, with 10 males (14.1%) and 22 females (21.1%) in their respective age groups living below the poverty level.
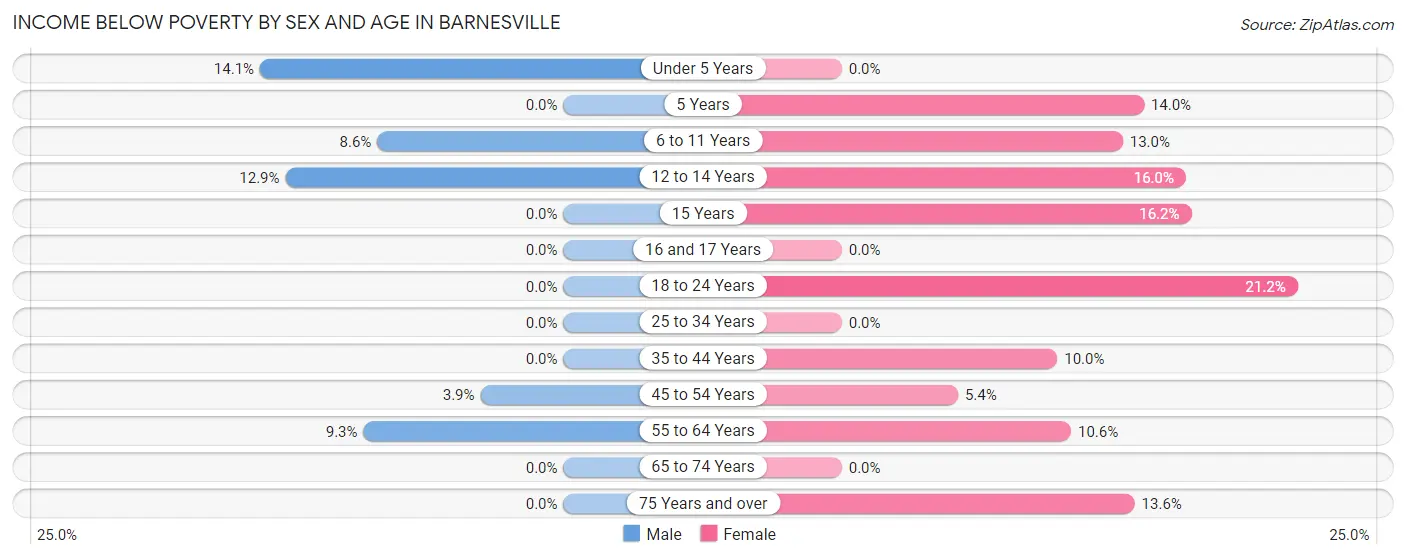
| Age Bracket | Male | Female |
| Under 5 Years | 10 (14.1%) | 0 (0.0%) |
| 5 Years | 0 (0.0%) | 15 (14.0%) |
| 6 to 11 Years | 14 (8.6%) | 15 (13.0%) |
| 12 to 14 Years | 4 (12.9%) | 15 (16.0%) |
| 15 Years | 0 (0.0%) | 6 (16.2%) |
| 16 and 17 Years | 0 (0.0%) | 0 (0.0%) |
| 18 to 24 Years | 0 (0.0%) | 22 (21.1%) |
| 25 to 34 Years | 0 (0.0%) | 0 (0.0%) |
| 35 to 44 Years | 0 (0.0%) | 16 (10.0%) |
| 45 to 54 Years | 9 (3.8%) | 9 (5.4%) |
| 55 to 64 Years | 9 (9.3%) | 15 (10.6%) |
| 65 to 74 Years | 0 (0.0%) | 0 (0.0%) |
| 75 Years and over | 0 (0.0%) | 14 (13.6%) |
| Total | 46 (3.4%) | 127 (9.1%) |
Income Above Poverty by Sex and Age in Barnesville
According to the poverty statistics in Barnesville, males aged 15 years and females aged under 5 years are the age groups that are most secure financially, with 100.0% of males and 100.0% of females in these age groups living above the poverty line.
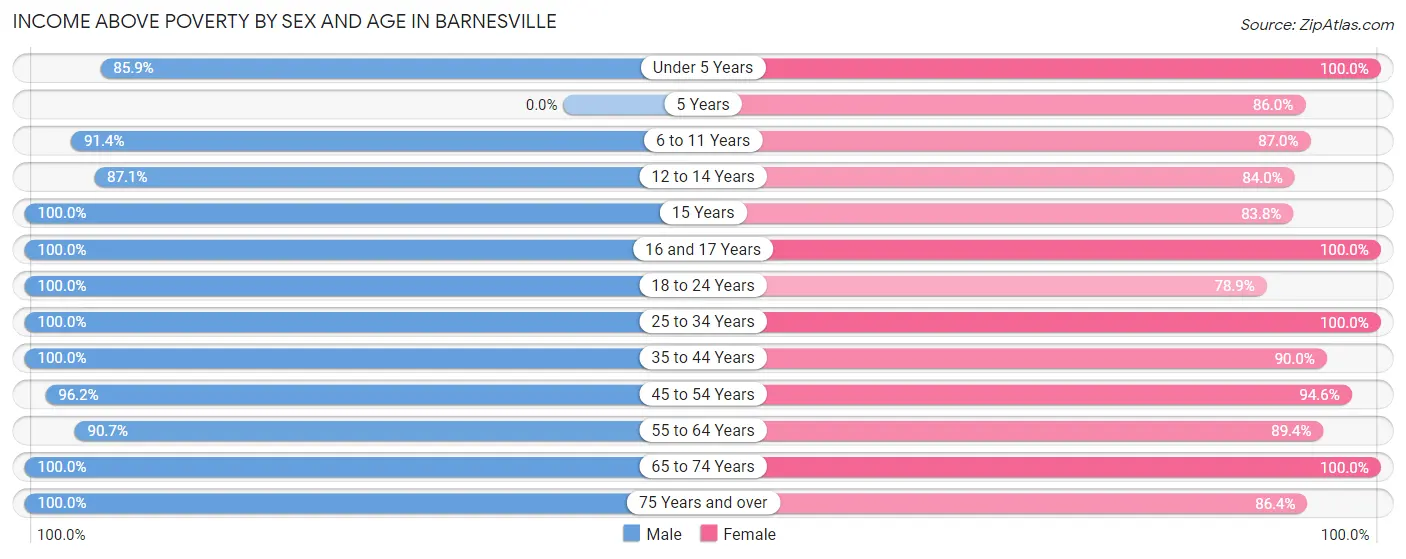
| Age Bracket | Male | Female |
| Under 5 Years | 61 (85.9%) | 57 (100.0%) |
| 5 Years | 0 (0.0%) | 92 (86.0%) |
| 6 to 11 Years | 148 (91.4%) | 100 (87.0%) |
| 12 to 14 Years | 27 (87.1%) | 79 (84.0%) |
| 15 Years | 33 (100.0%) | 31 (83.8%) |
| 16 and 17 Years | 44 (100.0%) | 56 (100.0%) |
| 18 to 24 Years | 139 (100.0%) | 82 (78.8%) |
| 25 to 34 Years | 166 (100.0%) | 192 (100.0%) |
| 35 to 44 Years | 209 (100.0%) | 144 (90.0%) |
| 45 to 54 Years | 225 (96.2%) | 158 (94.6%) |
| 55 to 64 Years | 88 (90.7%) | 126 (89.4%) |
| 65 to 74 Years | 65 (100.0%) | 63 (100.0%) |
| 75 Years and over | 89 (100.0%) | 89 (86.4%) |
| Total | 1,294 (96.6%) | 1,269 (90.9%) |
Income Below Poverty Among Married-Couple Families in Barnesville
The poverty statistics for married-couple families in Barnesville show that 1.6% or 9 of the total 549 families live below the poverty line. Families with no children have the highest poverty rate of 3.7%, comprising of 9 families. On the other hand, families with 1 or 2 children have the lowest poverty rate of 0.0%, which includes 0 families.
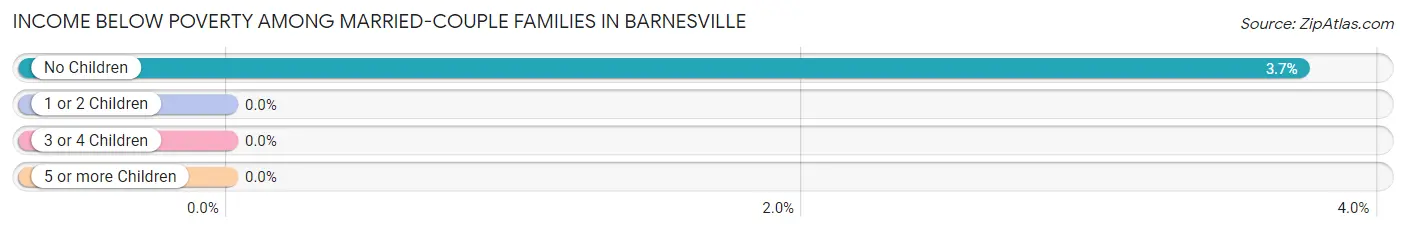
| Children | Above Poverty | Below Poverty |
| No Children | 232 (96.3%) | 9 (3.7%) |
| 1 or 2 Children | 253 (100.0%) | 0 (0.0%) |
| 3 or 4 Children | 55 (100.0%) | 0 (0.0%) |
| 5 or more Children | 0 (0.0%) | 0 (0.0%) |
| Total | 540 (98.4%) | 9 (1.6%) |
Income Below Poverty Among Single-Parent Households in Barnesville
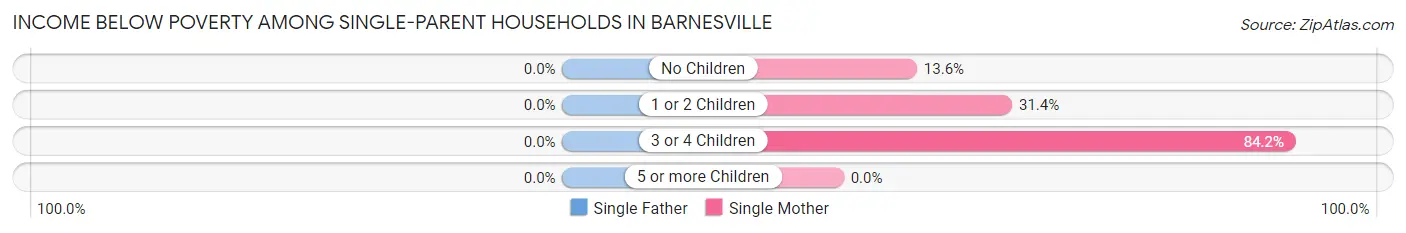
| Children | Single Father | Single Mother |
| No Children | 0 (0.0%) | 6 (13.6%) |
| 1 or 2 Children | 0 (0.0%) | 16 (31.4%) |
| 3 or 4 Children | 0 (0.0%) | 16 (84.2%) |
| 5 or more Children | 0 (0.0%) | 0 (0.0%) |
| Total | 0 (0.0%) | 38 (33.3%) |
Income Below Poverty Among Married-Couple vs Single-Parent Households in Barnesville
The poverty data for Barnesville shows that 9 of the married-couple family households (1.6%) and 38 of the single-parent households (22.6%) are living below the poverty level. Within the married-couple family households, those with no children have the highest poverty rate, with 9 households (3.7%) falling below the poverty line. Among the single-parent households, those with 3 or 4 children have the highest poverty rate, with 16 household (84.2%) living below poverty.
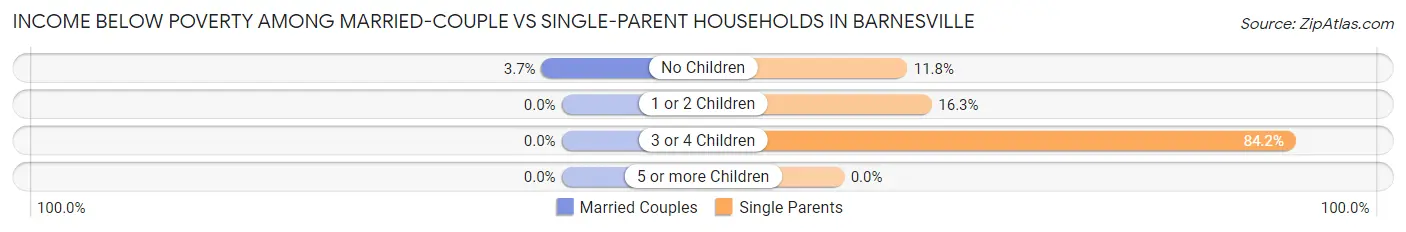
| Children | Married-Couple Families | Single-Parent Households |
| No Children | 9 (3.7%) | 6 (11.8%) |
| 1 or 2 Children | 0 (0.0%) | 16 (16.3%) |
| 3 or 4 Children | 0 (0.0%) | 16 (84.2%) |
| 5 or more Children | 0 (0.0%) | 0 (0.0%) |
| Total | 9 (1.6%) | 38 (22.6%) |
Race in Barnesville
The most populous races in Barnesville are White / Caucasian (2,646 | 95.4%), Hispanic or Latino (84 | 3.0%), and Asian (80 | 2.9%).
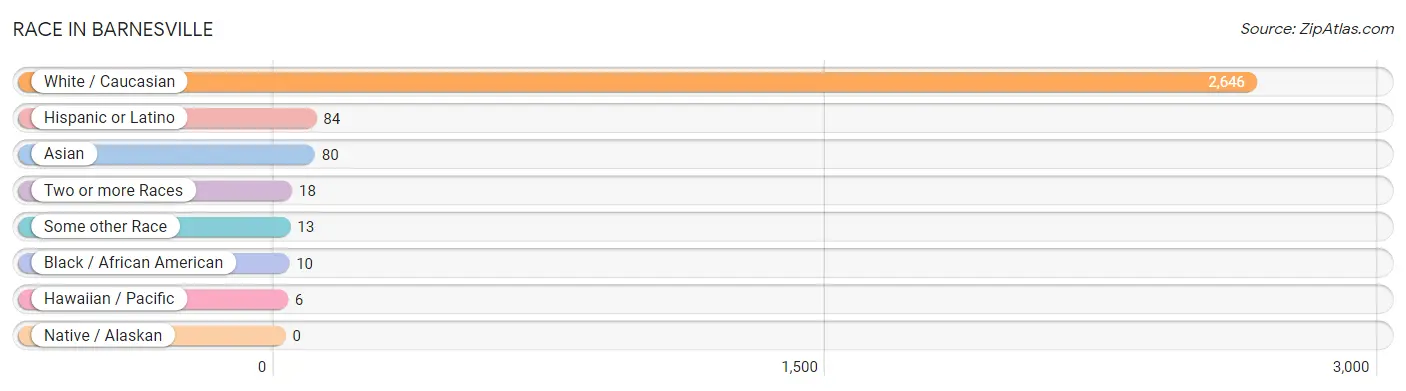
| Race | # Population | % Population |
| Asian | 80 | 2.9% |
| Black / African American | 10 | 0.4% |
| Hawaiian / Pacific | 6 | 0.2% |
| Hispanic or Latino | 84 | 3.0% |
| Native / Alaskan | 0 | 0.0% |
| White / Caucasian | 2,646 | 95.4% |
| Two or more Races | 18 | 0.6% |
| Some other Race | 13 | 0.5% |
| Total | 2,773 | 100.0% |
Ancestry in Barnesville
The most populous ancestries reported in Barnesville are Norwegian (1,000 | 36.1%), German (793 | 28.6%), English (260 | 9.4%), Irish (222 | 8.0%), and Swedish (132 | 4.8%), together accounting for 86.8% of all Barnesville residents.
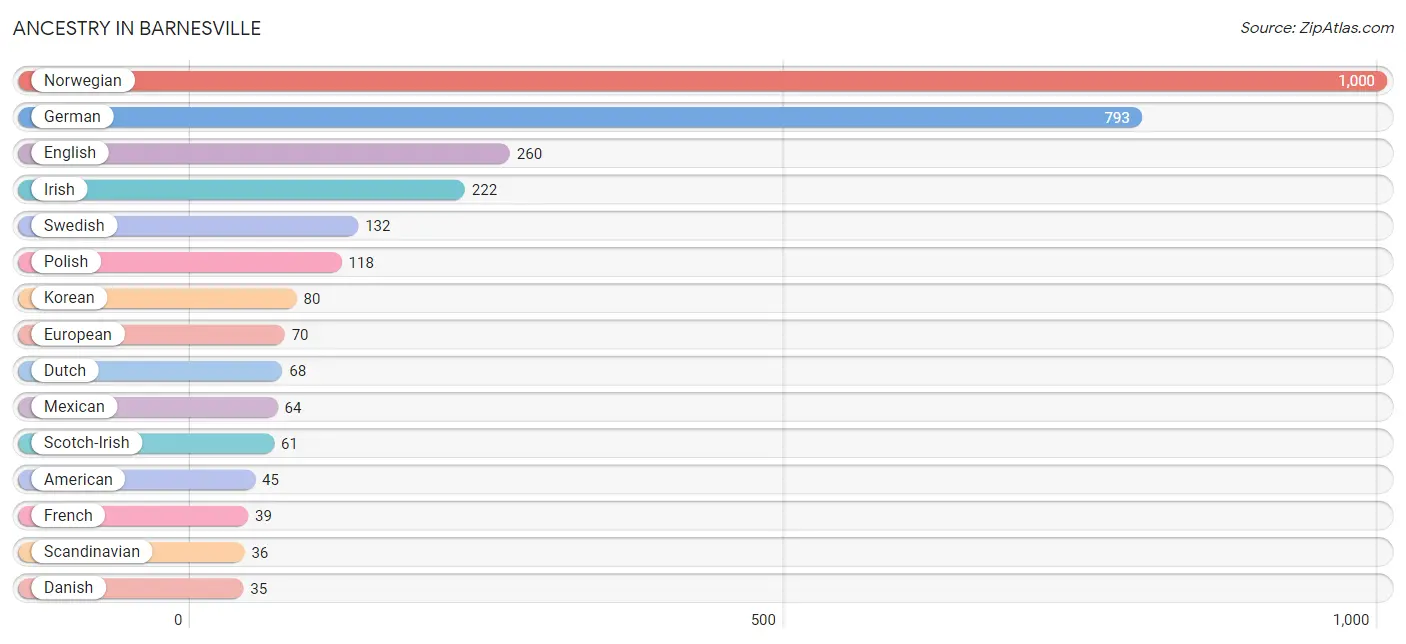
| Ancestry | # Population | % Population |
| African | 6 | 0.2% |
| American | 45 | 1.6% |
| Cuban | 8 | 0.3% |
| Czech | 7 | 0.3% |
| Danish | 35 | 1.3% |
| Dutch | 68 | 2.5% |
| English | 260 | 9.4% |
| European | 70 | 2.5% |
| Finnish | 11 | 0.4% |
| French | 39 | 1.4% |
| German | 793 | 28.6% |
| Icelander | 9 | 0.3% |
| Irish | 222 | 8.0% |
| Italian | 20 | 0.7% |
| Korean | 80 | 2.9% |
| Mexican | 64 | 2.3% |
| Native Hawaiian | 6 | 0.2% |
| Northern European | 18 | 0.6% |
| Norwegian | 1,000 | 36.1% |
| Polish | 118 | 4.3% |
| Portuguese | 9 | 0.3% |
| Puerto Rican | 12 | 0.4% |
| Russian | 12 | 0.4% |
| Scandinavian | 36 | 1.3% |
| Scotch-Irish | 61 | 2.2% |
| Scottish | 27 | 1.0% |
| Subsaharan African | 6 | 0.2% |
| Swedish | 132 | 4.8% |
| Swiss | 21 | 0.8% |
| Ugandan | 6 | 0.2% | View All 30 Rows |
Immigrants in Barnesville
The most numerous immigrant groups reported in Barnesville came from Asia (9 | 0.3%), Philippines (9 | 0.3%), South Eastern Asia (9 | 0.3%), Africa (6 | 0.2%), and Eastern Africa (6 | 0.2%), together accounting for 1.4% of all Barnesville residents.
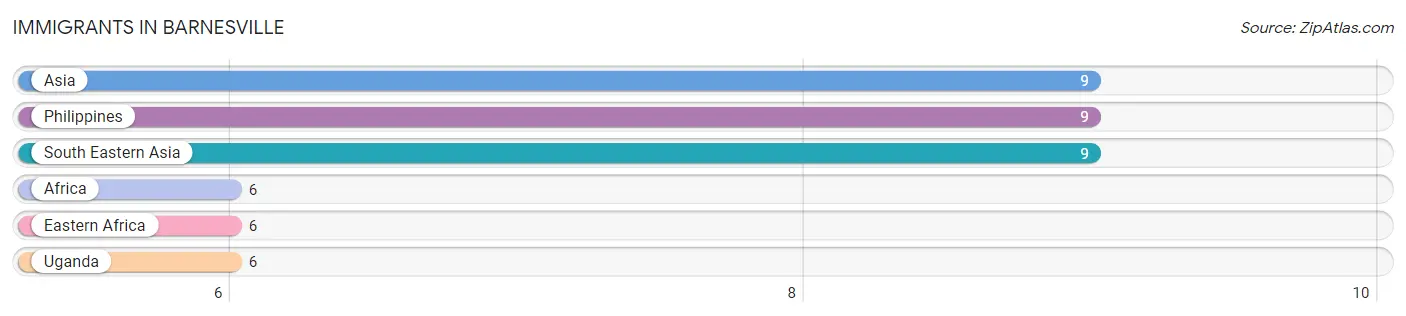
| Immigration Origin | # Population | % Population |
| Africa | 6 | 0.2% |
| Asia | 9 | 0.3% |
| Eastern Africa | 6 | 0.2% |
| Philippines | 9 | 0.3% |
| South Eastern Asia | 9 | 0.3% |
| Uganda | 6 | 0.2% | View All 6 Rows |
Sex and Age in Barnesville
Sex and Age in Barnesville
The most populous age groups in Barnesville are 35 to 39 Years (168 | 12.5%) for men and 5 to 9 Years (195 | 13.7%) for women.
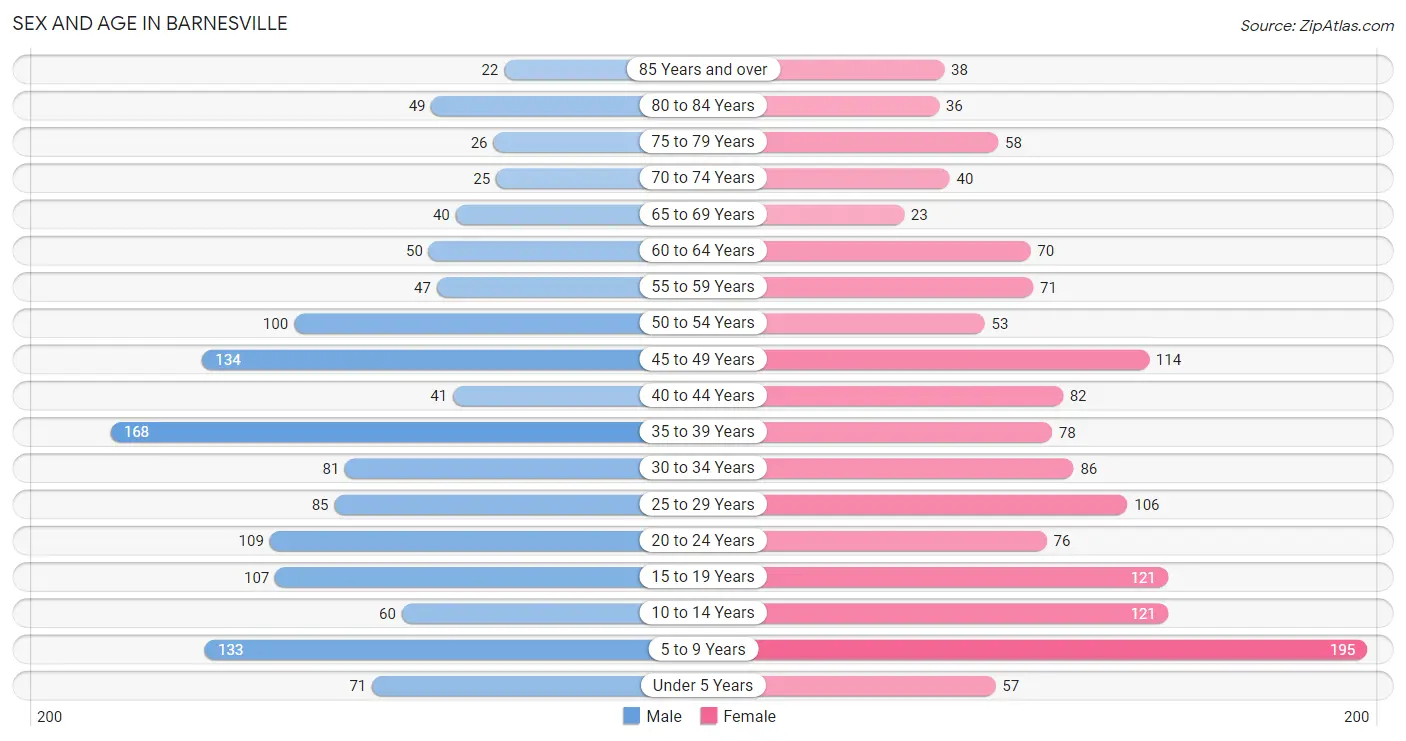
| Age Bracket | Male | Female |
| Under 5 Years | 71 (5.3%) | 57 (4.0%) |
| 5 to 9 Years | 133 (9.9%) | 195 (13.7%) |
| 10 to 14 Years | 60 (4.4%) | 121 (8.5%) |
| 15 to 19 Years | 107 (7.9%) | 121 (8.5%) |
| 20 to 24 Years | 109 (8.1%) | 76 (5.3%) |
| 25 to 29 Years | 85 (6.3%) | 106 (7.4%) |
| 30 to 34 Years | 81 (6.0%) | 86 (6.0%) |
| 35 to 39 Years | 168 (12.5%) | 78 (5.5%) |
| 40 to 44 Years | 41 (3.0%) | 82 (5.8%) |
| 45 to 49 Years | 134 (9.9%) | 114 (8.0%) |
| 50 to 54 Years | 100 (7.4%) | 53 (3.7%) |
| 55 to 59 Years | 47 (3.5%) | 71 (5.0%) |
| 60 to 64 Years | 50 (3.7%) | 70 (4.9%) |
| 65 to 69 Years | 40 (3.0%) | 23 (1.6%) |
| 70 to 74 Years | 25 (1.8%) | 40 (2.8%) |
| 75 to 79 Years | 26 (1.9%) | 58 (4.1%) |
| 80 to 84 Years | 49 (3.6%) | 36 (2.5%) |
| 85 Years and over | 22 (1.6%) | 38 (2.7%) |
| Total | 1,348 (100.0%) | 1,425 (100.0%) |
Families and Households in Barnesville
Median Family Size in Barnesville
The median family size in Barnesville is 3.15 persons per family, with married-couple families (549 | 76.6%) accounting for the largest median family size of 3.42 persons per family. On the other hand, single female/mother families (114 | 15.9%) represent the smallest median family size with 2.25 persons per family.
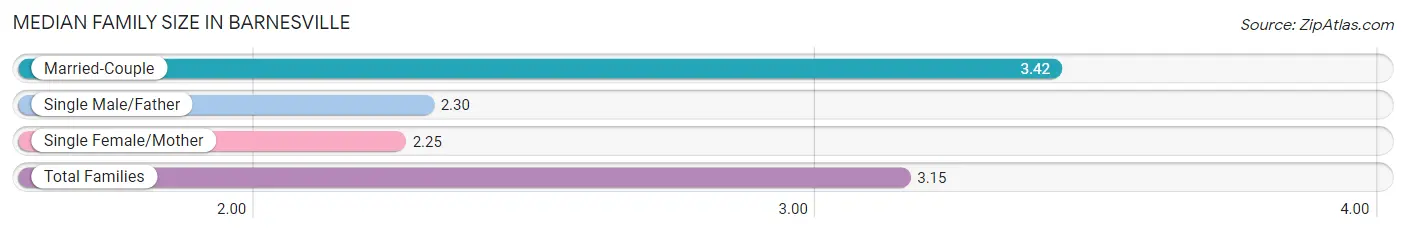
| Family Type | # Families | Family Size |
| Married-Couple | 549 (76.6%) | 3.42 |
| Single Male/Father | 54 (7.5%) | 2.30 |
| Single Female/Mother | 114 (15.9%) | 2.25 |
| Total Families | 717 (100.0%) | 3.15 |
Median Household Size in Barnesville
The median household size in Barnesville is 2.63 persons per household, with married-couple households (549 | 52.8%) accounting for the largest median household size of 3.5 persons per household. non-family households (323 | 31.1%) represent the smallest median household size with 1.06 persons per household.
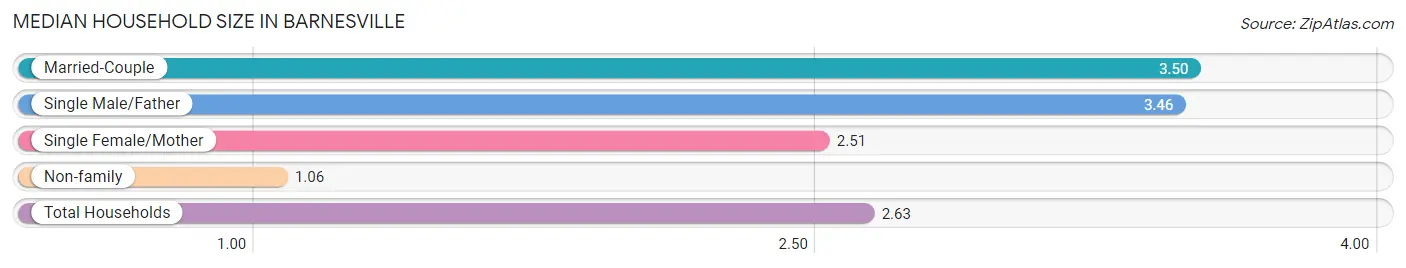
| Household Type | # Households | Household Size |
| Married-Couple | 549 (52.8%) | 3.50 |
| Single Male/Father | 54 (5.2%) | 3.46 |
| Single Female/Mother | 114 (11.0%) | 2.51 |
| Non-family | 323 (31.1%) | 1.06 |
| Total Households | 1,040 (100.0%) | 2.63 |
Household Size by Marriage Status in Barnesville
Out of a total of 1,040 households in Barnesville, 717 (68.9%) are family households, while 323 (31.1%) are nonfamily households. The most numerous type of family households are 2-person households, comprising 292, and the most common type of nonfamily households are 1-person households, comprising 302.
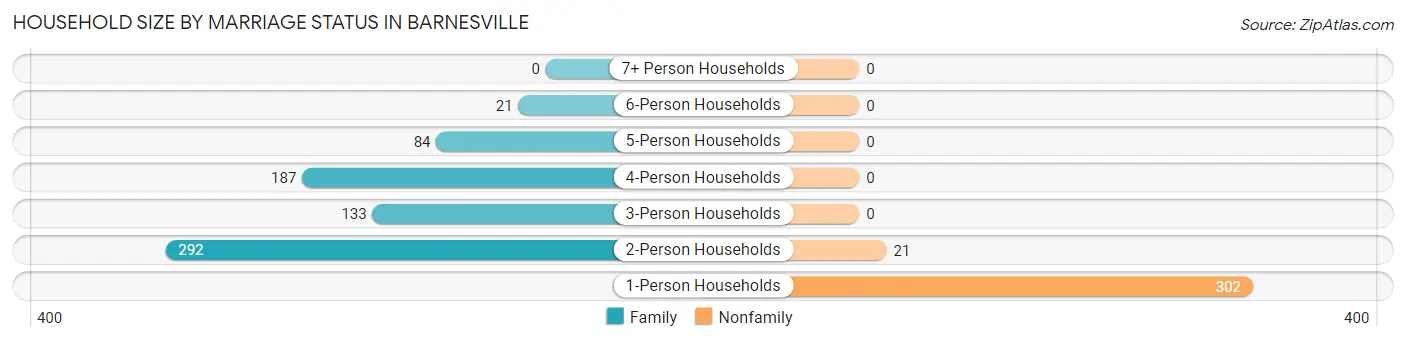
| Household Size | Family Households | Nonfamily Households |
| 1-Person Households | - | 302 (29.0%) |
| 2-Person Households | 292 (28.1%) | 21 (2.0%) |
| 3-Person Households | 133 (12.8%) | 0 (0.0%) |
| 4-Person Households | 187 (18.0%) | 0 (0.0%) |
| 5-Person Households | 84 (8.1%) | 0 (0.0%) |
| 6-Person Households | 21 (2.0%) | 0 (0.0%) |
| 7+ Person Households | 0 (0.0%) | 0 (0.0%) |
| Total | 717 (68.9%) | 323 (31.1%) |
Female Fertility in Barnesville
Fertility by Age in Barnesville
Average fertility rate in Barnesville is 27.0 births per 1,000 women. Women in the age bracket of 20 to 34 years have the highest fertility rate with 41.0 births per 1,000 women. Women in the age bracket of 20 to 34 years acount for 61.1% of all women with births.
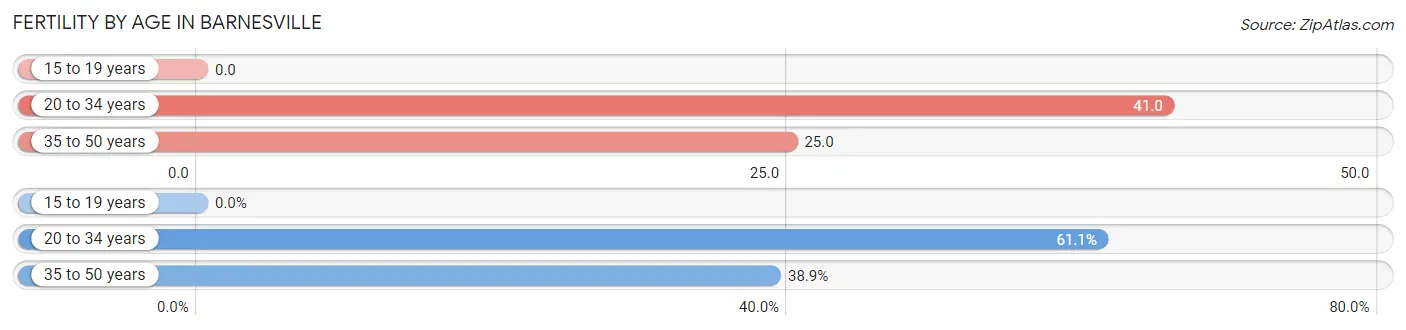
| Age Bracket | Women with Births | Births / 1,000 Women |
| 15 to 19 years | 0 (0.0%) | 0.0 |
| 20 to 34 years | 11 (61.1%) | 41.0 |
| 35 to 50 years | 7 (38.9%) | 25.0 |
| Total | 18 (100.0%) | 27.0 |
Fertility by Age by Marriage Status in Barnesville
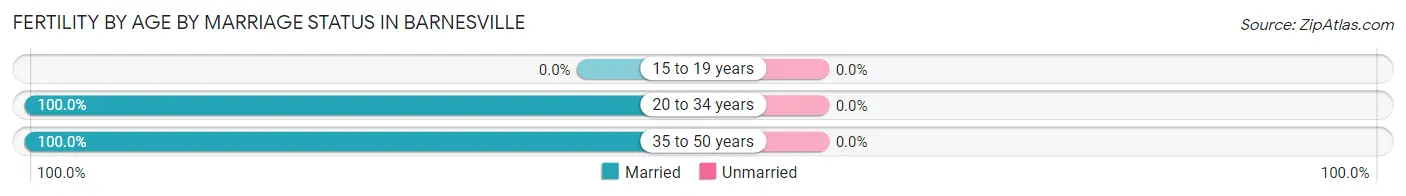
| Age Bracket | Married | Unmarried |
| 15 to 19 years | 0 (0.0%) | 0 (0.0%) |
| 20 to 34 years | 11 (100.0%) | 0 (0.0%) |
| 35 to 50 years | 7 (100.0%) | 0 (0.0%) |
| Total | 18 (100.0%) | 0 (0.0%) |
Fertility by Education in Barnesville
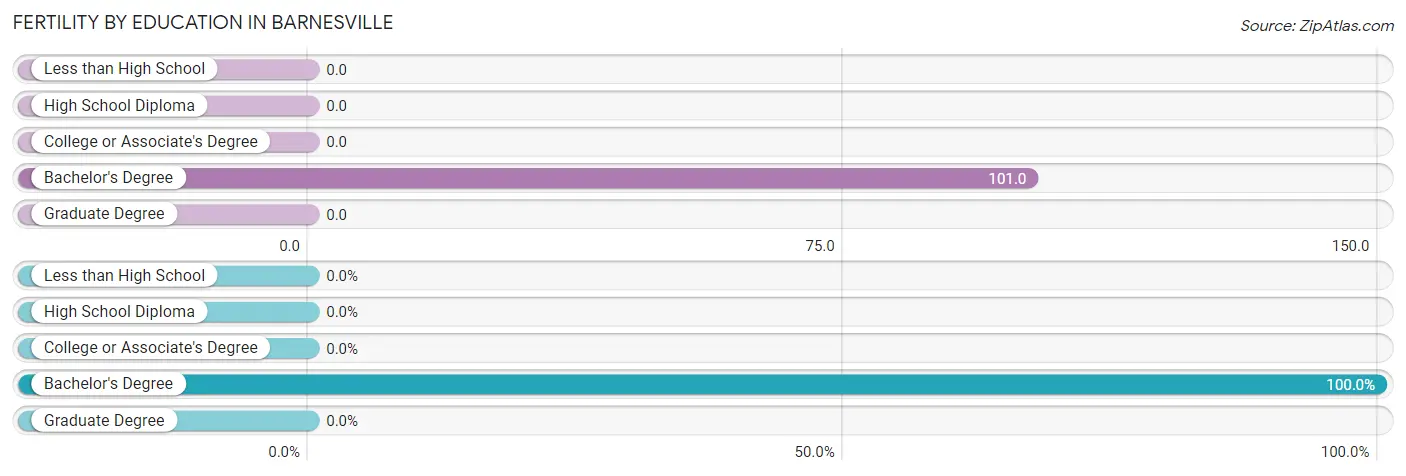
| Educational Attainment | Women with Births | Births / 1,000 Women |
| Less than High School | 0 (0.0%) | 0.0 |
| High School Diploma | 0 (0.0%) | 0.0 |
| College or Associate's Degree | 0 (0.0%) | 0.0 |
| Bachelor's Degree | 18 (100.0%) | 101.0 |
| Graduate Degree | 0 (0.0%) | 0.0 |
| Total | 18 (100.0%) | 27.0 |
Fertility by Education by Marriage Status in Barnesville
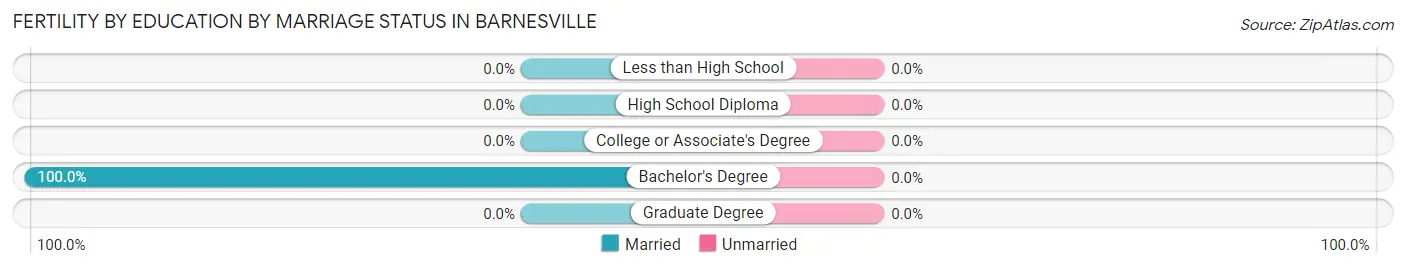
| Educational Attainment | Married | Unmarried |
| Less than High School | 0 (0.0%) | 0 (0.0%) |
| High School Diploma | 0 (0.0%) | 0 (0.0%) |
| College or Associate's Degree | 0 (0.0%) | 0 (0.0%) |
| Bachelor's Degree | 18 (100.0%) | 0 (0.0%) |
| Graduate Degree | 0 (0.0%) | 0 (0.0%) |
| Total | 18 (100.0%) | 0 (0.0%) |
Employment Characteristics in Barnesville
Employment by Class of Employer in Barnesville
Among the 1,463 employed individuals in Barnesville, private company employees (902 | 61.7%), local government employees (243 | 16.6%), and not-for-profit organizations (174 | 11.9%) make up the most common classes of employment.
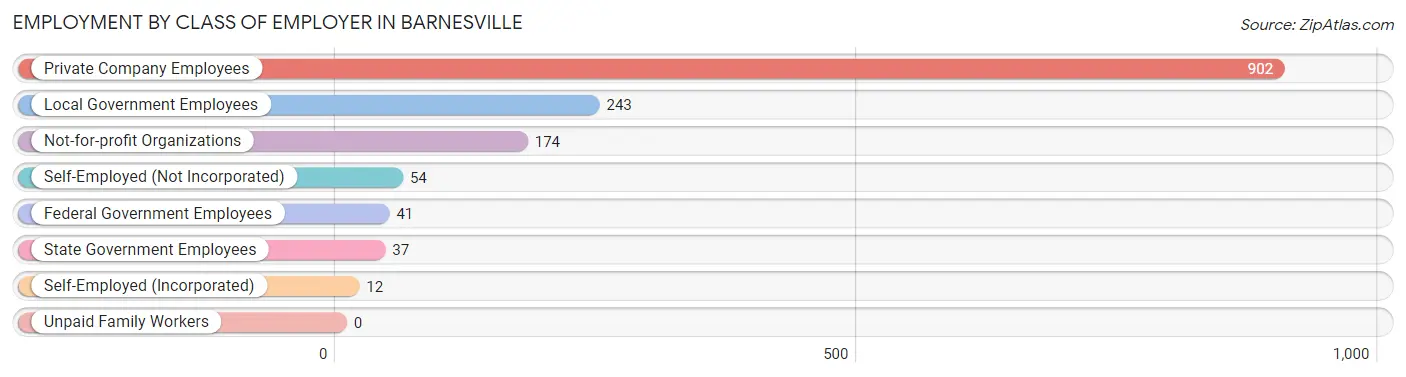
| Employer Class | # Employees | % Employees |
| Private Company Employees | 902 | 61.7% |
| Self-Employed (Incorporated) | 12 | 0.8% |
| Self-Employed (Not Incorporated) | 54 | 3.7% |
| Not-for-profit Organizations | 174 | 11.9% |
| Local Government Employees | 243 | 16.6% |
| State Government Employees | 37 | 2.5% |
| Federal Government Employees | 41 | 2.8% |
| Unpaid Family Workers | 0 | 0.0% |
| Total | 1,463 | 100.0% |
Employment Status by Age in Barnesville
According to the labor force statistics for Barnesville, out of the total population over 16 years of age (2,066), 72.1% or 1,490 individuals are in the labor force, with 1.3% or 19 of them unemployed. The age group with the highest labor force participation rate is 25 to 29 years, with 100.0% or 191 individuals in the labor force. Within the labor force, the 65 to 74 years age range has the highest percentage of unemployed individuals, with 15.7% or 8 of them being unemployed.
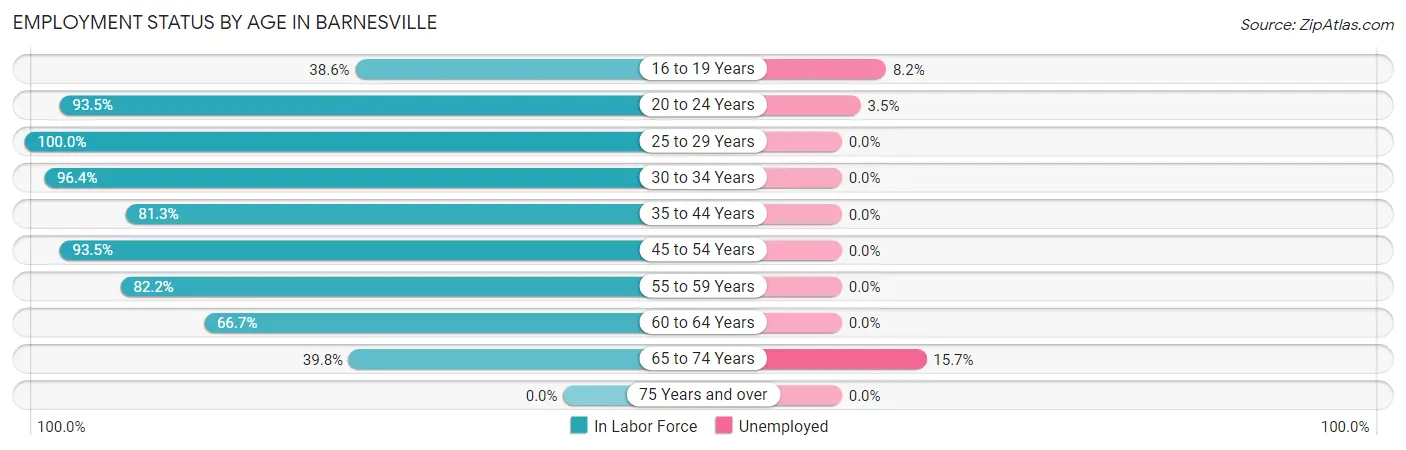
| Age Bracket | In Labor Force | Unemployed |
| 16 to 19 Years | 61 (38.6%) | 5 (8.2%) |
| 20 to 24 Years | 173 (93.5%) | 6 (3.5%) |
| 25 to 29 Years | 191 (100.0%) | 0 (0.0%) |
| 30 to 34 Years | 161 (96.4%) | 0 (0.0%) |
| 35 to 44 Years | 300 (81.3%) | 0 (0.0%) |
| 45 to 54 Years | 375 (93.5%) | 0 (0.0%) |
| 55 to 59 Years | 97 (82.2%) | 0 (0.0%) |
| 60 to 64 Years | 80 (66.7%) | 0 (0.0%) |
| 65 to 74 Years | 51 (39.8%) | 8 (15.7%) |
| 75 Years and over | 0 (0.0%) | 0 (0.0%) |
| Total | 1,490 (72.1%) | 19 (1.3%) |
Employment Status by Educational Attainment in Barnesville
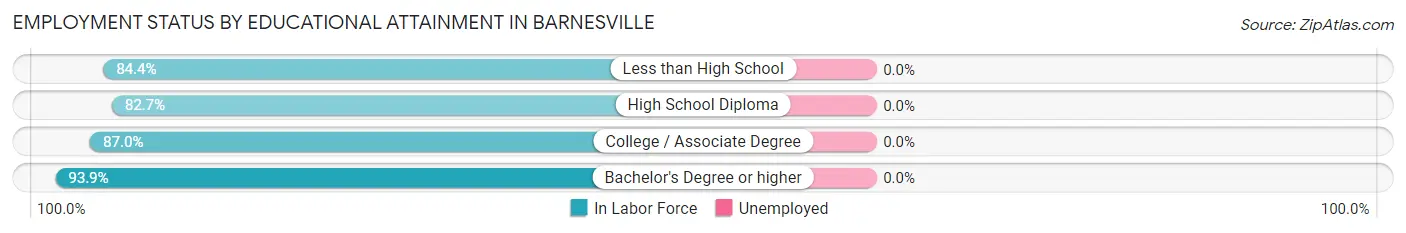
| Educational Attainment | In Labor Force | Unemployed |
| Less than High School | 27 (84.4%) | 0 (0.0%) |
| High School Diploma | 244 (82.7%) | 0 (0.0%) |
| College / Associate Degree | 536 (87.0%) | 0 (0.0%) |
| Bachelor's Degree or higher | 397 (93.9%) | 0 (0.0%) |
| Total | 1,203 (88.1%) | 0 (0.0%) |
Employment Occupations by Sex in Barnesville
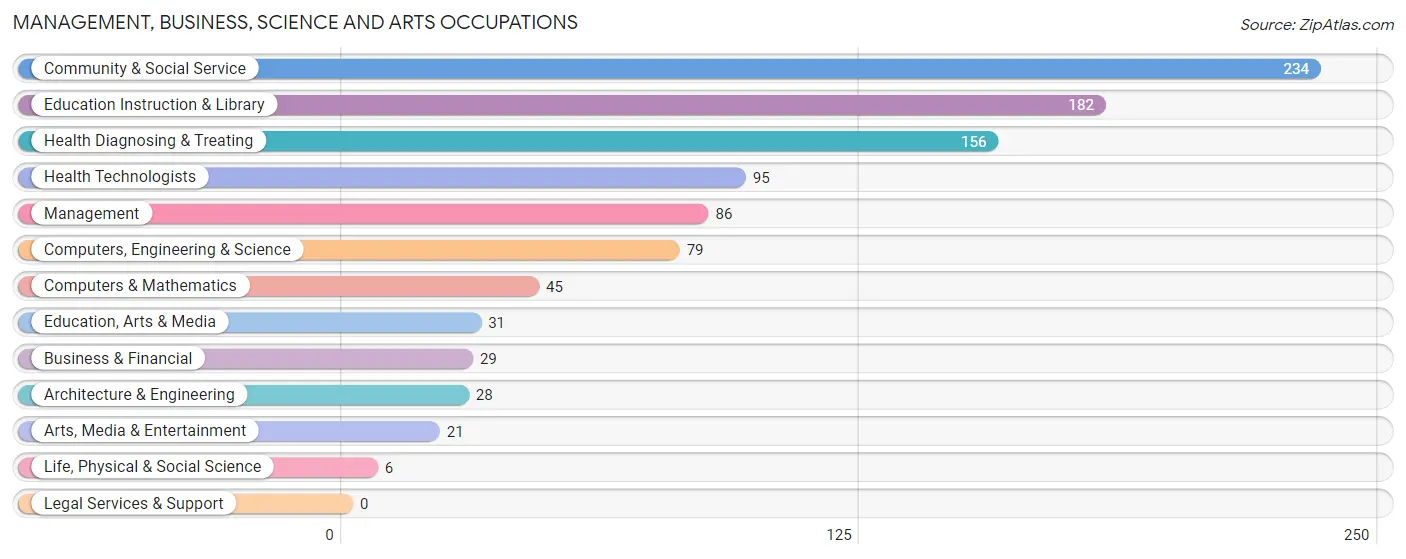
Management, Business, Science and Arts Occupations
The most common Management, Business, Science and Arts occupations in Barnesville are Community & Social Service (234 | 15.9%), Education Instruction & Library (182 | 12.4%), Health Diagnosing & Treating (156 | 10.6%), Health Technologists (95 | 6.5%), and Management (86 | 5.9%).
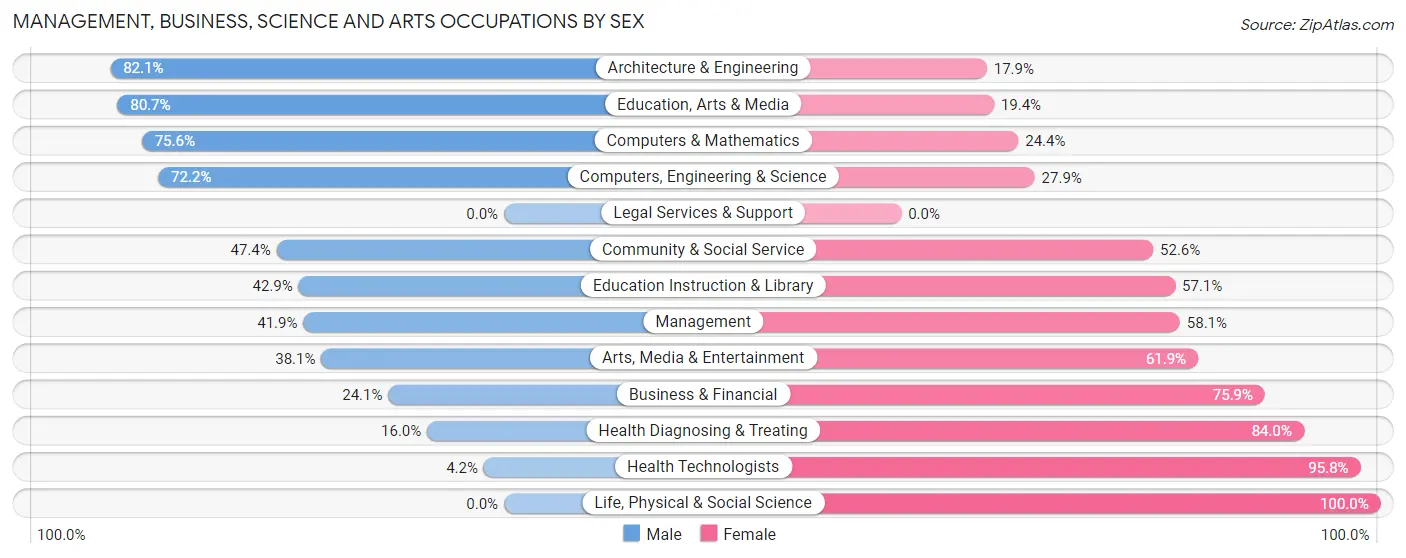
Management, Business, Science and Arts Occupations by Sex
Within the Management, Business, Science and Arts occupations in Barnesville, the most male-oriented occupations are Architecture & Engineering (82.1%), Education, Arts & Media (80.6%), and Computers & Mathematics (75.6%), while the most female-oriented occupations are Life, Physical & Social Science (100.0%), Health Technologists (95.8%), and Health Diagnosing & Treating (84.0%).
| Occupation | Male | Female |
| Management | 36 (41.9%) | 50 (58.1%) |
| Business & Financial | 7 (24.1%) | 22 (75.9%) |
| Computers, Engineering & Science | 57 (72.2%) | 22 (27.9%) |
| Computers & Mathematics | 34 (75.6%) | 11 (24.4%) |
| Architecture & Engineering | 23 (82.1%) | 5 (17.9%) |
| Life, Physical & Social Science | 0 (0.0%) | 6 (100.0%) |
| Community & Social Service | 111 (47.4%) | 123 (52.6%) |
| Education, Arts & Media | 25 (80.6%) | 6 (19.4%) |
| Legal Services & Support | 0 (0.0%) | 0 (0.0%) |
| Education Instruction & Library | 78 (42.9%) | 104 (57.1%) |
| Arts, Media & Entertainment | 8 (38.1%) | 13 (61.9%) |
| Health Diagnosing & Treating | 25 (16.0%) | 131 (84.0%) |
| Health Technologists | 4 (4.2%) | 91 (95.8%) |
| Total (Category) | 236 (40.4%) | 348 (59.6%) |
| Total (Overall) | 781 (53.1%) | 689 (46.9%) |
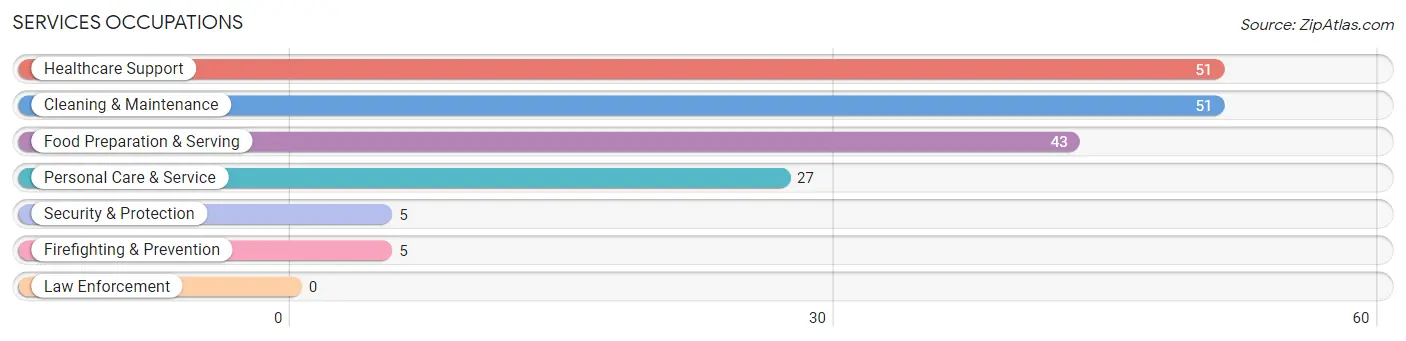
Services Occupations
The most common Services occupations in Barnesville are Healthcare Support (51 | 3.5%), Cleaning & Maintenance (51 | 3.5%), Food Preparation & Serving (43 | 2.9%), Personal Care & Service (27 | 1.8%), and Security & Protection (5 | 0.3%).
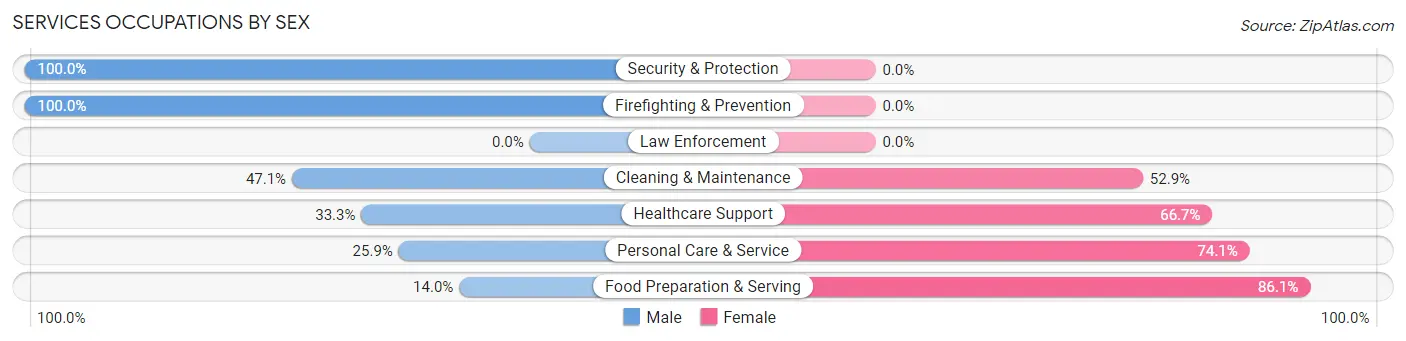
Services Occupations by Sex
Within the Services occupations in Barnesville, the most male-oriented occupations are Security & Protection (100.0%), Firefighting & Prevention (100.0%), and Cleaning & Maintenance (47.1%), while the most female-oriented occupations are Food Preparation & Serving (86.1%), Personal Care & Service (74.1%), and Healthcare Support (66.7%).
| Occupation | Male | Female |
| Healthcare Support | 17 (33.3%) | 34 (66.7%) |
| Security & Protection | 5 (100.0%) | 0 (0.0%) |
| Firefighting & Prevention | 5 (100.0%) | 0 (0.0%) |
| Law Enforcement | 0 (0.0%) | 0 (0.0%) |
| Food Preparation & Serving | 6 (14.0%) | 37 (86.1%) |
| Cleaning & Maintenance | 24 (47.1%) | 27 (52.9%) |
| Personal Care & Service | 7 (25.9%) | 20 (74.1%) |
| Total (Category) | 59 (33.3%) | 118 (66.7%) |
| Total (Overall) | 781 (53.1%) | 689 (46.9%) |
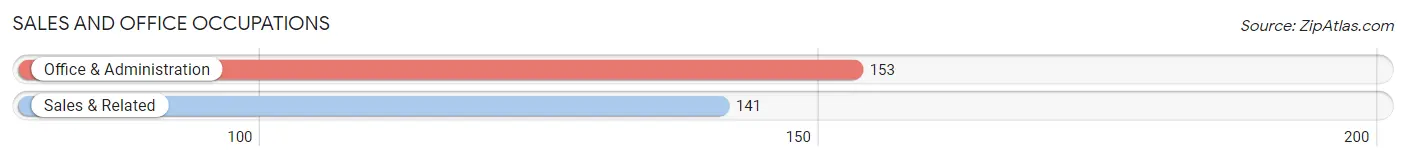
Sales and Office Occupations
The most common Sales and Office occupations in Barnesville are Office & Administration (153 | 10.4%), and Sales & Related (141 | 9.6%).
Sales and Office Occupations by Sex
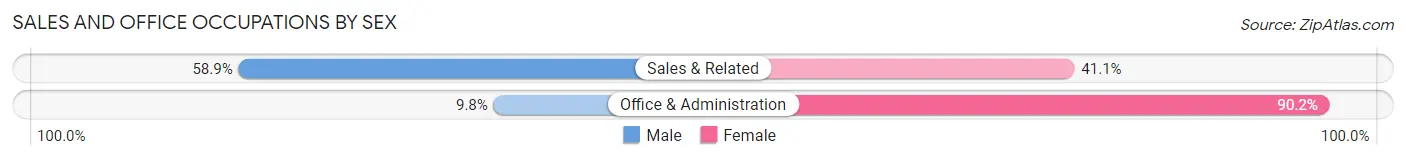
| Occupation | Male | Female |
| Sales & Related | 83 (58.9%) | 58 (41.1%) |
| Office & Administration | 15 (9.8%) | 138 (90.2%) |
| Total (Category) | 98 (33.3%) | 196 (66.7%) |
| Total (Overall) | 781 (53.1%) | 689 (46.9%) |
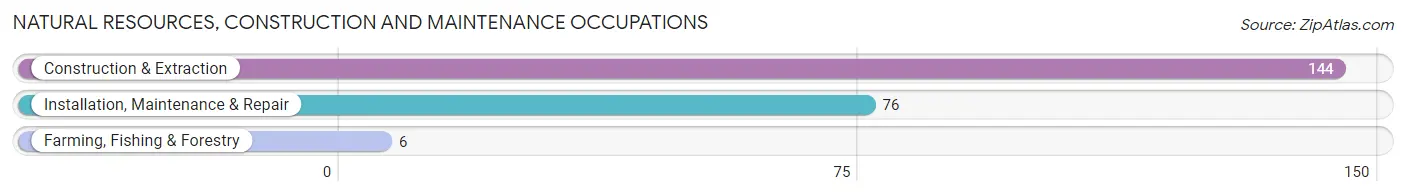
Natural Resources, Construction and Maintenance Occupations
The most common Natural Resources, Construction and Maintenance occupations in Barnesville are Construction & Extraction (144 | 9.8%), Installation, Maintenance & Repair (76 | 5.2%), and Farming, Fishing & Forestry (6 | 0.4%).
Natural Resources, Construction and Maintenance Occupations by Sex
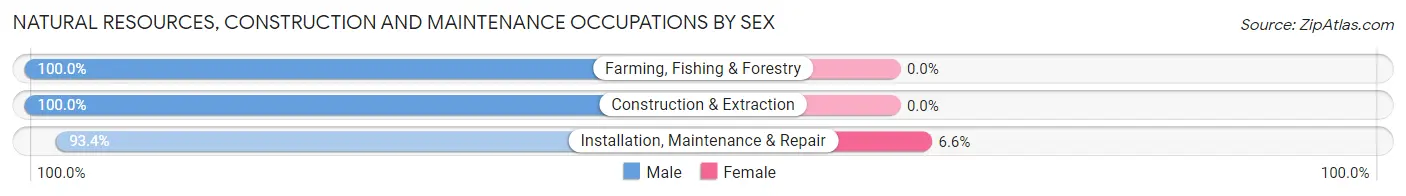
| Occupation | Male | Female |
| Farming, Fishing & Forestry | 6 (100.0%) | 0 (0.0%) |
| Construction & Extraction | 144 (100.0%) | 0 (0.0%) |
| Installation, Maintenance & Repair | 71 (93.4%) | 5 (6.6%) |
| Total (Category) | 221 (97.8%) | 5 (2.2%) |
| Total (Overall) | 781 (53.1%) | 689 (46.9%) |
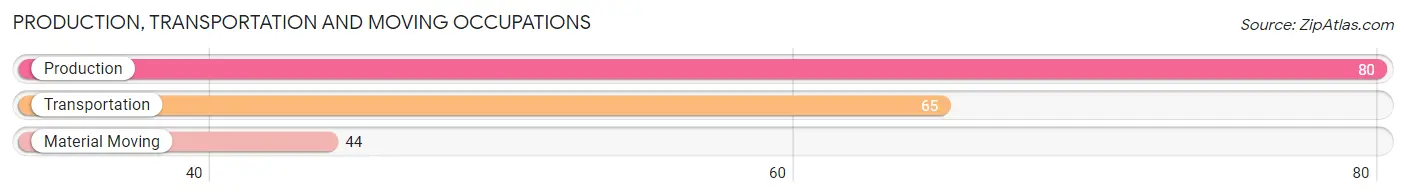
Production, Transportation and Moving Occupations
The most common Production, Transportation and Moving occupations in Barnesville are Production (80 | 5.4%), Transportation (65 | 4.4%), and Material Moving (44 | 3.0%).
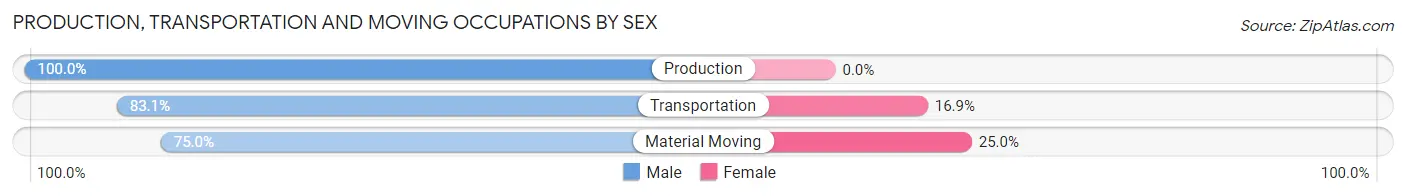
Production, Transportation and Moving Occupations by Sex
| Occupation | Male | Female |
| Production | 80 (100.0%) | 0 (0.0%) |
| Transportation | 54 (83.1%) | 11 (16.9%) |
| Material Moving | 33 (75.0%) | 11 (25.0%) |
| Total (Category) | 167 (88.4%) | 22 (11.6%) |
| Total (Overall) | 781 (53.1%) | 689 (46.9%) |
Employment Industries by Sex in Barnesville
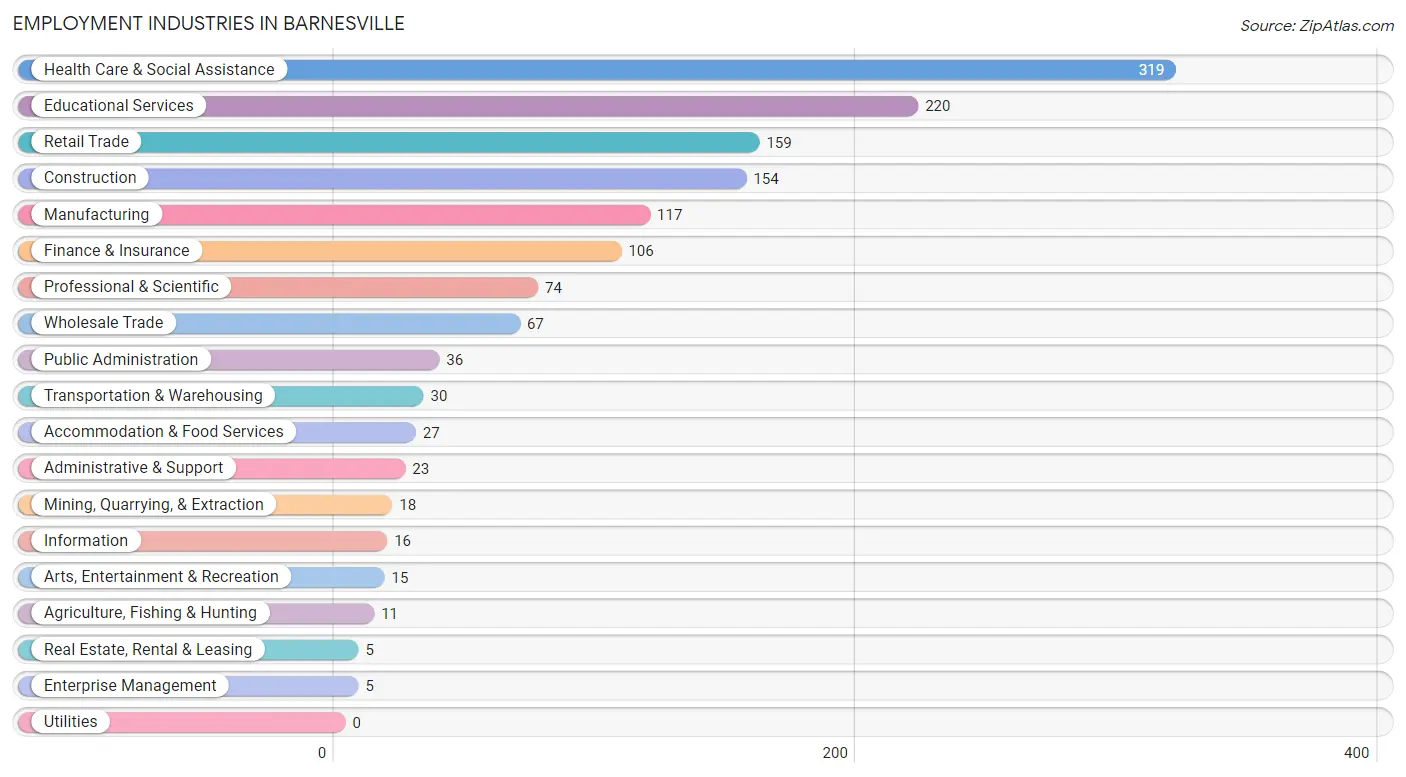
Employment Industries in Barnesville
The major employment industries in Barnesville include Health Care & Social Assistance (319 | 21.7%), Educational Services (220 | 15.0%), Retail Trade (159 | 10.8%), Construction (154 | 10.5%), and Manufacturing (117 | 8.0%).
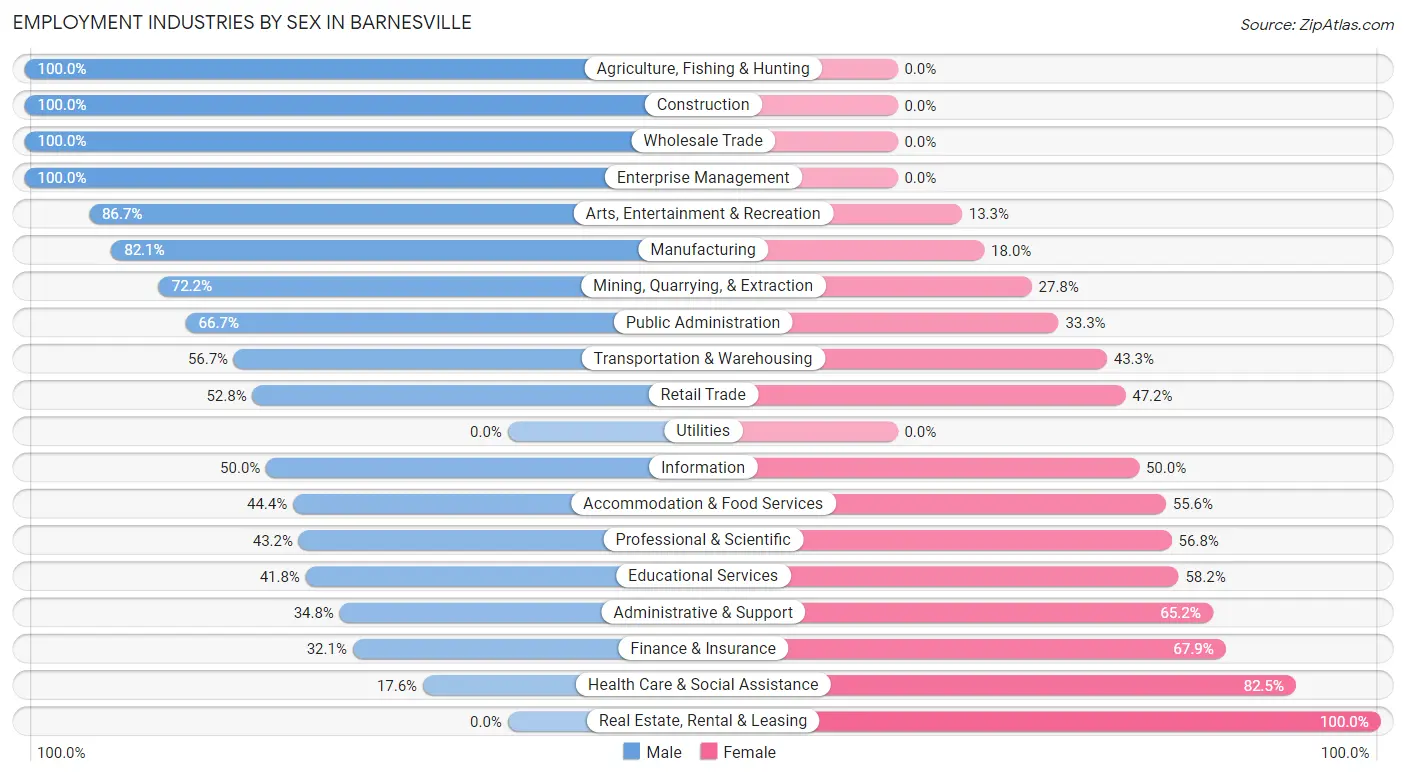
Employment Industries by Sex in Barnesville
The Barnesville industries that see more men than women are Agriculture, Fishing & Hunting (100.0%), Construction (100.0%), and Wholesale Trade (100.0%), whereas the industries that tend to have a higher number of women are Real Estate, Rental & Leasing (100.0%), Health Care & Social Assistance (82.5%), and Finance & Insurance (67.9%).
| Industry | Male | Female |
| Agriculture, Fishing & Hunting | 11 (100.0%) | 0 (0.0%) |
| Mining, Quarrying, & Extraction | 13 (72.2%) | 5 (27.8%) |
| Construction | 154 (100.0%) | 0 (0.0%) |
| Manufacturing | 96 (82.1%) | 21 (17.9%) |
| Wholesale Trade | 67 (100.0%) | 0 (0.0%) |
| Retail Trade | 84 (52.8%) | 75 (47.2%) |
| Transportation & Warehousing | 17 (56.7%) | 13 (43.3%) |
| Utilities | 0 (0.0%) | 0 (0.0%) |
| Information | 8 (50.0%) | 8 (50.0%) |
| Finance & Insurance | 34 (32.1%) | 72 (67.9%) |
| Real Estate, Rental & Leasing | 0 (0.0%) | 5 (100.0%) |
| Professional & Scientific | 32 (43.2%) | 42 (56.8%) |
| Enterprise Management | 5 (100.0%) | 0 (0.0%) |
| Administrative & Support | 8 (34.8%) | 15 (65.2%) |
| Educational Services | 92 (41.8%) | 128 (58.2%) |
| Health Care & Social Assistance | 56 (17.5%) | 263 (82.5%) |
| Arts, Entertainment & Recreation | 13 (86.7%) | 2 (13.3%) |
| Accommodation & Food Services | 12 (44.4%) | 15 (55.6%) |
| Public Administration | 24 (66.7%) | 12 (33.3%) |
| Total | 781 (53.1%) | 689 (46.9%) |
Education in Barnesville
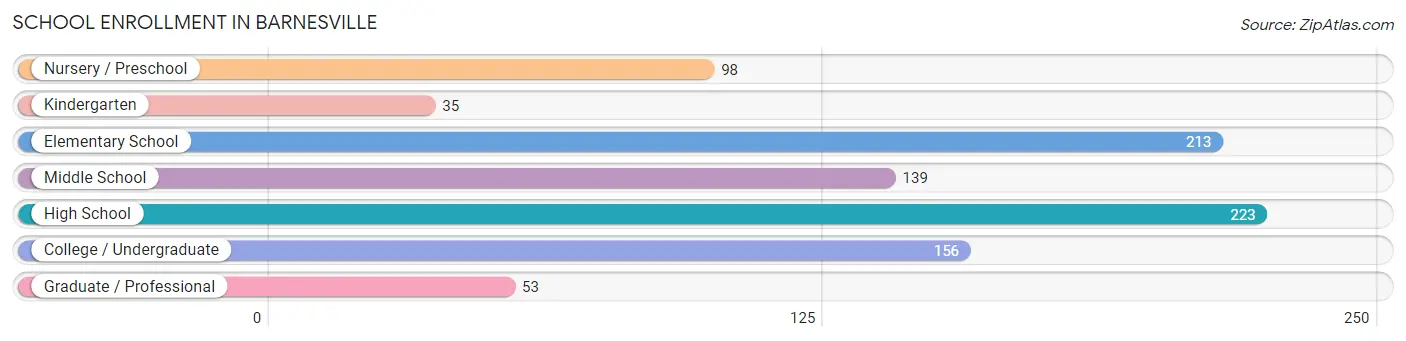
School Enrollment in Barnesville
The most common levels of schooling among the 917 students in Barnesville are high school (223 | 24.3%), elementary school (213 | 23.2%), and college / undergraduate (156 | 17.0%).
| School Level | # Students | % Students |
| Nursery / Preschool | 98 | 10.7% |
| Kindergarten | 35 | 3.8% |
| Elementary School | 213 | 23.2% |
| Middle School | 139 | 15.2% |
| High School | 223 | 24.3% |
| College / Undergraduate | 156 | 17.0% |
| Graduate / Professional | 53 | 5.8% |
| Total | 917 | 100.0% |
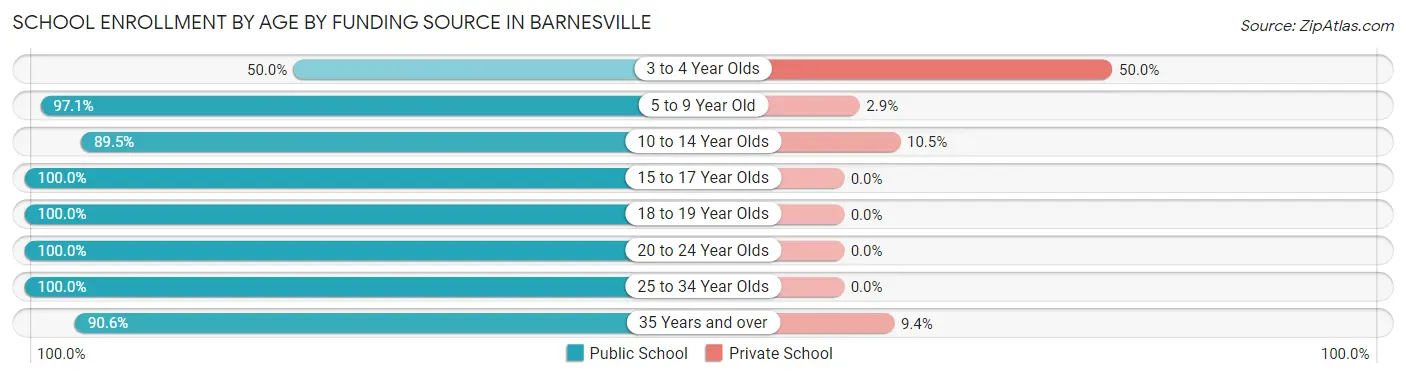
School Enrollment by Age by Funding Source in Barnesville
Out of a total of 917 students who are enrolled in schools in Barnesville, 37 (4.0%) attend a private institution, while the remaining 880 (96.0%) are enrolled in public schools. The age group of 3 to 4 year olds has the highest likelihood of being enrolled in private schools, with 6 (50.0% in the age bracket) enrolled. Conversely, the age group of 15 to 17 year olds has the lowest likelihood of being enrolled in a private school, with 170 (100.0% in the age bracket) attending a public institution.
| Age Bracket | Public School | Private School |
| 3 to 4 Year Olds | 6 (50.0%) | 6 (50.0%) |
| 5 to 9 Year Old | 298 (97.1%) | 9 (2.9%) |
| 10 to 14 Year Olds | 162 (89.5%) | 19 (10.5%) |
| 15 to 17 Year Olds | 170 (100.0%) | 0 (0.0%) |
| 18 to 19 Year Olds | 50 (100.0%) | 0 (0.0%) |
| 20 to 24 Year Olds | 112 (100.0%) | 0 (0.0%) |
| 25 to 34 Year Olds | 53 (100.0%) | 0 (0.0%) |
| 35 Years and over | 29 (90.6%) | 3 (9.4%) |
| Total | 880 (96.0%) | 37 (4.0%) |
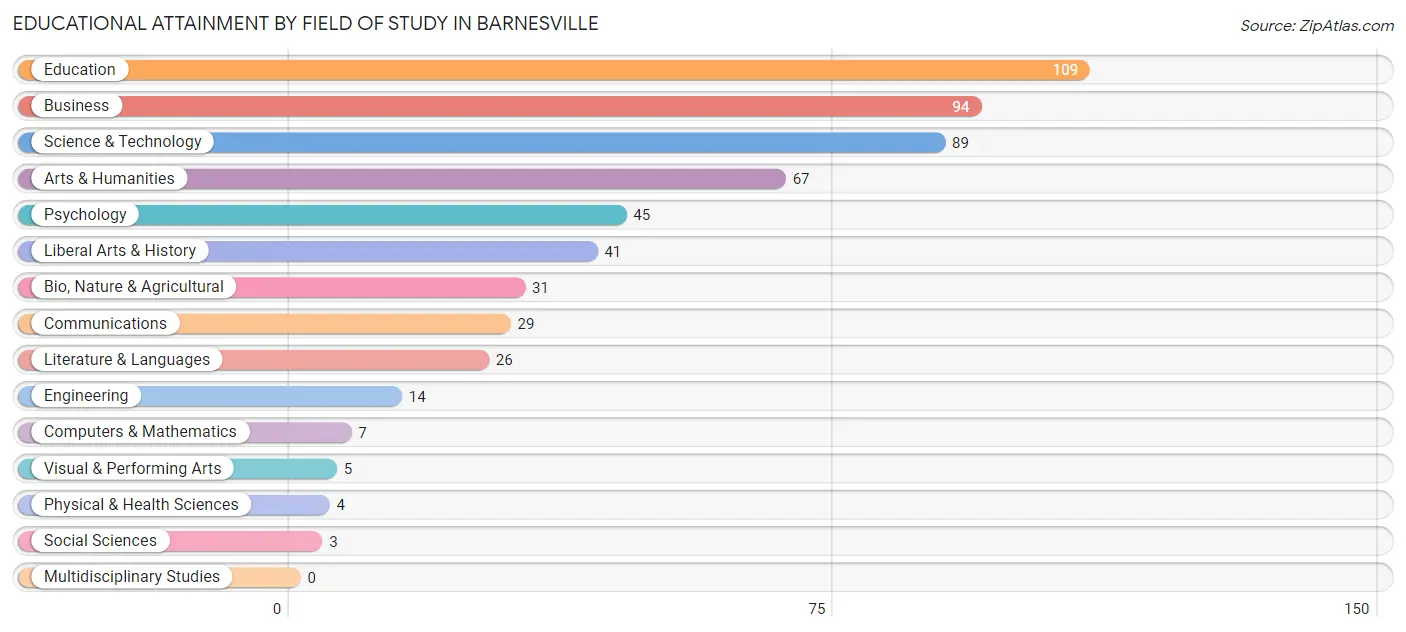
Educational Attainment by Field of Study in Barnesville
Education (109 | 19.3%), business (94 | 16.7%), science & technology (89 | 15.8%), arts & humanities (67 | 11.9%), and psychology (45 | 8.0%) are the most common fields of study among 564 individuals in Barnesville who have obtained a bachelor's degree or higher.
| Field of Study | # Graduates | % Graduates |
| Computers & Mathematics | 7 | 1.2% |
| Bio, Nature & Agricultural | 31 | 5.5% |
| Physical & Health Sciences | 4 | 0.7% |
| Psychology | 45 | 8.0% |
| Social Sciences | 3 | 0.5% |
| Engineering | 14 | 2.5% |
| Multidisciplinary Studies | 0 | 0.0% |
| Science & Technology | 89 | 15.8% |
| Business | 94 | 16.7% |
| Education | 109 | 19.3% |
| Literature & Languages | 26 | 4.6% |
| Liberal Arts & History | 41 | 7.3% |
| Visual & Performing Arts | 5 | 0.9% |
| Communications | 29 | 5.1% |
| Arts & Humanities | 67 | 11.9% |
| Total | 564 | 100.0% |
Transportation & Commute in Barnesville
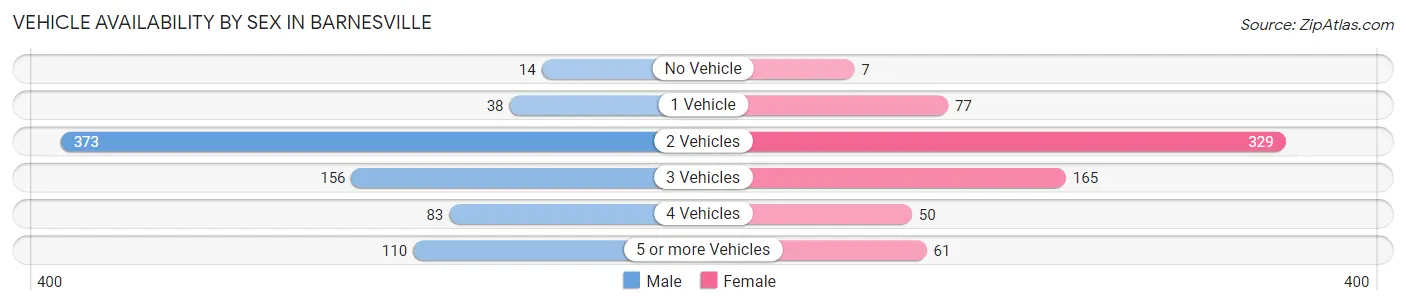
Vehicle Availability by Sex in Barnesville
The most prevalent vehicle ownership categories in Barnesville are males with 2 vehicles (373, accounting for 48.2%) and females with 2 vehicles (329, making up 54.1%).
| Vehicles Available | Male | Female |
| No Vehicle | 14 (1.8%) | 7 (1.0%) |
| 1 Vehicle | 38 (4.9%) | 77 (11.2%) |
| 2 Vehicles | 373 (48.2%) | 329 (47.7%) |
| 3 Vehicles | 156 (20.2%) | 165 (23.9%) |
| 4 Vehicles | 83 (10.7%) | 50 (7.3%) |
| 5 or more Vehicles | 110 (14.2%) | 61 (8.8%) |
| Total | 774 (100.0%) | 689 (100.0%) |
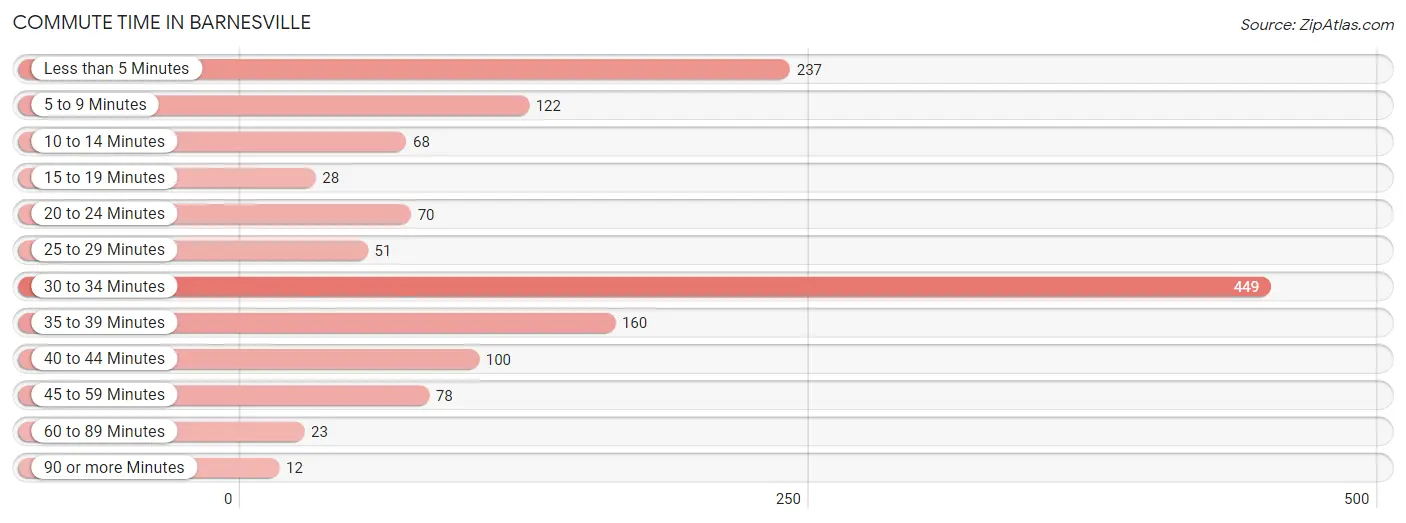
Commute Time in Barnesville
The most frequently occuring commute durations in Barnesville are 30 to 34 minutes (449 commuters, 32.1%), less than 5 minutes (237 commuters, 17.0%), and 35 to 39 minutes (160 commuters, 11.4%).
| Commute Time | # Commuters | % Commuters |
| Less than 5 Minutes | 237 | 17.0% |
| 5 to 9 Minutes | 122 | 8.7% |
| 10 to 14 Minutes | 68 | 4.9% |
| 15 to 19 Minutes | 28 | 2.0% |
| 20 to 24 Minutes | 70 | 5.0% |
| 25 to 29 Minutes | 51 | 3.6% |
| 30 to 34 Minutes | 449 | 32.1% |
| 35 to 39 Minutes | 160 | 11.4% |
| 40 to 44 Minutes | 100 | 7.1% |
| 45 to 59 Minutes | 78 | 5.6% |
| 60 to 89 Minutes | 23 | 1.7% |
| 90 or more Minutes | 12 | 0.9% |
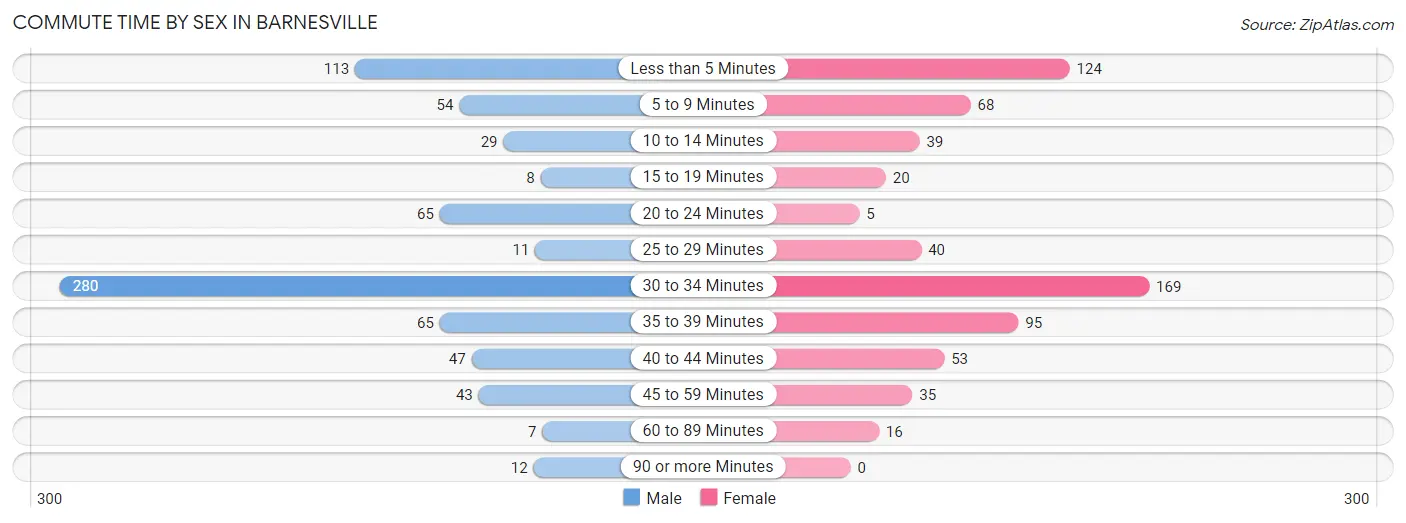
Commute Time by Sex in Barnesville
The most common commute times in Barnesville are 30 to 34 minutes (280 commuters, 38.2%) for males and 30 to 34 minutes (169 commuters, 25.5%) for females.
| Commute Time | Male | Female |
| Less than 5 Minutes | 113 (15.4%) | 124 (18.7%) |
| 5 to 9 Minutes | 54 (7.4%) | 68 (10.2%) |
| 10 to 14 Minutes | 29 (4.0%) | 39 (5.9%) |
| 15 to 19 Minutes | 8 (1.1%) | 20 (3.0%) |
| 20 to 24 Minutes | 65 (8.9%) | 5 (0.7%) |
| 25 to 29 Minutes | 11 (1.5%) | 40 (6.0%) |
| 30 to 34 Minutes | 280 (38.2%) | 169 (25.5%) |
| 35 to 39 Minutes | 65 (8.9%) | 95 (14.3%) |
| 40 to 44 Minutes | 47 (6.4%) | 53 (8.0%) |
| 45 to 59 Minutes | 43 (5.9%) | 35 (5.3%) |
| 60 to 89 Minutes | 7 (0.9%) | 16 (2.4%) |
| 90 or more Minutes | 12 (1.6%) | 0 (0.0%) |
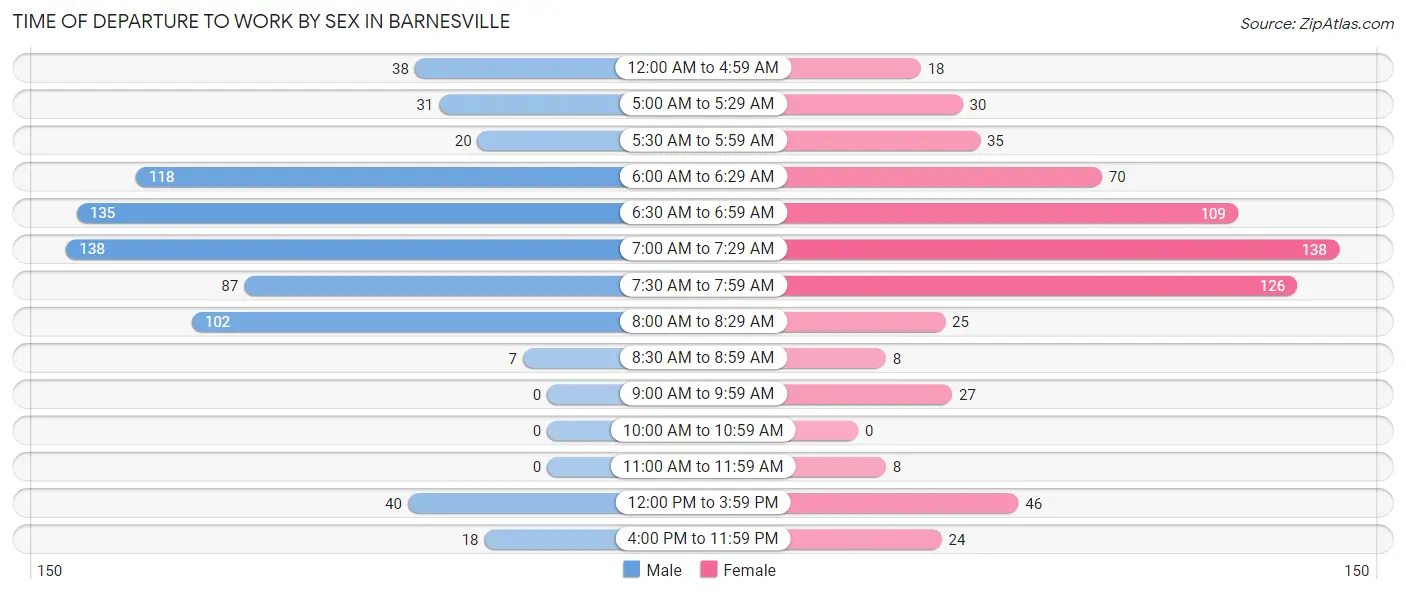
Time of Departure to Work by Sex in Barnesville
The most frequent times of departure to work in Barnesville are 7:00 AM to 7:29 AM (138, 18.8%) for males and 7:00 AM to 7:29 AM (138, 20.8%) for females.
| Time of Departure | Male | Female |
| 12:00 AM to 4:59 AM | 38 (5.2%) | 18 (2.7%) |
| 5:00 AM to 5:29 AM | 31 (4.2%) | 30 (4.5%) |
| 5:30 AM to 5:59 AM | 20 (2.7%) | 35 (5.3%) |
| 6:00 AM to 6:29 AM | 118 (16.1%) | 70 (10.5%) |
| 6:30 AM to 6:59 AM | 135 (18.4%) | 109 (16.4%) |
| 7:00 AM to 7:29 AM | 138 (18.8%) | 138 (20.8%) |
| 7:30 AM to 7:59 AM | 87 (11.8%) | 126 (19.0%) |
| 8:00 AM to 8:29 AM | 102 (13.9%) | 25 (3.8%) |
| 8:30 AM to 8:59 AM | 7 (0.9%) | 8 (1.2%) |
| 9:00 AM to 9:59 AM | 0 (0.0%) | 27 (4.1%) |
| 10:00 AM to 10:59 AM | 0 (0.0%) | 0 (0.0%) |
| 11:00 AM to 11:59 AM | 0 (0.0%) | 8 (1.2%) |
| 12:00 PM to 3:59 PM | 40 (5.4%) | 46 (6.9%) |
| 4:00 PM to 11:59 PM | 18 (2.5%) | 24 (3.6%) |
| Total | 734 (100.0%) | 664 (100.0%) |
Housing Occupancy in Barnesville
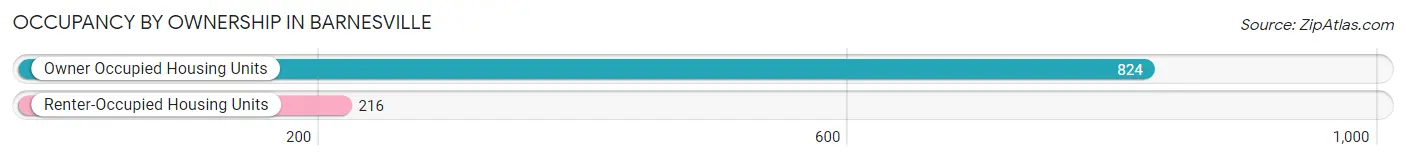
Occupancy by Ownership in Barnesville
Of the total 1,040 dwellings in Barnesville, owner-occupied units account for 824 (79.2%), while renter-occupied units make up 216 (20.8%).
| Occupancy | # Housing Units | % Housing Units |
| Owner Occupied Housing Units | 824 | 79.2% |
| Renter-Occupied Housing Units | 216 | 20.8% |
| Total Occupied Housing Units | 1,040 | 100.0% |
Occupancy by Household Size in Barnesville
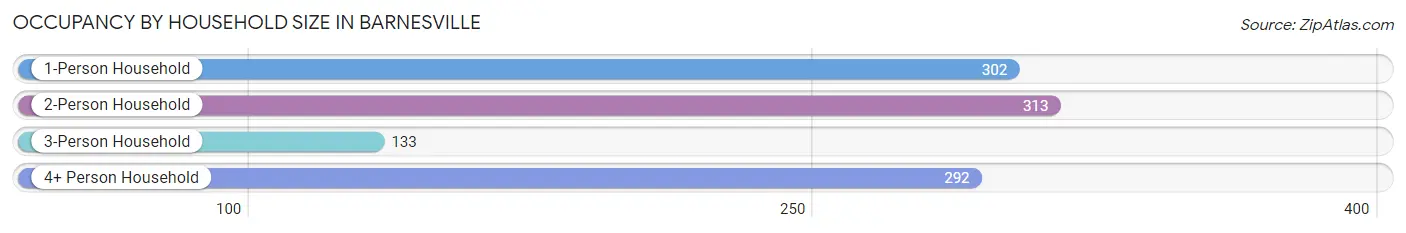
| Household Size | # Housing Units | % Housing Units |
| 1-Person Household | 302 | 29.0% |
| 2-Person Household | 313 | 30.1% |
| 3-Person Household | 133 | 12.8% |
| 4+ Person Household | 292 | 28.1% |
| Total Housing Units | 1,040 | 100.0% |
Occupancy by Ownership by Household Size in Barnesville
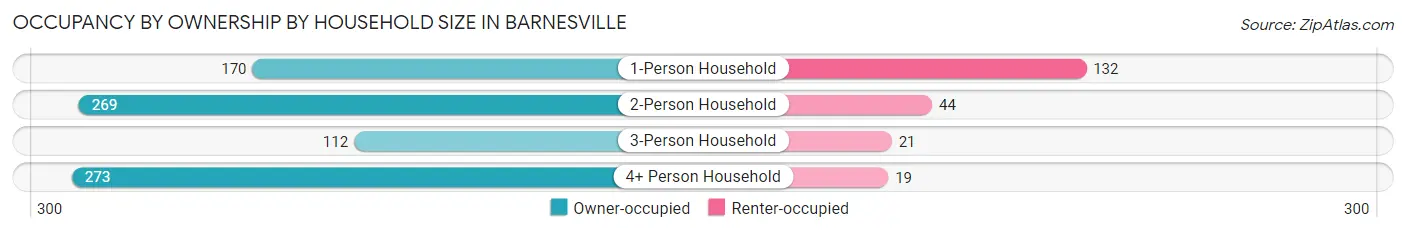
| Household Size | Owner-occupied | Renter-occupied |
| 1-Person Household | 170 (56.3%) | 132 (43.7%) |
| 2-Person Household | 269 (85.9%) | 44 (14.1%) |
| 3-Person Household | 112 (84.2%) | 21 (15.8%) |
| 4+ Person Household | 273 (93.5%) | 19 (6.5%) |
| Total Housing Units | 824 (79.2%) | 216 (20.8%) |
Occupancy by Educational Attainment in Barnesville
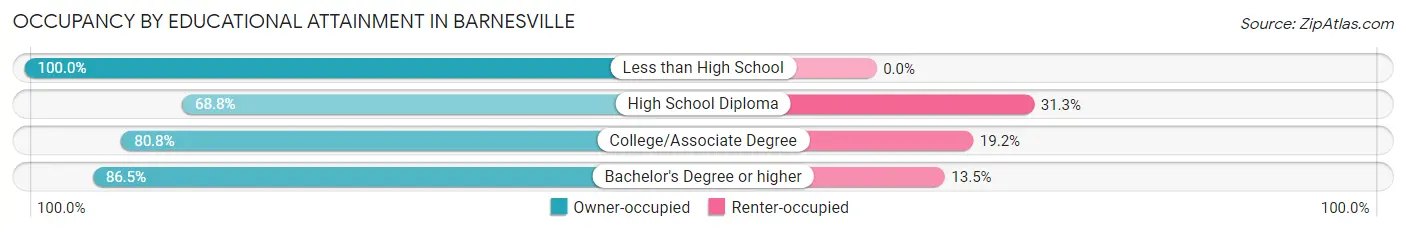
| Household Size | Owner-occupied | Renter-occupied |
| Less than High School | 5 (100.0%) | 0 (0.0%) |
| High School Diploma | 209 (68.8%) | 95 (31.2%) |
| College/Associate Degree | 316 (80.8%) | 75 (19.2%) |
| Bachelor's Degree or higher | 294 (86.5%) | 46 (13.5%) |
Occupancy by Age of Householder in Barnesville
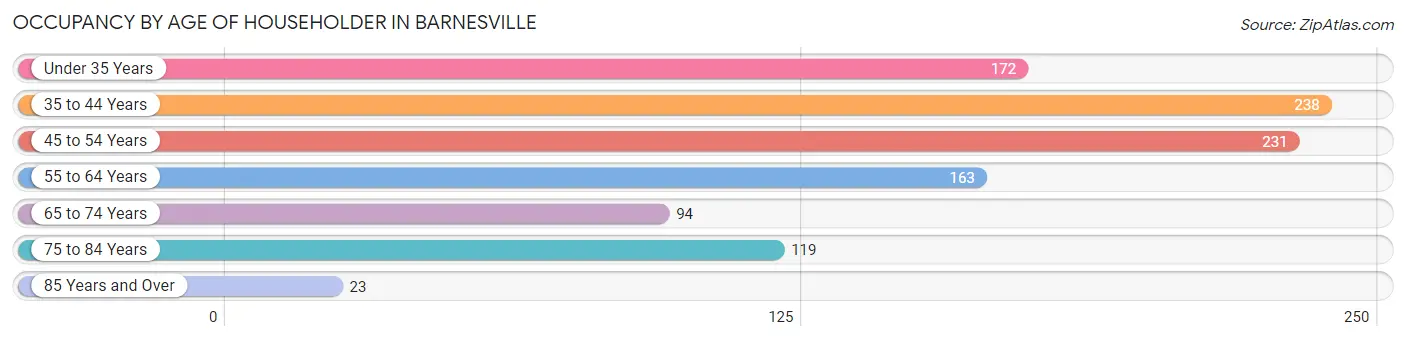
| Age Bracket | # Households | % Households |
| Under 35 Years | 172 | 16.5% |
| 35 to 44 Years | 238 | 22.9% |
| 45 to 54 Years | 231 | 22.2% |
| 55 to 64 Years | 163 | 15.7% |
| 65 to 74 Years | 94 | 9.0% |
| 75 to 84 Years | 119 | 11.4% |
| 85 Years and Over | 23 | 2.2% |
| Total | 1,040 | 100.0% |
Housing Finances in Barnesville
Median Income by Occupancy in Barnesville
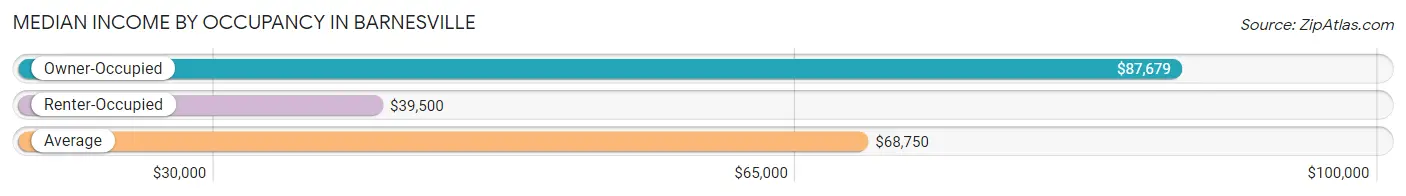
| Occupancy Type | # Households | Median Income |
| Owner-Occupied | 824 (79.2%) | $87,679 |
| Renter-Occupied | 216 (20.8%) | $39,500 |
| Average | 1,040 (100.0%) | $68,750 |
Occupancy by Householder Income Bracket in Barnesville
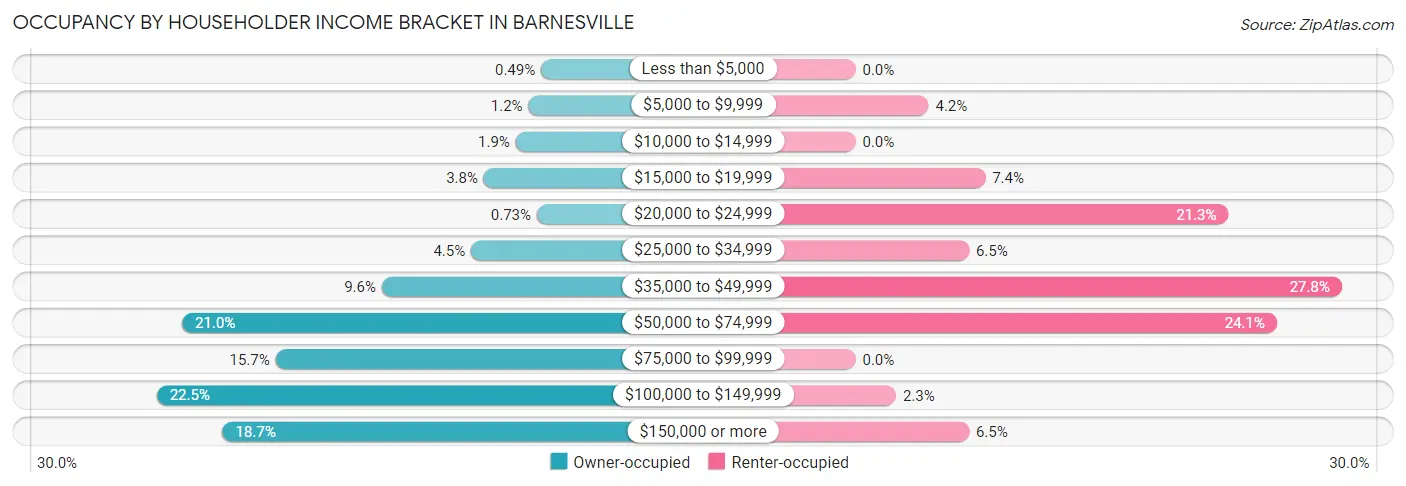
| Income Bracket | Owner-occupied | Renter-occupied |
| Less than $5,000 | 4 (0.5%) | 0 (0.0%) |
| $5,000 to $9,999 | 10 (1.2%) | 9 (4.2%) |
| $10,000 to $14,999 | 16 (1.9%) | 0 (0.0%) |
| $15,000 to $19,999 | 31 (3.8%) | 16 (7.4%) |
| $20,000 to $24,999 | 6 (0.7%) | 46 (21.3%) |
| $25,000 to $34,999 | 37 (4.5%) | 14 (6.5%) |
| $35,000 to $49,999 | 79 (9.6%) | 60 (27.8%) |
| $50,000 to $74,999 | 173 (21.0%) | 52 (24.1%) |
| $75,000 to $99,999 | 129 (15.7%) | 0 (0.0%) |
| $100,000 to $149,999 | 185 (22.5%) | 5 (2.3%) |
| $150,000 or more | 154 (18.7%) | 14 (6.5%) |
| Total | 824 (100.0%) | 216 (100.0%) |
Monthly Housing Cost Tiers in Barnesville
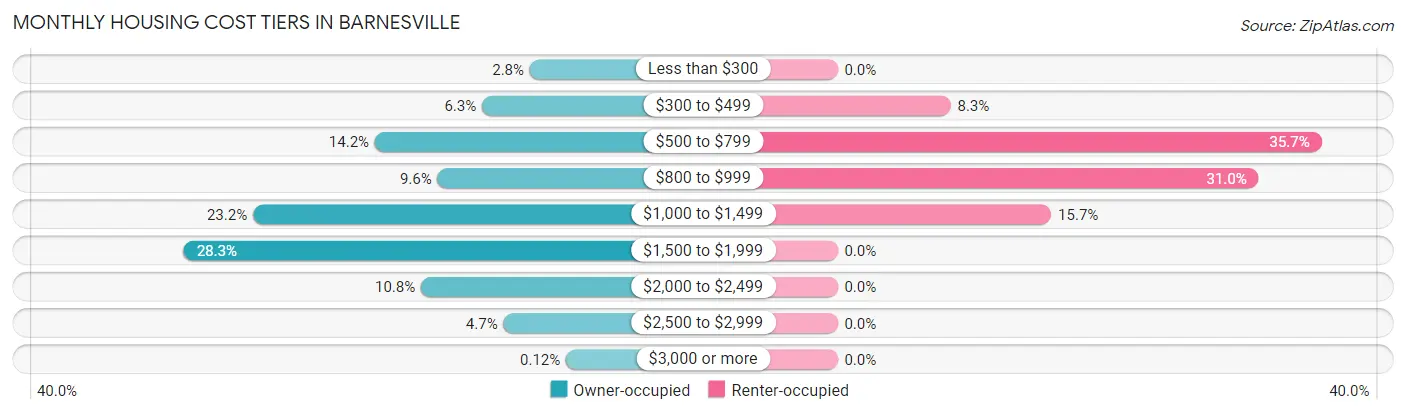
| Monthly Cost | Owner-occupied | Renter-occupied |
| Less than $300 | 23 (2.8%) | 0 (0.0%) |
| $300 to $499 | 52 (6.3%) | 18 (8.3%) |
| $500 to $799 | 117 (14.2%) | 77 (35.6%) |
| $800 to $999 | 79 (9.6%) | 67 (31.0%) |
| $1,000 to $1,499 | 191 (23.2%) | 34 (15.7%) |
| $1,500 to $1,999 | 233 (28.3%) | 0 (0.0%) |
| $2,000 to $2,499 | 89 (10.8%) | 0 (0.0%) |
| $2,500 to $2,999 | 39 (4.7%) | 0 (0.0%) |
| $3,000 or more | 1 (0.1%) | 0 (0.0%) |
| Total | 824 (100.0%) | 216 (100.0%) |
Physical Housing Characteristics in Barnesville
Housing Structures in Barnesville
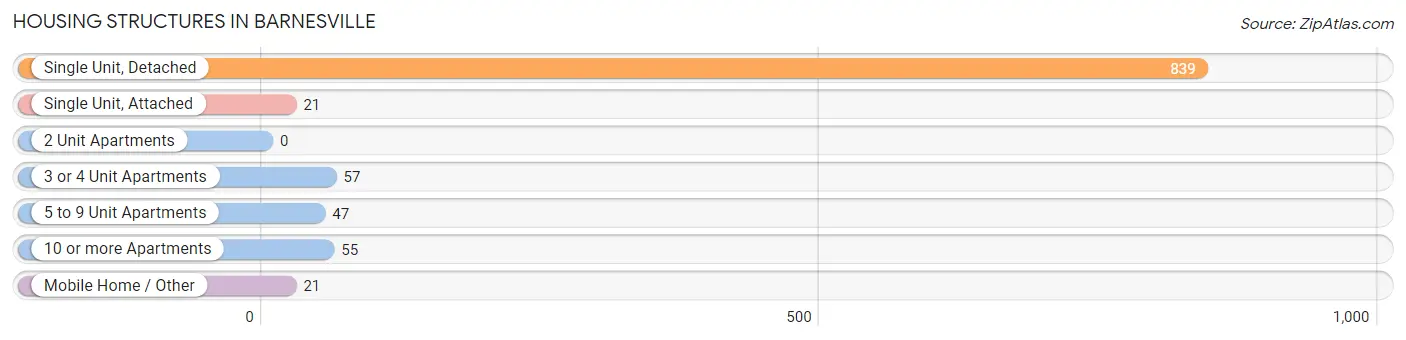
| Structure Type | # Housing Units | % Housing Units |
| Single Unit, Detached | 839 | 80.7% |
| Single Unit, Attached | 21 | 2.0% |
| 2 Unit Apartments | 0 | 0.0% |
| 3 or 4 Unit Apartments | 57 | 5.5% |
| 5 to 9 Unit Apartments | 47 | 4.5% |
| 10 or more Apartments | 55 | 5.3% |
| Mobile Home / Other | 21 | 2.0% |
| Total | 1,040 | 100.0% |
Housing Structures by Occupancy in Barnesville
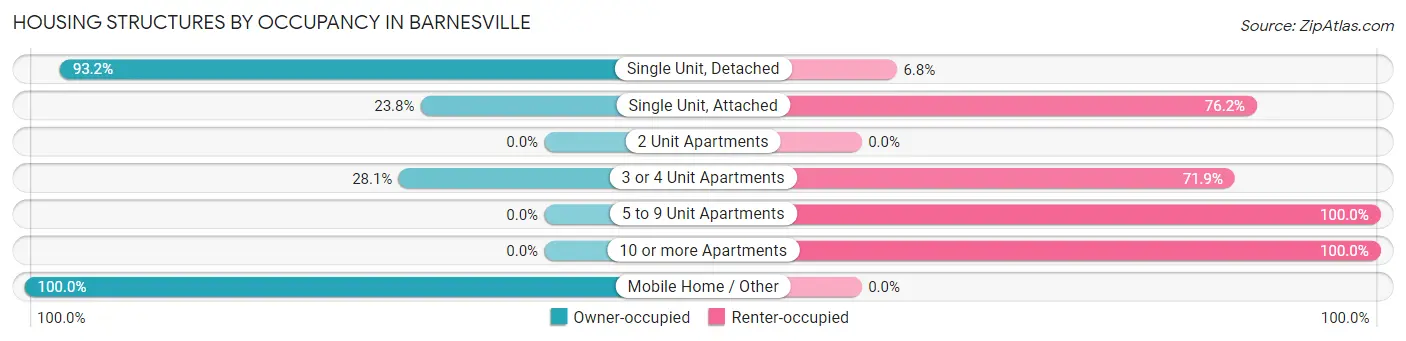
| Structure Type | Owner-occupied | Renter-occupied |
| Single Unit, Detached | 782 (93.2%) | 57 (6.8%) |
| Single Unit, Attached | 5 (23.8%) | 16 (76.2%) |
| 2 Unit Apartments | 0 (0.0%) | 0 (0.0%) |
| 3 or 4 Unit Apartments | 16 (28.1%) | 41 (71.9%) |
| 5 to 9 Unit Apartments | 0 (0.0%) | 47 (100.0%) |
| 10 or more Apartments | 0 (0.0%) | 55 (100.0%) |
| Mobile Home / Other | 21 (100.0%) | 0 (0.0%) |
| Total | 824 (79.2%) | 216 (20.8%) |
Housing Structures by Number of Rooms in Barnesville
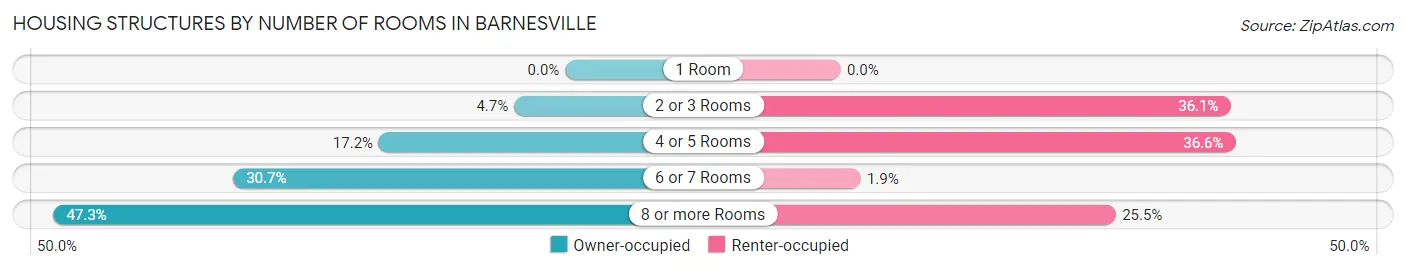
| Number of Rooms | Owner-occupied | Renter-occupied |
| 1 Room | 0 (0.0%) | 0 (0.0%) |
| 2 or 3 Rooms | 39 (4.7%) | 78 (36.1%) |
| 4 or 5 Rooms | 142 (17.2%) | 79 (36.6%) |
| 6 or 7 Rooms | 253 (30.7%) | 4 (1.8%) |
| 8 or more Rooms | 390 (47.3%) | 55 (25.5%) |
| Total | 824 (100.0%) | 216 (100.0%) |
Housing Structure by Heating Type in Barnesville
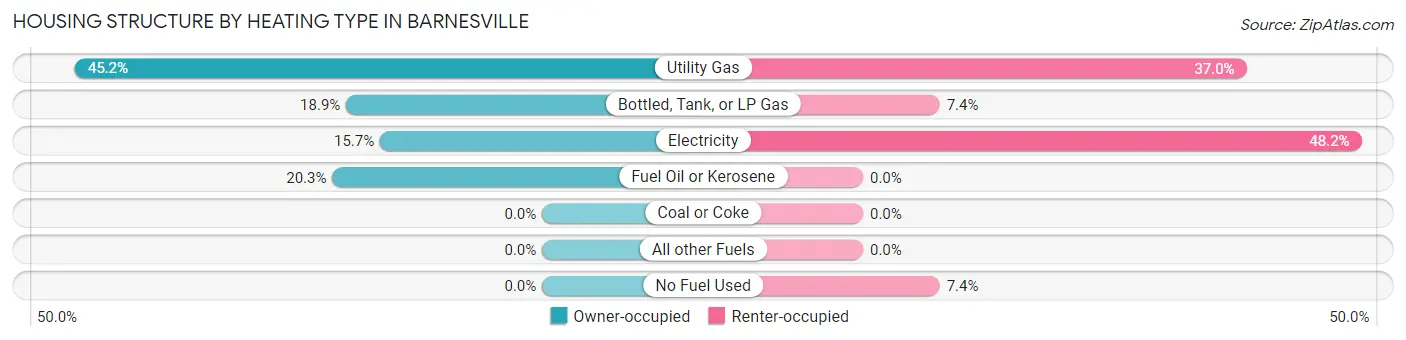
| Heating Type | Owner-occupied | Renter-occupied |
| Utility Gas | 372 (45.2%) | 80 (37.0%) |
| Bottled, Tank, or LP Gas | 156 (18.9%) | 16 (7.4%) |
| Electricity | 129 (15.7%) | 104 (48.1%) |
| Fuel Oil or Kerosene | 167 (20.3%) | 0 (0.0%) |
| Coal or Coke | 0 (0.0%) | 0 (0.0%) |
| All other Fuels | 0 (0.0%) | 0 (0.0%) |
| No Fuel Used | 0 (0.0%) | 16 (7.4%) |
| Total | 824 (100.0%) | 216 (100.0%) |
Household Vehicle Usage in Barnesville
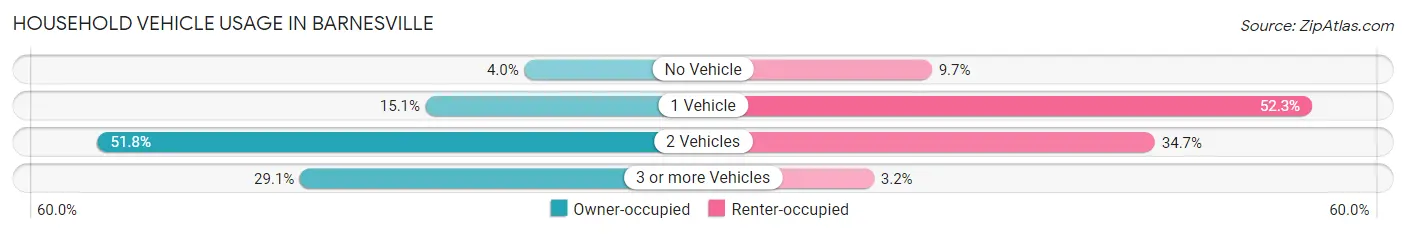
| Vehicles per Household | Owner-occupied | Renter-occupied |
| No Vehicle | 33 (4.0%) | 21 (9.7%) |
| 1 Vehicle | 124 (15.0%) | 113 (52.3%) |
| 2 Vehicles | 427 (51.8%) | 75 (34.7%) |
| 3 or more Vehicles | 240 (29.1%) | 7 (3.2%) |
| Total | 824 (100.0%) | 216 (100.0%) |
Real Estate & Mortgages in Barnesville
Real Estate and Mortgage Overview in Barnesville
| Characteristic | Without Mortgage | With Mortgage |
| Housing Units | 241 | 583 |
| Median Property Value | $183,000 | $213,700 |
| Median Household Income | $51,250 | $132 |
| Monthly Housing Costs | $593 | $1 |
| Real Estate Taxes | $2,019 | $11 |
Property Value by Mortgage Status in Barnesville
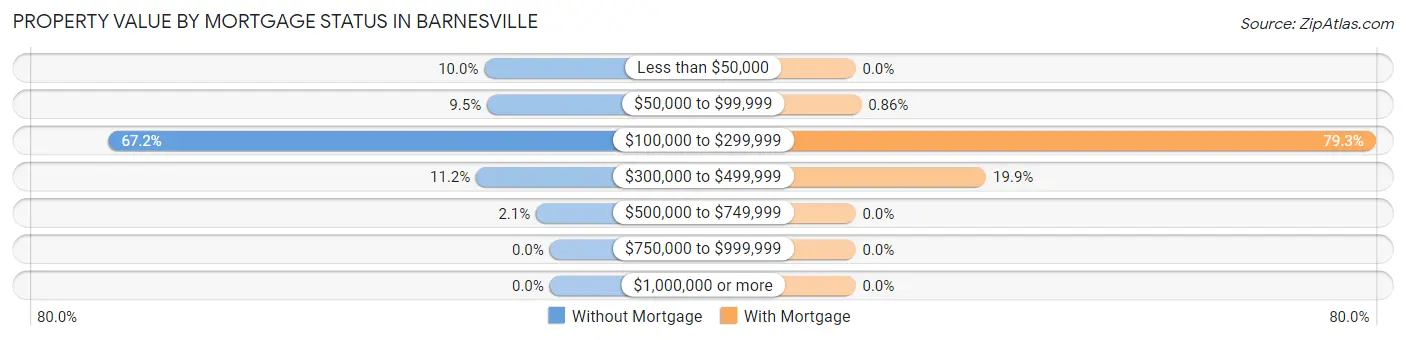
| Property Value | Without Mortgage | With Mortgage |
| Less than $50,000 | 24 (10.0%) | 0 (0.0%) |
| $50,000 to $99,999 | 23 (9.5%) | 5 (0.9%) |
| $100,000 to $299,999 | 162 (67.2%) | 462 (79.2%) |
| $300,000 to $499,999 | 27 (11.2%) | 116 (19.9%) |
| $500,000 to $749,999 | 5 (2.1%) | 0 (0.0%) |
| $750,000 to $999,999 | 0 (0.0%) | 0 (0.0%) |
| $1,000,000 or more | 0 (0.0%) | 0 (0.0%) |
| Total | 241 (100.0%) | 583 (100.0%) |
Household Income by Mortgage Status in Barnesville
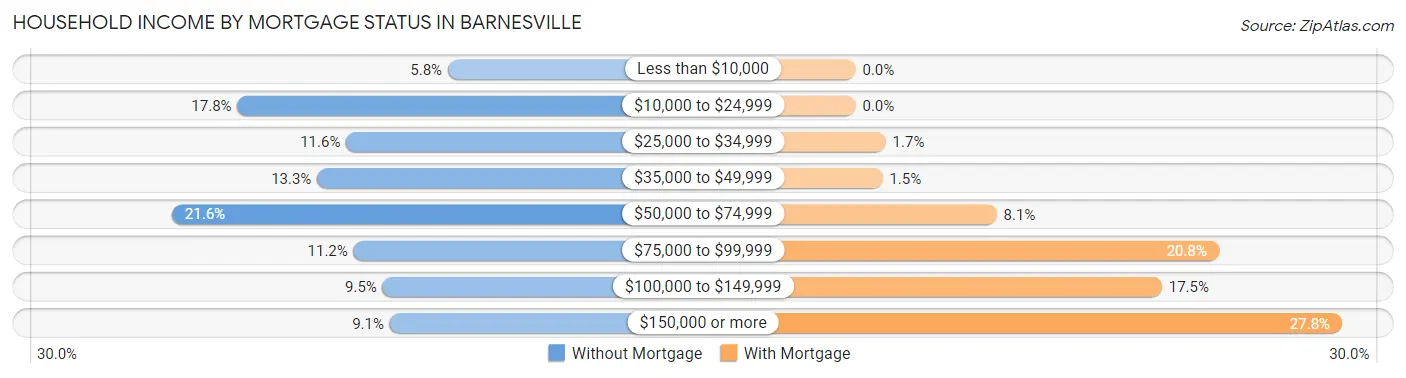
| Household Income | Without Mortgage | With Mortgage |
| Less than $10,000 | 14 (5.8%) | 0 (0.0%) |
| $10,000 to $24,999 | 43 (17.8%) | 0 (0.0%) |
| $25,000 to $34,999 | 28 (11.6%) | 10 (1.7%) |
| $35,000 to $49,999 | 32 (13.3%) | 9 (1.5%) |
| $50,000 to $74,999 | 52 (21.6%) | 47 (8.1%) |
| $75,000 to $99,999 | 27 (11.2%) | 121 (20.7%) |
| $100,000 to $149,999 | 23 (9.5%) | 102 (17.5%) |
| $150,000 or more | 22 (9.1%) | 162 (27.8%) |
| Total | 241 (100.0%) | 583 (100.0%) |
Property Value to Household Income Ratio in Barnesville
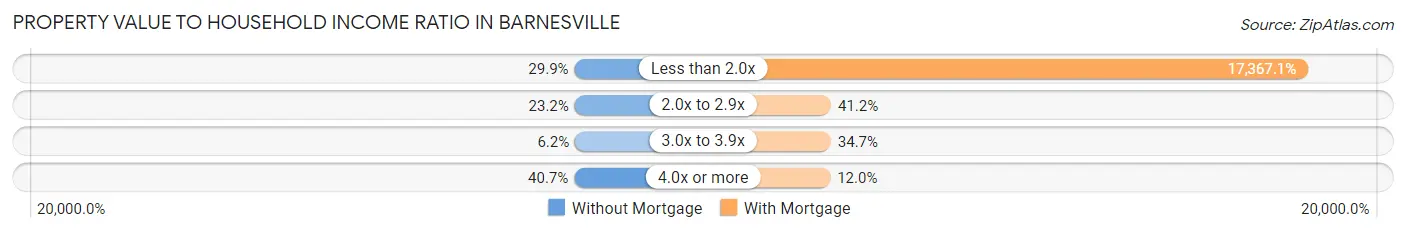
| Value-to-Income Ratio | Without Mortgage | With Mortgage |
| Less than 2.0x | 72 (29.9%) | 101,250 (17,367.1%) |
| 2.0x to 2.9x | 56 (23.2%) | 240 (41.2%) |
| 3.0x to 3.9x | 15 (6.2%) | 202 (34.6%) |
| 4.0x or more | 98 (40.7%) | 70 (12.0%) |
| Total | 241 (100.0%) | 583 (100.0%) |
Real Estate Taxes by Mortgage Status in Barnesville
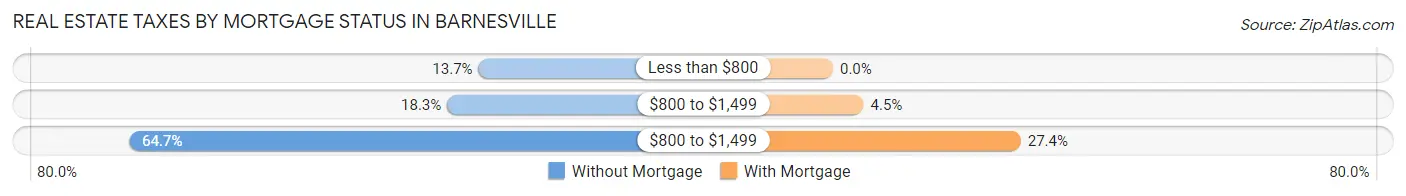
| Property Taxes | Without Mortgage | With Mortgage |
| Less than $800 | 33 (13.7%) | 0 (0.0%) |
| $800 to $1,499 | 44 (18.3%) | 26 (4.5%) |
| $800 to $1,499 | 156 (64.7%) | 160 (27.4%) |
| Total | 241 (100.0%) | 583 (100.0%) |
Health & Disability in Barnesville
Health Insurance Coverage by Age in Barnesville
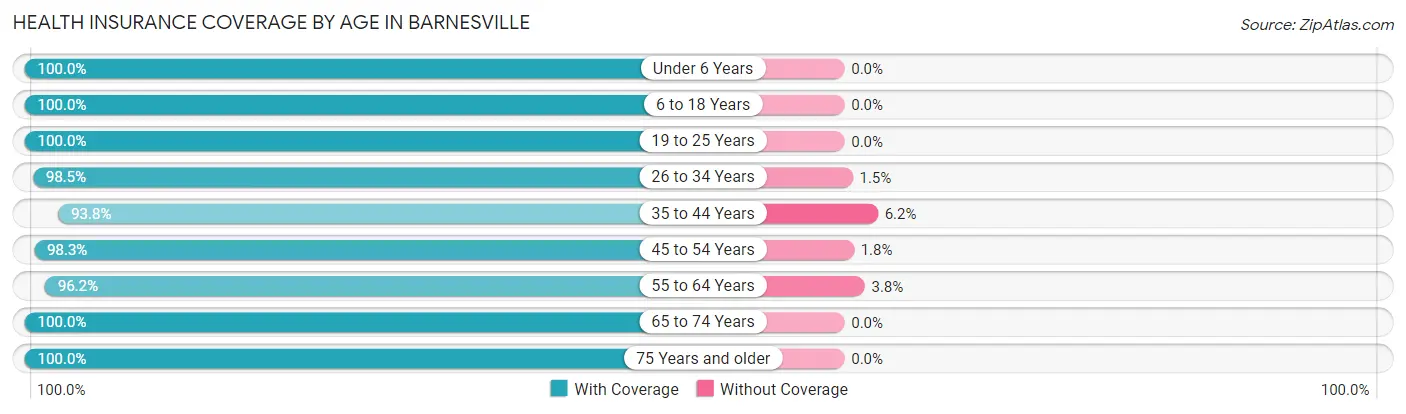
| Age Bracket | With Coverage | Without Coverage |
| Under 6 Years | 235 (100.0%) | 0 (0.0%) |
| 6 to 18 Years | 614 (100.0%) | 0 (0.0%) |
| 19 to 25 Years | 234 (100.0%) | 0 (0.0%) |
| 26 to 34 Years | 320 (98.5%) | 5 (1.5%) |
| 35 to 44 Years | 346 (93.8%) | 23 (6.2%) |
| 45 to 54 Years | 394 (98.3%) | 7 (1.8%) |
| 55 to 64 Years | 229 (96.2%) | 9 (3.8%) |
| 65 to 74 Years | 128 (100.0%) | 0 (0.0%) |
| 75 Years and older | 192 (100.0%) | 0 (0.0%) |
| Total | 2,692 (98.4%) | 44 (1.6%) |
Health Insurance Coverage by Citizenship Status in Barnesville
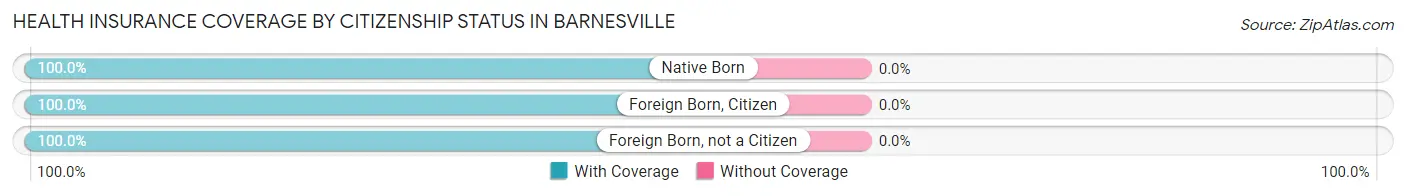
| Citizenship Status | With Coverage | Without Coverage |
| Native Born | 235 (100.0%) | 0 (0.0%) |
| Foreign Born, Citizen | 614 (100.0%) | 0 (0.0%) |
| Foreign Born, not a Citizen | 234 (100.0%) | 0 (0.0%) |
Health Insurance Coverage by Household Income in Barnesville
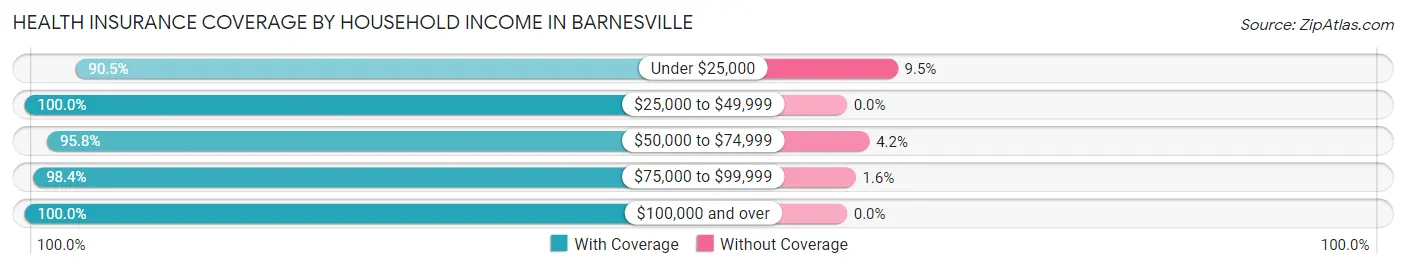
| Household Income | With Coverage | Without Coverage |
| Under $25,000 | 152 (90.5%) | 16 (9.5%) |
| $25,000 to $49,999 | 389 (100.0%) | 0 (0.0%) |
| $50,000 to $74,999 | 525 (95.8%) | 23 (4.2%) |
| $75,000 to $99,999 | 303 (98.4%) | 5 (1.6%) |
| $100,000 and over | 1,323 (100.0%) | 0 (0.0%) |
Public vs Private Health Insurance Coverage by Age in Barnesville
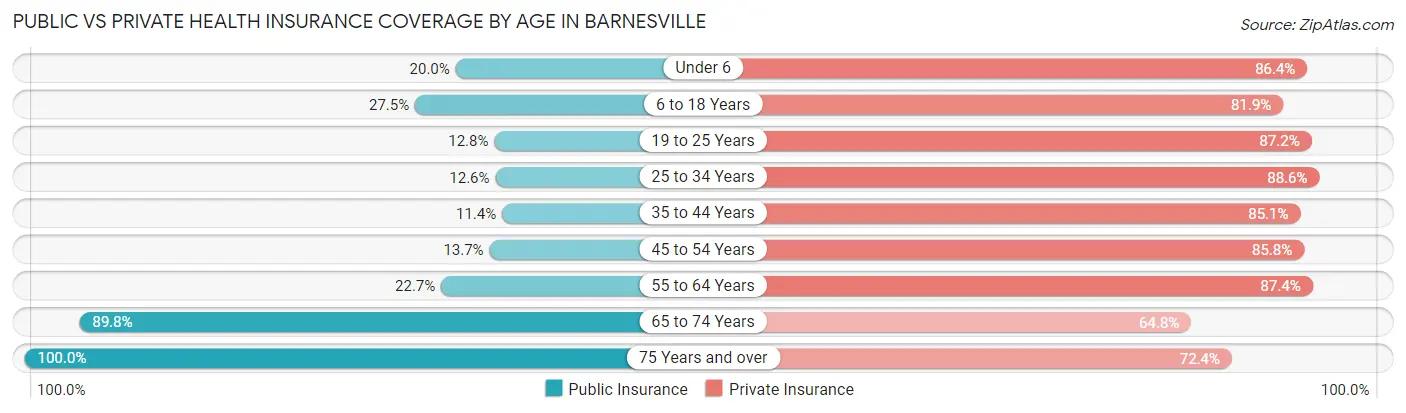
| Age Bracket | Public Insurance | Private Insurance |
| Under 6 | 47 (20.0%) | 203 (86.4%) |
| 6 to 18 Years | 169 (27.5%) | 503 (81.9%) |
| 19 to 25 Years | 30 (12.8%) | 204 (87.2%) |
| 25 to 34 Years | 41 (12.6%) | 288 (88.6%) |
| 35 to 44 Years | 42 (11.4%) | 314 (85.1%) |
| 45 to 54 Years | 55 (13.7%) | 344 (85.8%) |
| 55 to 64 Years | 54 (22.7%) | 208 (87.4%) |
| 65 to 74 Years | 115 (89.8%) | 83 (64.8%) |
| 75 Years and over | 192 (100.0%) | 139 (72.4%) |
| Total | 745 (27.2%) | 2,286 (83.6%) |
Disability Status by Sex by Age in Barnesville
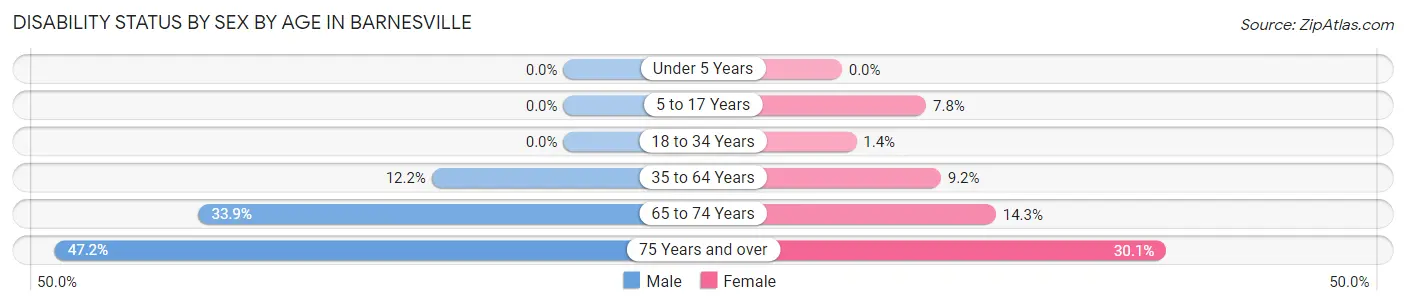
| Age Bracket | Male | Female |
| Under 5 Years | 0 (0.0%) | 0 (0.0%) |
| 5 to 17 Years | 0 (0.0%) | 32 (7.8%) |
| 18 to 34 Years | 0 (0.0%) | 4 (1.3%) |
| 35 to 64 Years | 66 (12.2%) | 43 (9.2%) |
| 65 to 74 Years | 22 (33.9%) | 9 (14.3%) |
| 75 Years and over | 42 (47.2%) | 31 (30.1%) |
Disability Class by Sex by Age in Barnesville
Disability Class: Hearing Difficulty
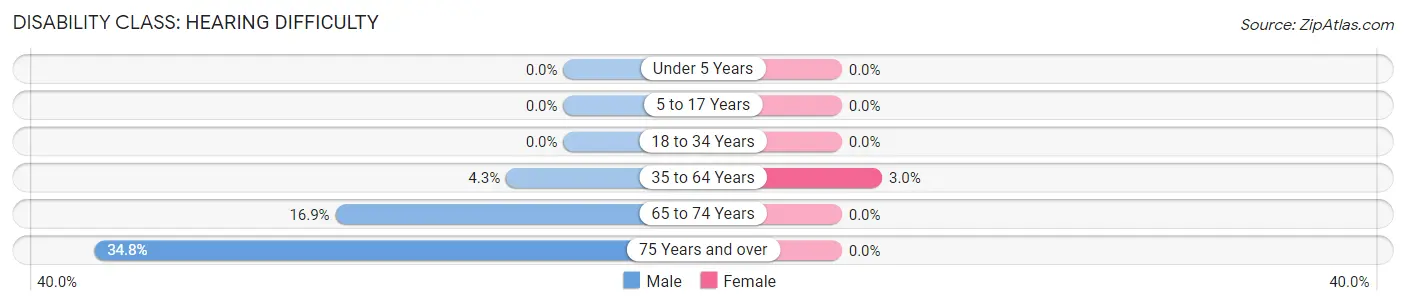
| Age Bracket | Male | Female |
| Under 5 Years | 0 (0.0%) | 0 (0.0%) |
| 5 to 17 Years | 0 (0.0%) | 0 (0.0%) |
| 18 to 34 Years | 0 (0.0%) | 0 (0.0%) |
| 35 to 64 Years | 23 (4.3%) | 14 (3.0%) |
| 65 to 74 Years | 11 (16.9%) | 0 (0.0%) |
| 75 Years and over | 31 (34.8%) | 0 (0.0%) |
Disability Class: Vision Difficulty
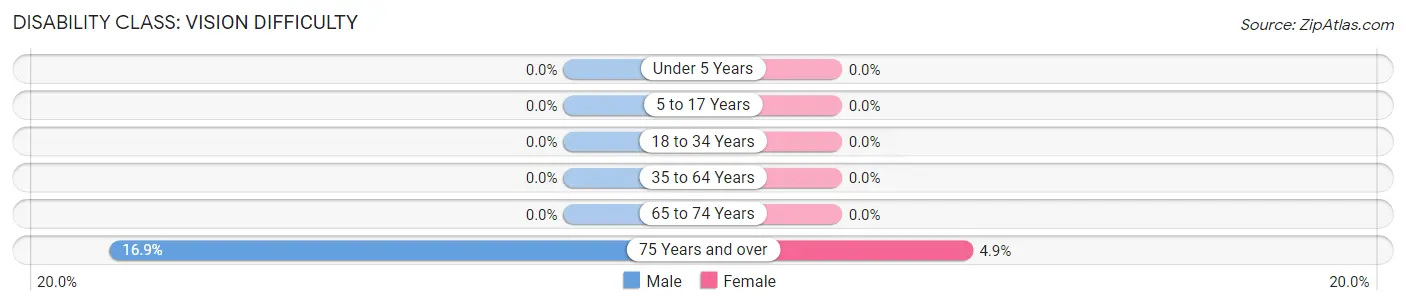
| Age Bracket | Male | Female |
| Under 5 Years | 0 (0.0%) | 0 (0.0%) |
| 5 to 17 Years | 0 (0.0%) | 0 (0.0%) |
| 18 to 34 Years | 0 (0.0%) | 0 (0.0%) |
| 35 to 64 Years | 0 (0.0%) | 0 (0.0%) |
| 65 to 74 Years | 0 (0.0%) | 0 (0.0%) |
| 75 Years and over | 15 (16.9%) | 5 (4.9%) |
Disability Class: Cognitive Difficulty
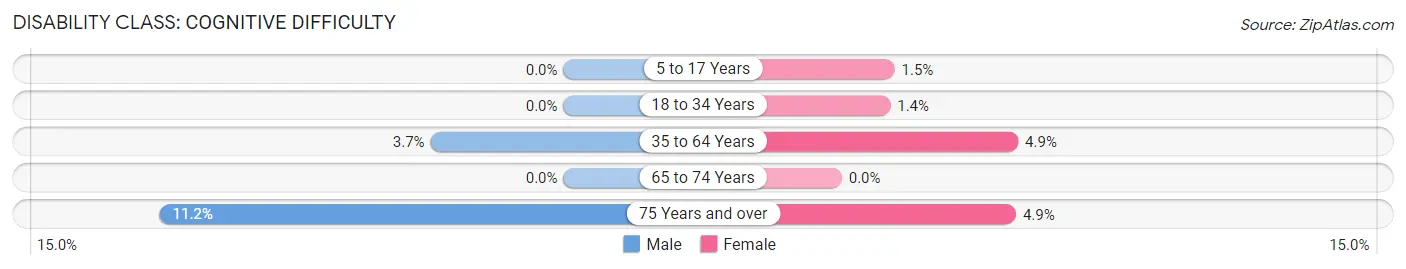
| Age Bracket | Male | Female |
| 5 to 17 Years | 0 (0.0%) | 6 (1.5%) |
| 18 to 34 Years | 0 (0.0%) | 4 (1.3%) |
| 35 to 64 Years | 20 (3.7%) | 23 (4.9%) |
| 65 to 74 Years | 0 (0.0%) | 0 (0.0%) |
| 75 Years and over | 10 (11.2%) | 5 (4.9%) |
Disability Class: Ambulatory Difficulty
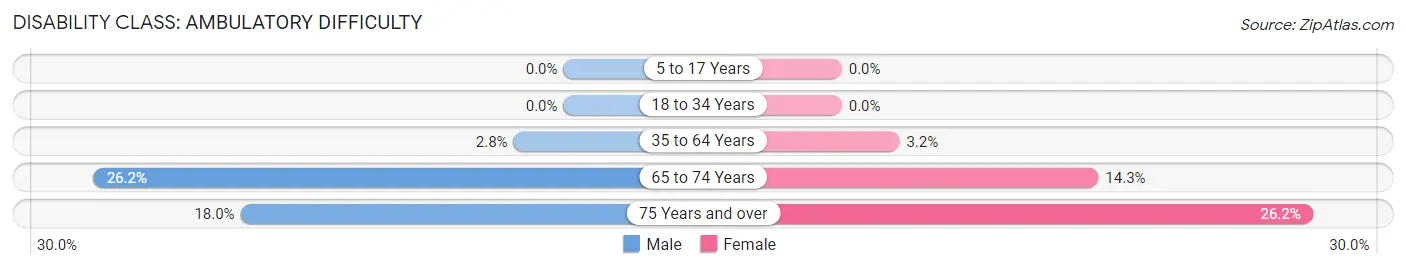
| Age Bracket | Male | Female |
| 5 to 17 Years | 0 (0.0%) | 0 (0.0%) |
| 18 to 34 Years | 0 (0.0%) | 0 (0.0%) |
| 35 to 64 Years | 15 (2.8%) | 15 (3.2%) |
| 65 to 74 Years | 17 (26.2%) | 9 (14.3%) |
| 75 Years and over | 16 (18.0%) | 27 (26.2%) |
Disability Class: Self-Care Difficulty
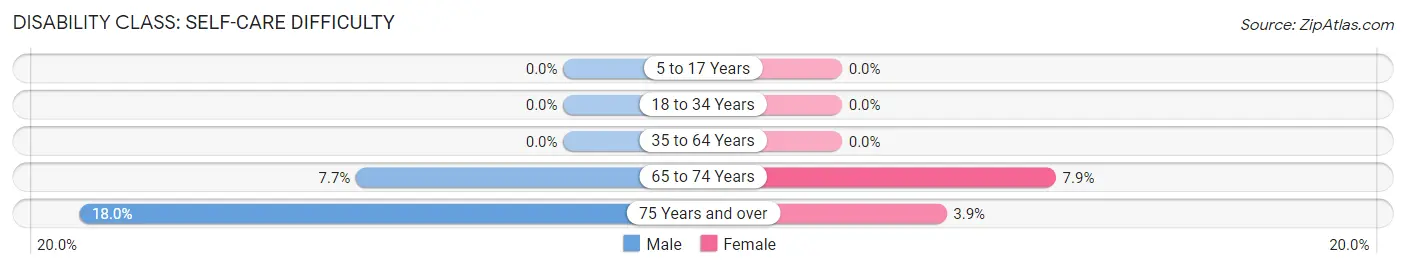
| Age Bracket | Male | Female |
| 5 to 17 Years | 0 (0.0%) | 0 (0.0%) |
| 18 to 34 Years | 0 (0.0%) | 0 (0.0%) |
| 35 to 64 Years | 0 (0.0%) | 0 (0.0%) |
| 65 to 74 Years | 5 (7.7%) | 5 (7.9%) |
| 75 Years and over | 16 (18.0%) | 4 (3.9%) |
Technology Access in Barnesville
Computing Device Access in Barnesville
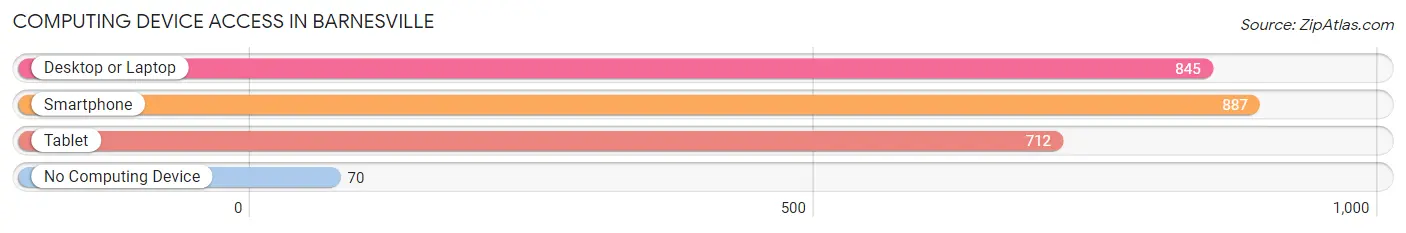
| Device Type | # Households | % Households |
| Desktop or Laptop | 845 | 81.2% |
| Smartphone | 887 | 85.3% |
| Tablet | 712 | 68.5% |
| No Computing Device | 70 | 6.7% |
| Total | 1,040 | 100.0% |
Internet Access in Barnesville
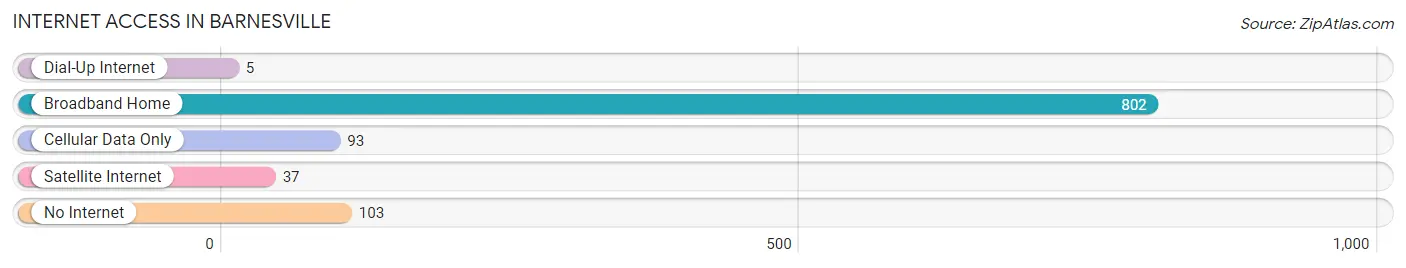
| Internet Type | # Households | % Households |
| Dial-Up Internet | 5 | 0.5% |
| Broadband Home | 802 | 77.1% |
| Cellular Data Only | 93 | 8.9% |
| Satellite Internet | 37 | 3.6% |
| No Internet | 103 | 9.9% |
| Total | 1,040 | 100.0% |
Barnesville Summary
Barnesville, Minnesota is a small city located in Clay County, in the northwestern part of the state. It is situated on the Red River of the North, about 25 miles south of Fargo, North Dakota. The city has a population of 2,521, according to the 2010 census.
History
Barnesville was founded in 1881 by a group of settlers from Wisconsin. The city was named after the nearby Barnesville Township, which was named after the Barnesville family, who were among the first settlers in the area. The city was incorporated in 1883.
In the early years, Barnesville was a farming community, with the main crops being wheat, oats, and barley. The city also had a number of businesses, including a flour mill, a creamery, a lumber yard, and a brickyard.
In the late 19th century, the city began to grow rapidly, and by the early 20th century, it had become a major center for the lumber industry. The city also had a number of other businesses, including a furniture factory, a canning factory, and a brickyard.
Geography
Barnesville is located in Clay County, in the northwestern part of Minnesota. It is situated on the Red River of the North, about 25 miles south of Fargo, North Dakota. The city has a total area of 2.2 square miles, all of which is land.
The city is located in a flat, open area, with the Red River of the North to the east and the Buffalo River to the west. The city is surrounded by farmland, and there are several small lakes in the area.
Economy
The economy of Barnesville is largely based on agriculture and manufacturing. The city is home to several large agricultural businesses, including a grain elevator, a feed mill, and a dairy. The city also has a number of manufacturing businesses, including a furniture factory, a canning factory, and a brickyard.
The city also has a number of retail businesses, including a grocery store, a hardware store, and a number of restaurants. The city also has a number of service businesses, including a bank, a post office, and a number of medical and dental offices.
Demographics
According to the 2010 census, the population of Barnesville was 2,521. The racial makeup of the city was 97.3% White, 0.7% African American, 0.3% Native American, 0.2% Asian, 0.1% Pacific Islander, 0.4% from other races, and 1.0% from two or more races. Hispanic or Latino of any race were 1.2% of the population.
The median household income in Barnesville was $41,944, and the median family income was $50,938. The per capita income was $20,945. About 8.3% of families and 10.7% of the population were below the poverty line, including 14.2% of those under age 18 and 8.2% of those age 65 or over.
Common Questions
What is Per Capita Income in Barnesville?
Per Capita income in Barnesville is $42,922.
What is the Median Family Income in Barnesville?
Median Family Income in Barnesville is $89,792.
What is the Median Household income in Barnesville?
Median Household Income in Barnesville is $68,750.
What is Income or Wage Gap in Barnesville?
Income or Wage Gap in Barnesville is 21.2%.
Women in Barnesville earn 78.8 cents for every dollar earned by a man.
What is Inequality or Gini Index in Barnesville?
Inequality or Gini Index in Barnesville is 0.49.
What is the Total Population of Barnesville?
Total Population of Barnesville is 2,773.
What is the Total Male Population of Barnesville?
Total Male Population of Barnesville is 1,348.
What is the Total Female Population of Barnesville?
Total Female Population of Barnesville is 1,425.
What is the Ratio of Males per 100 Females in Barnesville?
There are 94.60 Males per 100 Females in Barnesville.
What is the Ratio of Females per 100 Males in Barnesville?
There are 105.71 Females per 100 Males in Barnesville.
What is the Median Population Age in Barnesville?
Median Population Age in Barnesville is 34.1 Years.
What is the Average Family Size in Barnesville
Average Family Size in Barnesville is 3.1 People.
What is the Average Household Size in Barnesville
Average Household Size in Barnesville is 2.6 People.
How Large is the Labor Force in Barnesville?
There are 1,490 People in the Labor Forcein in Barnesville.
What is the Percentage of People in the Labor Force in Barnesville?
72.1% of People are in the Labor Force in Barnesville.
What is the Unemployment Rate in Barnesville?
Unemployment Rate in Barnesville is 1.3%.