Balaton, MN Map & Demographics
Balaton Map
Balaton Overview
$26,943
PER CAPITA INCOME
$75,625
AVG FAMILY INCOME
$53,333
AVG HOUSEHOLD INCOME
11.3%
WAGE / INCOME GAP [ % ]
88.7¢/ $1
WAGE / INCOME GAP [ $ ]
0.37
INEQUALITY / GINI INDEX
548
TOTAL POPULATION
296
MALE POPULATION
252
FEMALE POPULATION
117.46
MALES / 100 FEMALES
85.14
FEMALES / 100 MALES
39.1
MEDIAN AGE
2.6
AVG FAMILY SIZE
2.1
AVG HOUSEHOLD SIZE
273
LABOR FORCE [ PEOPLE ]
62.9%
PERCENT IN LABOR FORCE
7.7%
UNEMPLOYMENT RATE
Balaton Zip Codes
Balaton Area Codes
Income in Balaton
Income Overview in Balaton
Per Capita Income in Balaton is $26,943, while median incomes of families and households are $75,625 and $53,333 respectively.
| Characteristic | Number | Measure |
| Per Capita Income | 548 | $26,943 |
| Median Family Income | 145 | $75,625 |
| Mean Family Income | 145 | $73,936 |
| Median Household Income | 242 | $53,333 |
| Mean Household Income | 242 | $60,936 |
| Income Deficit | 145 | $0 |
| Wage / Income Gap (%) | 548 | 11.27% |
| Wage / Income Gap ($) | 548 | 88.73¢ per $1 |
| Gini / Inequality Index | 548 | 0.37 |
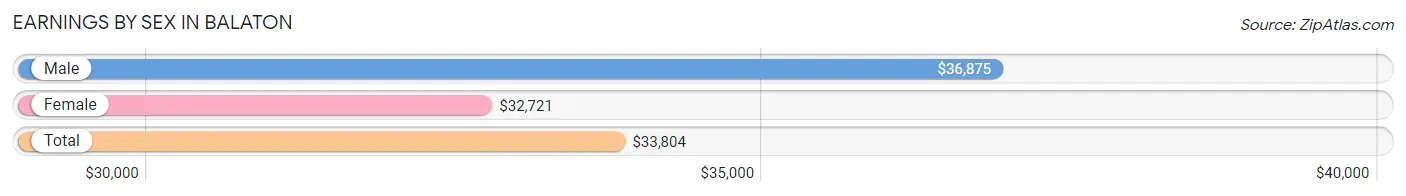
Earnings by Sex in Balaton
Average Earnings in Balaton are $33,804, $36,875 for men and $32,721 for women, a difference of 11.3%.
| Sex | Number | Average Earnings |
| Male | 177 (61.0%) | $36,875 |
| Female | 113 (39.0%) | $32,721 |
| Total | 290 (100.0%) | $33,804 |
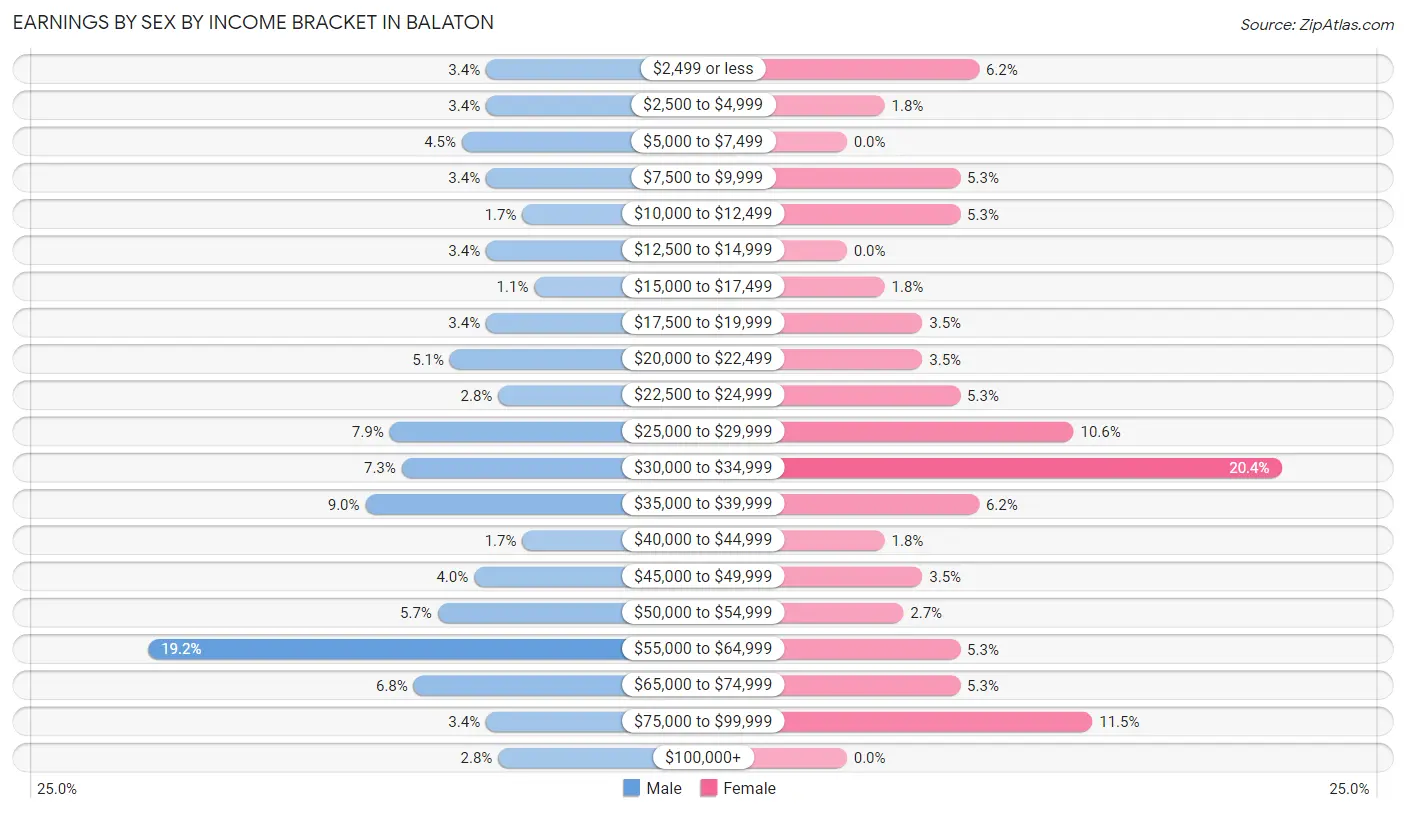
Earnings by Sex by Income Bracket in Balaton
The most common earnings brackets in Balaton are $55,000 to $64,999 for men (34 | 19.2%) and $30,000 to $34,999 for women (23 | 20.3%).
| Income | Male | Female |
| $2,499 or less | 6 (3.4%) | 7 (6.2%) |
| $2,500 to $4,999 | 6 (3.4%) | 2 (1.8%) |
| $5,000 to $7,499 | 8 (4.5%) | 0 (0.0%) |
| $7,500 to $9,999 | 6 (3.4%) | 6 (5.3%) |
| $10,000 to $12,499 | 3 (1.7%) | 6 (5.3%) |
| $12,500 to $14,999 | 6 (3.4%) | 0 (0.0%) |
| $15,000 to $17,499 | 2 (1.1%) | 2 (1.8%) |
| $17,500 to $19,999 | 6 (3.4%) | 4 (3.5%) |
| $20,000 to $22,499 | 9 (5.1%) | 4 (3.5%) |
| $22,500 to $24,999 | 5 (2.8%) | 6 (5.3%) |
| $25,000 to $29,999 | 14 (7.9%) | 12 (10.6%) |
| $30,000 to $34,999 | 13 (7.3%) | 23 (20.3%) |
| $35,000 to $39,999 | 16 (9.0%) | 7 (6.2%) |
| $40,000 to $44,999 | 3 (1.7%) | 2 (1.8%) |
| $45,000 to $49,999 | 7 (4.0%) | 4 (3.5%) |
| $50,000 to $54,999 | 10 (5.7%) | 3 (2.6%) |
| $55,000 to $64,999 | 34 (19.2%) | 6 (5.3%) |
| $65,000 to $74,999 | 12 (6.8%) | 6 (5.3%) |
| $75,000 to $99,999 | 6 (3.4%) | 13 (11.5%) |
| $100,000+ | 5 (2.8%) | 0 (0.0%) |
| Total | 177 (100.0%) | 113 (100.0%) |
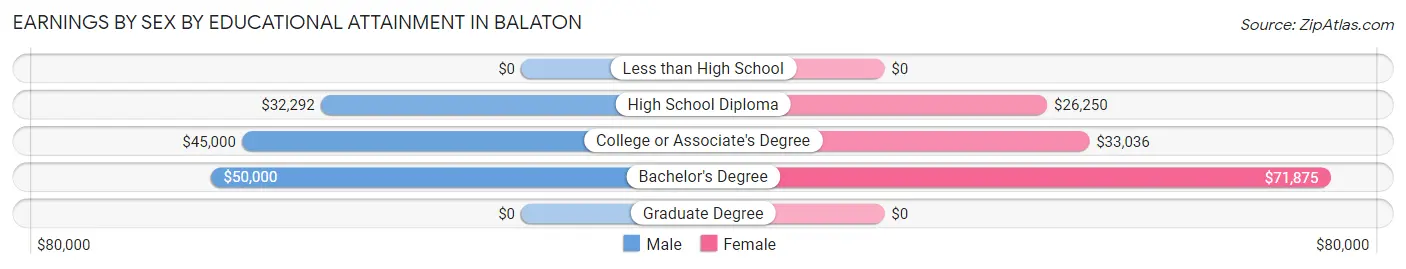
Earnings by Sex by Educational Attainment in Balaton
Average earnings in Balaton are $39,250 for men and $33,333 for women, a difference of 15.1%. Men with an educational attainment of bachelor's degree enjoy the highest average annual earnings of $50,000, while those with high school diploma education earn the least with $32,292. Women with an educational attainment of bachelor's degree earn the most with the average annual earnings of $71,875, while those with high school diploma education have the smallest earnings of $26,250.
| Educational Attainment | Male Income | Female Income |
| Less than High School | - | - |
| High School Diploma | $32,292 | $26,250 |
| College or Associate's Degree | $45,000 | $33,036 |
| Bachelor's Degree | $50,000 | $71,875 |
| Graduate Degree | - | - |
| Total | $39,250 | $33,333 |
Family Income in Balaton
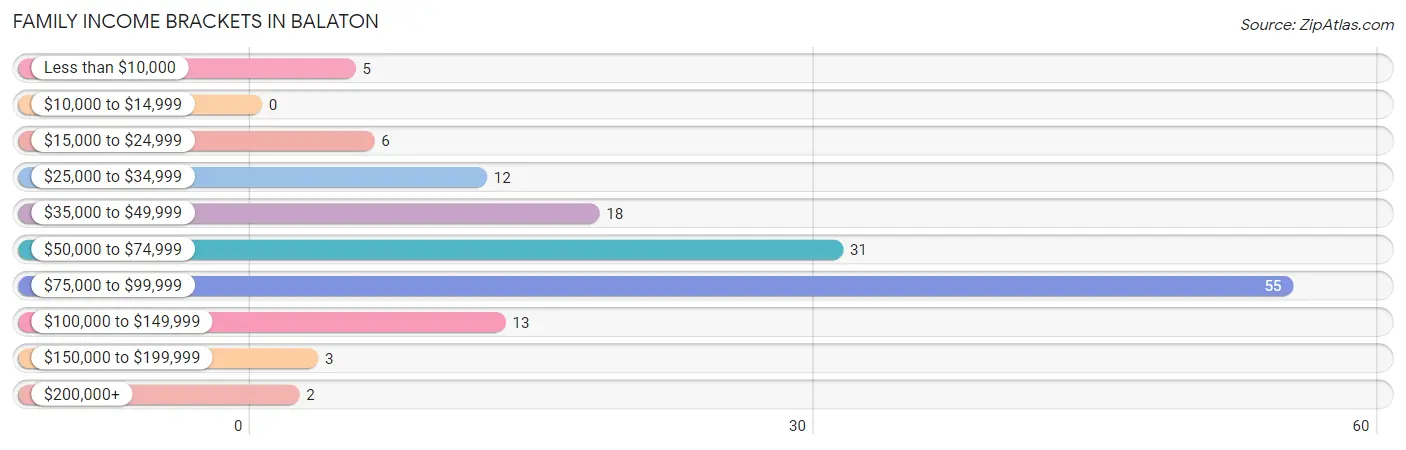
Family Income Brackets in Balaton
According to the Balaton family income data, there are 55 families falling into the $75,000 to $99,999 income range, which is the most common income bracket and makes up 37.9% of all families.
| Income Bracket | # Families | % Families |
| Less than $10,000 | 5 | 3.4% |
| $10,000 to $14,999 | 0 | 0.0% |
| $15,000 to $24,999 | 6 | 4.1% |
| $25,000 to $34,999 | 12 | 8.3% |
| $35,000 to $49,999 | 18 | 12.4% |
| $50,000 to $74,999 | 31 | 21.4% |
| $75,000 to $99,999 | 55 | 37.9% |
| $100,000 to $149,999 | 13 | 9.0% |
| $150,000 to $199,999 | 3 | 2.1% |
| $200,000+ | 2 | 1.4% |
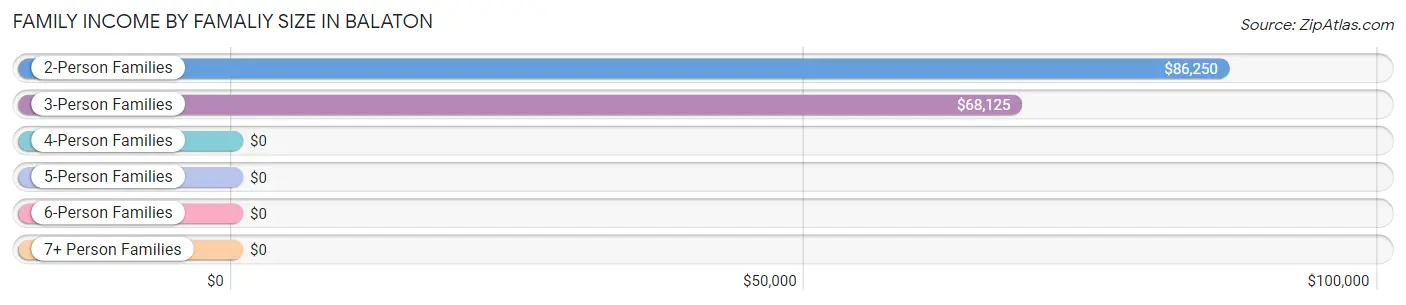
Family Income by Famaliy Size in Balaton
2-person families (84 | 57.9%) account for the highest median family income in Balaton with $86,250 per family, while 2-person families (84 | 57.9%) have the highest median income of $43,125 per family member.
| Income Bracket | # Families | Median Income |
| 2-Person Families | 84 (57.9%) | $86,250 |
| 3-Person Families | 37 (25.5%) | $68,125 |
| 4-Person Families | 9 (6.2%) | $0 |
| 5-Person Families | 11 (7.6%) | $0 |
| 6-Person Families | 1 (0.7%) | $0 |
| 7+ Person Families | 3 (2.1%) | $0 |
| Total | 145 (100.0%) | $75,625 |
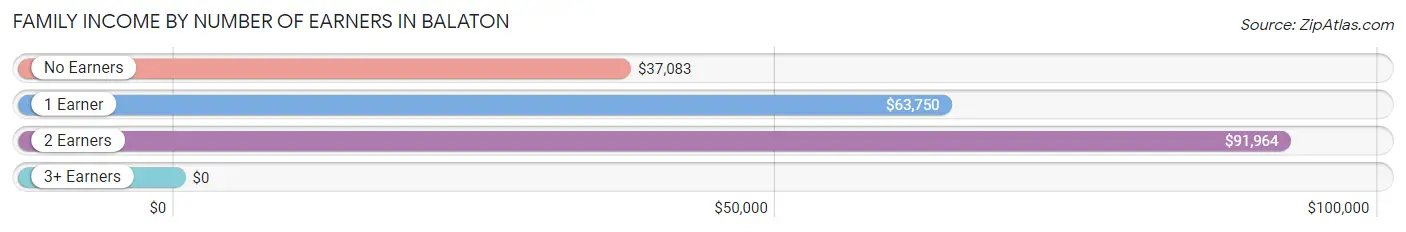
Family Income by Number of Earners in Balaton
| Number of Earners | # Families | Median Income |
| No Earners | 23 (15.9%) | $37,083 |
| 1 Earner | 52 (35.9%) | $63,750 |
| 2 Earners | 67 (46.2%) | $91,964 |
| 3+ Earners | 3 (2.1%) | $0 |
| Total | 145 (100.0%) | $75,625 |
Household Income in Balaton
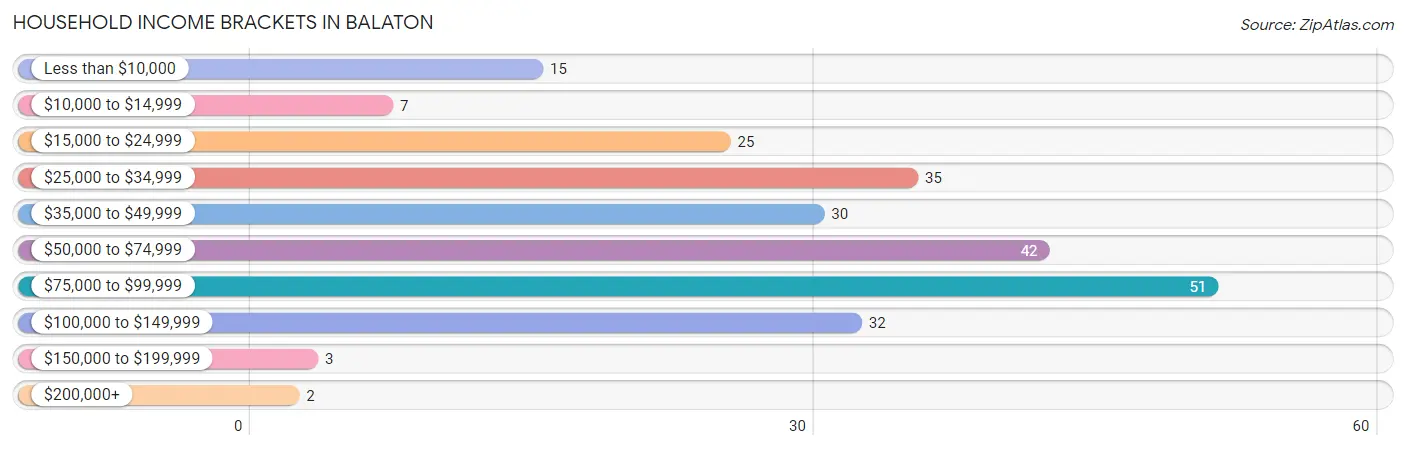
Household Income Brackets in Balaton
With 51 households falling in the category, the $75,000 to $99,999 income range is the most frequent in Balaton, accounting for 21.1% of all households. In contrast, only 2 households (0.8%) fall into the $200,000+ income bracket, making it the least populous group.
| Income Bracket | # Households | % Households |
| Less than $10,000 | 15 | 6.2% |
| $10,000 to $14,999 | 7 | 2.9% |
| $15,000 to $24,999 | 25 | 10.3% |
| $25,000 to $34,999 | 35 | 14.5% |
| $35,000 to $49,999 | 30 | 12.4% |
| $50,000 to $74,999 | 42 | 17.4% |
| $75,000 to $99,999 | 51 | 21.1% |
| $100,000 to $149,999 | 32 | 13.2% |
| $150,000 to $199,999 | 3 | 1.2% |
| $200,000+ | 2 | 0.8% |
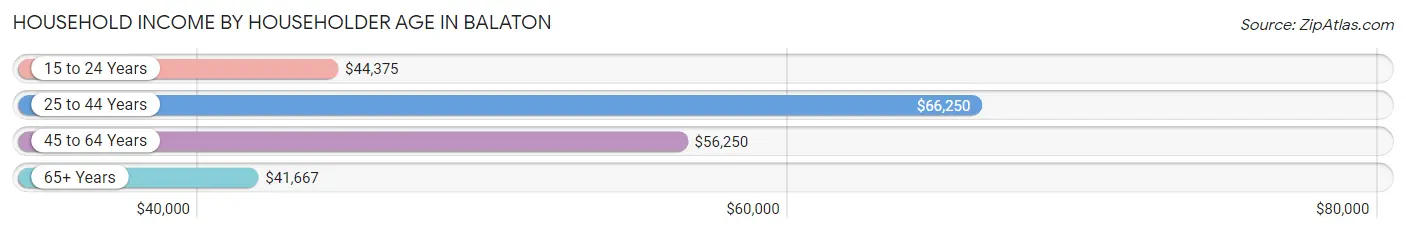
Household Income by Householder Age in Balaton
The median household income in Balaton is $53,333, with the highest median household income of $66,250 found in the 25 to 44 years age bracket for the primary householder. A total of 92 households (38.0%) fall into this category. Meanwhile, the 65+ years age bracket for the primary householder has the lowest median household income of $41,667, with 76 households (31.4%) in this group.
| Income Bracket | # Households | Median Income |
| 15 to 24 Years | 8 (3.3%) | $44,375 |
| 25 to 44 Years | 92 (38.0%) | $66,250 |
| 45 to 64 Years | 66 (27.3%) | $56,250 |
| 65+ Years | 76 (31.4%) | $41,667 |
| Total | 242 (100.0%) | $53,333 |
Poverty in Balaton
Income Below Poverty by Sex and Age in Balaton
With 15.2% poverty level for males and 15.7% for females among the residents of Balaton, 5 year old males and 18 to 24 year old females are the most vulnerable to poverty, with 7 males (77.8%) and 5 females (50.0%) in their respective age groups living below the poverty level.
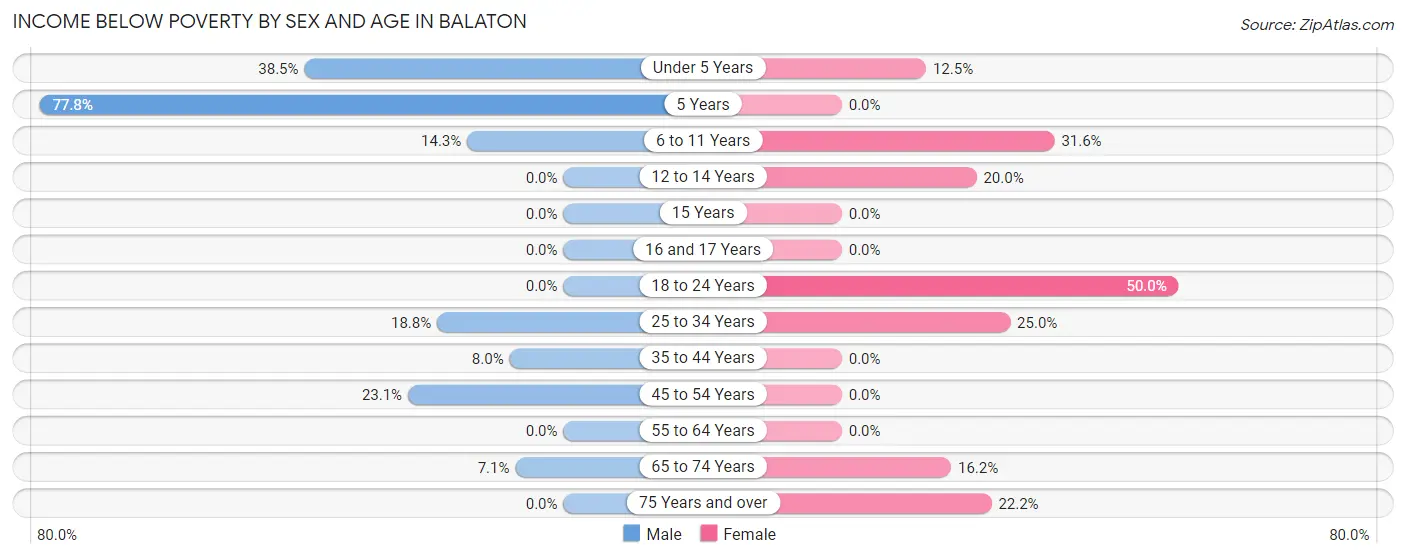
| Age Bracket | Male | Female |
| Under 5 Years | 10 (38.5%) | 2 (12.5%) |
| 5 Years | 7 (77.8%) | 0 (0.0%) |
| 6 to 11 Years | 4 (14.3%) | 6 (31.6%) |
| 12 to 14 Years | 0 (0.0%) | 1 (20.0%) |
| 15 Years | 0 (0.0%) | 0 (0.0%) |
| 16 and 17 Years | 0 (0.0%) | 0 (0.0%) |
| 18 to 24 Years | 0 (0.0%) | 5 (50.0%) |
| 25 to 34 Years | 12 (18.8%) | 11 (25.0%) |
| 35 to 44 Years | 2 (8.0%) | 0 (0.0%) |
| 45 to 54 Years | 6 (23.1%) | 0 (0.0%) |
| 55 to 64 Years | 0 (0.0%) | 0 (0.0%) |
| 65 to 74 Years | 2 (7.1%) | 6 (16.2%) |
| 75 Years and over | 0 (0.0%) | 6 (22.2%) |
| Total | 43 (15.2%) | 37 (15.7%) |
Income Above Poverty by Sex and Age in Balaton
According to the poverty statistics in Balaton, males aged 12 to 14 years and females aged 5 years are the age groups that are most secure financially, with 100.0% of males and 100.0% of females in these age groups living above the poverty line.
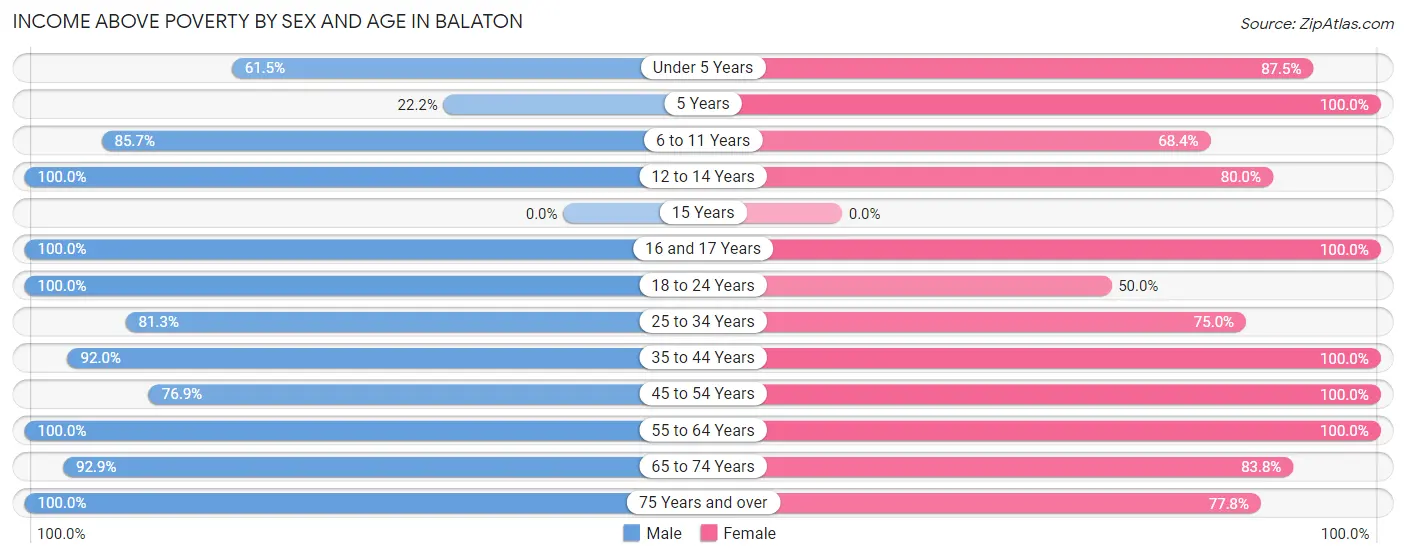
| Age Bracket | Male | Female |
| Under 5 Years | 16 (61.5%) | 14 (87.5%) |
| 5 Years | 2 (22.2%) | 9 (100.0%) |
| 6 to 11 Years | 24 (85.7%) | 13 (68.4%) |
| 12 to 14 Years | 2 (100.0%) | 4 (80.0%) |
| 15 Years | 0 (0.0%) | 0 (0.0%) |
| 16 and 17 Years | 3 (100.0%) | 4 (100.0%) |
| 18 to 24 Years | 21 (100.0%) | 5 (50.0%) |
| 25 to 34 Years | 52 (81.2%) | 33 (75.0%) |
| 35 to 44 Years | 23 (92.0%) | 13 (100.0%) |
| 45 to 54 Years | 20 (76.9%) | 25 (100.0%) |
| 55 to 64 Years | 30 (100.0%) | 26 (100.0%) |
| 65 to 74 Years | 26 (92.9%) | 31 (83.8%) |
| 75 Years and over | 20 (100.0%) | 21 (77.8%) |
| Total | 239 (84.8%) | 198 (84.3%) |
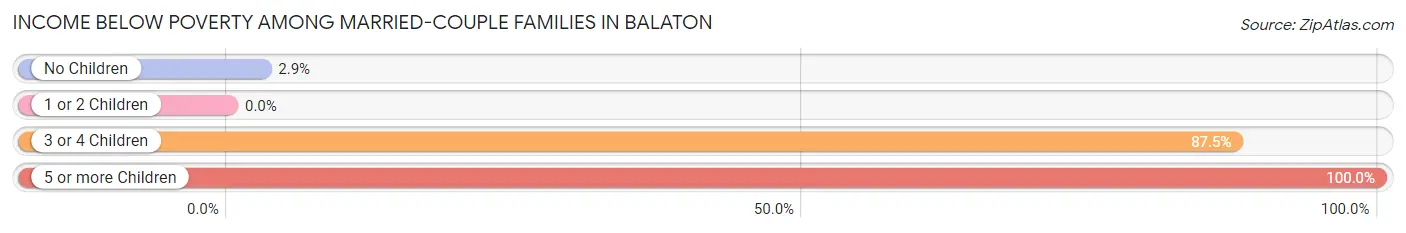
Income Below Poverty Among Married-Couple Families in Balaton
The poverty statistics for married-couple families in Balaton show that 9.0% or 10 of the total 111 families live below the poverty line. Families with 5 or more children have the highest poverty rate of 100.0%, comprising of 1 families. On the other hand, families with 1 or 2 children have the lowest poverty rate of 0.0%, which includes 0 families.
| Children | Above Poverty | Below Poverty |
| No Children | 67 (97.1%) | 2 (2.9%) |
| 1 or 2 Children | 33 (100.0%) | 0 (0.0%) |
| 3 or 4 Children | 1 (12.5%) | 7 (87.5%) |
| 5 or more Children | 0 (0.0%) | 1 (100.0%) |
| Total | 101 (91.0%) | 10 (9.0%) |
Income Below Poverty Among Single-Parent Households in Balaton
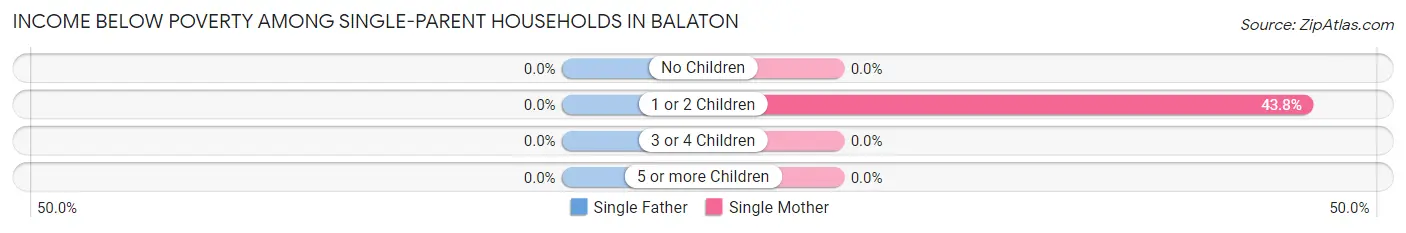
| Children | Single Father | Single Mother |
| No Children | 0 (0.0%) | 0 (0.0%) |
| 1 or 2 Children | 0 (0.0%) | 7 (43.8%) |
| 3 or 4 Children | 0 (0.0%) | 0 (0.0%) |
| 5 or more Children | 0 (0.0%) | 0 (0.0%) |
| Total | 0 (0.0%) | 7 (35.0%) |
Income Below Poverty Among Married-Couple vs Single-Parent Households in Balaton
The poverty data for Balaton shows that 10 of the married-couple family households (9.0%) and 7 of the single-parent households (20.6%) are living below the poverty level. Within the married-couple family households, those with 5 or more children have the highest poverty rate, with 1 households (100.0%) falling below the poverty line. Among the single-parent households, those with 1 or 2 children have the highest poverty rate, with 7 household (36.8%) living below poverty.
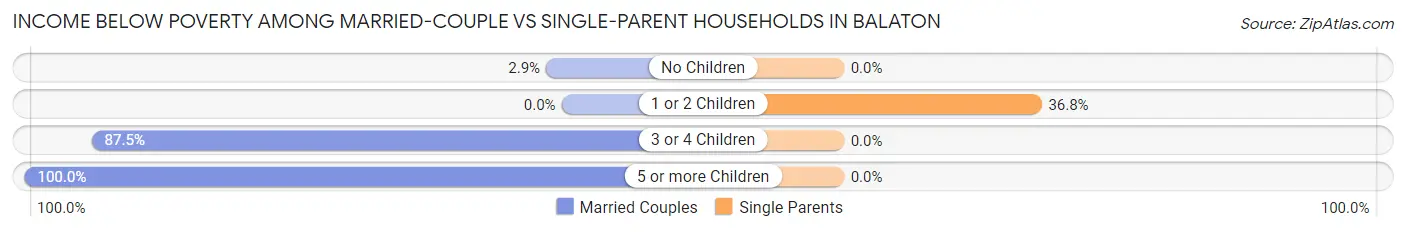
| Children | Married-Couple Families | Single-Parent Households |
| No Children | 2 (2.9%) | 0 (0.0%) |
| 1 or 2 Children | 0 (0.0%) | 7 (36.8%) |
| 3 or 4 Children | 7 (87.5%) | 0 (0.0%) |
| 5 or more Children | 1 (100.0%) | 0 (0.0%) |
| Total | 10 (9.0%) | 7 (20.6%) |
Race in Balaton
The most populous races in Balaton are White / Caucasian (511 | 93.2%), Two or more Races (33 | 6.0%), and Hispanic or Latino (4 | 0.7%).
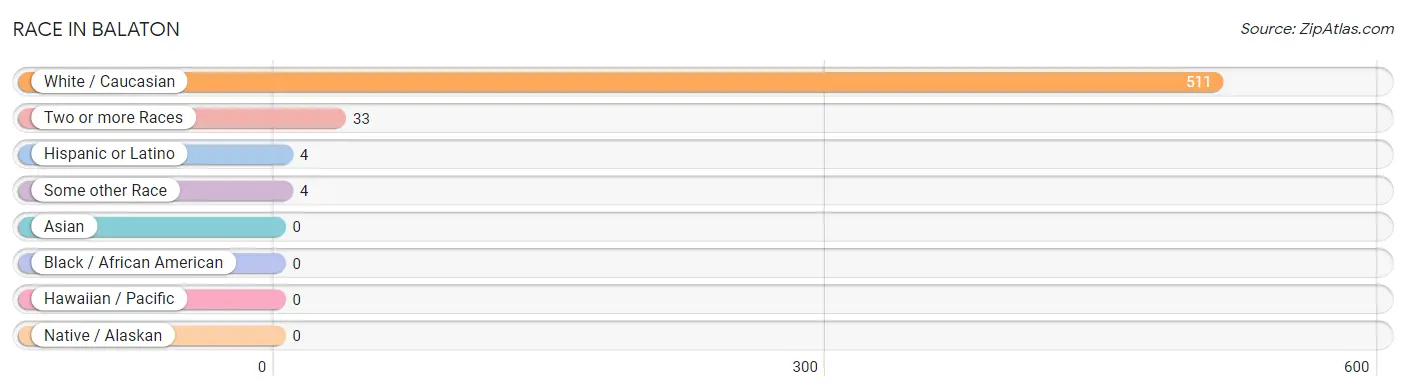
| Race | # Population | % Population |
| Asian | 0 | 0.0% |
| Black / African American | 0 | 0.0% |
| Hawaiian / Pacific | 0 | 0.0% |
| Hispanic or Latino | 4 | 0.7% |
| Native / Alaskan | 0 | 0.0% |
| White / Caucasian | 511 | 93.2% |
| Two or more Races | 33 | 6.0% |
| Some other Race | 4 | 0.7% |
| Total | 548 | 100.0% |
Ancestry in Balaton
The most populous ancestries reported in Balaton are German (206 | 37.6%), Norwegian (107 | 19.5%), Swedish (38 | 6.9%), English (33 | 6.0%), and French American Indian (28 | 5.1%), together accounting for 75.2% of all Balaton residents.
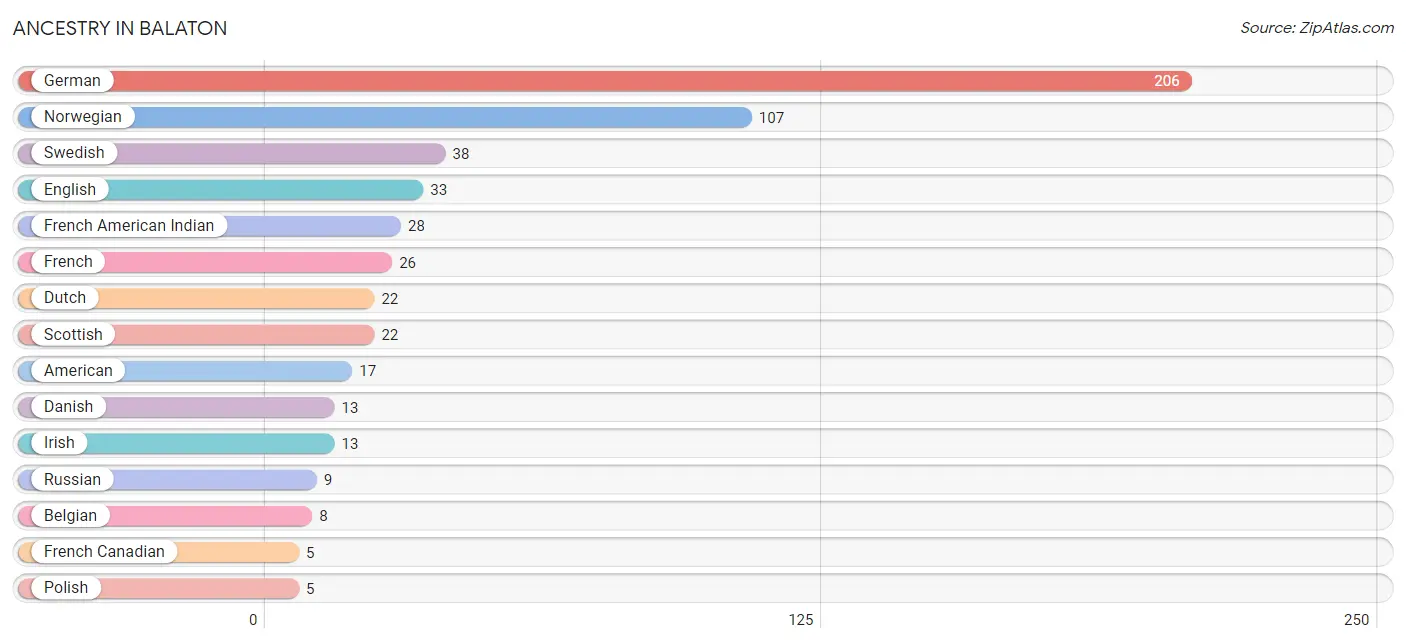
| Ancestry | # Population | % Population |
| American | 17 | 3.1% |
| Belgian | 8 | 1.5% |
| Central American | 4 | 0.7% |
| Danish | 13 | 2.4% |
| Dutch | 22 | 4.0% |
| English | 33 | 6.0% |
| European | 3 | 0.5% |
| Finnish | 2 | 0.4% |
| French | 26 | 4.7% |
| French American Indian | 28 | 5.1% |
| French Canadian | 5 | 0.9% |
| German | 206 | 37.6% |
| Guatemalan | 4 | 0.7% |
| Irish | 13 | 2.4% |
| Italian | 3 | 0.5% |
| Norwegian | 107 | 19.5% |
| Polish | 5 | 0.9% |
| Russian | 9 | 1.6% |
| Scandinavian | 2 | 0.4% |
| Scotch-Irish | 2 | 0.4% |
| Scottish | 22 | 4.0% |
| Swedish | 38 | 6.9% |
| Swiss | 1 | 0.2% | View All 23 Rows |
Immigrants in Balaton

| Immigration Origin | # Population | % Population | View All 0 Rows |
Sex and Age in Balaton
Sex and Age in Balaton
The most populous age groups in Balaton are 30 to 34 Years (36 | 12.2%) for men and 65 to 69 Years (31 | 12.3%) for women.
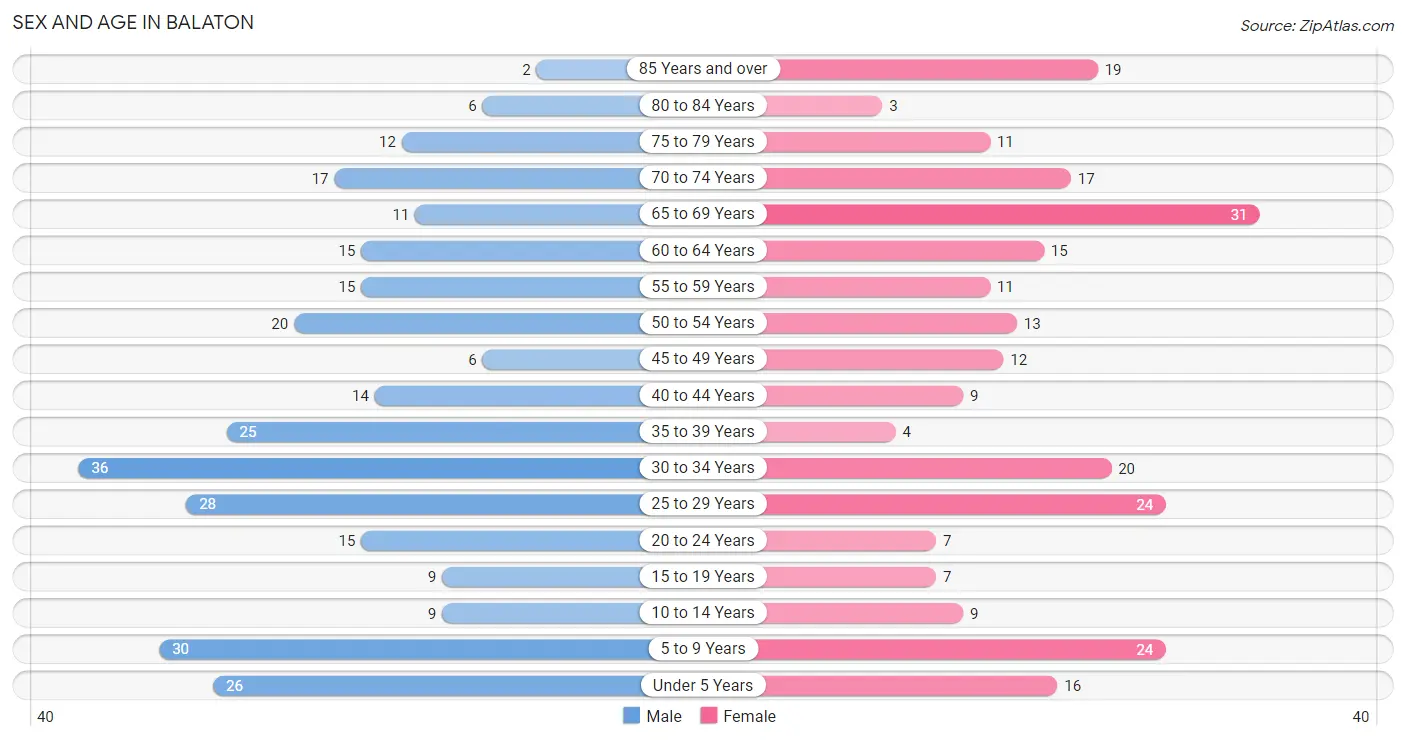
| Age Bracket | Male | Female |
| Under 5 Years | 26 (8.8%) | 16 (6.4%) |
| 5 to 9 Years | 30 (10.1%) | 24 (9.5%) |
| 10 to 14 Years | 9 (3.0%) | 9 (3.6%) |
| 15 to 19 Years | 9 (3.0%) | 7 (2.8%) |
| 20 to 24 Years | 15 (5.1%) | 7 (2.8%) |
| 25 to 29 Years | 28 (9.5%) | 24 (9.5%) |
| 30 to 34 Years | 36 (12.2%) | 20 (7.9%) |
| 35 to 39 Years | 25 (8.5%) | 4 (1.6%) |
| 40 to 44 Years | 14 (4.7%) | 9 (3.6%) |
| 45 to 49 Years | 6 (2.0%) | 12 (4.8%) |
| 50 to 54 Years | 20 (6.8%) | 13 (5.2%) |
| 55 to 59 Years | 15 (5.1%) | 11 (4.4%) |
| 60 to 64 Years | 15 (5.1%) | 15 (5.9%) |
| 65 to 69 Years | 11 (3.7%) | 31 (12.3%) |
| 70 to 74 Years | 17 (5.7%) | 17 (6.8%) |
| 75 to 79 Years | 12 (4.1%) | 11 (4.4%) |
| 80 to 84 Years | 6 (2.0%) | 3 (1.2%) |
| 85 Years and over | 2 (0.7%) | 19 (7.5%) |
| Total | 296 (100.0%) | 252 (100.0%) |
Families and Households in Balaton
Median Family Size in Balaton
The median family size in Balaton is 2.63 persons per family, with single male/father families (14 | 9.7%) accounting for the largest median family size of 3.64 persons per family. On the other hand, married-couple families (111 | 76.5%) represent the smallest median family size with 2.50 persons per family.
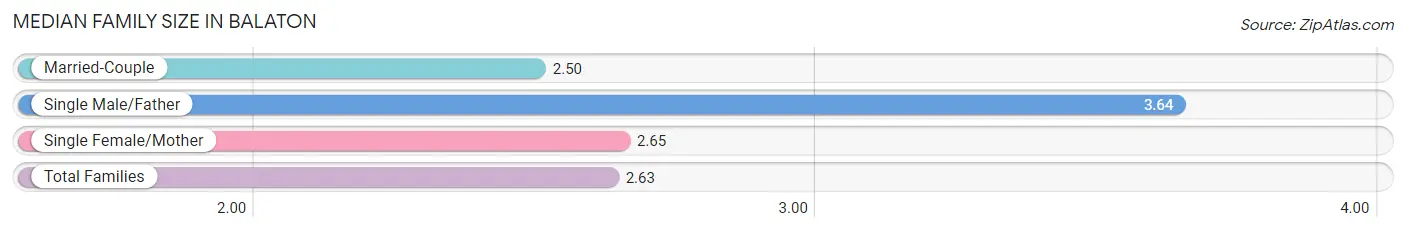
| Family Type | # Families | Family Size |
| Married-Couple | 111 (76.5%) | 2.50 |
| Single Male/Father | 14 (9.7%) | 3.64 |
| Single Female/Mother | 20 (13.8%) | 2.65 |
| Total Families | 145 (100.0%) | 2.63 |
Median Household Size in Balaton
The median household size in Balaton is 2.14 persons per household, with single male/father households (14 | 5.8%) accounting for the largest median household size of 3.79 persons per household. non-family households (97 | 40.1%) represent the smallest median household size with 1.10 persons per household.
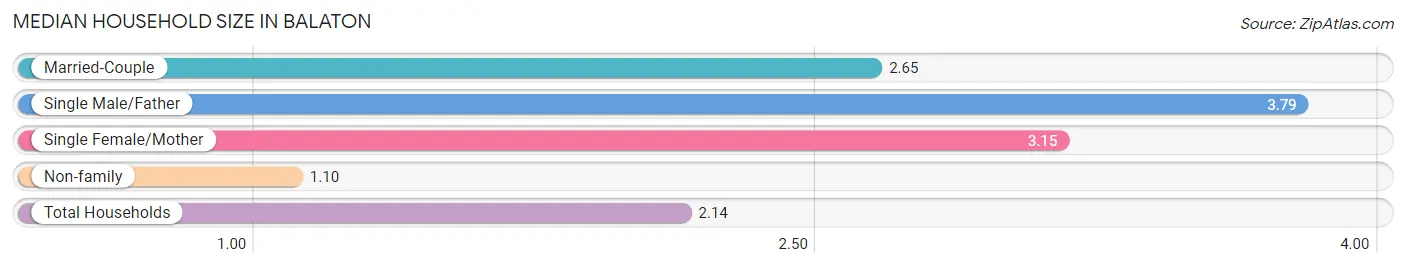
| Household Type | # Households | Household Size |
| Married-Couple | 111 (45.9%) | 2.65 |
| Single Male/Father | 14 (5.8%) | 3.79 |
| Single Female/Mother | 20 (8.3%) | 3.15 |
| Non-family | 97 (40.1%) | 1.10 |
| Total Households | 242 (100.0%) | 2.14 |
Household Size by Marriage Status in Balaton
Out of a total of 242 households in Balaton, 145 (59.9%) are family households, while 97 (40.1%) are nonfamily households. The most numerous type of family households are 2-person households, comprising 78, and the most common type of nonfamily households are 1-person households, comprising 87.
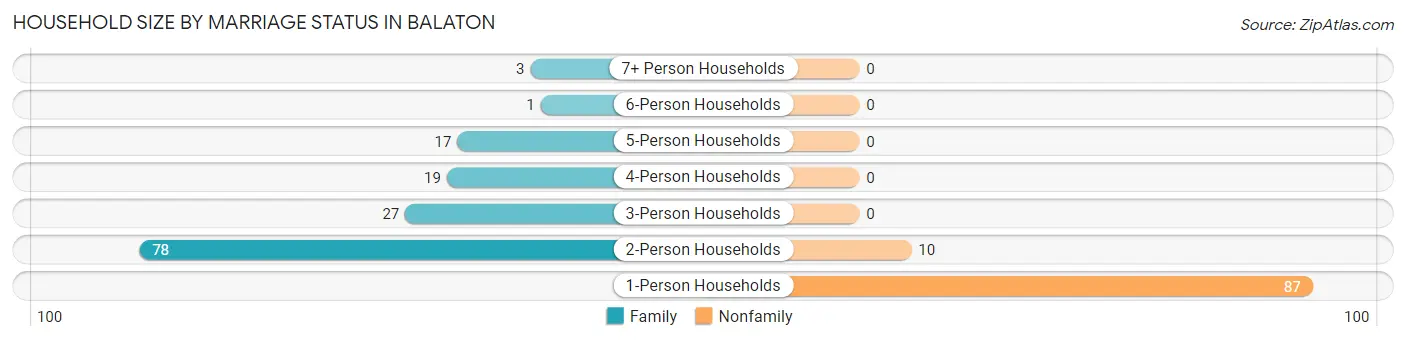
| Household Size | Family Households | Nonfamily Households |
| 1-Person Households | - | 87 (35.9%) |
| 2-Person Households | 78 (32.2%) | 10 (4.1%) |
| 3-Person Households | 27 (11.2%) | 0 (0.0%) |
| 4-Person Households | 19 (7.9%) | 0 (0.0%) |
| 5-Person Households | 17 (7.0%) | 0 (0.0%) |
| 6-Person Households | 1 (0.4%) | 0 (0.0%) |
| 7+ Person Households | 3 (1.2%) | 0 (0.0%) |
| Total | 145 (59.9%) | 97 (40.1%) |
Female Fertility in Balaton
Fertility by Age in Balaton
Average fertility rate in Balaton is 174.0 births per 1,000 women. Women in the age bracket of 20 to 34 years have the highest fertility rate with 294.0 births per 1,000 women. Women in the age bracket of 20 to 34 years acount for 100.0% of all women with births.
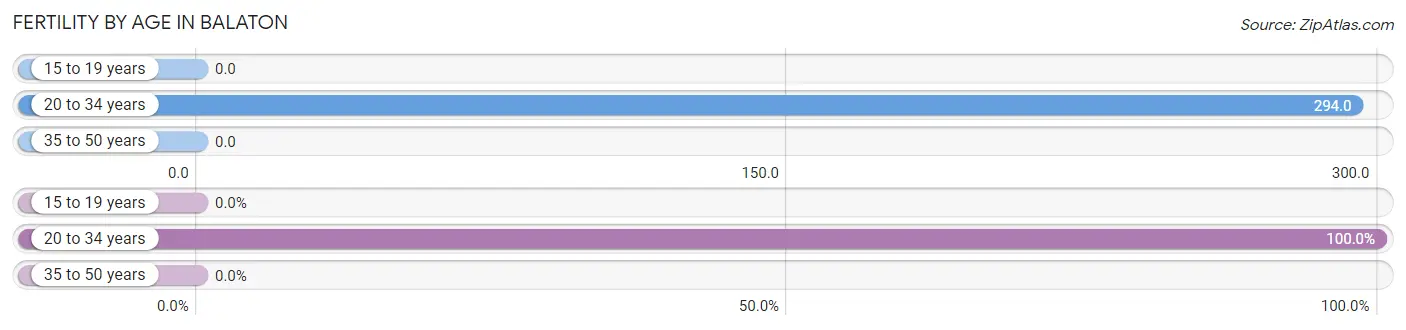
| Age Bracket | Women with Births | Births / 1,000 Women |
| 15 to 19 years | 0 (0.0%) | 0.0 |
| 20 to 34 years | 15 (100.0%) | 294.0 |
| 35 to 50 years | 0 (0.0%) | 0.0 |
| Total | 15 (100.0%) | 174.0 |
Fertility by Age by Marriage Status in Balaton
86.7% of women with births (15) in Balaton are married. The highest percentage of unmarried women with births falls into 20 to 34 years age bracket with 13.3% of them unmarried at the time of birth, while the lowest percentage of unmarried women with births belong to 20 to 34 years age bracket with 13.3% of them unmarried.
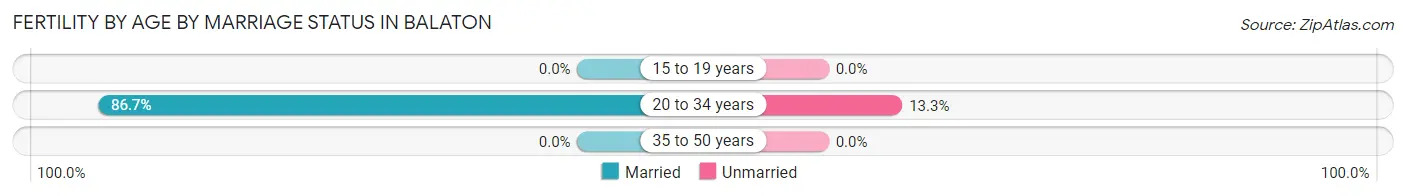
| Age Bracket | Married | Unmarried |
| 15 to 19 years | 0 (0.0%) | 0 (0.0%) |
| 20 to 34 years | 13 (86.7%) | 2 (13.3%) |
| 35 to 50 years | 0 (0.0%) | 0 (0.0%) |
| Total | 13 (86.7%) | 2 (13.3%) |
Fertility by Education in Balaton
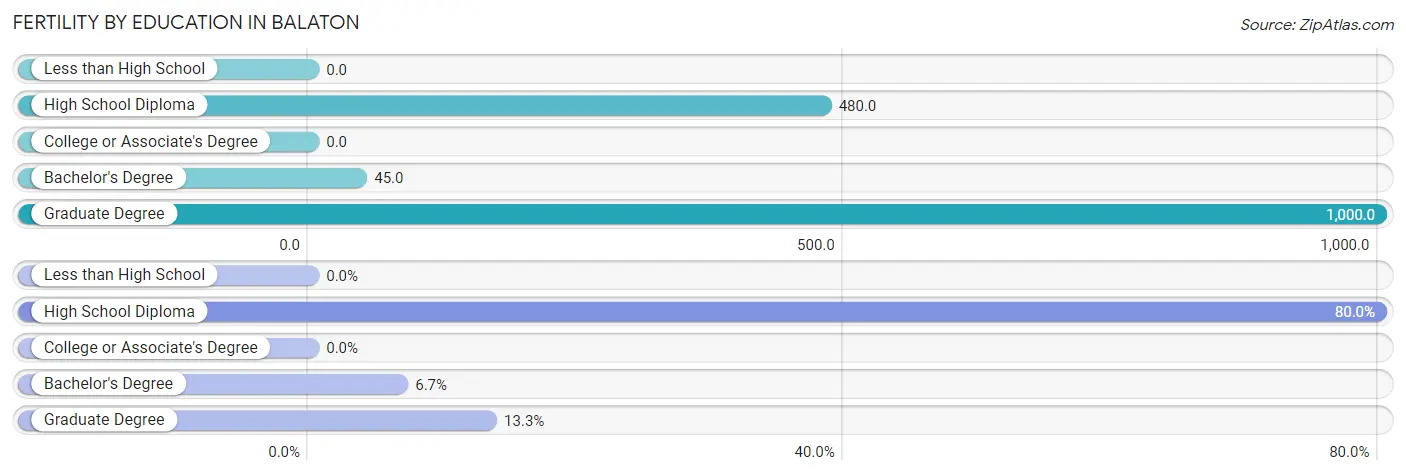
| Educational Attainment | Women with Births | Births / 1,000 Women |
| Less than High School | 0 (0.0%) | 0.0 |
| High School Diploma | 12 (80.0%) | 480.0 |
| College or Associate's Degree | 0 (0.0%) | 0.0 |
| Bachelor's Degree | 1 (6.7%) | 45.0 |
| Graduate Degree | 2 (13.3%) | 1,000.0 |
| Total | 15 (100.0%) | 174.0 |
Fertility by Education by Marriage Status in Balaton
13.3% of women with births in Balaton are unmarried. Women with the educational attainment of high school diploma are most likely to be married with 100.0% of them married at childbirth, while women with the educational attainment of graduate degree are least likely to be married with 100.0% of them unmarried at childbirth.
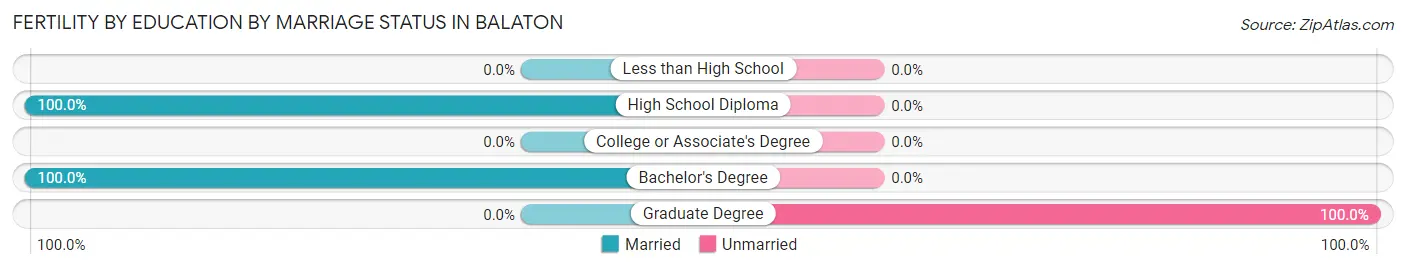
| Educational Attainment | Married | Unmarried |
| Less than High School | 0 (0.0%) | 0 (0.0%) |
| High School Diploma | 12 (100.0%) | 0 (0.0%) |
| College or Associate's Degree | 0 (0.0%) | 0 (0.0%) |
| Bachelor's Degree | 1 (100.0%) | 0 (0.0%) |
| Graduate Degree | 0 (0.0%) | 2 (100.0%) |
| Total | 13 (86.7%) | 2 (13.3%) |
Employment Characteristics in Balaton
Employment by Class of Employer in Balaton
Among the 244 employed individuals in Balaton, private company employees (187 | 76.6%), self-employed (not incorporated) (17 | 7.0%), and not-for-profit organizations (12 | 4.9%) make up the most common classes of employment.
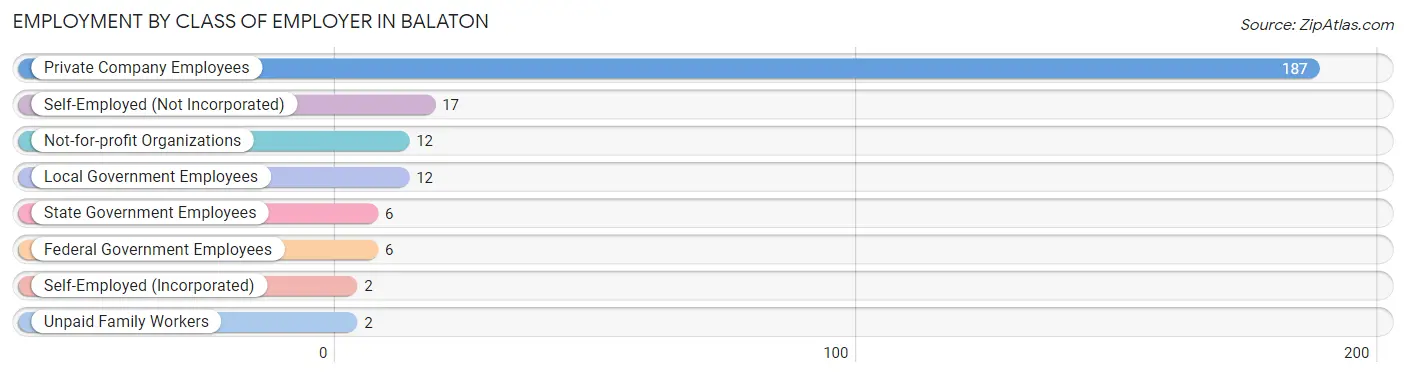
| Employer Class | # Employees | % Employees |
| Private Company Employees | 187 | 76.6% |
| Self-Employed (Incorporated) | 2 | 0.8% |
| Self-Employed (Not Incorporated) | 17 | 7.0% |
| Not-for-profit Organizations | 12 | 4.9% |
| Local Government Employees | 12 | 4.9% |
| State Government Employees | 6 | 2.5% |
| Federal Government Employees | 6 | 2.5% |
| Unpaid Family Workers | 2 | 0.8% |
| Total | 244 | 100.0% |
Employment Status by Age in Balaton
According to the labor force statistics for Balaton, out of the total population over 16 years of age (434), 62.9% or 273 individuals are in the labor force, with 7.7% or 21 of them unemployed. The age group with the highest labor force participation rate is 20 to 24 years, with 100.0% or 22 individuals in the labor force. Within the labor force, the 35 to 44 years age range has the highest percentage of unemployed individuals, with 23.7% or 9 of them being unemployed.
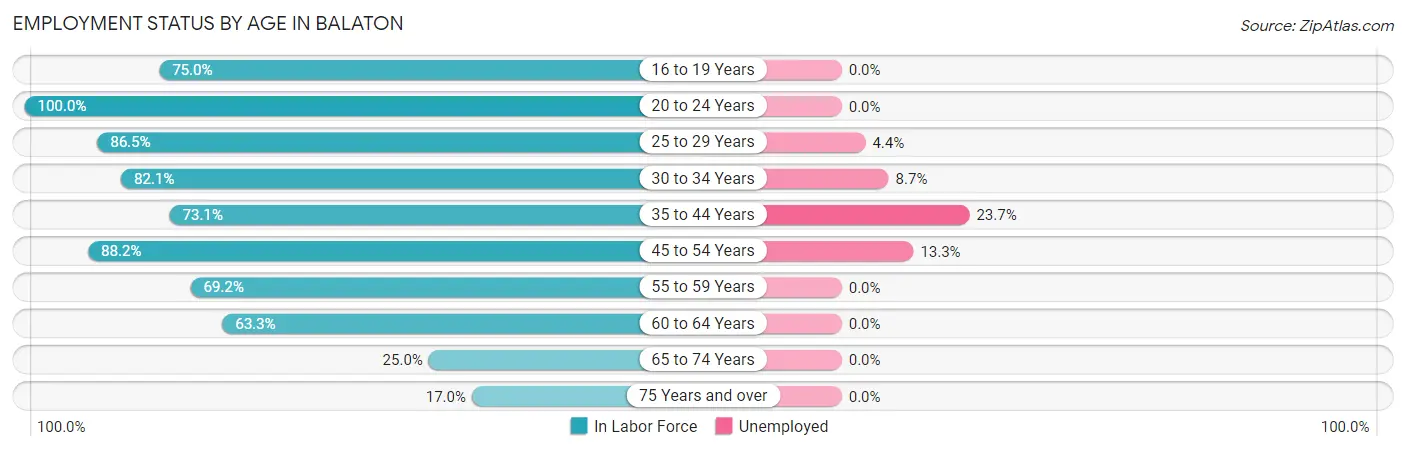
| Age Bracket | In Labor Force | Unemployed |
| 16 to 19 Years | 12 (75.0%) | 0 (0.0%) |
| 20 to 24 Years | 22 (100.0%) | 0 (0.0%) |
| 25 to 29 Years | 45 (86.5%) | 2 (4.4%) |
| 30 to 34 Years | 46 (82.1%) | 4 (8.7%) |
| 35 to 44 Years | 38 (73.1%) | 9 (23.7%) |
| 45 to 54 Years | 45 (88.2%) | 6 (13.3%) |
| 55 to 59 Years | 18 (69.2%) | 0 (0.0%) |
| 60 to 64 Years | 19 (63.3%) | 0 (0.0%) |
| 65 to 74 Years | 19 (25.0%) | 0 (0.0%) |
| 75 Years and over | 9 (17.0%) | 0 (0.0%) |
| Total | 273 (62.9%) | 21 (7.7%) |
Employment Status by Educational Attainment in Balaton
According to labor force statistics for Balaton, 79.0% of individuals (211) out of the total population between 25 and 64 years of age (267) are in the labor force, with 10.0% or 21 of them being unemployed. The group with the highest labor force participation rate are those with the educational attainment of college / associate degree, with 91.8% or 123 individuals in the labor force. Within the labor force, individuals with college / associate degree education have the highest percentage of unemployment, with 13.8% or 17 of them being unemployed.
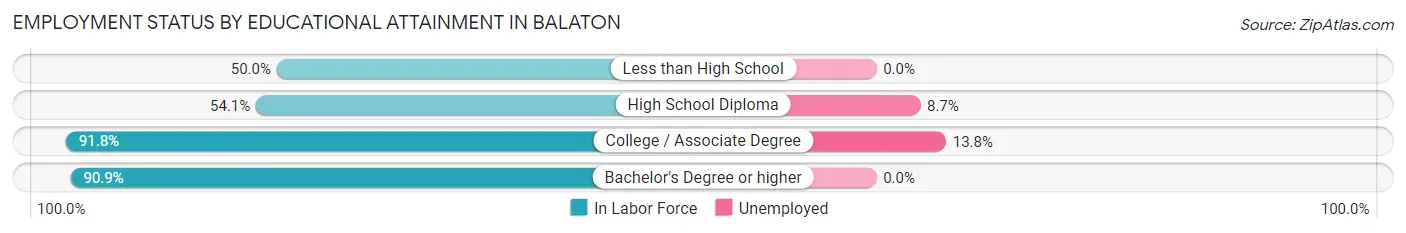
| Educational Attainment | In Labor Force | Unemployed |
| Less than High School | 2 (50.0%) | 0 (0.0%) |
| High School Diploma | 46 (54.1%) | 7 (8.7%) |
| College / Associate Degree | 123 (91.8%) | 18 (13.8%) |
| Bachelor's Degree or higher | 40 (90.9%) | 0 (0.0%) |
| Total | 211 (79.0%) | 27 (10.0%) |
Employment Occupations by Sex in Balaton
Management, Business, Science and Arts Occupations
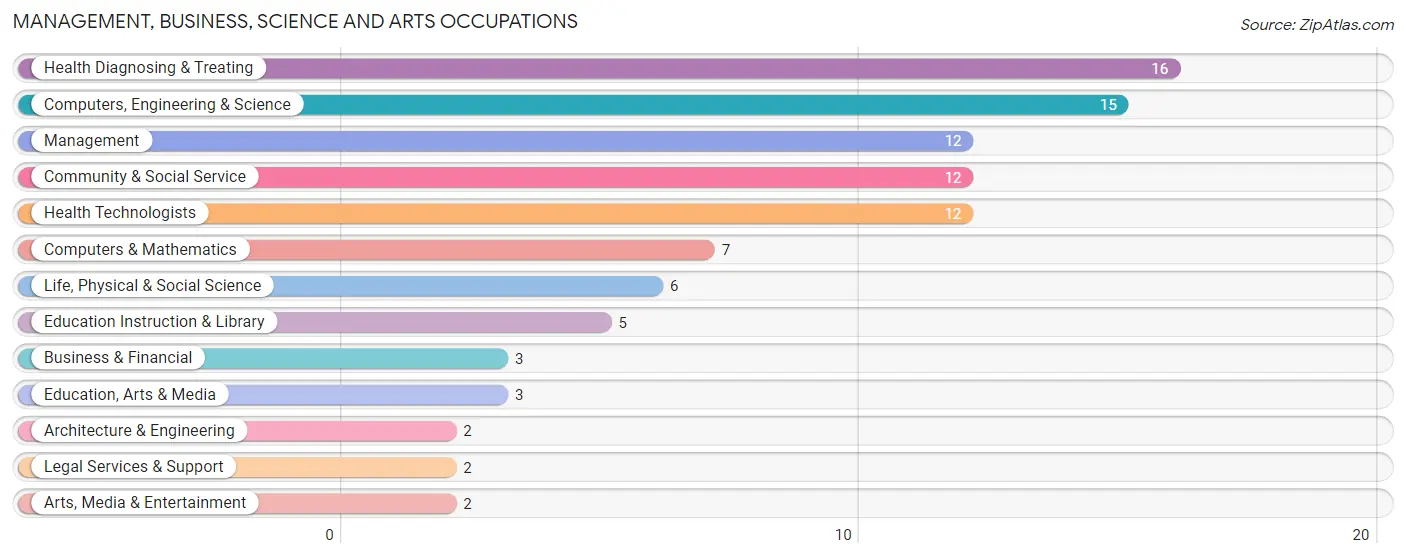
The most common Management, Business, Science and Arts occupations in Balaton are Health Diagnosing & Treating (16 | 6.4%), Computers, Engineering & Science (15 | 5.9%), Management (12 | 4.8%), Community & Social Service (12 | 4.8%), and Health Technologists (12 | 4.8%).
Management, Business, Science and Arts Occupations by Sex
Within the Management, Business, Science and Arts occupations in Balaton, the most male-oriented occupations are Computers & Mathematics (100.0%), Architecture & Engineering (100.0%), and Legal Services & Support (100.0%), while the most female-oriented occupations are Arts, Media & Entertainment (100.0%), Health Technologists (100.0%), and Health Diagnosing & Treating (75.0%).
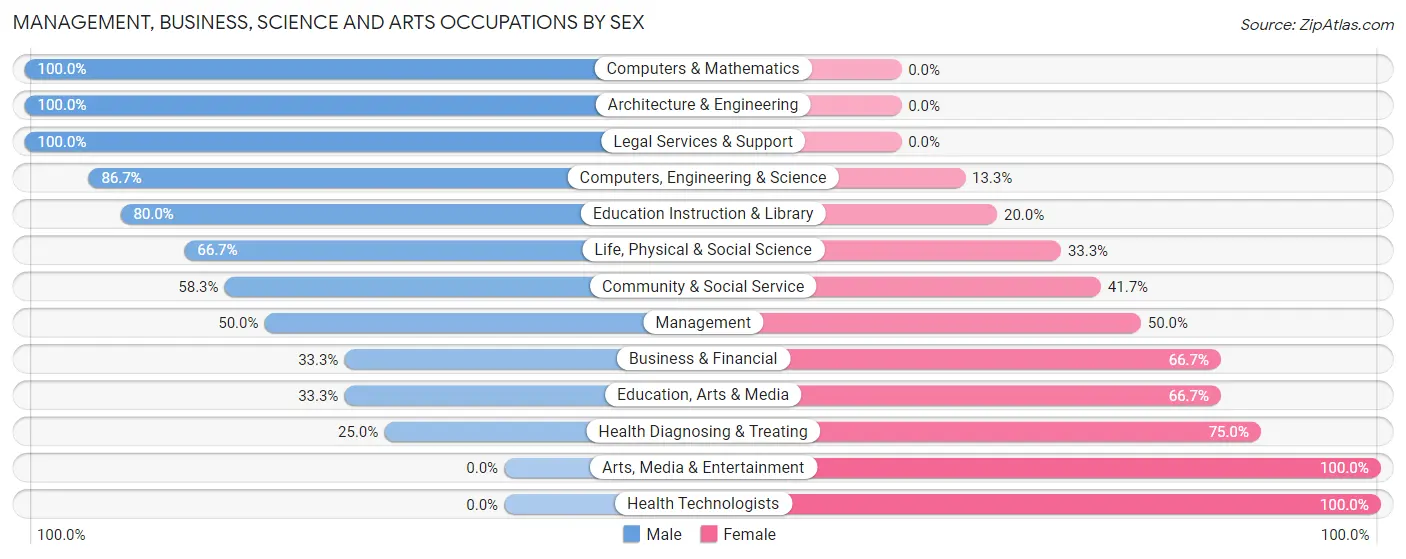
| Occupation | Male | Female |
| Management | 6 (50.0%) | 6 (50.0%) |
| Business & Financial | 1 (33.3%) | 2 (66.7%) |
| Computers, Engineering & Science | 13 (86.7%) | 2 (13.3%) |
| Computers & Mathematics | 7 (100.0%) | 0 (0.0%) |
| Architecture & Engineering | 2 (100.0%) | 0 (0.0%) |
| Life, Physical & Social Science | 4 (66.7%) | 2 (33.3%) |
| Community & Social Service | 7 (58.3%) | 5 (41.7%) |
| Education, Arts & Media | 1 (33.3%) | 2 (66.7%) |
| Legal Services & Support | 2 (100.0%) | 0 (0.0%) |
| Education Instruction & Library | 4 (80.0%) | 1 (20.0%) |
| Arts, Media & Entertainment | 0 (0.0%) | 2 (100.0%) |
| Health Diagnosing & Treating | 4 (25.0%) | 12 (75.0%) |
| Health Technologists | 0 (0.0%) | 12 (100.0%) |
| Total (Category) | 31 (53.4%) | 27 (46.6%) |
| Total (Overall) | 144 (57.1%) | 108 (42.9%) |
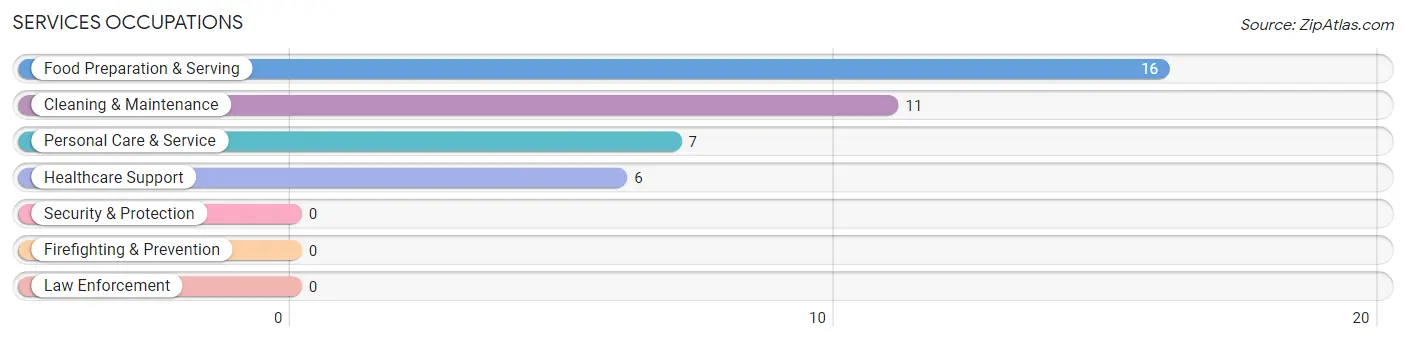
Services Occupations
The most common Services occupations in Balaton are Food Preparation & Serving (16 | 6.4%), Cleaning & Maintenance (11 | 4.4%), Personal Care & Service (7 | 2.8%), and Healthcare Support (6 | 2.4%).
Services Occupations by Sex
Within the Services occupations in Balaton, the most male-oriented occupations are Personal Care & Service (100.0%), Cleaning & Maintenance (45.5%), and Food Preparation & Serving (31.2%), while the most female-oriented occupations are Healthcare Support (100.0%), Food Preparation & Serving (68.8%), and Cleaning & Maintenance (54.5%).
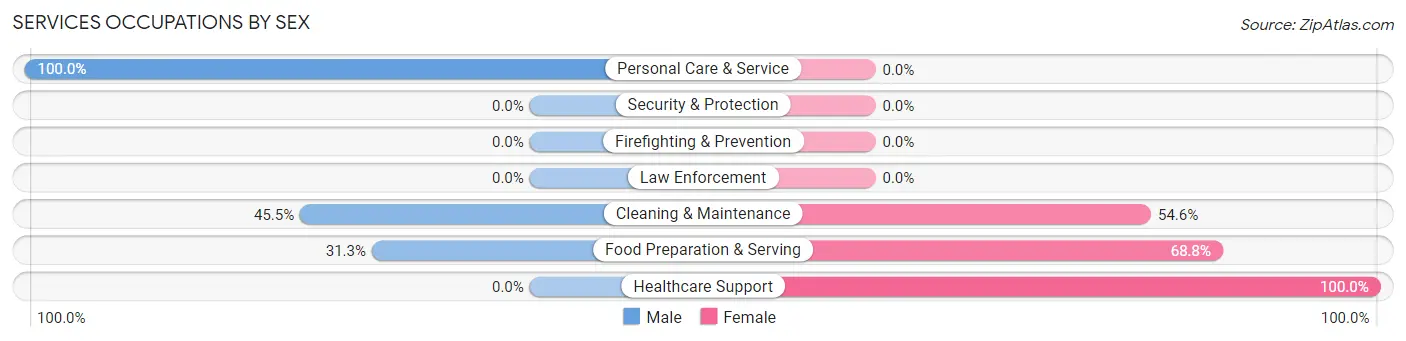
| Occupation | Male | Female |
| Healthcare Support | 0 (0.0%) | 6 (100.0%) |
| Security & Protection | 0 (0.0%) | 0 (0.0%) |
| Firefighting & Prevention | 0 (0.0%) | 0 (0.0%) |
| Law Enforcement | 0 (0.0%) | 0 (0.0%) |
| Food Preparation & Serving | 5 (31.2%) | 11 (68.8%) |
| Cleaning & Maintenance | 5 (45.5%) | 6 (54.5%) |
| Personal Care & Service | 7 (100.0%) | 0 (0.0%) |
| Total (Category) | 17 (42.5%) | 23 (57.5%) |
| Total (Overall) | 144 (57.1%) | 108 (42.9%) |
Sales and Office Occupations
The most common Sales and Office occupations in Balaton are Office & Administration (34 | 13.5%), and Sales & Related (28 | 11.1%).
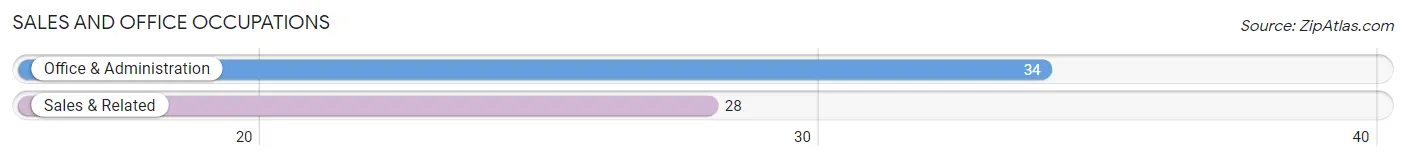
Sales and Office Occupations by Sex
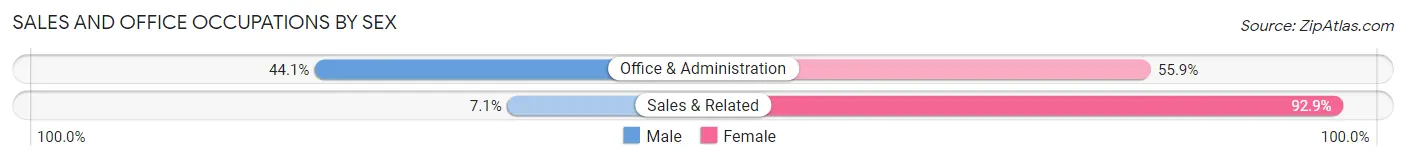
| Occupation | Male | Female |
| Sales & Related | 2 (7.1%) | 26 (92.9%) |
| Office & Administration | 15 (44.1%) | 19 (55.9%) |
| Total (Category) | 17 (27.4%) | 45 (72.6%) |
| Total (Overall) | 144 (57.1%) | 108 (42.9%) |
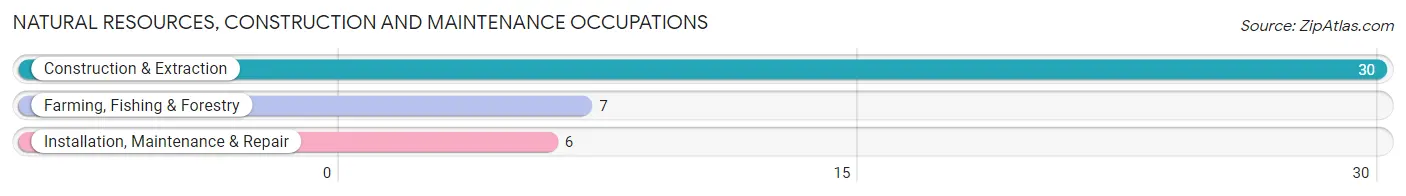
Natural Resources, Construction and Maintenance Occupations
The most common Natural Resources, Construction and Maintenance occupations in Balaton are Construction & Extraction (30 | 11.9%), Farming, Fishing & Forestry (7 | 2.8%), and Installation, Maintenance & Repair (6 | 2.4%).
Natural Resources, Construction and Maintenance Occupations by Sex
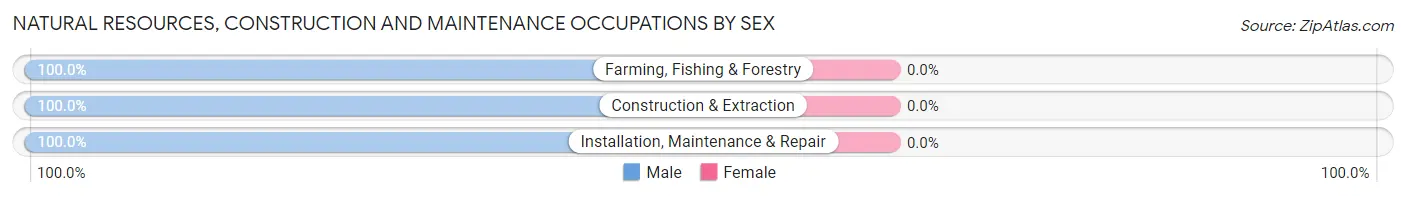
| Occupation | Male | Female |
| Farming, Fishing & Forestry | 7 (100.0%) | 0 (0.0%) |
| Construction & Extraction | 30 (100.0%) | 0 (0.0%) |
| Installation, Maintenance & Repair | 6 (100.0%) | 0 (0.0%) |
| Total (Category) | 43 (100.0%) | 0 (0.0%) |
| Total (Overall) | 144 (57.1%) | 108 (42.9%) |
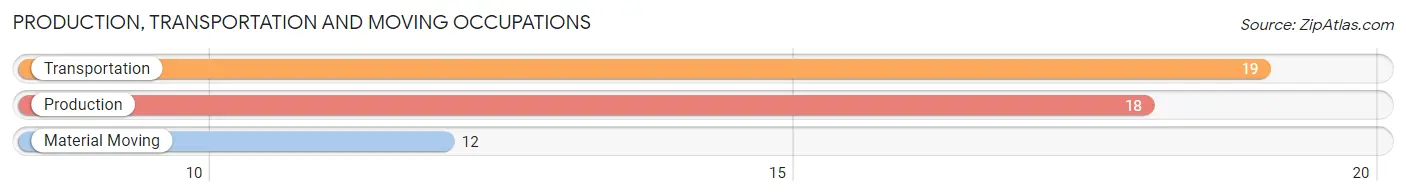
Production, Transportation and Moving Occupations
The most common Production, Transportation and Moving occupations in Balaton are Transportation (19 | 7.5%), Production (18 | 7.1%), and Material Moving (12 | 4.8%).
Production, Transportation and Moving Occupations by Sex
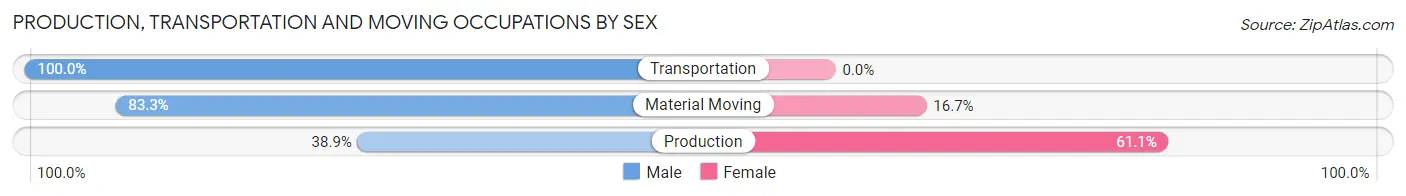
| Occupation | Male | Female |
| Production | 7 (38.9%) | 11 (61.1%) |
| Transportation | 19 (100.0%) | 0 (0.0%) |
| Material Moving | 10 (83.3%) | 2 (16.7%) |
| Total (Category) | 36 (73.5%) | 13 (26.5%) |
| Total (Overall) | 144 (57.1%) | 108 (42.9%) |
Employment Industries by Sex in Balaton
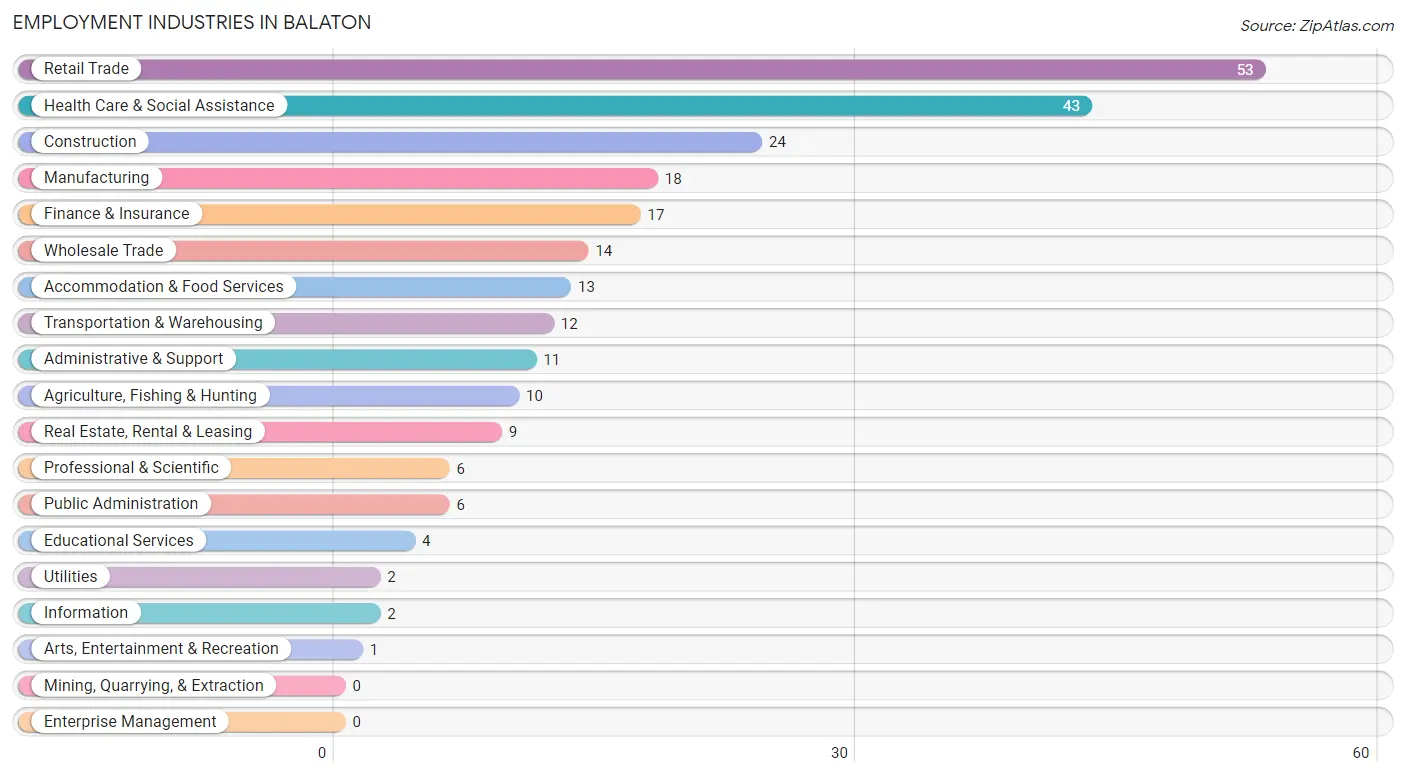
Employment Industries in Balaton
The major employment industries in Balaton include Retail Trade (53 | 21.0%), Health Care & Social Assistance (43 | 17.1%), Construction (24 | 9.5%), Manufacturing (18 | 7.1%), and Finance & Insurance (17 | 6.8%).
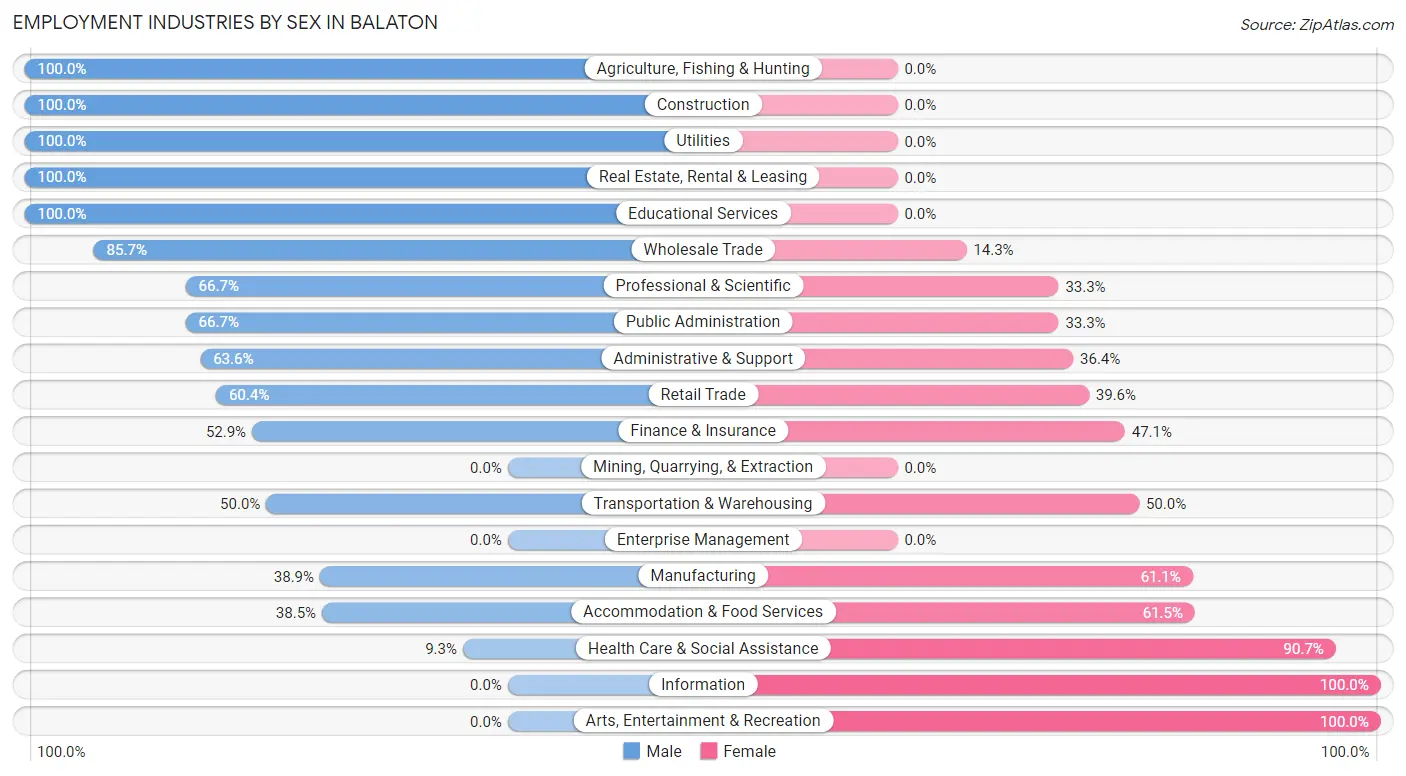
Employment Industries by Sex in Balaton
The Balaton industries that see more men than women are Agriculture, Fishing & Hunting (100.0%), Construction (100.0%), and Utilities (100.0%), whereas the industries that tend to have a higher number of women are Information (100.0%), Arts, Entertainment & Recreation (100.0%), and Health Care & Social Assistance (90.7%).
| Industry | Male | Female |
| Agriculture, Fishing & Hunting | 10 (100.0%) | 0 (0.0%) |
| Mining, Quarrying, & Extraction | 0 (0.0%) | 0 (0.0%) |
| Construction | 24 (100.0%) | 0 (0.0%) |
| Manufacturing | 7 (38.9%) | 11 (61.1%) |
| Wholesale Trade | 12 (85.7%) | 2 (14.3%) |
| Retail Trade | 32 (60.4%) | 21 (39.6%) |
| Transportation & Warehousing | 6 (50.0%) | 6 (50.0%) |
| Utilities | 2 (100.0%) | 0 (0.0%) |
| Information | 0 (0.0%) | 2 (100.0%) |
| Finance & Insurance | 9 (52.9%) | 8 (47.1%) |
| Real Estate, Rental & Leasing | 9 (100.0%) | 0 (0.0%) |
| Professional & Scientific | 4 (66.7%) | 2 (33.3%) |
| Enterprise Management | 0 (0.0%) | 0 (0.0%) |
| Administrative & Support | 7 (63.6%) | 4 (36.4%) |
| Educational Services | 4 (100.0%) | 0 (0.0%) |
| Health Care & Social Assistance | 4 (9.3%) | 39 (90.7%) |
| Arts, Entertainment & Recreation | 0 (0.0%) | 1 (100.0%) |
| Accommodation & Food Services | 5 (38.5%) | 8 (61.5%) |
| Public Administration | 4 (66.7%) | 2 (33.3%) |
| Total | 144 (57.1%) | 108 (42.9%) |
Education in Balaton
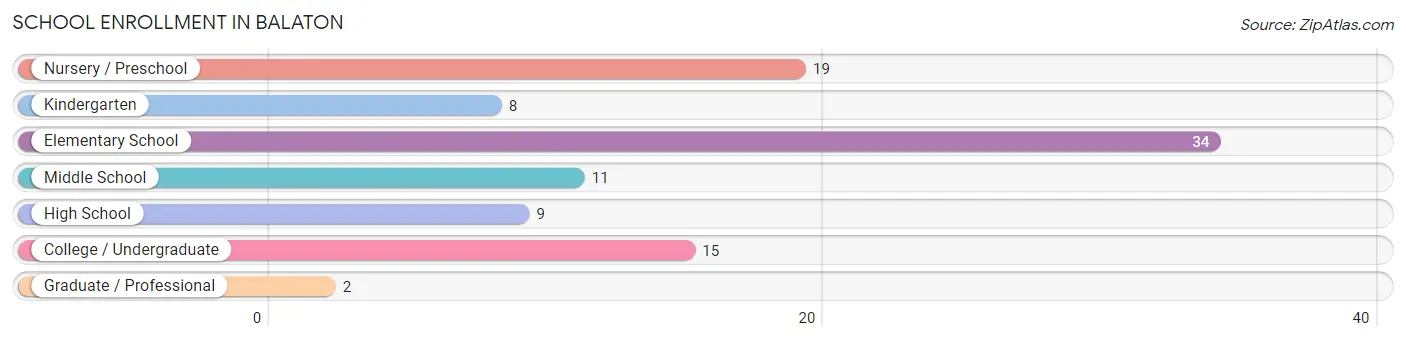
School Enrollment in Balaton
The most common levels of schooling among the 98 students in Balaton are elementary school (34 | 34.7%), nursery / preschool (19 | 19.4%), and college / undergraduate (15 | 15.3%).
| School Level | # Students | % Students |
| Nursery / Preschool | 19 | 19.4% |
| Kindergarten | 8 | 8.2% |
| Elementary School | 34 | 34.7% |
| Middle School | 11 | 11.2% |
| High School | 9 | 9.2% |
| College / Undergraduate | 15 | 15.3% |
| Graduate / Professional | 2 | 2.0% |
| Total | 98 | 100.0% |
School Enrollment by Age by Funding Source in Balaton
Out of a total of 98 students who are enrolled in schools in Balaton, 25 (25.5%) attend a private institution, while the remaining 73 (74.5%) are enrolled in public schools. The age group of 5 to 9 year old has the highest likelihood of being enrolled in private schools, with 20 (42.5% in the age bracket) enrolled. Conversely, the age group of 3 to 4 year olds has the lowest likelihood of being enrolled in a private school, with 9 (100.0% in the age bracket) attending a public institution.
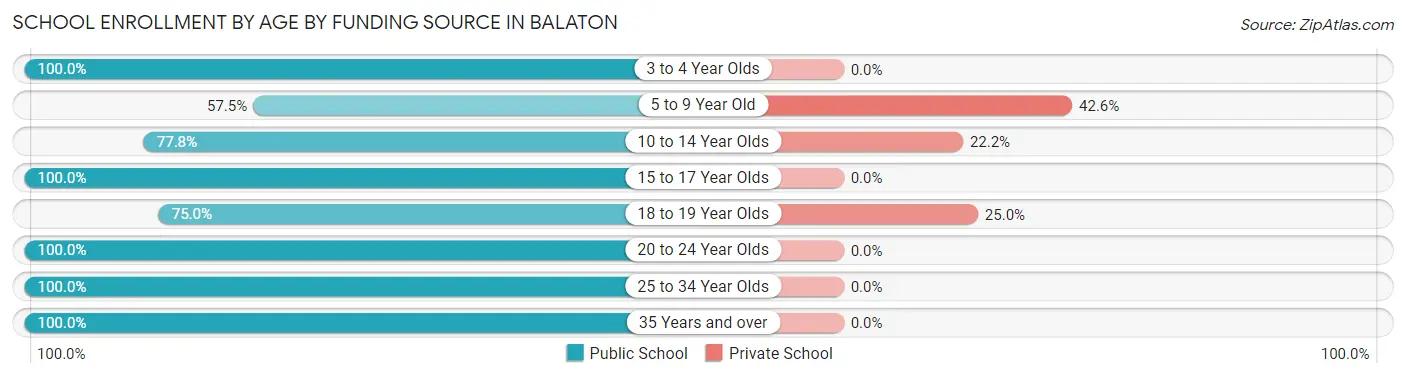
| Age Bracket | Public School | Private School |
| 3 to 4 Year Olds | 9 (100.0%) | 0 (0.0%) |
| 5 to 9 Year Old | 27 (57.5%) | 20 (42.5%) |
| 10 to 14 Year Olds | 14 (77.8%) | 4 (22.2%) |
| 15 to 17 Year Olds | 7 (100.0%) | 0 (0.0%) |
| 18 to 19 Year Olds | 3 (75.0%) | 1 (25.0%) |
| 20 to 24 Year Olds | 7 (100.0%) | 0 (0.0%) |
| 25 to 34 Year Olds | 5 (100.0%) | 0 (0.0%) |
| 35 Years and over | 1 (100.0%) | 0 (0.0%) |
| Total | 73 (74.5%) | 25 (25.5%) |
Educational Attainment by Field of Study in Balaton
Literature & languages (16 | 21.9%), visual & performing arts (15 | 20.5%), business (9 | 12.3%), bio, nature & agricultural (8 | 11.0%), and arts & humanities (6 | 8.2%) are the most common fields of study among 73 individuals in Balaton who have obtained a bachelor's degree or higher.
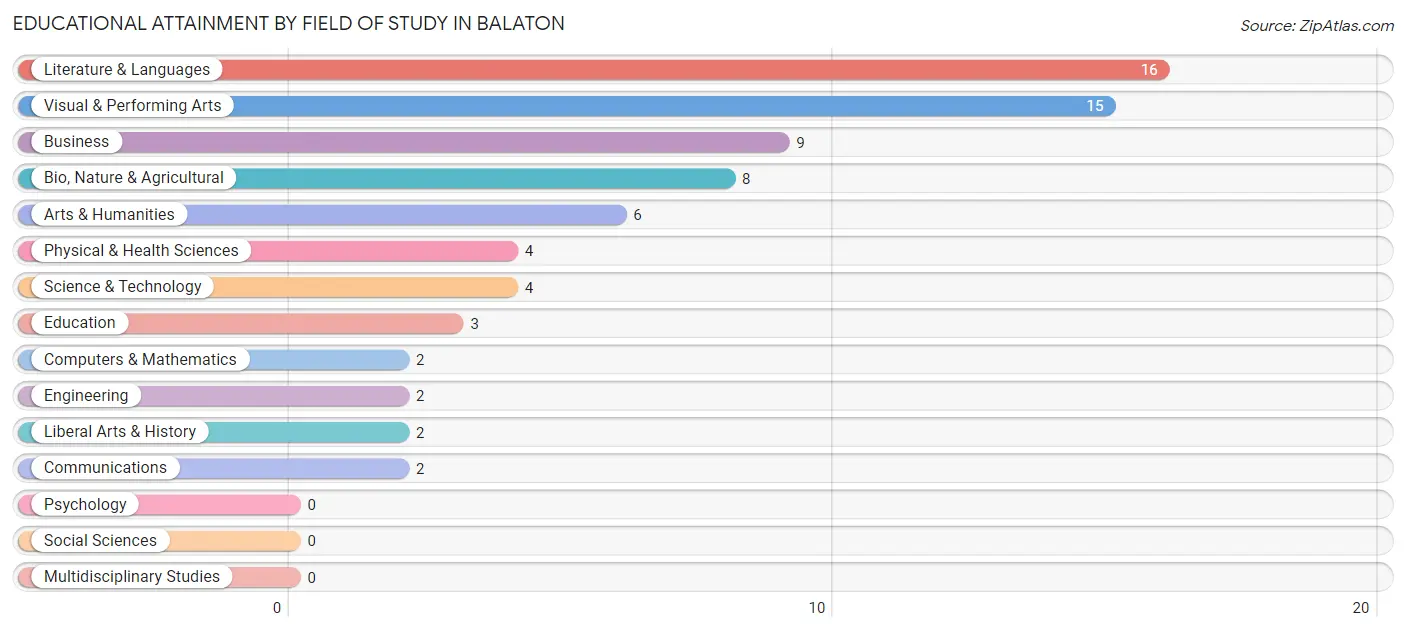
| Field of Study | # Graduates | % Graduates |
| Computers & Mathematics | 2 | 2.7% |
| Bio, Nature & Agricultural | 8 | 11.0% |
| Physical & Health Sciences | 4 | 5.5% |
| Psychology | 0 | 0.0% |
| Social Sciences | 0 | 0.0% |
| Engineering | 2 | 2.7% |
| Multidisciplinary Studies | 0 | 0.0% |
| Science & Technology | 4 | 5.5% |
| Business | 9 | 12.3% |
| Education | 3 | 4.1% |
| Literature & Languages | 16 | 21.9% |
| Liberal Arts & History | 2 | 2.7% |
| Visual & Performing Arts | 15 | 20.5% |
| Communications | 2 | 2.7% |
| Arts & Humanities | 6 | 8.2% |
| Total | 73 | 100.0% |
Transportation & Commute in Balaton
Vehicle Availability by Sex in Balaton
The most prevalent vehicle ownership categories in Balaton are males with 2 vehicles (72, accounting for 51.4%) and females with 2 vehicles (44, making up 69.2%).
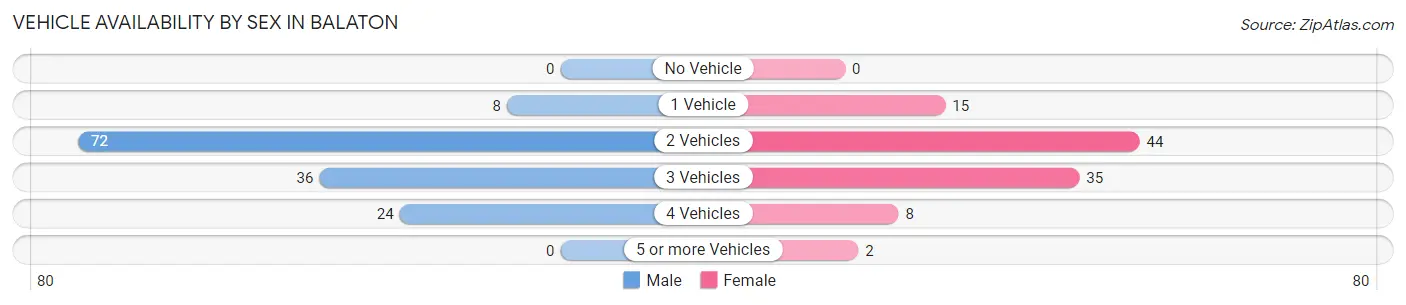
| Vehicles Available | Male | Female |
| No Vehicle | 0 (0.0%) | 0 (0.0%) |
| 1 Vehicle | 8 (5.7%) | 15 (14.4%) |
| 2 Vehicles | 72 (51.4%) | 44 (42.3%) |
| 3 Vehicles | 36 (25.7%) | 35 (33.7%) |
| 4 Vehicles | 24 (17.1%) | 8 (7.7%) |
| 5 or more Vehicles | 0 (0.0%) | 2 (1.9%) |
| Total | 140 (100.0%) | 104 (100.0%) |
Commute Time in Balaton
The most frequently occuring commute durations in Balaton are 20 to 24 minutes (49 commuters, 21.4%), 25 to 29 minutes (45 commuters, 19.7%), and 5 to 9 minutes (38 commuters, 16.6%).
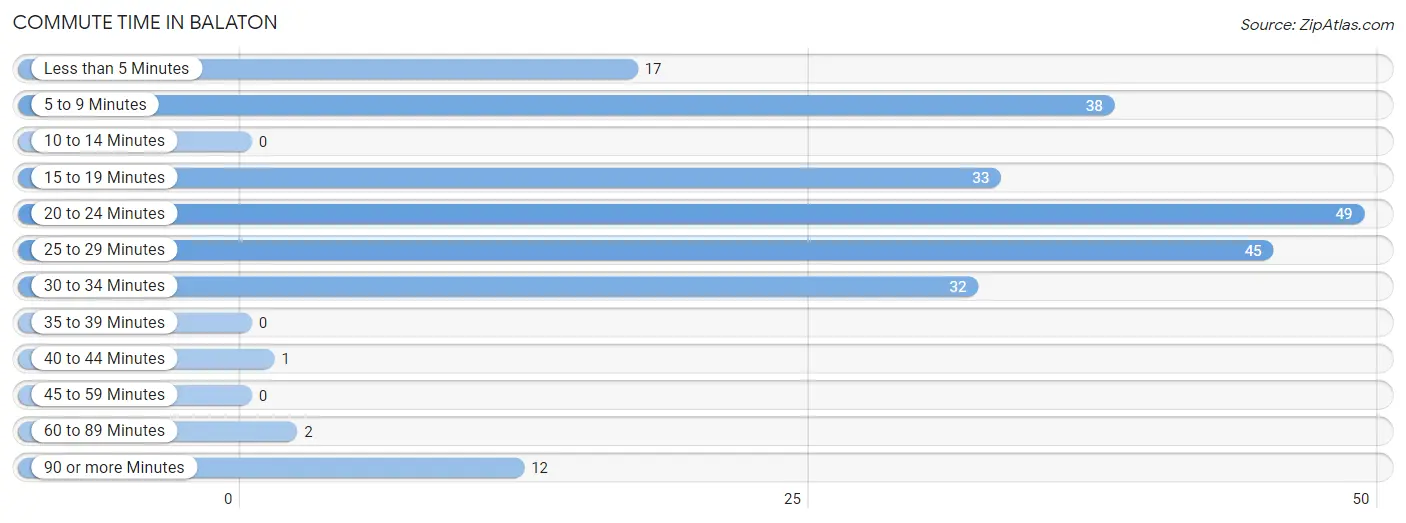
| Commute Time | # Commuters | % Commuters |
| Less than 5 Minutes | 17 | 7.4% |
| 5 to 9 Minutes | 38 | 16.6% |
| 10 to 14 Minutes | 0 | 0.0% |
| 15 to 19 Minutes | 33 | 14.4% |
| 20 to 24 Minutes | 49 | 21.4% |
| 25 to 29 Minutes | 45 | 19.7% |
| 30 to 34 Minutes | 32 | 14.0% |
| 35 to 39 Minutes | 0 | 0.0% |
| 40 to 44 Minutes | 1 | 0.4% |
| 45 to 59 Minutes | 0 | 0.0% |
| 60 to 89 Minutes | 2 | 0.9% |
| 90 or more Minutes | 12 | 5.2% |
Commute Time by Sex in Balaton
The most common commute times in Balaton are 25 to 29 minutes (32 commuters, 24.2%) for males and 20 to 24 minutes (29 commuters, 29.9%) for females.
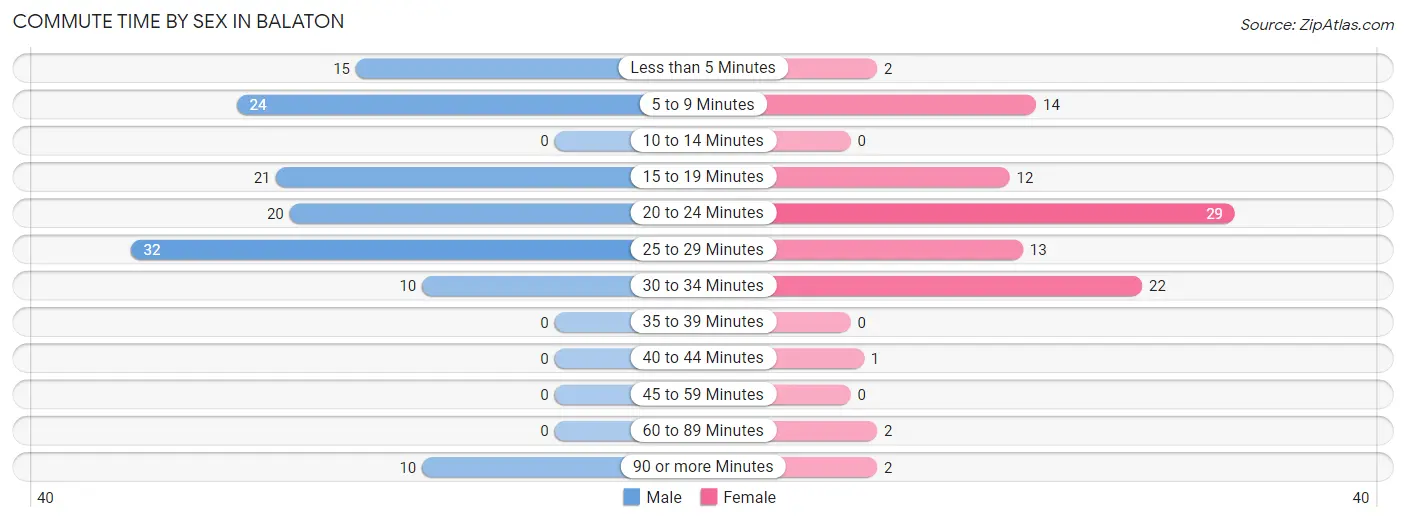
| Commute Time | Male | Female |
| Less than 5 Minutes | 15 (11.4%) | 2 (2.1%) |
| 5 to 9 Minutes | 24 (18.2%) | 14 (14.4%) |
| 10 to 14 Minutes | 0 (0.0%) | 0 (0.0%) |
| 15 to 19 Minutes | 21 (15.9%) | 12 (12.4%) |
| 20 to 24 Minutes | 20 (15.1%) | 29 (29.9%) |
| 25 to 29 Minutes | 32 (24.2%) | 13 (13.4%) |
| 30 to 34 Minutes | 10 (7.6%) | 22 (22.7%) |
| 35 to 39 Minutes | 0 (0.0%) | 0 (0.0%) |
| 40 to 44 Minutes | 0 (0.0%) | 1 (1.0%) |
| 45 to 59 Minutes | 0 (0.0%) | 0 (0.0%) |
| 60 to 89 Minutes | 0 (0.0%) | 2 (2.1%) |
| 90 or more Minutes | 10 (7.6%) | 2 (2.1%) |
Time of Departure to Work by Sex in Balaton
The most frequent times of departure to work in Balaton are 8:00 AM to 8:29 AM (28, 21.2%) for males and 7:30 AM to 7:59 AM (34, 35.0%) for females.
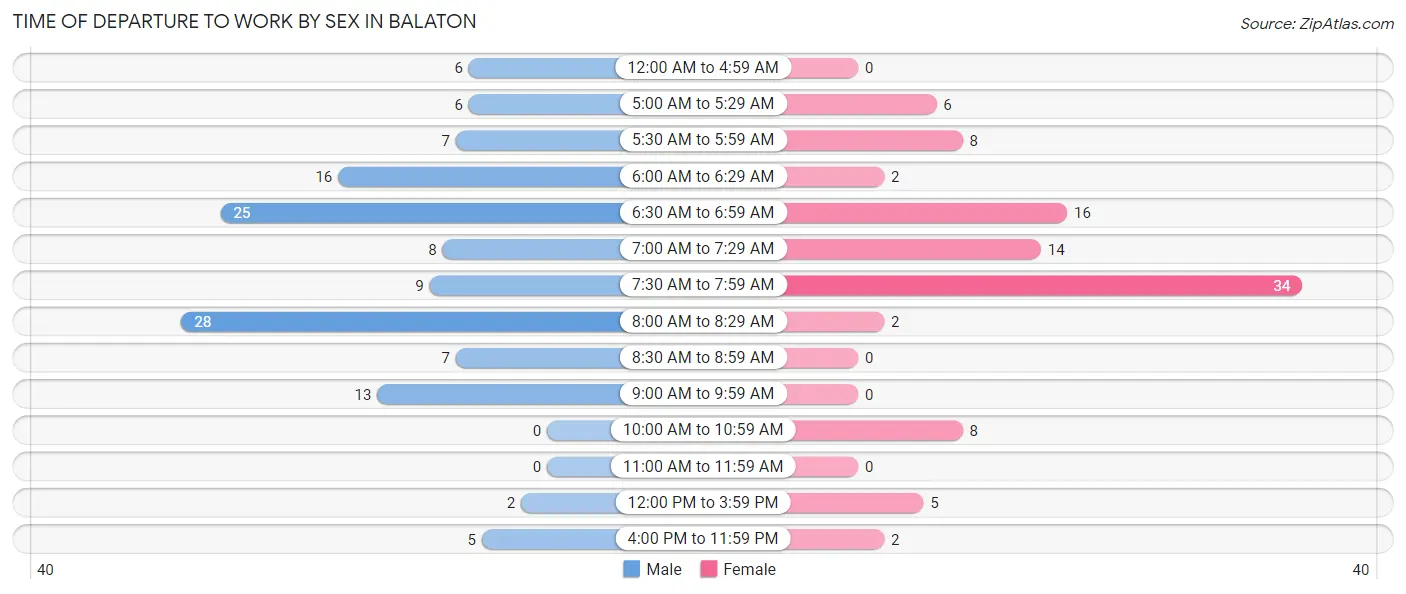
| Time of Departure | Male | Female |
| 12:00 AM to 4:59 AM | 6 (4.5%) | 0 (0.0%) |
| 5:00 AM to 5:29 AM | 6 (4.5%) | 6 (6.2%) |
| 5:30 AM to 5:59 AM | 7 (5.3%) | 8 (8.3%) |
| 6:00 AM to 6:29 AM | 16 (12.1%) | 2 (2.1%) |
| 6:30 AM to 6:59 AM | 25 (18.9%) | 16 (16.5%) |
| 7:00 AM to 7:29 AM | 8 (6.1%) | 14 (14.4%) |
| 7:30 AM to 7:59 AM | 9 (6.8%) | 34 (35.0%) |
| 8:00 AM to 8:29 AM | 28 (21.2%) | 2 (2.1%) |
| 8:30 AM to 8:59 AM | 7 (5.3%) | 0 (0.0%) |
| 9:00 AM to 9:59 AM | 13 (9.9%) | 0 (0.0%) |
| 10:00 AM to 10:59 AM | 0 (0.0%) | 8 (8.3%) |
| 11:00 AM to 11:59 AM | 0 (0.0%) | 0 (0.0%) |
| 12:00 PM to 3:59 PM | 2 (1.5%) | 5 (5.1%) |
| 4:00 PM to 11:59 PM | 5 (3.8%) | 2 (2.1%) |
| Total | 132 (100.0%) | 97 (100.0%) |
Housing Occupancy in Balaton
Occupancy by Ownership in Balaton
Of the total 242 dwellings in Balaton, owner-occupied units account for 178 (73.6%), while renter-occupied units make up 64 (26.5%).
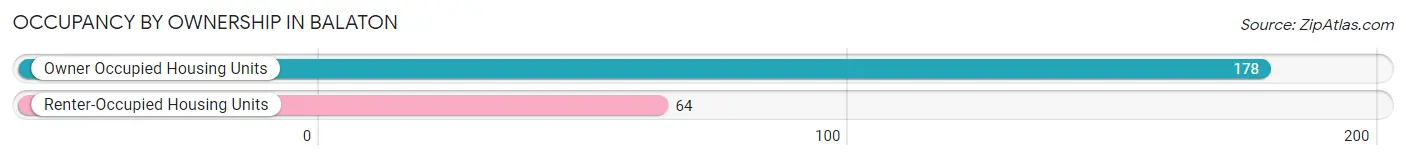
| Occupancy | # Housing Units | % Housing Units |
| Owner Occupied Housing Units | 178 | 73.6% |
| Renter-Occupied Housing Units | 64 | 26.5% |
| Total Occupied Housing Units | 242 | 100.0% |
Occupancy by Household Size in Balaton
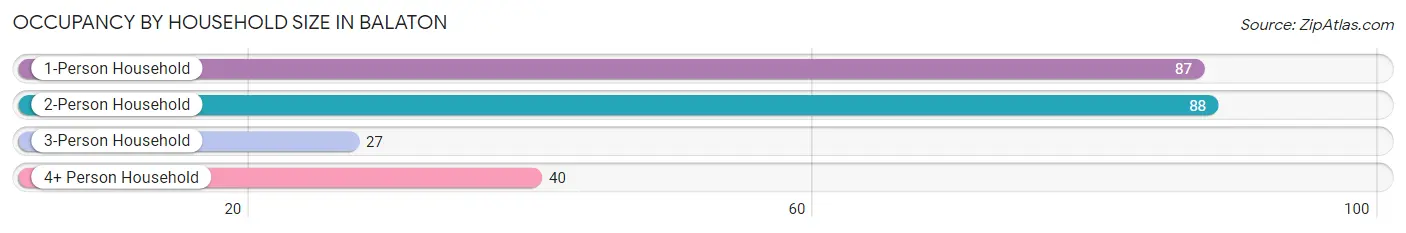
| Household Size | # Housing Units | % Housing Units |
| 1-Person Household | 87 | 35.9% |
| 2-Person Household | 88 | 36.4% |
| 3-Person Household | 27 | 11.2% |
| 4+ Person Household | 40 | 16.5% |
| Total Housing Units | 242 | 100.0% |
Occupancy by Ownership by Household Size in Balaton
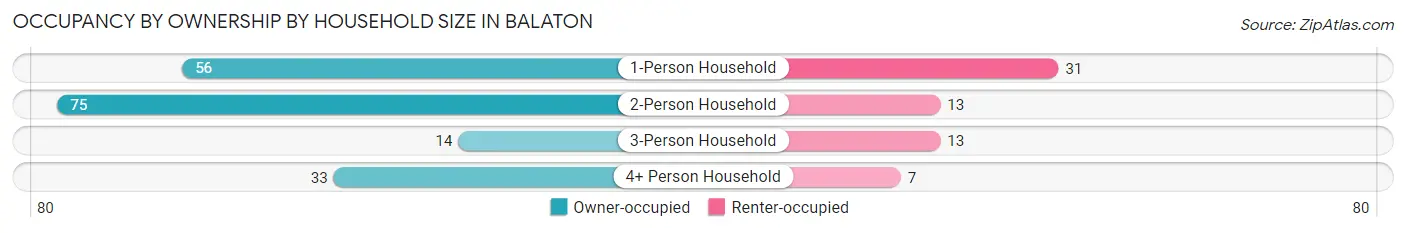
| Household Size | Owner-occupied | Renter-occupied |
| 1-Person Household | 56 (64.4%) | 31 (35.6%) |
| 2-Person Household | 75 (85.2%) | 13 (14.8%) |
| 3-Person Household | 14 (51.8%) | 13 (48.1%) |
| 4+ Person Household | 33 (82.5%) | 7 (17.5%) |
| Total Housing Units | 178 (73.6%) | 64 (26.5%) |
Occupancy by Educational Attainment in Balaton
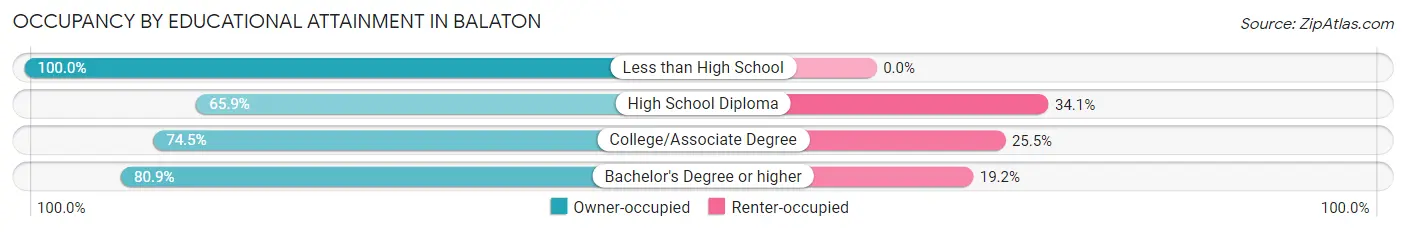
| Household Size | Owner-occupied | Renter-occupied |
| Less than High School | 10 (100.0%) | 0 (0.0%) |
| High School Diploma | 60 (65.9%) | 31 (34.1%) |
| College/Associate Degree | 70 (74.5%) | 24 (25.5%) |
| Bachelor's Degree or higher | 38 (80.8%) | 9 (19.2%) |
Occupancy by Age of Householder in Balaton
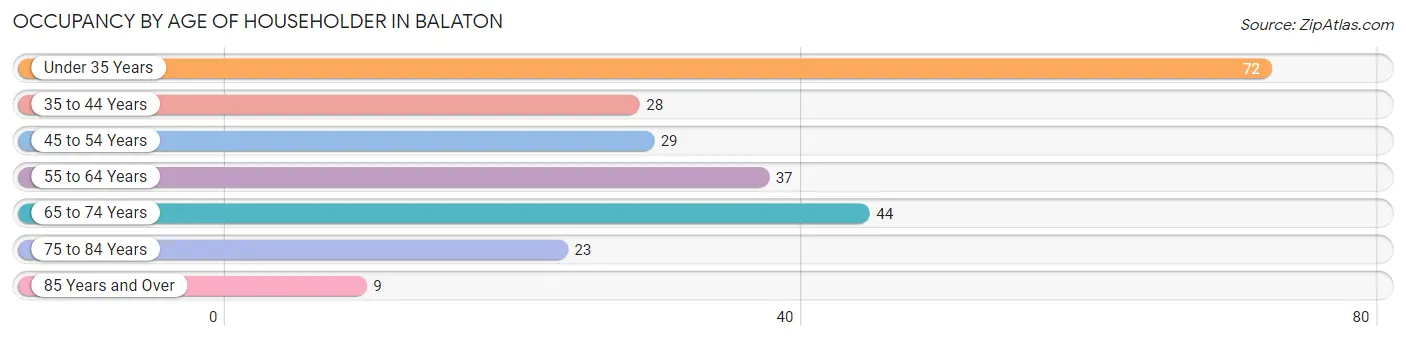
| Age Bracket | # Households | % Households |
| Under 35 Years | 72 | 29.7% |
| 35 to 44 Years | 28 | 11.6% |
| 45 to 54 Years | 29 | 12.0% |
| 55 to 64 Years | 37 | 15.3% |
| 65 to 74 Years | 44 | 18.2% |
| 75 to 84 Years | 23 | 9.5% |
| 85 Years and Over | 9 | 3.7% |
| Total | 242 | 100.0% |
Housing Finances in Balaton
Median Income by Occupancy in Balaton
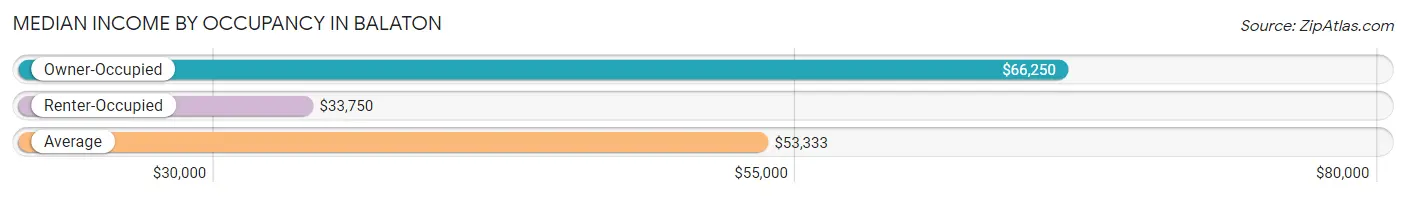
| Occupancy Type | # Households | Median Income |
| Owner-Occupied | 178 (73.6%) | $66,250 |
| Renter-Occupied | 64 (26.5%) | $33,750 |
| Average | 242 (100.0%) | $53,333 |
Occupancy by Householder Income Bracket in Balaton
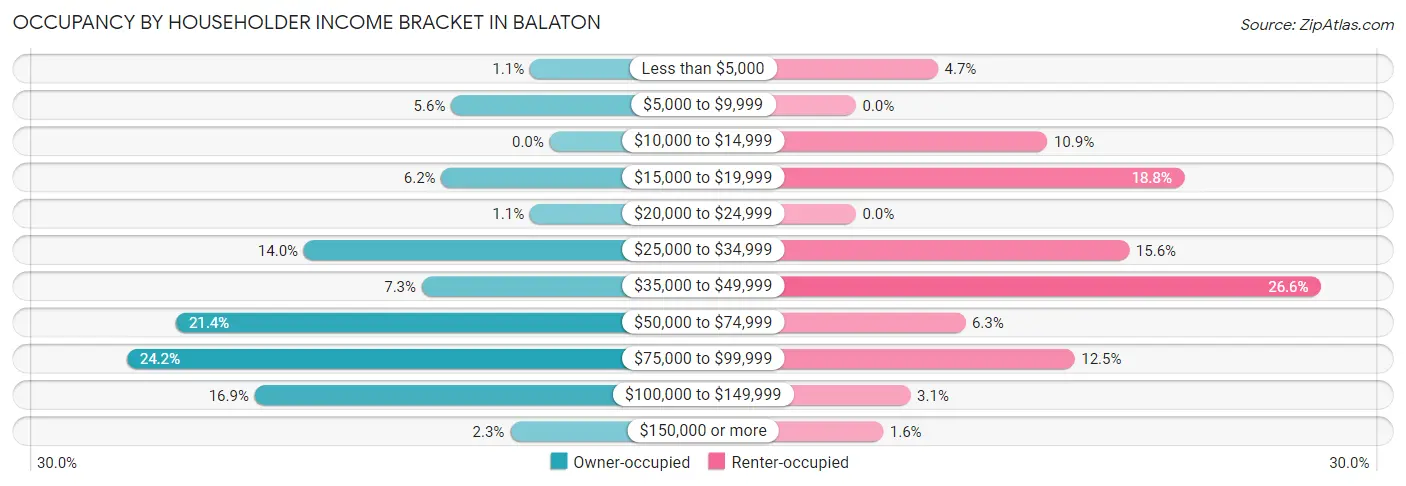
| Income Bracket | Owner-occupied | Renter-occupied |
| Less than $5,000 | 2 (1.1%) | 3 (4.7%) |
| $5,000 to $9,999 | 10 (5.6%) | 0 (0.0%) |
| $10,000 to $14,999 | 0 (0.0%) | 7 (10.9%) |
| $15,000 to $19,999 | 11 (6.2%) | 12 (18.8%) |
| $20,000 to $24,999 | 2 (1.1%) | 0 (0.0%) |
| $25,000 to $34,999 | 25 (14.0%) | 10 (15.6%) |
| $35,000 to $49,999 | 13 (7.3%) | 17 (26.6%) |
| $50,000 to $74,999 | 38 (21.3%) | 4 (6.2%) |
| $75,000 to $99,999 | 43 (24.2%) | 8 (12.5%) |
| $100,000 to $149,999 | 30 (16.9%) | 2 (3.1%) |
| $150,000 or more | 4 (2.2%) | 1 (1.6%) |
| Total | 178 (100.0%) | 64 (100.0%) |
Monthly Housing Cost Tiers in Balaton
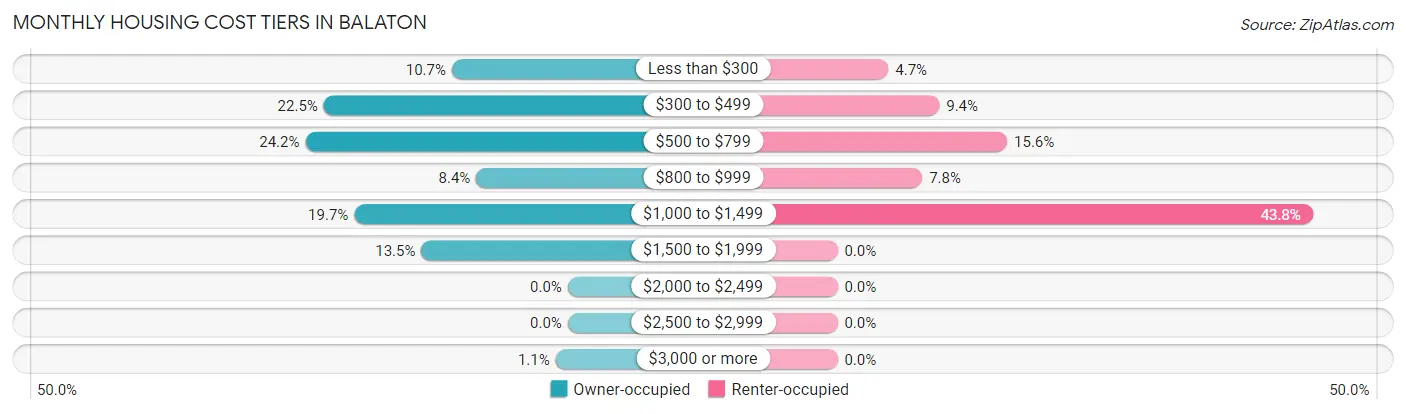
| Monthly Cost | Owner-occupied | Renter-occupied |
| Less than $300 | 19 (10.7%) | 3 (4.7%) |
| $300 to $499 | 40 (22.5%) | 6 (9.4%) |
| $500 to $799 | 43 (24.2%) | 10 (15.6%) |
| $800 to $999 | 15 (8.4%) | 5 (7.8%) |
| $1,000 to $1,499 | 35 (19.7%) | 28 (43.8%) |
| $1,500 to $1,999 | 24 (13.5%) | 0 (0.0%) |
| $2,000 to $2,499 | 0 (0.0%) | 0 (0.0%) |
| $2,500 to $2,999 | 0 (0.0%) | 0 (0.0%) |
| $3,000 or more | 2 (1.1%) | 0 (0.0%) |
| Total | 178 (100.0%) | 64 (100.0%) |
Physical Housing Characteristics in Balaton
Housing Structures in Balaton
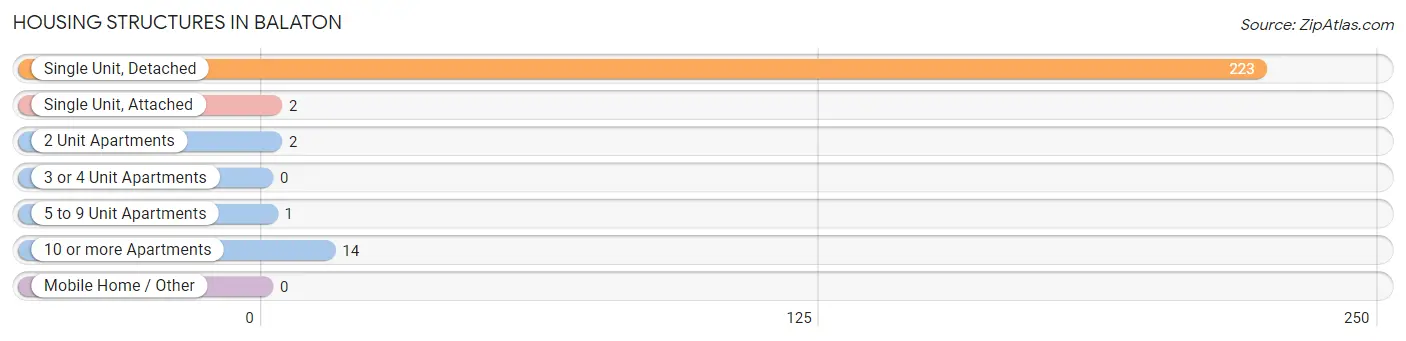
| Structure Type | # Housing Units | % Housing Units |
| Single Unit, Detached | 223 | 92.1% |
| Single Unit, Attached | 2 | 0.8% |
| 2 Unit Apartments | 2 | 0.8% |
| 3 or 4 Unit Apartments | 0 | 0.0% |
| 5 to 9 Unit Apartments | 1 | 0.4% |
| 10 or more Apartments | 14 | 5.8% |
| Mobile Home / Other | 0 | 0.0% |
| Total | 242 | 100.0% |
Housing Structures by Occupancy in Balaton
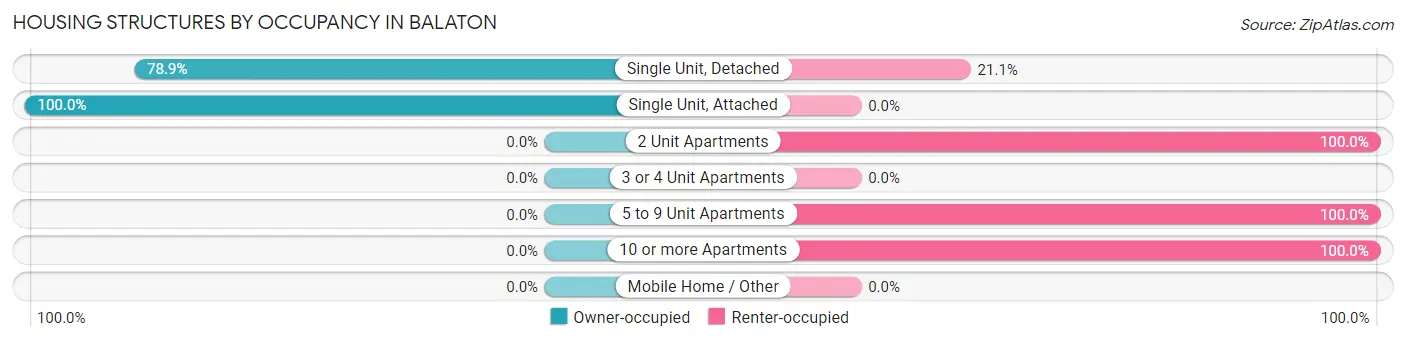
| Structure Type | Owner-occupied | Renter-occupied |
| Single Unit, Detached | 176 (78.9%) | 47 (21.1%) |
| Single Unit, Attached | 2 (100.0%) | 0 (0.0%) |
| 2 Unit Apartments | 0 (0.0%) | 2 (100.0%) |
| 3 or 4 Unit Apartments | 0 (0.0%) | 0 (0.0%) |
| 5 to 9 Unit Apartments | 0 (0.0%) | 1 (100.0%) |
| 10 or more Apartments | 0 (0.0%) | 14 (100.0%) |
| Mobile Home / Other | 0 (0.0%) | 0 (0.0%) |
| Total | 178 (73.6%) | 64 (26.5%) |
Housing Structures by Number of Rooms in Balaton
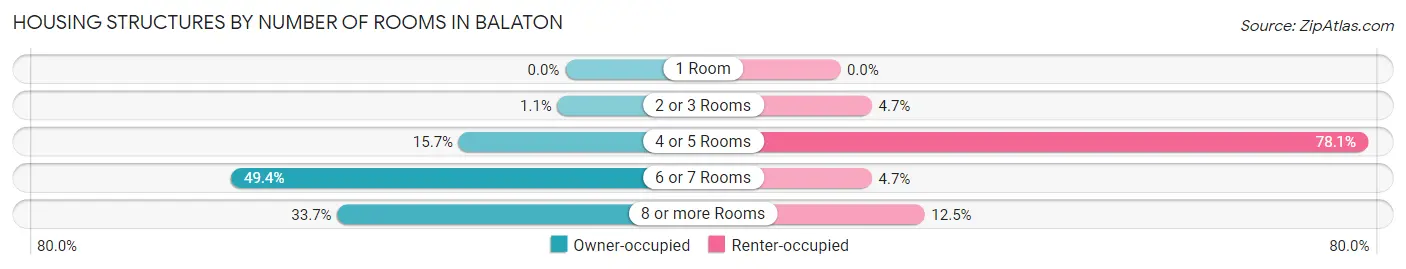
| Number of Rooms | Owner-occupied | Renter-occupied |
| 1 Room | 0 (0.0%) | 0 (0.0%) |
| 2 or 3 Rooms | 2 (1.1%) | 3 (4.7%) |
| 4 or 5 Rooms | 28 (15.7%) | 50 (78.1%) |
| 6 or 7 Rooms | 88 (49.4%) | 3 (4.7%) |
| 8 or more Rooms | 60 (33.7%) | 8 (12.5%) |
| Total | 178 (100.0%) | 64 (100.0%) |
Housing Structure by Heating Type in Balaton
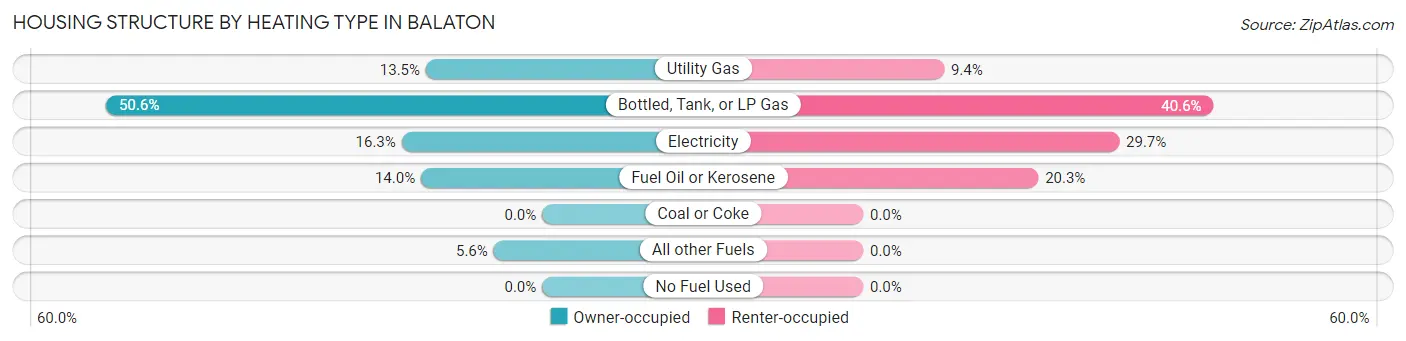
| Heating Type | Owner-occupied | Renter-occupied |
| Utility Gas | 24 (13.5%) | 6 (9.4%) |
| Bottled, Tank, or LP Gas | 90 (50.6%) | 26 (40.6%) |
| Electricity | 29 (16.3%) | 19 (29.7%) |
| Fuel Oil or Kerosene | 25 (14.0%) | 13 (20.3%) |
| Coal or Coke | 0 (0.0%) | 0 (0.0%) |
| All other Fuels | 10 (5.6%) | 0 (0.0%) |
| No Fuel Used | 0 (0.0%) | 0 (0.0%) |
| Total | 178 (100.0%) | 64 (100.0%) |
Household Vehicle Usage in Balaton
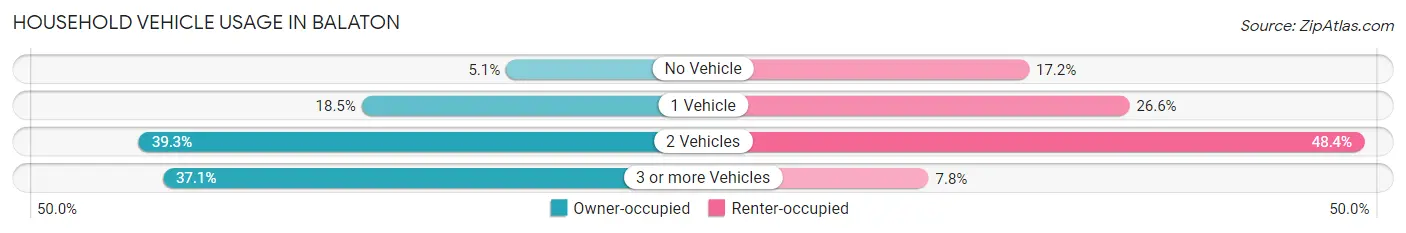
| Vehicles per Household | Owner-occupied | Renter-occupied |
| No Vehicle | 9 (5.1%) | 11 (17.2%) |
| 1 Vehicle | 33 (18.5%) | 17 (26.6%) |
| 2 Vehicles | 70 (39.3%) | 31 (48.4%) |
| 3 or more Vehicles | 66 (37.1%) | 5 (7.8%) |
| Total | 178 (100.0%) | 64 (100.0%) |
Real Estate & Mortgages in Balaton
Real Estate and Mortgage Overview in Balaton
| Characteristic | Without Mortgage | With Mortgage |
| Housing Units | 89 | 89 |
| Median Property Value | $71,700 | $88,300 |
| Median Household Income | $50,750 | $2 |
| Monthly Housing Costs | $453 | $2 |
| Real Estate Taxes | $860 | $2 |
Property Value by Mortgage Status in Balaton
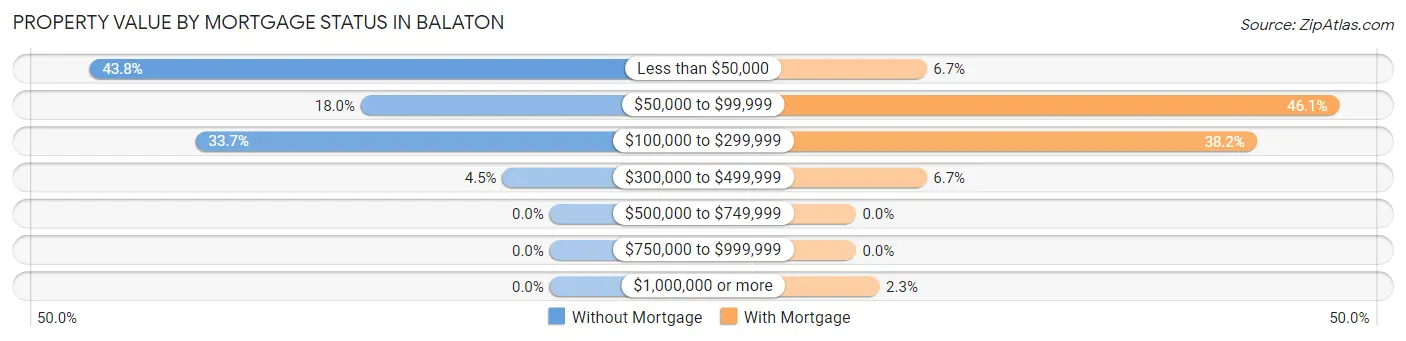
| Property Value | Without Mortgage | With Mortgage |
| Less than $50,000 | 39 (43.8%) | 6 (6.7%) |
| $50,000 to $99,999 | 16 (18.0%) | 41 (46.1%) |
| $100,000 to $299,999 | 30 (33.7%) | 34 (38.2%) |
| $300,000 to $499,999 | 4 (4.5%) | 6 (6.7%) |
| $500,000 to $749,999 | 0 (0.0%) | 0 (0.0%) |
| $750,000 to $999,999 | 0 (0.0%) | 0 (0.0%) |
| $1,000,000 or more | 0 (0.0%) | 2 (2.2%) |
| Total | 89 (100.0%) | 89 (100.0%) |
Household Income by Mortgage Status in Balaton
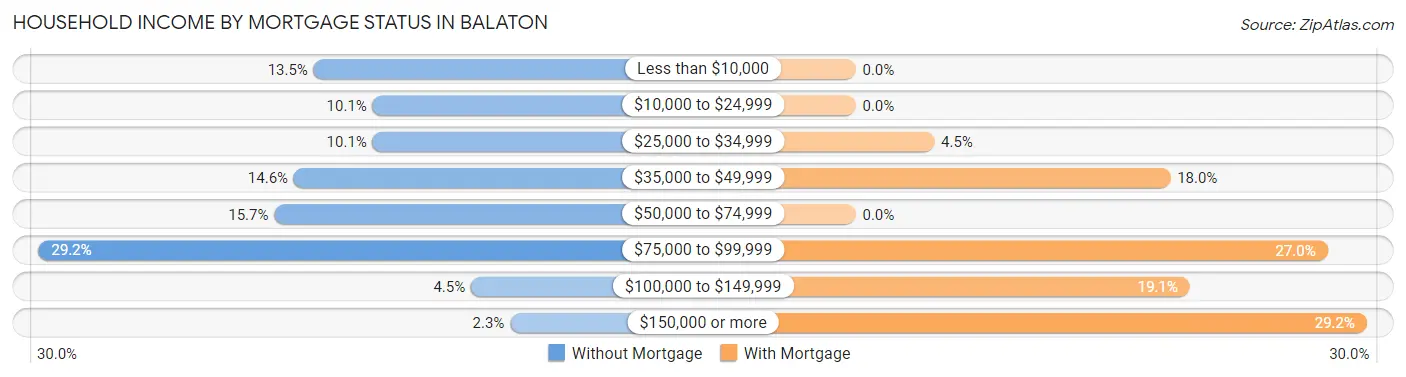
| Household Income | Without Mortgage | With Mortgage |
| Less than $10,000 | 12 (13.5%) | 0 (0.0%) |
| $10,000 to $24,999 | 9 (10.1%) | 0 (0.0%) |
| $25,000 to $34,999 | 9 (10.1%) | 4 (4.5%) |
| $35,000 to $49,999 | 13 (14.6%) | 16 (18.0%) |
| $50,000 to $74,999 | 14 (15.7%) | 0 (0.0%) |
| $75,000 to $99,999 | 26 (29.2%) | 24 (27.0%) |
| $100,000 to $149,999 | 4 (4.5%) | 17 (19.1%) |
| $150,000 or more | 2 (2.2%) | 26 (29.2%) |
| Total | 89 (100.0%) | 89 (100.0%) |
Property Value to Household Income Ratio in Balaton
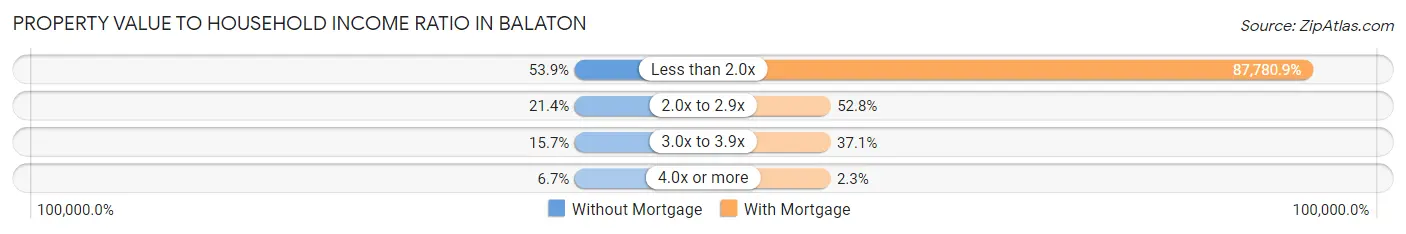
| Value-to-Income Ratio | Without Mortgage | With Mortgage |
| Less than 2.0x | 48 (53.9%) | 78,125 (87,780.9%) |
| 2.0x to 2.9x | 19 (21.3%) | 47 (52.8%) |
| 3.0x to 3.9x | 14 (15.7%) | 33 (37.1%) |
| 4.0x or more | 6 (6.7%) | 2 (2.2%) |
| Total | 89 (100.0%) | 89 (100.0%) |
Real Estate Taxes by Mortgage Status in Balaton
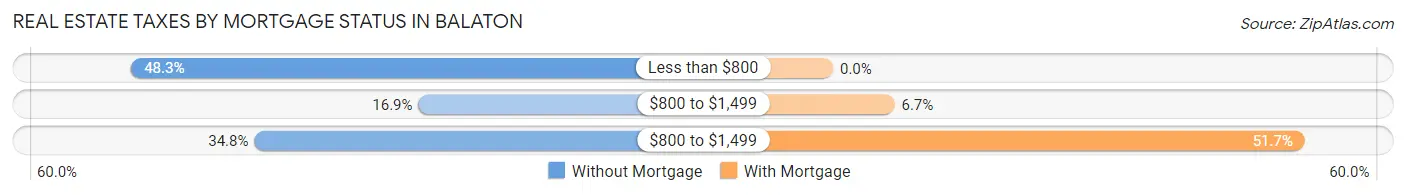
| Property Taxes | Without Mortgage | With Mortgage |
| Less than $800 | 43 (48.3%) | 0 (0.0%) |
| $800 to $1,499 | 15 (16.9%) | 6 (6.7%) |
| $800 to $1,499 | 31 (34.8%) | 46 (51.7%) |
| Total | 89 (100.0%) | 89 (100.0%) |
Health & Disability in Balaton
Health Insurance Coverage by Age in Balaton
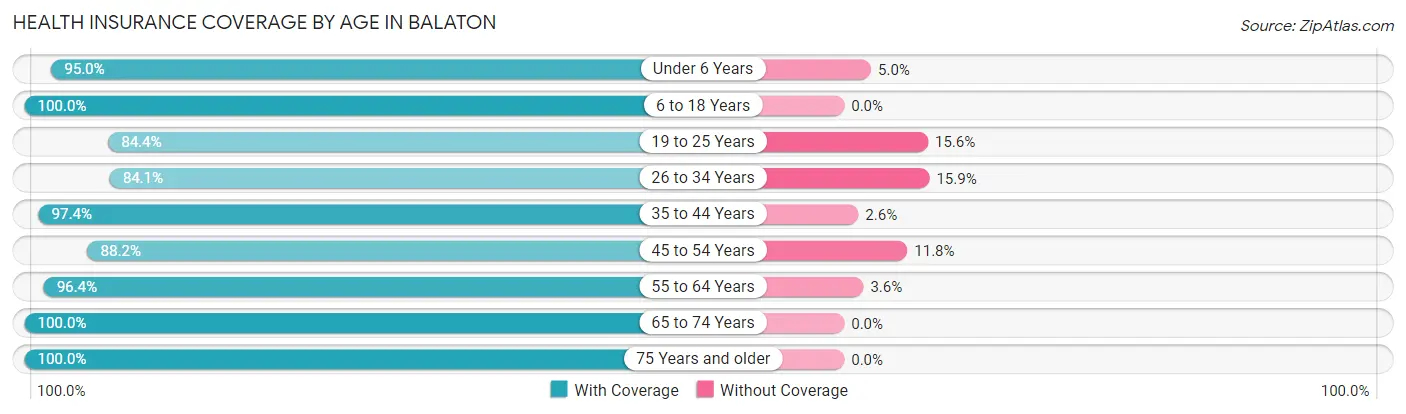
| Age Bracket | With Coverage | Without Coverage |
| Under 6 Years | 57 (95.0%) | 3 (5.0%) |
| 6 to 18 Years | 61 (100.0%) | 0 (0.0%) |
| 19 to 25 Years | 27 (84.4%) | 5 (15.6%) |
| 26 to 34 Years | 90 (84.1%) | 17 (15.9%) |
| 35 to 44 Years | 37 (97.4%) | 1 (2.6%) |
| 45 to 54 Years | 45 (88.2%) | 6 (11.8%) |
| 55 to 64 Years | 54 (96.4%) | 2 (3.6%) |
| 65 to 74 Years | 65 (100.0%) | 0 (0.0%) |
| 75 Years and older | 47 (100.0%) | 0 (0.0%) |
| Total | 483 (93.4%) | 34 (6.6%) |
Health Insurance Coverage by Citizenship Status in Balaton
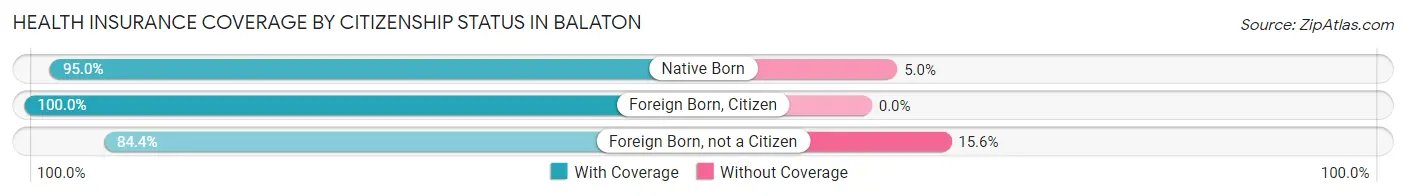
| Citizenship Status | With Coverage | Without Coverage |
| Native Born | 57 (95.0%) | 3 (5.0%) |
| Foreign Born, Citizen | 61 (100.0%) | 0 (0.0%) |
| Foreign Born, not a Citizen | 27 (84.4%) | 5 (15.6%) |
Health Insurance Coverage by Household Income in Balaton
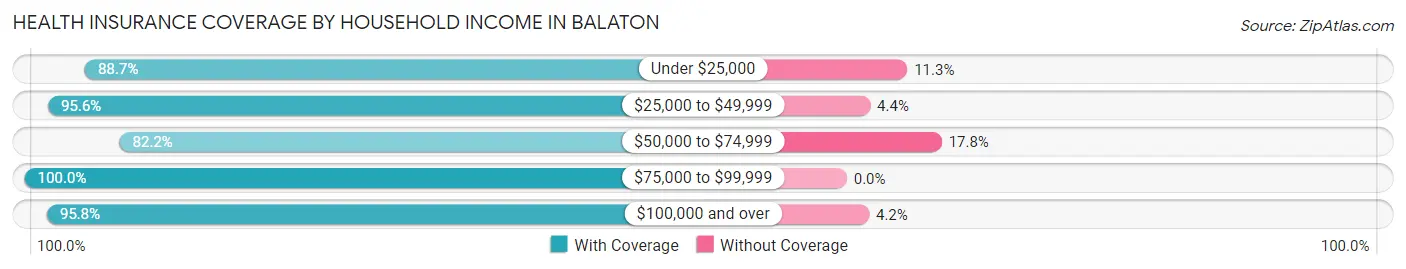
| Household Income | With Coverage | Without Coverage |
| Under $25,000 | 47 (88.7%) | 6 (11.3%) |
| $25,000 to $49,999 | 153 (95.6%) | 7 (4.4%) |
| $50,000 to $74,999 | 74 (82.2%) | 16 (17.8%) |
| $75,000 to $99,999 | 94 (100.0%) | 0 (0.0%) |
| $100,000 and over | 115 (95.8%) | 5 (4.2%) |
Public vs Private Health Insurance Coverage by Age in Balaton
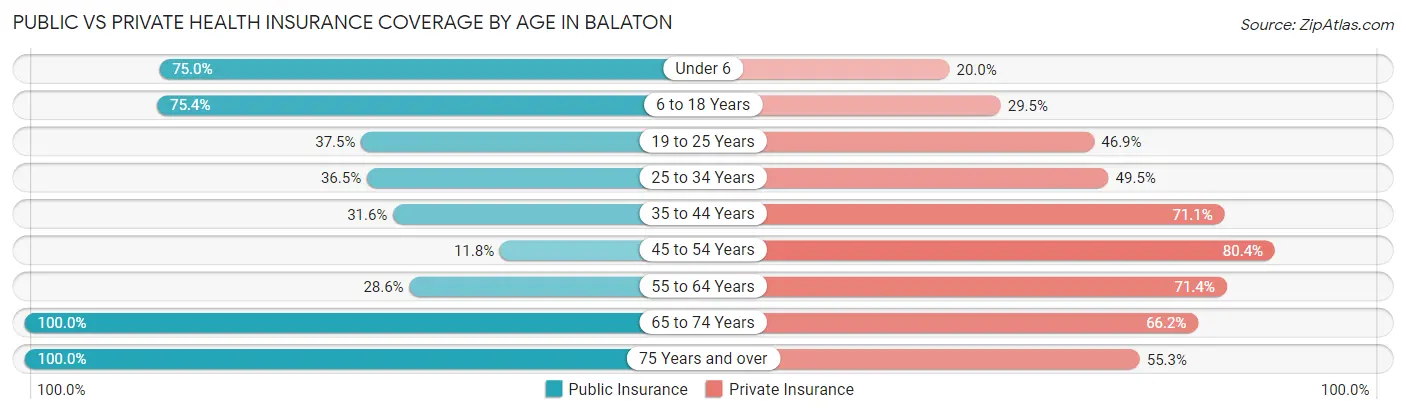
| Age Bracket | Public Insurance | Private Insurance |
| Under 6 | 45 (75.0%) | 12 (20.0%) |
| 6 to 18 Years | 46 (75.4%) | 18 (29.5%) |
| 19 to 25 Years | 12 (37.5%) | 15 (46.9%) |
| 25 to 34 Years | 39 (36.4%) | 53 (49.5%) |
| 35 to 44 Years | 12 (31.6%) | 27 (71.1%) |
| 45 to 54 Years | 6 (11.8%) | 41 (80.4%) |
| 55 to 64 Years | 16 (28.6%) | 40 (71.4%) |
| 65 to 74 Years | 65 (100.0%) | 43 (66.1%) |
| 75 Years and over | 47 (100.0%) | 26 (55.3%) |
| Total | 288 (55.7%) | 275 (53.2%) |
Disability Status by Sex by Age in Balaton
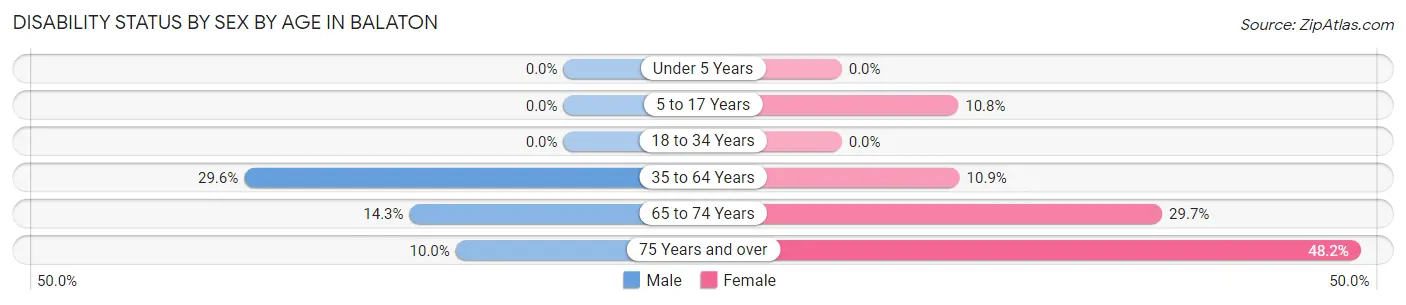
| Age Bracket | Male | Female |
| Under 5 Years | 0 (0.0%) | 0 (0.0%) |
| 5 to 17 Years | 0 (0.0%) | 4 (10.8%) |
| 18 to 34 Years | 0 (0.0%) | 0 (0.0%) |
| 35 to 64 Years | 24 (29.6%) | 7 (10.9%) |
| 65 to 74 Years | 4 (14.3%) | 11 (29.7%) |
| 75 Years and over | 2 (10.0%) | 13 (48.1%) |
Disability Class by Sex by Age in Balaton
Disability Class: Hearing Difficulty
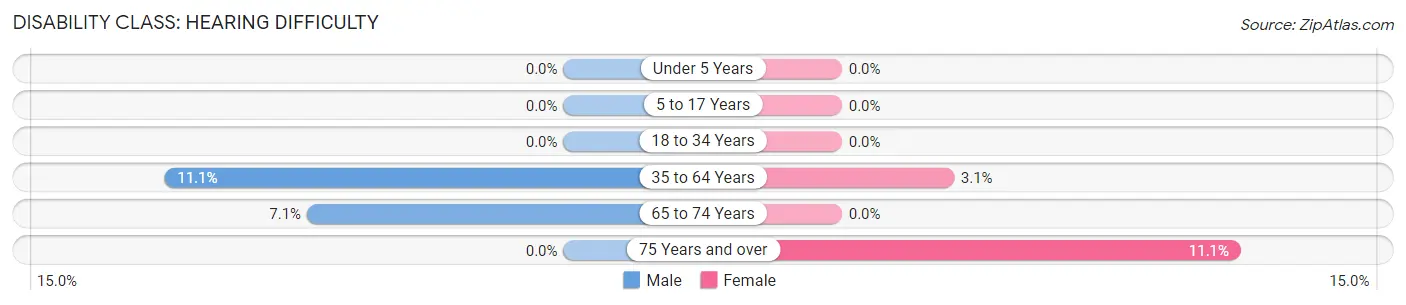
| Age Bracket | Male | Female |
| Under 5 Years | 0 (0.0%) | 0 (0.0%) |
| 5 to 17 Years | 0 (0.0%) | 0 (0.0%) |
| 18 to 34 Years | 0 (0.0%) | 0 (0.0%) |
| 35 to 64 Years | 9 (11.1%) | 2 (3.1%) |
| 65 to 74 Years | 2 (7.1%) | 0 (0.0%) |
| 75 Years and over | 0 (0.0%) | 3 (11.1%) |
Disability Class: Vision Difficulty
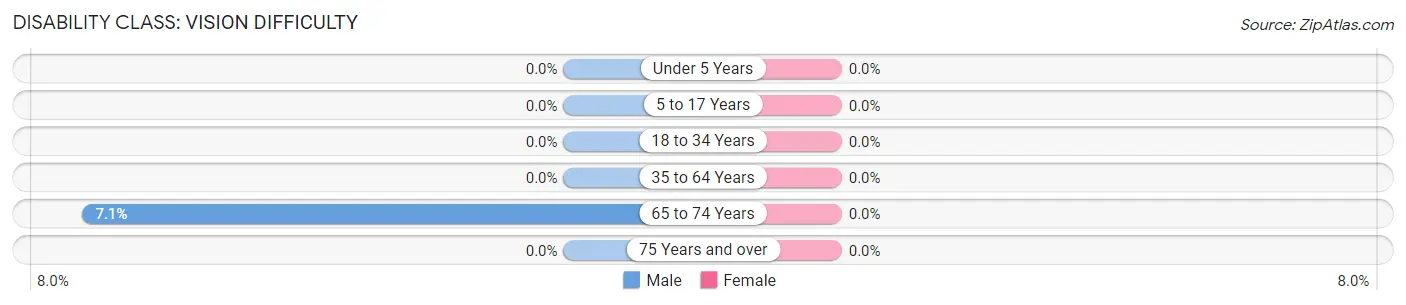
| Age Bracket | Male | Female |
| Under 5 Years | 0 (0.0%) | 0 (0.0%) |
| 5 to 17 Years | 0 (0.0%) | 0 (0.0%) |
| 18 to 34 Years | 0 (0.0%) | 0 (0.0%) |
| 35 to 64 Years | 0 (0.0%) | 0 (0.0%) |
| 65 to 74 Years | 2 (7.1%) | 0 (0.0%) |
| 75 Years and over | 0 (0.0%) | 0 (0.0%) |
Disability Class: Cognitive Difficulty
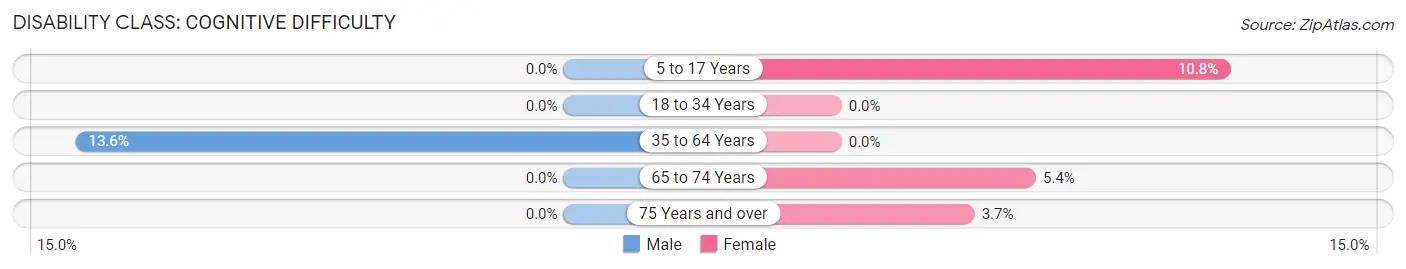
| Age Bracket | Male | Female |
| 5 to 17 Years | 0 (0.0%) | 4 (10.8%) |
| 18 to 34 Years | 0 (0.0%) | 0 (0.0%) |
| 35 to 64 Years | 11 (13.6%) | 0 (0.0%) |
| 65 to 74 Years | 0 (0.0%) | 2 (5.4%) |
| 75 Years and over | 0 (0.0%) | 1 (3.7%) |
Disability Class: Ambulatory Difficulty
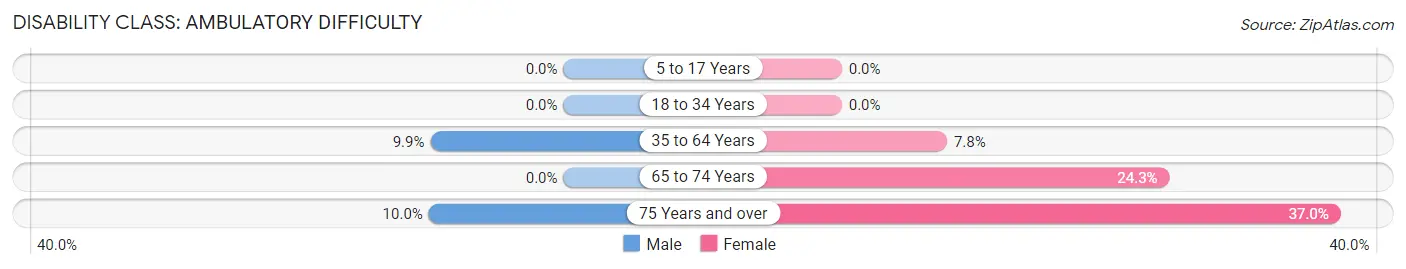
| Age Bracket | Male | Female |
| 5 to 17 Years | 0 (0.0%) | 0 (0.0%) |
| 18 to 34 Years | 0 (0.0%) | 0 (0.0%) |
| 35 to 64 Years | 8 (9.9%) | 5 (7.8%) |
| 65 to 74 Years | 0 (0.0%) | 9 (24.3%) |
| 75 Years and over | 2 (10.0%) | 10 (37.0%) |
Disability Class: Self-Care Difficulty
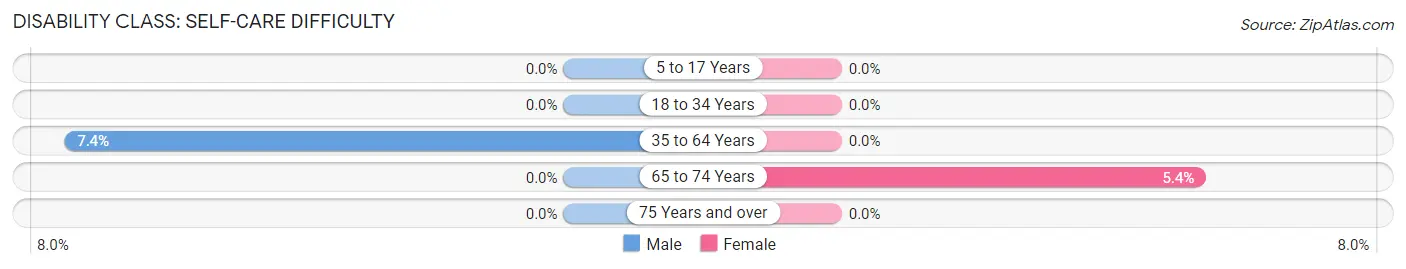
| Age Bracket | Male | Female |
| 5 to 17 Years | 0 (0.0%) | 0 (0.0%) |
| 18 to 34 Years | 0 (0.0%) | 0 (0.0%) |
| 35 to 64 Years | 6 (7.4%) | 0 (0.0%) |
| 65 to 74 Years | 0 (0.0%) | 2 (5.4%) |
| 75 Years and over | 0 (0.0%) | 0 (0.0%) |
Technology Access in Balaton
Computing Device Access in Balaton
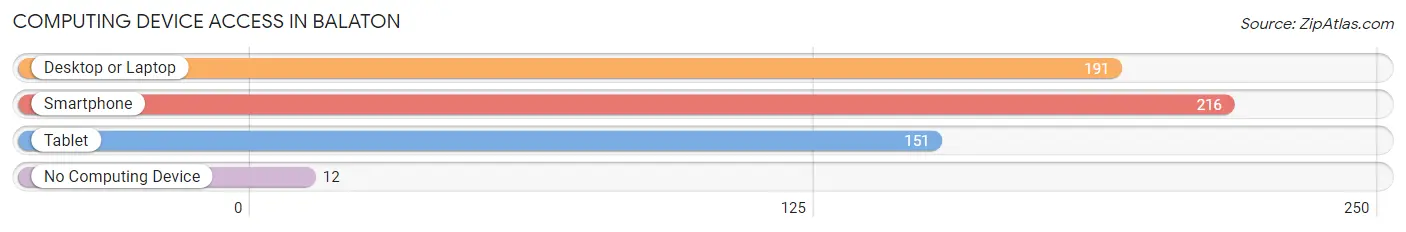
| Device Type | # Households | % Households |
| Desktop or Laptop | 191 | 78.9% |
| Smartphone | 216 | 89.3% |
| Tablet | 151 | 62.4% |
| No Computing Device | 12 | 5.0% |
| Total | 242 | 100.0% |
Internet Access in Balaton
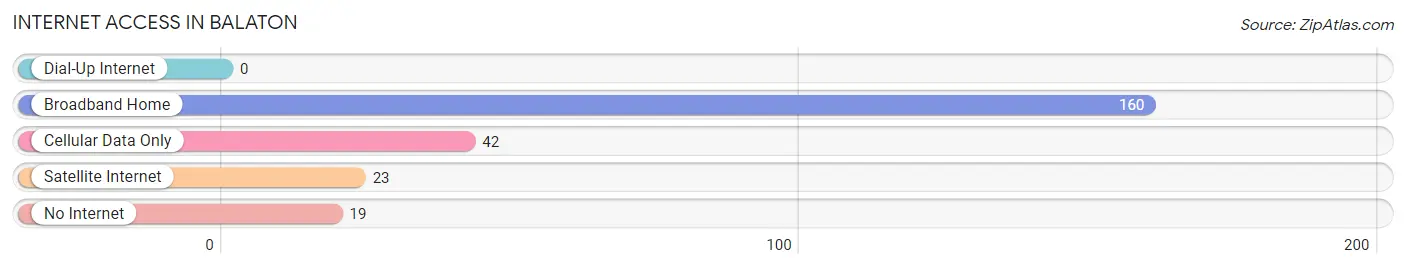
| Internet Type | # Households | % Households |
| Dial-Up Internet | 0 | 0.0% |
| Broadband Home | 160 | 66.1% |
| Cellular Data Only | 42 | 17.4% |
| Satellite Internet | 23 | 9.5% |
| No Internet | 19 | 7.9% |
| Total | 242 | 100.0% |
Balaton Summary
Lake Balaton is a freshwater lake located in western Hungary. It is the largest lake in Central Europe and the second largest in Europe. It is also the deepest lake in Hungary. The lake is located in the Transdanubian region of Hungary, and is bordered by the counties of Veszprém, Somogy, Zala, and Fejér.
Geography
Lake Balaton is located in the Transdanubian region of Hungary, and is bordered by the counties of Veszprém, Somogy, Zala, and Fejér. The lake is approximately 77 km long and 14 km wide, with a surface area of 592 km2. The lake is fed by several rivers, including the Zala, Sió, and Sárvíz. The lake has an average depth of 3.2 m, and a maximum depth of 12.2 m. The lake is surrounded by hills and mountains, and is located in a region of volcanic activity.
History
The area around Lake Balaton has been inhabited since the Neolithic period. The lake was first mentioned in written records in the 10th century, when it was referred to as the “Sea of Balaton”. During the Middle Ages, the lake was an important trading route between Hungary and the Mediterranean. In the 19th century, the lake became a popular tourist destination, and the first steamboat was launched in 1866. In the 20th century, the lake was used for military purposes, and the surrounding area was heavily industrialized.
Economy
Lake Balaton is an important economic resource for Hungary. The lake is a major tourist destination, and the surrounding area is home to numerous resorts, hotels, and restaurants. The lake is also an important source of fish, and is home to a variety of species, including carp, pike, and perch. The lake is also used for recreational activities, such as swimming, sailing, and windsurfing.
Demographics
The population of the Lake Balaton region is approximately 1.2 million. The majority of the population is Hungarian, with a small minority of Roma and German-speaking people. The region is predominantly rural, with a few larger towns and cities, such as Siófok, Balatonfüred, and Keszthely.
Conclusion
Lake Balaton is an important economic and cultural resource for Hungary. The lake is a major tourist destination, and is home to a variety of fish species. The surrounding area is predominantly rural, with a few larger towns and cities. The population of the region is predominantly Hungarian, with a small minority of Roma and German-speaking people.
Common Questions
What is Per Capita Income in Balaton?
Per Capita income in Balaton is $26,943.
What is the Median Family Income in Balaton?
Median Family Income in Balaton is $75,625.
What is the Median Household income in Balaton?
Median Household Income in Balaton is $53,333.
What is Income or Wage Gap in Balaton?
Income or Wage Gap in Balaton is 11.3%.
Women in Balaton earn 88.7 cents for every dollar earned by a man.
What is Inequality or Gini Index in Balaton?
Inequality or Gini Index in Balaton is 0.37.
What is the Total Population of Balaton?
Total Population of Balaton is 548.
What is the Total Male Population of Balaton?
Total Male Population of Balaton is 296.
What is the Total Female Population of Balaton?
Total Female Population of Balaton is 252.
What is the Ratio of Males per 100 Females in Balaton?
There are 117.46 Males per 100 Females in Balaton.
What is the Ratio of Females per 100 Males in Balaton?
There are 85.14 Females per 100 Males in Balaton.
What is the Median Population Age in Balaton?
Median Population Age in Balaton is 39.1 Years.
What is the Average Family Size in Balaton
Average Family Size in Balaton is 2.6 People.
What is the Average Household Size in Balaton
Average Household Size in Balaton is 2.1 People.
How Large is the Labor Force in Balaton?
There are 273 People in the Labor Forcein in Balaton.
What is the Percentage of People in the Labor Force in Balaton?
62.9% of People are in the Labor Force in Balaton.
What is the Unemployment Rate in Balaton?
Unemployment Rate in Balaton is 7.7%.