Avon, MN Map & Demographics
Avon Map
Avon Overview
$42,306
PER CAPITA INCOME
$92,143
AVG FAMILY INCOME
$87,961
AVG HOUSEHOLD INCOME
25.7%
WAGE / INCOME GAP [ % ]
74.3¢/ $1
WAGE / INCOME GAP [ $ ]
0.37
INEQUALITY / GINI INDEX
1,410
TOTAL POPULATION
694
MALE POPULATION
716
FEMALE POPULATION
96.93
MALES / 100 FEMALES
103.17
FEMALES / 100 MALES
37.5
MEDIAN AGE
2.9
AVG FAMILY SIZE
2.5
AVG HOUSEHOLD SIZE
816
LABOR FORCE [ PEOPLE ]
71.0%
PERCENT IN LABOR FORCE
2.7%
UNEMPLOYMENT RATE
Avon Zip Codes
Avon Area Codes
Income in Avon
Income Overview in Avon
Per Capita Income in Avon is $42,306, while median incomes of families and households are $92,143 and $87,961 respectively.
| Characteristic | Number | Measure |
| Per Capita Income | 1,410 | $42,306 |
| Median Family Income | 362 | $92,143 |
| Mean Family Income | 362 | $112,802 |
| Median Household Income | 573 | $87,961 |
| Mean Household Income | 573 | $101,518 |
| Income Deficit | 362 | $0 |
| Wage / Income Gap (%) | 1,410 | 25.71% |
| Wage / Income Gap ($) | 1,410 | 74.29¢ per $1 |
| Gini / Inequality Index | 1,410 | 0.37 |
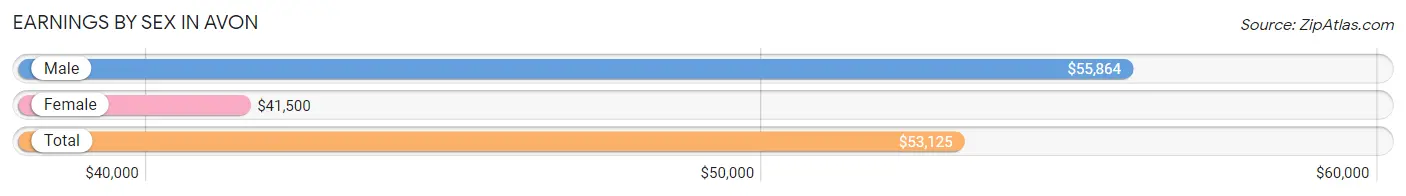
Earnings by Sex in Avon
Average Earnings in Avon are $53,125, $55,864 for men and $41,500 for women, a difference of 25.7%.
| Sex | Number | Average Earnings |
| Male | 484 (53.9%) | $55,864 |
| Female | 414 (46.1%) | $41,500 |
| Total | 898 (100.0%) | $53,125 |
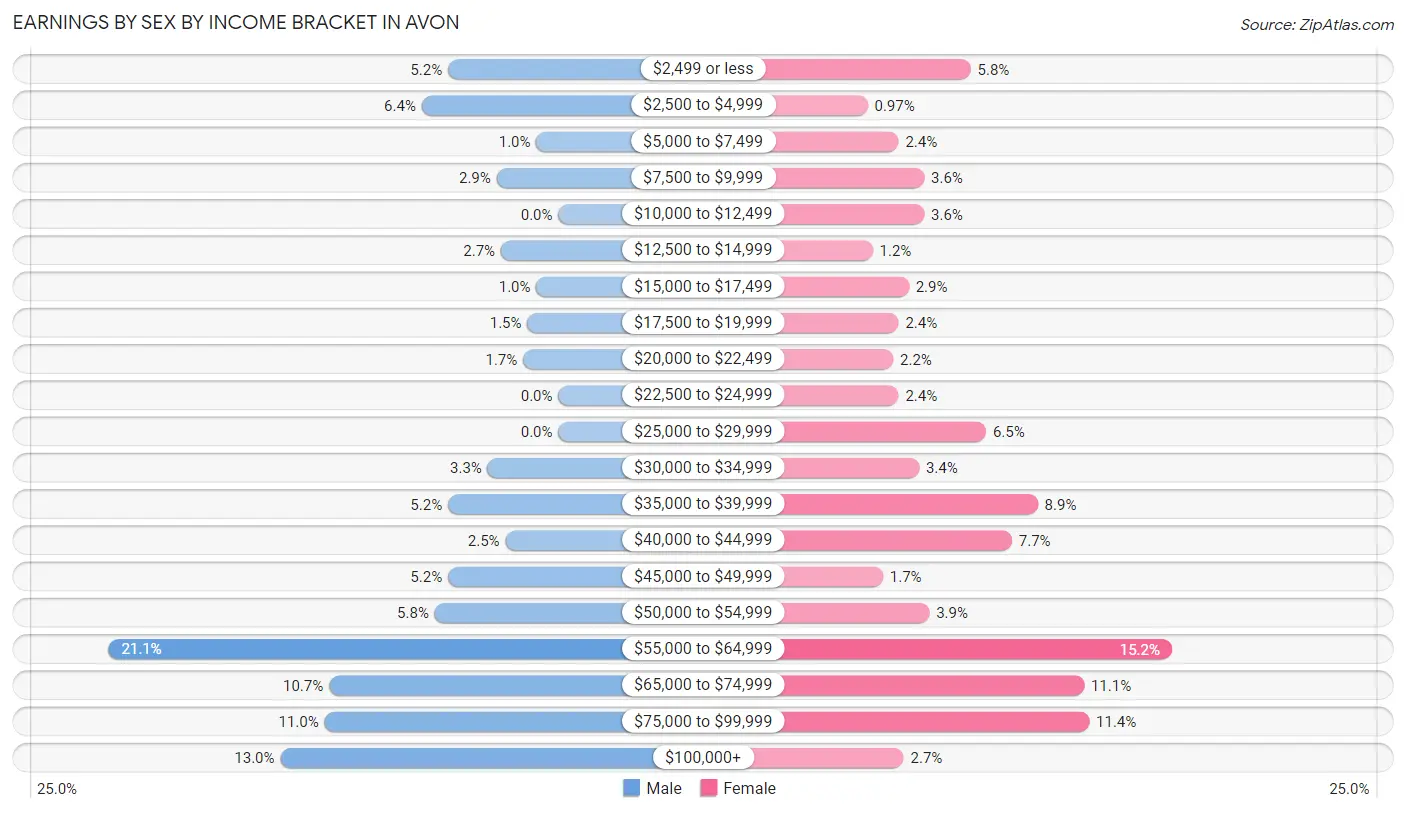
Earnings by Sex by Income Bracket in Avon
The most common earnings brackets in Avon are $55,000 to $64,999 for men (102 | 21.1%) and $55,000 to $64,999 for women (63 | 15.2%).
| Income | Male | Female |
| $2,499 or less | 25 (5.2%) | 24 (5.8%) |
| $2,500 to $4,999 | 31 (6.4%) | 4 (1.0%) |
| $5,000 to $7,499 | 5 (1.0%) | 10 (2.4%) |
| $7,500 to $9,999 | 14 (2.9%) | 15 (3.6%) |
| $10,000 to $12,499 | 0 (0.0%) | 15 (3.6%) |
| $12,500 to $14,999 | 13 (2.7%) | 5 (1.2%) |
| $15,000 to $17,499 | 5 (1.0%) | 12 (2.9%) |
| $17,500 to $19,999 | 7 (1.5%) | 10 (2.4%) |
| $20,000 to $22,499 | 8 (1.7%) | 9 (2.2%) |
| $22,500 to $24,999 | 0 (0.0%) | 10 (2.4%) |
| $25,000 to $29,999 | 0 (0.0%) | 27 (6.5%) |
| $30,000 to $34,999 | 16 (3.3%) | 14 (3.4%) |
| $35,000 to $39,999 | 25 (5.2%) | 37 (8.9%) |
| $40,000 to $44,999 | 12 (2.5%) | 32 (7.7%) |
| $45,000 to $49,999 | 25 (5.2%) | 7 (1.7%) |
| $50,000 to $54,999 | 28 (5.8%) | 16 (3.9%) |
| $55,000 to $64,999 | 102 (21.1%) | 63 (15.2%) |
| $65,000 to $74,999 | 52 (10.7%) | 46 (11.1%) |
| $75,000 to $99,999 | 53 (11.0%) | 47 (11.4%) |
| $100,000+ | 63 (13.0%) | 11 (2.7%) |
| Total | 484 (100.0%) | 414 (100.0%) |
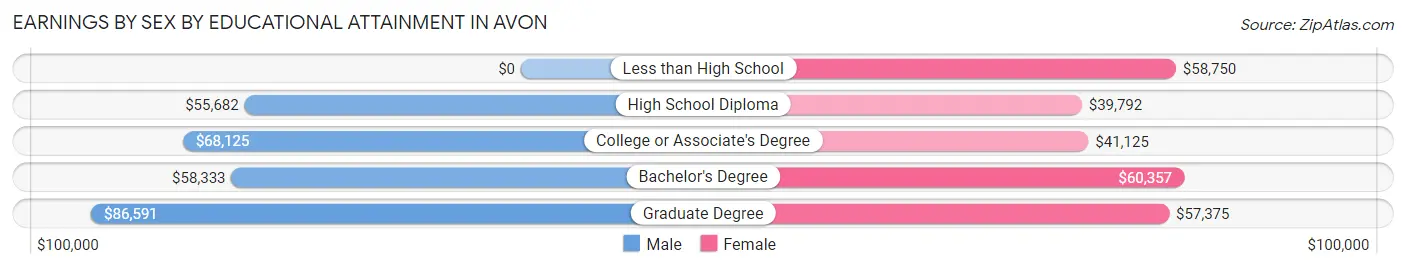
Earnings by Sex by Educational Attainment in Avon
Average earnings in Avon are $58,646 for men and $50,208 for women, a difference of 14.4%. Men with an educational attainment of graduate degree enjoy the highest average annual earnings of $86,591, while those with high school diploma education earn the least with $55,682. Women with an educational attainment of bachelor's degree earn the most with the average annual earnings of $60,357, while those with high school diploma education have the smallest earnings of $39,792.
| Educational Attainment | Male Income | Female Income |
| Less than High School | - | - |
| High School Diploma | $55,682 | $39,792 |
| College or Associate's Degree | $68,125 | $41,125 |
| Bachelor's Degree | $58,333 | $60,357 |
| Graduate Degree | $86,591 | $57,375 |
| Total | $58,646 | $50,208 |
Family Income in Avon
Family Income Brackets in Avon
According to the Avon family income data, there are 99 families falling into the $100,000 to $149,999 income range, which is the most common income bracket and makes up 27.4% of all families. Conversely, the $15,000 to $24,999 income bracket is the least frequent group with only 2 families (0.5%) belonging to this category.
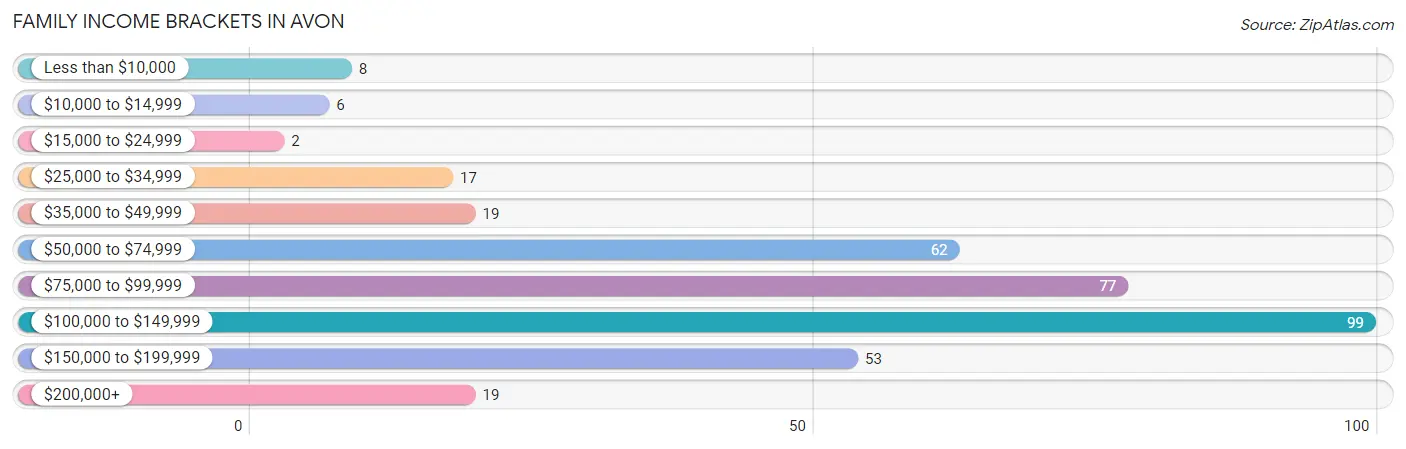
| Income Bracket | # Families | % Families |
| Less than $10,000 | 8 | 2.2% |
| $10,000 to $14,999 | 6 | 1.7% |
| $15,000 to $24,999 | 2 | 0.6% |
| $25,000 to $34,999 | 17 | 4.7% |
| $35,000 to $49,999 | 19 | 5.2% |
| $50,000 to $74,999 | 62 | 17.1% |
| $75,000 to $99,999 | 77 | 21.3% |
| $100,000 to $149,999 | 99 | 27.3% |
| $150,000 to $199,999 | 53 | 14.6% |
| $200,000+ | 19 | 5.2% |
Family Income by Famaliy Size in Avon
3-person families (49 | 13.5%) account for the highest median family income in Avon with $136,042 per family, while 3-person families (49 | 13.5%) have the highest median income of $45,347 per family member.
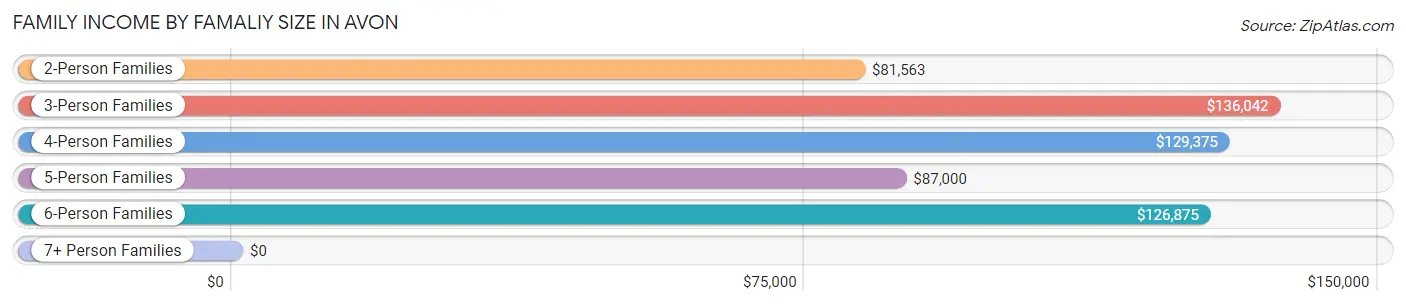
| Income Bracket | # Families | Median Income |
| 2-Person Families | 209 (57.7%) | $81,563 |
| 3-Person Families | 49 (13.5%) | $136,042 |
| 4-Person Families | 69 (19.1%) | $129,375 |
| 5-Person Families | 26 (7.2%) | $87,000 |
| 6-Person Families | 6 (1.7%) | $126,875 |
| 7+ Person Families | 3 (0.8%) | $0 |
| Total | 362 (100.0%) | $92,143 |
Family Income by Number of Earners in Avon
The median family income in Avon is $92,143, with families comprising 3+ earners (50) having the highest median family income of $195,333, while families with no earners (53) have the lowest median family income of $71,042, accounting for 13.8% and 14.6% of families, respectively.
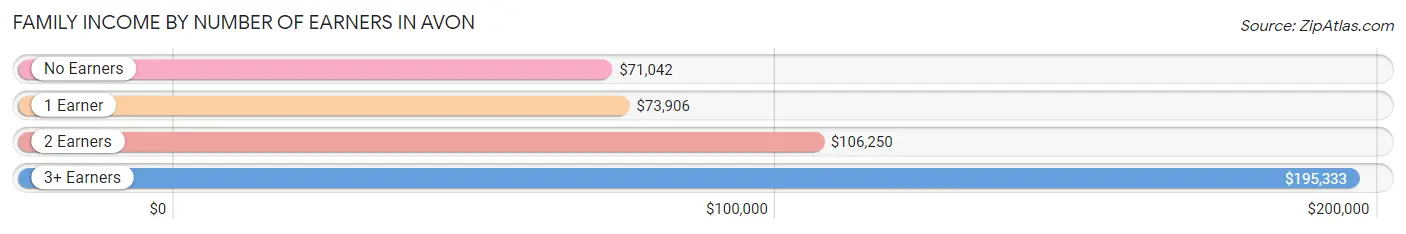
| Number of Earners | # Families | Median Income |
| No Earners | 53 (14.6%) | $71,042 |
| 1 Earner | 93 (25.7%) | $73,906 |
| 2 Earners | 166 (45.9%) | $106,250 |
| 3+ Earners | 50 (13.8%) | $195,333 |
| Total | 362 (100.0%) | $92,143 |
Household Income in Avon
Household Income Brackets in Avon
With 121 households falling in the category, the $75,000 to $99,999 income range is the most frequent in Avon, accounting for 21.1% of all households. In contrast, only 17 households (3.0%) fall into the less than $10,000 income bracket, making it the least populous group.
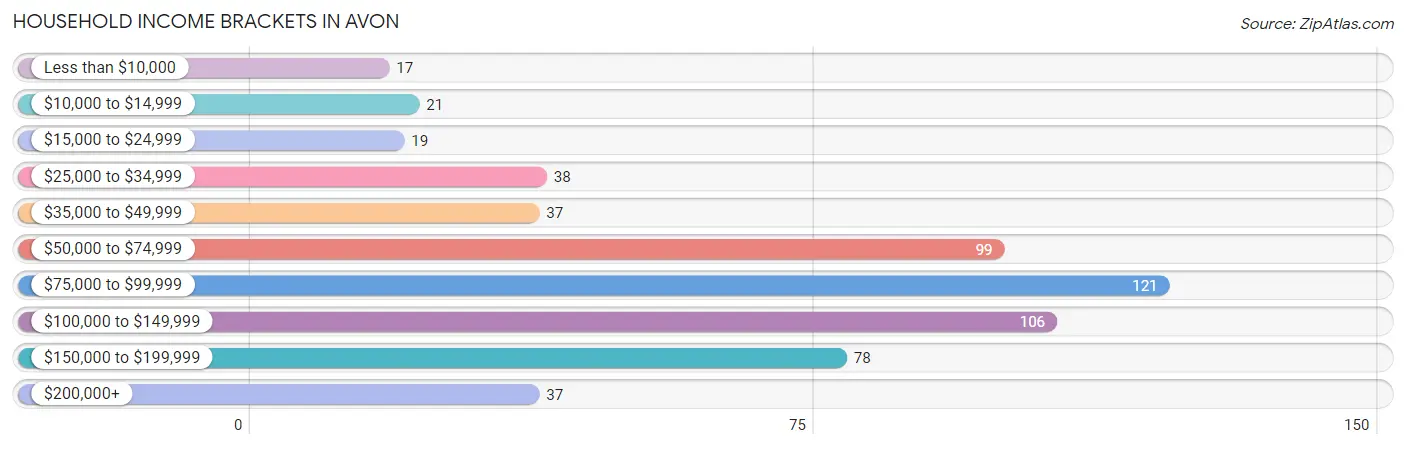
| Income Bracket | # Households | % Households |
| Less than $10,000 | 17 | 3.0% |
| $10,000 to $14,999 | 21 | 3.7% |
| $15,000 to $24,999 | 19 | 3.3% |
| $25,000 to $34,999 | 38 | 6.6% |
| $35,000 to $49,999 | 37 | 6.5% |
| $50,000 to $74,999 | 99 | 17.3% |
| $75,000 to $99,999 | 121 | 21.1% |
| $100,000 to $149,999 | 106 | 18.5% |
| $150,000 to $199,999 | 78 | 13.6% |
| $200,000+ | 37 | 6.5% |
Household Income by Householder Age in Avon
The median household income in Avon is $87,961, with the highest median household income of $96,250 found in the 45 to 64 years age bracket for the primary householder. A total of 208 households (36.3%) fall into this category. Meanwhile, the 15 to 24 years age bracket for the primary householder has the lowest median household income of $0, with 2 households (0.4%) in this group.
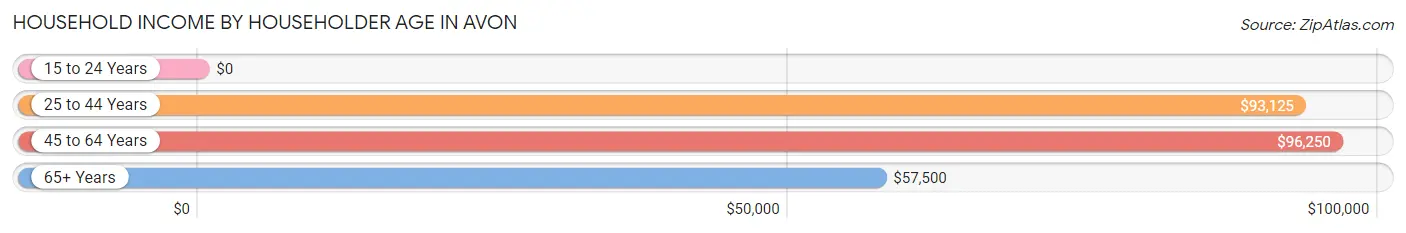
| Income Bracket | # Households | Median Income |
| 15 to 24 Years | 2 (0.4%) | $0 |
| 25 to 44 Years | 221 (38.6%) | $93,125 |
| 45 to 64 Years | 208 (36.3%) | $96,250 |
| 65+ Years | 142 (24.8%) | $57,500 |
| Total | 573 (100.0%) | $87,961 |
Poverty in Avon
Income Below Poverty by Sex and Age in Avon
With 5.4% poverty level for males and 9.1% for females among the residents of Avon, 18 to 24 year old males and 18 to 24 year old females are the most vulnerable to poverty, with 19 males (17.1%) and 17 females (38.6%) in their respective age groups living below the poverty level.
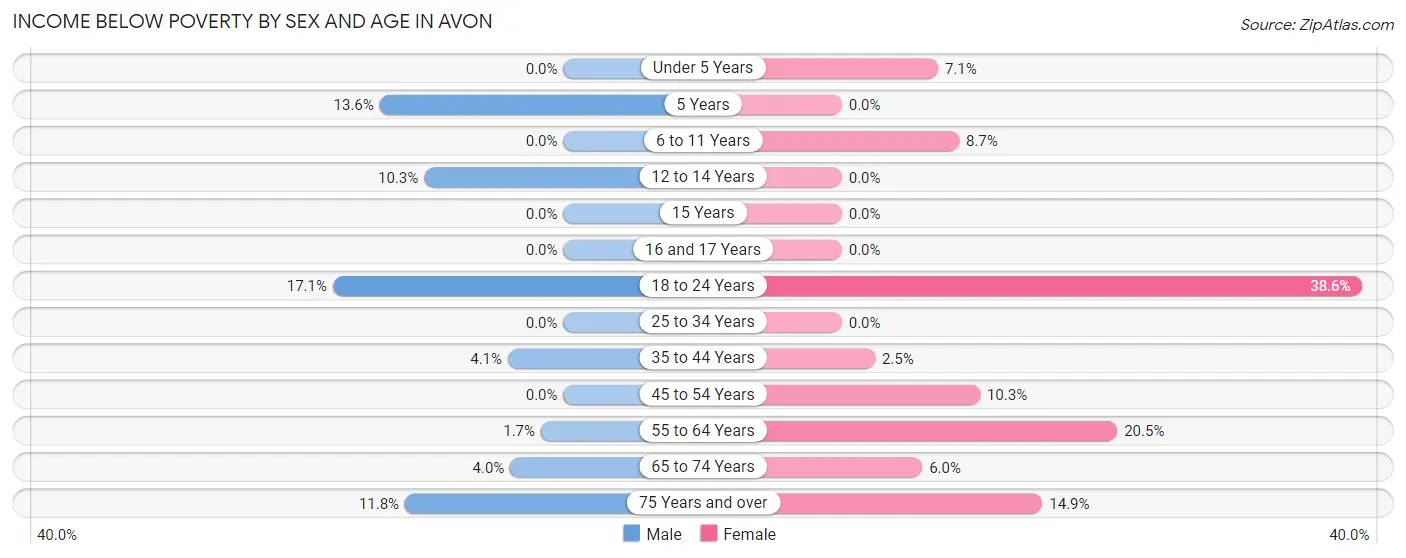
| Age Bracket | Male | Female |
| Under 5 Years | 0 (0.0%) | 2 (7.1%) |
| 5 Years | 3 (13.6%) | 0 (0.0%) |
| 6 to 11 Years | 0 (0.0%) | 6 (8.7%) |
| 12 to 14 Years | 3 (10.3%) | 0 (0.0%) |
| 15 Years | 0 (0.0%) | 0 (0.0%) |
| 16 and 17 Years | 0 (0.0%) | 0 (0.0%) |
| 18 to 24 Years | 19 (17.1%) | 17 (38.6%) |
| 25 to 34 Years | 0 (0.0%) | 0 (0.0%) |
| 35 to 44 Years | 4 (4.1%) | 3 (2.5%) |
| 45 to 54 Years | 0 (0.0%) | 8 (10.3%) |
| 55 to 64 Years | 1 (1.7%) | 18 (20.4%) |
| 65 to 74 Years | 3 (4.0%) | 4 (6.0%) |
| 75 Years and over | 4 (11.8%) | 7 (14.9%) |
| Total | 37 (5.4%) | 65 (9.1%) |
Income Above Poverty by Sex and Age in Avon
According to the poverty statistics in Avon, males aged under 5 years and females aged 5 years are the age groups that are most secure financially, with 100.0% of males and 100.0% of females in these age groups living above the poverty line.
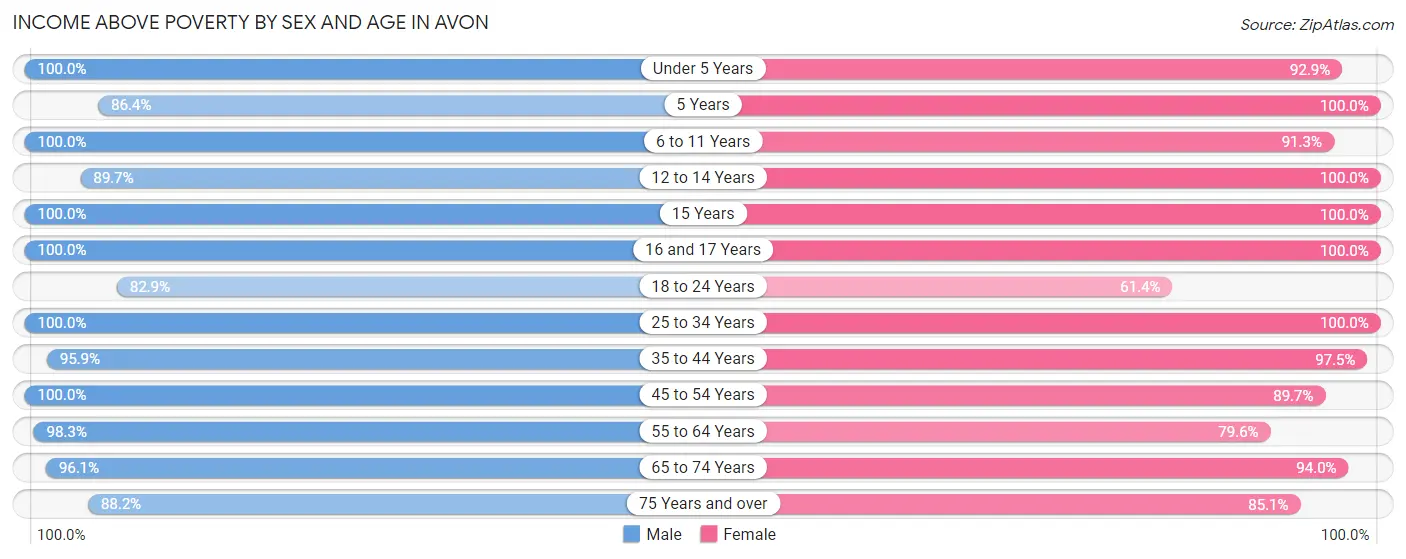
| Age Bracket | Male | Female |
| Under 5 Years | 39 (100.0%) | 26 (92.9%) |
| 5 Years | 19 (86.4%) | 10 (100.0%) |
| 6 to 11 Years | 20 (100.0%) | 63 (91.3%) |
| 12 to 14 Years | 26 (89.7%) | 17 (100.0%) |
| 15 Years | 10 (100.0%) | 10 (100.0%) |
| 16 and 17 Years | 6 (100.0%) | 27 (100.0%) |
| 18 to 24 Years | 92 (82.9%) | 27 (61.4%) |
| 25 to 34 Years | 79 (100.0%) | 105 (100.0%) |
| 35 to 44 Years | 93 (95.9%) | 119 (97.5%) |
| 45 to 54 Years | 105 (100.0%) | 70 (89.7%) |
| 55 to 64 Years | 59 (98.3%) | 70 (79.5%) |
| 65 to 74 Years | 73 (96.1%) | 63 (94.0%) |
| 75 Years and over | 30 (88.2%) | 40 (85.1%) |
| Total | 651 (94.6%) | 647 (90.9%) |
Income Below Poverty Among Married-Couple Families in Avon
The poverty statistics for married-couple families in Avon show that 3.1% or 9 of the total 291 families live below the poverty line. Families with 5 or more children have the highest poverty rate of 100.0%, comprising of 3 families. On the other hand, families with 1 or 2 children have the lowest poverty rate of 0.0%, which includes 0 families.
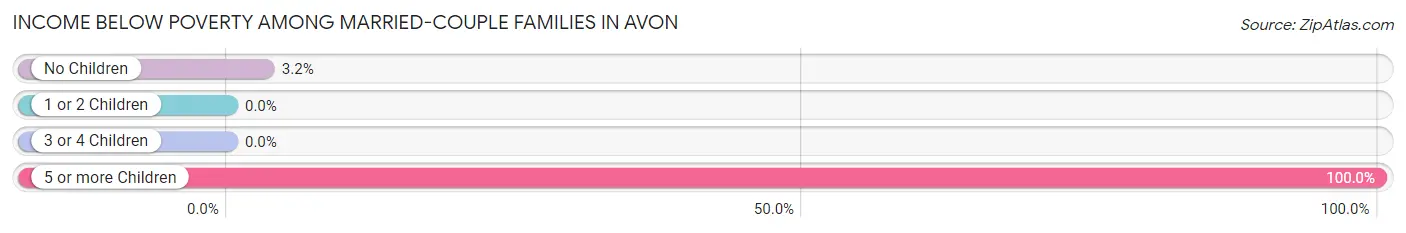
| Children | Above Poverty | Below Poverty |
| No Children | 181 (96.8%) | 6 (3.2%) |
| 1 or 2 Children | 76 (100.0%) | 0 (0.0%) |
| 3 or 4 Children | 25 (100.0%) | 0 (0.0%) |
| 5 or more Children | 0 (0.0%) | 3 (100.0%) |
| Total | 282 (96.9%) | 9 (3.1%) |
Income Below Poverty Among Single-Parent Households in Avon
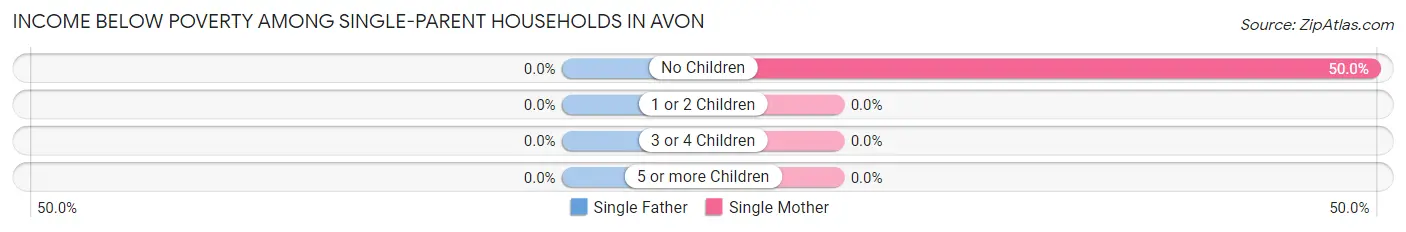
| Children | Single Father | Single Mother |
| No Children | 0 (0.0%) | 8 (50.0%) |
| 1 or 2 Children | 0 (0.0%) | 0 (0.0%) |
| 3 or 4 Children | 0 (0.0%) | 0 (0.0%) |
| 5 or more Children | 0 (0.0%) | 0 (0.0%) |
| Total | 0 (0.0%) | 8 (14.8%) |
Income Below Poverty Among Married-Couple vs Single-Parent Households in Avon
The poverty data for Avon shows that 9 of the married-couple family households (3.1%) and 8 of the single-parent households (11.3%) are living below the poverty level. Within the married-couple family households, those with 5 or more children have the highest poverty rate, with 3 households (100.0%) falling below the poverty line. Among the single-parent households, those with no children have the highest poverty rate, with 8 household (30.8%) living below poverty.
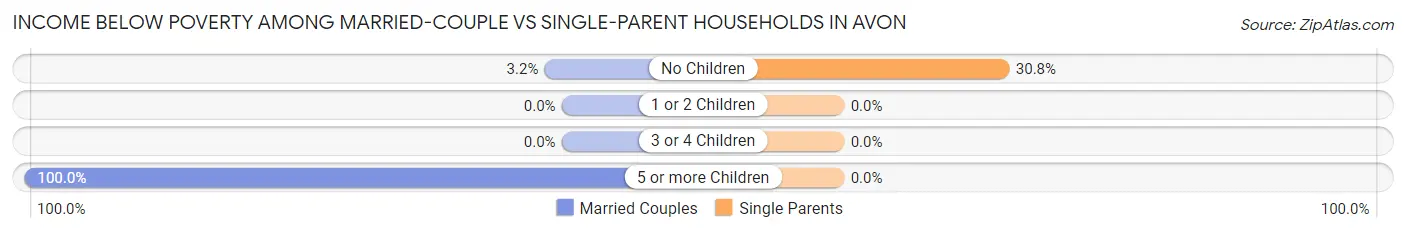
| Children | Married-Couple Families | Single-Parent Households |
| No Children | 6 (3.2%) | 8 (30.8%) |
| 1 or 2 Children | 0 (0.0%) | 0 (0.0%) |
| 3 or 4 Children | 0 (0.0%) | 0 (0.0%) |
| 5 or more Children | 3 (100.0%) | 0 (0.0%) |
| Total | 9 (3.1%) | 8 (11.3%) |
Race in Avon
The most populous races in Avon are White / Caucasian (1,379 | 97.8%), Some other Race (21 | 1.5%), and Two or more Races (10 | 0.7%).
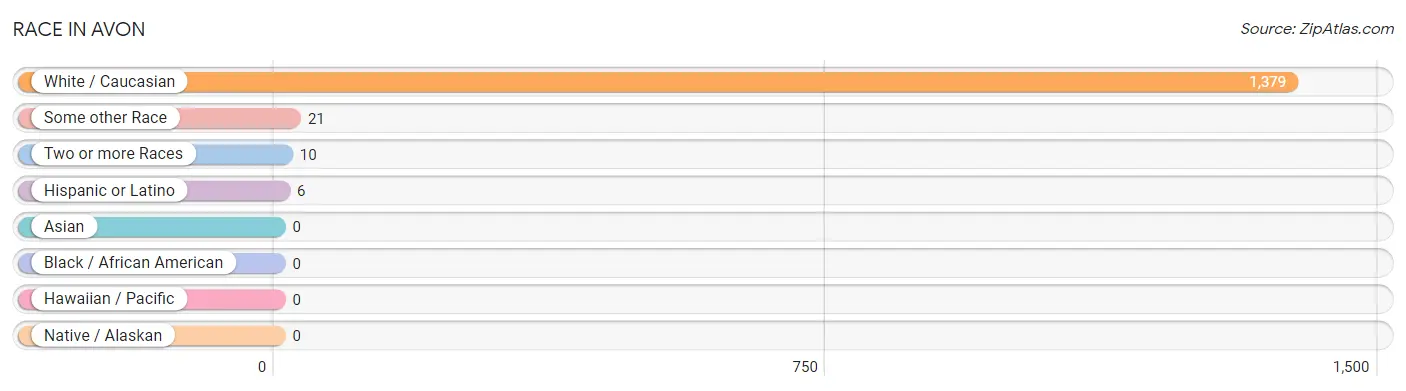
| Race | # Population | % Population |
| Asian | 0 | 0.0% |
| Black / African American | 0 | 0.0% |
| Hawaiian / Pacific | 0 | 0.0% |
| Hispanic or Latino | 6 | 0.4% |
| Native / Alaskan | 0 | 0.0% |
| White / Caucasian | 1,379 | 97.8% |
| Two or more Races | 10 | 0.7% |
| Some other Race | 21 | 1.5% |
| Total | 1,410 | 100.0% |
Ancestry in Avon
The most populous ancestries reported in Avon are German (745 | 52.8%), Polish (172 | 12.2%), Irish (168 | 11.9%), Norwegian (121 | 8.6%), and English (97 | 6.9%), together accounting for 92.4% of all Avon residents.
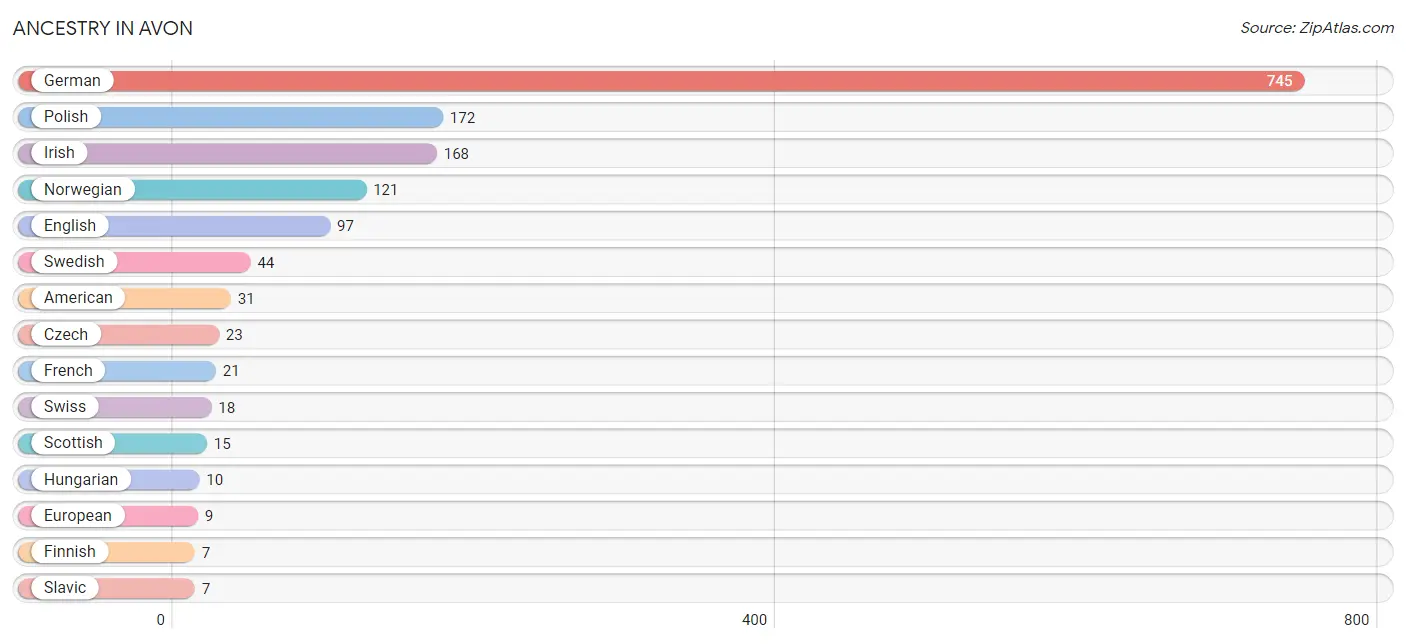
| Ancestry | # Population | % Population |
| American | 31 | 2.2% |
| Austrian | 3 | 0.2% |
| Chippewa | 2 | 0.1% |
| Czech | 23 | 1.6% |
| Dutch | 1 | 0.1% |
| English | 97 | 6.9% |
| European | 9 | 0.6% |
| Finnish | 7 | 0.5% |
| French | 21 | 1.5% |
| French Canadian | 5 | 0.4% |
| German | 745 | 52.8% |
| Hungarian | 10 | 0.7% |
| Irish | 168 | 11.9% |
| Italian | 5 | 0.4% |
| Mexican | 2 | 0.1% |
| Norwegian | 121 | 8.6% |
| Polish | 172 | 12.2% |
| Puerto Rican | 2 | 0.1% |
| Scandinavian | 6 | 0.4% |
| Scotch-Irish | 5 | 0.4% |
| Scottish | 15 | 1.1% |
| Slavic | 7 | 0.5% |
| Slovene | 3 | 0.2% |
| Swedish | 44 | 3.1% |
| Swiss | 18 | 1.3% | View All 25 Rows |
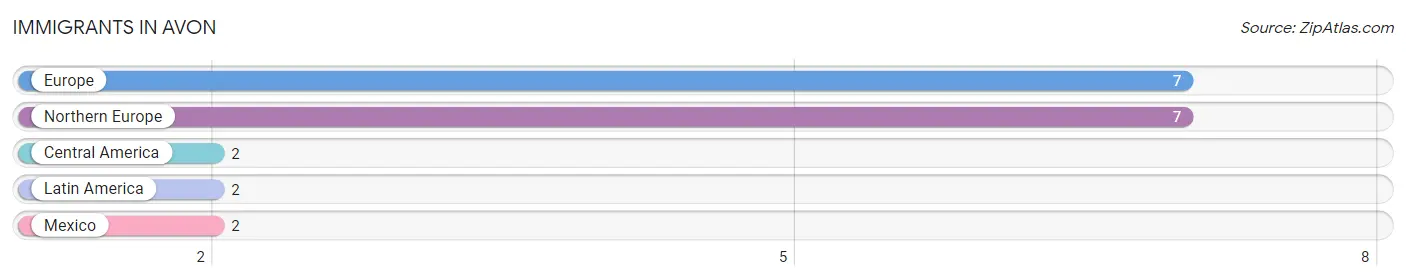
Immigrants in Avon
The most numerous immigrant groups reported in Avon came from Europe (7 | 0.5%), Northern Europe (7 | 0.5%), Central America (2 | 0.1%), Latin America (2 | 0.1%), and Mexico (2 | 0.1%), together accounting for 1.4% of all Avon residents.
| Immigration Origin | # Population | % Population |
| Central America | 2 | 0.1% |
| Europe | 7 | 0.5% |
| Latin America | 2 | 0.1% |
| Mexico | 2 | 0.1% |
| Northern Europe | 7 | 0.5% | View All 5 Rows |
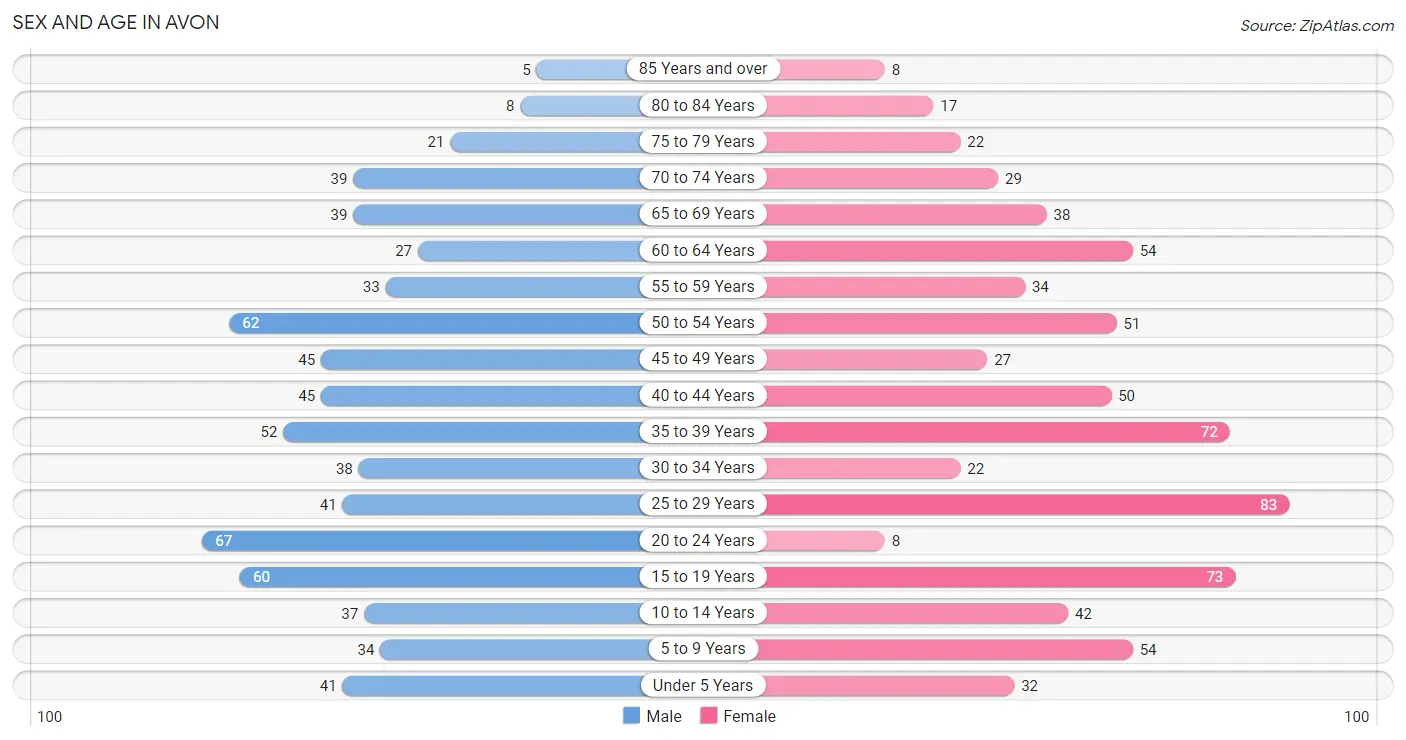
Sex and Age in Avon
Sex and Age in Avon
The most populous age groups in Avon are 20 to 24 Years (67 | 9.7%) for men and 25 to 29 Years (83 | 11.6%) for women.
| Age Bracket | Male | Female |
| Under 5 Years | 41 (5.9%) | 32 (4.5%) |
| 5 to 9 Years | 34 (4.9%) | 54 (7.5%) |
| 10 to 14 Years | 37 (5.3%) | 42 (5.9%) |
| 15 to 19 Years | 60 (8.6%) | 73 (10.2%) |
| 20 to 24 Years | 67 (9.7%) | 8 (1.1%) |
| 25 to 29 Years | 41 (5.9%) | 83 (11.6%) |
| 30 to 34 Years | 38 (5.5%) | 22 (3.1%) |
| 35 to 39 Years | 52 (7.5%) | 72 (10.1%) |
| 40 to 44 Years | 45 (6.5%) | 50 (7.0%) |
| 45 to 49 Years | 45 (6.5%) | 27 (3.8%) |
| 50 to 54 Years | 62 (8.9%) | 51 (7.1%) |
| 55 to 59 Years | 33 (4.8%) | 34 (4.8%) |
| 60 to 64 Years | 27 (3.9%) | 54 (7.5%) |
| 65 to 69 Years | 39 (5.6%) | 38 (5.3%) |
| 70 to 74 Years | 39 (5.6%) | 29 (4.1%) |
| 75 to 79 Years | 21 (3.0%) | 22 (3.1%) |
| 80 to 84 Years | 8 (1.1%) | 17 (2.4%) |
| 85 Years and over | 5 (0.7%) | 8 (1.1%) |
| Total | 694 (100.0%) | 716 (100.0%) |
Families and Households in Avon
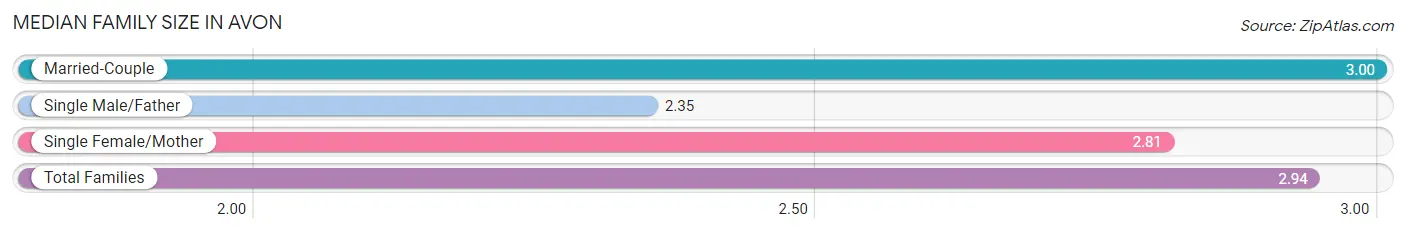
Median Family Size in Avon
The median family size in Avon is 2.94 persons per family, with married-couple families (291 | 80.4%) accounting for the largest median family size of 3 persons per family. On the other hand, single male/father families (17 | 4.7%) represent the smallest median family size with 2.35 persons per family.
| Family Type | # Families | Family Size |
| Married-Couple | 291 (80.4%) | 3.00 |
| Single Male/Father | 17 (4.7%) | 2.35 |
| Single Female/Mother | 54 (14.9%) | 2.81 |
| Total Families | 362 (100.0%) | 2.94 |
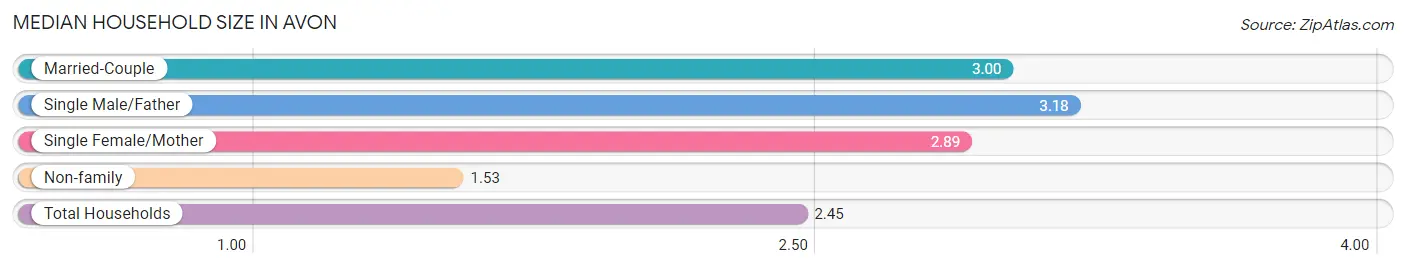
Median Household Size in Avon
The median household size in Avon is 2.45 persons per household, with single male/father households (17 | 3.0%) accounting for the largest median household size of 3.18 persons per household. non-family households (211 | 36.8%) represent the smallest median household size with 1.53 persons per household.
| Household Type | # Households | Household Size |
| Married-Couple | 291 (50.8%) | 3.00 |
| Single Male/Father | 17 (3.0%) | 3.18 |
| Single Female/Mother | 54 (9.4%) | 2.89 |
| Non-family | 211 (36.8%) | 1.53 |
| Total Households | 573 (100.0%) | 2.45 |
Household Size by Marriage Status in Avon
Out of a total of 573 households in Avon, 362 (63.2%) are family households, while 211 (36.8%) are nonfamily households. The most numerous type of family households are 2-person households, comprising 198, and the most common type of nonfamily households are 1-person households, comprising 149.
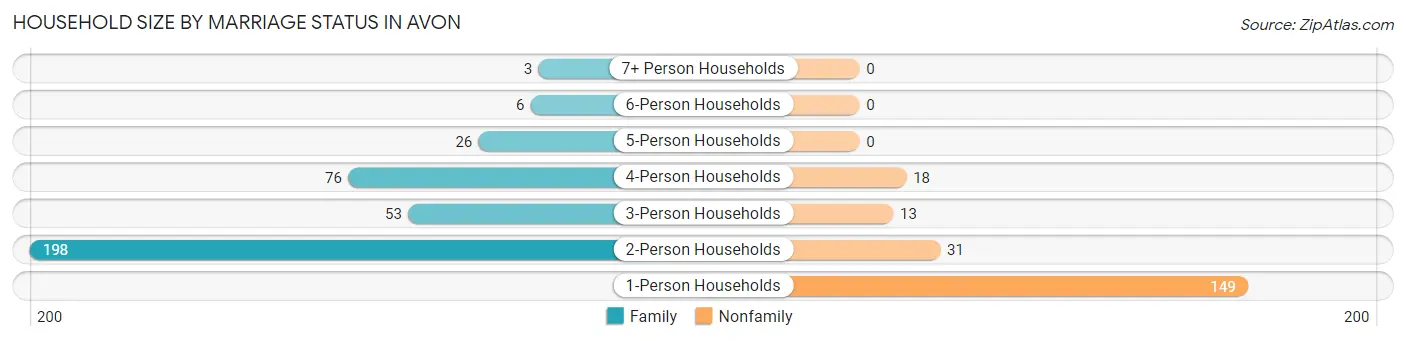
| Household Size | Family Households | Nonfamily Households |
| 1-Person Households | - | 149 (26.0%) |
| 2-Person Households | 198 (34.5%) | 31 (5.4%) |
| 3-Person Households | 53 (9.2%) | 13 (2.3%) |
| 4-Person Households | 76 (13.3%) | 18 (3.1%) |
| 5-Person Households | 26 (4.5%) | 0 (0.0%) |
| 6-Person Households | 6 (1.1%) | 0 (0.0%) |
| 7+ Person Households | 3 (0.5%) | 0 (0.0%) |
| Total | 362 (63.2%) | 211 (36.8%) |
Female Fertility in Avon
Fertility by Age in Avon
Average fertility rate in Avon is 45.0 births per 1,000 women. Women in the age bracket of 20 to 34 years have the highest fertility rate with 142.0 births per 1,000 women. Women in the age bracket of 20 to 34 years acount for 100.0% of all women with births.
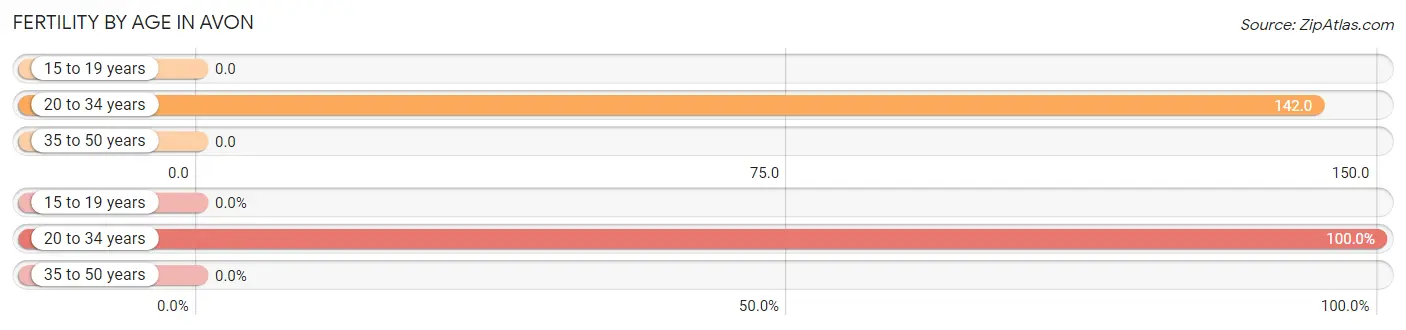
| Age Bracket | Women with Births | Births / 1,000 Women |
| 15 to 19 years | 0 (0.0%) | 0.0 |
| 20 to 34 years | 16 (100.0%) | 142.0 |
| 35 to 50 years | 0 (0.0%) | 0.0 |
| Total | 16 (100.0%) | 45.0 |
Fertility by Age by Marriage Status in Avon
81.2% of women with births (16) in Avon are married. The highest percentage of unmarried women with births falls into 20 to 34 years age bracket with 18.8% of them unmarried at the time of birth, while the lowest percentage of unmarried women with births belong to 20 to 34 years age bracket with 18.8% of them unmarried.
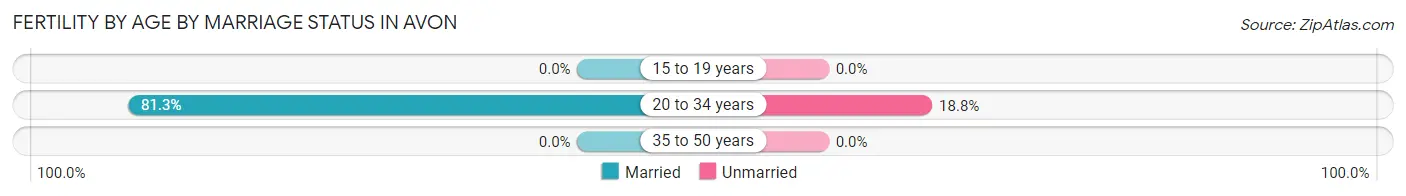
| Age Bracket | Married | Unmarried |
| 15 to 19 years | 0 (0.0%) | 0 (0.0%) |
| 20 to 34 years | 13 (81.2%) | 3 (18.8%) |
| 35 to 50 years | 0 (0.0%) | 0 (0.0%) |
| Total | 13 (81.2%) | 3 (18.8%) |
Fertility by Education in Avon
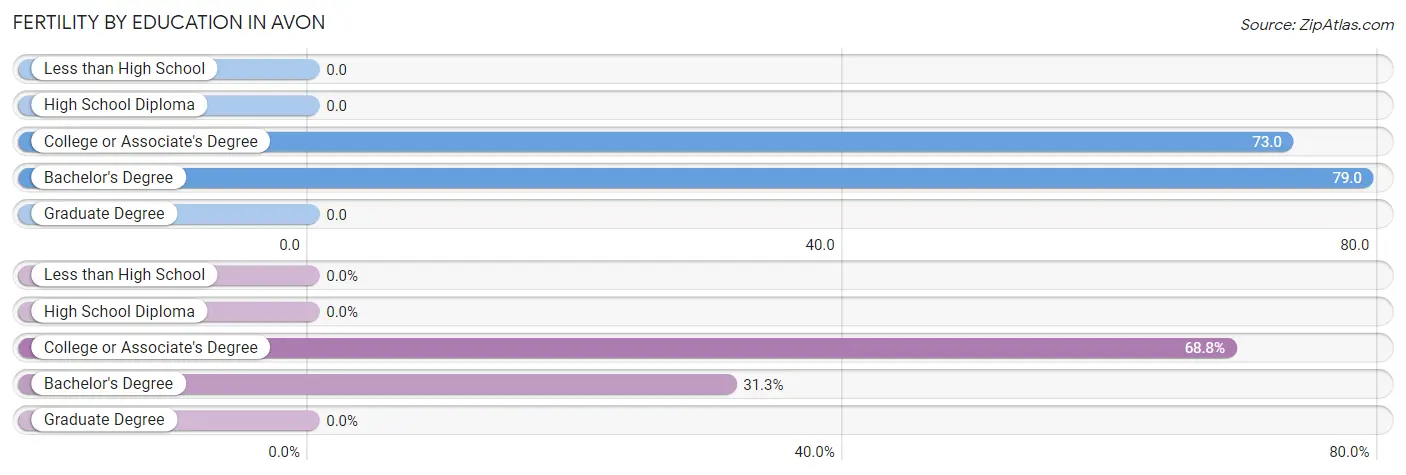
| Educational Attainment | Women with Births | Births / 1,000 Women |
| Less than High School | 0 (0.0%) | 0.0 |
| High School Diploma | 0 (0.0%) | 0.0 |
| College or Associate's Degree | 11 (68.8%) | 73.0 |
| Bachelor's Degree | 5 (31.2%) | 79.0 |
| Graduate Degree | 0 (0.0%) | 0.0 |
| Total | 16 (100.0%) | 45.0 |
Fertility by Education by Marriage Status in Avon
18.8% of women with births in Avon are unmarried. Women with the educational attainment of bachelor's degree are most likely to be married with 100.0% of them married at childbirth, while women with the educational attainment of college or associate's degree are least likely to be married with 27.3% of them unmarried at childbirth.
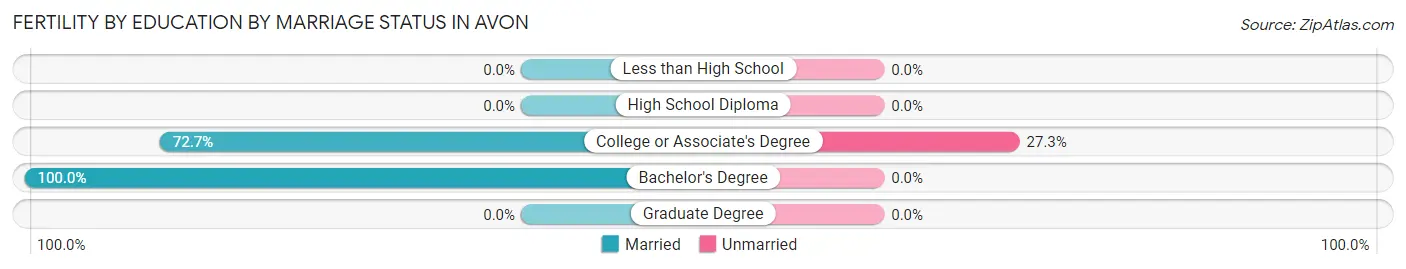
| Educational Attainment | Married | Unmarried |
| Less than High School | 0 (0.0%) | 0 (0.0%) |
| High School Diploma | 0 (0.0%) | 0 (0.0%) |
| College or Associate's Degree | 8 (72.7%) | 3 (27.3%) |
| Bachelor's Degree | 5 (100.0%) | 0 (0.0%) |
| Graduate Degree | 0 (0.0%) | 0 (0.0%) |
| Total | 13 (81.2%) | 3 (18.8%) |
Employment Characteristics in Avon
Employment by Class of Employer in Avon
Among the 786 employed individuals in Avon, private company employees (533 | 67.8%), not-for-profit organizations (92 | 11.7%), and local government employees (44 | 5.6%) make up the most common classes of employment.
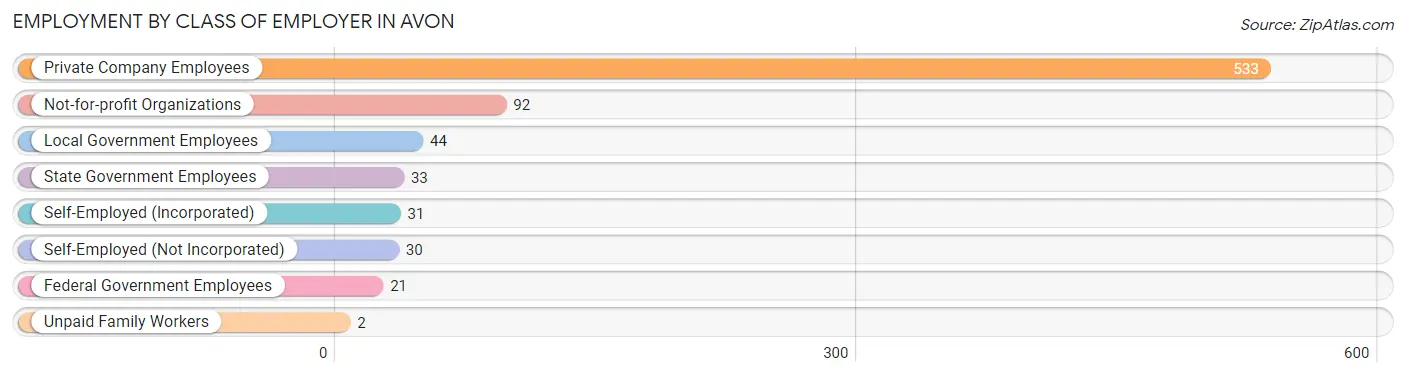
| Employer Class | # Employees | % Employees |
| Private Company Employees | 533 | 67.8% |
| Self-Employed (Incorporated) | 31 | 3.9% |
| Self-Employed (Not Incorporated) | 30 | 3.8% |
| Not-for-profit Organizations | 92 | 11.7% |
| Local Government Employees | 44 | 5.6% |
| State Government Employees | 33 | 4.2% |
| Federal Government Employees | 21 | 2.7% |
| Unpaid Family Workers | 2 | 0.3% |
| Total | 786 | 100.0% |
Employment Status by Age in Avon
According to the labor force statistics for Avon, out of the total population over 16 years of age (1,150), 71.0% or 816 individuals are in the labor force, with 2.7% or 22 of them unemployed. The age group with the highest labor force participation rate is 30 to 34 years, with 96.7% or 58 individuals in the labor force. Within the labor force, the 16 to 19 years age range has the highest percentage of unemployed individuals, with 21.3% or 19 of them being unemployed.
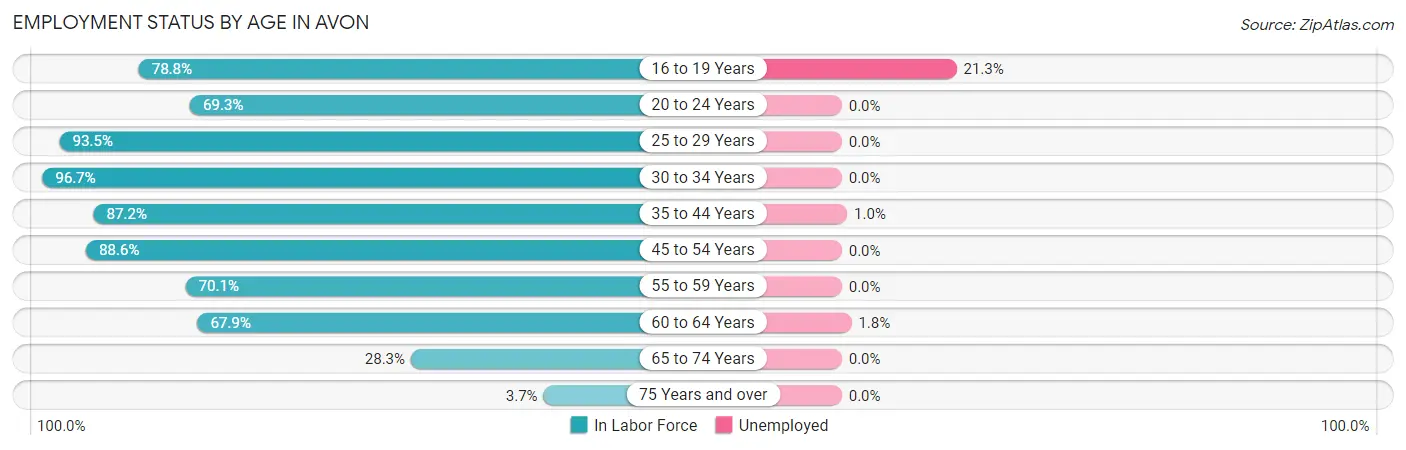
| Age Bracket | In Labor Force | Unemployed |
| 16 to 19 Years | 89 (78.8%) | 19 (21.3%) |
| 20 to 24 Years | 52 (69.3%) | 0 (0.0%) |
| 25 to 29 Years | 116 (93.5%) | 0 (0.0%) |
| 30 to 34 Years | 58 (96.7%) | 0 (0.0%) |
| 35 to 44 Years | 191 (87.2%) | 2 (1.0%) |
| 45 to 54 Years | 164 (88.6%) | 0 (0.0%) |
| 55 to 59 Years | 47 (70.1%) | 0 (0.0%) |
| 60 to 64 Years | 55 (67.9%) | 1 (1.8%) |
| 65 to 74 Years | 41 (28.3%) | 0 (0.0%) |
| 75 Years and over | 3 (3.7%) | 0 (0.0%) |
| Total | 816 (71.0%) | 22 (2.7%) |
Employment Status by Educational Attainment in Avon
According to labor force statistics for Avon, 85.7% of individuals (631) out of the total population between 25 and 64 years of age (736) are in the labor force, with 0.5% or 3 of them being unemployed. The group with the highest labor force participation rate are those with the educational attainment of bachelor's degree or higher, with 92.6% or 224 individuals in the labor force. Within the labor force, individuals with high school diploma education have the highest percentage of unemployment, with 1.3% or 2 of them being unemployed.
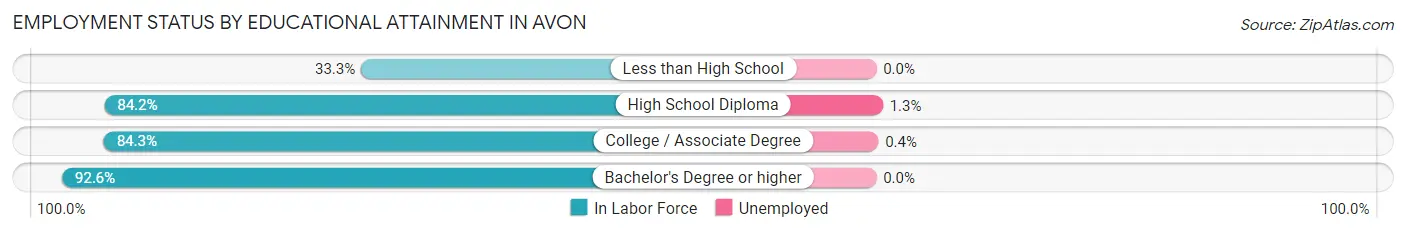
| Educational Attainment | In Labor Force | Unemployed |
| Less than High School | 6 (33.3%) | 0 (0.0%) |
| High School Diploma | 154 (84.2%) | 2 (1.3%) |
| College / Associate Degree | 247 (84.3%) | 1 (0.4%) |
| Bachelor's Degree or higher | 224 (92.6%) | 0 (0.0%) |
| Total | 631 (85.7%) | 4 (0.5%) |
Employment Occupations by Sex in Avon
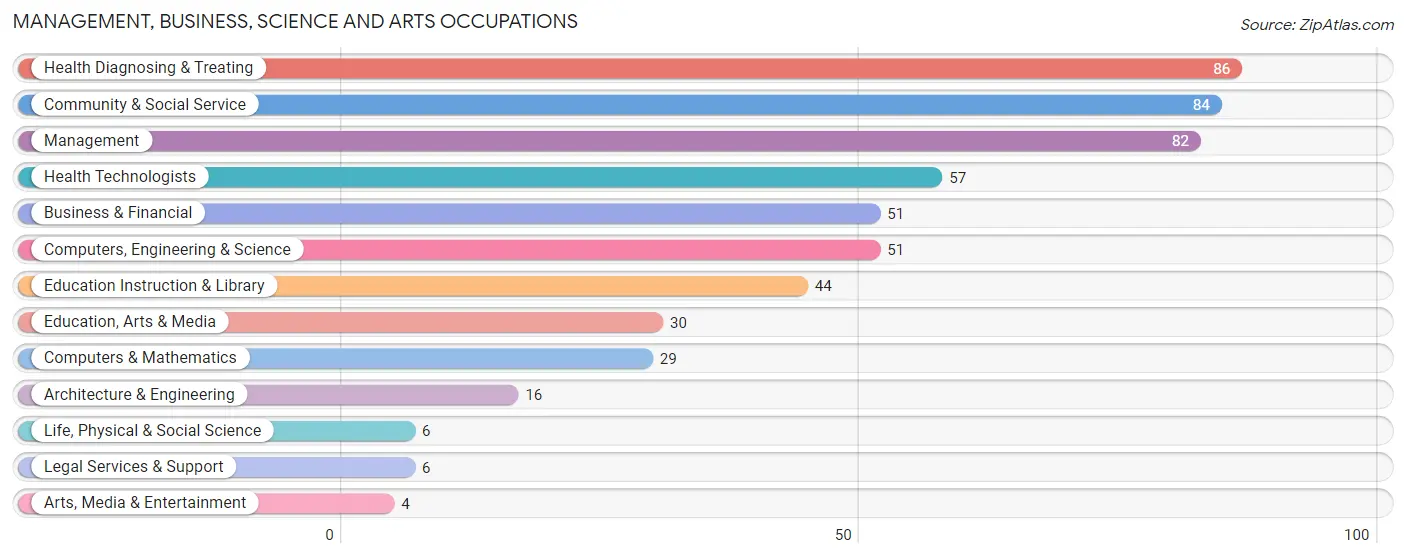
Management, Business, Science and Arts Occupations
The most common Management, Business, Science and Arts occupations in Avon are Health Diagnosing & Treating (86 | 10.8%), Community & Social Service (84 | 10.6%), Management (82 | 10.3%), Health Technologists (57 | 7.2%), and Business & Financial (51 | 6.4%).
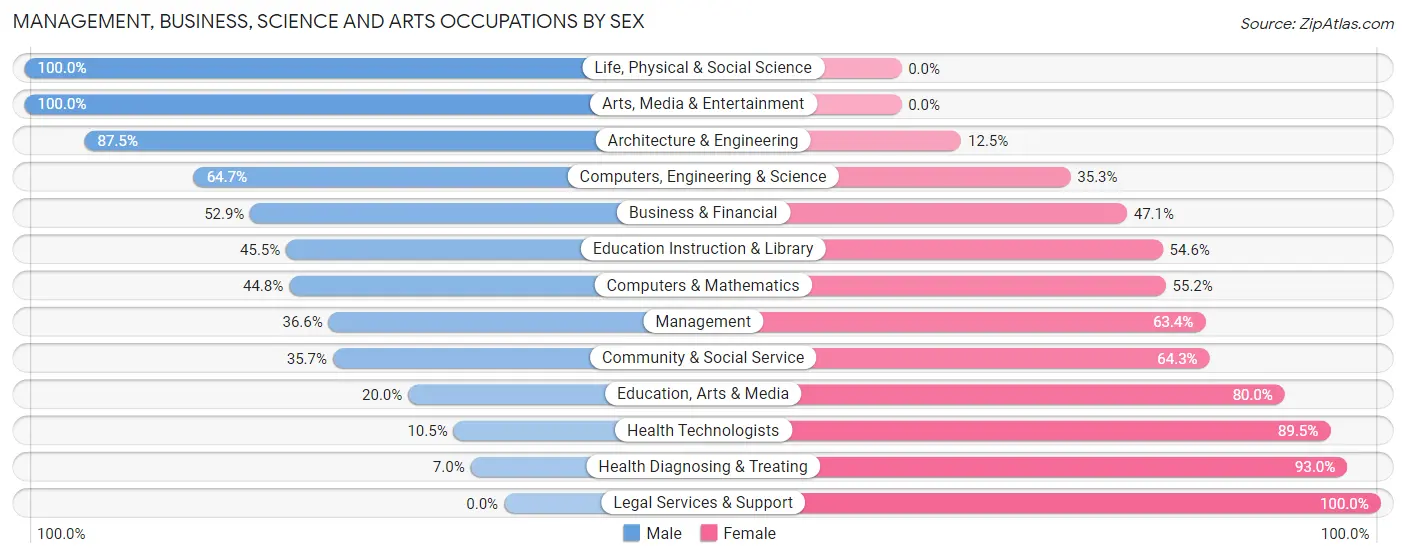
Management, Business, Science and Arts Occupations by Sex
Within the Management, Business, Science and Arts occupations in Avon, the most male-oriented occupations are Life, Physical & Social Science (100.0%), Arts, Media & Entertainment (100.0%), and Architecture & Engineering (87.5%), while the most female-oriented occupations are Legal Services & Support (100.0%), Health Diagnosing & Treating (93.0%), and Health Technologists (89.5%).
| Occupation | Male | Female |
| Management | 30 (36.6%) | 52 (63.4%) |
| Business & Financial | 27 (52.9%) | 24 (47.1%) |
| Computers, Engineering & Science | 33 (64.7%) | 18 (35.3%) |
| Computers & Mathematics | 13 (44.8%) | 16 (55.2%) |
| Architecture & Engineering | 14 (87.5%) | 2 (12.5%) |
| Life, Physical & Social Science | 6 (100.0%) | 0 (0.0%) |
| Community & Social Service | 30 (35.7%) | 54 (64.3%) |
| Education, Arts & Media | 6 (20.0%) | 24 (80.0%) |
| Legal Services & Support | 0 (0.0%) | 6 (100.0%) |
| Education Instruction & Library | 20 (45.5%) | 24 (54.5%) |
| Arts, Media & Entertainment | 4 (100.0%) | 0 (0.0%) |
| Health Diagnosing & Treating | 6 (7.0%) | 80 (93.0%) |
| Health Technologists | 6 (10.5%) | 51 (89.5%) |
| Total (Category) | 126 (35.6%) | 228 (64.4%) |
| Total (Overall) | 412 (51.9%) | 382 (48.1%) |
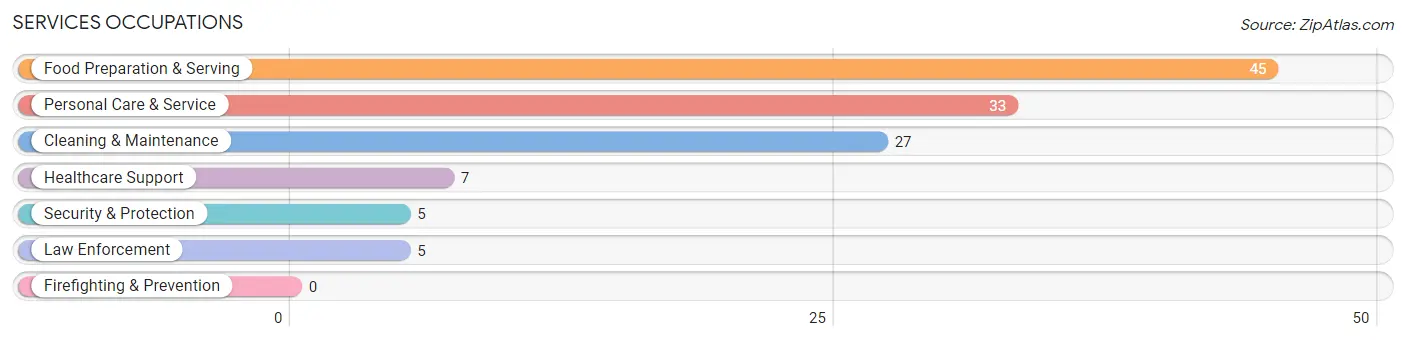
Services Occupations
The most common Services occupations in Avon are Food Preparation & Serving (45 | 5.7%), Personal Care & Service (33 | 4.2%), Cleaning & Maintenance (27 | 3.4%), Healthcare Support (7 | 0.9%), and Security & Protection (5 | 0.6%).
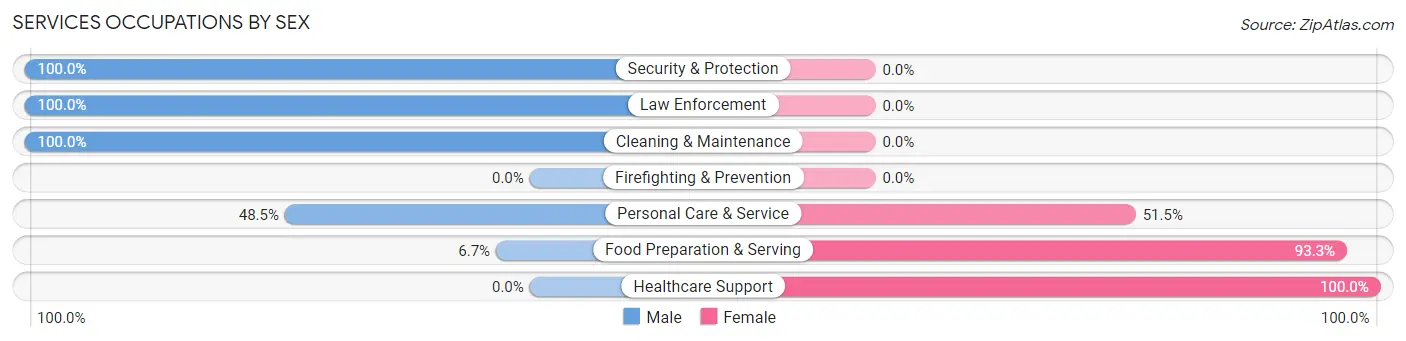
Services Occupations by Sex
Within the Services occupations in Avon, the most male-oriented occupations are Security & Protection (100.0%), Law Enforcement (100.0%), and Cleaning & Maintenance (100.0%), while the most female-oriented occupations are Healthcare Support (100.0%), Food Preparation & Serving (93.3%), and Personal Care & Service (51.5%).
| Occupation | Male | Female |
| Healthcare Support | 0 (0.0%) | 7 (100.0%) |
| Security & Protection | 5 (100.0%) | 0 (0.0%) |
| Firefighting & Prevention | 0 (0.0%) | 0 (0.0%) |
| Law Enforcement | 5 (100.0%) | 0 (0.0%) |
| Food Preparation & Serving | 3 (6.7%) | 42 (93.3%) |
| Cleaning & Maintenance | 27 (100.0%) | 0 (0.0%) |
| Personal Care & Service | 16 (48.5%) | 17 (51.5%) |
| Total (Category) | 51 (43.6%) | 66 (56.4%) |
| Total (Overall) | 412 (51.9%) | 382 (48.1%) |
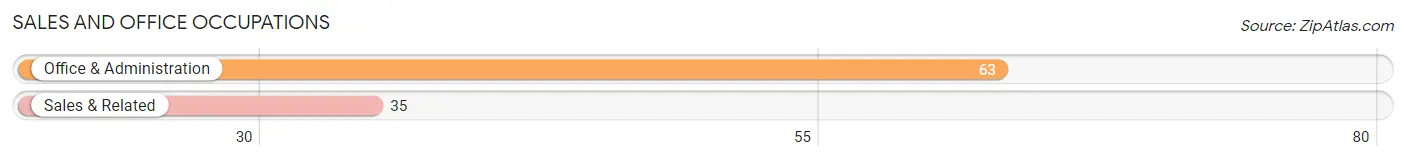
Sales and Office Occupations
The most common Sales and Office occupations in Avon are Office & Administration (63 | 7.9%), and Sales & Related (35 | 4.4%).
Sales and Office Occupations by Sex
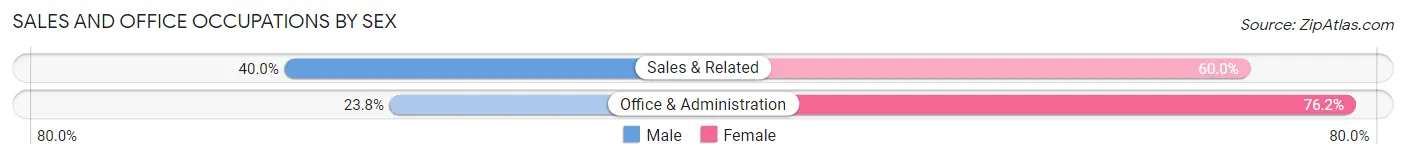
| Occupation | Male | Female |
| Sales & Related | 14 (40.0%) | 21 (60.0%) |
| Office & Administration | 15 (23.8%) | 48 (76.2%) |
| Total (Category) | 29 (29.6%) | 69 (70.4%) |
| Total (Overall) | 412 (51.9%) | 382 (48.1%) |
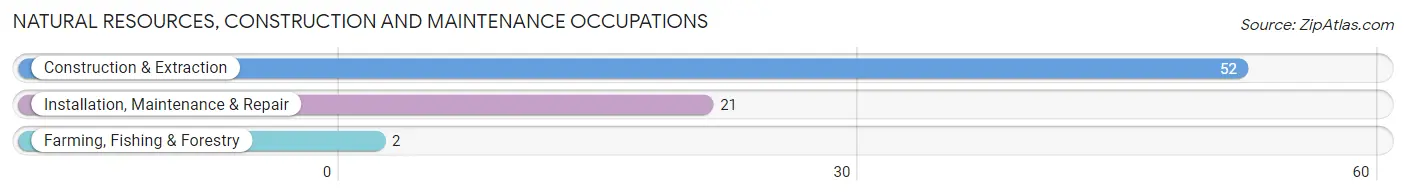
Natural Resources, Construction and Maintenance Occupations
The most common Natural Resources, Construction and Maintenance occupations in Avon are Construction & Extraction (52 | 6.6%), Installation, Maintenance & Repair (21 | 2.6%), and Farming, Fishing & Forestry (2 | 0.3%).
Natural Resources, Construction and Maintenance Occupations by Sex
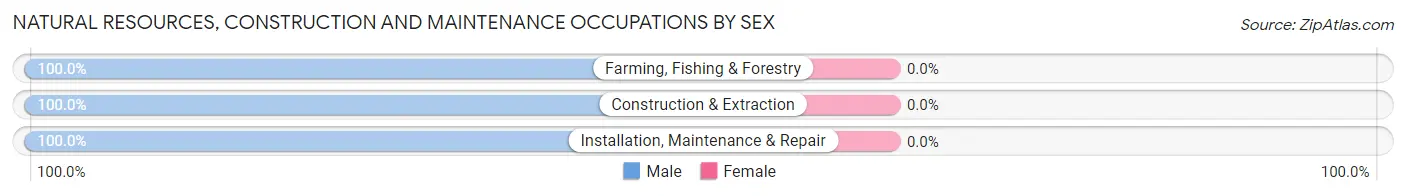
| Occupation | Male | Female |
| Farming, Fishing & Forestry | 2 (100.0%) | 0 (0.0%) |
| Construction & Extraction | 52 (100.0%) | 0 (0.0%) |
| Installation, Maintenance & Repair | 21 (100.0%) | 0 (0.0%) |
| Total (Category) | 75 (100.0%) | 0 (0.0%) |
| Total (Overall) | 412 (51.9%) | 382 (48.1%) |
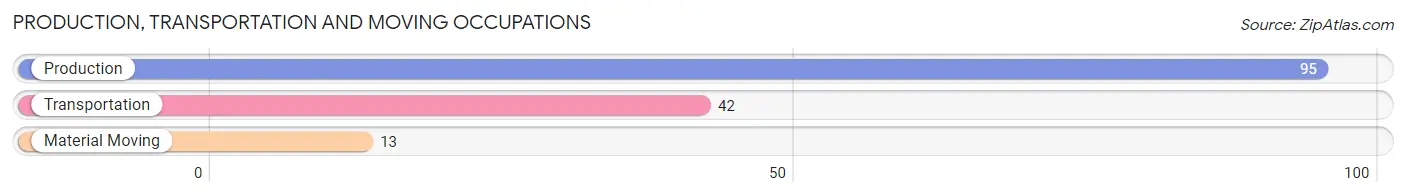
Production, Transportation and Moving Occupations
The most common Production, Transportation and Moving occupations in Avon are Production (95 | 12.0%), Transportation (42 | 5.3%), and Material Moving (13 | 1.6%).
Production, Transportation and Moving Occupations by Sex
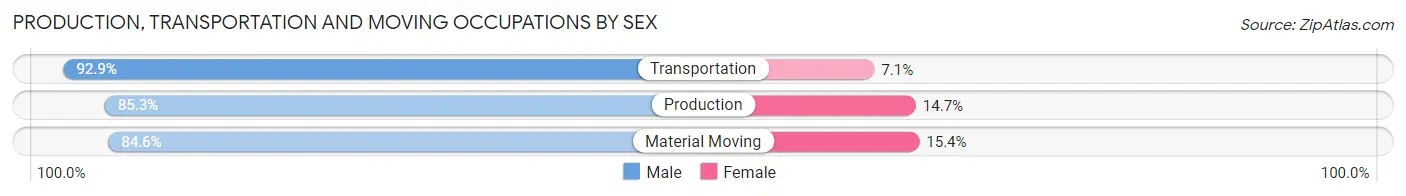
| Occupation | Male | Female |
| Production | 81 (85.3%) | 14 (14.7%) |
| Transportation | 39 (92.9%) | 3 (7.1%) |
| Material Moving | 11 (84.6%) | 2 (15.4%) |
| Total (Category) | 131 (87.3%) | 19 (12.7%) |
| Total (Overall) | 412 (51.9%) | 382 (48.1%) |
Employment Industries by Sex in Avon
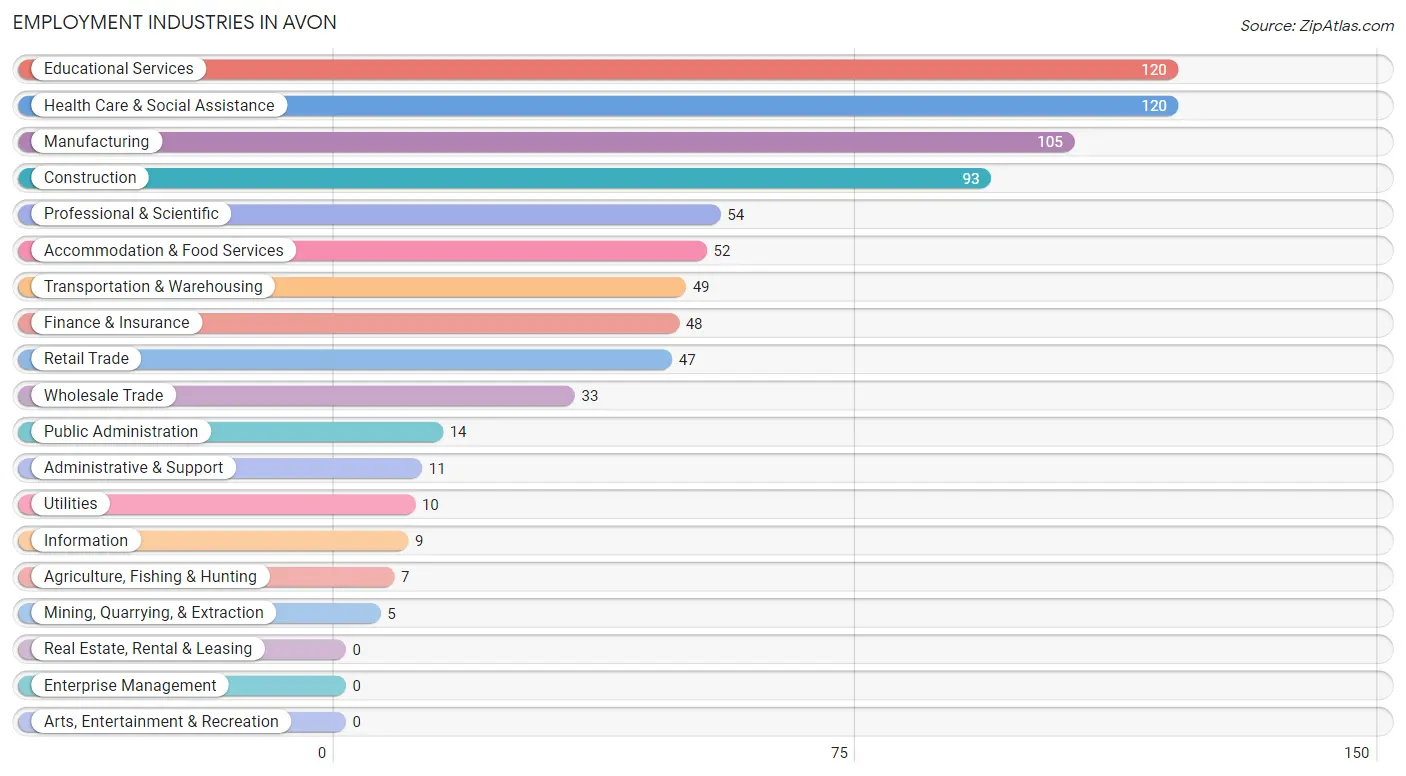
Employment Industries in Avon
The major employment industries in Avon include Educational Services (120 | 15.1%), Health Care & Social Assistance (120 | 15.1%), Manufacturing (105 | 13.2%), Construction (93 | 11.7%), and Professional & Scientific (54 | 6.8%).
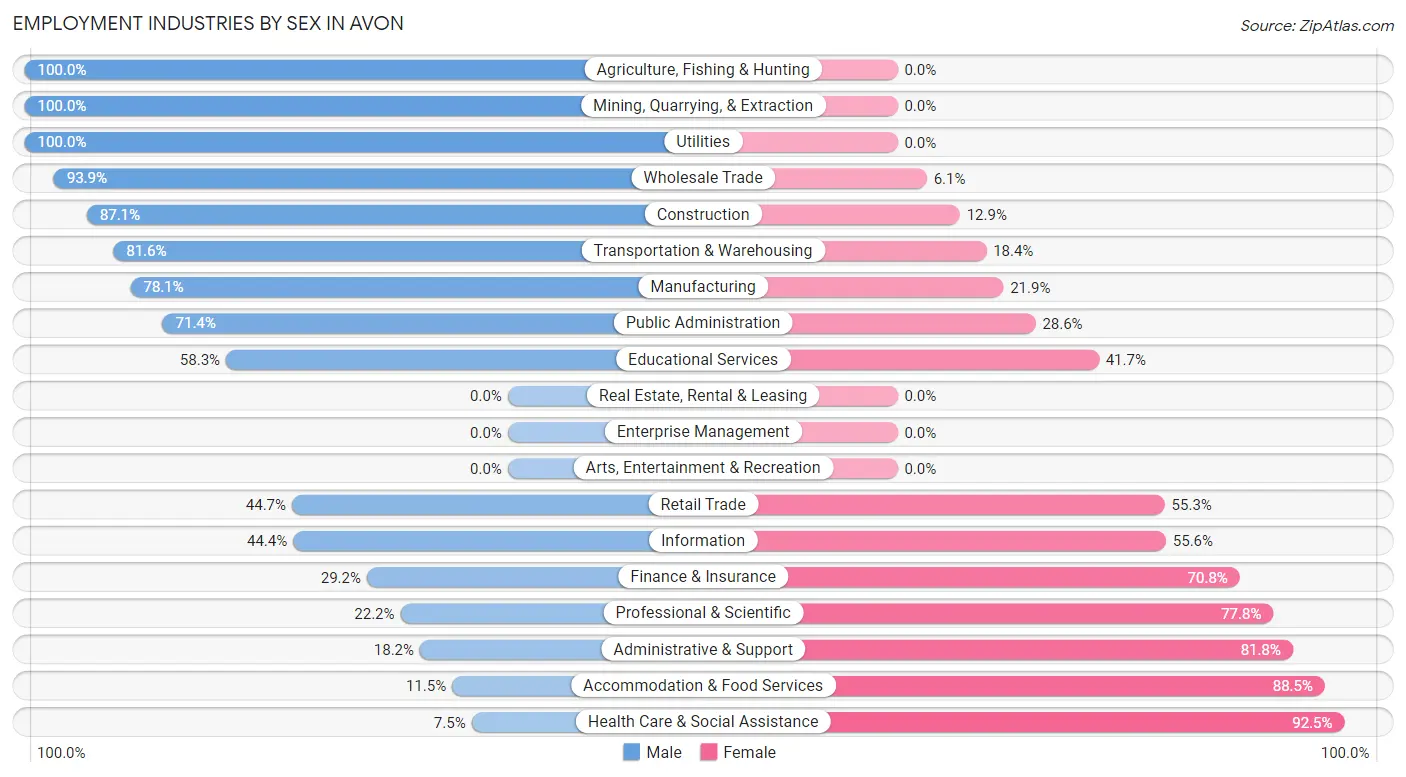
Employment Industries by Sex in Avon
The Avon industries that see more men than women are Agriculture, Fishing & Hunting (100.0%), Mining, Quarrying, & Extraction (100.0%), and Utilities (100.0%), whereas the industries that tend to have a higher number of women are Health Care & Social Assistance (92.5%), Accommodation & Food Services (88.5%), and Administrative & Support (81.8%).
| Industry | Male | Female |
| Agriculture, Fishing & Hunting | 7 (100.0%) | 0 (0.0%) |
| Mining, Quarrying, & Extraction | 5 (100.0%) | 0 (0.0%) |
| Construction | 81 (87.1%) | 12 (12.9%) |
| Manufacturing | 82 (78.1%) | 23 (21.9%) |
| Wholesale Trade | 31 (93.9%) | 2 (6.1%) |
| Retail Trade | 21 (44.7%) | 26 (55.3%) |
| Transportation & Warehousing | 40 (81.6%) | 9 (18.4%) |
| Utilities | 10 (100.0%) | 0 (0.0%) |
| Information | 4 (44.4%) | 5 (55.6%) |
| Finance & Insurance | 14 (29.2%) | 34 (70.8%) |
| Real Estate, Rental & Leasing | 0 (0.0%) | 0 (0.0%) |
| Professional & Scientific | 12 (22.2%) | 42 (77.8%) |
| Enterprise Management | 0 (0.0%) | 0 (0.0%) |
| Administrative & Support | 2 (18.2%) | 9 (81.8%) |
| Educational Services | 70 (58.3%) | 50 (41.7%) |
| Health Care & Social Assistance | 9 (7.5%) | 111 (92.5%) |
| Arts, Entertainment & Recreation | 0 (0.0%) | 0 (0.0%) |
| Accommodation & Food Services | 6 (11.5%) | 46 (88.5%) |
| Public Administration | 10 (71.4%) | 4 (28.6%) |
| Total | 412 (51.9%) | 382 (48.1%) |
Education in Avon
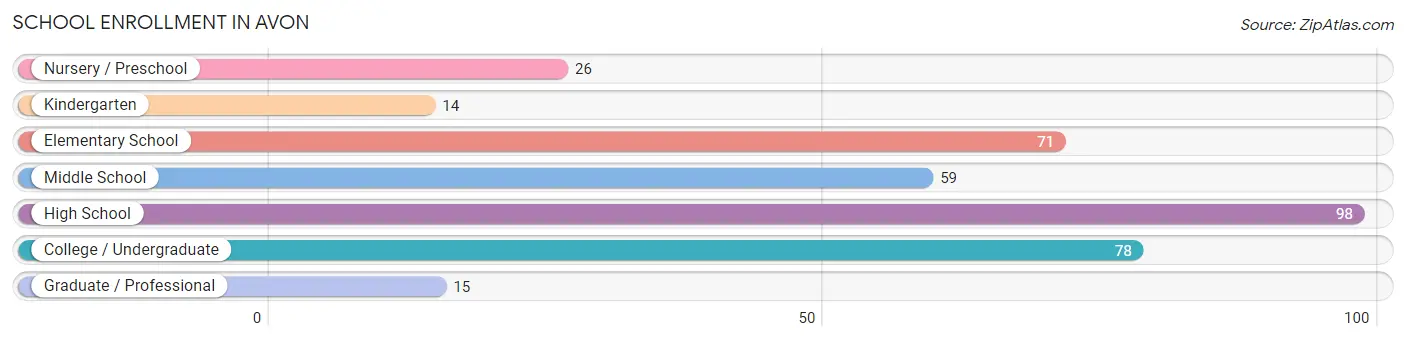
School Enrollment in Avon
The most common levels of schooling among the 361 students in Avon are high school (98 | 27.2%), college / undergraduate (78 | 21.6%), and elementary school (71 | 19.7%).
| School Level | # Students | % Students |
| Nursery / Preschool | 26 | 7.2% |
| Kindergarten | 14 | 3.9% |
| Elementary School | 71 | 19.7% |
| Middle School | 59 | 16.3% |
| High School | 98 | 27.2% |
| College / Undergraduate | 78 | 21.6% |
| Graduate / Professional | 15 | 4.2% |
| Total | 361 | 100.0% |
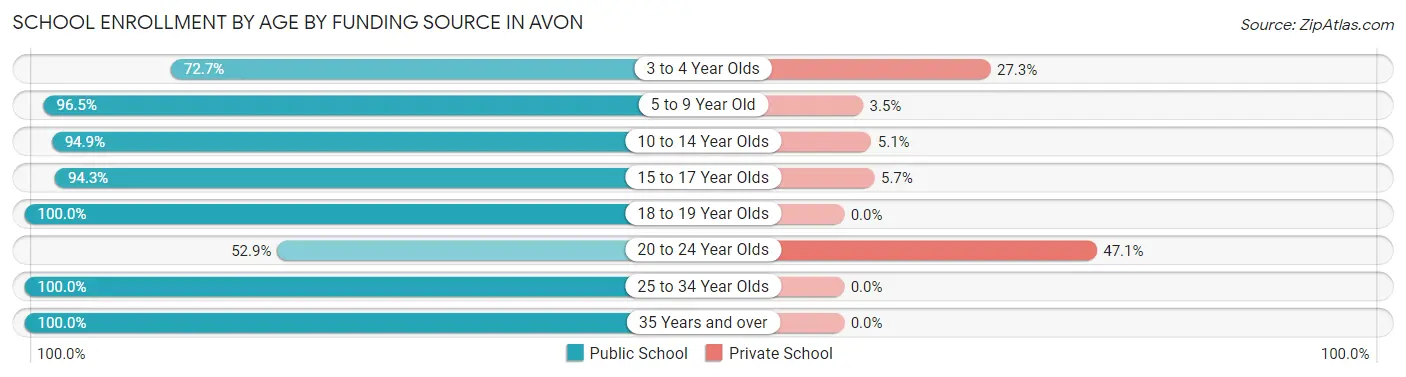
School Enrollment by Age by Funding Source in Avon
Out of a total of 361 students who are enrolled in schools in Avon, 29 (8.0%) attend a private institution, while the remaining 332 (92.0%) are enrolled in public schools. The age group of 20 to 24 year olds has the highest likelihood of being enrolled in private schools, with 16 (47.1% in the age bracket) enrolled. Conversely, the age group of 18 to 19 year olds has the lowest likelihood of being enrolled in a private school, with 50 (100.0% in the age bracket) attending a public institution.
| Age Bracket | Public School | Private School |
| 3 to 4 Year Olds | 8 (72.7%) | 3 (27.3%) |
| 5 to 9 Year Old | 82 (96.5%) | 3 (3.5%) |
| 10 to 14 Year Olds | 75 (94.9%) | 4 (5.1%) |
| 15 to 17 Year Olds | 50 (94.3%) | 3 (5.7%) |
| 18 to 19 Year Olds | 50 (100.0%) | 0 (0.0%) |
| 20 to 24 Year Olds | 18 (52.9%) | 16 (47.1%) |
| 25 to 34 Year Olds | 40 (100.0%) | 0 (0.0%) |
| 35 Years and over | 9 (100.0%) | 0 (0.0%) |
| Total | 332 (92.0%) | 29 (8.0%) |
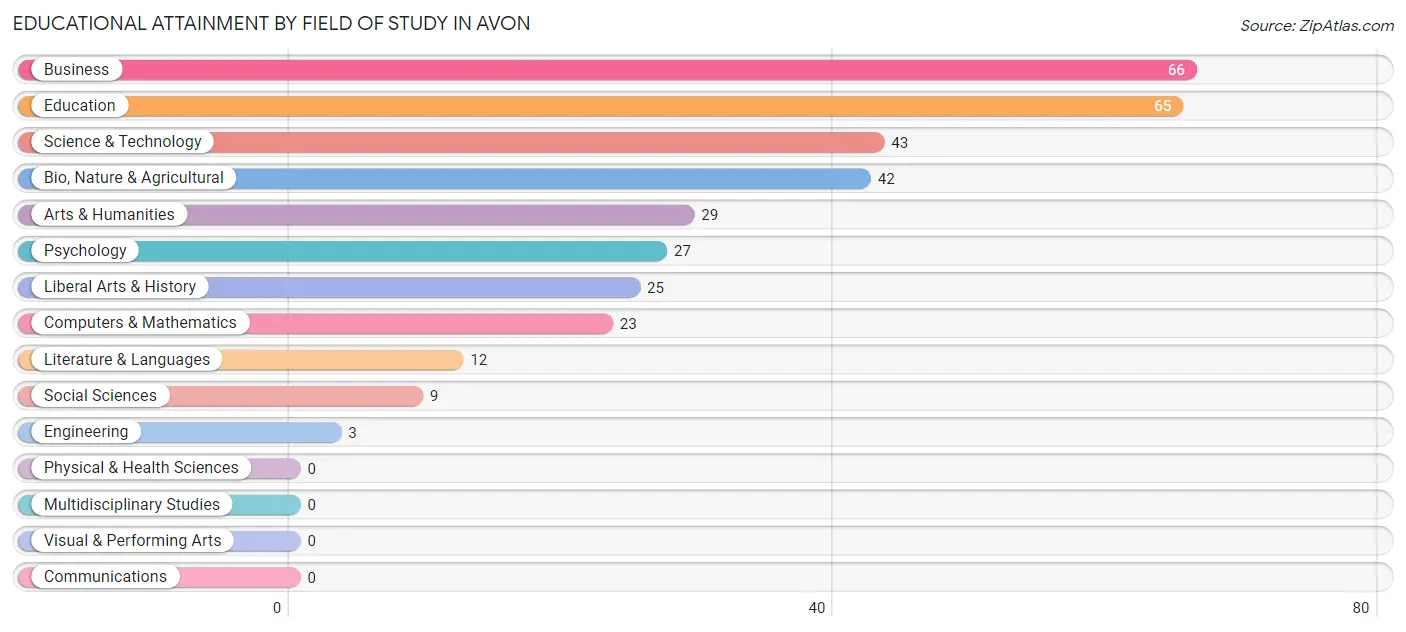
Educational Attainment by Field of Study in Avon
Business (66 | 19.2%), education (65 | 18.9%), science & technology (43 | 12.5%), bio, nature & agricultural (42 | 12.2%), and arts & humanities (29 | 8.4%) are the most common fields of study among 344 individuals in Avon who have obtained a bachelor's degree or higher.
| Field of Study | # Graduates | % Graduates |
| Computers & Mathematics | 23 | 6.7% |
| Bio, Nature & Agricultural | 42 | 12.2% |
| Physical & Health Sciences | 0 | 0.0% |
| Psychology | 27 | 7.9% |
| Social Sciences | 9 | 2.6% |
| Engineering | 3 | 0.9% |
| Multidisciplinary Studies | 0 | 0.0% |
| Science & Technology | 43 | 12.5% |
| Business | 66 | 19.2% |
| Education | 65 | 18.9% |
| Literature & Languages | 12 | 3.5% |
| Liberal Arts & History | 25 | 7.3% |
| Visual & Performing Arts | 0 | 0.0% |
| Communications | 0 | 0.0% |
| Arts & Humanities | 29 | 8.4% |
| Total | 344 | 100.0% |
Transportation & Commute in Avon
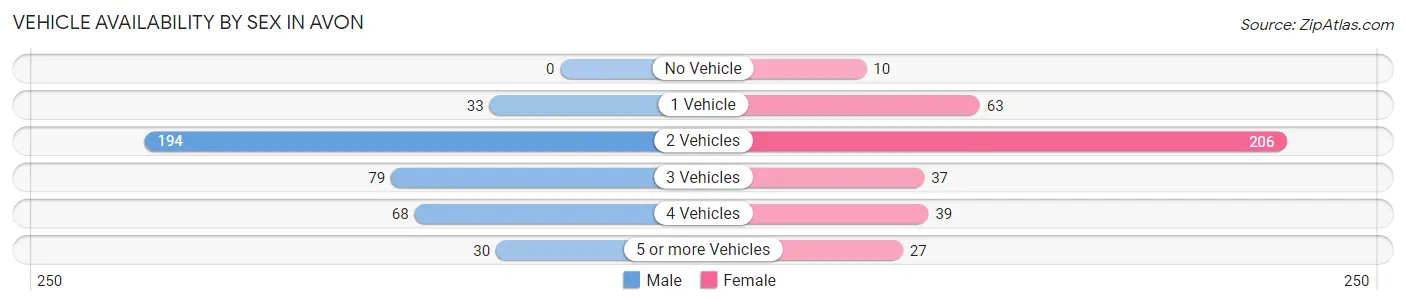
Vehicle Availability by Sex in Avon
The most prevalent vehicle ownership categories in Avon are males with 2 vehicles (194, accounting for 48.0%) and females with 2 vehicles (206, making up 50.8%).
| Vehicles Available | Male | Female |
| No Vehicle | 0 (0.0%) | 10 (2.6%) |
| 1 Vehicle | 33 (8.2%) | 63 (16.5%) |
| 2 Vehicles | 194 (48.0%) | 206 (53.9%) |
| 3 Vehicles | 79 (19.6%) | 37 (9.7%) |
| 4 Vehicles | 68 (16.8%) | 39 (10.2%) |
| 5 or more Vehicles | 30 (7.4%) | 27 (7.1%) |
| Total | 404 (100.0%) | 382 (100.0%) |
Commute Time in Avon
The most frequently occuring commute durations in Avon are 10 to 14 minutes (126 commuters, 17.2%), 25 to 29 minutes (124 commuters, 16.9%), and 20 to 24 minutes (117 commuters, 16.0%).
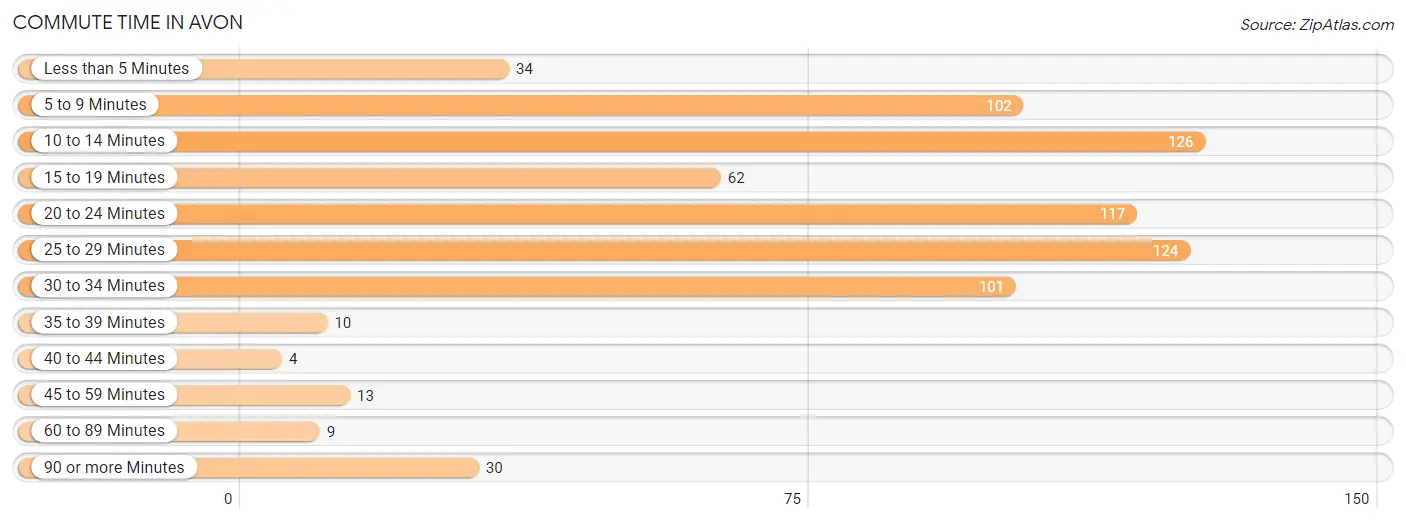
| Commute Time | # Commuters | % Commuters |
| Less than 5 Minutes | 34 | 4.6% |
| 5 to 9 Minutes | 102 | 13.9% |
| 10 to 14 Minutes | 126 | 17.2% |
| 15 to 19 Minutes | 62 | 8.5% |
| 20 to 24 Minutes | 117 | 16.0% |
| 25 to 29 Minutes | 124 | 16.9% |
| 30 to 34 Minutes | 101 | 13.8% |
| 35 to 39 Minutes | 10 | 1.4% |
| 40 to 44 Minutes | 4 | 0.5% |
| 45 to 59 Minutes | 13 | 1.8% |
| 60 to 89 Minutes | 9 | 1.2% |
| 90 or more Minutes | 30 | 4.1% |
Commute Time by Sex in Avon
The most common commute times in Avon are 10 to 14 minutes (86 commuters, 22.1%) for males and 25 to 29 minutes (74 commuters, 21.6%) for females.
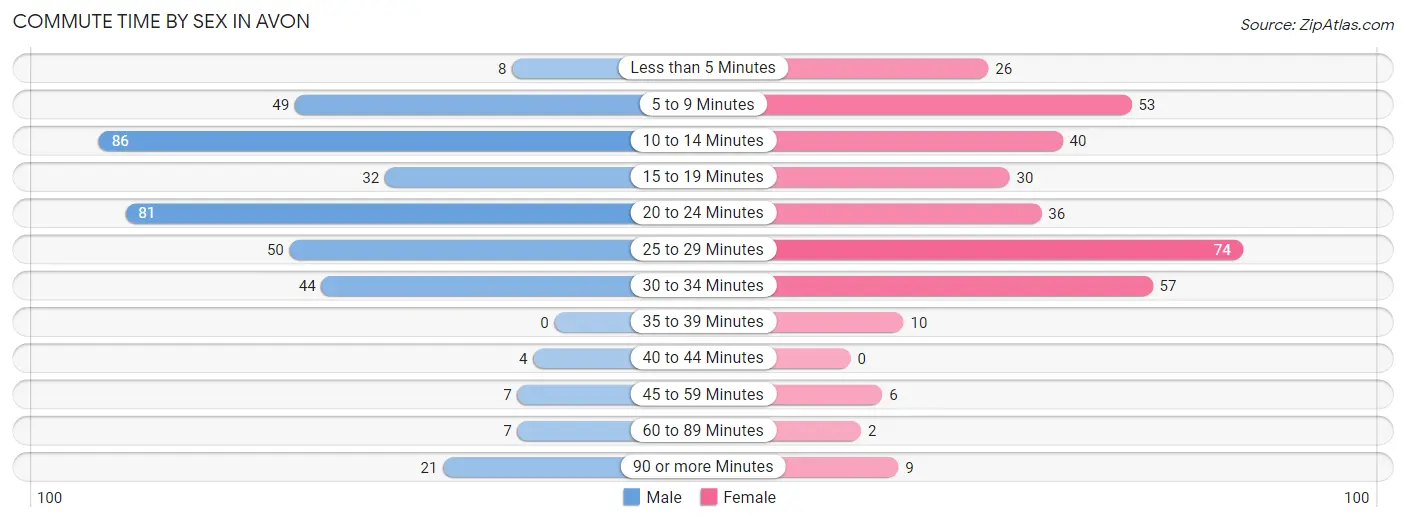
| Commute Time | Male | Female |
| Less than 5 Minutes | 8 (2.1%) | 26 (7.6%) |
| 5 to 9 Minutes | 49 (12.6%) | 53 (15.4%) |
| 10 to 14 Minutes | 86 (22.1%) | 40 (11.7%) |
| 15 to 19 Minutes | 32 (8.2%) | 30 (8.7%) |
| 20 to 24 Minutes | 81 (20.8%) | 36 (10.5%) |
| 25 to 29 Minutes | 50 (12.9%) | 74 (21.6%) |
| 30 to 34 Minutes | 44 (11.3%) | 57 (16.6%) |
| 35 to 39 Minutes | 0 (0.0%) | 10 (2.9%) |
| 40 to 44 Minutes | 4 (1.0%) | 0 (0.0%) |
| 45 to 59 Minutes | 7 (1.8%) | 6 (1.8%) |
| 60 to 89 Minutes | 7 (1.8%) | 2 (0.6%) |
| 90 or more Minutes | 21 (5.4%) | 9 (2.6%) |
Time of Departure to Work by Sex in Avon
The most frequent times of departure to work in Avon are 7:00 AM to 7:29 AM (72, 18.5%) for males and 7:00 AM to 7:29 AM (111, 32.4%) for females.
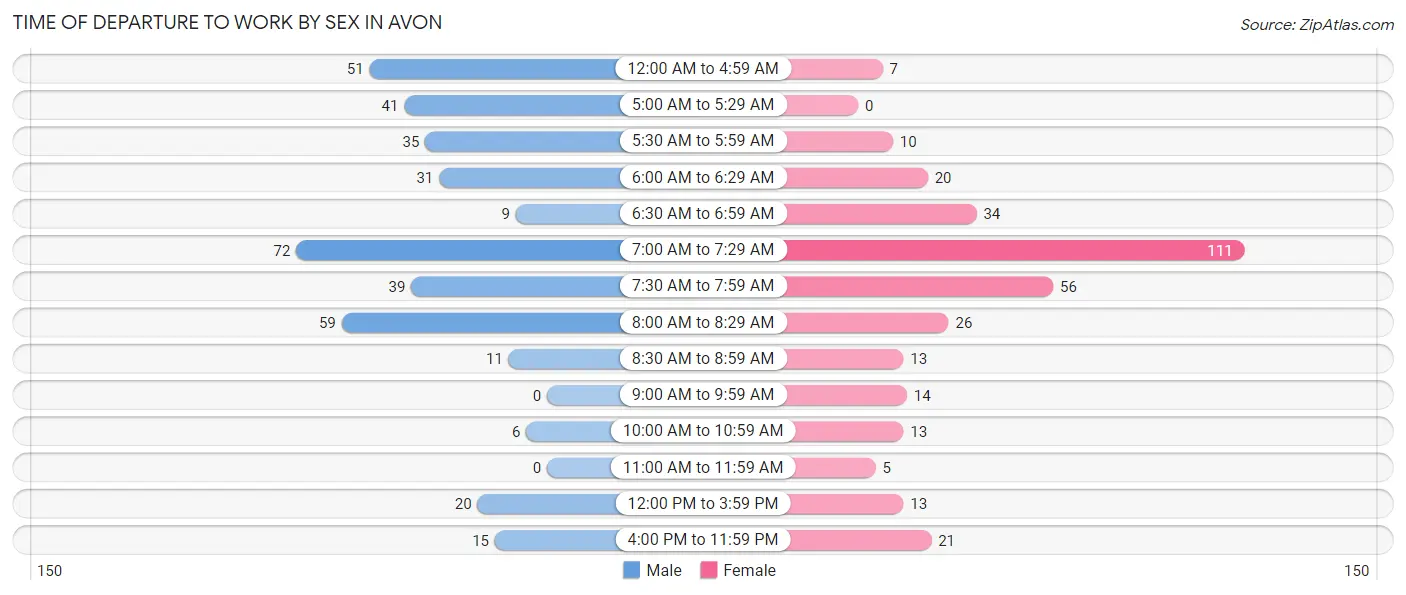
| Time of Departure | Male | Female |
| 12:00 AM to 4:59 AM | 51 (13.1%) | 7 (2.0%) |
| 5:00 AM to 5:29 AM | 41 (10.5%) | 0 (0.0%) |
| 5:30 AM to 5:59 AM | 35 (9.0%) | 10 (2.9%) |
| 6:00 AM to 6:29 AM | 31 (8.0%) | 20 (5.8%) |
| 6:30 AM to 6:59 AM | 9 (2.3%) | 34 (9.9%) |
| 7:00 AM to 7:29 AM | 72 (18.5%) | 111 (32.4%) |
| 7:30 AM to 7:59 AM | 39 (10.0%) | 56 (16.3%) |
| 8:00 AM to 8:29 AM | 59 (15.2%) | 26 (7.6%) |
| 8:30 AM to 8:59 AM | 11 (2.8%) | 13 (3.8%) |
| 9:00 AM to 9:59 AM | 0 (0.0%) | 14 (4.1%) |
| 10:00 AM to 10:59 AM | 6 (1.5%) | 13 (3.8%) |
| 11:00 AM to 11:59 AM | 0 (0.0%) | 5 (1.5%) |
| 12:00 PM to 3:59 PM | 20 (5.1%) | 13 (3.8%) |
| 4:00 PM to 11:59 PM | 15 (3.9%) | 21 (6.1%) |
| Total | 389 (100.0%) | 343 (100.0%) |
Housing Occupancy in Avon
Occupancy by Ownership in Avon
Of the total 573 dwellings in Avon, owner-occupied units account for 471 (82.2%), while renter-occupied units make up 102 (17.8%).
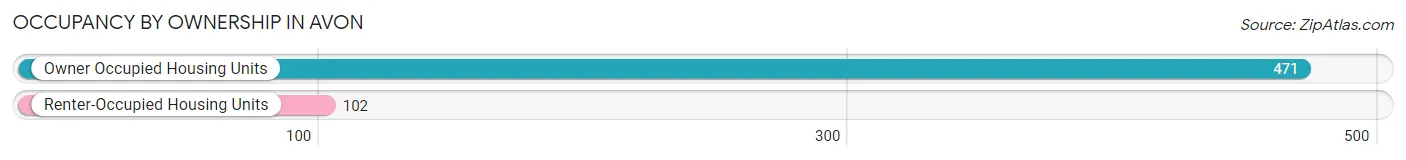
| Occupancy | # Housing Units | % Housing Units |
| Owner Occupied Housing Units | 471 | 82.2% |
| Renter-Occupied Housing Units | 102 | 17.8% |
| Total Occupied Housing Units | 573 | 100.0% |
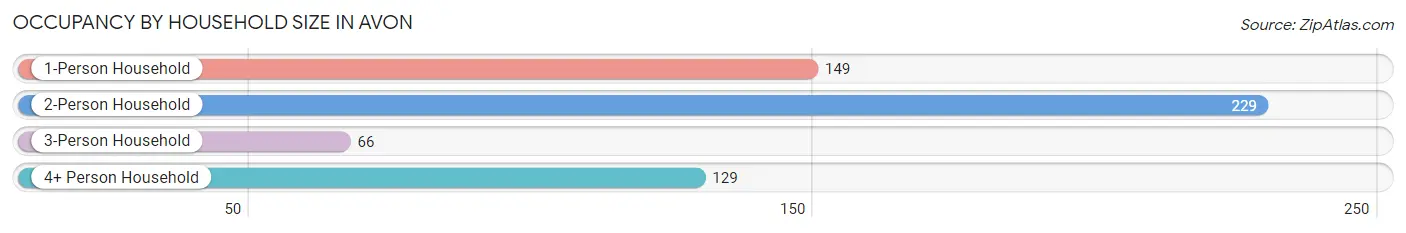
Occupancy by Household Size in Avon
| Household Size | # Housing Units | % Housing Units |
| 1-Person Household | 149 | 26.0% |
| 2-Person Household | 229 | 40.0% |
| 3-Person Household | 66 | 11.5% |
| 4+ Person Household | 129 | 22.5% |
| Total Housing Units | 573 | 100.0% |
Occupancy by Ownership by Household Size in Avon
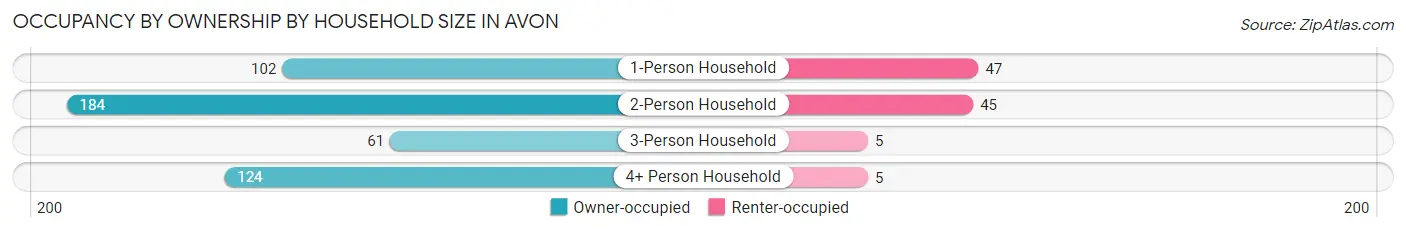
| Household Size | Owner-occupied | Renter-occupied |
| 1-Person Household | 102 (68.5%) | 47 (31.5%) |
| 2-Person Household | 184 (80.3%) | 45 (19.7%) |
| 3-Person Household | 61 (92.4%) | 5 (7.6%) |
| 4+ Person Household | 124 (96.1%) | 5 (3.9%) |
| Total Housing Units | 471 (82.2%) | 102 (17.8%) |
Occupancy by Educational Attainment in Avon
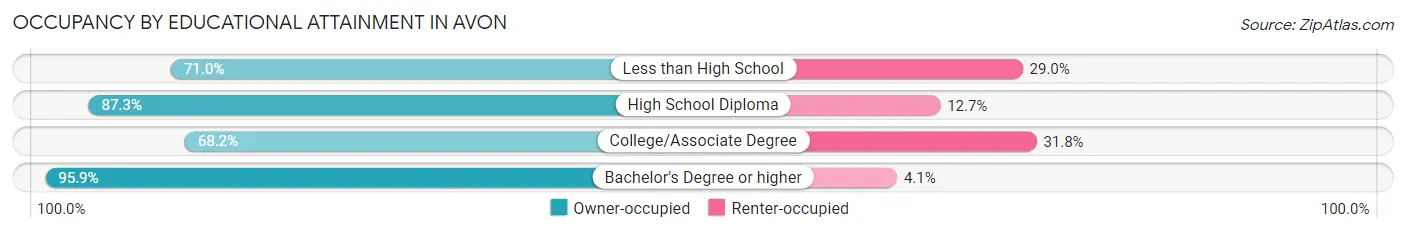
| Household Size | Owner-occupied | Renter-occupied |
| Less than High School | 22 (71.0%) | 9 (29.0%) |
| High School Diploma | 117 (87.3%) | 17 (12.7%) |
| College/Associate Degree | 146 (68.2%) | 68 (31.8%) |
| Bachelor's Degree or higher | 186 (95.9%) | 8 (4.1%) |
Occupancy by Age of Householder in Avon
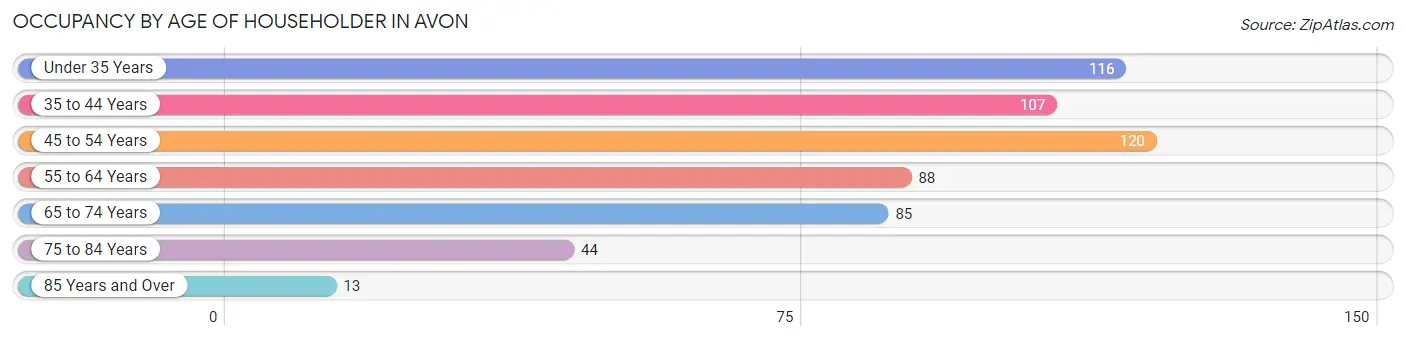
| Age Bracket | # Households | % Households |
| Under 35 Years | 116 | 20.2% |
| 35 to 44 Years | 107 | 18.7% |
| 45 to 54 Years | 120 | 20.9% |
| 55 to 64 Years | 88 | 15.4% |
| 65 to 74 Years | 85 | 14.8% |
| 75 to 84 Years | 44 | 7.7% |
| 85 Years and Over | 13 | 2.3% |
| Total | 573 | 100.0% |
Housing Finances in Avon
Median Income by Occupancy in Avon
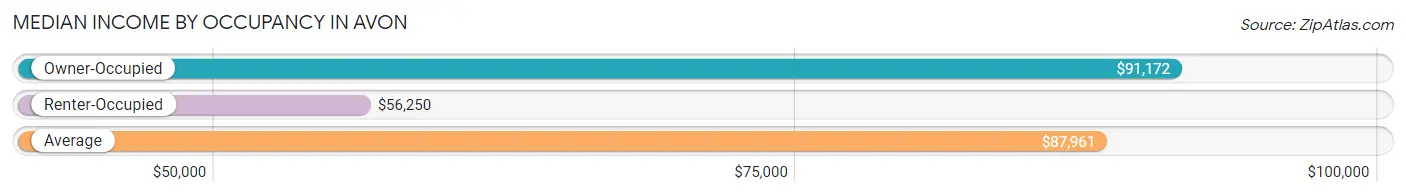
| Occupancy Type | # Households | Median Income |
| Owner-Occupied | 471 (82.2%) | $91,172 |
| Renter-Occupied | 102 (17.8%) | $56,250 |
| Average | 573 (100.0%) | $87,961 |
Occupancy by Householder Income Bracket in Avon
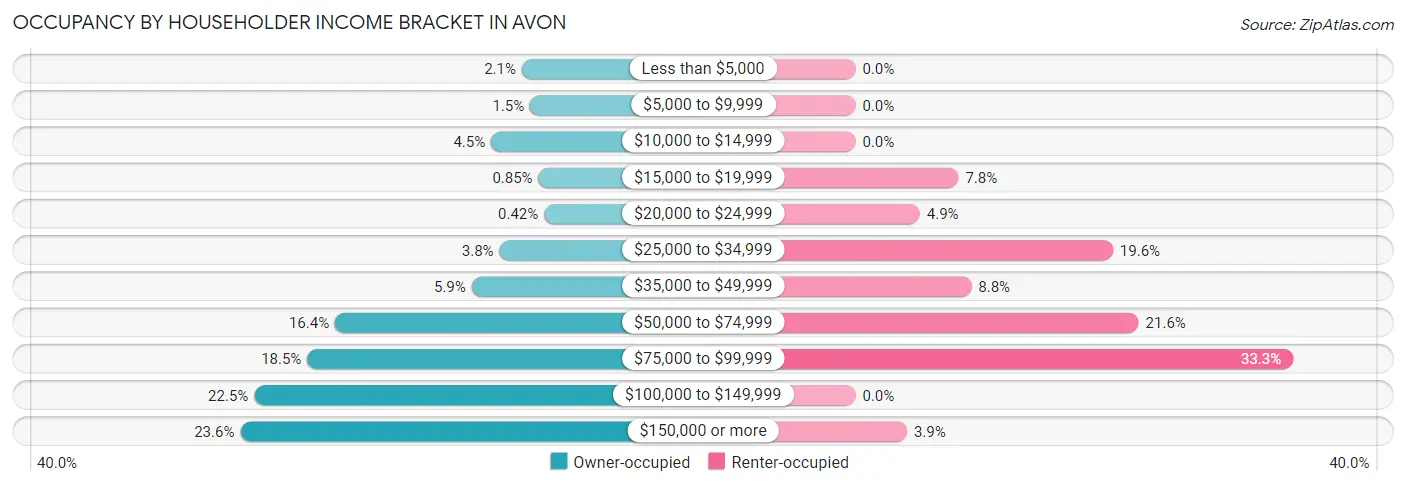
| Income Bracket | Owner-occupied | Renter-occupied |
| Less than $5,000 | 10 (2.1%) | 0 (0.0%) |
| $5,000 to $9,999 | 7 (1.5%) | 0 (0.0%) |
| $10,000 to $14,999 | 21 (4.5%) | 0 (0.0%) |
| $15,000 to $19,999 | 4 (0.9%) | 8 (7.8%) |
| $20,000 to $24,999 | 2 (0.4%) | 5 (4.9%) |
| $25,000 to $34,999 | 18 (3.8%) | 20 (19.6%) |
| $35,000 to $49,999 | 28 (5.9%) | 9 (8.8%) |
| $50,000 to $74,999 | 77 (16.4%) | 22 (21.6%) |
| $75,000 to $99,999 | 87 (18.5%) | 34 (33.3%) |
| $100,000 to $149,999 | 106 (22.5%) | 0 (0.0%) |
| $150,000 or more | 111 (23.6%) | 4 (3.9%) |
| Total | 471 (100.0%) | 102 (100.0%) |
Monthly Housing Cost Tiers in Avon
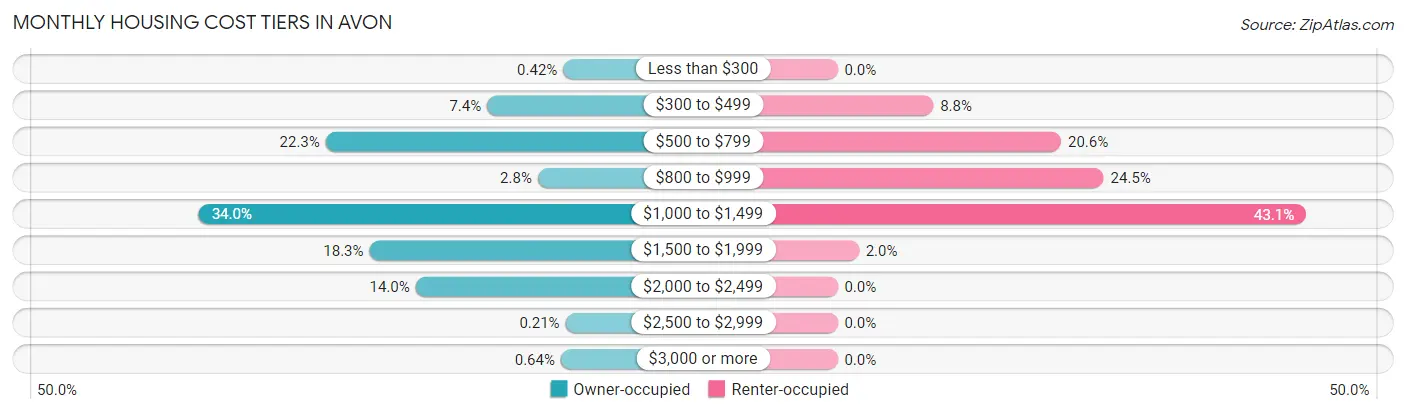
| Monthly Cost | Owner-occupied | Renter-occupied |
| Less than $300 | 2 (0.4%) | 0 (0.0%) |
| $300 to $499 | 35 (7.4%) | 9 (8.8%) |
| $500 to $799 | 105 (22.3%) | 21 (20.6%) |
| $800 to $999 | 13 (2.8%) | 25 (24.5%) |
| $1,000 to $1,499 | 160 (34.0%) | 44 (43.1%) |
| $1,500 to $1,999 | 86 (18.3%) | 2 (2.0%) |
| $2,000 to $2,499 | 66 (14.0%) | 0 (0.0%) |
| $2,500 to $2,999 | 1 (0.2%) | 0 (0.0%) |
| $3,000 or more | 3 (0.6%) | 0 (0.0%) |
| Total | 471 (100.0%) | 102 (100.0%) |
Physical Housing Characteristics in Avon
Housing Structures in Avon
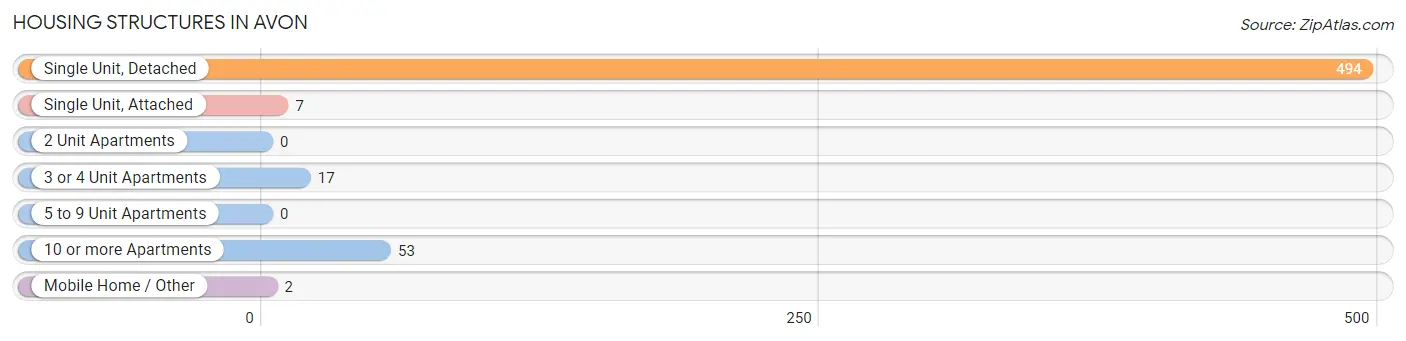
| Structure Type | # Housing Units | % Housing Units |
| Single Unit, Detached | 494 | 86.2% |
| Single Unit, Attached | 7 | 1.2% |
| 2 Unit Apartments | 0 | 0.0% |
| 3 or 4 Unit Apartments | 17 | 3.0% |
| 5 to 9 Unit Apartments | 0 | 0.0% |
| 10 or more Apartments | 53 | 9.2% |
| Mobile Home / Other | 2 | 0.4% |
| Total | 573 | 100.0% |
Housing Structures by Occupancy in Avon
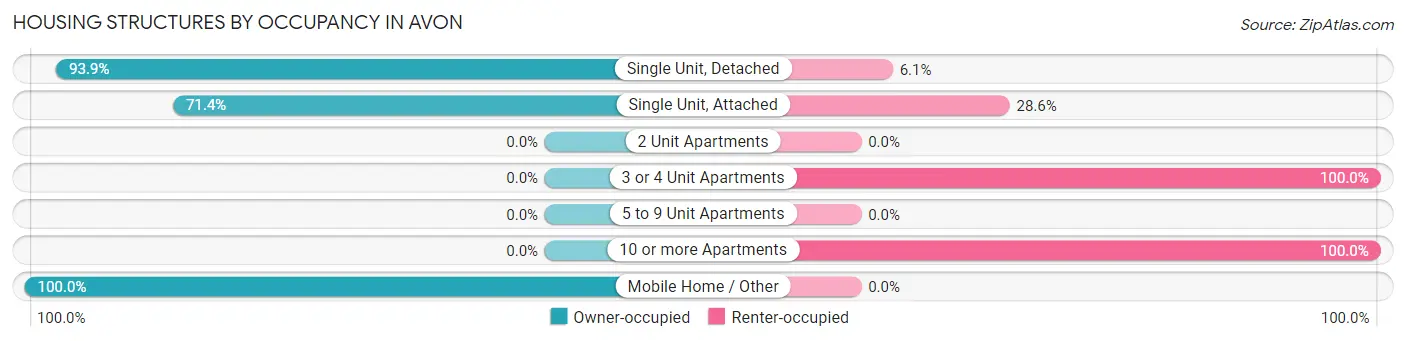
| Structure Type | Owner-occupied | Renter-occupied |
| Single Unit, Detached | 464 (93.9%) | 30 (6.1%) |
| Single Unit, Attached | 5 (71.4%) | 2 (28.6%) |
| 2 Unit Apartments | 0 (0.0%) | 0 (0.0%) |
| 3 or 4 Unit Apartments | 0 (0.0%) | 17 (100.0%) |
| 5 to 9 Unit Apartments | 0 (0.0%) | 0 (0.0%) |
| 10 or more Apartments | 0 (0.0%) | 53 (100.0%) |
| Mobile Home / Other | 2 (100.0%) | 0 (0.0%) |
| Total | 471 (82.2%) | 102 (17.8%) |
Housing Structures by Number of Rooms in Avon
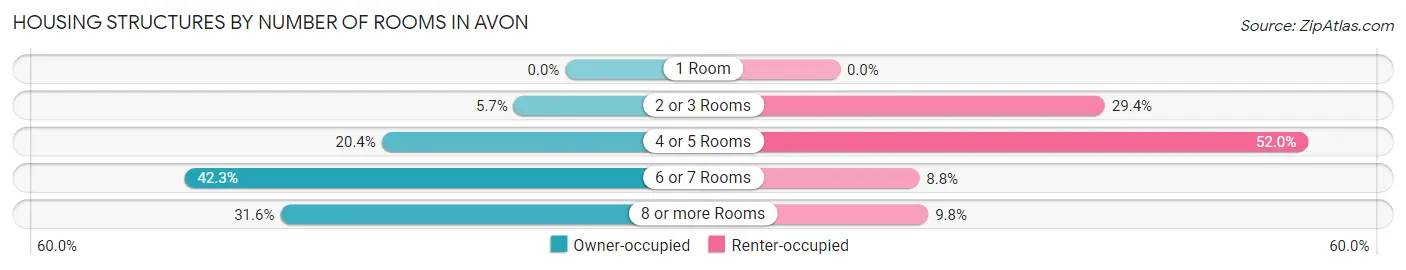
| Number of Rooms | Owner-occupied | Renter-occupied |
| 1 Room | 0 (0.0%) | 0 (0.0%) |
| 2 or 3 Rooms | 27 (5.7%) | 30 (29.4%) |
| 4 or 5 Rooms | 96 (20.4%) | 53 (52.0%) |
| 6 or 7 Rooms | 199 (42.2%) | 9 (8.8%) |
| 8 or more Rooms | 149 (31.6%) | 10 (9.8%) |
| Total | 471 (100.0%) | 102 (100.0%) |
Housing Structure by Heating Type in Avon
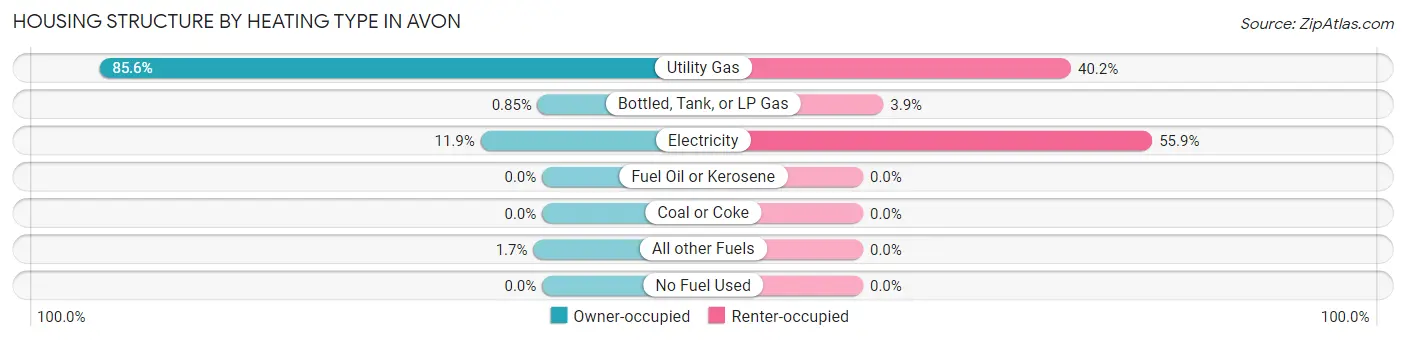
| Heating Type | Owner-occupied | Renter-occupied |
| Utility Gas | 403 (85.6%) | 41 (40.2%) |
| Bottled, Tank, or LP Gas | 4 (0.9%) | 4 (3.9%) |
| Electricity | 56 (11.9%) | 57 (55.9%) |
| Fuel Oil or Kerosene | 0 (0.0%) | 0 (0.0%) |
| Coal or Coke | 0 (0.0%) | 0 (0.0%) |
| All other Fuels | 8 (1.7%) | 0 (0.0%) |
| No Fuel Used | 0 (0.0%) | 0 (0.0%) |
| Total | 471 (100.0%) | 102 (100.0%) |
Household Vehicle Usage in Avon
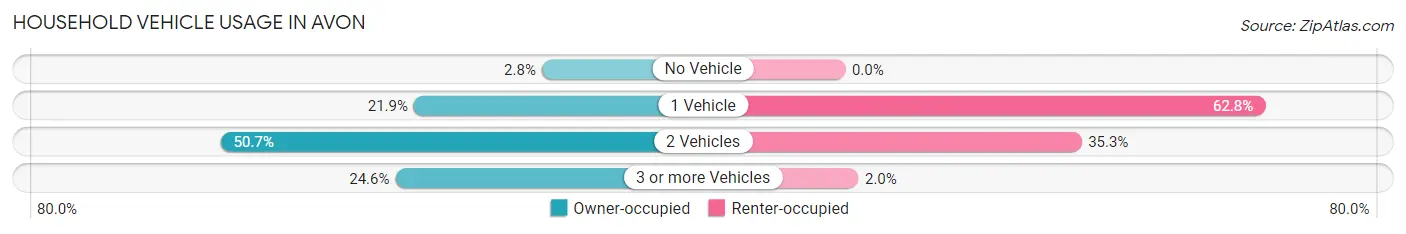
| Vehicles per Household | Owner-occupied | Renter-occupied |
| No Vehicle | 13 (2.8%) | 0 (0.0%) |
| 1 Vehicle | 103 (21.9%) | 64 (62.7%) |
| 2 Vehicles | 239 (50.7%) | 36 (35.3%) |
| 3 or more Vehicles | 116 (24.6%) | 2 (2.0%) |
| Total | 471 (100.0%) | 102 (100.0%) |
Real Estate & Mortgages in Avon
Real Estate and Mortgage Overview in Avon
| Characteristic | Without Mortgage | With Mortgage |
| Housing Units | 150 | 321 |
| Median Property Value | $213,500 | $213,400 |
| Median Household Income | $62,083 | $90 |
| Monthly Housing Costs | $619 | $3 |
| Real Estate Taxes | $2,842 | $3 |
Property Value by Mortgage Status in Avon
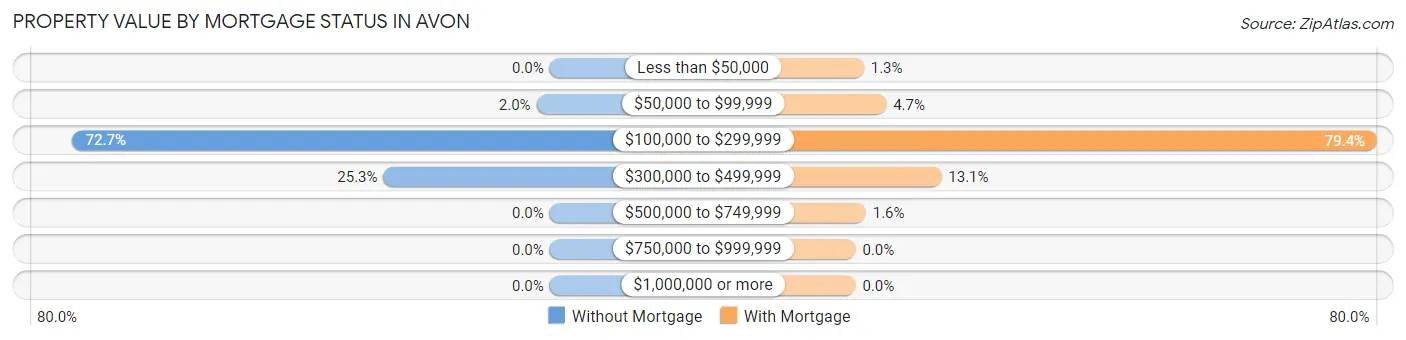
| Property Value | Without Mortgage | With Mortgage |
| Less than $50,000 | 0 (0.0%) | 4 (1.3%) |
| $50,000 to $99,999 | 3 (2.0%) | 15 (4.7%) |
| $100,000 to $299,999 | 109 (72.7%) | 255 (79.4%) |
| $300,000 to $499,999 | 38 (25.3%) | 42 (13.1%) |
| $500,000 to $749,999 | 0 (0.0%) | 5 (1.6%) |
| $750,000 to $999,999 | 0 (0.0%) | 0 (0.0%) |
| $1,000,000 or more | 0 (0.0%) | 0 (0.0%) |
| Total | 150 (100.0%) | 321 (100.0%) |
Household Income by Mortgage Status in Avon
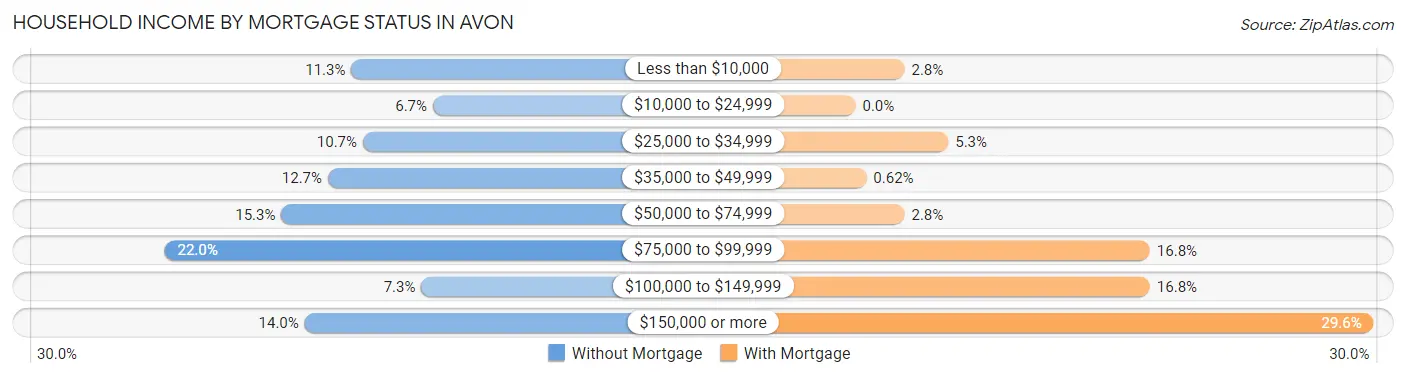
| Household Income | Without Mortgage | With Mortgage |
| Less than $10,000 | 17 (11.3%) | 9 (2.8%) |
| $10,000 to $24,999 | 10 (6.7%) | 0 (0.0%) |
| $25,000 to $34,999 | 16 (10.7%) | 17 (5.3%) |
| $35,000 to $49,999 | 19 (12.7%) | 2 (0.6%) |
| $50,000 to $74,999 | 23 (15.3%) | 9 (2.8%) |
| $75,000 to $99,999 | 33 (22.0%) | 54 (16.8%) |
| $100,000 to $149,999 | 11 (7.3%) | 54 (16.8%) |
| $150,000 or more | 21 (14.0%) | 95 (29.6%) |
| Total | 150 (100.0%) | 321 (100.0%) |
Property Value to Household Income Ratio in Avon
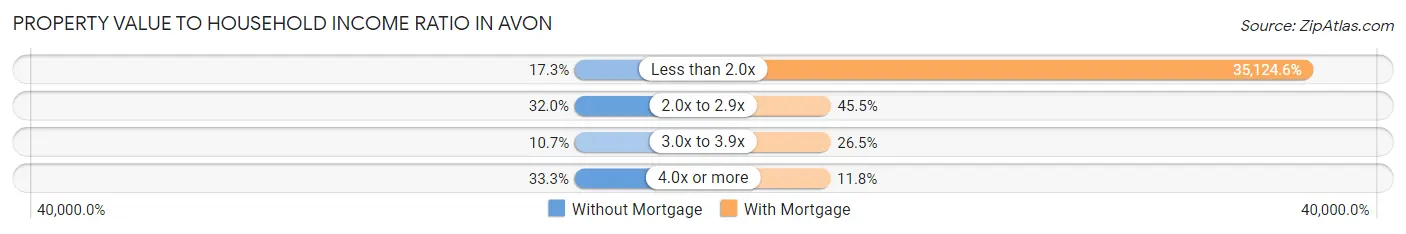
| Value-to-Income Ratio | Without Mortgage | With Mortgage |
| Less than 2.0x | 26 (17.3%) | 112,750 (35,124.6%) |
| 2.0x to 2.9x | 48 (32.0%) | 146 (45.5%) |
| 3.0x to 3.9x | 16 (10.7%) | 85 (26.5%) |
| 4.0x or more | 50 (33.3%) | 38 (11.8%) |
| Total | 150 (100.0%) | 321 (100.0%) |
Real Estate Taxes by Mortgage Status in Avon
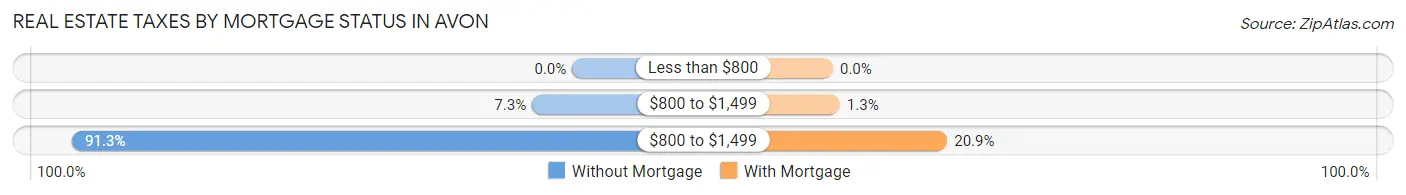
| Property Taxes | Without Mortgage | With Mortgage |
| Less than $800 | 0 (0.0%) | 0 (0.0%) |
| $800 to $1,499 | 11 (7.3%) | 4 (1.3%) |
| $800 to $1,499 | 137 (91.3%) | 67 (20.9%) |
| Total | 150 (100.0%) | 321 (100.0%) |
Health & Disability in Avon
Health Insurance Coverage by Age in Avon
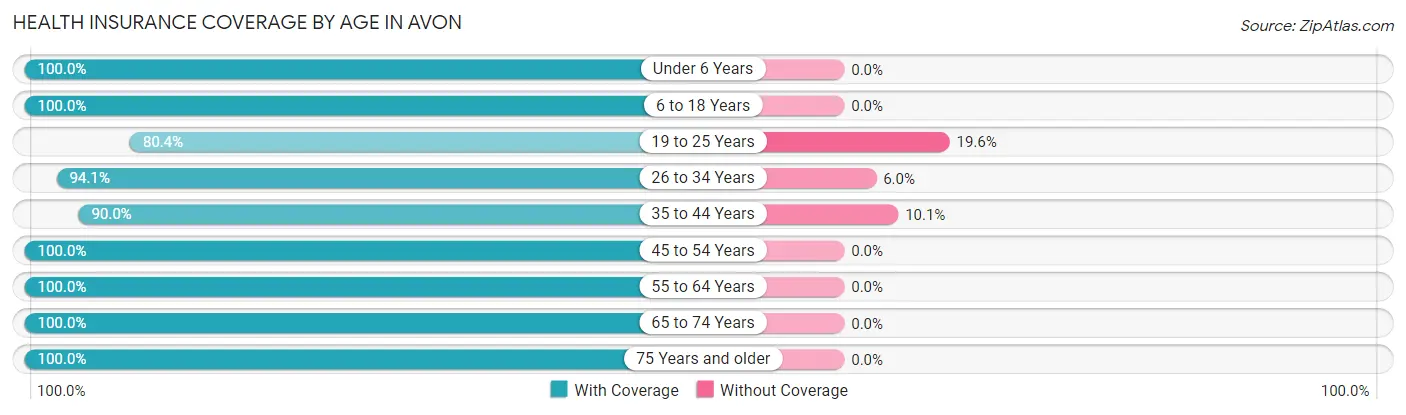
| Age Bracket | With Coverage | Without Coverage |
| Under 6 Years | 105 (100.0%) | 0 (0.0%) |
| 6 to 18 Years | 252 (100.0%) | 0 (0.0%) |
| 19 to 25 Years | 86 (80.4%) | 21 (19.6%) |
| 26 to 34 Years | 158 (94.1%) | 10 (5.9%) |
| 35 to 44 Years | 197 (89.9%) | 22 (10.1%) |
| 45 to 54 Years | 183 (100.0%) | 0 (0.0%) |
| 55 to 64 Years | 148 (100.0%) | 0 (0.0%) |
| 65 to 74 Years | 143 (100.0%) | 0 (0.0%) |
| 75 Years and older | 81 (100.0%) | 0 (0.0%) |
| Total | 1,353 (96.2%) | 53 (3.8%) |
Health Insurance Coverage by Citizenship Status in Avon
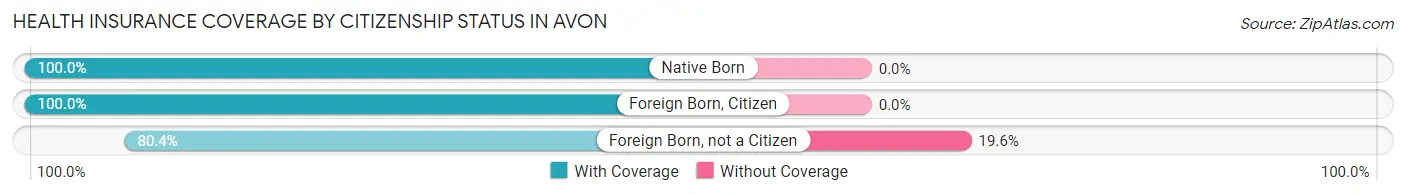
| Citizenship Status | With Coverage | Without Coverage |
| Native Born | 105 (100.0%) | 0 (0.0%) |
| Foreign Born, Citizen | 252 (100.0%) | 0 (0.0%) |
| Foreign Born, not a Citizen | 86 (80.4%) | 21 (19.6%) |
Health Insurance Coverage by Household Income in Avon
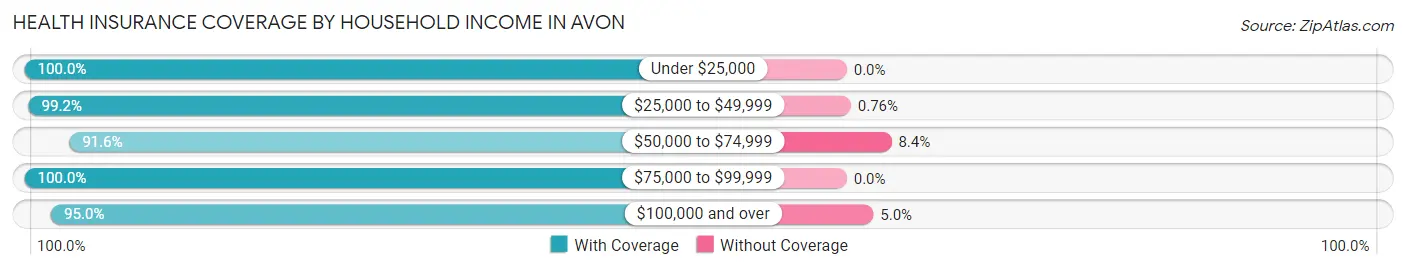
| Household Income | With Coverage | Without Coverage |
| Under $25,000 | 81 (100.0%) | 0 (0.0%) |
| $25,000 to $49,999 | 130 (99.2%) | 1 (0.8%) |
| $50,000 to $74,999 | 186 (91.6%) | 17 (8.4%) |
| $75,000 to $99,999 | 287 (100.0%) | 0 (0.0%) |
| $100,000 and over | 669 (95.0%) | 35 (5.0%) |
Public vs Private Health Insurance Coverage by Age in Avon
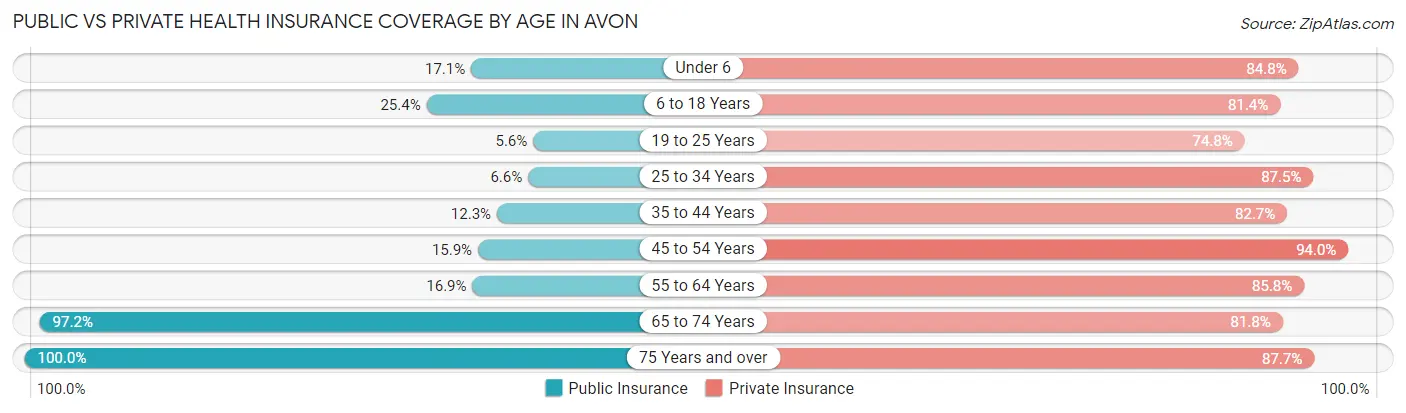
| Age Bracket | Public Insurance | Private Insurance |
| Under 6 | 18 (17.1%) | 89 (84.8%) |
| 6 to 18 Years | 64 (25.4%) | 205 (81.4%) |
| 19 to 25 Years | 6 (5.6%) | 80 (74.8%) |
| 25 to 34 Years | 11 (6.6%) | 147 (87.5%) |
| 35 to 44 Years | 27 (12.3%) | 181 (82.7%) |
| 45 to 54 Years | 29 (15.9%) | 172 (94.0%) |
| 55 to 64 Years | 25 (16.9%) | 127 (85.8%) |
| 65 to 74 Years | 139 (97.2%) | 117 (81.8%) |
| 75 Years and over | 81 (100.0%) | 71 (87.6%) |
| Total | 400 (28.4%) | 1,189 (84.6%) |
Disability Status by Sex by Age in Avon
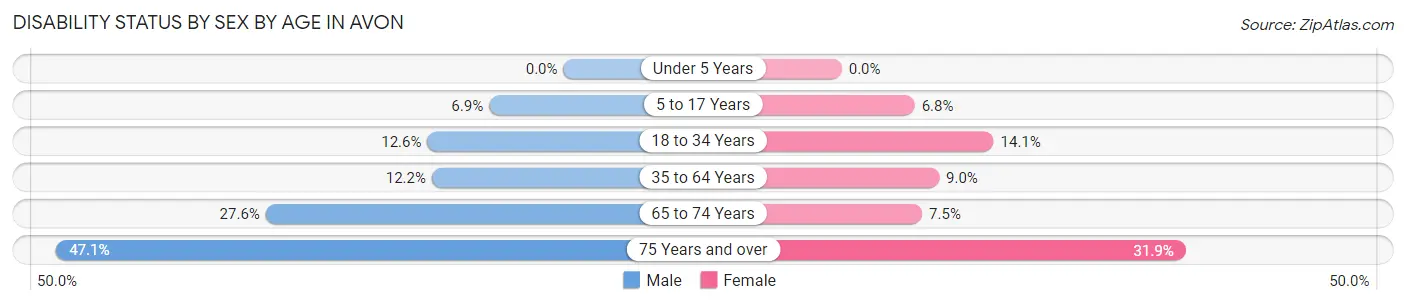
| Age Bracket | Male | Female |
| Under 5 Years | 0 (0.0%) | 0 (0.0%) |
| 5 to 17 Years | 6 (6.9%) | 9 (6.8%) |
| 18 to 34 Years | 24 (12.6%) | 21 (14.1%) |
| 35 to 64 Years | 32 (12.2%) | 26 (9.0%) |
| 65 to 74 Years | 21 (27.6%) | 5 (7.5%) |
| 75 Years and over | 16 (47.1%) | 15 (31.9%) |
Disability Class by Sex by Age in Avon
Disability Class: Hearing Difficulty
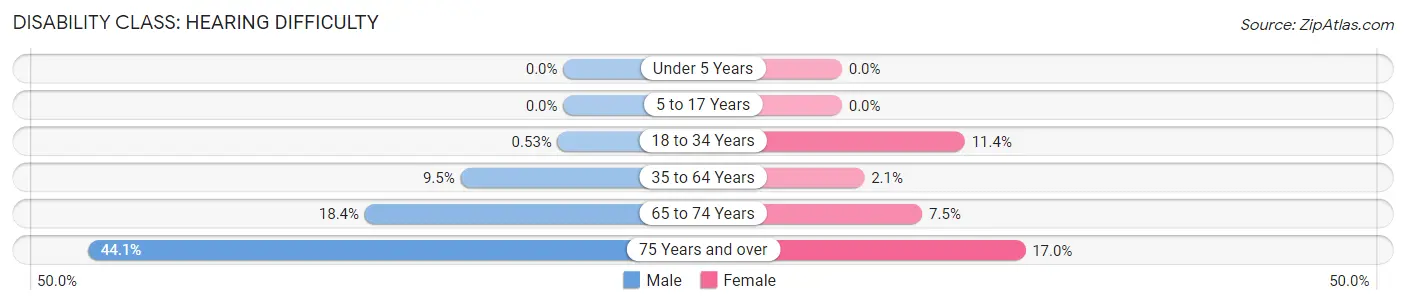
| Age Bracket | Male | Female |
| Under 5 Years | 0 (0.0%) | 0 (0.0%) |
| 5 to 17 Years | 0 (0.0%) | 0 (0.0%) |
| 18 to 34 Years | 1 (0.5%) | 17 (11.4%) |
| 35 to 64 Years | 25 (9.5%) | 6 (2.1%) |
| 65 to 74 Years | 14 (18.4%) | 5 (7.5%) |
| 75 Years and over | 15 (44.1%) | 8 (17.0%) |
Disability Class: Vision Difficulty
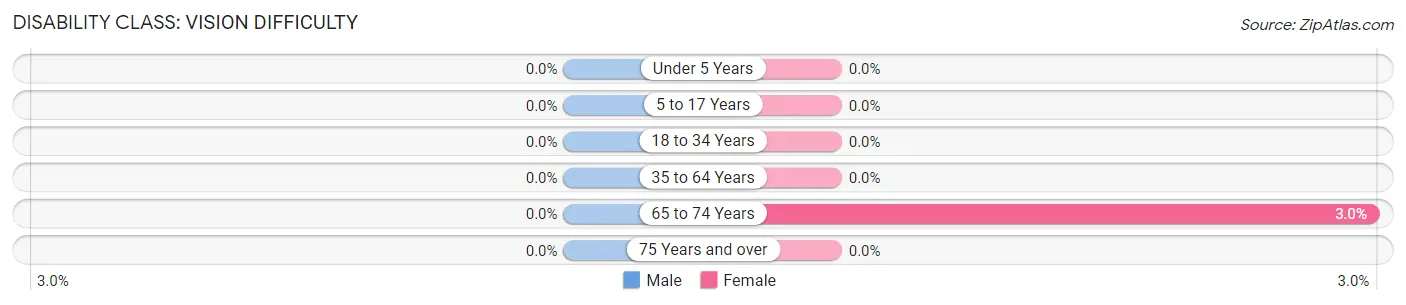
| Age Bracket | Male | Female |
| Under 5 Years | 0 (0.0%) | 0 (0.0%) |
| 5 to 17 Years | 0 (0.0%) | 0 (0.0%) |
| 18 to 34 Years | 0 (0.0%) | 0 (0.0%) |
| 35 to 64 Years | 0 (0.0%) | 0 (0.0%) |
| 65 to 74 Years | 0 (0.0%) | 2 (3.0%) |
| 75 Years and over | 0 (0.0%) | 0 (0.0%) |
Disability Class: Cognitive Difficulty
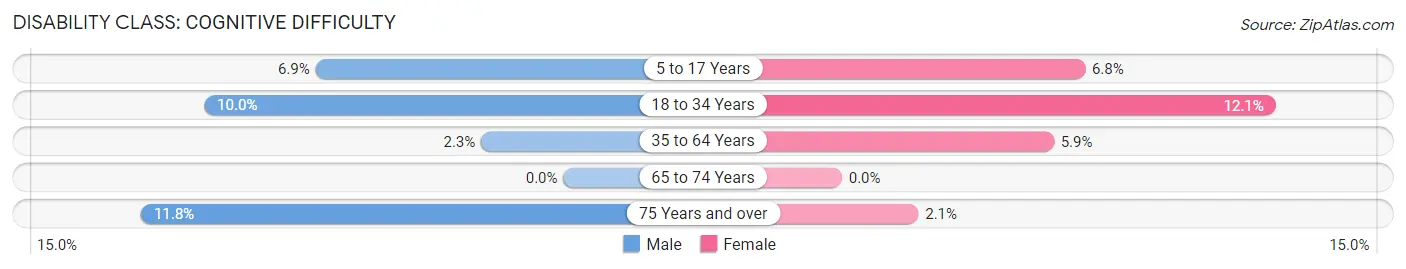
| Age Bracket | Male | Female |
| 5 to 17 Years | 6 (6.9%) | 9 (6.8%) |
| 18 to 34 Years | 19 (10.0%) | 18 (12.1%) |
| 35 to 64 Years | 6 (2.3%) | 17 (5.9%) |
| 65 to 74 Years | 0 (0.0%) | 0 (0.0%) |
| 75 Years and over | 4 (11.8%) | 1 (2.1%) |
Disability Class: Ambulatory Difficulty
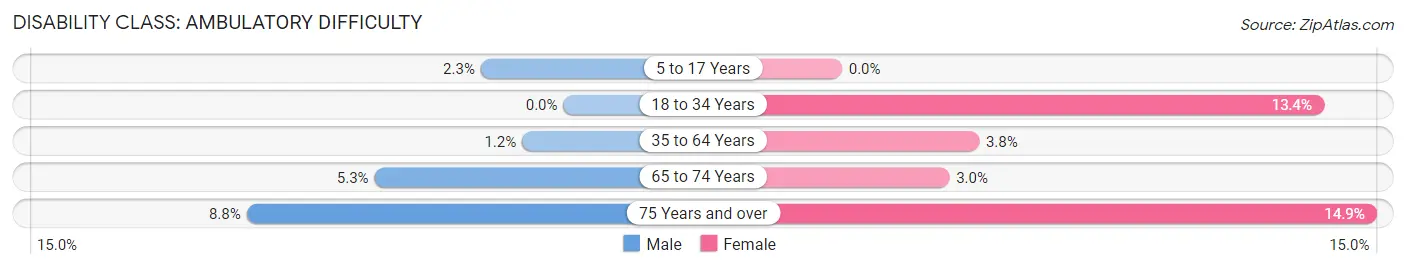
| Age Bracket | Male | Female |
| 5 to 17 Years | 2 (2.3%) | 0 (0.0%) |
| 18 to 34 Years | 0 (0.0%) | 20 (13.4%) |
| 35 to 64 Years | 3 (1.1%) | 11 (3.8%) |
| 65 to 74 Years | 4 (5.3%) | 2 (3.0%) |
| 75 Years and over | 3 (8.8%) | 7 (14.9%) |
Disability Class: Self-Care Difficulty
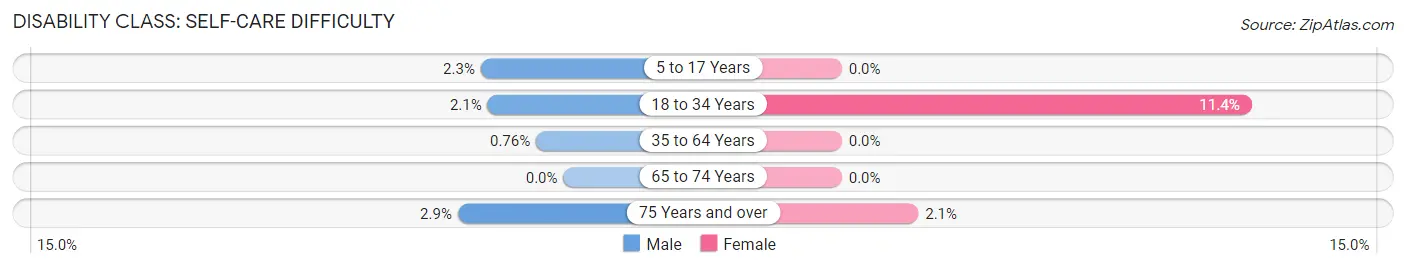
| Age Bracket | Male | Female |
| 5 to 17 Years | 2 (2.3%) | 0 (0.0%) |
| 18 to 34 Years | 4 (2.1%) | 17 (11.4%) |
| 35 to 64 Years | 2 (0.8%) | 0 (0.0%) |
| 65 to 74 Years | 0 (0.0%) | 0 (0.0%) |
| 75 Years and over | 1 (2.9%) | 1 (2.1%) |
Technology Access in Avon
Computing Device Access in Avon
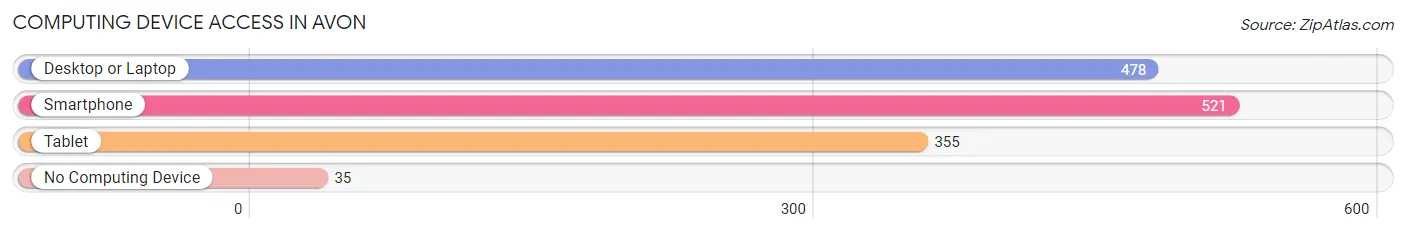
| Device Type | # Households | % Households |
| Desktop or Laptop | 478 | 83.4% |
| Smartphone | 521 | 90.9% |
| Tablet | 355 | 62.0% |
| No Computing Device | 35 | 6.1% |
| Total | 573 | 100.0% |
Internet Access in Avon
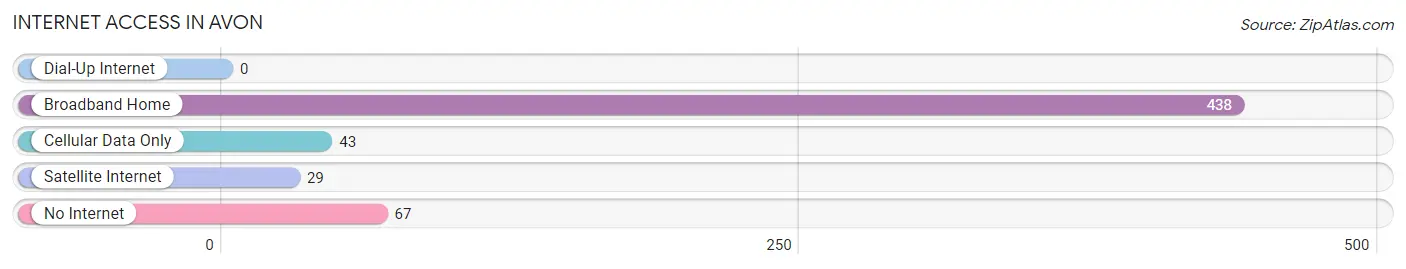
| Internet Type | # Households | % Households |
| Dial-Up Internet | 0 | 0.0% |
| Broadband Home | 438 | 76.4% |
| Cellular Data Only | 43 | 7.5% |
| Satellite Internet | 29 | 5.1% |
| No Internet | 67 | 11.7% |
| Total | 573 | 100.0% |
Avon Summary
Avon, Minnesota is a small city located in Stearns County, Minnesota, United States. It is situated on the banks of the Sauk River, approximately 25 miles northwest of St. Cloud. The city was founded in 1856 and incorporated in 1887. As of the 2010 census, the population of Avon was 2,436.
History
Avon was founded in 1856 by a group of settlers from Germany. The settlers were attracted to the area by the abundance of timber and the Sauk River, which provided a convenient means of transportation. The town was originally named “New Munich” after the city of Munich in Germany. In 1887, the town was renamed Avon after the Avon River in England.
Avon was an important stop on the Great Northern Railway, which ran through the city from 1887 to 1971. The railway provided a convenient means of transportation for the town’s residents and allowed them to easily access the larger cities of St. Cloud and Minneapolis.
Geography
Avon is located in Stearns County, Minnesota, approximately 25 miles northwest of St. Cloud. The city is situated on the banks of the Sauk River, which flows through the city and provides a convenient means of transportation. The city is surrounded by rolling hills and is located in the Central Lakes region of Minnesota.
The city has a total area of 2.2 square miles, all of which is land. The average elevation of the city is 1,072 feet above sea level.
Economy
Avon’s economy is largely based on agriculture and tourism. The city is home to several farms, which produce a variety of crops, including corn, soybeans, and wheat. The city is also home to several small businesses, including restaurants, retail stores, and service providers.
Avon is also a popular tourist destination. The city is home to several parks, including Avon City Park, which features a playground, picnic area, and walking trails. The city is also home to several historic sites, including the Avon Historical Society Museum, which houses artifacts from the city’s past.
Demographics
As of the 2010 census, the population of Avon was 2,436. The racial makeup of the city was 97.2% White, 0.3% African American, 0.3% Native American, 0.4% Asian, 0.1% Pacific Islander, 0.7% from other races, and 0.9% from two or more races. Hispanic or Latino of any race were 1.7% of the population.
The median income for a household in the city was $45,938, and the median income for a family was $51,964. The per capita income for the city was $20,945. About 5.2% of families and 6.7% of the population were below the poverty line, including 8.2% of those under age 18 and 6.2% of those age 65 or over.
Common Questions
What is Per Capita Income in Avon?
Per Capita income in Avon is $42,306.
What is the Median Family Income in Avon?
Median Family Income in Avon is $92,143.
What is the Median Household income in Avon?
Median Household Income in Avon is $87,961.
What is Income or Wage Gap in Avon?
Income or Wage Gap in Avon is 25.7%.
Women in Avon earn 74.3 cents for every dollar earned by a man.
What is Inequality or Gini Index in Avon?
Inequality or Gini Index in Avon is 0.37.
What is the Total Population of Avon?
Total Population of Avon is 1,410.
What is the Total Male Population of Avon?
Total Male Population of Avon is 694.
What is the Total Female Population of Avon?
Total Female Population of Avon is 716.
What is the Ratio of Males per 100 Females in Avon?
There are 96.93 Males per 100 Females in Avon.
What is the Ratio of Females per 100 Males in Avon?
There are 103.17 Females per 100 Males in Avon.
What is the Median Population Age in Avon?
Median Population Age in Avon is 37.5 Years.
What is the Average Family Size in Avon
Average Family Size in Avon is 2.9 People.
What is the Average Household Size in Avon
Average Household Size in Avon is 2.5 People.
How Large is the Labor Force in Avon?
There are 816 People in the Labor Forcein in Avon.
What is the Percentage of People in the Labor Force in Avon?
71.0% of People are in the Labor Force in Avon.
What is the Unemployment Rate in Avon?
Unemployment Rate in Avon is 2.7%.