Aurora, MN Map & Demographics
Aurora Map
Aurora Overview
$28,052
PER CAPITA INCOME
$58,750
AVG FAMILY INCOME
$39,500
AVG HOUSEHOLD INCOME
18.6%
WAGE / INCOME GAP [ % ]
81.4¢/ $1
WAGE / INCOME GAP [ $ ]
0.44
INEQUALITY / GINI INDEX
1,775
TOTAL POPULATION
908
MALE POPULATION
867
FEMALE POPULATION
104.73
MALES / 100 FEMALES
95.48
FEMALES / 100 MALES
54.0
MEDIAN AGE
2.7
AVG FAMILY SIZE
1.9
AVG HOUSEHOLD SIZE
568
LABOR FORCE [ PEOPLE ]
38.8%
PERCENT IN LABOR FORCE
6.9%
UNEMPLOYMENT RATE
Aurora Zip Codes
Aurora Area Codes
Income in Aurora
Income Overview in Aurora
Per Capita Income in Aurora is $28,052, while median incomes of families and households are $58,750 and $39,500 respectively.
| Characteristic | Number | Measure |
| Per Capita Income | 1,775 | $28,052 |
| Median Family Income | 396 | $58,750 |
| Mean Family Income | 396 | $69,296 |
| Median Household Income | 912 | $39,500 |
| Mean Household Income | 912 | $52,996 |
| Income Deficit | 396 | $0 |
| Wage / Income Gap (%) | 1,775 | 18.61% |
| Wage / Income Gap ($) | 1,775 | 81.39¢ per $1 |
| Gini / Inequality Index | 1,775 | 0.44 |
Earnings by Sex in Aurora
Average Earnings in Aurora are $36,550, $40,588 for men and $33,036 for women, a difference of 18.6%.
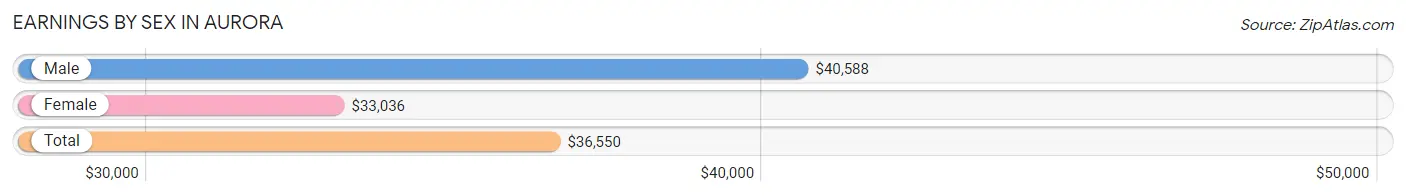
| Sex | Number | Average Earnings |
| Male | 344 (56.7%) | $40,588 |
| Female | 263 (43.3%) | $33,036 |
| Total | 607 (100.0%) | $36,550 |
Earnings by Sex by Income Bracket in Aurora
The most common earnings brackets in Aurora are $100,000+ for men (44 | 12.8%) and $55,000 to $64,999 for women (32 | 12.2%).
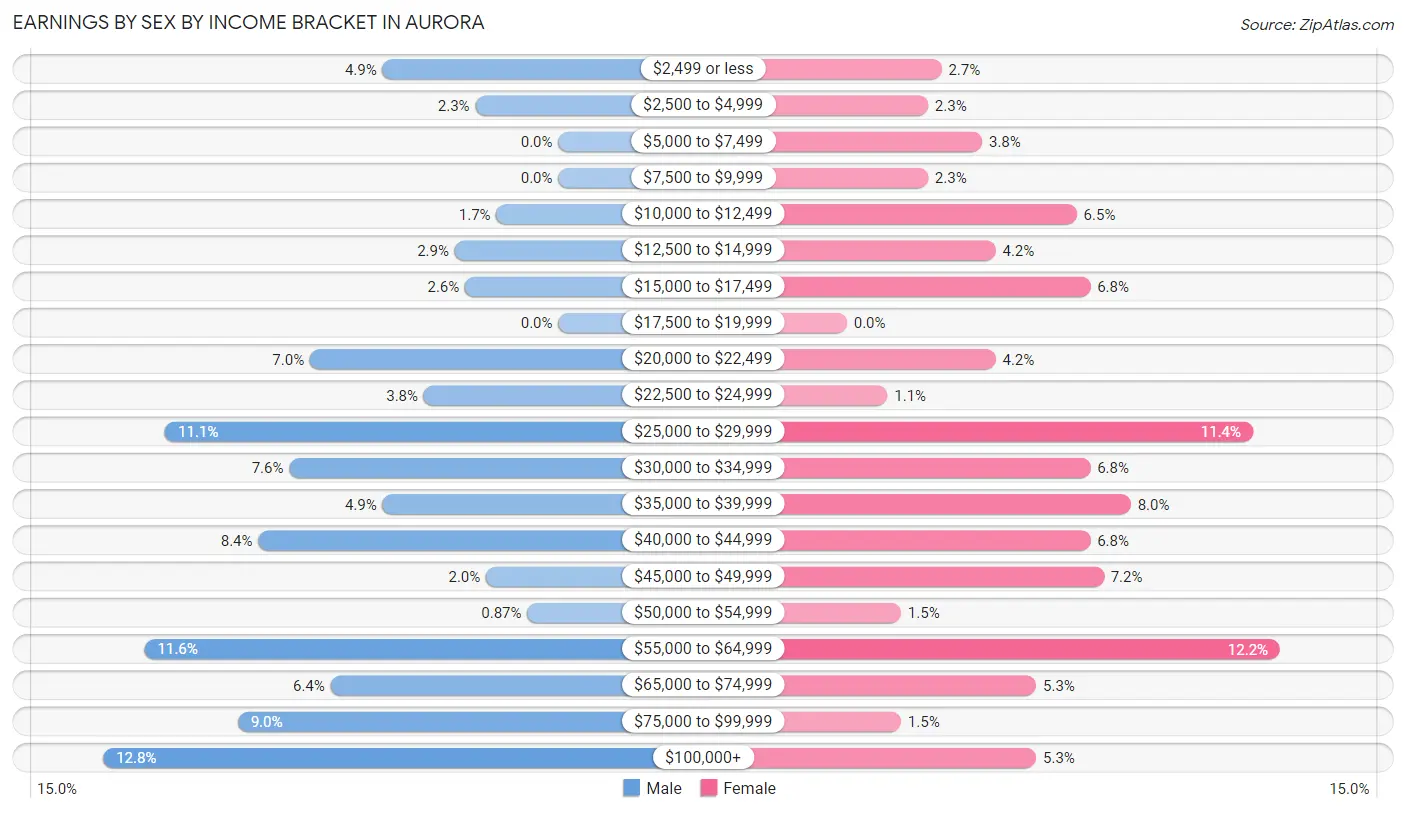
| Income | Male | Female |
| $2,499 or less | 17 (4.9%) | 7 (2.7%) |
| $2,500 to $4,999 | 8 (2.3%) | 6 (2.3%) |
| $5,000 to $7,499 | 0 (0.0%) | 10 (3.8%) |
| $7,500 to $9,999 | 0 (0.0%) | 6 (2.3%) |
| $10,000 to $12,499 | 6 (1.7%) | 17 (6.5%) |
| $12,500 to $14,999 | 10 (2.9%) | 11 (4.2%) |
| $15,000 to $17,499 | 9 (2.6%) | 18 (6.8%) |
| $17,500 to $19,999 | 0 (0.0%) | 0 (0.0%) |
| $20,000 to $22,499 | 24 (7.0%) | 11 (4.2%) |
| $22,500 to $24,999 | 13 (3.8%) | 3 (1.1%) |
| $25,000 to $29,999 | 38 (11.1%) | 30 (11.4%) |
| $30,000 to $34,999 | 26 (7.6%) | 18 (6.8%) |
| $35,000 to $39,999 | 17 (4.9%) | 21 (8.0%) |
| $40,000 to $44,999 | 29 (8.4%) | 18 (6.8%) |
| $45,000 to $49,999 | 7 (2.0%) | 19 (7.2%) |
| $50,000 to $54,999 | 3 (0.9%) | 4 (1.5%) |
| $55,000 to $64,999 | 40 (11.6%) | 32 (12.2%) |
| $65,000 to $74,999 | 22 (6.4%) | 14 (5.3%) |
| $75,000 to $99,999 | 31 (9.0%) | 4 (1.5%) |
| $100,000+ | 44 (12.8%) | 14 (5.3%) |
| Total | 344 (100.0%) | 263 (100.0%) |
Earnings by Sex by Educational Attainment in Aurora
Average earnings in Aurora are $41,765 for men and $35,395 for women, a difference of 15.2%. Men with an educational attainment of bachelor's degree enjoy the highest average annual earnings of $56,667, while those with high school diploma education earn the least with $32,083. Women with an educational attainment of bachelor's degree earn the most with the average annual earnings of $47,917, while those with high school diploma education have the smallest earnings of $30,795.
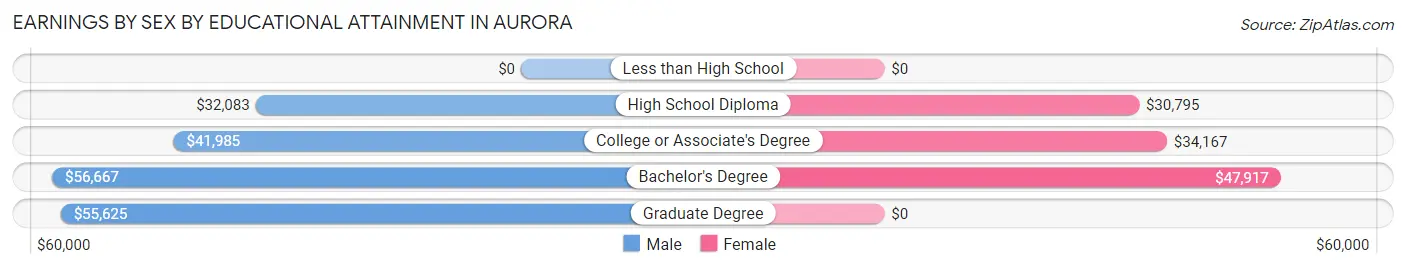
| Educational Attainment | Male Income | Female Income |
| Less than High School | - | - |
| High School Diploma | $32,083 | $30,795 |
| College or Associate's Degree | $41,985 | $34,167 |
| Bachelor's Degree | $56,667 | $47,917 |
| Graduate Degree | $55,625 | $0 |
| Total | $41,765 | $35,395 |
Family Income in Aurora
Family Income Brackets in Aurora
According to the Aurora family income data, there are 87 families falling into the $50,000 to $74,999 income range, which is the most common income bracket and makes up 22.0% of all families. Conversely, the $200,000+ income bracket is the least frequent group with only 3 families (0.8%) belonging to this category.
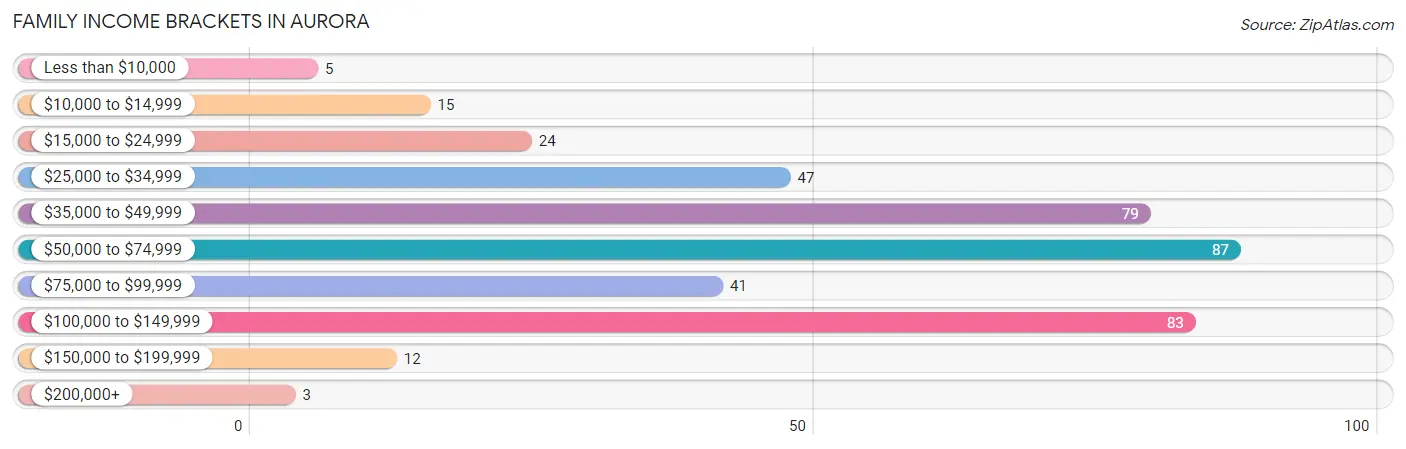
| Income Bracket | # Families | % Families |
| Less than $10,000 | 5 | 1.3% |
| $10,000 to $14,999 | 15 | 3.8% |
| $15,000 to $24,999 | 24 | 6.1% |
| $25,000 to $34,999 | 47 | 11.9% |
| $35,000 to $49,999 | 79 | 19.9% |
| $50,000 to $74,999 | 87 | 22.0% |
| $75,000 to $99,999 | 41 | 10.4% |
| $100,000 to $149,999 | 83 | 21.0% |
| $150,000 to $199,999 | 12 | 3.0% |
| $200,000+ | 3 | 0.8% |
Family Income by Famaliy Size in Aurora
4-person families (43 | 10.9%) account for the highest median family income in Aurora with $104,063 per family, while 2-person families (228 | 57.6%) have the highest median income of $29,166 per family member.
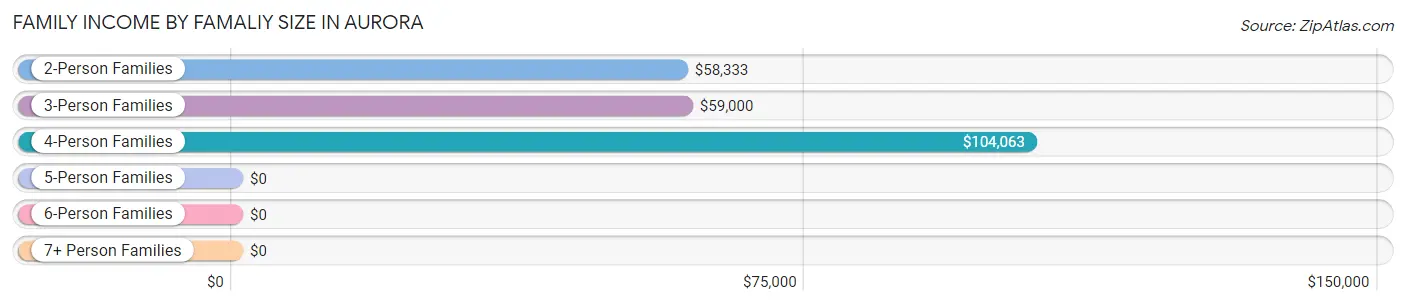
| Income Bracket | # Families | Median Income |
| 2-Person Families | 228 (57.6%) | $58,333 |
| 3-Person Families | 98 (24.7%) | $59,000 |
| 4-Person Families | 43 (10.9%) | $104,063 |
| 5-Person Families | 27 (6.8%) | $0 |
| 6-Person Families | 0 (0.0%) | $0 |
| 7+ Person Families | 0 (0.0%) | $0 |
| Total | 396 (100.0%) | $58,750 |
Family Income by Number of Earners in Aurora
The median family income in Aurora is $58,750, with families comprising 2 earners (101) having the highest median family income of $110,313, while families with no earners (116) have the lowest median family income of $40,833, accounting for 25.5% and 29.3% of families, respectively.
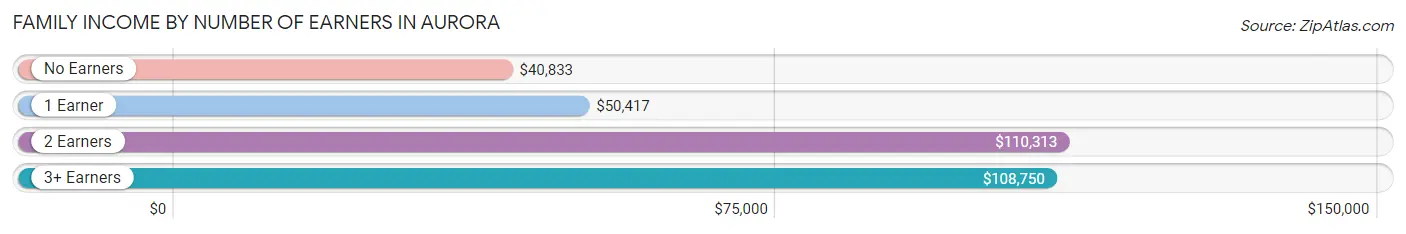
| Number of Earners | # Families | Median Income |
| No Earners | 116 (29.3%) | $40,833 |
| 1 Earner | 162 (40.9%) | $50,417 |
| 2 Earners | 101 (25.5%) | $110,313 |
| 3+ Earners | 17 (4.3%) | $108,750 |
| Total | 396 (100.0%) | $58,750 |
Household Income in Aurora
Household Income Brackets in Aurora
With 165 households falling in the category, the $25,000 to $34,999 income range is the most frequent in Aurora, accounting for 18.1% of all households. In contrast, only 14 households (1.5%) fall into the $200,000+ income bracket, making it the least populous group.
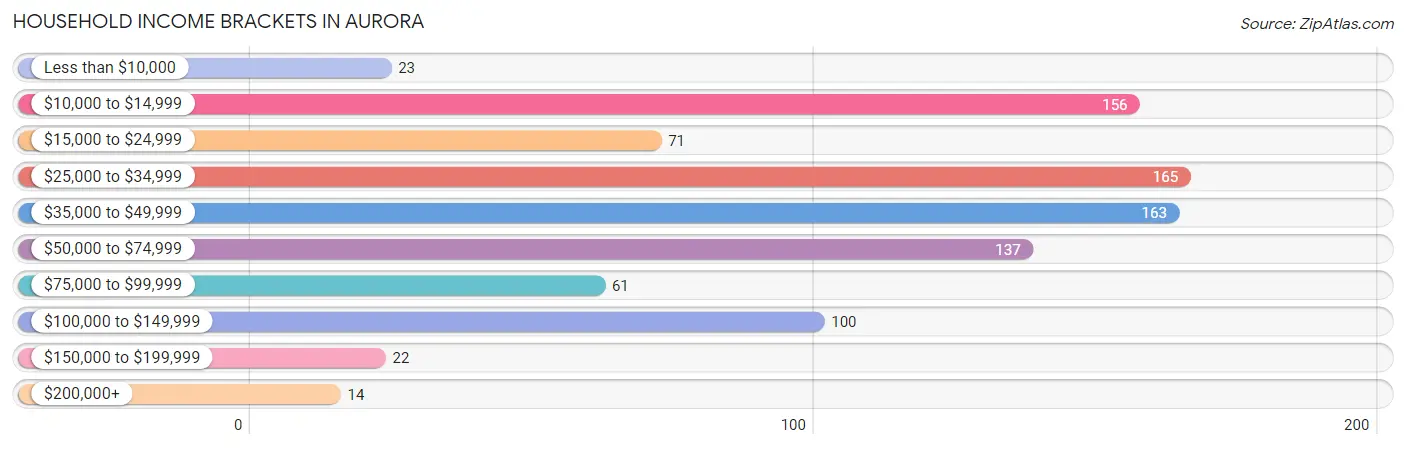
| Income Bracket | # Households | % Households |
| Less than $10,000 | 23 | 2.5% |
| $10,000 to $14,999 | 156 | 17.1% |
| $15,000 to $24,999 | 71 | 7.8% |
| $25,000 to $34,999 | 165 | 18.1% |
| $35,000 to $49,999 | 163 | 17.9% |
| $50,000 to $74,999 | 137 | 15.0% |
| $75,000 to $99,999 | 61 | 6.7% |
| $100,000 to $149,999 | 100 | 11.0% |
| $150,000 to $199,999 | 22 | 2.4% |
| $200,000+ | 14 | 1.5% |
Household Income by Householder Age in Aurora
The median household income in Aurora is $39,500, with the highest median household income of $51,000 found in the 25 to 44 years age bracket for the primary householder. A total of 202 households (22.2%) fall into this category. Meanwhile, the 15 to 24 years age bracket for the primary householder has the lowest median household income of $0, with 4 households (0.4%) in this group.
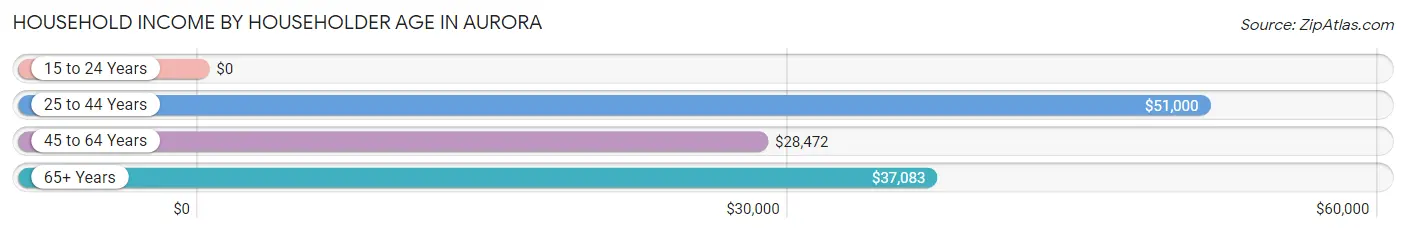
| Income Bracket | # Households | Median Income |
| 15 to 24 Years | 4 (0.4%) | $0 |
| 25 to 44 Years | 202 (22.2%) | $51,000 |
| 45 to 64 Years | 331 (36.3%) | $28,472 |
| 65+ Years | 375 (41.1%) | $37,083 |
| Total | 912 (100.0%) | $39,500 |
Poverty in Aurora
Income Below Poverty by Sex and Age in Aurora
With 19.3% poverty level for males and 21.1% for females among the residents of Aurora, 55 to 64 year old males and 6 to 11 year old females are the most vulnerable to poverty, with 93 males (50.5%) and 31 females (57.4%) in their respective age groups living below the poverty level.
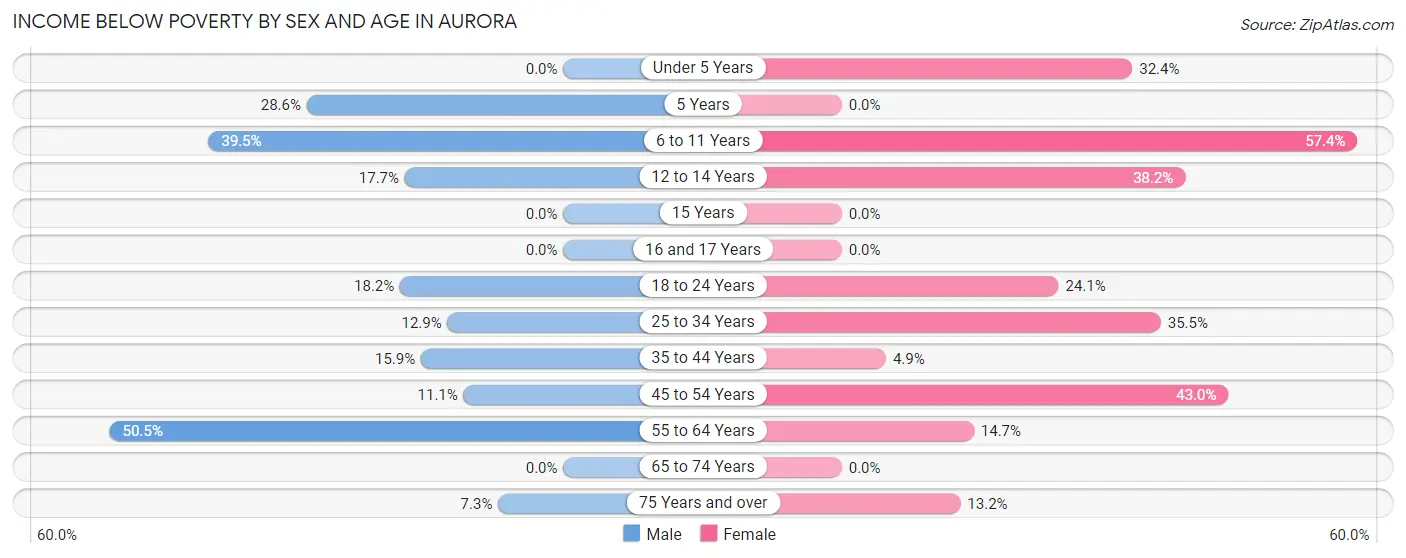
| Age Bracket | Male | Female |
| Under 5 Years | 0 (0.0%) | 11 (32.4%) |
| 5 Years | 4 (28.6%) | 0 (0.0%) |
| 6 to 11 Years | 17 (39.5%) | 31 (57.4%) |
| 12 to 14 Years | 6 (17.6%) | 13 (38.2%) |
| 15 Years | 0 (0.0%) | 0 (0.0%) |
| 16 and 17 Years | 0 (0.0%) | 0 (0.0%) |
| 18 to 24 Years | 4 (18.2%) | 7 (24.1%) |
| 25 to 34 Years | 12 (12.9%) | 27 (35.5%) |
| 35 to 44 Years | 13 (15.9%) | 3 (4.9%) |
| 45 to 54 Years | 14 (11.1%) | 34 (43.0%) |
| 55 to 64 Years | 93 (50.5%) | 15 (14.7%) |
| 65 to 74 Years | 0 (0.0%) | 0 (0.0%) |
| 75 Years and over | 5 (7.2%) | 28 (13.2%) |
| Total | 168 (19.3%) | 169 (21.1%) |
Income Above Poverty by Sex and Age in Aurora
According to the poverty statistics in Aurora, males aged under 5 years and females aged 5 years are the age groups that are most secure financially, with 100.0% of males and 100.0% of females in these age groups living above the poverty line.
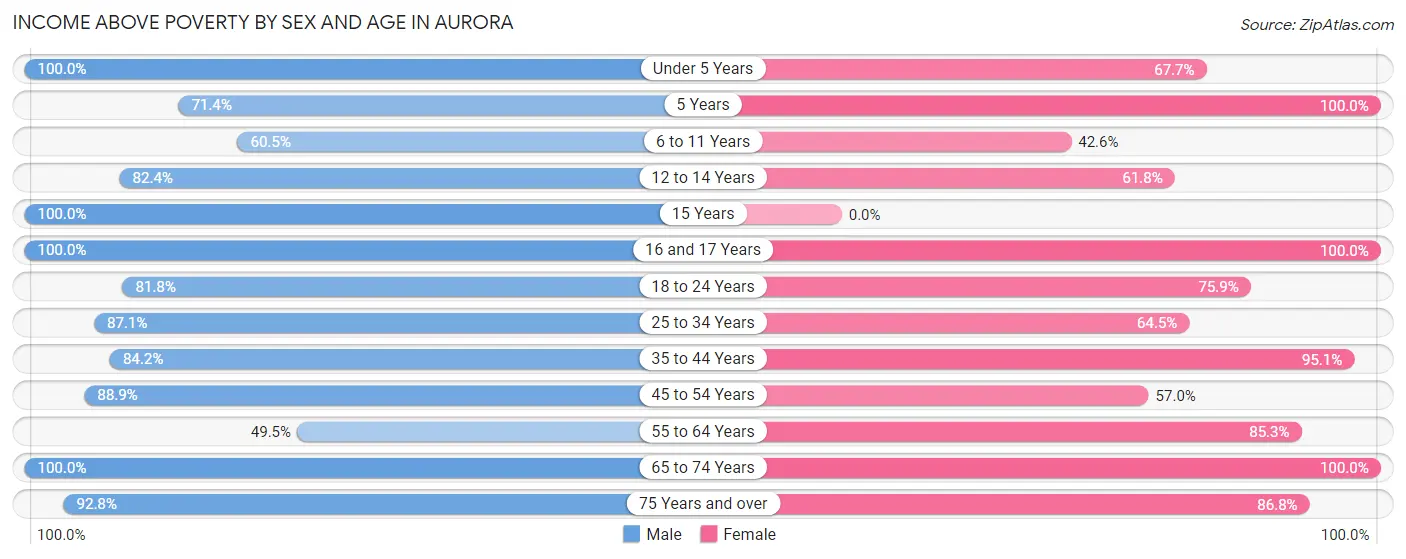
| Age Bracket | Male | Female |
| Under 5 Years | 25 (100.0%) | 23 (67.6%) |
| 5 Years | 10 (71.4%) | 5 (100.0%) |
| 6 to 11 Years | 26 (60.5%) | 23 (42.6%) |
| 12 to 14 Years | 28 (82.4%) | 21 (61.8%) |
| 15 Years | 9 (100.0%) | 0 (0.0%) |
| 16 and 17 Years | 34 (100.0%) | 4 (100.0%) |
| 18 to 24 Years | 18 (81.8%) | 22 (75.9%) |
| 25 to 34 Years | 81 (87.1%) | 49 (64.5%) |
| 35 to 44 Years | 69 (84.2%) | 58 (95.1%) |
| 45 to 54 Years | 112 (88.9%) | 45 (57.0%) |
| 55 to 64 Years | 91 (49.5%) | 87 (85.3%) |
| 65 to 74 Years | 136 (100.0%) | 109 (100.0%) |
| 75 Years and over | 64 (92.7%) | 184 (86.8%) |
| Total | 703 (80.7%) | 630 (78.8%) |
Income Below Poverty Among Married-Couple Families in Aurora
The poverty statistics for married-couple families in Aurora show that 3.2% or 8 of the total 249 families live below the poverty line. Families with no children have the highest poverty rate of 4.3%, comprising of 8 families. On the other hand, families with 1 or 2 children have the lowest poverty rate of 0.0%, which includes 0 families.
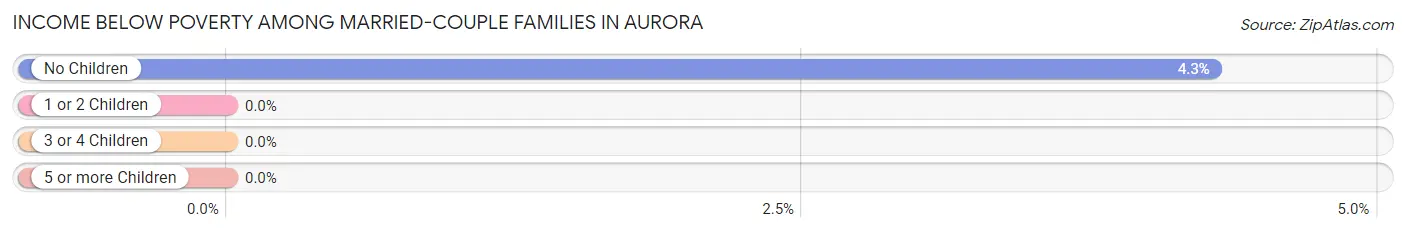
| Children | Above Poverty | Below Poverty |
| No Children | 179 (95.7%) | 8 (4.3%) |
| 1 or 2 Children | 48 (100.0%) | 0 (0.0%) |
| 3 or 4 Children | 14 (100.0%) | 0 (0.0%) |
| 5 or more Children | 0 (0.0%) | 0 (0.0%) |
| Total | 241 (96.8%) | 8 (3.2%) |
Income Below Poverty Among Single-Parent Households in Aurora
According to the poverty data in Aurora, 15.2% or 14 single-father households and 34.5% or 19 single-mother households are living below the poverty line. Among single-father households, those with 1 or 2 children have the highest poverty rate, with 9 households (18.8%) experiencing poverty. Likewise, among single-mother households, those with 3 or 4 children have the highest poverty rate, with 16 households (94.1%) falling below the poverty line.
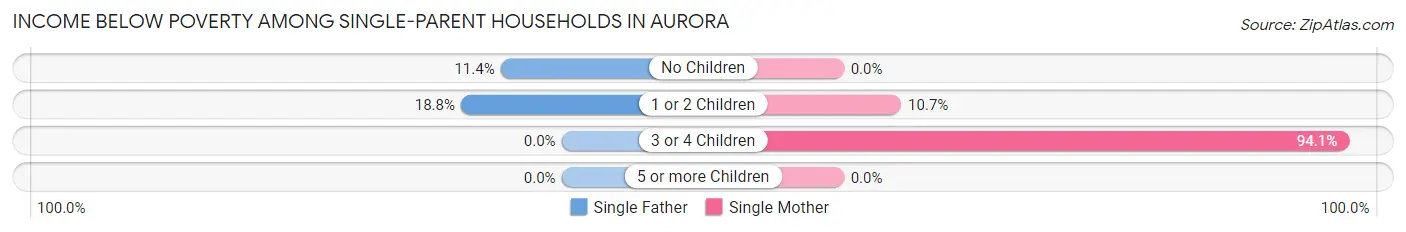
| Children | Single Father | Single Mother |
| No Children | 5 (11.4%) | 0 (0.0%) |
| 1 or 2 Children | 9 (18.8%) | 3 (10.7%) |
| 3 or 4 Children | 0 (0.0%) | 16 (94.1%) |
| 5 or more Children | 0 (0.0%) | 0 (0.0%) |
| Total | 14 (15.2%) | 19 (34.5%) |
Income Below Poverty Among Married-Couple vs Single-Parent Households in Aurora
The poverty data for Aurora shows that 8 of the married-couple family households (3.2%) and 33 of the single-parent households (22.5%) are living below the poverty level. Within the married-couple family households, those with no children have the highest poverty rate, with 8 households (4.3%) falling below the poverty line. Among the single-parent households, those with 3 or 4 children have the highest poverty rate, with 16 household (94.1%) living below poverty.
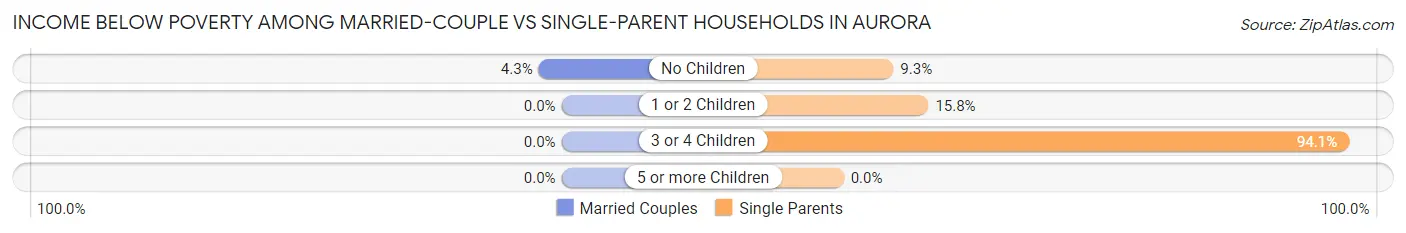
| Children | Married-Couple Families | Single-Parent Households |
| No Children | 8 (4.3%) | 5 (9.3%) |
| 1 or 2 Children | 0 (0.0%) | 12 (15.8%) |
| 3 or 4 Children | 0 (0.0%) | 16 (94.1%) |
| 5 or more Children | 0 (0.0%) | 0 (0.0%) |
| Total | 8 (3.2%) | 33 (22.5%) |
Race in Aurora
The most populous races in Aurora are White / Caucasian (1,757 | 99.0%), Two or more Races (11 | 0.6%), and Native / Alaskan (7 | 0.4%).
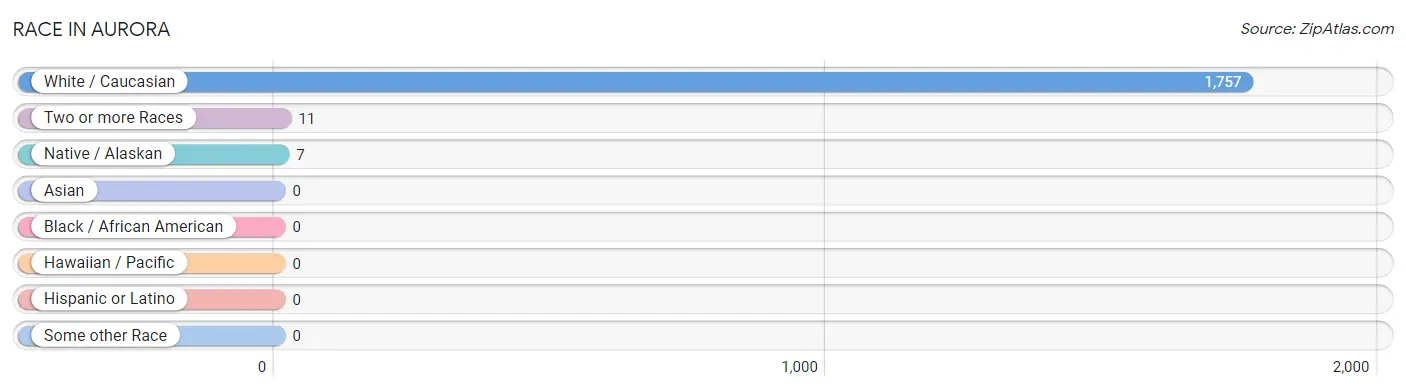
| Race | # Population | % Population |
| Asian | 0 | 0.0% |
| Black / African American | 0 | 0.0% |
| Hawaiian / Pacific | 0 | 0.0% |
| Hispanic or Latino | 0 | 0.0% |
| Native / Alaskan | 7 | 0.4% |
| White / Caucasian | 1,757 | 99.0% |
| Two or more Races | 11 | 0.6% |
| Some other Race | 0 | 0.0% |
| Total | 1,775 | 100.0% |
Ancestry in Aurora
The most populous ancestries reported in Aurora are German (562 | 31.7%), Finnish (318 | 17.9%), Irish (174 | 9.8%), English (163 | 9.2%), and Scottish (150 | 8.5%), together accounting for 77.0% of all Aurora residents.
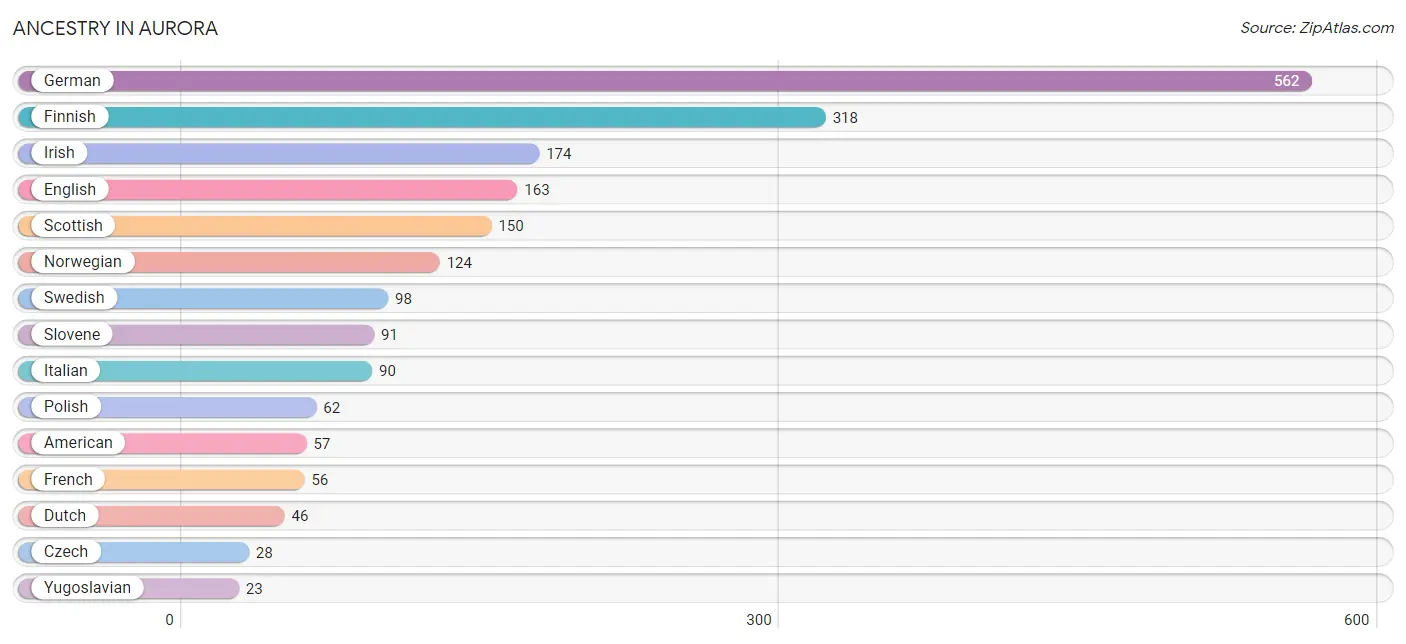
| Ancestry | # Population | % Population |
| American | 57 | 3.2% |
| Belgian | 11 | 0.6% |
| British | 4 | 0.2% |
| Celtic | 14 | 0.8% |
| Chippewa | 7 | 0.4% |
| Czech | 28 | 1.6% |
| Czechoslovakian | 5 | 0.3% |
| Danish | 21 | 1.2% |
| Dutch | 46 | 2.6% |
| English | 163 | 9.2% |
| European | 4 | 0.2% |
| Finnish | 318 | 17.9% |
| French | 56 | 3.2% |
| French Canadian | 4 | 0.2% |
| German | 562 | 31.7% |
| Irish | 174 | 9.8% |
| Italian | 90 | 5.1% |
| Northern European | 15 | 0.9% |
| Norwegian | 124 | 7.0% |
| Pennsylvania German | 11 | 0.6% |
| Polish | 62 | 3.5% |
| Scandinavian | 9 | 0.5% |
| Scotch-Irish | 18 | 1.0% |
| Scottish | 150 | 8.5% |
| Slavic | 6 | 0.3% |
| Slovene | 91 | 5.1% |
| Swedish | 98 | 5.5% |
| Swiss | 3 | 0.2% |
| Welsh | 6 | 0.3% |
| Yugoslavian | 23 | 1.3% | View All 30 Rows |
Immigrants in Aurora
The most numerous immigrant groups reported in Aurora came from Europe (17 | 1.0%), Austria (9 | 0.5%), Western Europe (9 | 0.5%), Italy (8 | 0.4%), and Southern Europe (8 | 0.4%), together accounting for 2.9% of all Aurora residents.
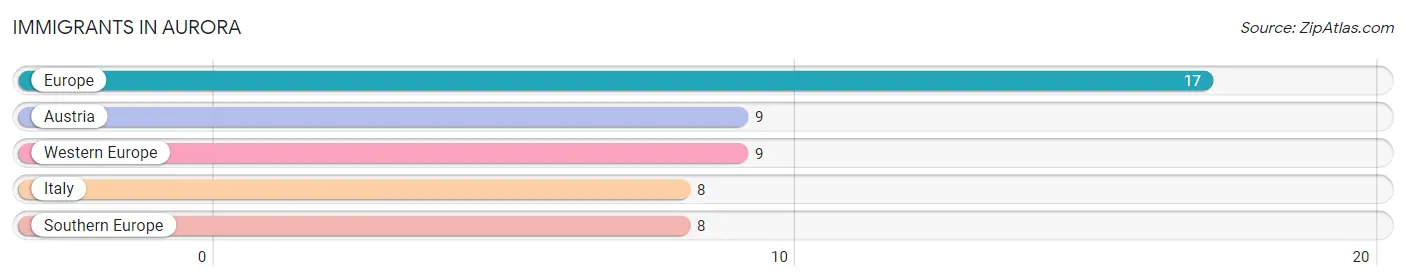
| Immigration Origin | # Population | % Population |
| Austria | 9 | 0.5% |
| Europe | 17 | 1.0% |
| Italy | 8 | 0.4% |
| Southern Europe | 8 | 0.4% |
| Western Europe | 9 | 0.5% | View All 5 Rows |
Sex and Age in Aurora
Sex and Age in Aurora
The most populous age groups in Aurora are 60 to 64 Years (165 | 18.2%) for men and 85 Years and over (126 | 14.5%) for women.
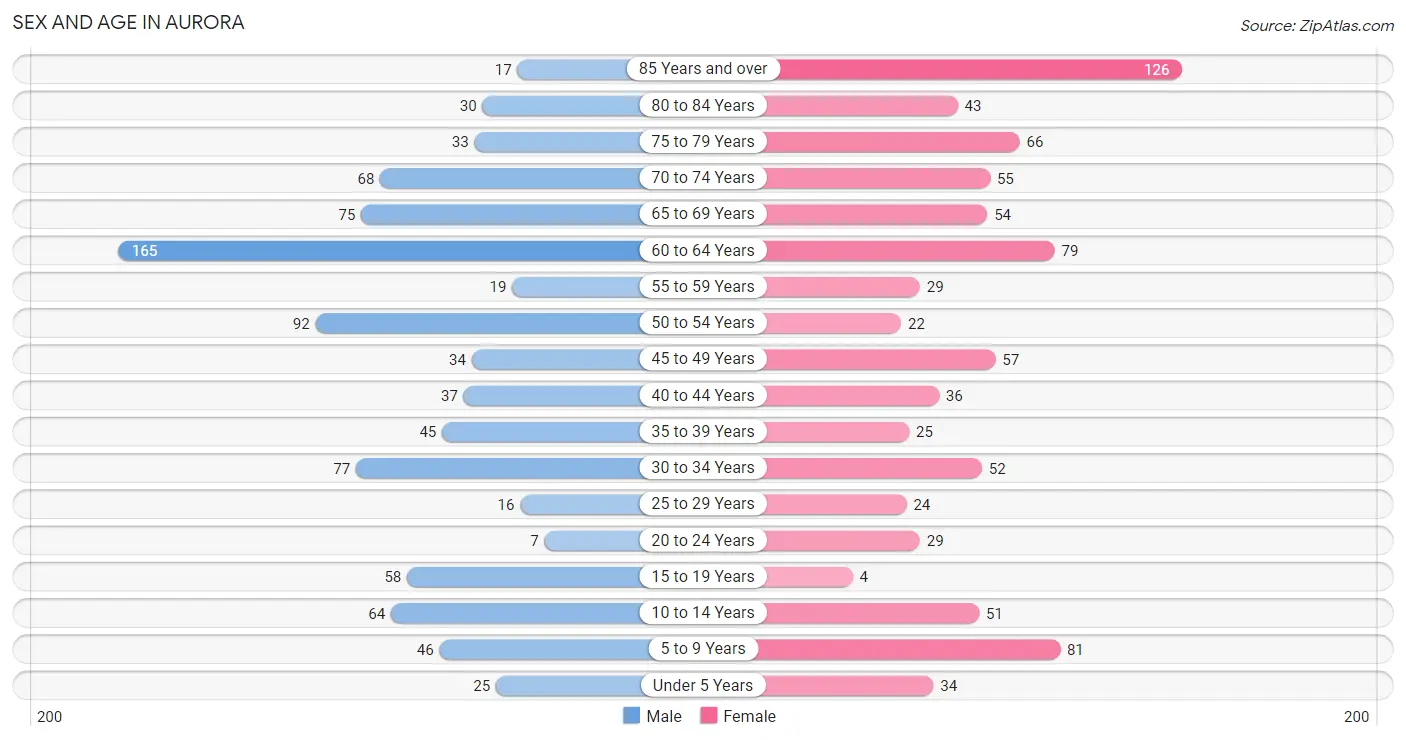
| Age Bracket | Male | Female |
| Under 5 Years | 25 (2.8%) | 34 (3.9%) |
| 5 to 9 Years | 46 (5.1%) | 81 (9.3%) |
| 10 to 14 Years | 64 (7.0%) | 51 (5.9%) |
| 15 to 19 Years | 58 (6.4%) | 4 (0.5%) |
| 20 to 24 Years | 7 (0.8%) | 29 (3.3%) |
| 25 to 29 Years | 16 (1.8%) | 24 (2.8%) |
| 30 to 34 Years | 77 (8.5%) | 52 (6.0%) |
| 35 to 39 Years | 45 (5.0%) | 25 (2.9%) |
| 40 to 44 Years | 37 (4.1%) | 36 (4.2%) |
| 45 to 49 Years | 34 (3.7%) | 57 (6.6%) |
| 50 to 54 Years | 92 (10.1%) | 22 (2.5%) |
| 55 to 59 Years | 19 (2.1%) | 29 (3.3%) |
| 60 to 64 Years | 165 (18.2%) | 79 (9.1%) |
| 65 to 69 Years | 75 (8.3%) | 54 (6.2%) |
| 70 to 74 Years | 68 (7.5%) | 55 (6.3%) |
| 75 to 79 Years | 33 (3.6%) | 66 (7.6%) |
| 80 to 84 Years | 30 (3.3%) | 43 (5.0%) |
| 85 Years and over | 17 (1.9%) | 126 (14.5%) |
| Total | 908 (100.0%) | 867 (100.0%) |
Families and Households in Aurora
Median Family Size in Aurora
The median family size in Aurora is 2.68 persons per family, with single female/mother families (55 | 13.9%) accounting for the largest median family size of 3.53 persons per family. On the other hand, single male/father families (92 | 23.2%) represent the smallest median family size with 2.50 persons per family.
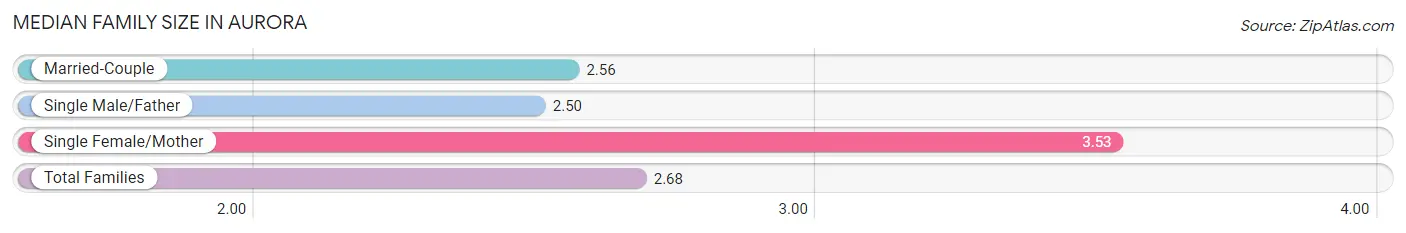
| Family Type | # Families | Family Size |
| Married-Couple | 249 (62.9%) | 2.56 |
| Single Male/Father | 92 (23.2%) | 2.50 |
| Single Female/Mother | 55 (13.9%) | 3.53 |
| Total Families | 396 (100.0%) | 2.68 |
Median Household Size in Aurora
The median household size in Aurora is 1.88 persons per household, with single female/mother households (55 | 6.0%) accounting for the largest median household size of 3.78 persons per household. non-family households (516 | 56.6%) represent the smallest median household size with 1.09 persons per household.
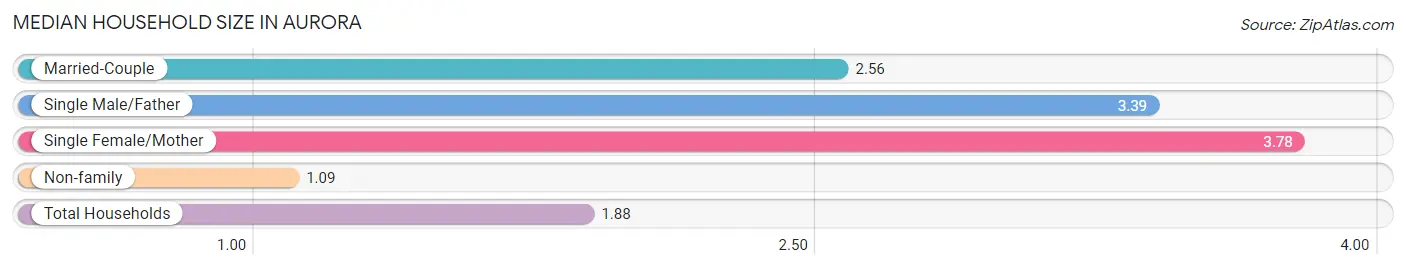
| Household Type | # Households | Household Size |
| Married-Couple | 249 (27.3%) | 2.56 |
| Single Male/Father | 92 (10.1%) | 3.39 |
| Single Female/Mother | 55 (6.0%) | 3.78 |
| Non-family | 516 (56.6%) | 1.09 |
| Total Households | 912 (100.0%) | 1.88 |
Household Size by Marriage Status in Aurora
Out of a total of 912 households in Aurora, 396 (43.4%) are family households, while 516 (56.6%) are nonfamily households. The most numerous type of family households are 2-person households, comprising 213, and the most common type of nonfamily households are 1-person households, comprising 492.
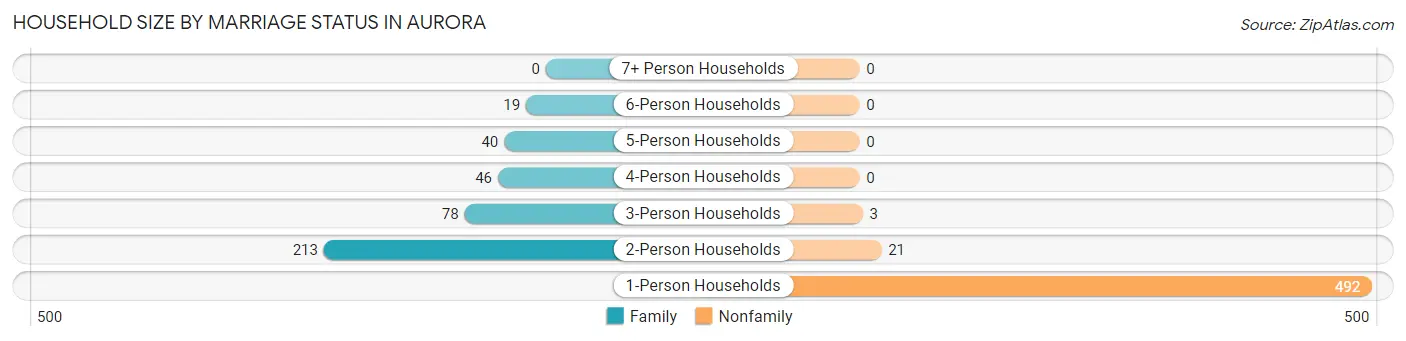
| Household Size | Family Households | Nonfamily Households |
| 1-Person Households | - | 492 (53.9%) |
| 2-Person Households | 213 (23.4%) | 21 (2.3%) |
| 3-Person Households | 78 (8.6%) | 3 (0.3%) |
| 4-Person Households | 46 (5.0%) | 0 (0.0%) |
| 5-Person Households | 40 (4.4%) | 0 (0.0%) |
| 6-Person Households | 19 (2.1%) | 0 (0.0%) |
| 7+ Person Households | 0 (0.0%) | 0 (0.0%) |
| Total | 396 (43.4%) | 516 (56.6%) |
Female Fertility in Aurora
Fertility by Age in Aurora
Average fertility rate in Aurora is 26.0 births per 1,000 women. Women in the age bracket of 20 to 34 years have the highest fertility rate with 57.0 births per 1,000 women. Women in the age bracket of 20 to 34 years acount for 100.0% of all women with births.
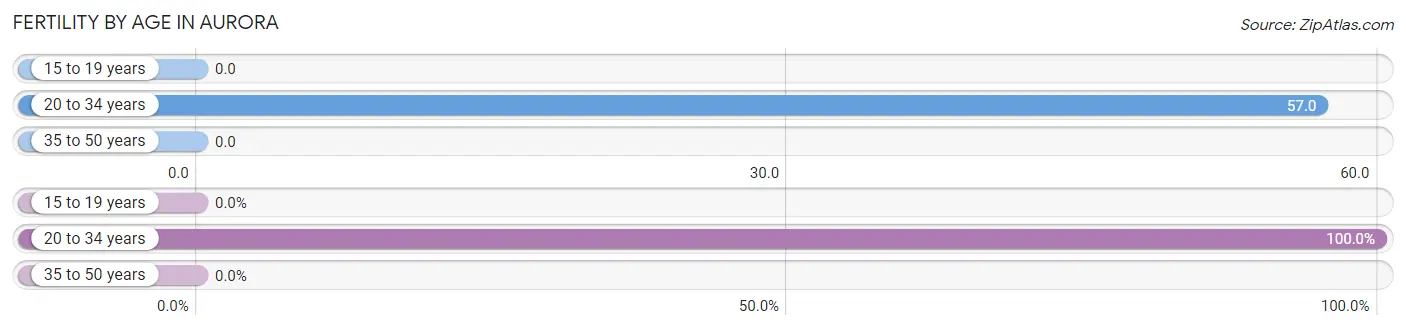
| Age Bracket | Women with Births | Births / 1,000 Women |
| 15 to 19 years | 0 (0.0%) | 0.0 |
| 20 to 34 years | 6 (100.0%) | 57.0 |
| 35 to 50 years | 0 (0.0%) | 0.0 |
| Total | 6 (100.0%) | 26.0 |
Fertility by Age by Marriage Status in Aurora
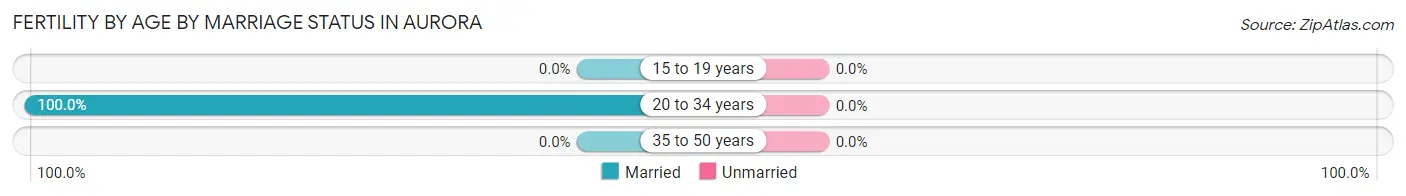
| Age Bracket | Married | Unmarried |
| 15 to 19 years | 0 (0.0%) | 0 (0.0%) |
| 20 to 34 years | 6 (100.0%) | 0 (0.0%) |
| 35 to 50 years | 0 (0.0%) | 0 (0.0%) |
| Total | 6 (100.0%) | 0 (0.0%) |
Fertility by Education in Aurora
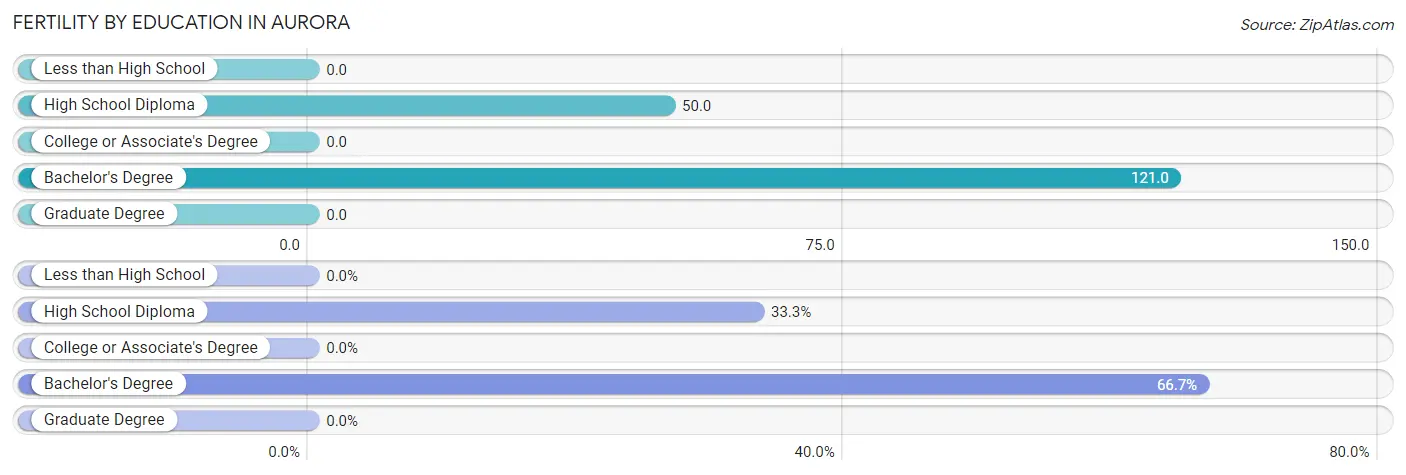
| Educational Attainment | Women with Births | Births / 1,000 Women |
| Less than High School | 0 (0.0%) | 0.0 |
| High School Diploma | 2 (33.3%) | 50.0 |
| College or Associate's Degree | 0 (0.0%) | 0.0 |
| Bachelor's Degree | 4 (66.7%) | 121.0 |
| Graduate Degree | 0 (0.0%) | 0.0 |
| Total | 6 (100.0%) | 26.0 |
Fertility by Education by Marriage Status in Aurora
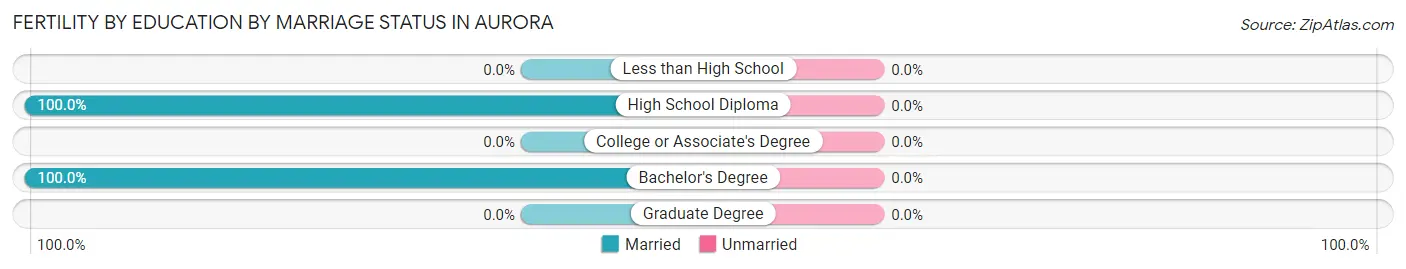
| Educational Attainment | Married | Unmarried |
| Less than High School | 0 (0.0%) | 0 (0.0%) |
| High School Diploma | 2 (100.0%) | 0 (0.0%) |
| College or Associate's Degree | 0 (0.0%) | 0 (0.0%) |
| Bachelor's Degree | 4 (100.0%) | 0 (0.0%) |
| Graduate Degree | 0 (0.0%) | 0 (0.0%) |
| Total | 6 (100.0%) | 0 (0.0%) |
Employment Characteristics in Aurora
Employment by Class of Employer in Aurora
Among the 523 employed individuals in Aurora, private company employees (314 | 60.0%), not-for-profit organizations (56 | 10.7%), and local government employees (47 | 9.0%) make up the most common classes of employment.
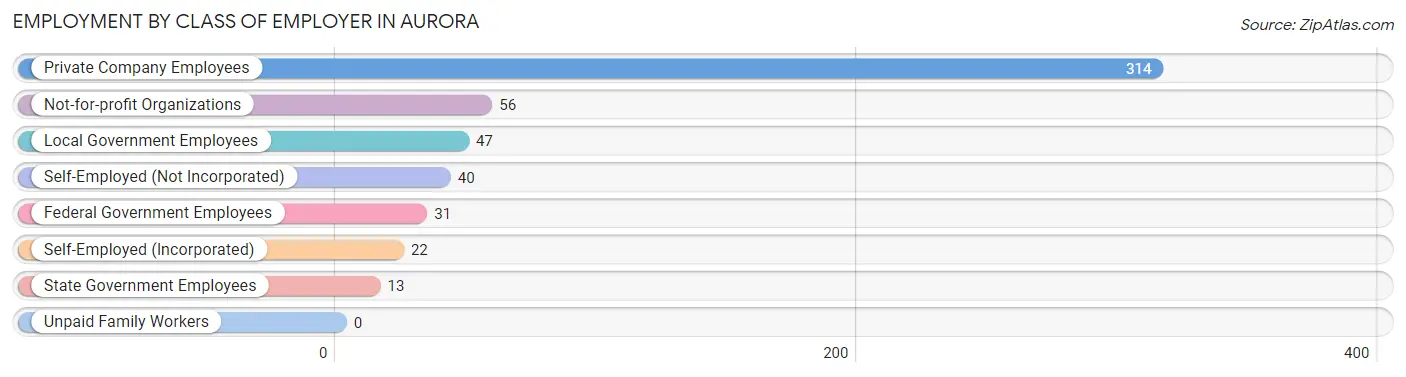
| Employer Class | # Employees | % Employees |
| Private Company Employees | 314 | 60.0% |
| Self-Employed (Incorporated) | 22 | 4.2% |
| Self-Employed (Not Incorporated) | 40 | 7.6% |
| Not-for-profit Organizations | 56 | 10.7% |
| Local Government Employees | 47 | 9.0% |
| State Government Employees | 13 | 2.5% |
| Federal Government Employees | 31 | 5.9% |
| Unpaid Family Workers | 0 | 0.0% |
| Total | 523 | 100.0% |
Employment Status by Age in Aurora
According to the labor force statistics for Aurora, out of the total population over 16 years of age (1,465), 38.8% or 568 individuals are in the labor force, with 6.9% or 39 of them unemployed. The age group with the highest labor force participation rate is 35 to 44 years, with 74.8% or 107 individuals in the labor force. Within the labor force, the 60 to 64 years age range has the highest percentage of unemployed individuals, with 15.6% or 12 of them being unemployed.
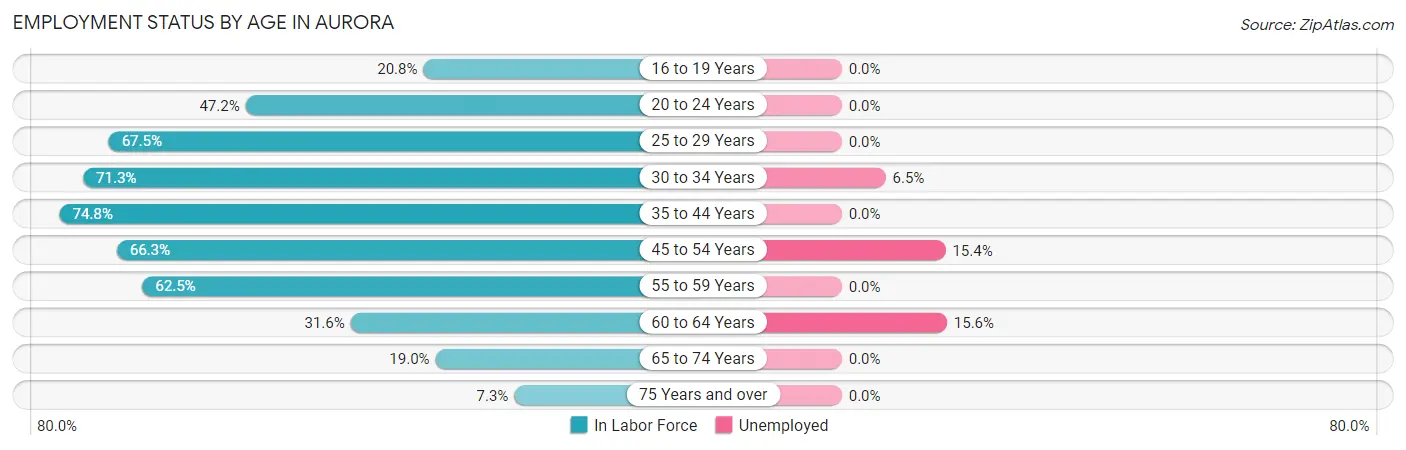
| Age Bracket | In Labor Force | Unemployed |
| 16 to 19 Years | 11 (20.8%) | 0 (0.0%) |
| 20 to 24 Years | 17 (47.2%) | 0 (0.0%) |
| 25 to 29 Years | 27 (67.5%) | 0 (0.0%) |
| 30 to 34 Years | 92 (71.3%) | 6 (6.5%) |
| 35 to 44 Years | 107 (74.8%) | 0 (0.0%) |
| 45 to 54 Years | 136 (66.3%) | 21 (15.4%) |
| 55 to 59 Years | 30 (62.5%) | 0 (0.0%) |
| 60 to 64 Years | 77 (31.6%) | 12 (15.6%) |
| 65 to 74 Years | 48 (19.0%) | 0 (0.0%) |
| 75 Years and over | 23 (7.3%) | 0 (0.0%) |
| Total | 568 (38.8%) | 39 (6.9%) |
Employment Status by Educational Attainment in Aurora
According to labor force statistics for Aurora, 58.0% of individuals (469) out of the total population between 25 and 64 years of age (809) are in the labor force, with 8.3% or 39 of them being unemployed. The group with the highest labor force participation rate are those with the educational attainment of bachelor's degree or higher, with 89.7% or 105 individuals in the labor force. Within the labor force, individuals with high school diploma education have the highest percentage of unemployment, with 12.4% or 21 of them being unemployed.
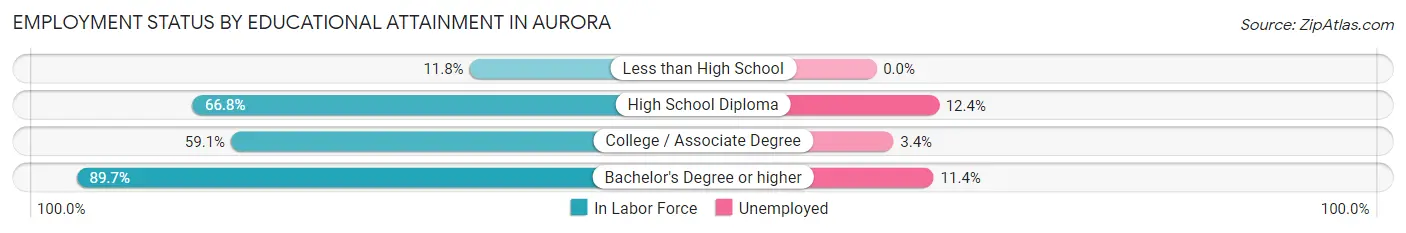
| Educational Attainment | In Labor Force | Unemployed |
| Less than High School | 16 (11.8%) | 0 (0.0%) |
| High School Diploma | 169 (66.8%) | 31 (12.4%) |
| College / Associate Degree | 179 (59.1%) | 10 (3.4%) |
| Bachelor's Degree or higher | 105 (89.7%) | 13 (11.4%) |
| Total | 469 (58.0%) | 67 (8.3%) |
Employment Occupations by Sex in Aurora
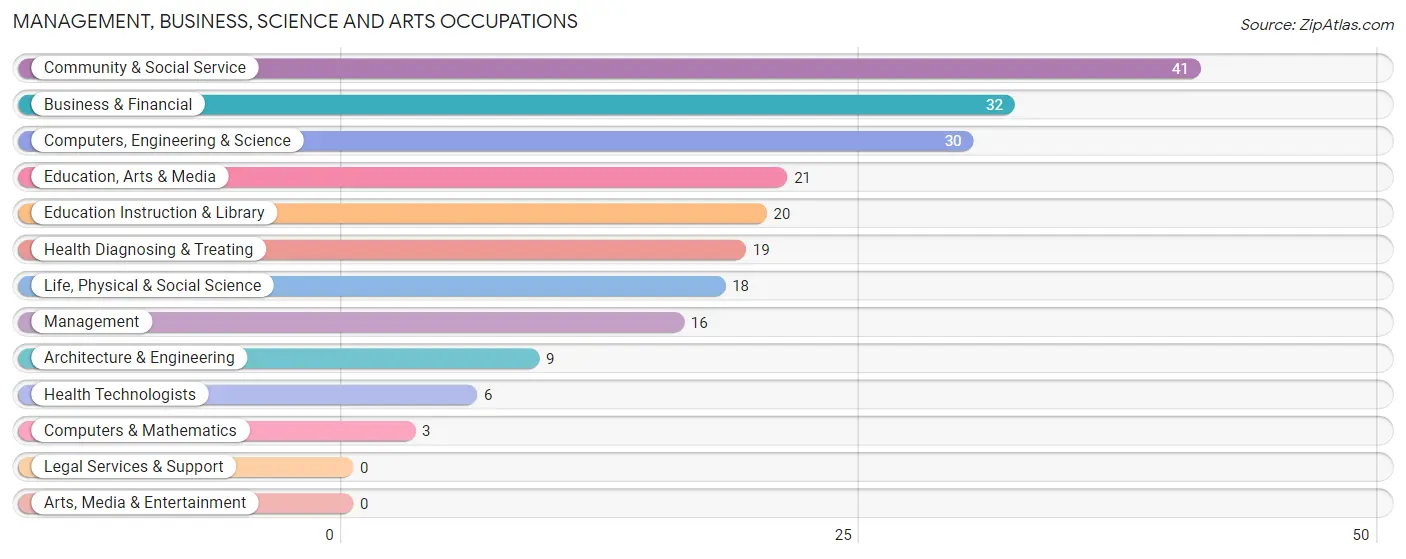
Management, Business, Science and Arts Occupations
The most common Management, Business, Science and Arts occupations in Aurora are Community & Social Service (41 | 7.7%), Business & Financial (32 | 6.0%), Computers, Engineering & Science (30 | 5.7%), Education, Arts & Media (21 | 4.0%), and Education Instruction & Library (20 | 3.8%).
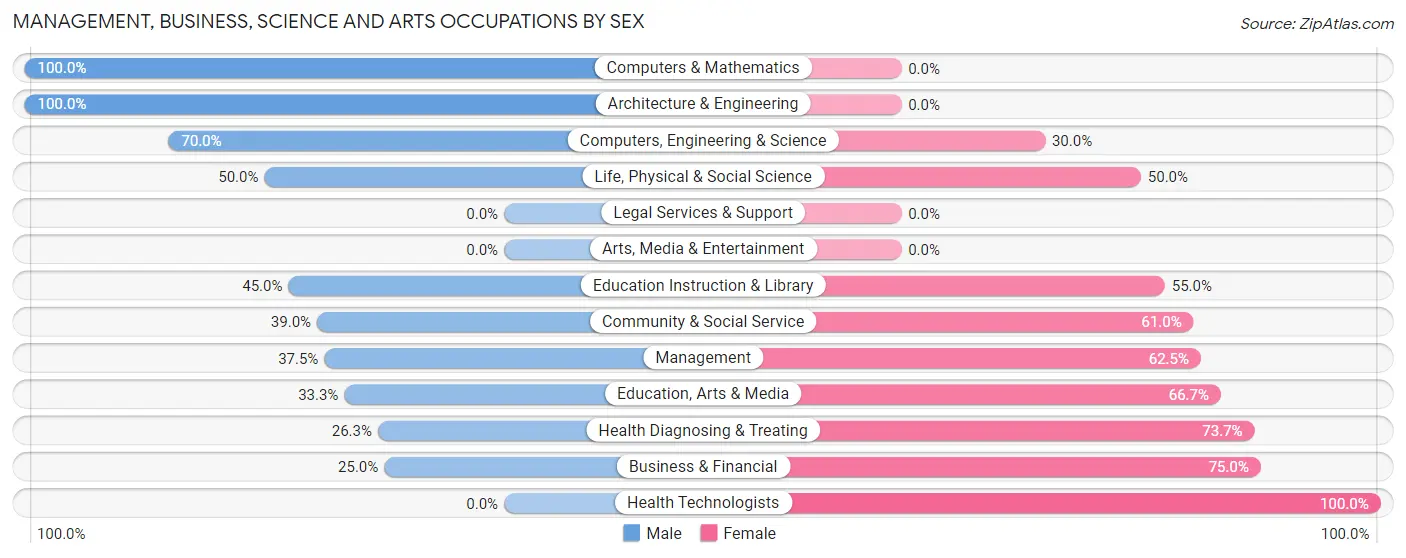
Management, Business, Science and Arts Occupations by Sex
Within the Management, Business, Science and Arts occupations in Aurora, the most male-oriented occupations are Computers & Mathematics (100.0%), Architecture & Engineering (100.0%), and Computers, Engineering & Science (70.0%), while the most female-oriented occupations are Health Technologists (100.0%), Business & Financial (75.0%), and Health Diagnosing & Treating (73.7%).
| Occupation | Male | Female |
| Management | 6 (37.5%) | 10 (62.5%) |
| Business & Financial | 8 (25.0%) | 24 (75.0%) |
| Computers, Engineering & Science | 21 (70.0%) | 9 (30.0%) |
| Computers & Mathematics | 3 (100.0%) | 0 (0.0%) |
| Architecture & Engineering | 9 (100.0%) | 0 (0.0%) |
| Life, Physical & Social Science | 9 (50.0%) | 9 (50.0%) |
| Community & Social Service | 16 (39.0%) | 25 (61.0%) |
| Education, Arts & Media | 7 (33.3%) | 14 (66.7%) |
| Legal Services & Support | 0 (0.0%) | 0 (0.0%) |
| Education Instruction & Library | 9 (45.0%) | 11 (55.0%) |
| Arts, Media & Entertainment | 0 (0.0%) | 0 (0.0%) |
| Health Diagnosing & Treating | 5 (26.3%) | 14 (73.7%) |
| Health Technologists | 0 (0.0%) | 6 (100.0%) |
| Total (Category) | 56 (40.6%) | 82 (59.4%) |
| Total (Overall) | 287 (54.2%) | 242 (45.8%) |
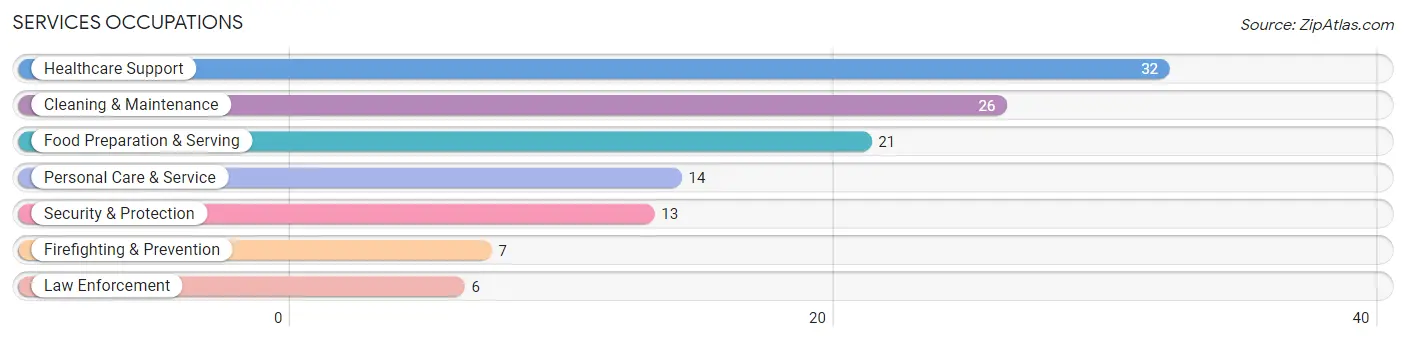
Services Occupations
The most common Services occupations in Aurora are Healthcare Support (32 | 6.0%), Cleaning & Maintenance (26 | 4.9%), Food Preparation & Serving (21 | 4.0%), Personal Care & Service (14 | 2.6%), and Security & Protection (13 | 2.5%).
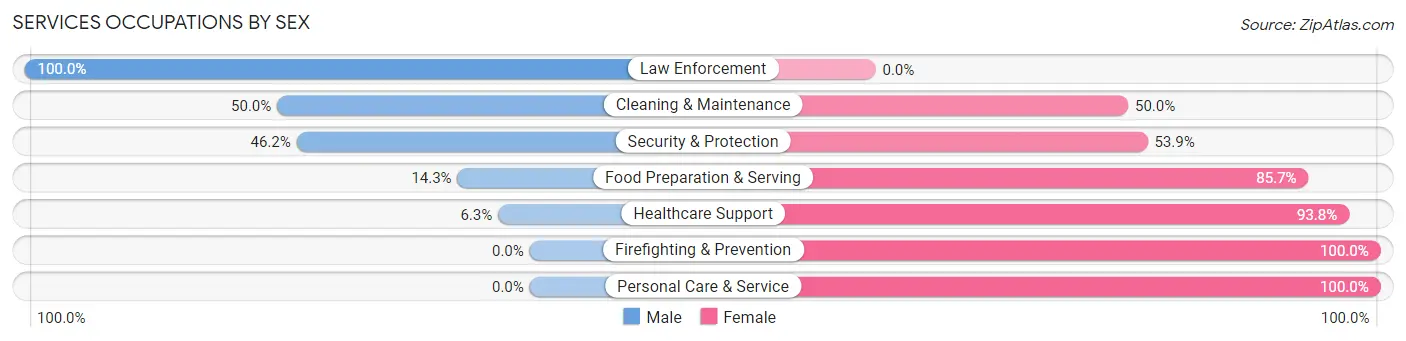
Services Occupations by Sex
Within the Services occupations in Aurora, the most male-oriented occupations are Law Enforcement (100.0%), Cleaning & Maintenance (50.0%), and Security & Protection (46.2%), while the most female-oriented occupations are Firefighting & Prevention (100.0%), Personal Care & Service (100.0%), and Healthcare Support (93.8%).
| Occupation | Male | Female |
| Healthcare Support | 2 (6.2%) | 30 (93.8%) |
| Security & Protection | 6 (46.2%) | 7 (53.8%) |
| Firefighting & Prevention | 0 (0.0%) | 7 (100.0%) |
| Law Enforcement | 6 (100.0%) | 0 (0.0%) |
| Food Preparation & Serving | 3 (14.3%) | 18 (85.7%) |
| Cleaning & Maintenance | 13 (50.0%) | 13 (50.0%) |
| Personal Care & Service | 0 (0.0%) | 14 (100.0%) |
| Total (Category) | 24 (22.6%) | 82 (77.4%) |
| Total (Overall) | 287 (54.2%) | 242 (45.8%) |
Sales and Office Occupations
The most common Sales and Office occupations in Aurora are Office & Administration (67 | 12.7%), and Sales & Related (39 | 7.4%).
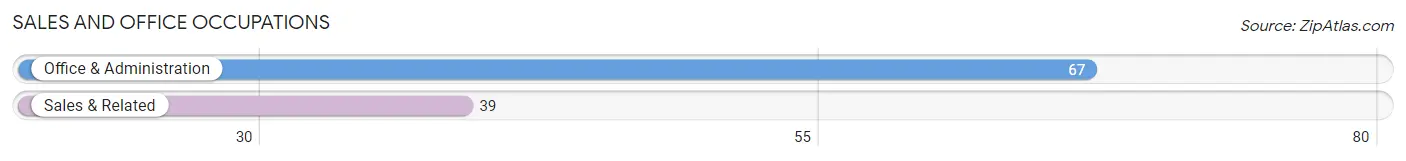
Sales and Office Occupations by Sex
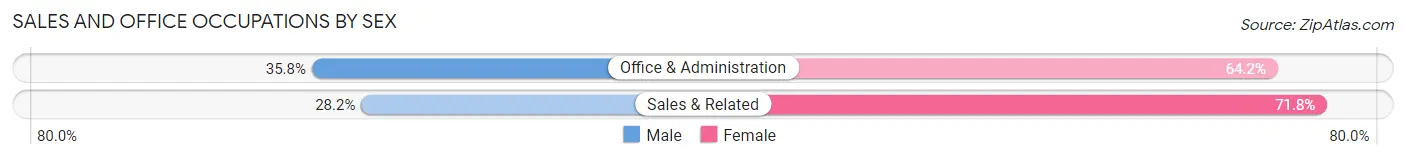
| Occupation | Male | Female |
| Sales & Related | 11 (28.2%) | 28 (71.8%) |
| Office & Administration | 24 (35.8%) | 43 (64.2%) |
| Total (Category) | 35 (33.0%) | 71 (67.0%) |
| Total (Overall) | 287 (54.2%) | 242 (45.8%) |
Natural Resources, Construction and Maintenance Occupations
The most common Natural Resources, Construction and Maintenance occupations in Aurora are Installation, Maintenance & Repair (31 | 5.9%), and Construction & Extraction (15 | 2.8%).
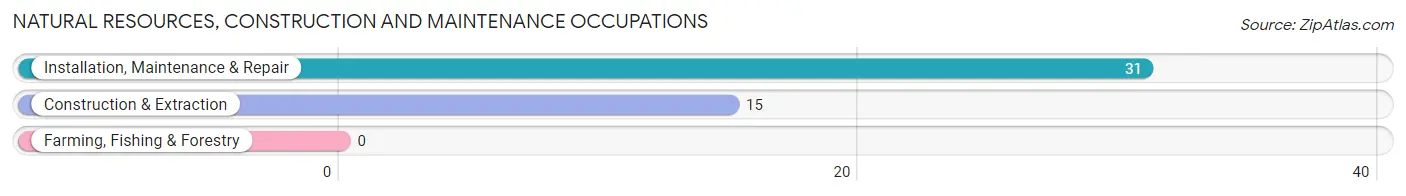
Natural Resources, Construction and Maintenance Occupations by Sex

| Occupation | Male | Female |
| Farming, Fishing & Forestry | 0 (0.0%) | 0 (0.0%) |
| Construction & Extraction | 15 (100.0%) | 0 (0.0%) |
| Installation, Maintenance & Repair | 31 (100.0%) | 0 (0.0%) |
| Total (Category) | 46 (100.0%) | 0 (0.0%) |
| Total (Overall) | 287 (54.2%) | 242 (45.8%) |
Production, Transportation and Moving Occupations
The most common Production, Transportation and Moving occupations in Aurora are Production (54 | 10.2%), Material Moving (44 | 8.3%), and Transportation (35 | 6.6%).
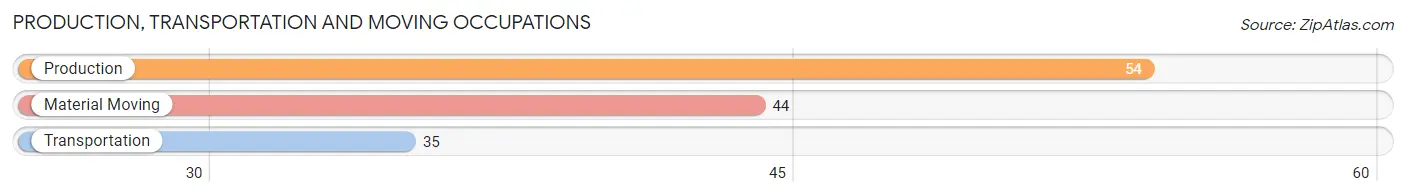
Production, Transportation and Moving Occupations by Sex
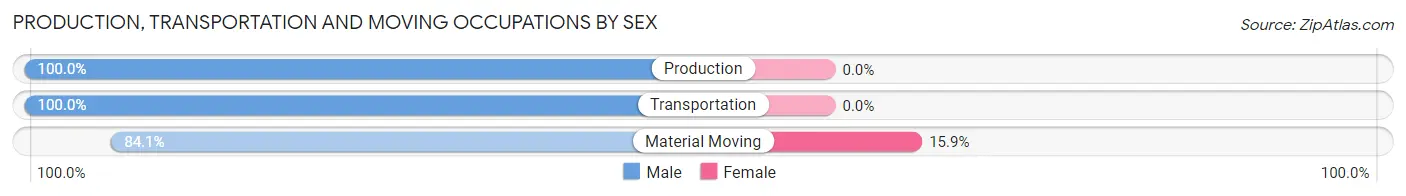
| Occupation | Male | Female |
| Production | 54 (100.0%) | 0 (0.0%) |
| Transportation | 35 (100.0%) | 0 (0.0%) |
| Material Moving | 37 (84.1%) | 7 (15.9%) |
| Total (Category) | 126 (94.7%) | 7 (5.3%) |
| Total (Overall) | 287 (54.2%) | 242 (45.8%) |
Employment Industries by Sex in Aurora
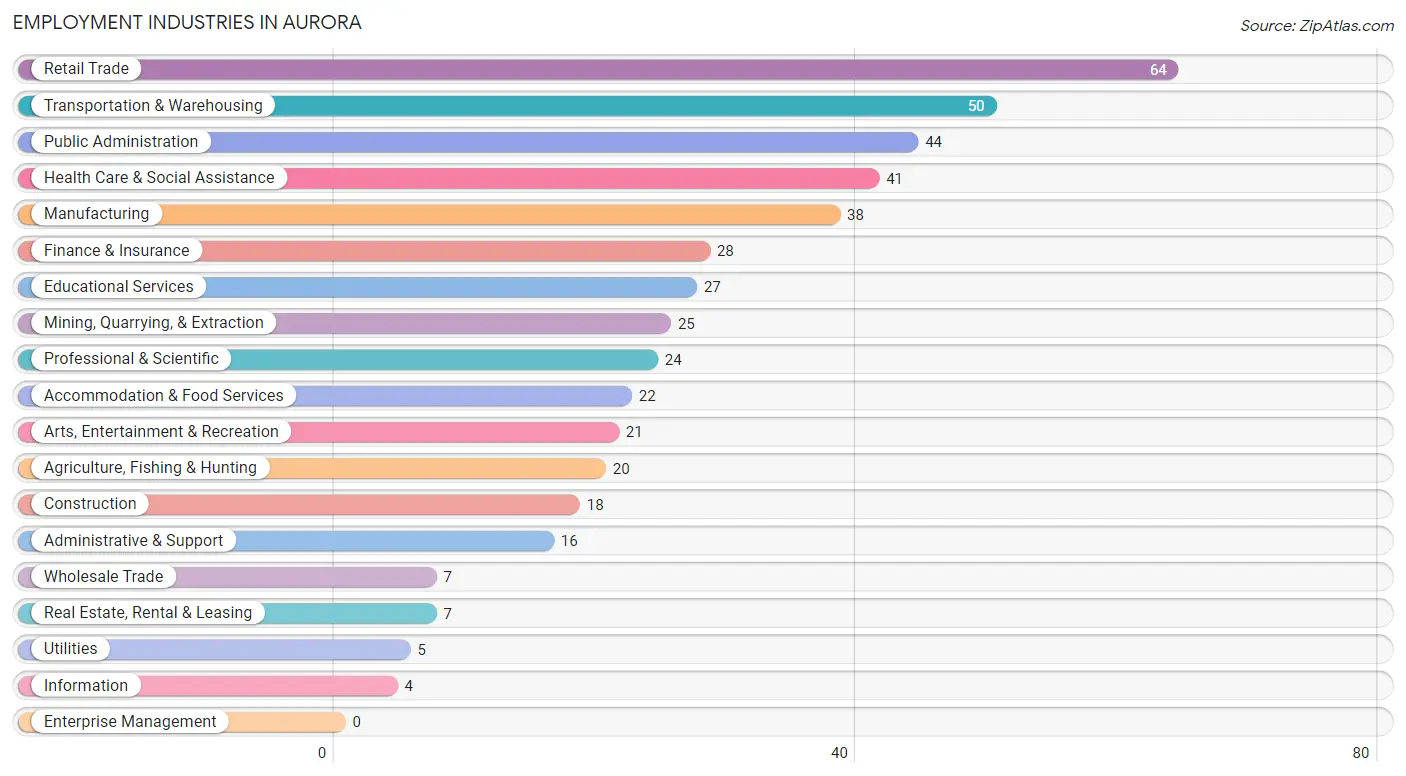
Employment Industries in Aurora
The major employment industries in Aurora include Retail Trade (64 | 12.1%), Transportation & Warehousing (50 | 9.5%), Public Administration (44 | 8.3%), Health Care & Social Assistance (41 | 7.7%), and Manufacturing (38 | 7.2%).
Employment Industries by Sex in Aurora
The Aurora industries that see more men than women are Mining, Quarrying, & Extraction (100.0%), Utilities (100.0%), and Manufacturing (92.1%), whereas the industries that tend to have a higher number of women are Wholesale Trade (100.0%), Information (100.0%), and Finance & Insurance (100.0%).
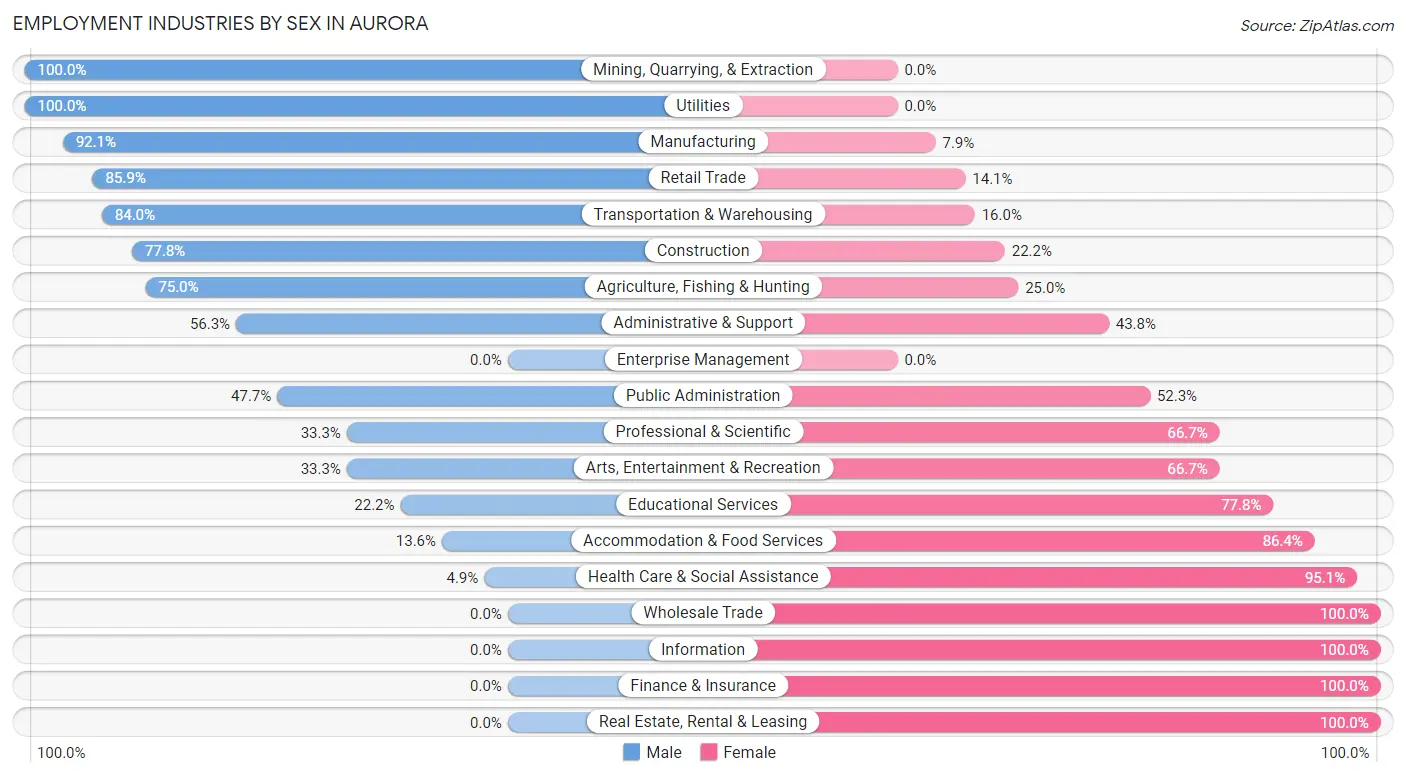
| Industry | Male | Female |
| Agriculture, Fishing & Hunting | 15 (75.0%) | 5 (25.0%) |
| Mining, Quarrying, & Extraction | 25 (100.0%) | 0 (0.0%) |
| Construction | 14 (77.8%) | 4 (22.2%) |
| Manufacturing | 35 (92.1%) | 3 (7.9%) |
| Wholesale Trade | 0 (0.0%) | 7 (100.0%) |
| Retail Trade | 55 (85.9%) | 9 (14.1%) |
| Transportation & Warehousing | 42 (84.0%) | 8 (16.0%) |
| Utilities | 5 (100.0%) | 0 (0.0%) |
| Information | 0 (0.0%) | 4 (100.0%) |
| Finance & Insurance | 0 (0.0%) | 28 (100.0%) |
| Real Estate, Rental & Leasing | 0 (0.0%) | 7 (100.0%) |
| Professional & Scientific | 8 (33.3%) | 16 (66.7%) |
| Enterprise Management | 0 (0.0%) | 0 (0.0%) |
| Administrative & Support | 9 (56.2%) | 7 (43.8%) |
| Educational Services | 6 (22.2%) | 21 (77.8%) |
| Health Care & Social Assistance | 2 (4.9%) | 39 (95.1%) |
| Arts, Entertainment & Recreation | 7 (33.3%) | 14 (66.7%) |
| Accommodation & Food Services | 3 (13.6%) | 19 (86.4%) |
| Public Administration | 21 (47.7%) | 23 (52.3%) |
| Total | 287 (54.2%) | 242 (45.8%) |
Education in Aurora
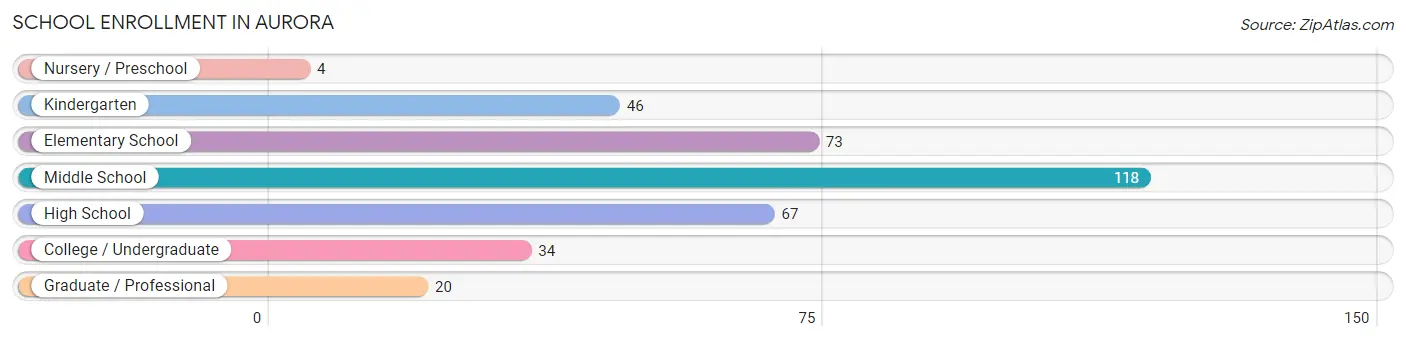
School Enrollment in Aurora
The most common levels of schooling among the 362 students in Aurora are middle school (118 | 32.6%), elementary school (73 | 20.2%), and high school (67 | 18.5%).
| School Level | # Students | % Students |
| Nursery / Preschool | 4 | 1.1% |
| Kindergarten | 46 | 12.7% |
| Elementary School | 73 | 20.2% |
| Middle School | 118 | 32.6% |
| High School | 67 | 18.5% |
| College / Undergraduate | 34 | 9.4% |
| Graduate / Professional | 20 | 5.5% |
| Total | 362 | 100.0% |
School Enrollment by Age by Funding Source in Aurora
Out of a total of 362 students who are enrolled in schools in Aurora, 42 (11.6%) attend a private institution, while the remaining 320 (88.4%) are enrolled in public schools. The age group of 35 years and over has the highest likelihood of being enrolled in private schools, with 14 (73.7% in the age bracket) enrolled. Conversely, the age group of 3 to 4 year olds has the lowest likelihood of being enrolled in a private school, with 9 (100.0% in the age bracket) attending a public institution.
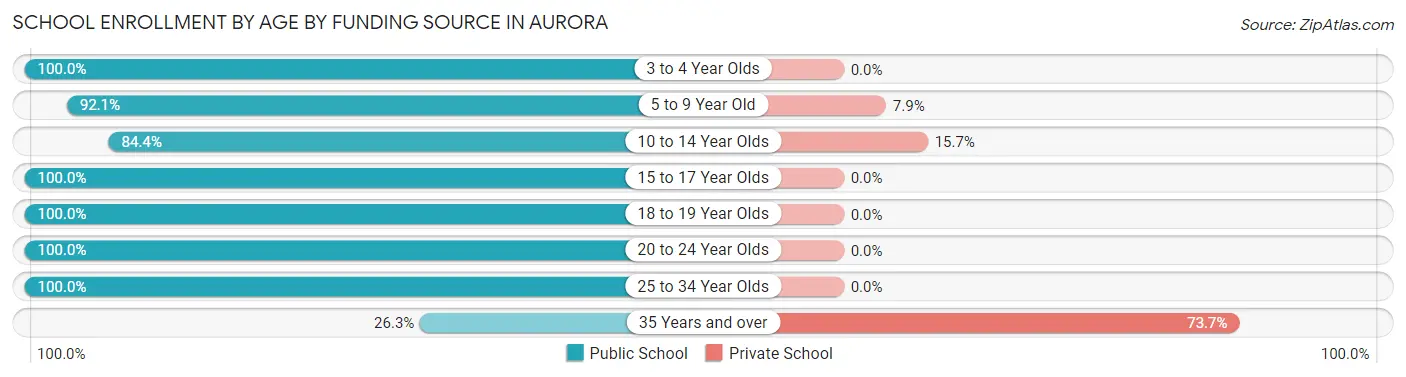
| Age Bracket | Public School | Private School |
| 3 to 4 Year Olds | 9 (100.0%) | 0 (0.0%) |
| 5 to 9 Year Old | 117 (92.1%) | 10 (7.9%) |
| 10 to 14 Year Olds | 97 (84.4%) | 18 (15.7%) |
| 15 to 17 Year Olds | 47 (100.0%) | 0 (0.0%) |
| 18 to 19 Year Olds | 10 (100.0%) | 0 (0.0%) |
| 20 to 24 Year Olds | 25 (100.0%) | 0 (0.0%) |
| 25 to 34 Year Olds | 10 (100.0%) | 0 (0.0%) |
| 35 Years and over | 5 (26.3%) | 14 (73.7%) |
| Total | 320 (88.4%) | 42 (11.6%) |
Educational Attainment by Field of Study in Aurora
Education (144 | 51.2%), engineering (48 | 17.1%), psychology (18 | 6.4%), business (16 | 5.7%), and bio, nature & agricultural (15 | 5.3%) are the most common fields of study among 281 individuals in Aurora who have obtained a bachelor's degree or higher.
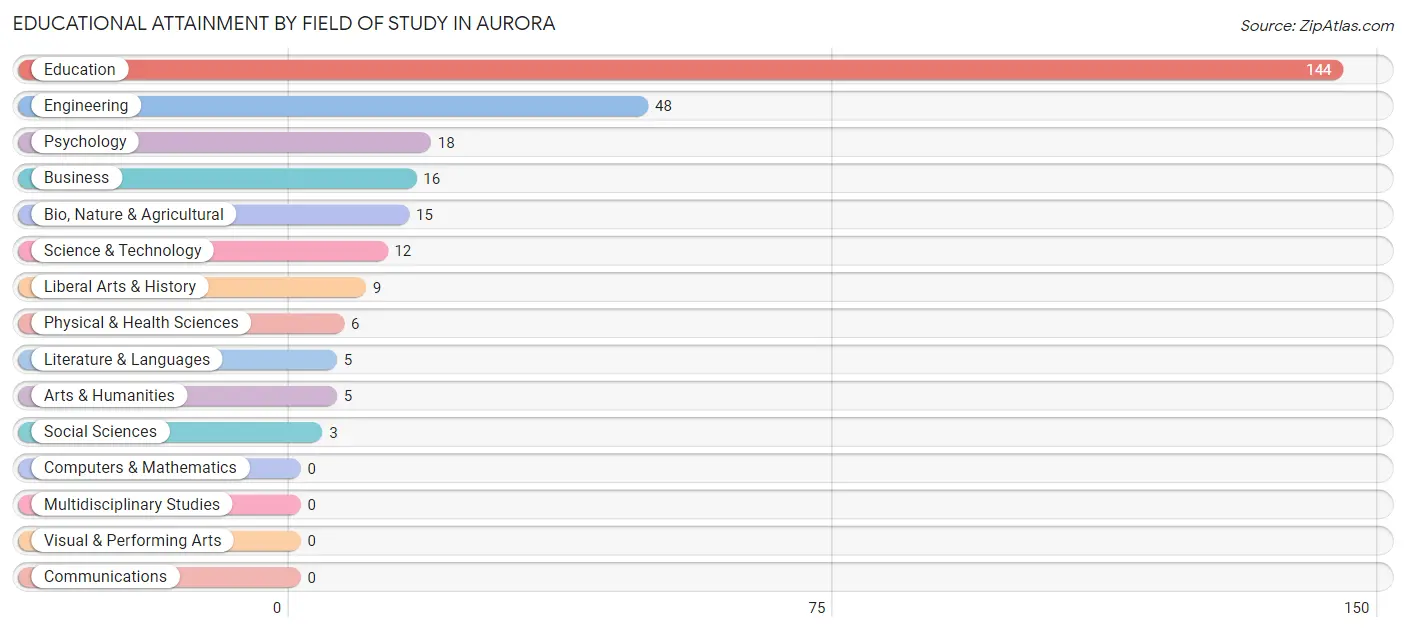
| Field of Study | # Graduates | % Graduates |
| Computers & Mathematics | 0 | 0.0% |
| Bio, Nature & Agricultural | 15 | 5.3% |
| Physical & Health Sciences | 6 | 2.1% |
| Psychology | 18 | 6.4% |
| Social Sciences | 3 | 1.1% |
| Engineering | 48 | 17.1% |
| Multidisciplinary Studies | 0 | 0.0% |
| Science & Technology | 12 | 4.3% |
| Business | 16 | 5.7% |
| Education | 144 | 51.2% |
| Literature & Languages | 5 | 1.8% |
| Liberal Arts & History | 9 | 3.2% |
| Visual & Performing Arts | 0 | 0.0% |
| Communications | 0 | 0.0% |
| Arts & Humanities | 5 | 1.8% |
| Total | 281 | 100.0% |
Transportation & Commute in Aurora
Vehicle Availability by Sex in Aurora
The most prevalent vehicle ownership categories in Aurora are males with 2 vehicles (83, accounting for 29.9%) and females with 2 vehicles (100, making up 34.3%).
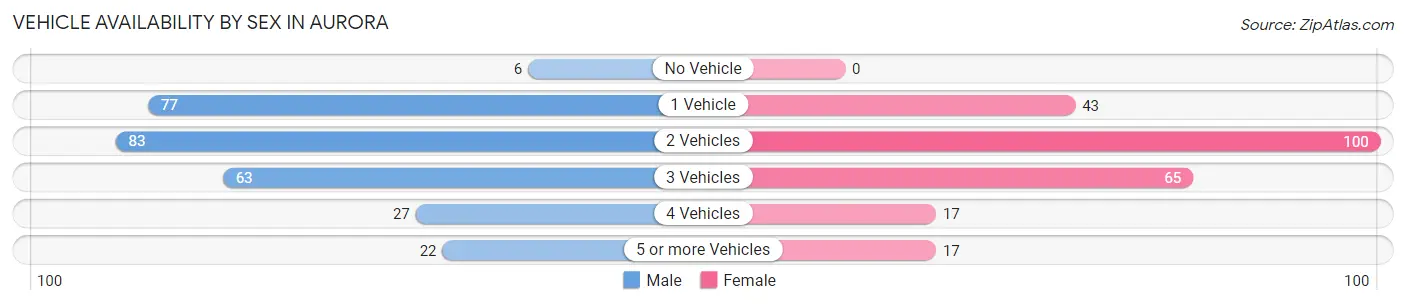
| Vehicles Available | Male | Female |
| No Vehicle | 6 (2.2%) | 0 (0.0%) |
| 1 Vehicle | 77 (27.7%) | 43 (17.8%) |
| 2 Vehicles | 83 (29.9%) | 100 (41.3%) |
| 3 Vehicles | 63 (22.7%) | 65 (26.9%) |
| 4 Vehicles | 27 (9.7%) | 17 (7.0%) |
| 5 or more Vehicles | 22 (7.9%) | 17 (7.0%) |
| Total | 278 (100.0%) | 242 (100.0%) |
Commute Time in Aurora
The most frequently occuring commute durations in Aurora are 5 to 9 minutes (77 commuters, 16.0%), 30 to 34 minutes (75 commuters, 15.6%), and 10 to 14 minutes (56 commuters, 11.7%).
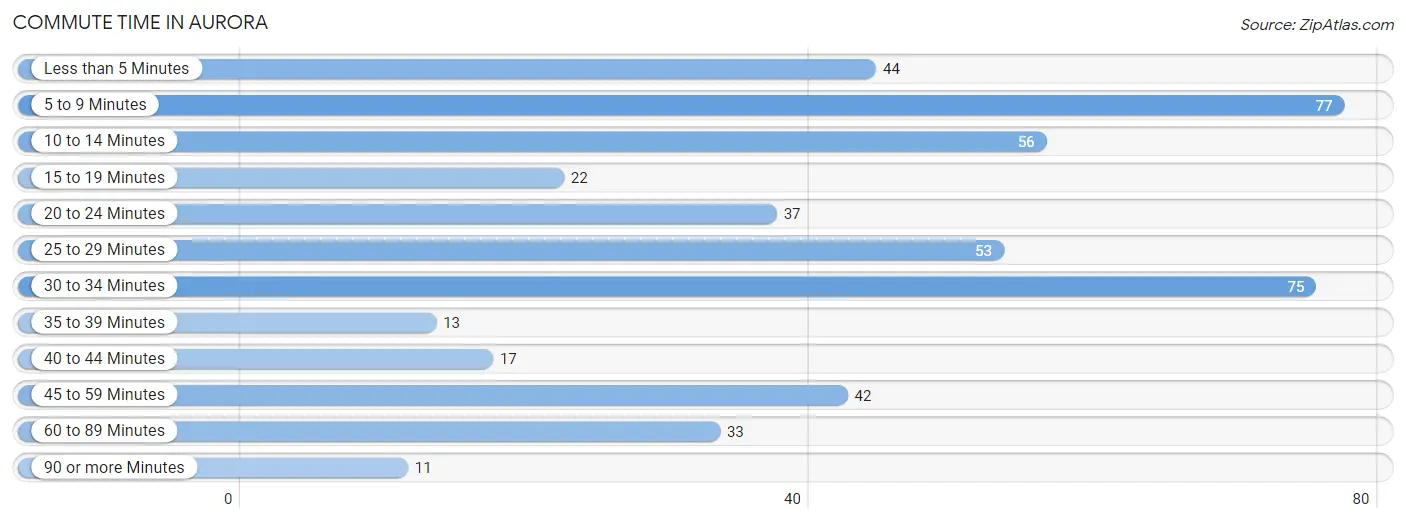
| Commute Time | # Commuters | % Commuters |
| Less than 5 Minutes | 44 | 9.2% |
| 5 to 9 Minutes | 77 | 16.0% |
| 10 to 14 Minutes | 56 | 11.7% |
| 15 to 19 Minutes | 22 | 4.6% |
| 20 to 24 Minutes | 37 | 7.7% |
| 25 to 29 Minutes | 53 | 11.0% |
| 30 to 34 Minutes | 75 | 15.6% |
| 35 to 39 Minutes | 13 | 2.7% |
| 40 to 44 Minutes | 17 | 3.5% |
| 45 to 59 Minutes | 42 | 8.7% |
| 60 to 89 Minutes | 33 | 6.9% |
| 90 or more Minutes | 11 | 2.3% |
Commute Time by Sex in Aurora
The most common commute times in Aurora are 30 to 34 minutes (45 commuters, 17.1%) for males and 5 to 9 minutes (57 commuters, 26.4%) for females.
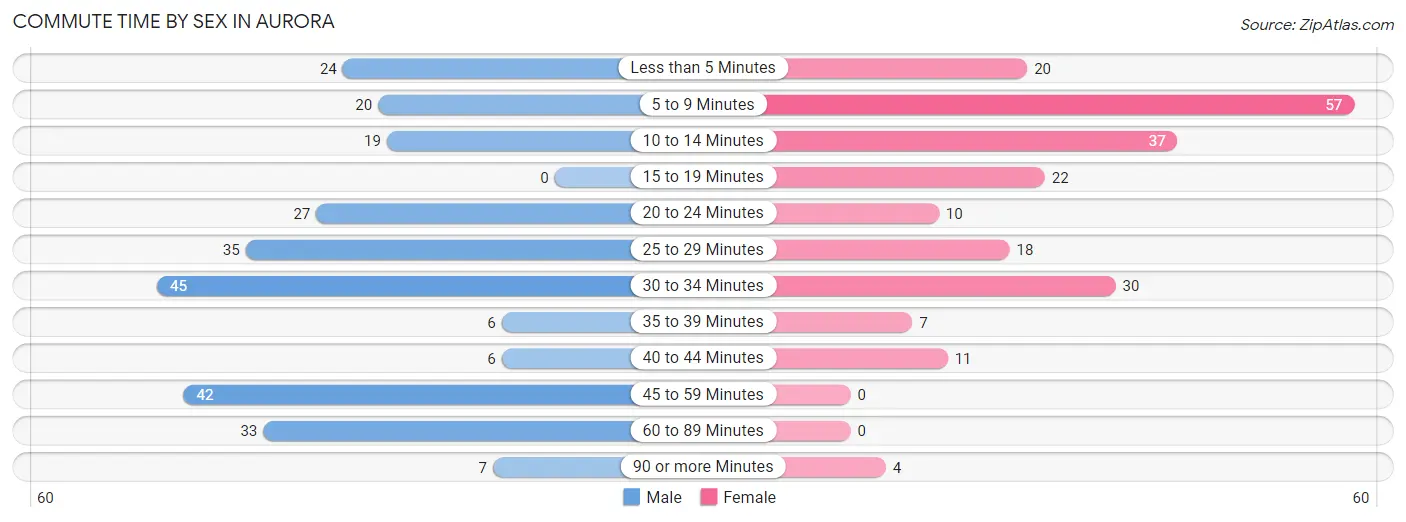
| Commute Time | Male | Female |
| Less than 5 Minutes | 24 (9.1%) | 20 (9.3%) |
| 5 to 9 Minutes | 20 (7.6%) | 57 (26.4%) |
| 10 to 14 Minutes | 19 (7.2%) | 37 (17.1%) |
| 15 to 19 Minutes | 0 (0.0%) | 22 (10.2%) |
| 20 to 24 Minutes | 27 (10.2%) | 10 (4.6%) |
| 25 to 29 Minutes | 35 (13.3%) | 18 (8.3%) |
| 30 to 34 Minutes | 45 (17.1%) | 30 (13.9%) |
| 35 to 39 Minutes | 6 (2.3%) | 7 (3.2%) |
| 40 to 44 Minutes | 6 (2.3%) | 11 (5.1%) |
| 45 to 59 Minutes | 42 (15.9%) | 0 (0.0%) |
| 60 to 89 Minutes | 33 (12.5%) | 0 (0.0%) |
| 90 or more Minutes | 7 (2.6%) | 4 (1.8%) |
Time of Departure to Work by Sex in Aurora
The most frequent times of departure to work in Aurora are 12:00 AM to 4:59 AM (52, 19.7%) for males and 7:30 AM to 7:59 AM (44, 20.4%) for females.
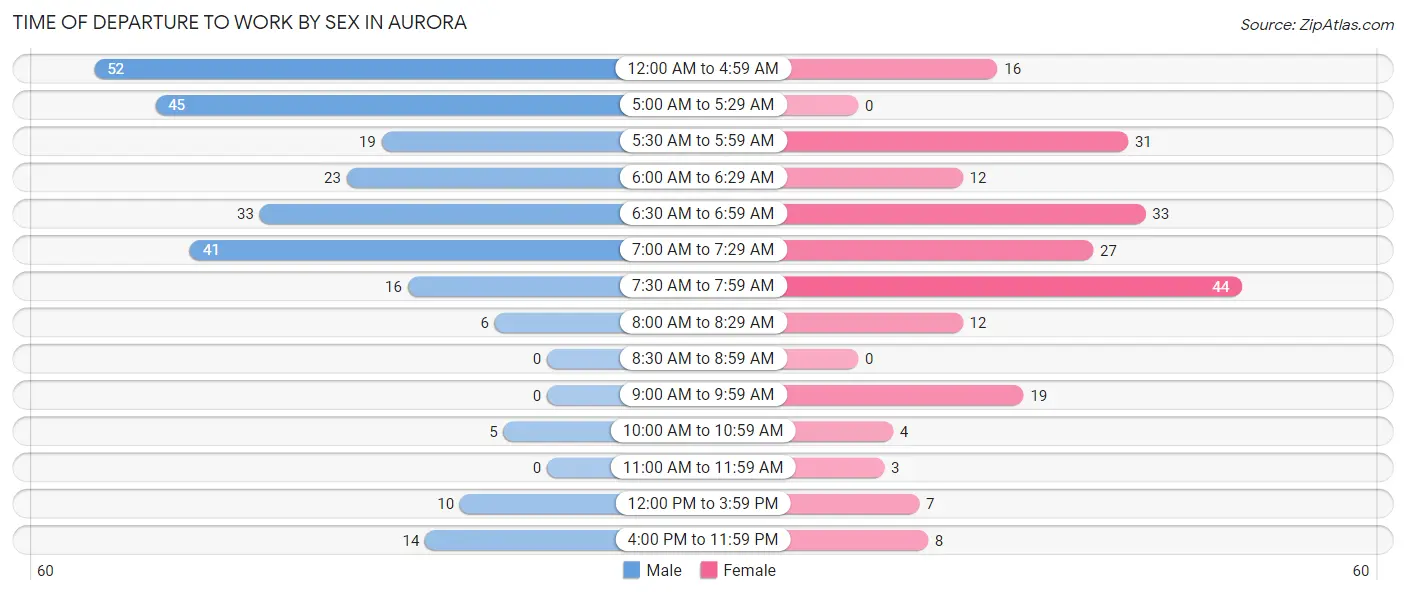
| Time of Departure | Male | Female |
| 12:00 AM to 4:59 AM | 52 (19.7%) | 16 (7.4%) |
| 5:00 AM to 5:29 AM | 45 (17.1%) | 0 (0.0%) |
| 5:30 AM to 5:59 AM | 19 (7.2%) | 31 (14.3%) |
| 6:00 AM to 6:29 AM | 23 (8.7%) | 12 (5.6%) |
| 6:30 AM to 6:59 AM | 33 (12.5%) | 33 (15.3%) |
| 7:00 AM to 7:29 AM | 41 (15.5%) | 27 (12.5%) |
| 7:30 AM to 7:59 AM | 16 (6.1%) | 44 (20.4%) |
| 8:00 AM to 8:29 AM | 6 (2.3%) | 12 (5.6%) |
| 8:30 AM to 8:59 AM | 0 (0.0%) | 0 (0.0%) |
| 9:00 AM to 9:59 AM | 0 (0.0%) | 19 (8.8%) |
| 10:00 AM to 10:59 AM | 5 (1.9%) | 4 (1.8%) |
| 11:00 AM to 11:59 AM | 0 (0.0%) | 3 (1.4%) |
| 12:00 PM to 3:59 PM | 10 (3.8%) | 7 (3.2%) |
| 4:00 PM to 11:59 PM | 14 (5.3%) | 8 (3.7%) |
| Total | 264 (100.0%) | 216 (100.0%) |
Housing Occupancy in Aurora
Occupancy by Ownership in Aurora
Of the total 912 dwellings in Aurora, owner-occupied units account for 700 (76.7%), while renter-occupied units make up 212 (23.3%).
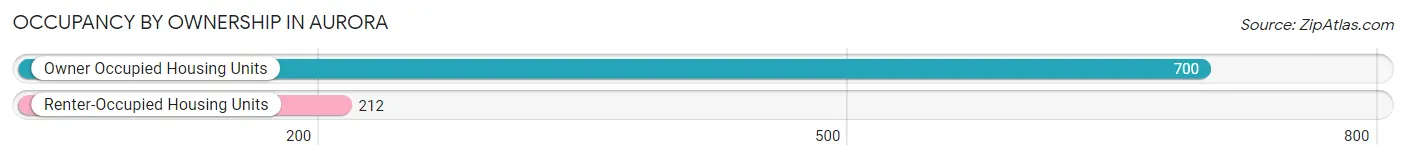
| Occupancy | # Housing Units | % Housing Units |
| Owner Occupied Housing Units | 700 | 76.7% |
| Renter-Occupied Housing Units | 212 | 23.3% |
| Total Occupied Housing Units | 912 | 100.0% |
Occupancy by Household Size in Aurora
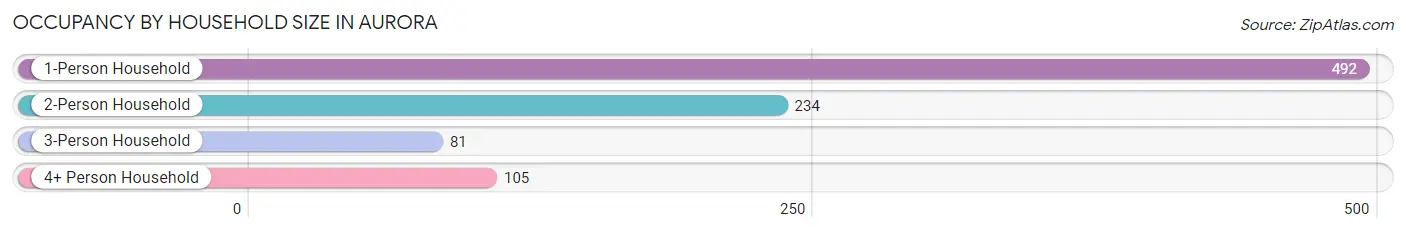
| Household Size | # Housing Units | % Housing Units |
| 1-Person Household | 492 | 53.9% |
| 2-Person Household | 234 | 25.7% |
| 3-Person Household | 81 | 8.9% |
| 4+ Person Household | 105 | 11.5% |
| Total Housing Units | 912 | 100.0% |
Occupancy by Ownership by Household Size in Aurora
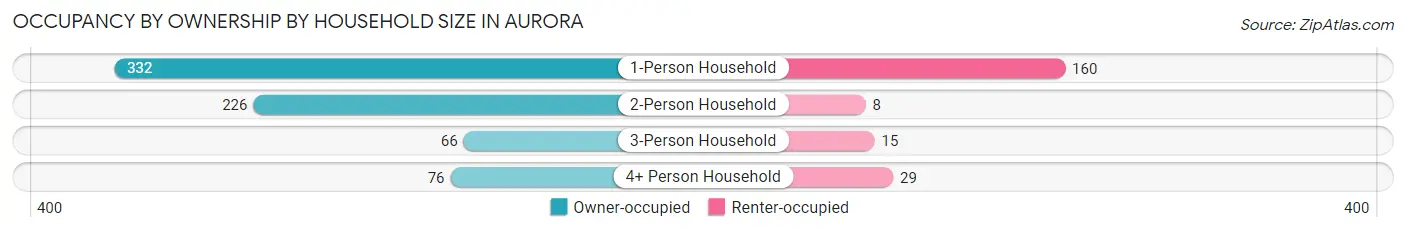
| Household Size | Owner-occupied | Renter-occupied |
| 1-Person Household | 332 (67.5%) | 160 (32.5%) |
| 2-Person Household | 226 (96.6%) | 8 (3.4%) |
| 3-Person Household | 66 (81.5%) | 15 (18.5%) |
| 4+ Person Household | 76 (72.4%) | 29 (27.6%) |
| Total Housing Units | 700 (76.7%) | 212 (23.3%) |
Occupancy by Educational Attainment in Aurora
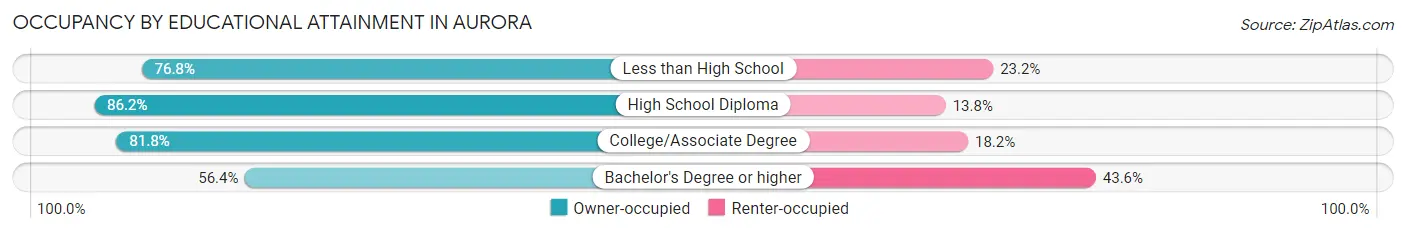
| Household Size | Owner-occupied | Renter-occupied |
| Less than High School | 96 (76.8%) | 29 (23.2%) |
| High School Diploma | 225 (86.2%) | 36 (13.8%) |
| College/Associate Degree | 265 (81.8%) | 59 (18.2%) |
| Bachelor's Degree or higher | 114 (56.4%) | 88 (43.6%) |
Occupancy by Age of Householder in Aurora
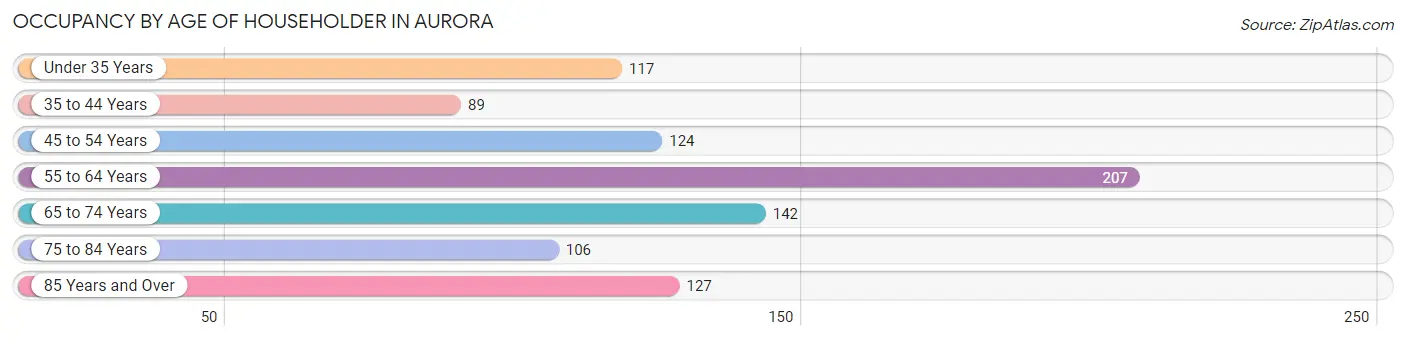
| Age Bracket | # Households | % Households |
| Under 35 Years | 117 | 12.8% |
| 35 to 44 Years | 89 | 9.8% |
| 45 to 54 Years | 124 | 13.6% |
| 55 to 64 Years | 207 | 22.7% |
| 65 to 74 Years | 142 | 15.6% |
| 75 to 84 Years | 106 | 11.6% |
| 85 Years and Over | 127 | 13.9% |
| Total | 912 | 100.0% |
Housing Finances in Aurora
Median Income by Occupancy in Aurora
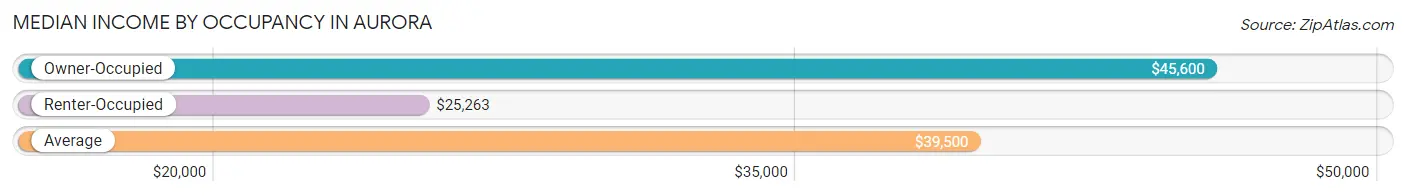
| Occupancy Type | # Households | Median Income |
| Owner-Occupied | 700 (76.7%) | $45,600 |
| Renter-Occupied | 212 (23.3%) | $25,263 |
| Average | 912 (100.0%) | $39,500 |
Occupancy by Householder Income Bracket in Aurora
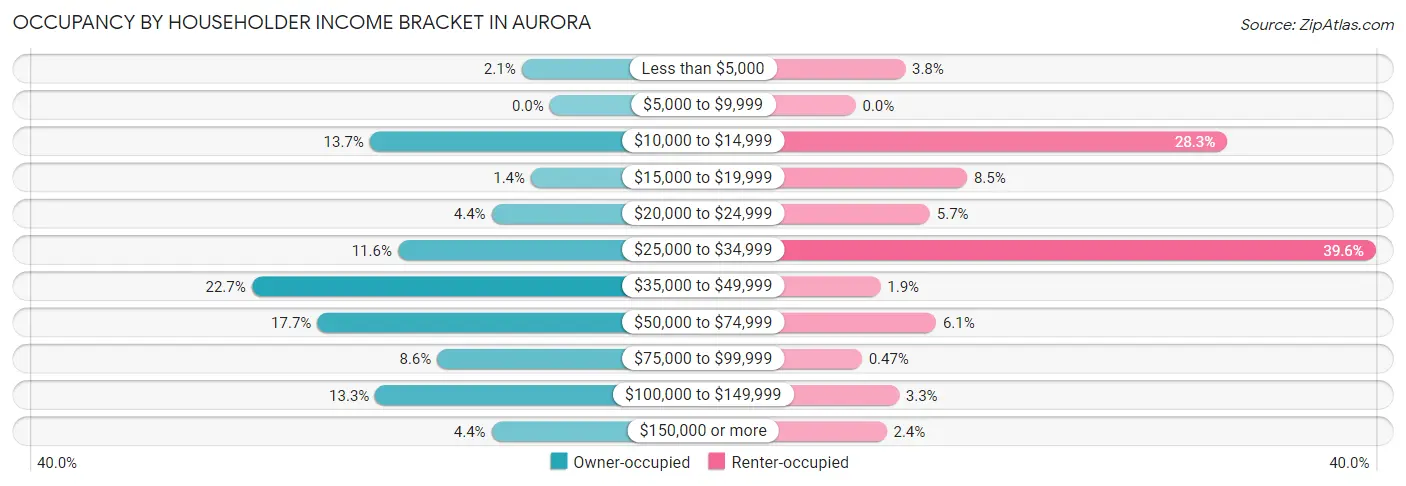
| Income Bracket | Owner-occupied | Renter-occupied |
| Less than $5,000 | 15 (2.1%) | 8 (3.8%) |
| $5,000 to $9,999 | 0 (0.0%) | 0 (0.0%) |
| $10,000 to $14,999 | 96 (13.7%) | 60 (28.3%) |
| $15,000 to $19,999 | 10 (1.4%) | 18 (8.5%) |
| $20,000 to $24,999 | 31 (4.4%) | 12 (5.7%) |
| $25,000 to $34,999 | 81 (11.6%) | 84 (39.6%) |
| $35,000 to $49,999 | 159 (22.7%) | 4 (1.9%) |
| $50,000 to $74,999 | 124 (17.7%) | 13 (6.1%) |
| $75,000 to $99,999 | 60 (8.6%) | 1 (0.5%) |
| $100,000 to $149,999 | 93 (13.3%) | 7 (3.3%) |
| $150,000 or more | 31 (4.4%) | 5 (2.4%) |
| Total | 700 (100.0%) | 212 (100.0%) |
Monthly Housing Cost Tiers in Aurora
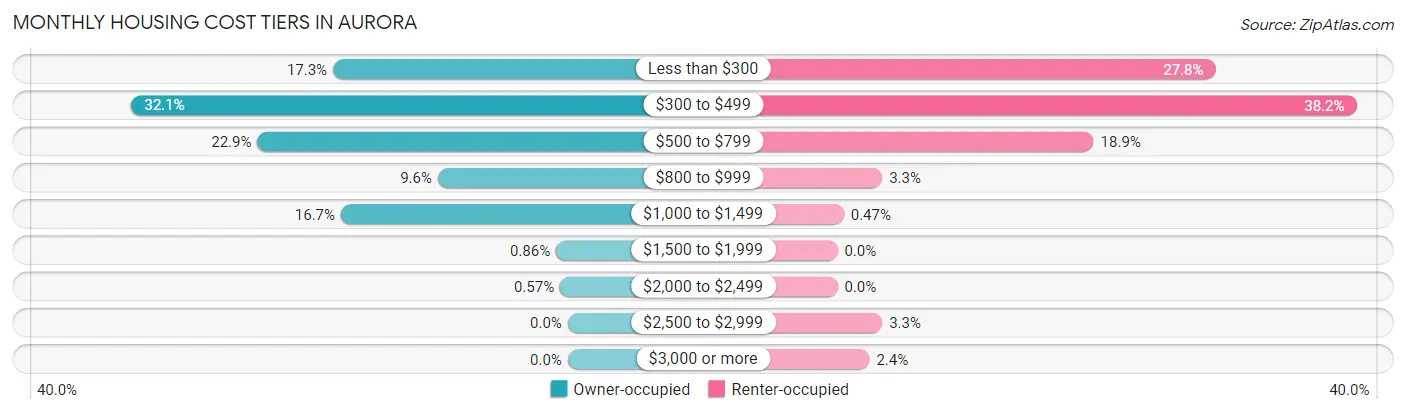
| Monthly Cost | Owner-occupied | Renter-occupied |
| Less than $300 | 121 (17.3%) | 59 (27.8%) |
| $300 to $499 | 225 (32.1%) | 81 (38.2%) |
| $500 to $799 | 160 (22.9%) | 40 (18.9%) |
| $800 to $999 | 67 (9.6%) | 7 (3.3%) |
| $1,000 to $1,499 | 117 (16.7%) | 1 (0.5%) |
| $1,500 to $1,999 | 6 (0.9%) | 0 (0.0%) |
| $2,000 to $2,499 | 4 (0.6%) | 0 (0.0%) |
| $2,500 to $2,999 | 0 (0.0%) | 7 (3.3%) |
| $3,000 or more | 0 (0.0%) | 5 (2.4%) |
| Total | 700 (100.0%) | 212 (100.0%) |
Physical Housing Characteristics in Aurora
Housing Structures in Aurora
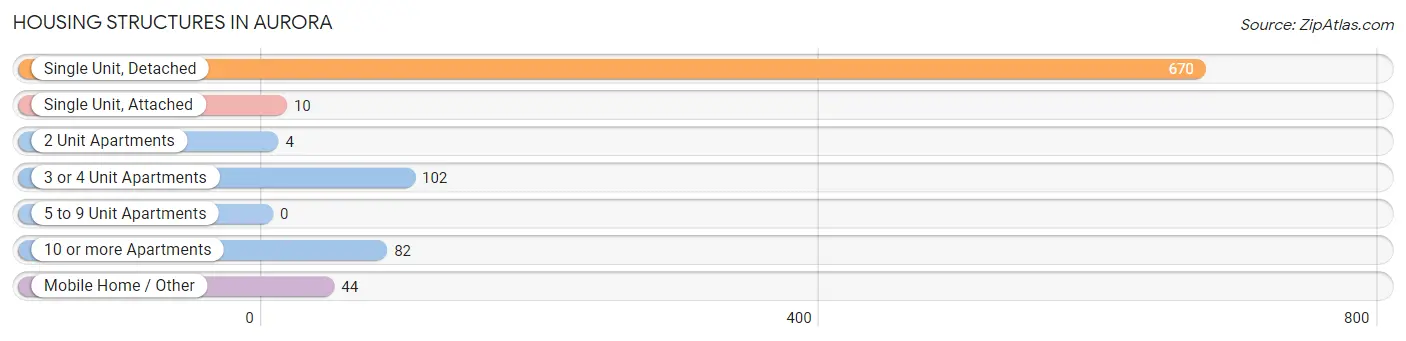
| Structure Type | # Housing Units | % Housing Units |
| Single Unit, Detached | 670 | 73.5% |
| Single Unit, Attached | 10 | 1.1% |
| 2 Unit Apartments | 4 | 0.4% |
| 3 or 4 Unit Apartments | 102 | 11.2% |
| 5 to 9 Unit Apartments | 0 | 0.0% |
| 10 or more Apartments | 82 | 9.0% |
| Mobile Home / Other | 44 | 4.8% |
| Total | 912 | 100.0% |
Housing Structures by Occupancy in Aurora
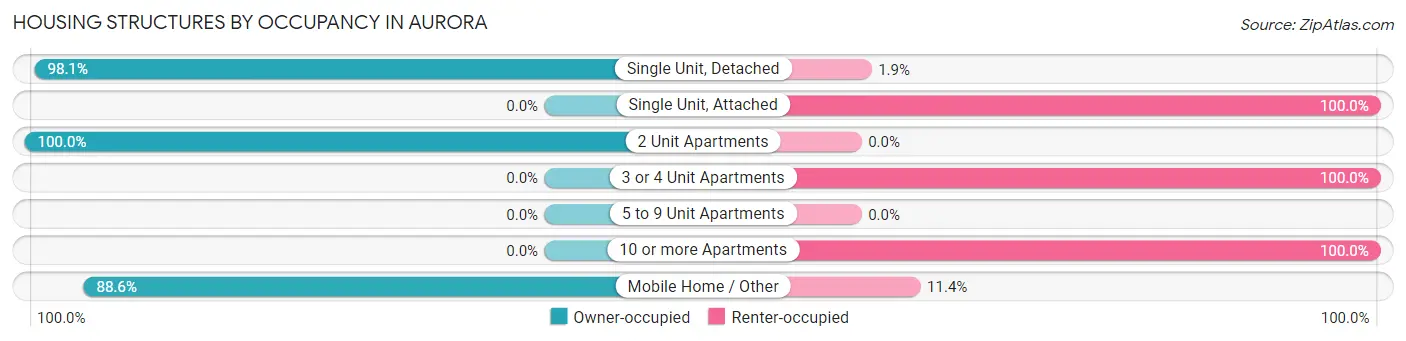
| Structure Type | Owner-occupied | Renter-occupied |
| Single Unit, Detached | 657 (98.1%) | 13 (1.9%) |
| Single Unit, Attached | 0 (0.0%) | 10 (100.0%) |
| 2 Unit Apartments | 4 (100.0%) | 0 (0.0%) |
| 3 or 4 Unit Apartments | 0 (0.0%) | 102 (100.0%) |
| 5 to 9 Unit Apartments | 0 (0.0%) | 0 (0.0%) |
| 10 or more Apartments | 0 (0.0%) | 82 (100.0%) |
| Mobile Home / Other | 39 (88.6%) | 5 (11.4%) |
| Total | 700 (76.7%) | 212 (23.3%) |
Housing Structures by Number of Rooms in Aurora
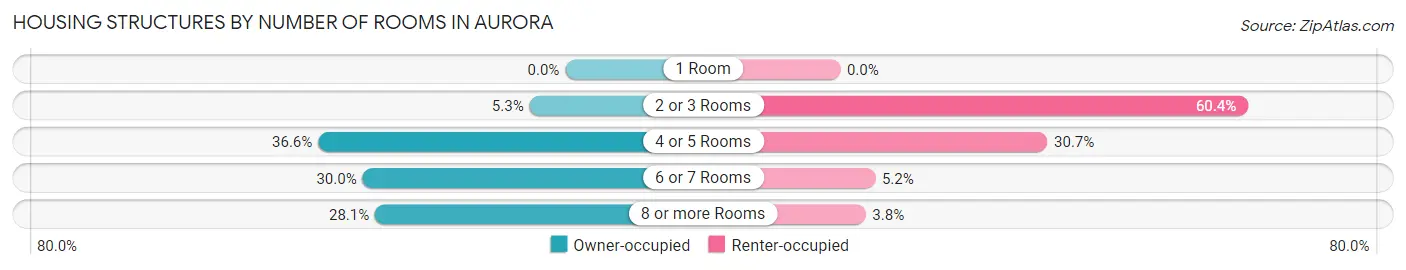
| Number of Rooms | Owner-occupied | Renter-occupied |
| 1 Room | 0 (0.0%) | 0 (0.0%) |
| 2 or 3 Rooms | 37 (5.3%) | 128 (60.4%) |
| 4 or 5 Rooms | 256 (36.6%) | 65 (30.7%) |
| 6 or 7 Rooms | 210 (30.0%) | 11 (5.2%) |
| 8 or more Rooms | 197 (28.1%) | 8 (3.8%) |
| Total | 700 (100.0%) | 212 (100.0%) |
Housing Structure by Heating Type in Aurora
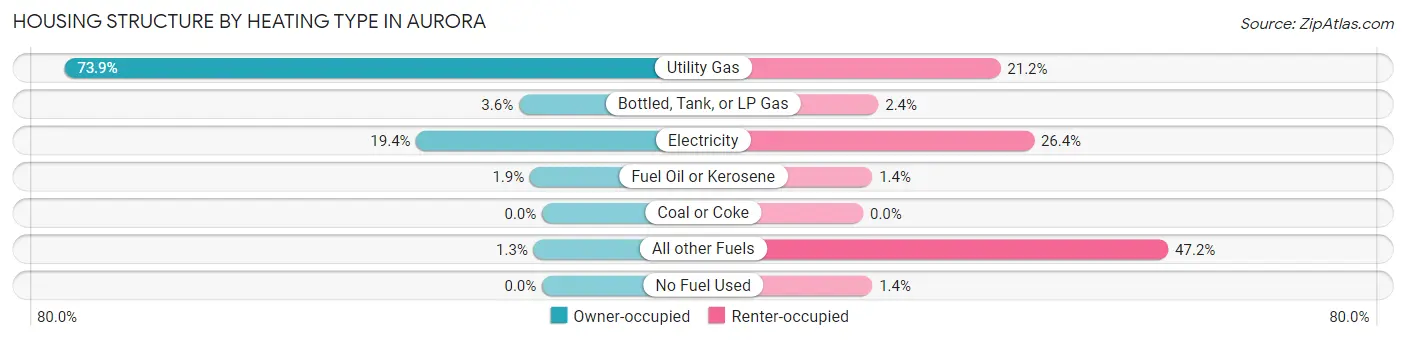
| Heating Type | Owner-occupied | Renter-occupied |
| Utility Gas | 517 (73.9%) | 45 (21.2%) |
| Bottled, Tank, or LP Gas | 25 (3.6%) | 5 (2.4%) |
| Electricity | 136 (19.4%) | 56 (26.4%) |
| Fuel Oil or Kerosene | 13 (1.9%) | 3 (1.4%) |
| Coal or Coke | 0 (0.0%) | 0 (0.0%) |
| All other Fuels | 9 (1.3%) | 100 (47.2%) |
| No Fuel Used | 0 (0.0%) | 3 (1.4%) |
| Total | 700 (100.0%) | 212 (100.0%) |
Household Vehicle Usage in Aurora
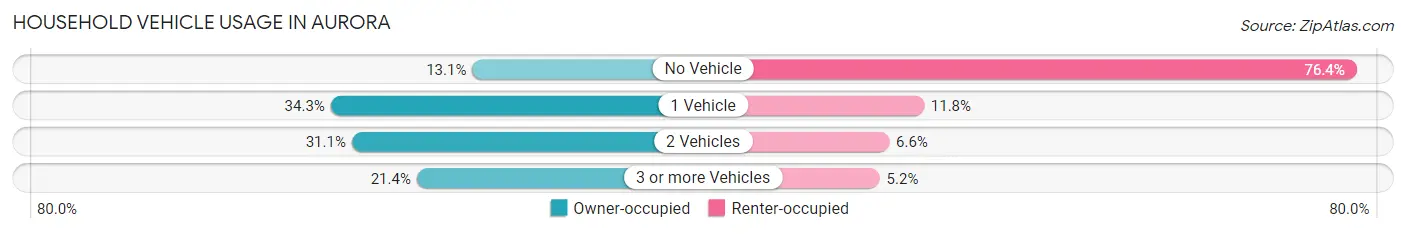
| Vehicles per Household | Owner-occupied | Renter-occupied |
| No Vehicle | 92 (13.1%) | 162 (76.4%) |
| 1 Vehicle | 240 (34.3%) | 25 (11.8%) |
| 2 Vehicles | 218 (31.1%) | 14 (6.6%) |
| 3 or more Vehicles | 150 (21.4%) | 11 (5.2%) |
| Total | 700 (100.0%) | 212 (100.0%) |
Real Estate & Mortgages in Aurora
Real Estate and Mortgage Overview in Aurora
| Characteristic | Without Mortgage | With Mortgage |
| Housing Units | 450 | 250 |
| Median Property Value | $73,800 | $90,900 |
| Median Household Income | $40,761 | $21 |
| Monthly Housing Costs | $370 | $0 |
| Real Estate Taxes | $741 | $8 |
Property Value by Mortgage Status in Aurora
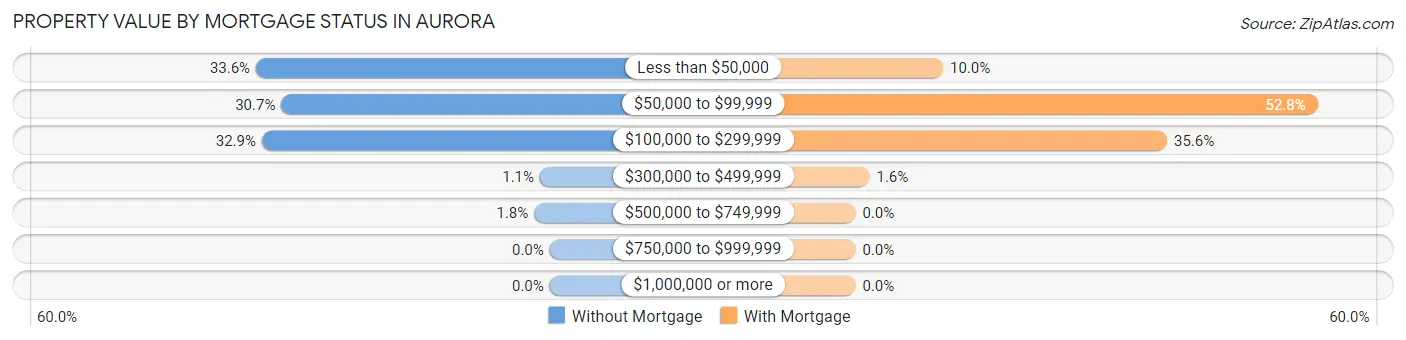
| Property Value | Without Mortgage | With Mortgage |
| Less than $50,000 | 151 (33.6%) | 25 (10.0%) |
| $50,000 to $99,999 | 138 (30.7%) | 132 (52.8%) |
| $100,000 to $299,999 | 148 (32.9%) | 89 (35.6%) |
| $300,000 to $499,999 | 5 (1.1%) | 4 (1.6%) |
| $500,000 to $749,999 | 8 (1.8%) | 0 (0.0%) |
| $750,000 to $999,999 | 0 (0.0%) | 0 (0.0%) |
| $1,000,000 or more | 0 (0.0%) | 0 (0.0%) |
| Total | 450 (100.0%) | 250 (100.0%) |
Household Income by Mortgage Status in Aurora
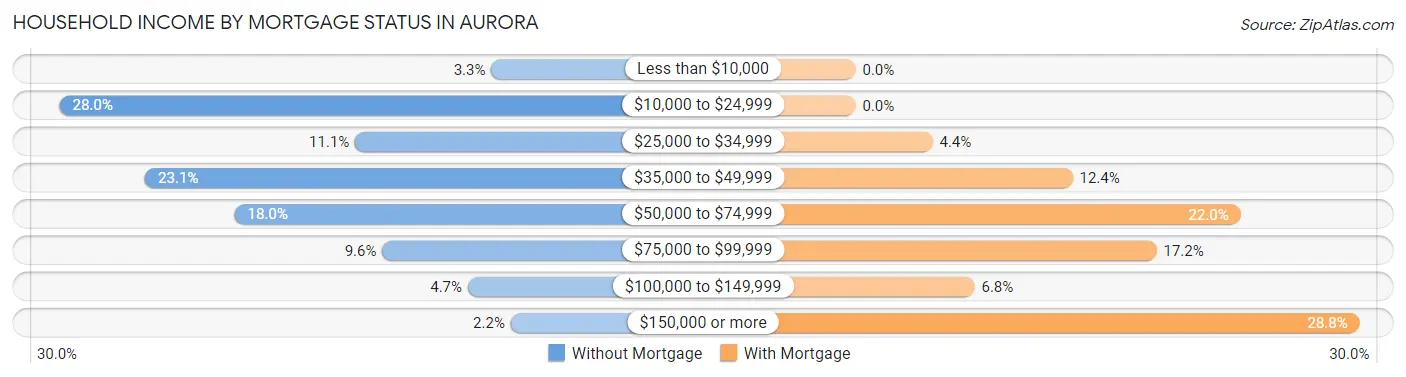
| Household Income | Without Mortgage | With Mortgage |
| Less than $10,000 | 15 (3.3%) | 0 (0.0%) |
| $10,000 to $24,999 | 126 (28.0%) | 0 (0.0%) |
| $25,000 to $34,999 | 50 (11.1%) | 11 (4.4%) |
| $35,000 to $49,999 | 104 (23.1%) | 31 (12.4%) |
| $50,000 to $74,999 | 81 (18.0%) | 55 (22.0%) |
| $75,000 to $99,999 | 43 (9.6%) | 43 (17.2%) |
| $100,000 to $149,999 | 21 (4.7%) | 17 (6.8%) |
| $150,000 or more | 10 (2.2%) | 72 (28.8%) |
| Total | 450 (100.0%) | 250 (100.0%) |
Property Value to Household Income Ratio in Aurora
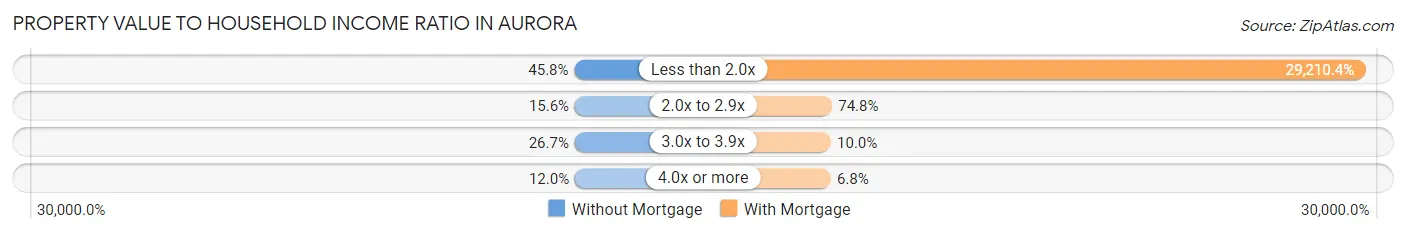
| Value-to-Income Ratio | Without Mortgage | With Mortgage |
| Less than 2.0x | 206 (45.8%) | 73,026 (29,210.4%) |
| 2.0x to 2.9x | 70 (15.6%) | 187 (74.8%) |
| 3.0x to 3.9x | 120 (26.7%) | 25 (10.0%) |
| 4.0x or more | 54 (12.0%) | 17 (6.8%) |
| Total | 450 (100.0%) | 250 (100.0%) |
Real Estate Taxes by Mortgage Status in Aurora

| Property Taxes | Without Mortgage | With Mortgage |
| Less than $800 | 265 (58.9%) | 0 (0.0%) |
| $800 to $1,499 | 96 (21.3%) | 111 (44.4%) |
| $800 to $1,499 | 89 (19.8%) | 70 (28.0%) |
| Total | 450 (100.0%) | 250 (100.0%) |
Health & Disability in Aurora
Health Insurance Coverage by Age in Aurora
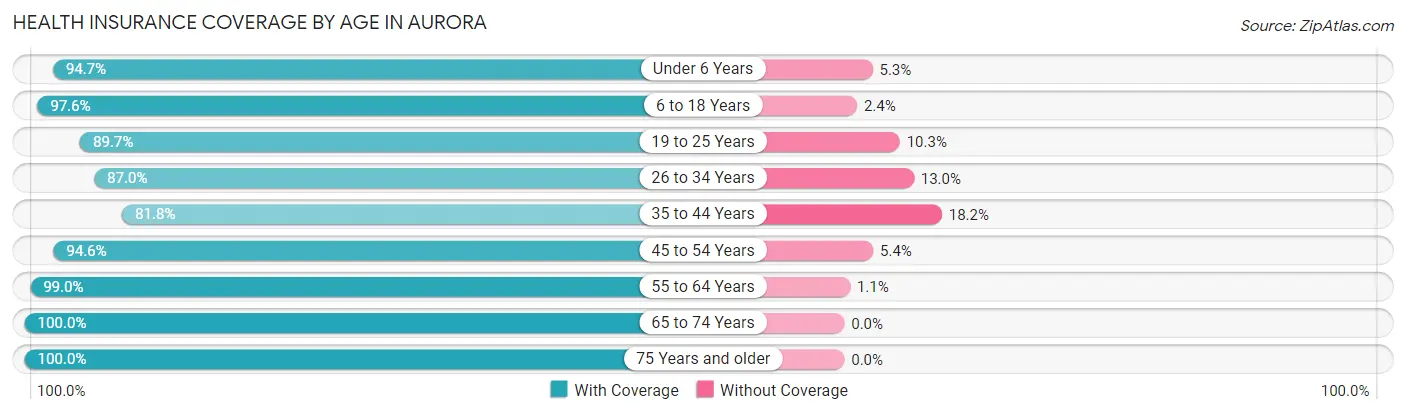
| Age Bracket | With Coverage | Without Coverage |
| Under 6 Years | 90 (94.7%) | 5 (5.3%) |
| 6 to 18 Years | 247 (97.6%) | 6 (2.4%) |
| 19 to 25 Years | 52 (89.7%) | 6 (10.3%) |
| 26 to 34 Years | 141 (87.0%) | 21 (13.0%) |
| 35 to 44 Years | 117 (81.8%) | 26 (18.2%) |
| 45 to 54 Years | 194 (94.6%) | 11 (5.4%) |
| 55 to 64 Years | 283 (99.0%) | 3 (1.1%) |
| 65 to 74 Years | 245 (100.0%) | 0 (0.0%) |
| 75 Years and older | 281 (100.0%) | 0 (0.0%) |
| Total | 1,650 (95.5%) | 78 (4.5%) |
Health Insurance Coverage by Citizenship Status in Aurora
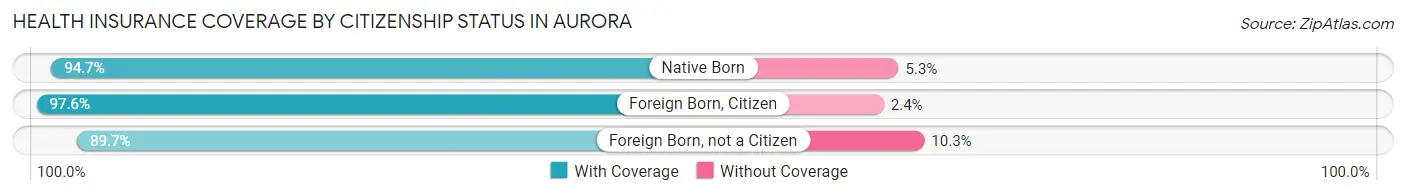
| Citizenship Status | With Coverage | Without Coverage |
| Native Born | 90 (94.7%) | 5 (5.3%) |
| Foreign Born, Citizen | 247 (97.6%) | 6 (2.4%) |
| Foreign Born, not a Citizen | 52 (89.7%) | 6 (10.3%) |
Health Insurance Coverage by Household Income in Aurora
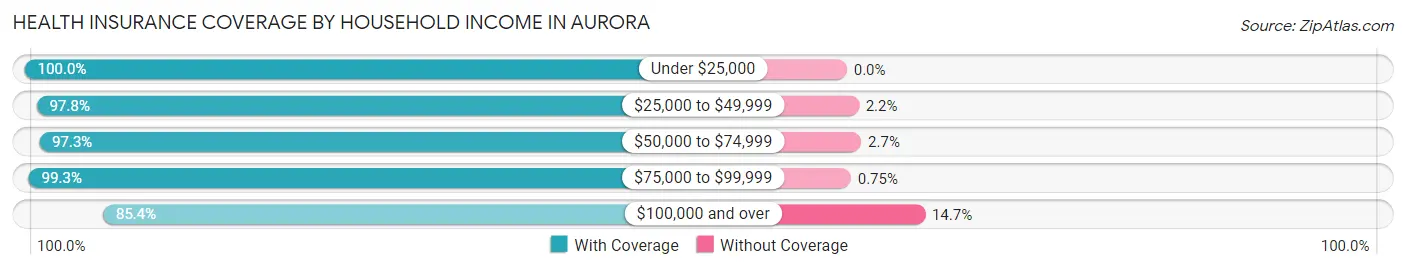
| Household Income | With Coverage | Without Coverage |
| Under $25,000 | 358 (100.0%) | 0 (0.0%) |
| $25,000 to $49,999 | 525 (97.8%) | 12 (2.2%) |
| $50,000 to $74,999 | 325 (97.3%) | 9 (2.7%) |
| $75,000 to $99,999 | 133 (99.3%) | 1 (0.7%) |
| $100,000 and over | 303 (85.4%) | 52 (14.6%) |
Public vs Private Health Insurance Coverage by Age in Aurora
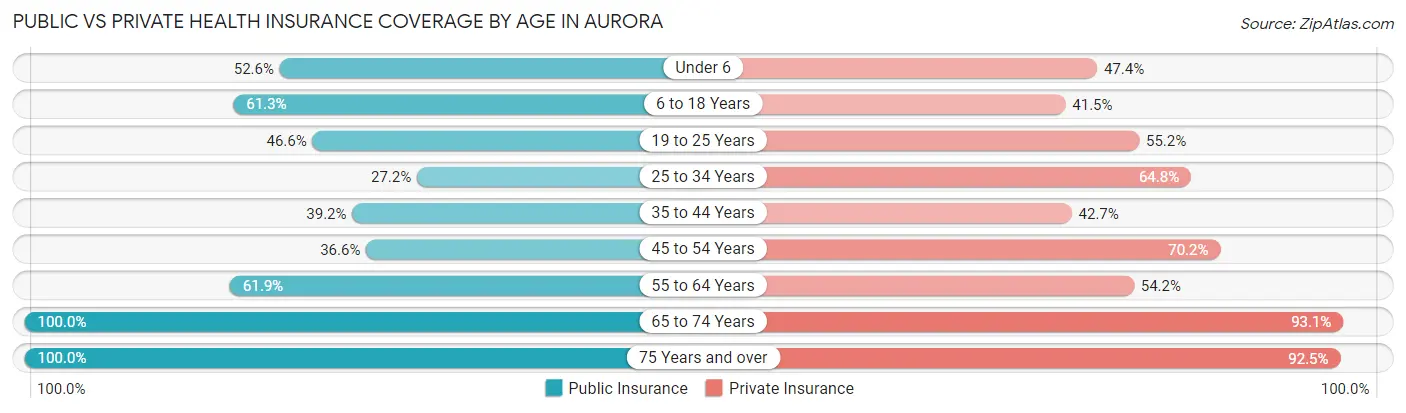
| Age Bracket | Public Insurance | Private Insurance |
| Under 6 | 50 (52.6%) | 45 (47.4%) |
| 6 to 18 Years | 155 (61.3%) | 105 (41.5%) |
| 19 to 25 Years | 27 (46.6%) | 32 (55.2%) |
| 25 to 34 Years | 44 (27.2%) | 105 (64.8%) |
| 35 to 44 Years | 56 (39.2%) | 61 (42.7%) |
| 45 to 54 Years | 75 (36.6%) | 144 (70.2%) |
| 55 to 64 Years | 177 (61.9%) | 155 (54.2%) |
| 65 to 74 Years | 245 (100.0%) | 228 (93.1%) |
| 75 Years and over | 281 (100.0%) | 260 (92.5%) |
| Total | 1,110 (64.2%) | 1,135 (65.7%) |
Disability Status by Sex by Age in Aurora
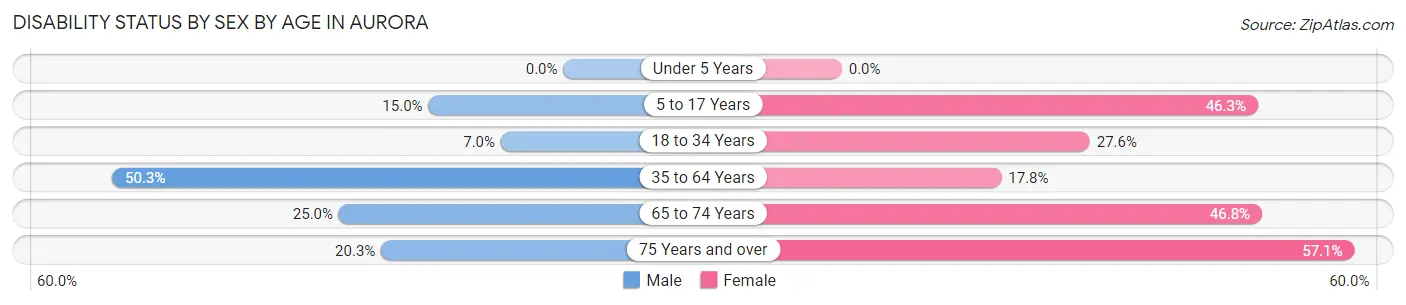
| Age Bracket | Male | Female |
| Under 5 Years | 0 (0.0%) | 0 (0.0%) |
| 5 to 17 Years | 23 (15.0%) | 63 (46.3%) |
| 18 to 34 Years | 8 (7.0%) | 29 (27.6%) |
| 35 to 64 Years | 197 (50.3%) | 43 (17.8%) |
| 65 to 74 Years | 34 (25.0%) | 51 (46.8%) |
| 75 Years and over | 14 (20.3%) | 121 (57.1%) |
Disability Class by Sex by Age in Aurora
Disability Class: Hearing Difficulty
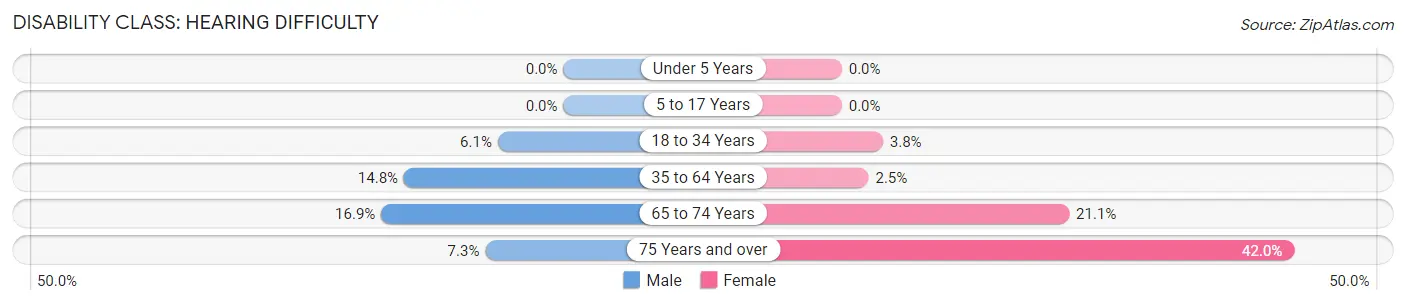
| Age Bracket | Male | Female |
| Under 5 Years | 0 (0.0%) | 0 (0.0%) |
| 5 to 17 Years | 0 (0.0%) | 0 (0.0%) |
| 18 to 34 Years | 7 (6.1%) | 4 (3.8%) |
| 35 to 64 Years | 58 (14.8%) | 6 (2.5%) |
| 65 to 74 Years | 23 (16.9%) | 23 (21.1%) |
| 75 Years and over | 5 (7.2%) | 89 (42.0%) |
Disability Class: Vision Difficulty
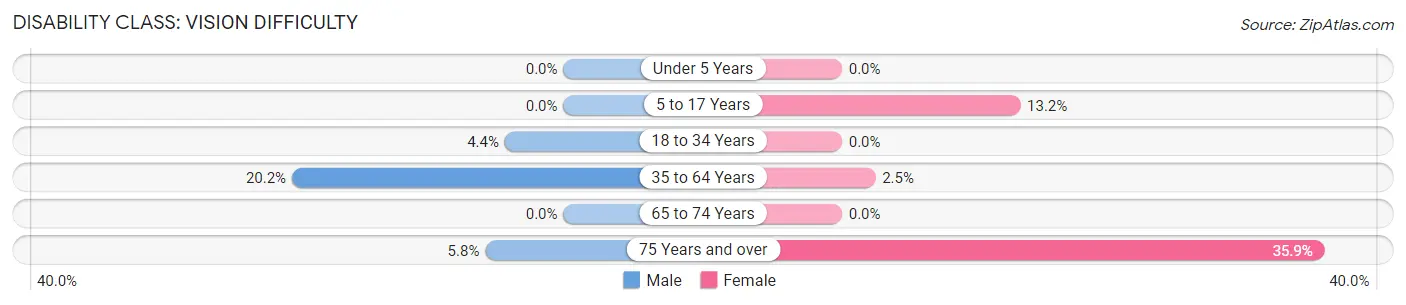
| Age Bracket | Male | Female |
| Under 5 Years | 0 (0.0%) | 0 (0.0%) |
| 5 to 17 Years | 0 (0.0%) | 18 (13.2%) |
| 18 to 34 Years | 5 (4.3%) | 0 (0.0%) |
| 35 to 64 Years | 79 (20.2%) | 6 (2.5%) |
| 65 to 74 Years | 0 (0.0%) | 0 (0.0%) |
| 75 Years and over | 4 (5.8%) | 76 (35.8%) |
Disability Class: Cognitive Difficulty
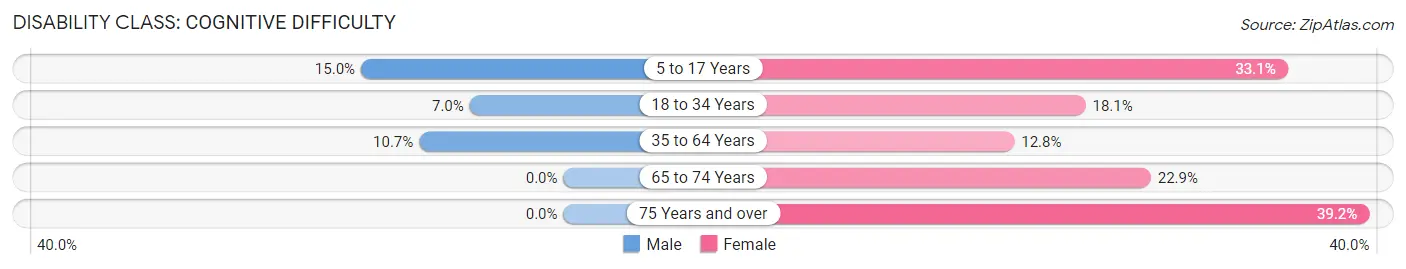
| Age Bracket | Male | Female |
| 5 to 17 Years | 23 (15.0%) | 45 (33.1%) |
| 18 to 34 Years | 8 (7.0%) | 19 (18.1%) |
| 35 to 64 Years | 42 (10.7%) | 31 (12.8%) |
| 65 to 74 Years | 0 (0.0%) | 25 (22.9%) |
| 75 Years and over | 0 (0.0%) | 83 (39.2%) |
Disability Class: Ambulatory Difficulty
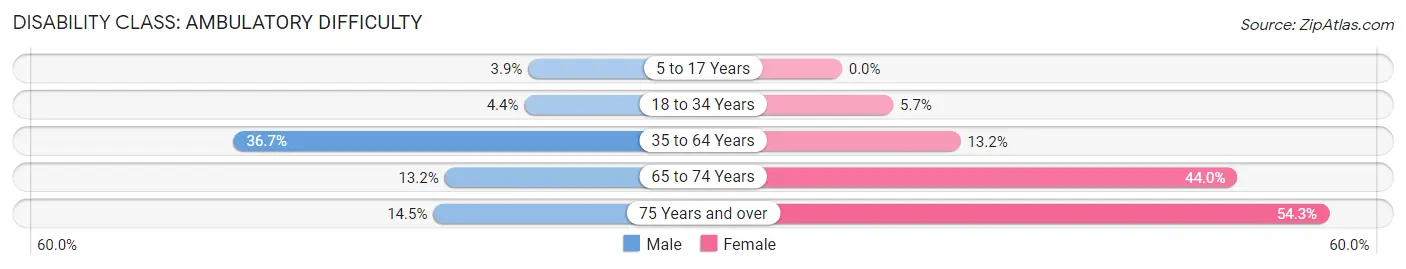
| Age Bracket | Male | Female |
| 5 to 17 Years | 6 (3.9%) | 0 (0.0%) |
| 18 to 34 Years | 5 (4.3%) | 6 (5.7%) |
| 35 to 64 Years | 144 (36.7%) | 32 (13.2%) |
| 65 to 74 Years | 18 (13.2%) | 48 (44.0%) |
| 75 Years and over | 10 (14.5%) | 115 (54.2%) |
Disability Class: Self-Care Difficulty
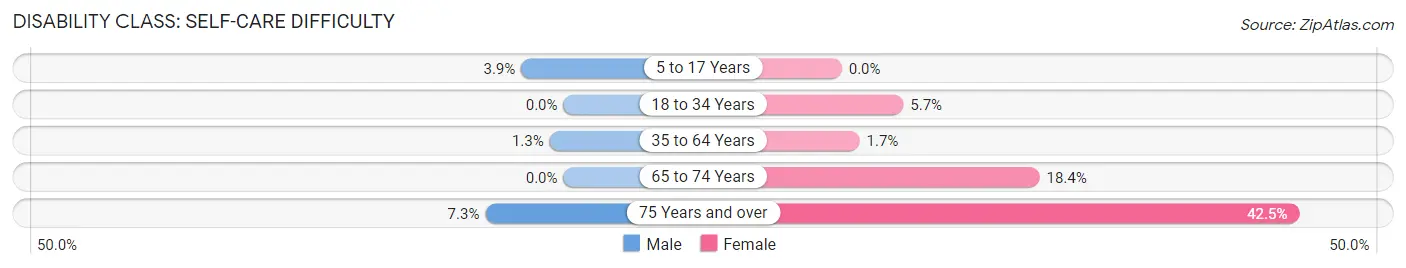
| Age Bracket | Male | Female |
| 5 to 17 Years | 6 (3.9%) | 0 (0.0%) |
| 18 to 34 Years | 0 (0.0%) | 6 (5.7%) |
| 35 to 64 Years | 5 (1.3%) | 4 (1.7%) |
| 65 to 74 Years | 0 (0.0%) | 20 (18.3%) |
| 75 Years and over | 5 (7.2%) | 90 (42.4%) |
Technology Access in Aurora
Computing Device Access in Aurora
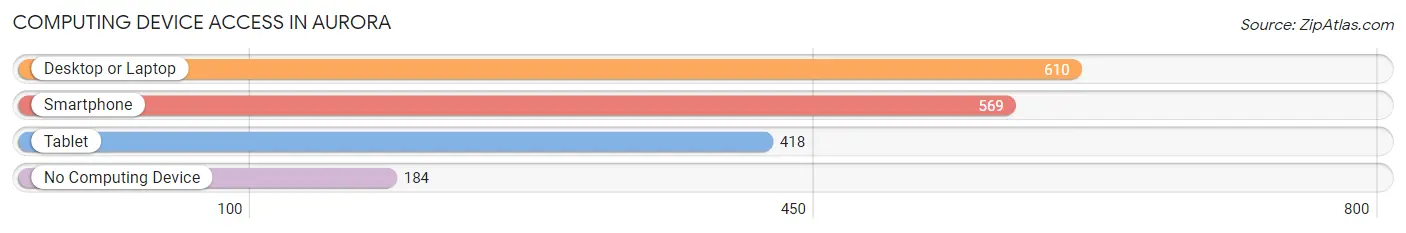
| Device Type | # Households | % Households |
| Desktop or Laptop | 610 | 66.9% |
| Smartphone | 569 | 62.4% |
| Tablet | 418 | 45.8% |
| No Computing Device | 184 | 20.2% |
| Total | 912 | 100.0% |
Internet Access in Aurora
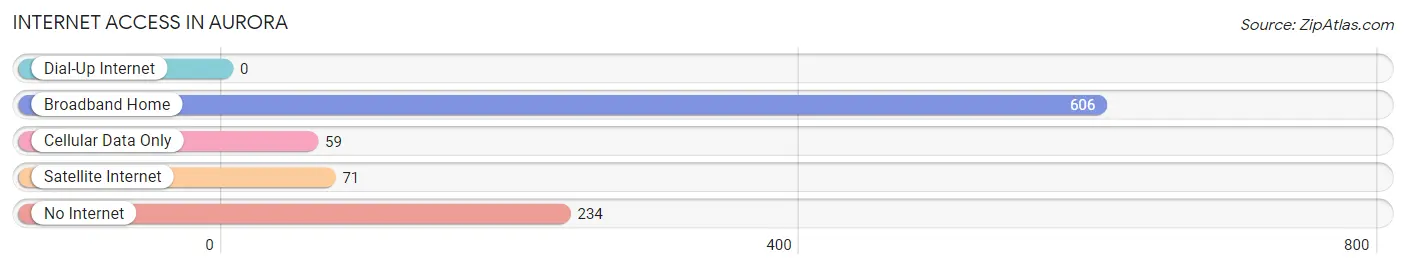
| Internet Type | # Households | % Households |
| Dial-Up Internet | 0 | 0.0% |
| Broadband Home | 606 | 66.4% |
| Cellular Data Only | 59 | 6.5% |
| Satellite Internet | 71 | 7.8% |
| No Internet | 234 | 25.7% |
| Total | 912 | 100.0% |
Aurora Summary
Aurora, Minnesota is a small city located in St. Louis County, Minnesota. It is situated on the western edge of the Mesabi Iron Range, approximately 25 miles northwest of Duluth. The city has a population of approximately 1,400 people and is part of the larger Iron Range region.
History
Aurora was founded in 1892 by a group of Finnish immigrants who had come to the area to work in the iron ore mines. The city was named after Aurora, the Roman goddess of the dawn. The city was incorporated in 1901 and quickly grew to become a bustling mining town. The city was home to several large iron ore mines, including the Aurora Mine, which was the largest in the region.
The city experienced a period of growth and prosperity in the early 20th century, but the Great Depression and the decline of the iron ore industry in the 1950s and 1960s caused the city to suffer economically. The city was able to recover in the 1970s and 1980s, thanks to the development of tourism and the growth of the local service industry.
Geography
Aurora is located in St. Louis County, Minnesota, approximately 25 miles northwest of Duluth. The city is situated on the western edge of the Mesabi Iron Range, a region of hills and valleys that is rich in iron ore deposits. The city is surrounded by forests and lakes, and is located near the Boundary Waters Canoe Area Wilderness.
The city has a total area of 1.3 square miles, all of which is land. The city is located at an elevation of 1,400 feet above sea level.
Economy
Aurora’s economy is largely based on tourism and the service industry. The city is home to several tourist attractions, including the Iron Range Museum, the Aurora Historical Society, and the Aurora Mine. The city is also home to several restaurants, bars, and shops.
The city is also home to several manufacturing companies, including a paper mill and a steel mill. The city is also home to several mining companies, which are involved in the extraction of iron ore from the Mesabi Iron Range.
Demographics
As of the 2010 census, Aurora had a population of 1,400 people. The racial makeup of the city was 97.4% White, 0.6% African American, 0.3% Native American, 0.3% Asian, 0.1% Pacific Islander, 0.3% from other races, and 0.9% from two or more races. Hispanic or Latino of any race were 1.3% of the population.
The median household income in Aurora was $41,250, and the median family income was $50,000. The per capita income for the city was $20,945. About 11.2% of families and 14.2% of the population were below the poverty line, including 18.2% of those under age 18 and 8.3% of those age 65 or over.
Common Questions
What is Per Capita Income in Aurora?
Per Capita income in Aurora is $28,052.
What is the Median Family Income in Aurora?
Median Family Income in Aurora is $58,750.
What is the Median Household income in Aurora?
Median Household Income in Aurora is $39,500.
What is Income or Wage Gap in Aurora?
Income or Wage Gap in Aurora is 18.6%.
Women in Aurora earn 81.4 cents for every dollar earned by a man.
What is Inequality or Gini Index in Aurora?
Inequality or Gini Index in Aurora is 0.44.
What is the Total Population of Aurora?
Total Population of Aurora is 1,775.
What is the Total Male Population of Aurora?
Total Male Population of Aurora is 908.
What is the Total Female Population of Aurora?
Total Female Population of Aurora is 867.
What is the Ratio of Males per 100 Females in Aurora?
There are 104.73 Males per 100 Females in Aurora.
What is the Ratio of Females per 100 Males in Aurora?
There are 95.48 Females per 100 Males in Aurora.
What is the Median Population Age in Aurora?
Median Population Age in Aurora is 54.0 Years.
What is the Average Family Size in Aurora
Average Family Size in Aurora is 2.7 People.
What is the Average Household Size in Aurora
Average Household Size in Aurora is 1.9 People.
How Large is the Labor Force in Aurora?
There are 568 People in the Labor Forcein in Aurora.
What is the Percentage of People in the Labor Force in Aurora?
38.8% of People are in the Labor Force in Aurora.
What is the Unemployment Rate in Aurora?
Unemployment Rate in Aurora is 6.9%.