Atwater, MN Map & Demographics
Atwater Map
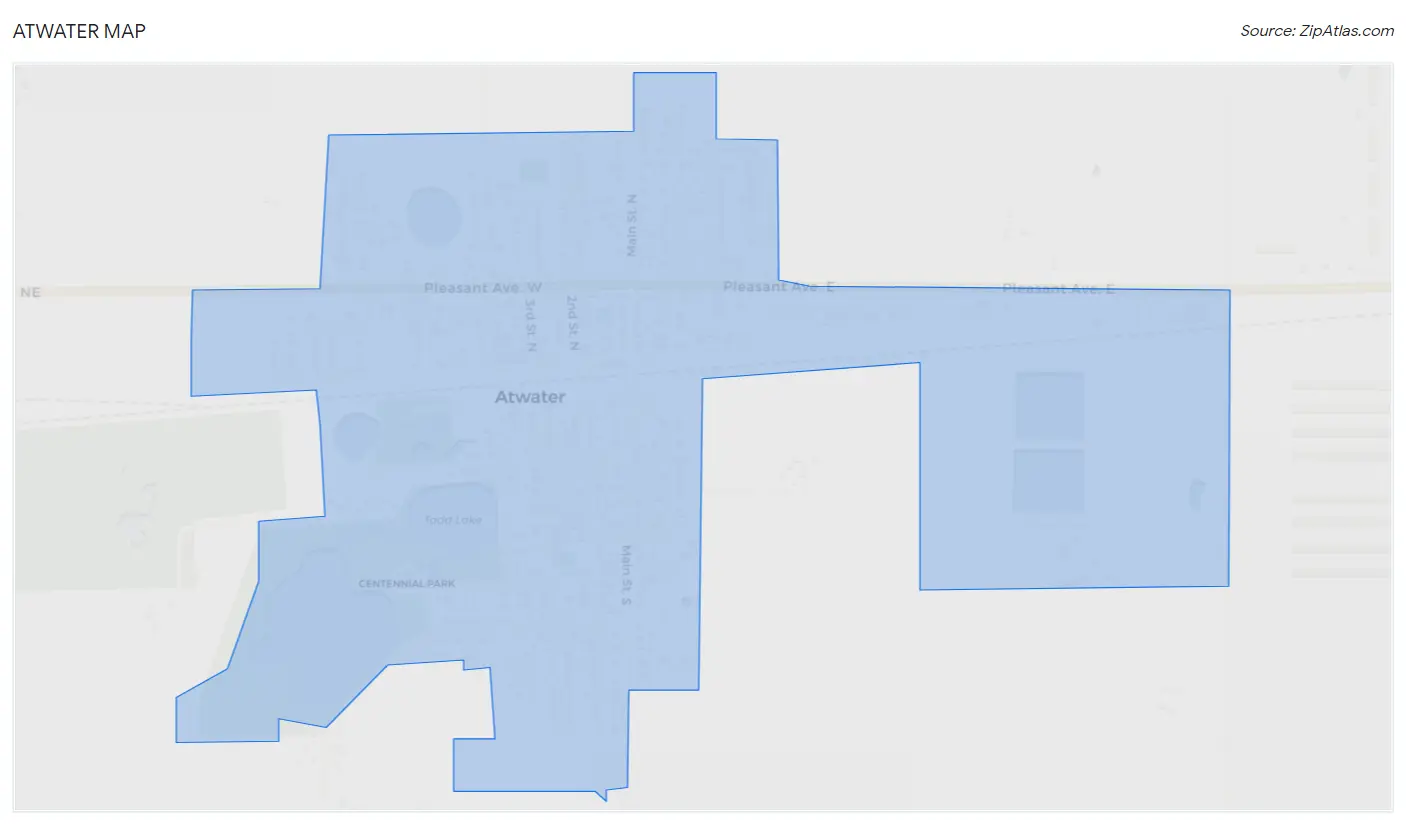
Atwater Overview
$27,673
PER CAPITA INCOME
$85,804
AVG FAMILY INCOME
$65,000
AVG HOUSEHOLD INCOME
8.0%
WAGE / INCOME GAP [ % ]
92.0¢/ $1
WAGE / INCOME GAP [ $ ]
0.35
INEQUALITY / GINI INDEX
1,210
TOTAL POPULATION
658
MALE POPULATION
552
FEMALE POPULATION
119.20
MALES / 100 FEMALES
83.89
FEMALES / 100 MALES
31.2
MEDIAN AGE
3.9
AVG FAMILY SIZE
2.9
AVG HOUSEHOLD SIZE
661
LABOR FORCE [ PEOPLE ]
78.0%
PERCENT IN LABOR FORCE
8.6%
UNEMPLOYMENT RATE
Atwater Zip Codes
Atwater Area Codes
Income in Atwater
Income Overview in Atwater
Per Capita Income in Atwater is $27,673, while median incomes of families and households are $85,804 and $65,000 respectively.
| Characteristic | Number | Measure |
| Per Capita Income | 1,210 | $27,673 |
| Median Family Income | 255 | $85,804 |
| Mean Family Income | 255 | $91,689 |
| Median Household Income | 416 | $65,000 |
| Mean Household Income | 416 | $73,669 |
| Income Deficit | 255 | $0 |
| Wage / Income Gap (%) | 1,210 | 7.99% |
| Wage / Income Gap ($) | 1,210 | 92.01¢ per $1 |
| Gini / Inequality Index | 1,210 | 0.35 |
Earnings by Sex in Atwater
Average Earnings in Atwater are $40,288, $38,654 for men and $42,011 for women, a difference of 8.0%.
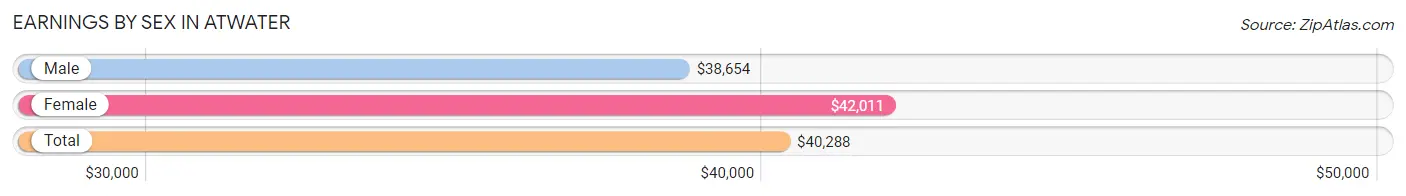
| Sex | Number | Average Earnings |
| Male | 374 (55.2%) | $38,654 |
| Female | 303 (44.8%) | $42,011 |
| Total | 677 (100.0%) | $40,288 |
Earnings by Sex by Income Bracket in Atwater
The most common earnings brackets in Atwater are $35,000 to $39,999 for men (50 | 13.4%) and $40,000 to $44,999 for women (47 | 15.5%).

| Income | Male | Female |
| $2,499 or less | 23 (6.1%) | 10 (3.3%) |
| $2,500 to $4,999 | 11 (2.9%) | 9 (3.0%) |
| $5,000 to $7,499 | 6 (1.6%) | 26 (8.6%) |
| $7,500 to $9,999 | 3 (0.8%) | 4 (1.3%) |
| $10,000 to $12,499 | 11 (2.9%) | 11 (3.6%) |
| $12,500 to $14,999 | 7 (1.9%) | 2 (0.7%) |
| $15,000 to $17,499 | 10 (2.7%) | 15 (5.0%) |
| $17,500 to $19,999 | 0 (0.0%) | 3 (1.0%) |
| $20,000 to $22,499 | 13 (3.5%) | 8 (2.6%) |
| $22,500 to $24,999 | 3 (0.8%) | 4 (1.3%) |
| $25,000 to $29,999 | 15 (4.0%) | 16 (5.3%) |
| $30,000 to $34,999 | 49 (13.1%) | 3 (1.0%) |
| $35,000 to $39,999 | 50 (13.4%) | 22 (7.3%) |
| $40,000 to $44,999 | 29 (7.7%) | 47 (15.5%) |
| $45,000 to $49,999 | 32 (8.6%) | 25 (8.3%) |
| $50,000 to $54,999 | 17 (4.5%) | 33 (10.9%) |
| $55,000 to $64,999 | 41 (11.0%) | 40 (13.2%) |
| $65,000 to $74,999 | 11 (2.9%) | 19 (6.3%) |
| $75,000 to $99,999 | 31 (8.3%) | 0 (0.0%) |
| $100,000+ | 12 (3.2%) | 6 (2.0%) |
| Total | 374 (100.0%) | 303 (100.0%) |
Earnings by Sex by Educational Attainment in Atwater
Average earnings in Atwater are $42,266 for men and $43,594 for women, a difference of 3.0%. Men with an educational attainment of college or associate's degree enjoy the highest average annual earnings of $51,094, while those with high school diploma education earn the least with $40,313. Women with an educational attainment of graduate degree earn the most with the average annual earnings of $63,125, while those with high school diploma education have the smallest earnings of $37,500.
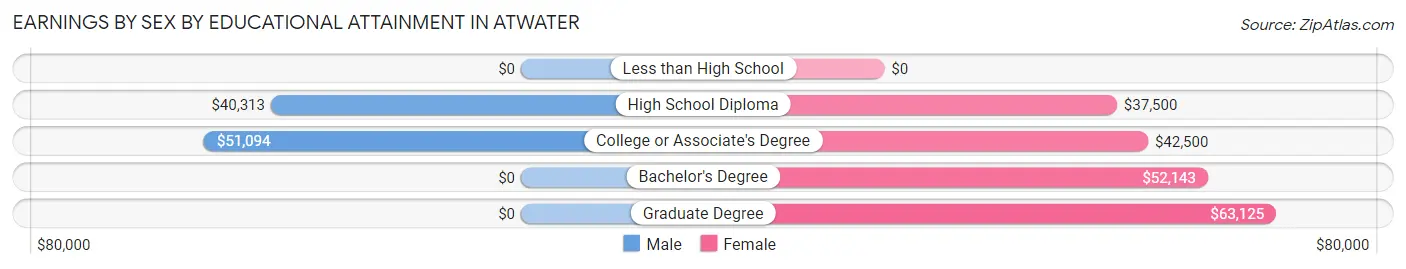
| Educational Attainment | Male Income | Female Income |
| Less than High School | - | - |
| High School Diploma | $40,313 | $37,500 |
| College or Associate's Degree | $51,094 | $42,500 |
| Bachelor's Degree | - | - |
| Graduate Degree | - | - |
| Total | $42,266 | $43,594 |
Family Income in Atwater
Family Income Brackets in Atwater
According to the Atwater family income data, there are 67 families falling into the $100,000 to $149,999 income range, which is the most common income bracket and makes up 26.3% of all families.
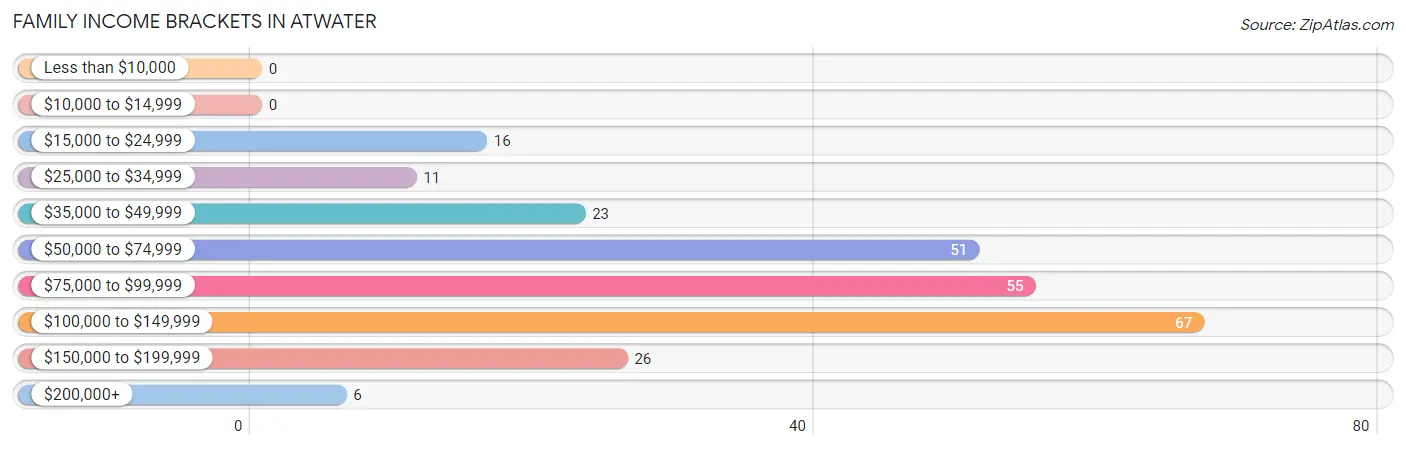
| Income Bracket | # Families | % Families |
| Less than $10,000 | 0 | 0.0% |
| $10,000 to $14,999 | 0 | 0.0% |
| $15,000 to $24,999 | 16 | 6.3% |
| $25,000 to $34,999 | 11 | 4.3% |
| $35,000 to $49,999 | 23 | 9.0% |
| $50,000 to $74,999 | 51 | 20.0% |
| $75,000 to $99,999 | 55 | 21.6% |
| $100,000 to $149,999 | 67 | 26.3% |
| $150,000 to $199,999 | 26 | 10.2% |
| $200,000+ | 6 | 2.4% |
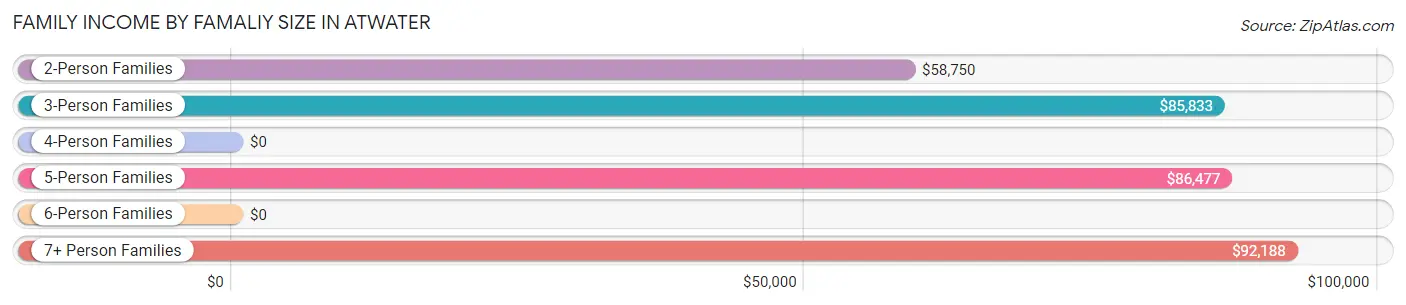
Family Income by Famaliy Size in Atwater
7+ person families (20 | 7.8%) account for the highest median family income in Atwater with $92,188 per family, while 2-person families (120 | 47.1%) have the highest median income of $29,375 per family member.
| Income Bracket | # Families | Median Income |
| 2-Person Families | 120 (47.1%) | $58,750 |
| 3-Person Families | 36 (14.1%) | $85,833 |
| 4-Person Families | 36 (14.1%) | $0 |
| 5-Person Families | 39 (15.3%) | $86,477 |
| 6-Person Families | 4 (1.6%) | $0 |
| 7+ Person Families | 20 (7.8%) | $92,188 |
| Total | 255 (100.0%) | $85,804 |
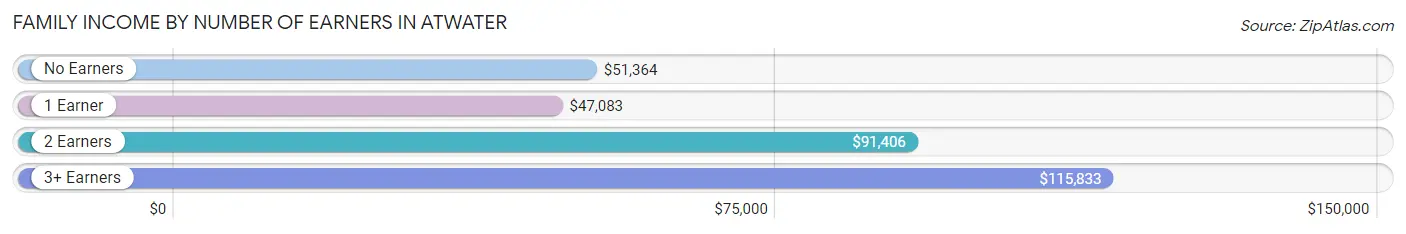
Family Income by Number of Earners in Atwater
The median family income in Atwater is $85,804, with families comprising 3+ earners (38) having the highest median family income of $115,833, while families with 1 earner (60) have the lowest median family income of $47,083, accounting for 14.9% and 23.5% of families, respectively.
| Number of Earners | # Families | Median Income |
| No Earners | 22 (8.6%) | $51,364 |
| 1 Earner | 60 (23.5%) | $47,083 |
| 2 Earners | 135 (52.9%) | $91,406 |
| 3+ Earners | 38 (14.9%) | $115,833 |
| Total | 255 (100.0%) | $85,804 |
Household Income in Atwater
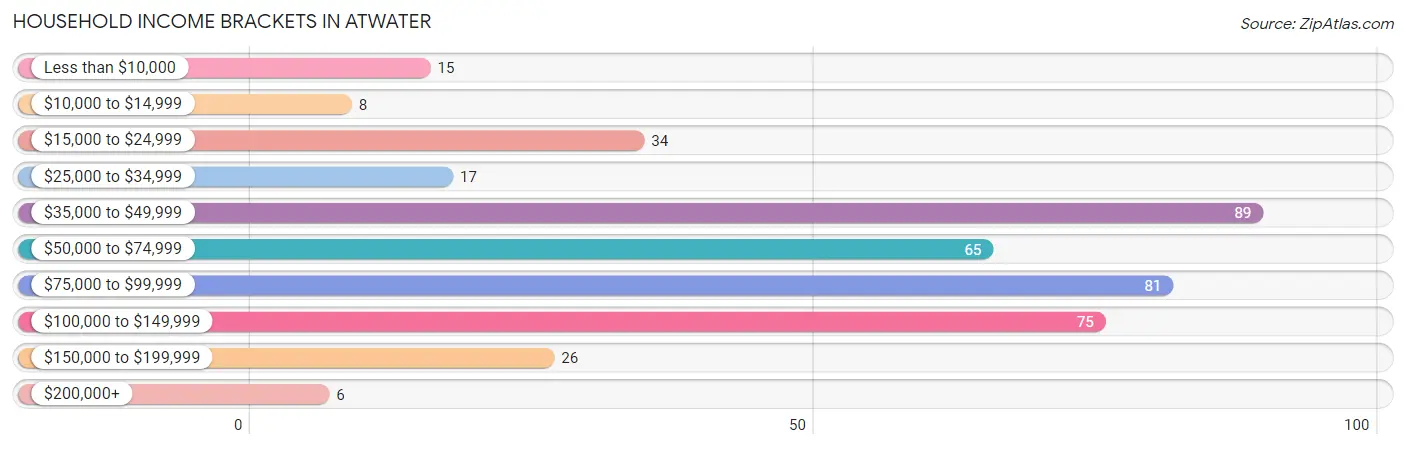
Household Income Brackets in Atwater
With 89 households falling in the category, the $35,000 to $49,999 income range is the most frequent in Atwater, accounting for 21.4% of all households. In contrast, only 6 households (1.4%) fall into the $200,000+ income bracket, making it the least populous group.
| Income Bracket | # Households | % Households |
| Less than $10,000 | 15 | 3.6% |
| $10,000 to $14,999 | 8 | 1.9% |
| $15,000 to $24,999 | 34 | 8.2% |
| $25,000 to $34,999 | 17 | 4.1% |
| $35,000 to $49,999 | 89 | 21.4% |
| $50,000 to $74,999 | 65 | 15.6% |
| $75,000 to $99,999 | 81 | 19.5% |
| $100,000 to $149,999 | 75 | 18.0% |
| $150,000 to $199,999 | 26 | 6.3% |
| $200,000+ | 6 | 1.4% |
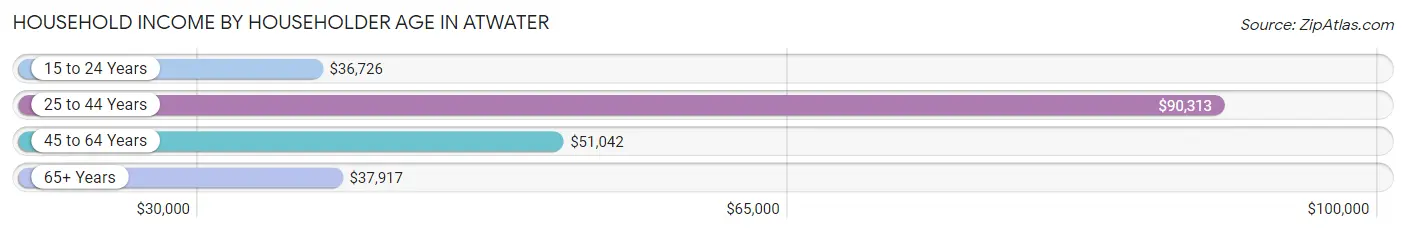
Household Income by Householder Age in Atwater
The median household income in Atwater is $65,000, with the highest median household income of $90,313 found in the 25 to 44 years age bracket for the primary householder. A total of 146 households (35.1%) fall into this category. Meanwhile, the 15 to 24 years age bracket for the primary householder has the lowest median household income of $36,726, with 37 households (8.9%) in this group.
| Income Bracket | # Households | Median Income |
| 15 to 24 Years | 37 (8.9%) | $36,726 |
| 25 to 44 Years | 146 (35.1%) | $90,313 |
| 45 to 64 Years | 162 (38.9%) | $51,042 |
| 65+ Years | 71 (17.1%) | $37,917 |
| Total | 416 (100.0%) | $65,000 |
Poverty in Atwater
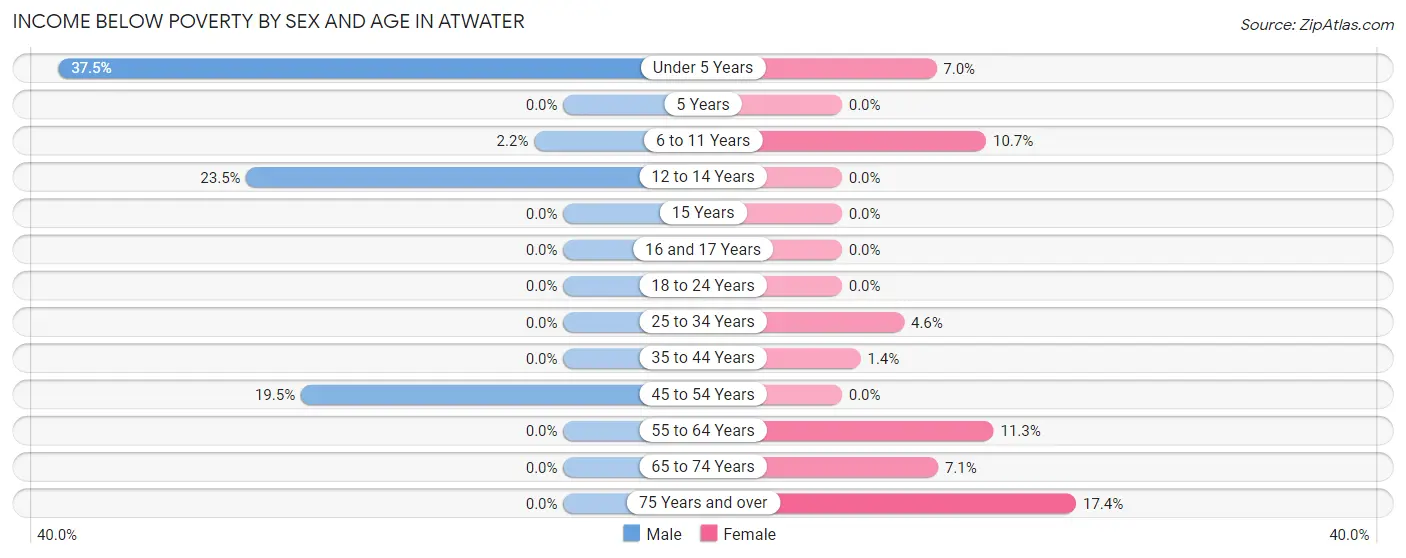
Income Below Poverty by Sex and Age in Atwater
With 4.9% poverty level for males and 5.3% for females among the residents of Atwater, under 5 year old males and 75 year old and over females are the most vulnerable to poverty, with 6 males (37.5%) and 4 females (17.4%) in their respective age groups living below the poverty level.
| Age Bracket | Male | Female |
| Under 5 Years | 6 (37.5%) | 4 (7.0%) |
| 5 Years | 0 (0.0%) | 0 (0.0%) |
| 6 to 11 Years | 3 (2.2%) | 6 (10.7%) |
| 12 to 14 Years | 8 (23.5%) | 0 (0.0%) |
| 15 Years | 0 (0.0%) | 0 (0.0%) |
| 16 and 17 Years | 0 (0.0%) | 0 (0.0%) |
| 18 to 24 Years | 0 (0.0%) | 0 (0.0%) |
| 25 to 34 Years | 0 (0.0%) | 3 (4.6%) |
| 35 to 44 Years | 0 (0.0%) | 1 (1.4%) |
| 45 to 54 Years | 15 (19.5%) | 0 (0.0%) |
| 55 to 64 Years | 0 (0.0%) | 8 (11.3%) |
| 65 to 74 Years | 0 (0.0%) | 3 (7.1%) |
| 75 Years and over | 0 (0.0%) | 4 (17.4%) |
| Total | 32 (4.9%) | 29 (5.3%) |
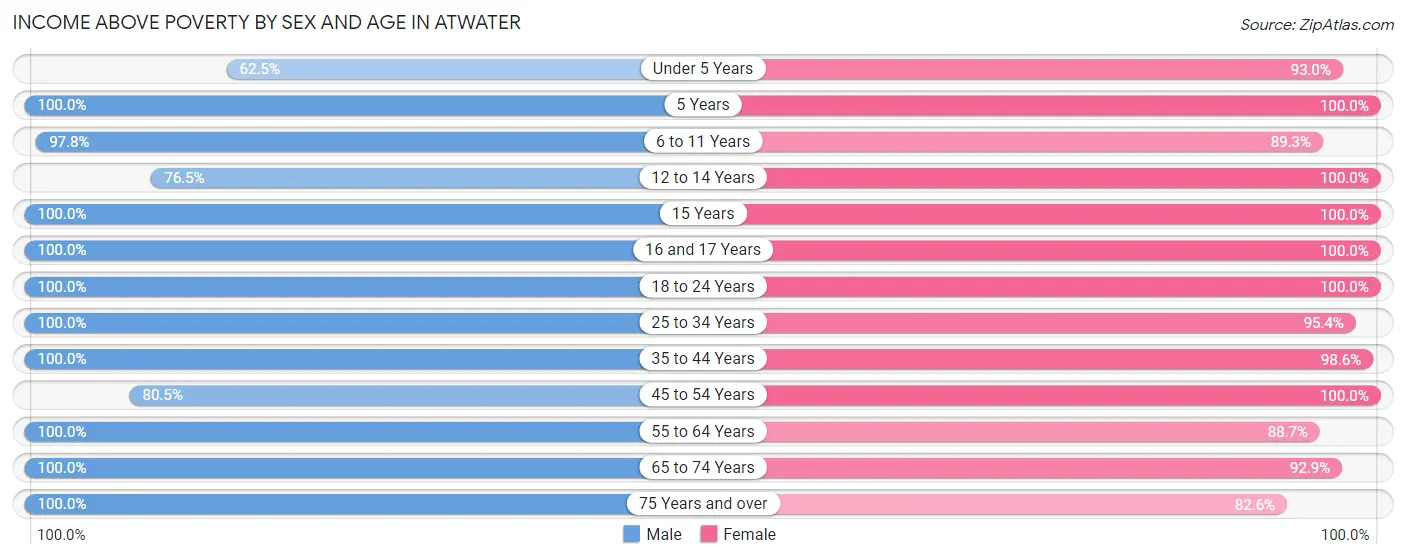
Income Above Poverty by Sex and Age in Atwater
According to the poverty statistics in Atwater, males aged 5 years and females aged 5 years are the age groups that are most secure financially, with 100.0% of males and 100.0% of females in these age groups living above the poverty line.
| Age Bracket | Male | Female |
| Under 5 Years | 10 (62.5%) | 53 (93.0%) |
| 5 Years | 7 (100.0%) | 8 (100.0%) |
| 6 to 11 Years | 136 (97.8%) | 50 (89.3%) |
| 12 to 14 Years | 26 (76.5%) | 33 (100.0%) |
| 15 Years | 7 (100.0%) | 6 (100.0%) |
| 16 and 17 Years | 30 (100.0%) | 6 (100.0%) |
| 18 to 24 Years | 79 (100.0%) | 28 (100.0%) |
| 25 to 34 Years | 77 (100.0%) | 62 (95.4%) |
| 35 to 44 Years | 85 (100.0%) | 71 (98.6%) |
| 45 to 54 Years | 62 (80.5%) | 80 (100.0%) |
| 55 to 64 Years | 60 (100.0%) | 63 (88.7%) |
| 65 to 74 Years | 28 (100.0%) | 39 (92.9%) |
| 75 Years and over | 19 (100.0%) | 19 (82.6%) |
| Total | 626 (95.1%) | 518 (94.7%) |
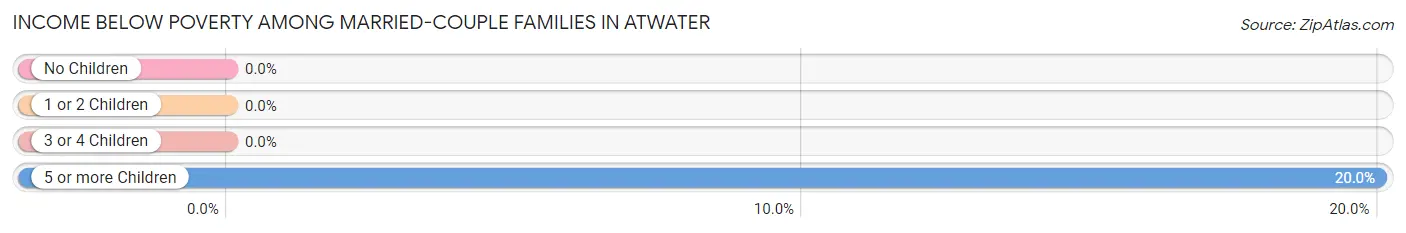
Income Below Poverty Among Married-Couple Families in Atwater
The poverty statistics for married-couple families in Atwater show that 1.4% or 3 of the total 219 families live below the poverty line. Families with 5 or more children have the highest poverty rate of 20.0%, comprising of 3 families. On the other hand, families with no children have the lowest poverty rate of 0.0%, which includes 0 families.
| Children | Above Poverty | Below Poverty |
| No Children | 125 (100.0%) | 0 (0.0%) |
| 1 or 2 Children | 39 (100.0%) | 0 (0.0%) |
| 3 or 4 Children | 40 (100.0%) | 0 (0.0%) |
| 5 or more Children | 12 (80.0%) | 3 (20.0%) |
| Total | 216 (98.6%) | 3 (1.4%) |
Income Below Poverty Among Single-Parent Households in Atwater
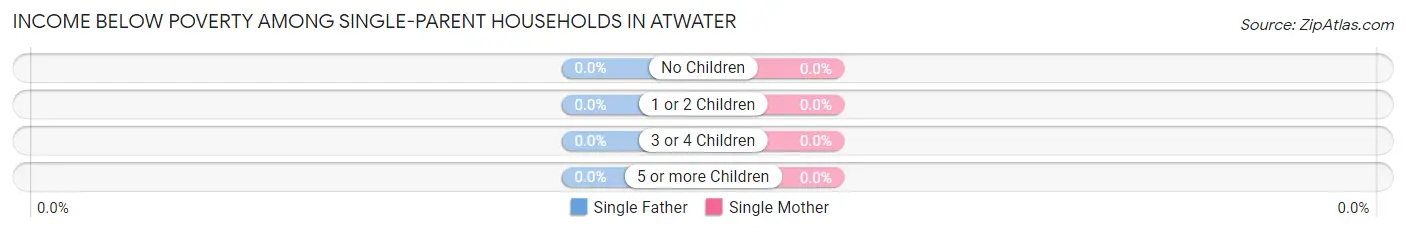
| Children | Single Father | Single Mother |
| No Children | 0 (0.0%) | 0 (0.0%) |
| 1 or 2 Children | 0 (0.0%) | 0 (0.0%) |
| 3 or 4 Children | 0 (0.0%) | 0 (0.0%) |
| 5 or more Children | 0 (0.0%) | 0 (0.0%) |
| Total | 0 (0.0%) | 0 (0.0%) |
Income Below Poverty Among Married-Couple vs Single-Parent Households in Atwater
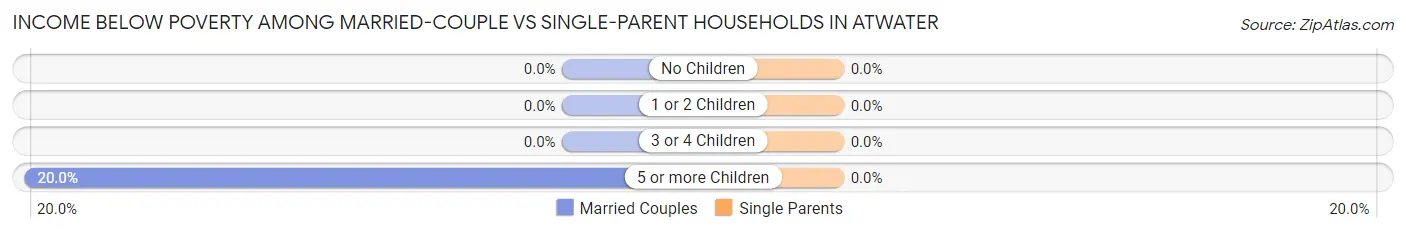
| Children | Married-Couple Families | Single-Parent Households |
| No Children | 0 (0.0%) | 0 (0.0%) |
| 1 or 2 Children | 0 (0.0%) | 0 (0.0%) |
| 3 or 4 Children | 0 (0.0%) | 0 (0.0%) |
| 5 or more Children | 3 (20.0%) | 0 (0.0%) |
| Total | 3 (1.4%) | 0 (0.0%) |
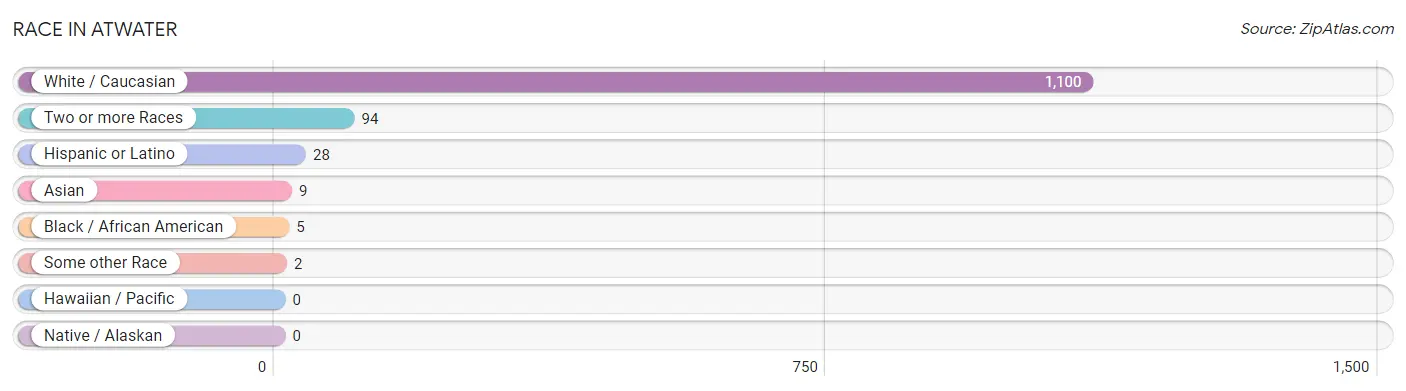
Race in Atwater
The most populous races in Atwater are White / Caucasian (1,100 | 90.9%), Two or more Races (94 | 7.8%), and Hispanic or Latino (28 | 2.3%).
| Race | # Population | % Population |
| Asian | 9 | 0.7% |
| Black / African American | 5 | 0.4% |
| Hawaiian / Pacific | 0 | 0.0% |
| Hispanic or Latino | 28 | 2.3% |
| Native / Alaskan | 0 | 0.0% |
| White / Caucasian | 1,100 | 90.9% |
| Two or more Races | 94 | 7.8% |
| Some other Race | 2 | 0.2% |
| Total | 1,210 | 100.0% |
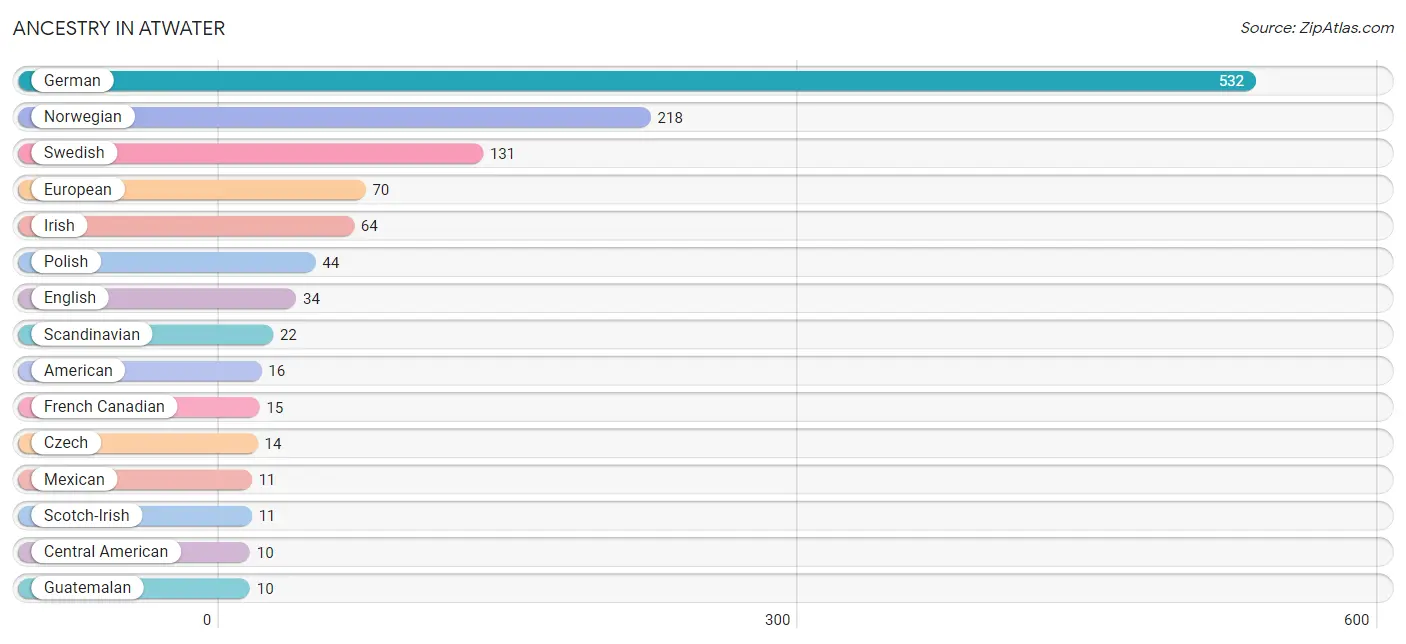
Ancestry in Atwater
The most populous ancestries reported in Atwater are German (532 | 44.0%), Norwegian (218 | 18.0%), Swedish (131 | 10.8%), European (70 | 5.8%), and Irish (64 | 5.3%), together accounting for 83.9% of all Atwater residents.
| Ancestry | # Population | % Population |
| American | 16 | 1.3% |
| Arapaho | 2 | 0.2% |
| Burmese | 4 | 0.3% |
| Central American | 10 | 0.8% |
| Cherokee | 2 | 0.2% |
| Chippewa | 1 | 0.1% |
| Croatian | 3 | 0.3% |
| Czech | 14 | 1.2% |
| Czechoslovakian | 3 | 0.3% |
| Danish | 3 | 0.3% |
| Dutch | 7 | 0.6% |
| English | 34 | 2.8% |
| European | 70 | 5.8% |
| Finnish | 2 | 0.2% |
| French Canadian | 15 | 1.2% |
| German | 532 | 44.0% |
| Guatemalan | 10 | 0.8% |
| Irish | 64 | 5.3% |
| Korean | 5 | 0.4% |
| Mexican | 11 | 0.9% |
| Norwegian | 218 | 18.0% |
| Polish | 44 | 3.6% |
| Puerto Rican | 7 | 0.6% |
| Scandinavian | 22 | 1.8% |
| Scotch-Irish | 11 | 0.9% |
| Scottish | 2 | 0.2% |
| Swedish | 131 | 10.8% | View All 27 Rows |
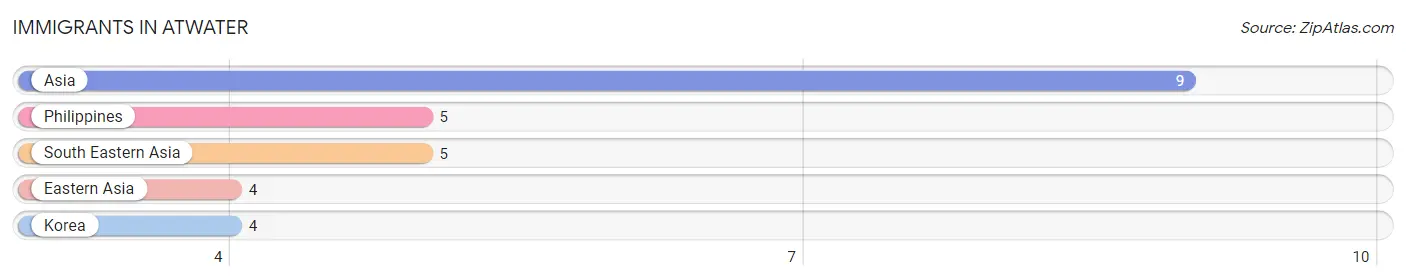
Immigrants in Atwater
The most numerous immigrant groups reported in Atwater came from Asia (9 | 0.7%), Philippines (5 | 0.4%), South Eastern Asia (5 | 0.4%), Eastern Asia (4 | 0.3%), and Korea (4 | 0.3%), together accounting for 2.2% of all Atwater residents.
| Immigration Origin | # Population | % Population |
| Asia | 9 | 0.7% |
| Eastern Asia | 4 | 0.3% |
| Korea | 4 | 0.3% |
| Philippines | 5 | 0.4% |
| South Eastern Asia | 5 | 0.4% | View All 5 Rows |
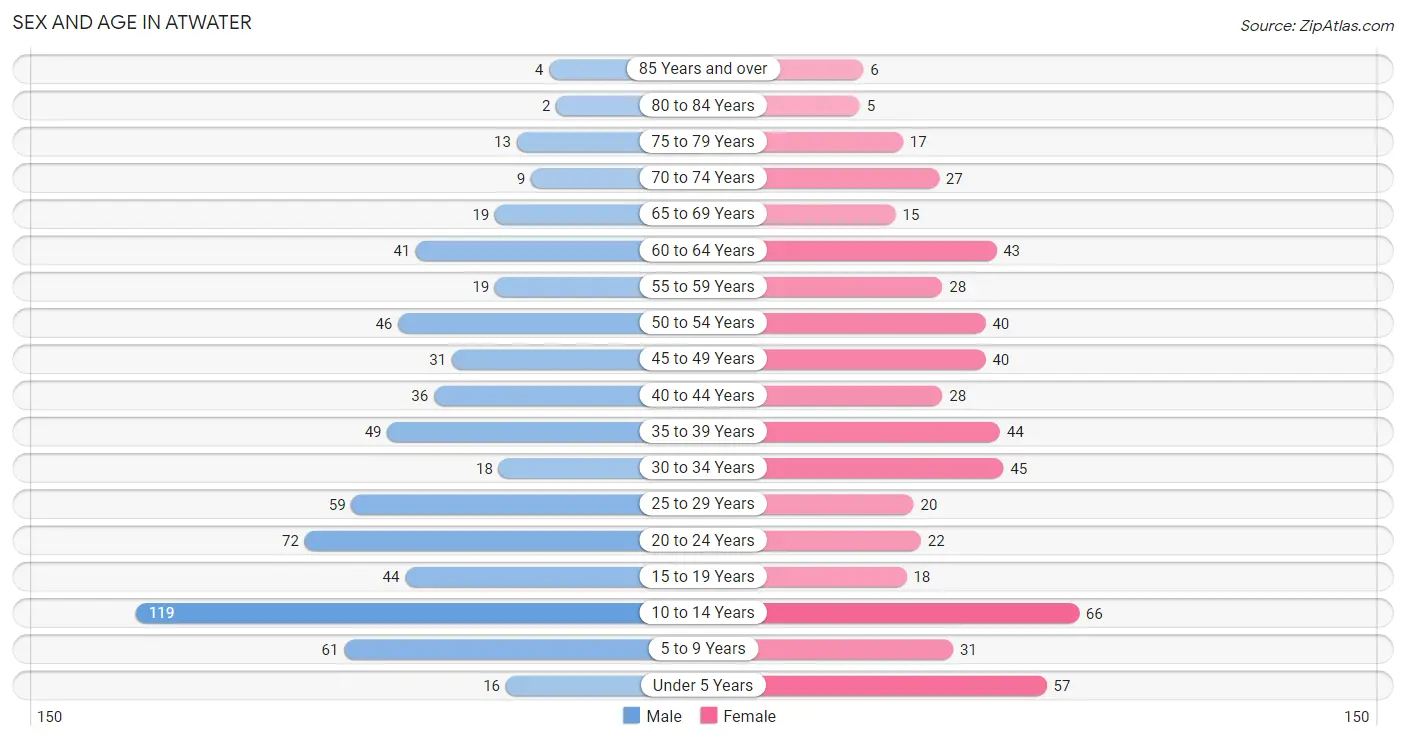
Sex and Age in Atwater
Sex and Age in Atwater
The most populous age groups in Atwater are 10 to 14 Years (119 | 18.1%) for men and 10 to 14 Years (66 | 12.0%) for women.
| Age Bracket | Male | Female |
| Under 5 Years | 16 (2.4%) | 57 (10.3%) |
| 5 to 9 Years | 61 (9.3%) | 31 (5.6%) |
| 10 to 14 Years | 119 (18.1%) | 66 (12.0%) |
| 15 to 19 Years | 44 (6.7%) | 18 (3.3%) |
| 20 to 24 Years | 72 (10.9%) | 22 (4.0%) |
| 25 to 29 Years | 59 (9.0%) | 20 (3.6%) |
| 30 to 34 Years | 18 (2.7%) | 45 (8.2%) |
| 35 to 39 Years | 49 (7.4%) | 44 (8.0%) |
| 40 to 44 Years | 36 (5.5%) | 28 (5.1%) |
| 45 to 49 Years | 31 (4.7%) | 40 (7.2%) |
| 50 to 54 Years | 46 (7.0%) | 40 (7.2%) |
| 55 to 59 Years | 19 (2.9%) | 28 (5.1%) |
| 60 to 64 Years | 41 (6.2%) | 43 (7.8%) |
| 65 to 69 Years | 19 (2.9%) | 15 (2.7%) |
| 70 to 74 Years | 9 (1.4%) | 27 (4.9%) |
| 75 to 79 Years | 13 (2.0%) | 17 (3.1%) |
| 80 to 84 Years | 2 (0.3%) | 5 (0.9%) |
| 85 Years and over | 4 (0.6%) | 6 (1.1%) |
| Total | 658 (100.0%) | 552 (100.0%) |
Families and Households in Atwater
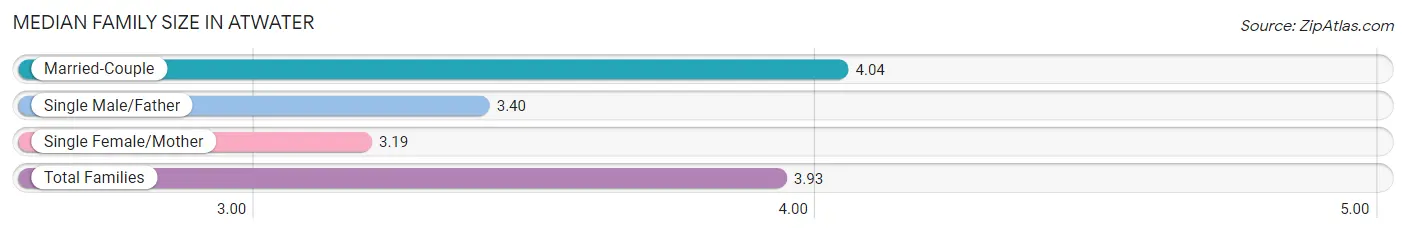
Median Family Size in Atwater
The median family size in Atwater is 3.93 persons per family, with married-couple families (219 | 85.9%) accounting for the largest median family size of 4.04 persons per family. On the other hand, single female/mother families (26 | 10.2%) represent the smallest median family size with 3.19 persons per family.
| Family Type | # Families | Family Size |
| Married-Couple | 219 (85.9%) | 4.04 |
| Single Male/Father | 10 (3.9%) | 3.40 |
| Single Female/Mother | 26 (10.2%) | 3.19 |
| Total Families | 255 (100.0%) | 3.93 |
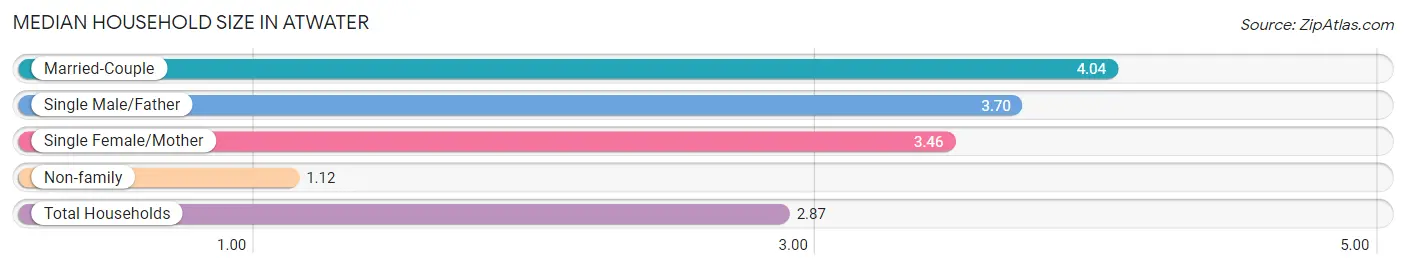
Median Household Size in Atwater
The median household size in Atwater is 2.87 persons per household, with married-couple households (219 | 52.6%) accounting for the largest median household size of 4.04 persons per household. non-family households (161 | 38.7%) represent the smallest median household size with 1.12 persons per household.
| Household Type | # Households | Household Size |
| Married-Couple | 219 (52.6%) | 4.04 |
| Single Male/Father | 10 (2.4%) | 3.70 |
| Single Female/Mother | 26 (6.2%) | 3.46 |
| Non-family | 161 (38.7%) | 1.12 |
| Total Households | 416 (100.0%) | 2.87 |
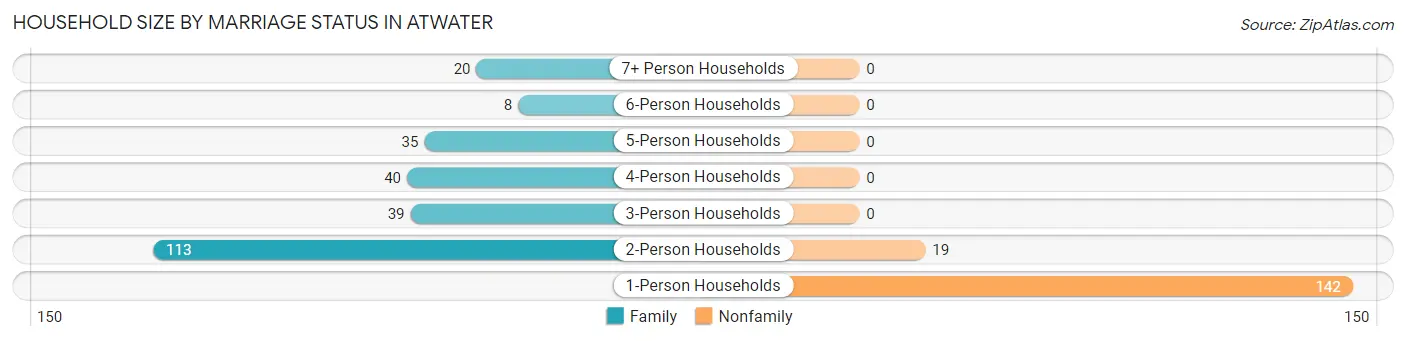
Household Size by Marriage Status in Atwater
Out of a total of 416 households in Atwater, 255 (61.3%) are family households, while 161 (38.7%) are nonfamily households. The most numerous type of family households are 2-person households, comprising 113, and the most common type of nonfamily households are 1-person households, comprising 142.
| Household Size | Family Households | Nonfamily Households |
| 1-Person Households | - | 142 (34.1%) |
| 2-Person Households | 113 (27.2%) | 19 (4.6%) |
| 3-Person Households | 39 (9.4%) | 0 (0.0%) |
| 4-Person Households | 40 (9.6%) | 0 (0.0%) |
| 5-Person Households | 35 (8.4%) | 0 (0.0%) |
| 6-Person Households | 8 (1.9%) | 0 (0.0%) |
| 7+ Person Households | 20 (4.8%) | 0 (0.0%) |
| Total | 255 (61.3%) | 161 (38.7%) |
Female Fertility in Atwater
Fertility by Age in Atwater
Average fertility rate in Atwater is 37.0 births per 1,000 women. Women in the age bracket of 20 to 34 years have the highest fertility rate with 57.0 births per 1,000 women. Women in the age bracket of 20 to 34 years acount for 62.5% of all women with births.
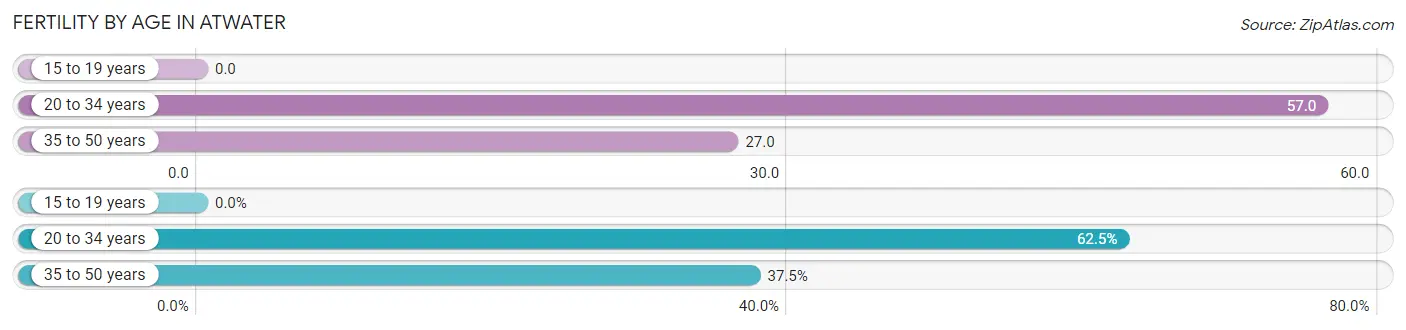
| Age Bracket | Women with Births | Births / 1,000 Women |
| 15 to 19 years | 0 (0.0%) | 0.0 |
| 20 to 34 years | 5 (62.5%) | 57.0 |
| 35 to 50 years | 3 (37.5%) | 27.0 |
| Total | 8 (100.0%) | 37.0 |
Fertility by Age by Marriage Status in Atwater
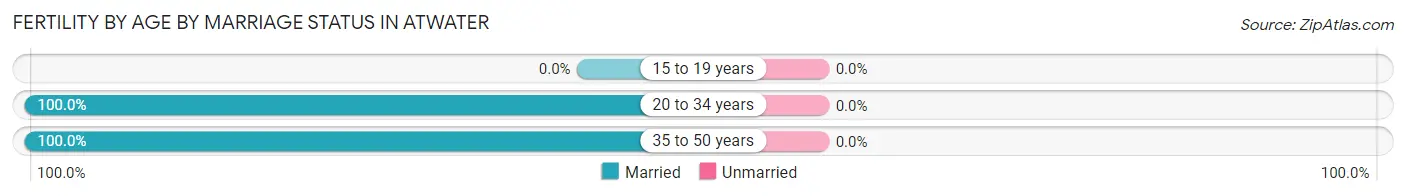
| Age Bracket | Married | Unmarried |
| 15 to 19 years | 0 (0.0%) | 0 (0.0%) |
| 20 to 34 years | 5 (100.0%) | 0 (0.0%) |
| 35 to 50 years | 3 (100.0%) | 0 (0.0%) |
| Total | 8 (100.0%) | 0 (0.0%) |
Fertility by Education in Atwater
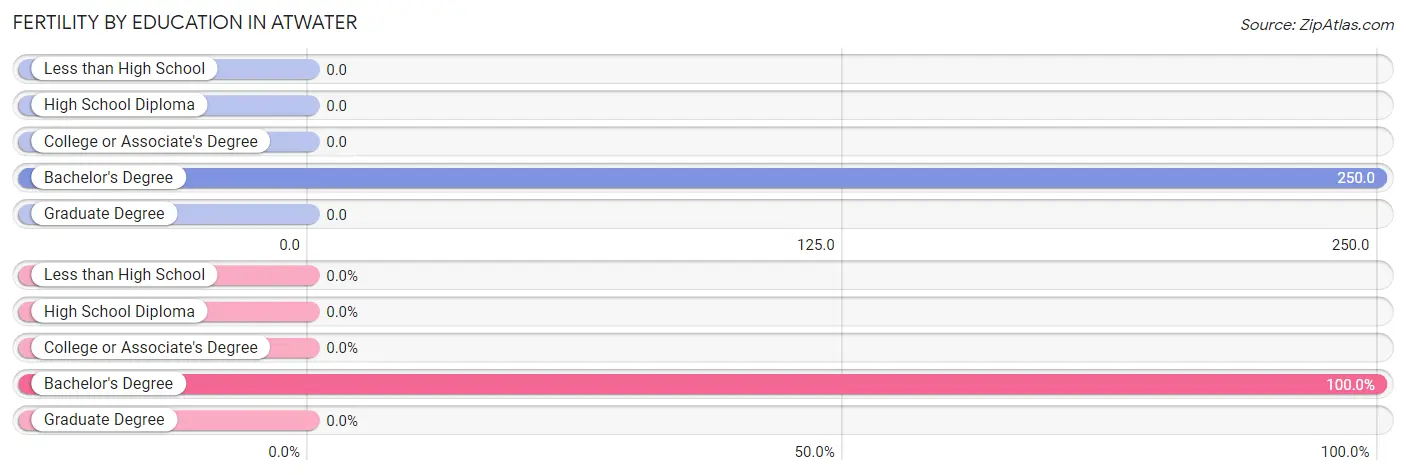
| Educational Attainment | Women with Births | Births / 1,000 Women |
| Less than High School | 0 (0.0%) | 0.0 |
| High School Diploma | 0 (0.0%) | 0.0 |
| College or Associate's Degree | 0 (0.0%) | 0.0 |
| Bachelor's Degree | 8 (100.0%) | 250.0 |
| Graduate Degree | 0 (0.0%) | 0.0 |
| Total | 8 (100.0%) | 37.0 |
Fertility by Education by Marriage Status in Atwater
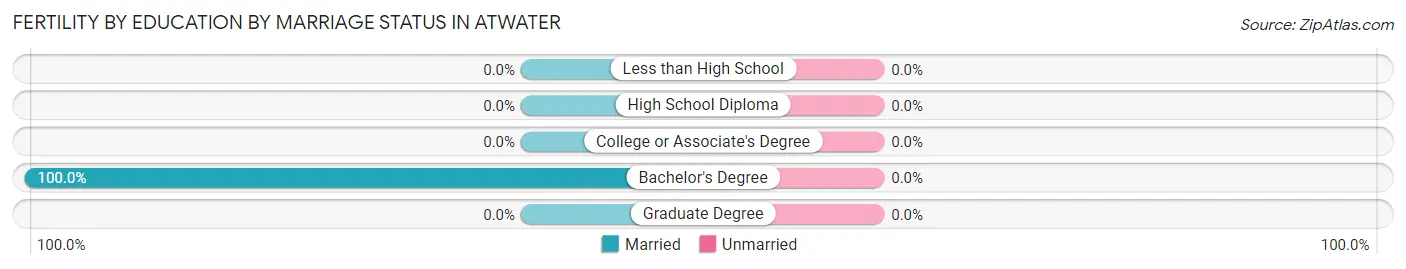
| Educational Attainment | Married | Unmarried |
| Less than High School | 0 (0.0%) | 0 (0.0%) |
| High School Diploma | 0 (0.0%) | 0 (0.0%) |
| College or Associate's Degree | 0 (0.0%) | 0 (0.0%) |
| Bachelor's Degree | 8 (100.0%) | 0 (0.0%) |
| Graduate Degree | 0 (0.0%) | 0 (0.0%) |
| Total | 8 (100.0%) | 0 (0.0%) |
Employment Characteristics in Atwater
Employment by Class of Employer in Atwater
Among the 604 employed individuals in Atwater, private company employees (364 | 60.3%), local government employees (96 | 15.9%), and state government employees (49 | 8.1%) make up the most common classes of employment.
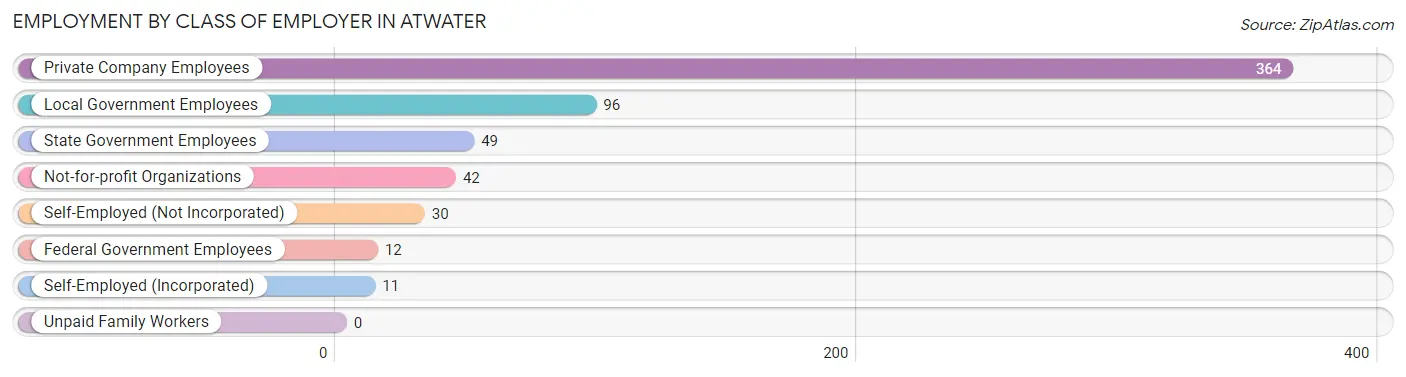
| Employer Class | # Employees | % Employees |
| Private Company Employees | 364 | 60.3% |
| Self-Employed (Incorporated) | 11 | 1.8% |
| Self-Employed (Not Incorporated) | 30 | 5.0% |
| Not-for-profit Organizations | 42 | 7.0% |
| Local Government Employees | 96 | 15.9% |
| State Government Employees | 49 | 8.1% |
| Federal Government Employees | 12 | 2.0% |
| Unpaid Family Workers | 0 | 0.0% |
| Total | 604 | 100.0% |
Employment Status by Age in Atwater
According to the labor force statistics for Atwater, out of the total population over 16 years of age (847), 78.0% or 661 individuals are in the labor force, with 8.6% or 57 of them unemployed. The age group with the highest labor force participation rate is 20 to 24 years, with 100.0% or 94 individuals in the labor force. Within the labor force, the 25 to 29 years age range has the highest percentage of unemployed individuals, with 36.7% or 29 of them being unemployed.
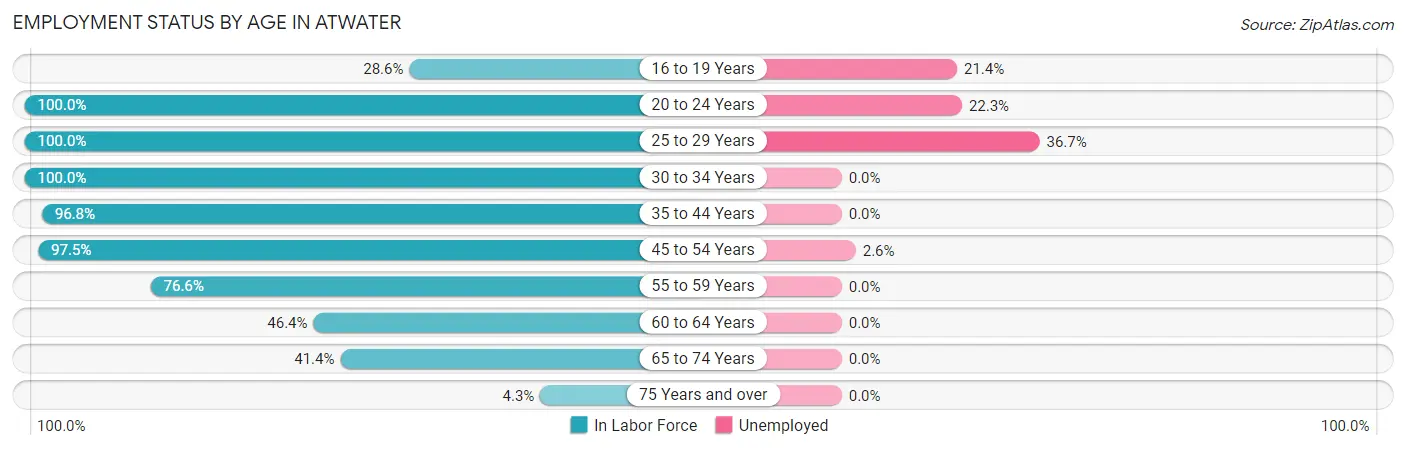
| Age Bracket | In Labor Force | Unemployed |
| 16 to 19 Years | 14 (28.6%) | 3 (21.4%) |
| 20 to 24 Years | 94 (100.0%) | 21 (22.3%) |
| 25 to 29 Years | 79 (100.0%) | 29 (36.7%) |
| 30 to 34 Years | 63 (100.0%) | 0 (0.0%) |
| 35 to 44 Years | 152 (96.8%) | 0 (0.0%) |
| 45 to 54 Years | 153 (97.5%) | 4 (2.6%) |
| 55 to 59 Years | 36 (76.6%) | 0 (0.0%) |
| 60 to 64 Years | 39 (46.4%) | 0 (0.0%) |
| 65 to 74 Years | 29 (41.4%) | 0 (0.0%) |
| 75 Years and over | 2 (4.3%) | 0 (0.0%) |
| Total | 661 (78.0%) | 57 (8.6%) |
Employment Status by Educational Attainment in Atwater
According to labor force statistics for Atwater, 88.9% of individuals (522) out of the total population between 25 and 64 years of age (587) are in the labor force, with 6.3% or 33 of them being unemployed. The group with the highest labor force participation rate are those with the educational attainment of bachelor's degree or higher, with 94.6% or 123 individuals in the labor force. Within the labor force, individuals with bachelor's degree or higher education have the highest percentage of unemployment, with 26.8% or 33 of them being unemployed.
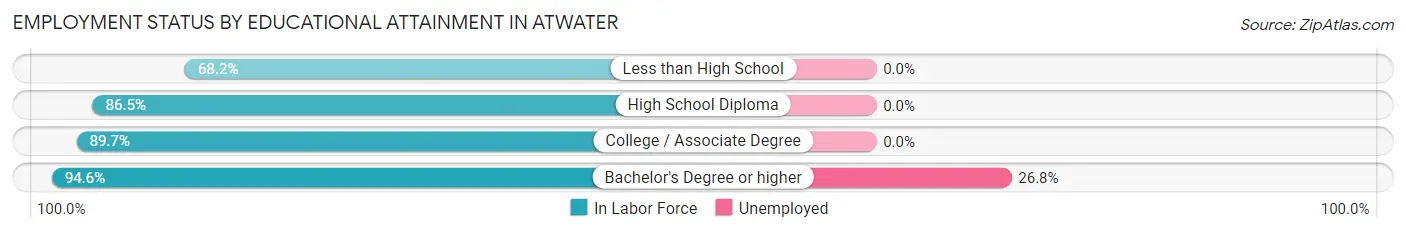
| Educational Attainment | In Labor Force | Unemployed |
| Less than High School | 15 (68.2%) | 0 (0.0%) |
| High School Diploma | 167 (86.5%) | 0 (0.0%) |
| College / Associate Degree | 217 (89.7%) | 0 (0.0%) |
| Bachelor's Degree or higher | 123 (94.6%) | 35 (26.8%) |
| Total | 522 (88.9%) | 37 (6.3%) |
Employment Occupations by Sex in Atwater
Management, Business, Science and Arts Occupations
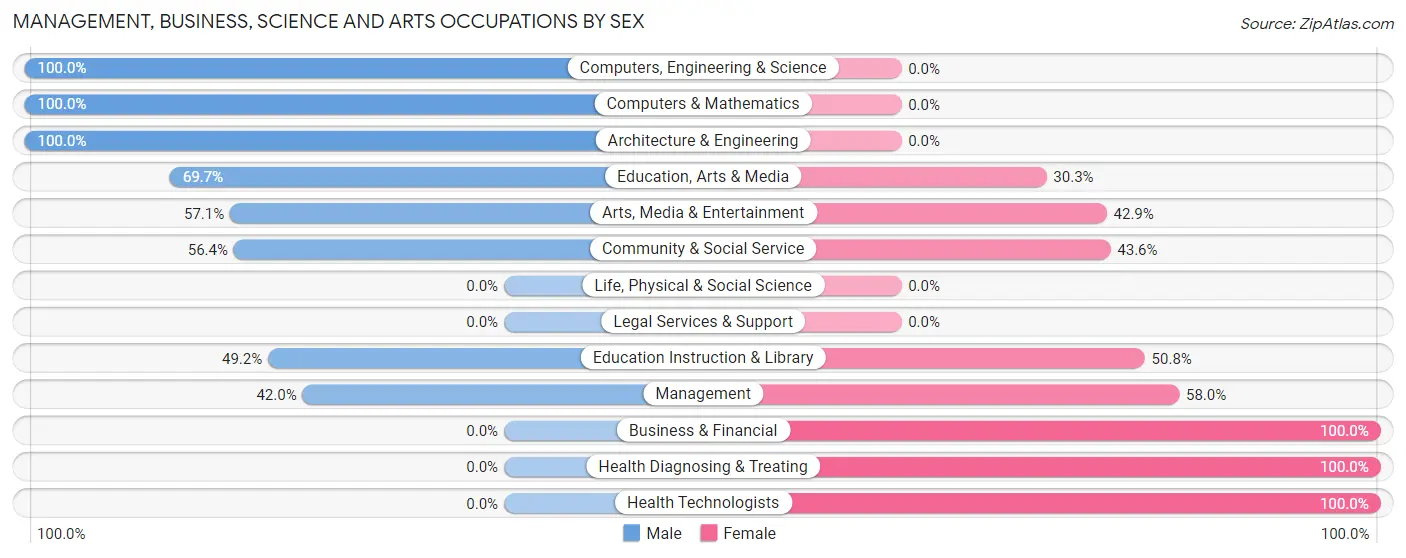
The most common Management, Business, Science and Arts occupations in Atwater are Community & Social Service (110 | 18.2%), Management (69 | 11.4%), Education Instruction & Library (63 | 10.4%), Education, Arts & Media (33 | 5.5%), and Health Diagnosing & Treating (31 | 5.1%).
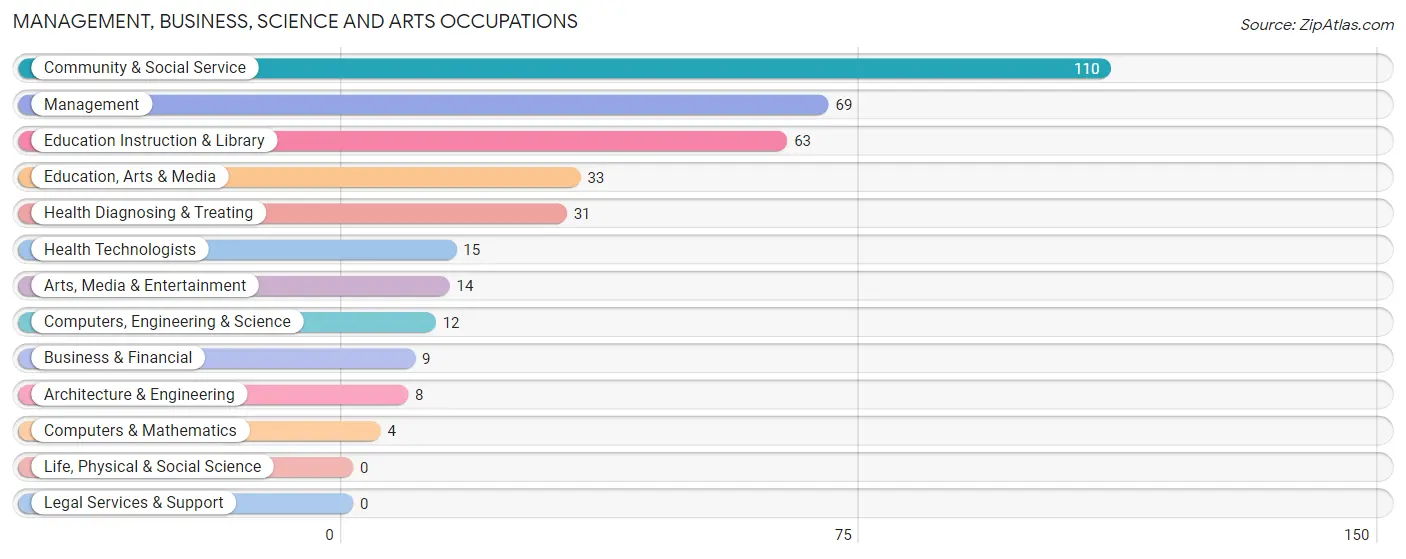
Management, Business, Science and Arts Occupations by Sex
Within the Management, Business, Science and Arts occupations in Atwater, the most male-oriented occupations are Computers, Engineering & Science (100.0%), Computers & Mathematics (100.0%), and Architecture & Engineering (100.0%), while the most female-oriented occupations are Business & Financial (100.0%), Health Diagnosing & Treating (100.0%), and Health Technologists (100.0%).
| Occupation | Male | Female |
| Management | 29 (42.0%) | 40 (58.0%) |
| Business & Financial | 0 (0.0%) | 9 (100.0%) |
| Computers, Engineering & Science | 12 (100.0%) | 0 (0.0%) |
| Computers & Mathematics | 4 (100.0%) | 0 (0.0%) |
| Architecture & Engineering | 8 (100.0%) | 0 (0.0%) |
| Life, Physical & Social Science | 0 (0.0%) | 0 (0.0%) |
| Community & Social Service | 62 (56.4%) | 48 (43.6%) |
| Education, Arts & Media | 23 (69.7%) | 10 (30.3%) |
| Legal Services & Support | 0 (0.0%) | 0 (0.0%) |
| Education Instruction & Library | 31 (49.2%) | 32 (50.8%) |
| Arts, Media & Entertainment | 8 (57.1%) | 6 (42.9%) |
| Health Diagnosing & Treating | 0 (0.0%) | 31 (100.0%) |
| Health Technologists | 0 (0.0%) | 15 (100.0%) |
| Total (Category) | 103 (44.6%) | 128 (55.4%) |
| Total (Overall) | 308 (51.0%) | 296 (49.0%) |
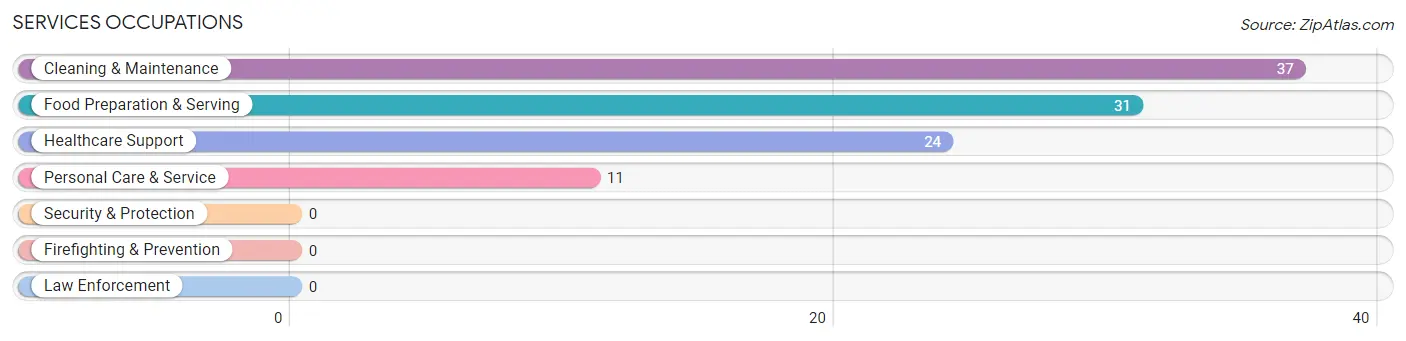
Services Occupations
The most common Services occupations in Atwater are Cleaning & Maintenance (37 | 6.1%), Food Preparation & Serving (31 | 5.1%), Healthcare Support (24 | 4.0%), and Personal Care & Service (11 | 1.8%).
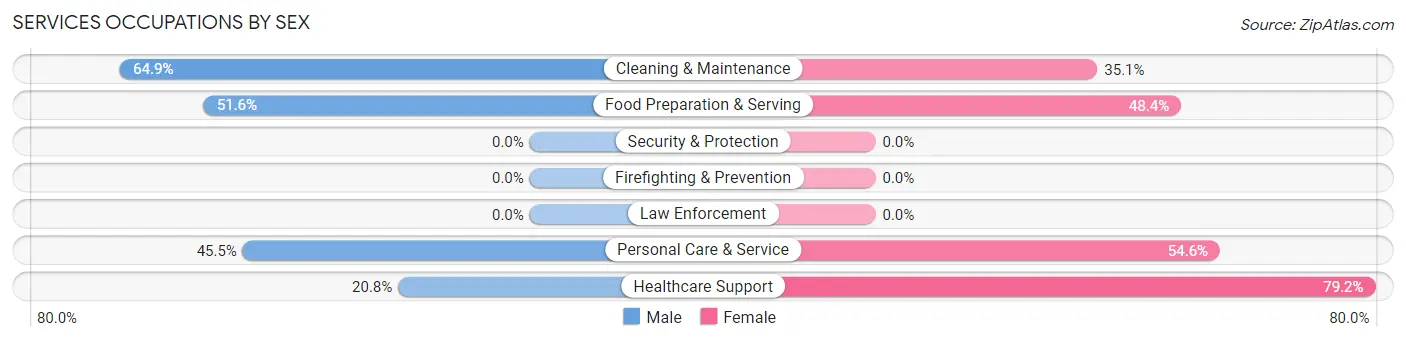
Services Occupations by Sex
Within the Services occupations in Atwater, the most male-oriented occupations are Cleaning & Maintenance (64.9%), Food Preparation & Serving (51.6%), and Personal Care & Service (45.5%), while the most female-oriented occupations are Healthcare Support (79.2%), Personal Care & Service (54.5%), and Food Preparation & Serving (48.4%).
| Occupation | Male | Female |
| Healthcare Support | 5 (20.8%) | 19 (79.2%) |
| Security & Protection | 0 (0.0%) | 0 (0.0%) |
| Firefighting & Prevention | 0 (0.0%) | 0 (0.0%) |
| Law Enforcement | 0 (0.0%) | 0 (0.0%) |
| Food Preparation & Serving | 16 (51.6%) | 15 (48.4%) |
| Cleaning & Maintenance | 24 (64.9%) | 13 (35.1%) |
| Personal Care & Service | 5 (45.5%) | 6 (54.5%) |
| Total (Category) | 50 (48.5%) | 53 (51.5%) |
| Total (Overall) | 308 (51.0%) | 296 (49.0%) |
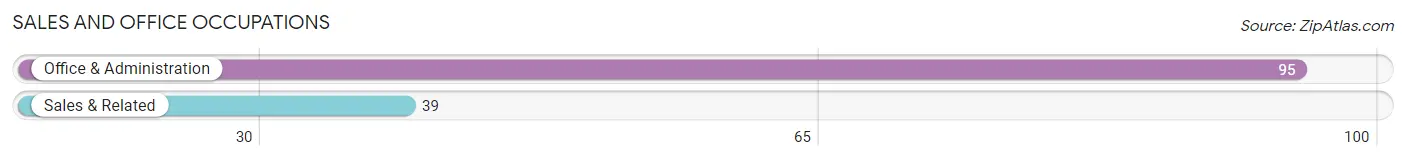
Sales and Office Occupations
The most common Sales and Office occupations in Atwater are Office & Administration (95 | 15.7%), and Sales & Related (39 | 6.5%).
Sales and Office Occupations by Sex
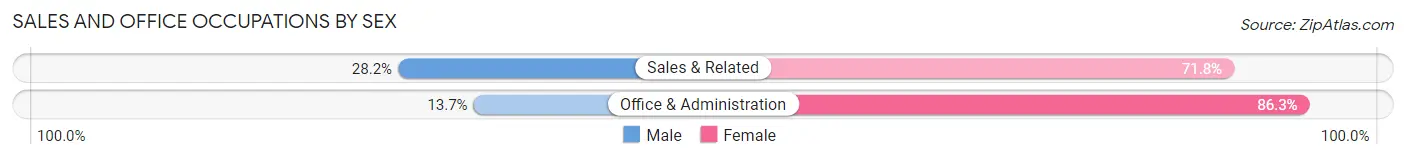
| Occupation | Male | Female |
| Sales & Related | 11 (28.2%) | 28 (71.8%) |
| Office & Administration | 13 (13.7%) | 82 (86.3%) |
| Total (Category) | 24 (17.9%) | 110 (82.1%) |
| Total (Overall) | 308 (51.0%) | 296 (49.0%) |
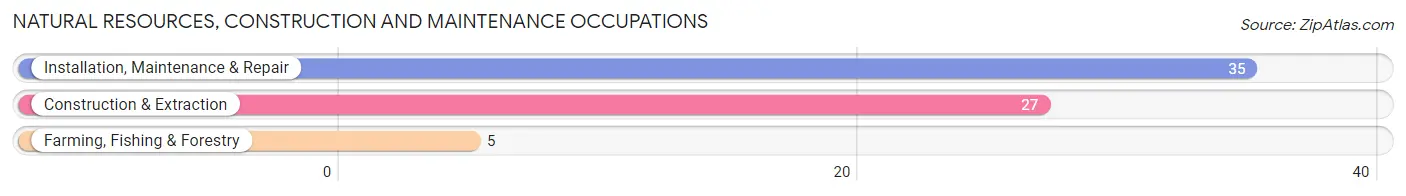
Natural Resources, Construction and Maintenance Occupations
The most common Natural Resources, Construction and Maintenance occupations in Atwater are Installation, Maintenance & Repair (35 | 5.8%), Construction & Extraction (27 | 4.5%), and Farming, Fishing & Forestry (5 | 0.8%).
Natural Resources, Construction and Maintenance Occupations by Sex
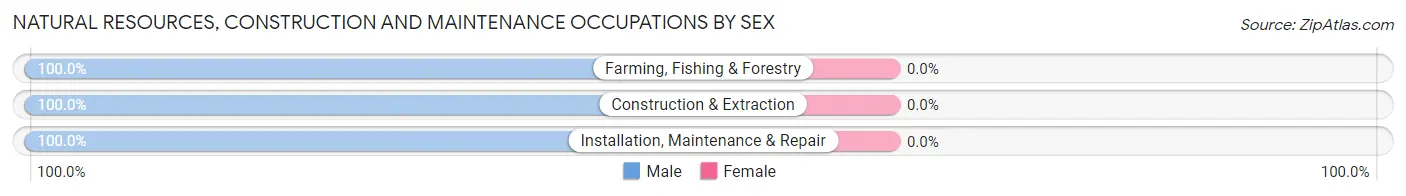
| Occupation | Male | Female |
| Farming, Fishing & Forestry | 5 (100.0%) | 0 (0.0%) |
| Construction & Extraction | 27 (100.0%) | 0 (0.0%) |
| Installation, Maintenance & Repair | 35 (100.0%) | 0 (0.0%) |
| Total (Category) | 67 (100.0%) | 0 (0.0%) |
| Total (Overall) | 308 (51.0%) | 296 (49.0%) |
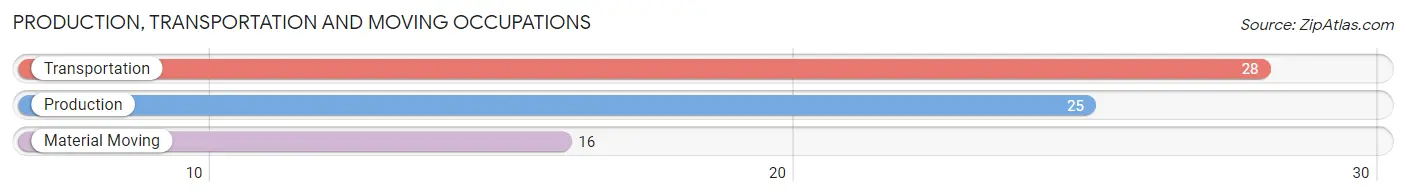
Production, Transportation and Moving Occupations
The most common Production, Transportation and Moving occupations in Atwater are Transportation (28 | 4.6%), Production (25 | 4.1%), and Material Moving (16 | 2.6%).
Production, Transportation and Moving Occupations by Sex
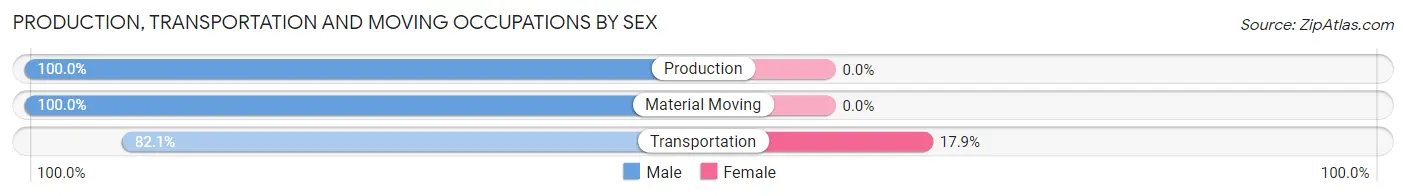
| Occupation | Male | Female |
| Production | 25 (100.0%) | 0 (0.0%) |
| Transportation | 23 (82.1%) | 5 (17.9%) |
| Material Moving | 16 (100.0%) | 0 (0.0%) |
| Total (Category) | 64 (92.7%) | 5 (7.2%) |
| Total (Overall) | 308 (51.0%) | 296 (49.0%) |
Employment Industries by Sex in Atwater
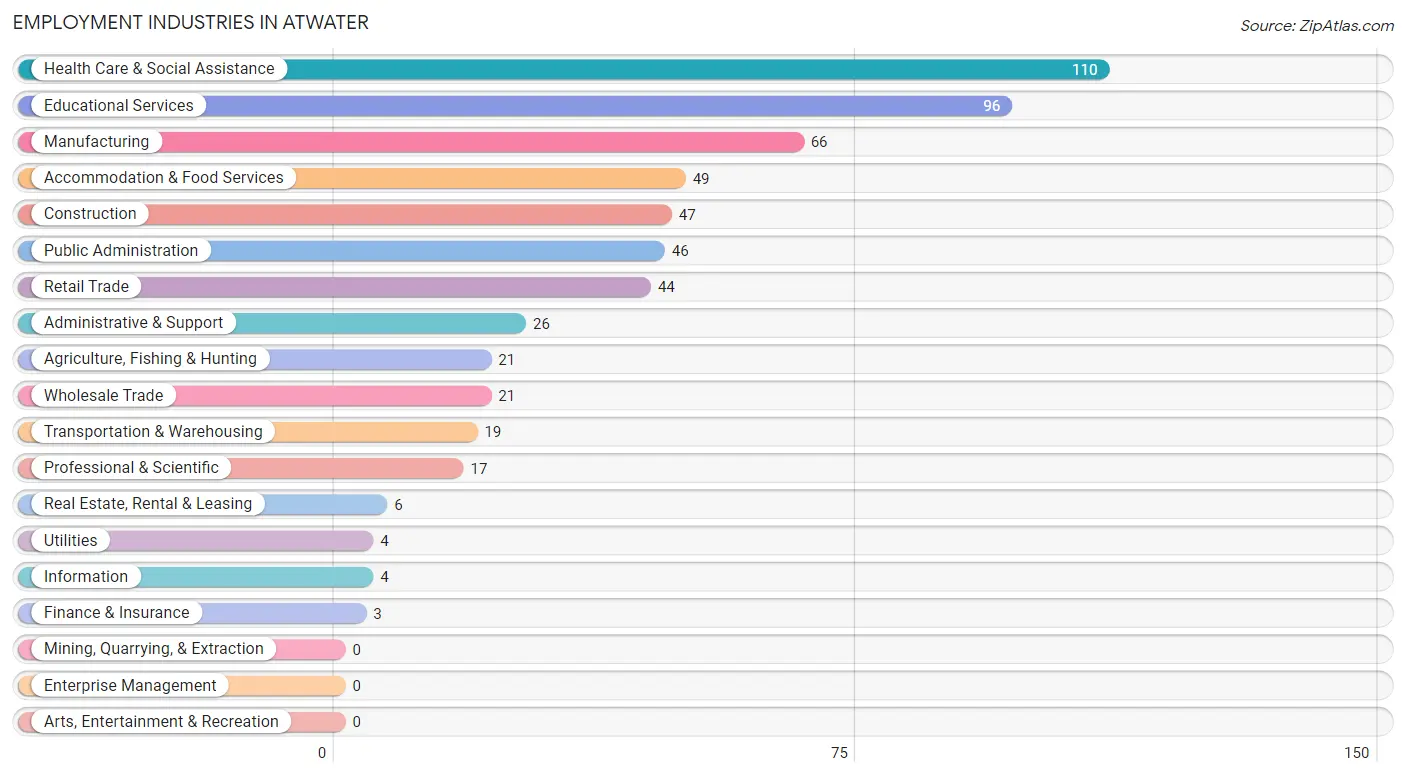
Employment Industries in Atwater
The major employment industries in Atwater include Health Care & Social Assistance (110 | 18.2%), Educational Services (96 | 15.9%), Manufacturing (66 | 10.9%), Accommodation & Food Services (49 | 8.1%), and Construction (47 | 7.8%).
Employment Industries by Sex in Atwater
The Atwater industries that see more men than women are Agriculture, Fishing & Hunting (100.0%), Transportation & Warehousing (100.0%), and Utilities (100.0%), whereas the industries that tend to have a higher number of women are Finance & Insurance (100.0%), Health Care & Social Assistance (80.0%), and Retail Trade (75.0%).
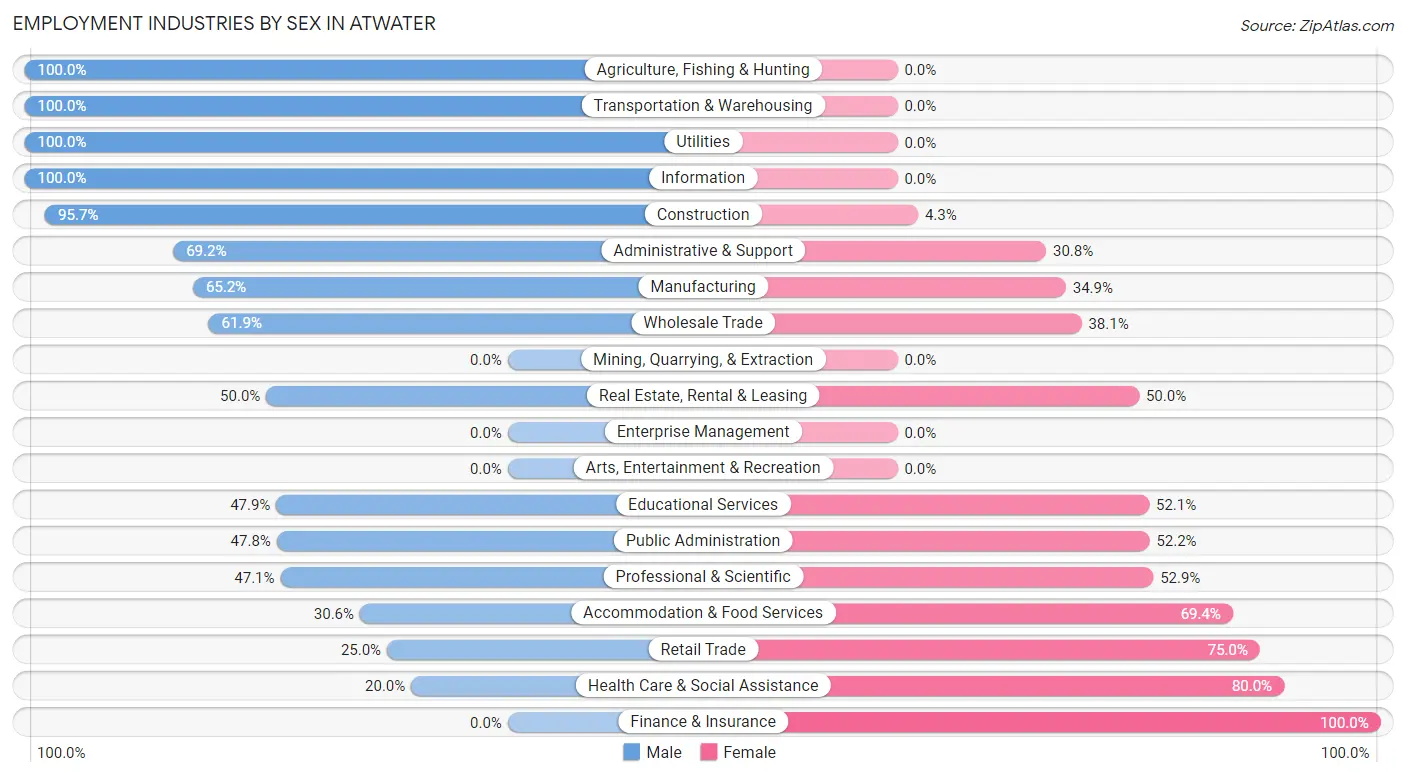
| Industry | Male | Female |
| Agriculture, Fishing & Hunting | 21 (100.0%) | 0 (0.0%) |
| Mining, Quarrying, & Extraction | 0 (0.0%) | 0 (0.0%) |
| Construction | 45 (95.7%) | 2 (4.3%) |
| Manufacturing | 43 (65.1%) | 23 (34.8%) |
| Wholesale Trade | 13 (61.9%) | 8 (38.1%) |
| Retail Trade | 11 (25.0%) | 33 (75.0%) |
| Transportation & Warehousing | 19 (100.0%) | 0 (0.0%) |
| Utilities | 4 (100.0%) | 0 (0.0%) |
| Information | 4 (100.0%) | 0 (0.0%) |
| Finance & Insurance | 0 (0.0%) | 3 (100.0%) |
| Real Estate, Rental & Leasing | 3 (50.0%) | 3 (50.0%) |
| Professional & Scientific | 8 (47.1%) | 9 (52.9%) |
| Enterprise Management | 0 (0.0%) | 0 (0.0%) |
| Administrative & Support | 18 (69.2%) | 8 (30.8%) |
| Educational Services | 46 (47.9%) | 50 (52.1%) |
| Health Care & Social Assistance | 22 (20.0%) | 88 (80.0%) |
| Arts, Entertainment & Recreation | 0 (0.0%) | 0 (0.0%) |
| Accommodation & Food Services | 15 (30.6%) | 34 (69.4%) |
| Public Administration | 22 (47.8%) | 24 (52.2%) |
| Total | 308 (51.0%) | 296 (49.0%) |
Education in Atwater
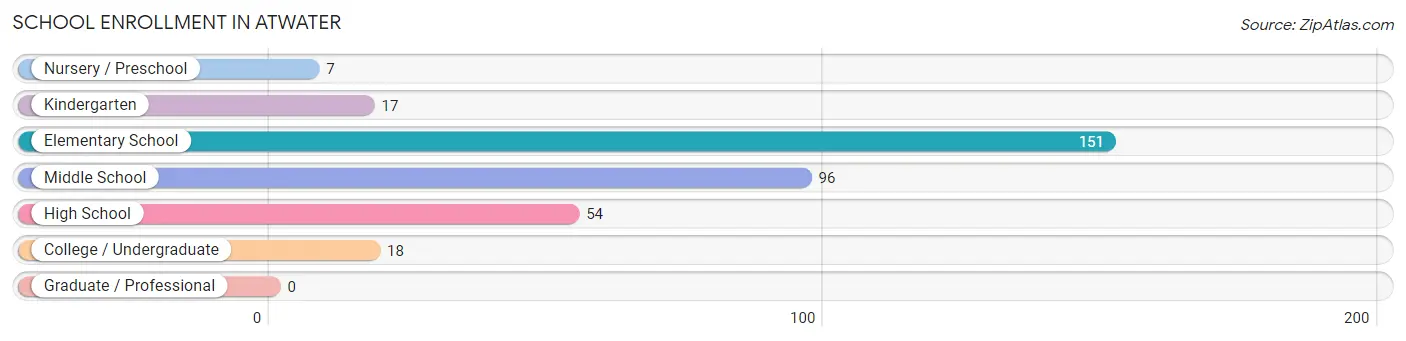
School Enrollment in Atwater
The most common levels of schooling among the 343 students in Atwater are elementary school (151 | 44.0%), middle school (96 | 28.0%), and high school (54 | 15.7%).
| School Level | # Students | % Students |
| Nursery / Preschool | 7 | 2.0% |
| Kindergarten | 17 | 5.0% |
| Elementary School | 151 | 44.0% |
| Middle School | 96 | 28.0% |
| High School | 54 | 15.7% |
| College / Undergraduate | 18 | 5.2% |
| Graduate / Professional | 0 | 0.0% |
| Total | 343 | 100.0% |
School Enrollment by Age by Funding Source in Atwater
Out of a total of 343 students who are enrolled in schools in Atwater, 14 (4.1%) attend a private institution, while the remaining 329 (95.9%) are enrolled in public schools. The age group of 20 to 24 year olds has the highest likelihood of being enrolled in private schools, with 2 (18.2% in the age bracket) enrolled. Conversely, the age group of 15 to 17 year olds has the lowest likelihood of being enrolled in a private school, with 49 (100.0% in the age bracket) attending a public institution.
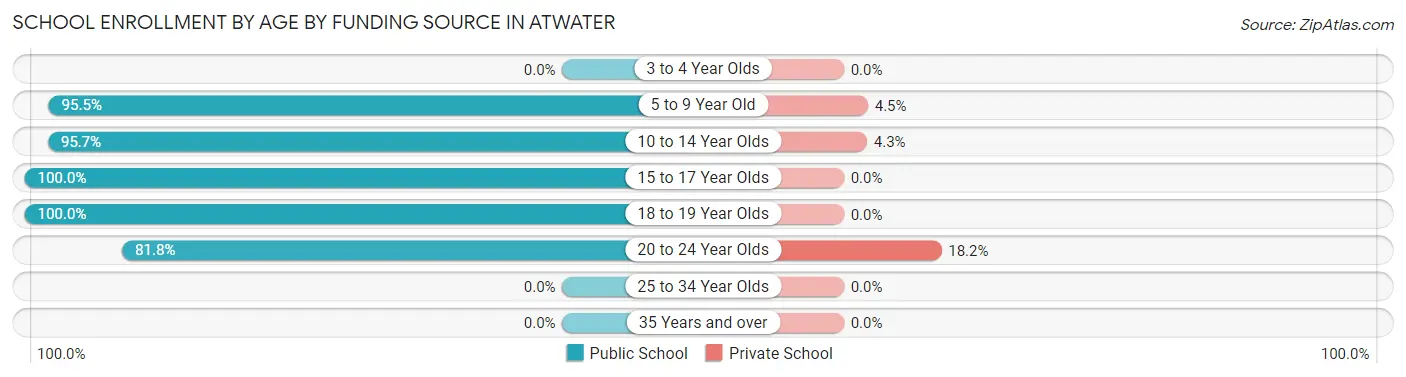
| Age Bracket | Public School | Private School |
| 3 to 4 Year Olds | 0 (0.0%) | 0 (0.0%) |
| 5 to 9 Year Old | 85 (95.5%) | 4 (4.5%) |
| 10 to 14 Year Olds | 177 (95.7%) | 8 (4.3%) |
| 15 to 17 Year Olds | 49 (100.0%) | 0 (0.0%) |
| 18 to 19 Year Olds | 9 (100.0%) | 0 (0.0%) |
| 20 to 24 Year Olds | 9 (81.8%) | 2 (18.2%) |
| 25 to 34 Year Olds | 0 (0.0%) | 0 (0.0%) |
| 35 Years and over | 0 (0.0%) | 0 (0.0%) |
| Total | 329 (95.9%) | 14 (4.1%) |
Educational Attainment by Field of Study in Atwater
Liberal arts & history (35 | 21.5%), education (32 | 19.6%), literature & languages (14 | 8.6%), arts & humanities (13 | 8.0%), and business (12 | 7.4%) are the most common fields of study among 163 individuals in Atwater who have obtained a bachelor's degree or higher.
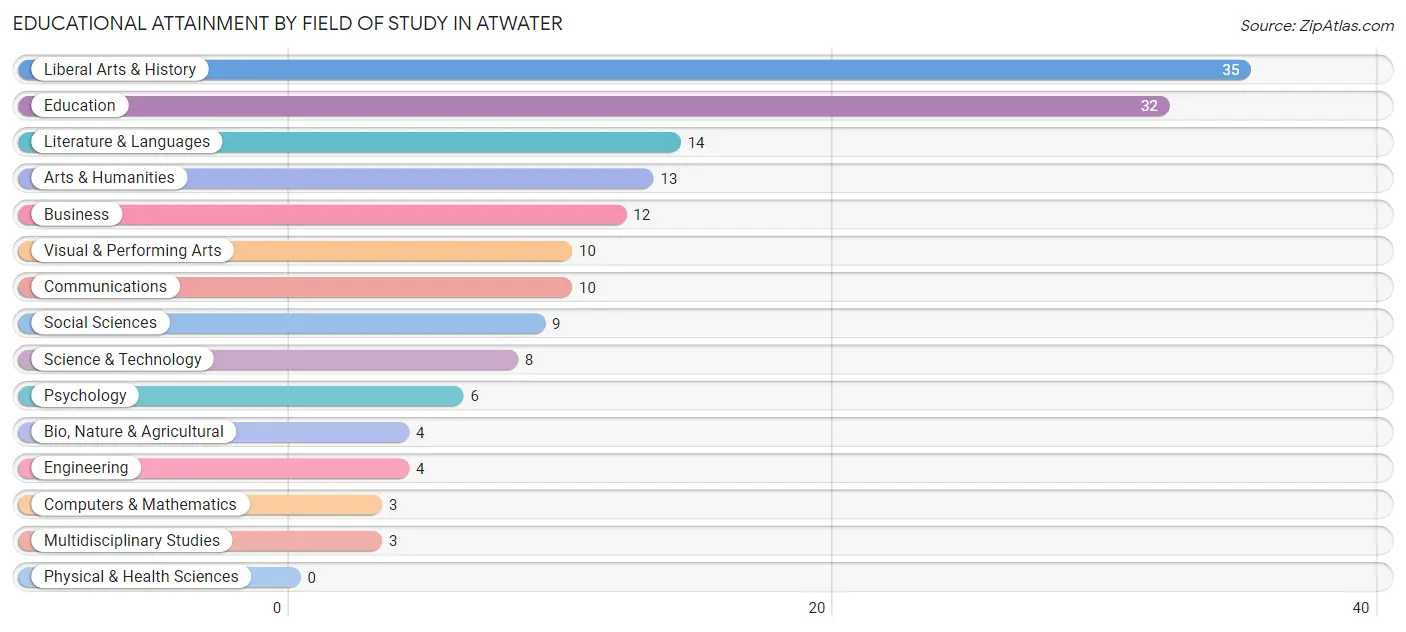
| Field of Study | # Graduates | % Graduates |
| Computers & Mathematics | 3 | 1.8% |
| Bio, Nature & Agricultural | 4 | 2.5% |
| Physical & Health Sciences | 0 | 0.0% |
| Psychology | 6 | 3.7% |
| Social Sciences | 9 | 5.5% |
| Engineering | 4 | 2.5% |
| Multidisciplinary Studies | 3 | 1.8% |
| Science & Technology | 8 | 4.9% |
| Business | 12 | 7.4% |
| Education | 32 | 19.6% |
| Literature & Languages | 14 | 8.6% |
| Liberal Arts & History | 35 | 21.5% |
| Visual & Performing Arts | 10 | 6.1% |
| Communications | 10 | 6.1% |
| Arts & Humanities | 13 | 8.0% |
| Total | 163 | 100.0% |
Transportation & Commute in Atwater
Vehicle Availability by Sex in Atwater
The most prevalent vehicle ownership categories in Atwater are males with 2 vehicles (114, accounting for 37.4%) and females with 2 vehicles (90, making up 39.9%).
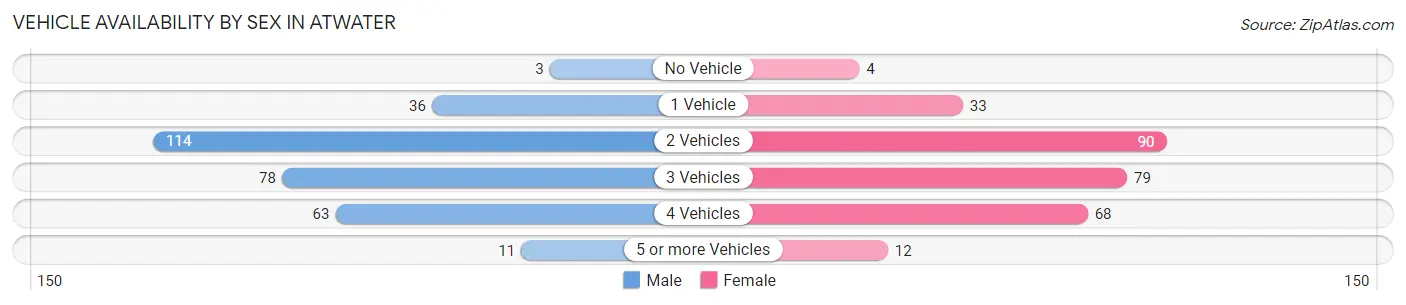
| Vehicles Available | Male | Female |
| No Vehicle | 3 (1.0%) | 4 (1.4%) |
| 1 Vehicle | 36 (11.8%) | 33 (11.5%) |
| 2 Vehicles | 114 (37.4%) | 90 (31.5%) |
| 3 Vehicles | 78 (25.6%) | 79 (27.6%) |
| 4 Vehicles | 63 (20.7%) | 68 (23.8%) |
| 5 or more Vehicles | 11 (3.6%) | 12 (4.2%) |
| Total | 305 (100.0%) | 286 (100.0%) |
Commute Time in Atwater
The most frequently occuring commute durations in Atwater are 20 to 24 minutes (216 commuters, 37.2%), 15 to 19 minutes (87 commuters, 15.0%), and 5 to 9 minutes (61 commuters, 10.5%).
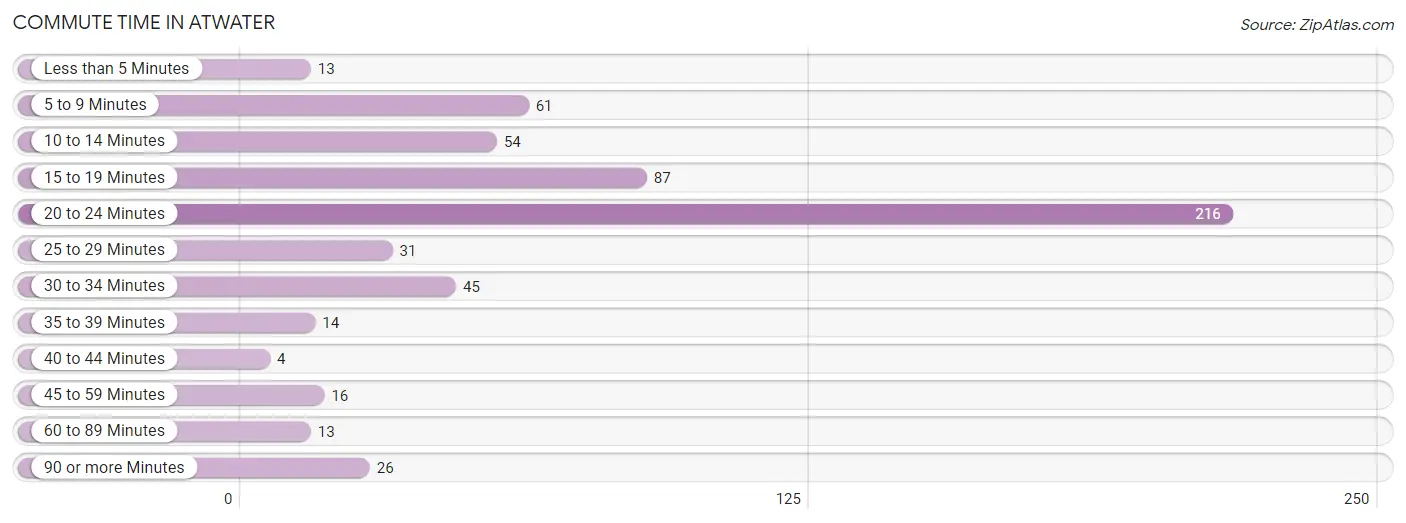
| Commute Time | # Commuters | % Commuters |
| Less than 5 Minutes | 13 | 2.2% |
| 5 to 9 Minutes | 61 | 10.5% |
| 10 to 14 Minutes | 54 | 9.3% |
| 15 to 19 Minutes | 87 | 15.0% |
| 20 to 24 Minutes | 216 | 37.2% |
| 25 to 29 Minutes | 31 | 5.3% |
| 30 to 34 Minutes | 45 | 7.8% |
| 35 to 39 Minutes | 14 | 2.4% |
| 40 to 44 Minutes | 4 | 0.7% |
| 45 to 59 Minutes | 16 | 2.8% |
| 60 to 89 Minutes | 13 | 2.2% |
| 90 or more Minutes | 26 | 4.5% |
Commute Time by Sex in Atwater
The most common commute times in Atwater are 20 to 24 minutes (107 commuters, 36.1%) for males and 20 to 24 minutes (109 commuters, 38.4%) for females.
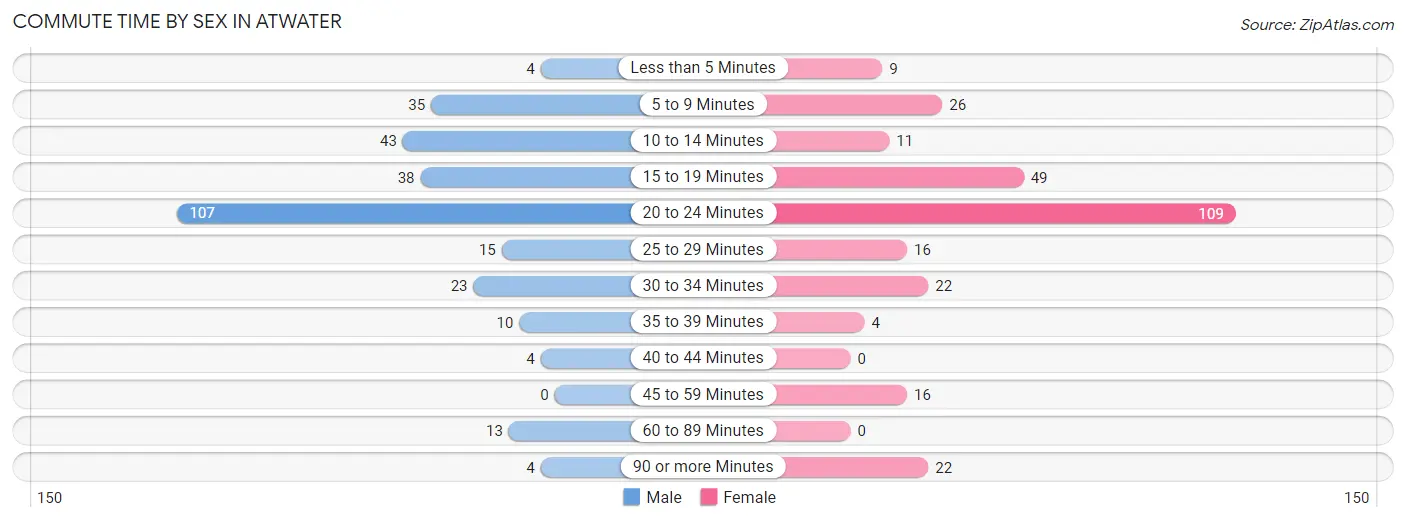
| Commute Time | Male | Female |
| Less than 5 Minutes | 4 (1.3%) | 9 (3.2%) |
| 5 to 9 Minutes | 35 (11.8%) | 26 (9.1%) |
| 10 to 14 Minutes | 43 (14.5%) | 11 (3.9%) |
| 15 to 19 Minutes | 38 (12.8%) | 49 (17.2%) |
| 20 to 24 Minutes | 107 (36.1%) | 109 (38.4%) |
| 25 to 29 Minutes | 15 (5.1%) | 16 (5.6%) |
| 30 to 34 Minutes | 23 (7.8%) | 22 (7.7%) |
| 35 to 39 Minutes | 10 (3.4%) | 4 (1.4%) |
| 40 to 44 Minutes | 4 (1.3%) | 0 (0.0%) |
| 45 to 59 Minutes | 0 (0.0%) | 16 (5.6%) |
| 60 to 89 Minutes | 13 (4.4%) | 0 (0.0%) |
| 90 or more Minutes | 4 (1.3%) | 22 (7.7%) |
Time of Departure to Work by Sex in Atwater
The most frequent times of departure to work in Atwater are 7:00 AM to 7:29 AM (67, 22.6%) for males and 7:00 AM to 7:29 AM (53, 18.7%) for females.
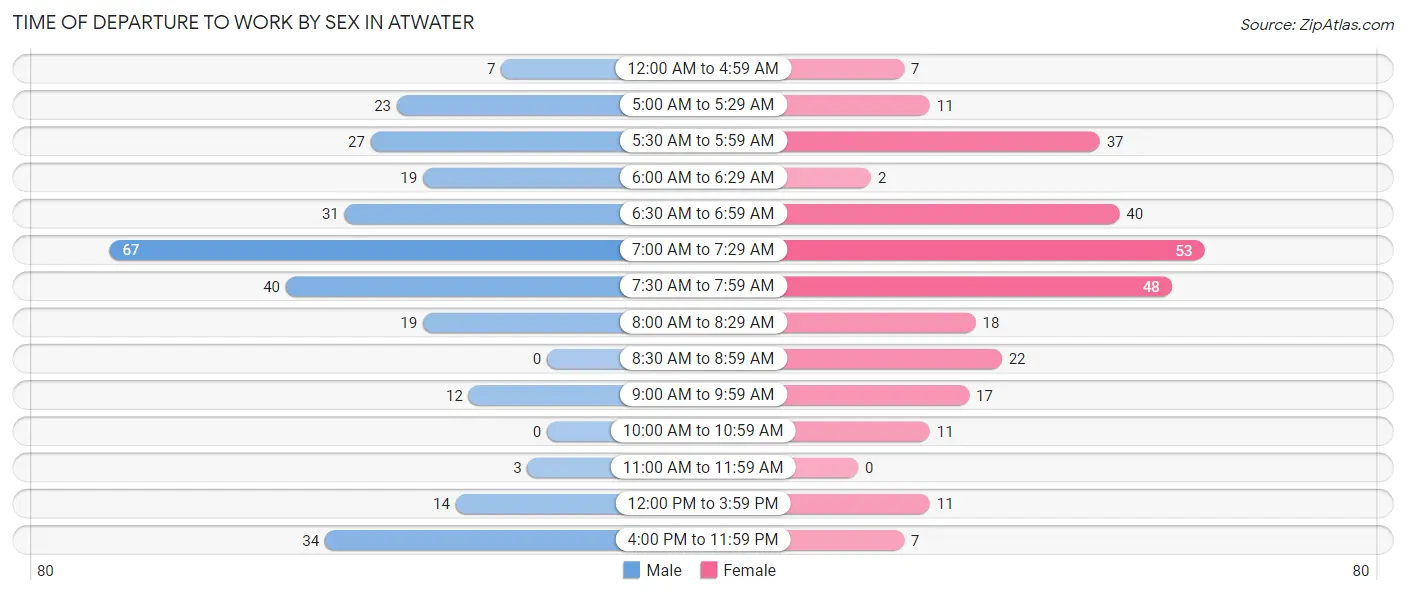
| Time of Departure | Male | Female |
| 12:00 AM to 4:59 AM | 7 (2.4%) | 7 (2.5%) |
| 5:00 AM to 5:29 AM | 23 (7.8%) | 11 (3.9%) |
| 5:30 AM to 5:59 AM | 27 (9.1%) | 37 (13.0%) |
| 6:00 AM to 6:29 AM | 19 (6.4%) | 2 (0.7%) |
| 6:30 AM to 6:59 AM | 31 (10.5%) | 40 (14.1%) |
| 7:00 AM to 7:29 AM | 67 (22.6%) | 53 (18.7%) |
| 7:30 AM to 7:59 AM | 40 (13.5%) | 48 (16.9%) |
| 8:00 AM to 8:29 AM | 19 (6.4%) | 18 (6.3%) |
| 8:30 AM to 8:59 AM | 0 (0.0%) | 22 (7.7%) |
| 9:00 AM to 9:59 AM | 12 (4.1%) | 17 (6.0%) |
| 10:00 AM to 10:59 AM | 0 (0.0%) | 11 (3.9%) |
| 11:00 AM to 11:59 AM | 3 (1.0%) | 0 (0.0%) |
| 12:00 PM to 3:59 PM | 14 (4.7%) | 11 (3.9%) |
| 4:00 PM to 11:59 PM | 34 (11.5%) | 7 (2.5%) |
| Total | 296 (100.0%) | 284 (100.0%) |
Housing Occupancy in Atwater
Occupancy by Ownership in Atwater
Of the total 416 dwellings in Atwater, owner-occupied units account for 334 (80.3%), while renter-occupied units make up 82 (19.7%).
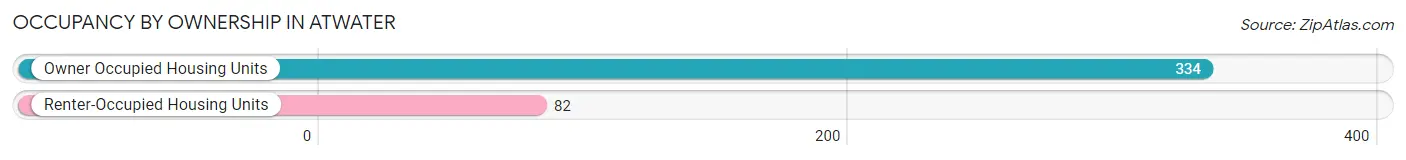
| Occupancy | # Housing Units | % Housing Units |
| Owner Occupied Housing Units | 334 | 80.3% |
| Renter-Occupied Housing Units | 82 | 19.7% |
| Total Occupied Housing Units | 416 | 100.0% |
Occupancy by Household Size in Atwater
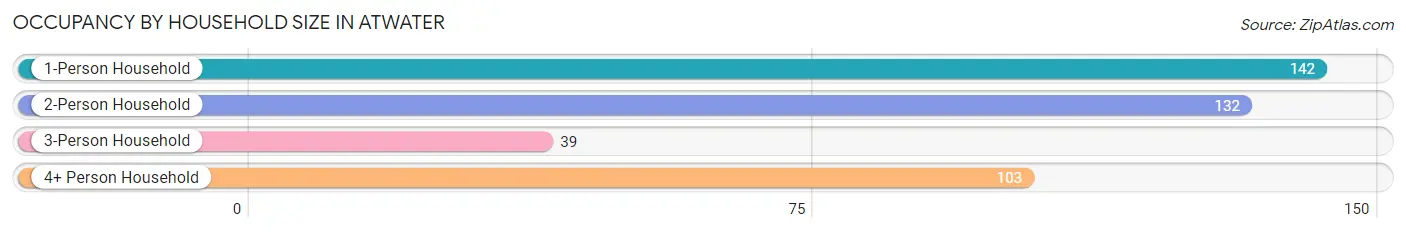
| Household Size | # Housing Units | % Housing Units |
| 1-Person Household | 142 | 34.1% |
| 2-Person Household | 132 | 31.7% |
| 3-Person Household | 39 | 9.4% |
| 4+ Person Household | 103 | 24.8% |
| Total Housing Units | 416 | 100.0% |
Occupancy by Ownership by Household Size in Atwater
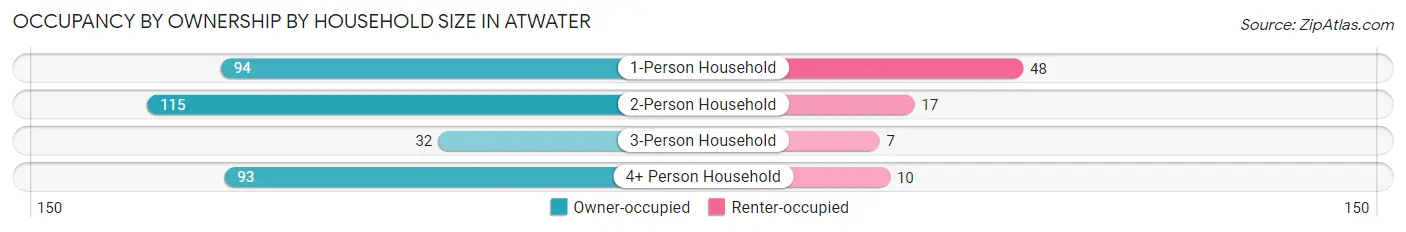
| Household Size | Owner-occupied | Renter-occupied |
| 1-Person Household | 94 (66.2%) | 48 (33.8%) |
| 2-Person Household | 115 (87.1%) | 17 (12.9%) |
| 3-Person Household | 32 (82.1%) | 7 (17.9%) |
| 4+ Person Household | 93 (90.3%) | 10 (9.7%) |
| Total Housing Units | 334 (80.3%) | 82 (19.7%) |
Occupancy by Educational Attainment in Atwater
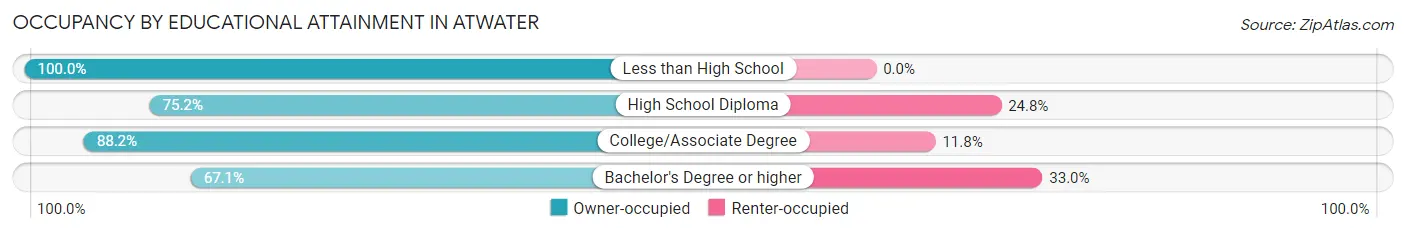
| Household Size | Owner-occupied | Renter-occupied |
| Less than High School | 7 (100.0%) | 0 (0.0%) |
| High School Diploma | 88 (75.2%) | 29 (24.8%) |
| College/Associate Degree | 180 (88.2%) | 24 (11.8%) |
| Bachelor's Degree or higher | 59 (67.0%) | 29 (33.0%) |
Occupancy by Age of Householder in Atwater
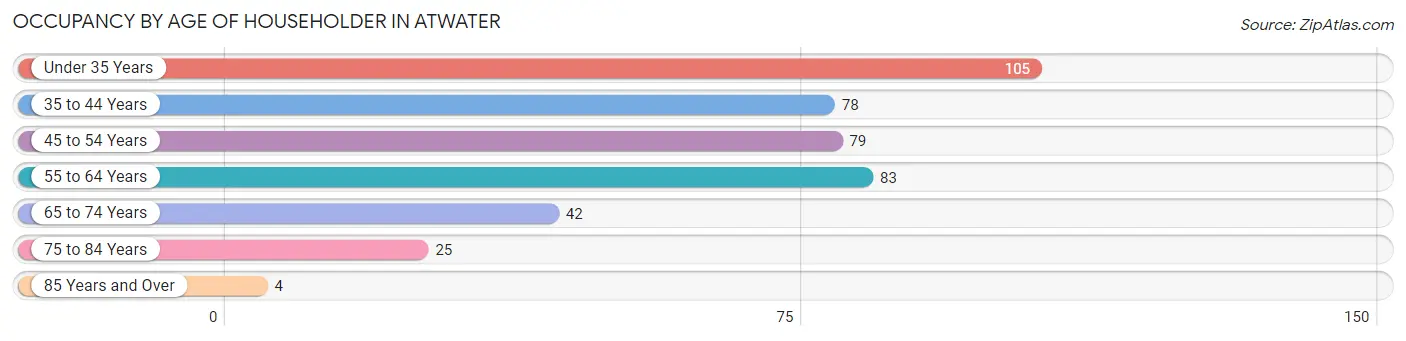
| Age Bracket | # Households | % Households |
| Under 35 Years | 105 | 25.2% |
| 35 to 44 Years | 78 | 18.8% |
| 45 to 54 Years | 79 | 19.0% |
| 55 to 64 Years | 83 | 20.0% |
| 65 to 74 Years | 42 | 10.1% |
| 75 to 84 Years | 25 | 6.0% |
| 85 Years and Over | 4 | 1.0% |
| Total | 416 | 100.0% |
Housing Finances in Atwater
Median Income by Occupancy in Atwater
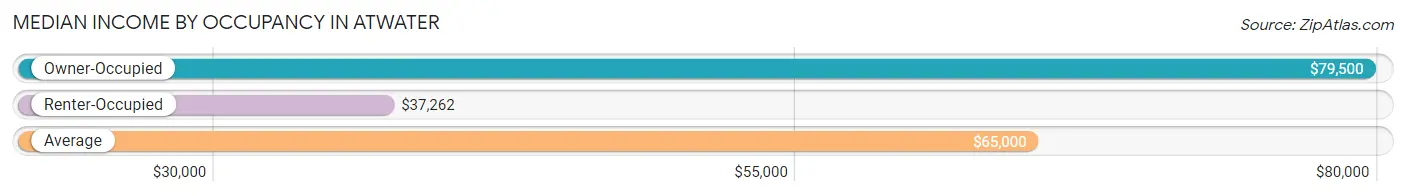
| Occupancy Type | # Households | Median Income |
| Owner-Occupied | 334 (80.3%) | $79,500 |
| Renter-Occupied | 82 (19.7%) | $37,262 |
| Average | 416 (100.0%) | $65,000 |
Occupancy by Householder Income Bracket in Atwater
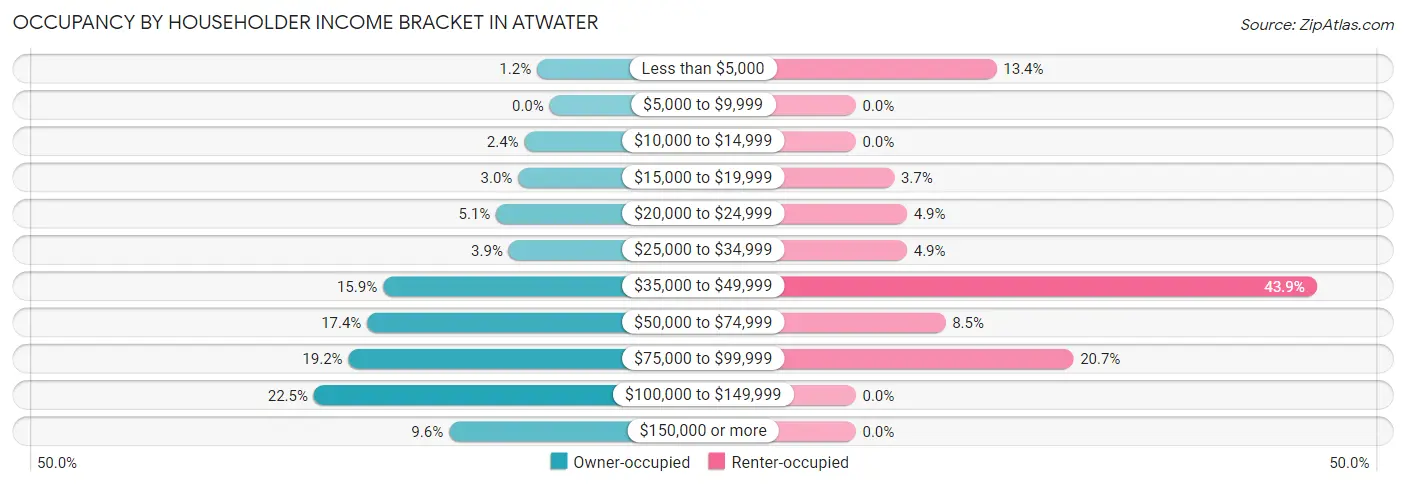
| Income Bracket | Owner-occupied | Renter-occupied |
| Less than $5,000 | 4 (1.2%) | 11 (13.4%) |
| $5,000 to $9,999 | 0 (0.0%) | 0 (0.0%) |
| $10,000 to $14,999 | 8 (2.4%) | 0 (0.0%) |
| $15,000 to $19,999 | 10 (3.0%) | 3 (3.7%) |
| $20,000 to $24,999 | 17 (5.1%) | 4 (4.9%) |
| $25,000 to $34,999 | 13 (3.9%) | 4 (4.9%) |
| $35,000 to $49,999 | 53 (15.9%) | 36 (43.9%) |
| $50,000 to $74,999 | 58 (17.4%) | 7 (8.5%) |
| $75,000 to $99,999 | 64 (19.2%) | 17 (20.7%) |
| $100,000 to $149,999 | 75 (22.5%) | 0 (0.0%) |
| $150,000 or more | 32 (9.6%) | 0 (0.0%) |
| Total | 334 (100.0%) | 82 (100.0%) |
Monthly Housing Cost Tiers in Atwater
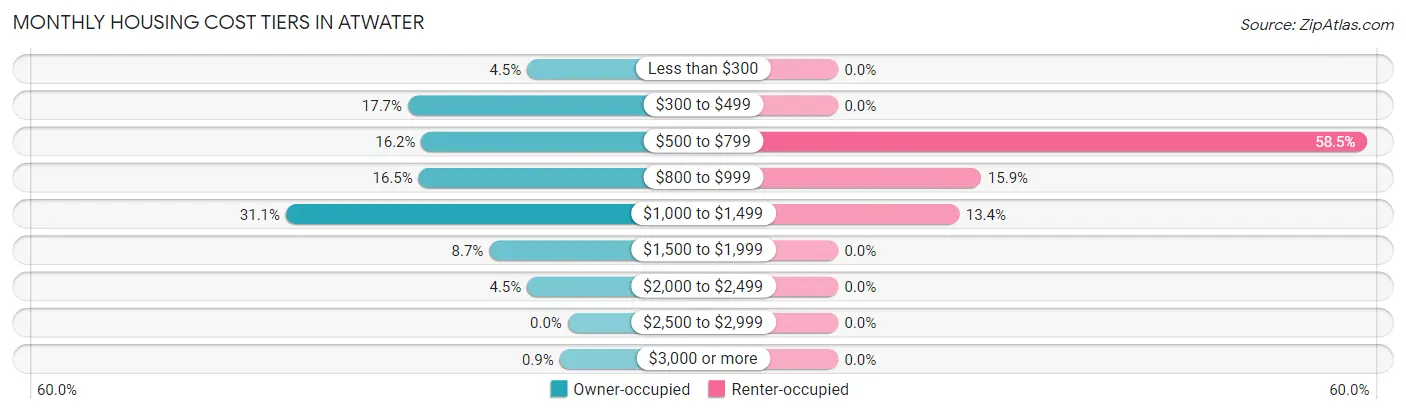
| Monthly Cost | Owner-occupied | Renter-occupied |
| Less than $300 | 15 (4.5%) | 0 (0.0%) |
| $300 to $499 | 59 (17.7%) | 0 (0.0%) |
| $500 to $799 | 54 (16.2%) | 48 (58.5%) |
| $800 to $999 | 55 (16.5%) | 13 (15.9%) |
| $1,000 to $1,499 | 104 (31.1%) | 11 (13.4%) |
| $1,500 to $1,999 | 29 (8.7%) | 0 (0.0%) |
| $2,000 to $2,499 | 15 (4.5%) | 0 (0.0%) |
| $2,500 to $2,999 | 0 (0.0%) | 0 (0.0%) |
| $3,000 or more | 3 (0.9%) | 0 (0.0%) |
| Total | 334 (100.0%) | 82 (100.0%) |
Physical Housing Characteristics in Atwater
Housing Structures in Atwater
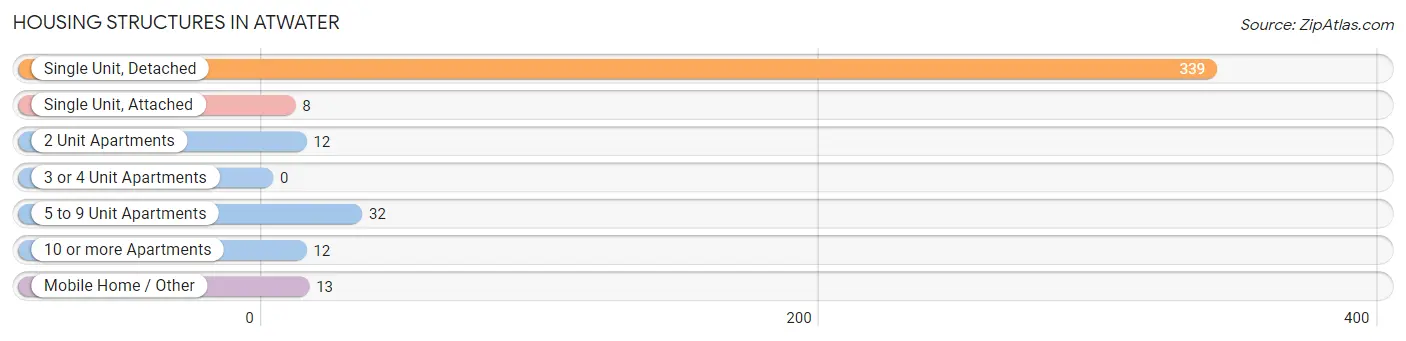
| Structure Type | # Housing Units | % Housing Units |
| Single Unit, Detached | 339 | 81.5% |
| Single Unit, Attached | 8 | 1.9% |
| 2 Unit Apartments | 12 | 2.9% |
| 3 or 4 Unit Apartments | 0 | 0.0% |
| 5 to 9 Unit Apartments | 32 | 7.7% |
| 10 or more Apartments | 12 | 2.9% |
| Mobile Home / Other | 13 | 3.1% |
| Total | 416 | 100.0% |
Housing Structures by Occupancy in Atwater
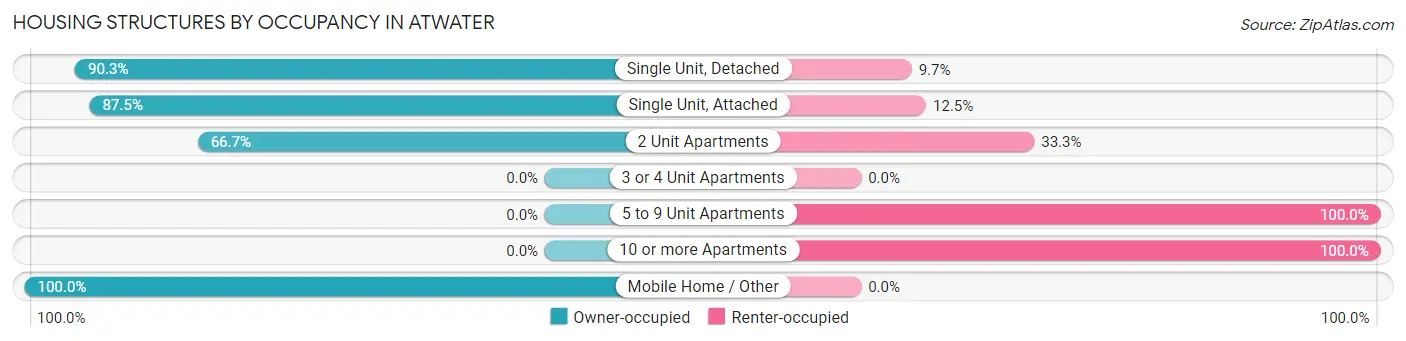
| Structure Type | Owner-occupied | Renter-occupied |
| Single Unit, Detached | 306 (90.3%) | 33 (9.7%) |
| Single Unit, Attached | 7 (87.5%) | 1 (12.5%) |
| 2 Unit Apartments | 8 (66.7%) | 4 (33.3%) |
| 3 or 4 Unit Apartments | 0 (0.0%) | 0 (0.0%) |
| 5 to 9 Unit Apartments | 0 (0.0%) | 32 (100.0%) |
| 10 or more Apartments | 0 (0.0%) | 12 (100.0%) |
| Mobile Home / Other | 13 (100.0%) | 0 (0.0%) |
| Total | 334 (80.3%) | 82 (19.7%) |
Housing Structures by Number of Rooms in Atwater
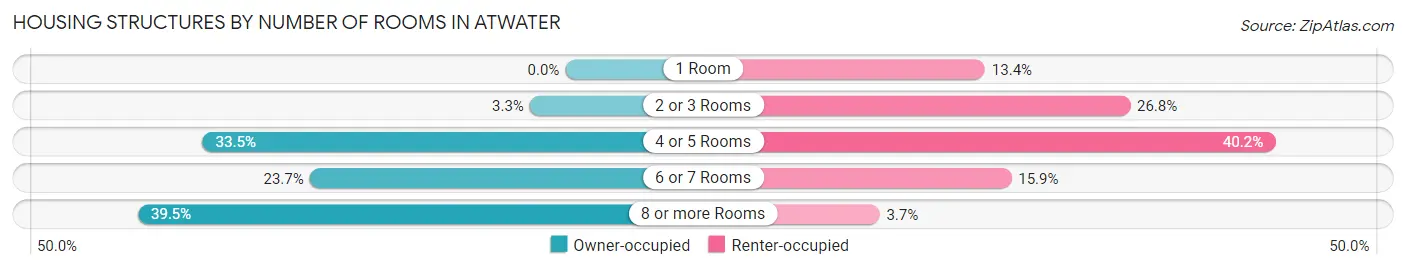
| Number of Rooms | Owner-occupied | Renter-occupied |
| 1 Room | 0 (0.0%) | 11 (13.4%) |
| 2 or 3 Rooms | 11 (3.3%) | 22 (26.8%) |
| 4 or 5 Rooms | 112 (33.5%) | 33 (40.2%) |
| 6 or 7 Rooms | 79 (23.6%) | 13 (15.9%) |
| 8 or more Rooms | 132 (39.5%) | 3 (3.7%) |
| Total | 334 (100.0%) | 82 (100.0%) |
Housing Structure by Heating Type in Atwater
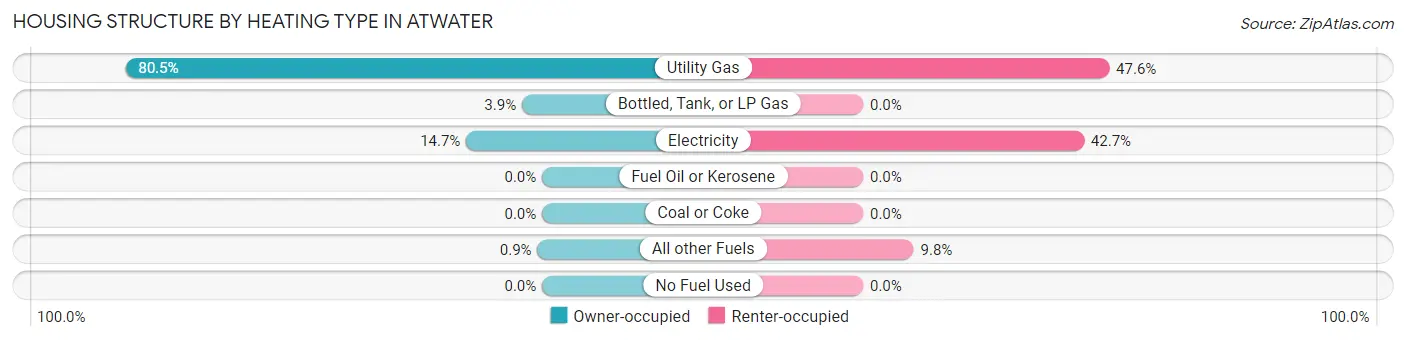
| Heating Type | Owner-occupied | Renter-occupied |
| Utility Gas | 269 (80.5%) | 39 (47.6%) |
| Bottled, Tank, or LP Gas | 13 (3.9%) | 0 (0.0%) |
| Electricity | 49 (14.7%) | 35 (42.7%) |
| Fuel Oil or Kerosene | 0 (0.0%) | 0 (0.0%) |
| Coal or Coke | 0 (0.0%) | 0 (0.0%) |
| All other Fuels | 3 (0.9%) | 8 (9.8%) |
| No Fuel Used | 0 (0.0%) | 0 (0.0%) |
| Total | 334 (100.0%) | 82 (100.0%) |
Household Vehicle Usage in Atwater
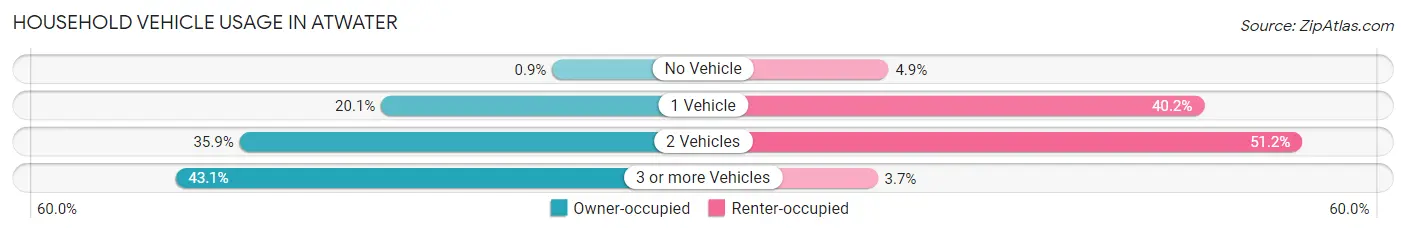
| Vehicles per Household | Owner-occupied | Renter-occupied |
| No Vehicle | 3 (0.9%) | 4 (4.9%) |
| 1 Vehicle | 67 (20.1%) | 33 (40.2%) |
| 2 Vehicles | 120 (35.9%) | 42 (51.2%) |
| 3 or more Vehicles | 144 (43.1%) | 3 (3.7%) |
| Total | 334 (100.0%) | 82 (100.0%) |
Real Estate & Mortgages in Atwater
Real Estate and Mortgage Overview in Atwater
| Characteristic | Without Mortgage | With Mortgage |
| Housing Units | 110 | 224 |
| Median Property Value | $122,800 | $148,100 |
| Median Household Income | $51,979 | $28 |
| Monthly Housing Costs | $456 | $0 |
| Real Estate Taxes | $1,686 | $0 |
Property Value by Mortgage Status in Atwater
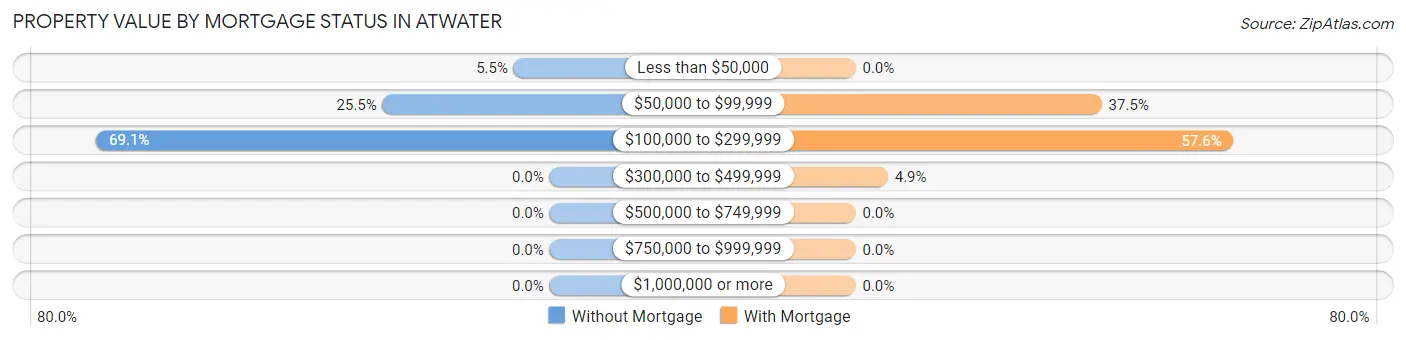
| Property Value | Without Mortgage | With Mortgage |
| Less than $50,000 | 6 (5.4%) | 0 (0.0%) |
| $50,000 to $99,999 | 28 (25.5%) | 84 (37.5%) |
| $100,000 to $299,999 | 76 (69.1%) | 129 (57.6%) |
| $300,000 to $499,999 | 0 (0.0%) | 11 (4.9%) |
| $500,000 to $749,999 | 0 (0.0%) | 0 (0.0%) |
| $750,000 to $999,999 | 0 (0.0%) | 0 (0.0%) |
| $1,000,000 or more | 0 (0.0%) | 0 (0.0%) |
| Total | 110 (100.0%) | 224 (100.0%) |
Household Income by Mortgage Status in Atwater
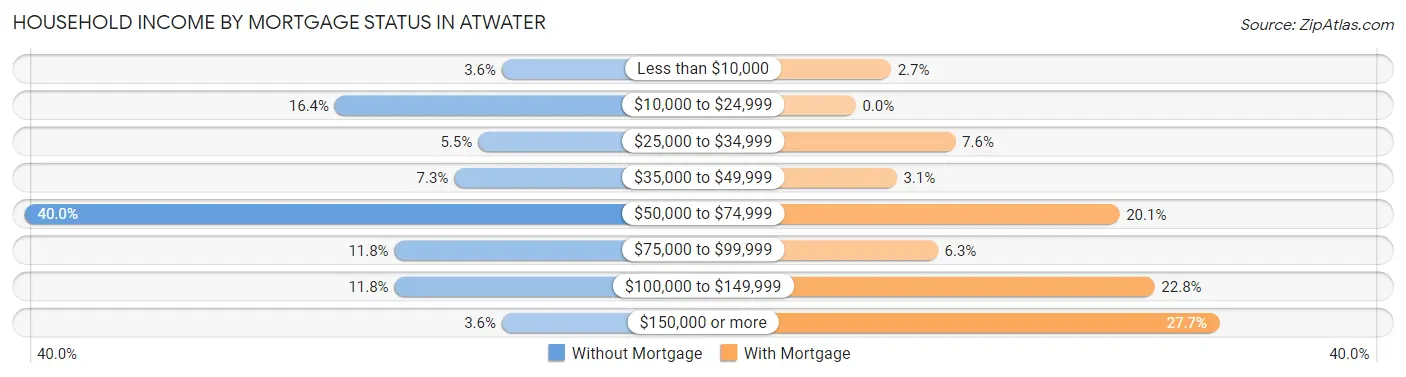
| Household Income | Without Mortgage | With Mortgage |
| Less than $10,000 | 4 (3.6%) | 6 (2.7%) |
| $10,000 to $24,999 | 18 (16.4%) | 0 (0.0%) |
| $25,000 to $34,999 | 6 (5.4%) | 17 (7.6%) |
| $35,000 to $49,999 | 8 (7.3%) | 7 (3.1%) |
| $50,000 to $74,999 | 44 (40.0%) | 45 (20.1%) |
| $75,000 to $99,999 | 13 (11.8%) | 14 (6.2%) |
| $100,000 to $149,999 | 13 (11.8%) | 51 (22.8%) |
| $150,000 or more | 4 (3.6%) | 62 (27.7%) |
| Total | 110 (100.0%) | 224 (100.0%) |
Property Value to Household Income Ratio in Atwater
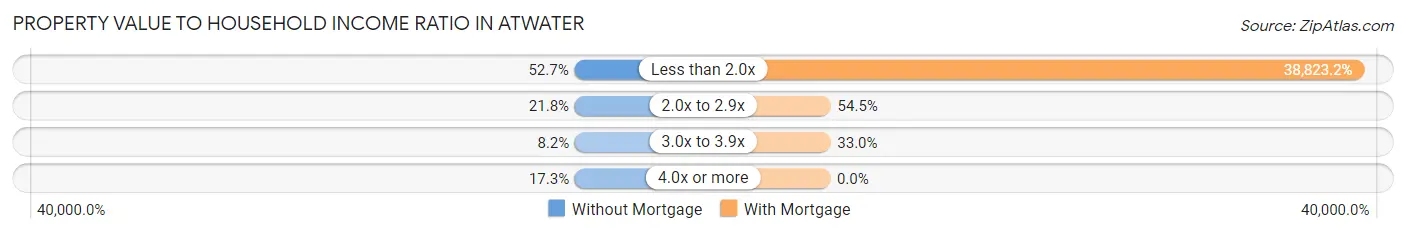
| Value-to-Income Ratio | Without Mortgage | With Mortgage |
| Less than 2.0x | 58 (52.7%) | 86,964 (38,823.2%) |
| 2.0x to 2.9x | 24 (21.8%) | 122 (54.5%) |
| 3.0x to 3.9x | 9 (8.2%) | 74 (33.0%) |
| 4.0x or more | 19 (17.3%) | 0 (0.0%) |
| Total | 110 (100.0%) | 224 (100.0%) |
Real Estate Taxes by Mortgage Status in Atwater
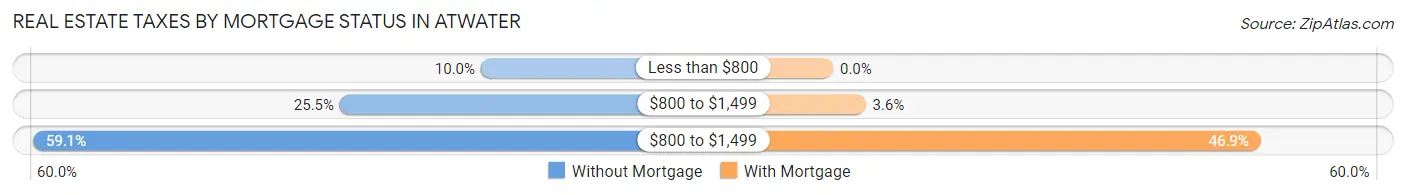
| Property Taxes | Without Mortgage | With Mortgage |
| Less than $800 | 11 (10.0%) | 0 (0.0%) |
| $800 to $1,499 | 28 (25.5%) | 8 (3.6%) |
| $800 to $1,499 | 65 (59.1%) | 105 (46.9%) |
| Total | 110 (100.0%) | 224 (100.0%) |
Health & Disability in Atwater
Health Insurance Coverage by Age in Atwater
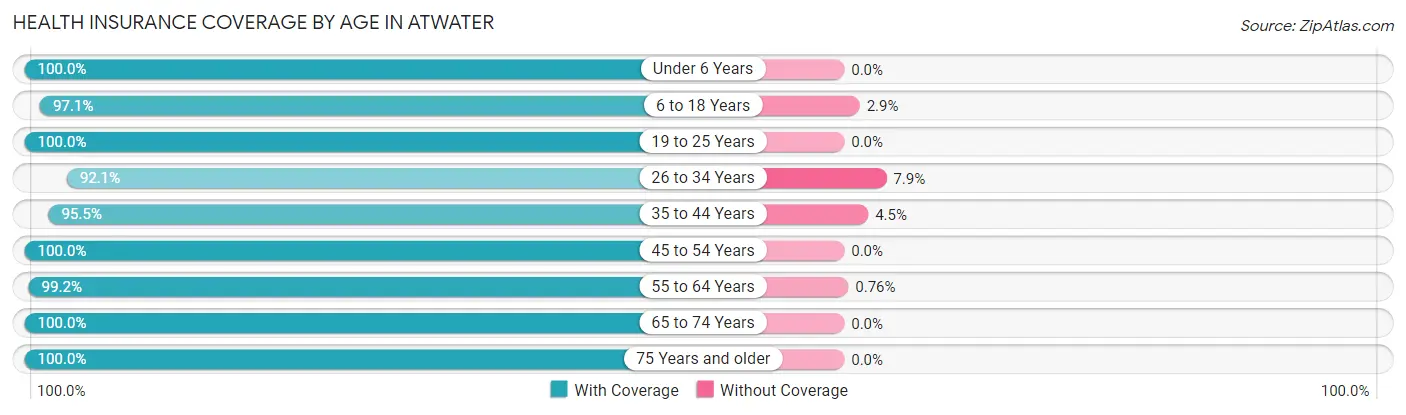
| Age Bracket | With Coverage | Without Coverage |
| Under 6 Years | 88 (100.0%) | 0 (0.0%) |
| 6 to 18 Years | 304 (97.1%) | 9 (2.9%) |
| 19 to 25 Years | 120 (100.0%) | 0 (0.0%) |
| 26 to 34 Years | 117 (92.1%) | 10 (7.9%) |
| 35 to 44 Years | 150 (95.5%) | 7 (4.5%) |
| 45 to 54 Years | 157 (100.0%) | 0 (0.0%) |
| 55 to 64 Years | 130 (99.2%) | 1 (0.8%) |
| 65 to 74 Years | 70 (100.0%) | 0 (0.0%) |
| 75 Years and older | 42 (100.0%) | 0 (0.0%) |
| Total | 1,178 (97.8%) | 27 (2.2%) |
Health Insurance Coverage by Citizenship Status in Atwater
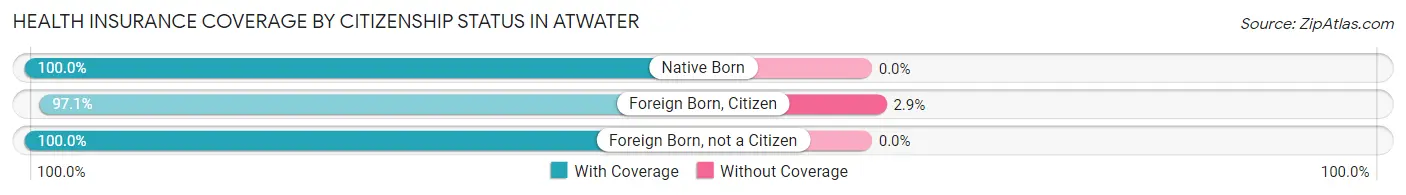
| Citizenship Status | With Coverage | Without Coverage |
| Native Born | 88 (100.0%) | 0 (0.0%) |
| Foreign Born, Citizen | 304 (97.1%) | 9 (2.9%) |
| Foreign Born, not a Citizen | 120 (100.0%) | 0 (0.0%) |
Health Insurance Coverage by Household Income in Atwater
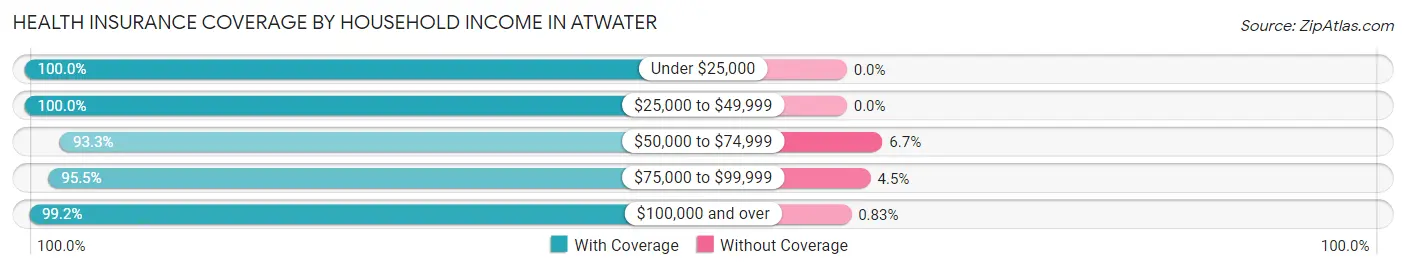
| Household Income | With Coverage | Without Coverage |
| Under $25,000 | 102 (100.0%) | 0 (0.0%) |
| $25,000 to $49,999 | 158 (100.0%) | 0 (0.0%) |
| $50,000 to $74,999 | 126 (93.3%) | 9 (6.7%) |
| $75,000 to $99,999 | 300 (95.5%) | 14 (4.5%) |
| $100,000 and over | 479 (99.2%) | 4 (0.8%) |
Public vs Private Health Insurance Coverage by Age in Atwater
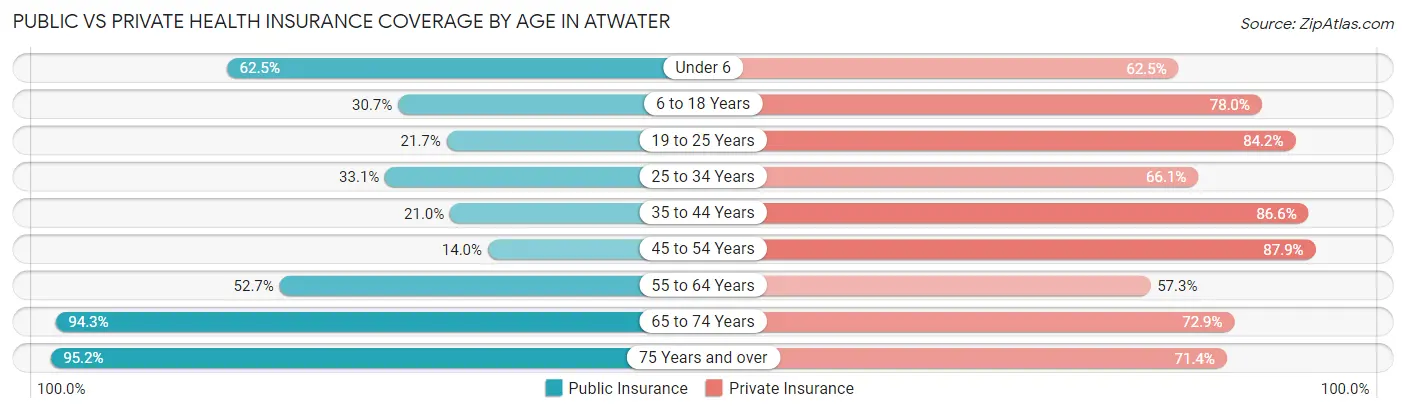
| Age Bracket | Public Insurance | Private Insurance |
| Under 6 | 55 (62.5%) | 55 (62.5%) |
| 6 to 18 Years | 96 (30.7%) | 244 (78.0%) |
| 19 to 25 Years | 26 (21.7%) | 101 (84.2%) |
| 25 to 34 Years | 42 (33.1%) | 84 (66.1%) |
| 35 to 44 Years | 33 (21.0%) | 136 (86.6%) |
| 45 to 54 Years | 22 (14.0%) | 138 (87.9%) |
| 55 to 64 Years | 69 (52.7%) | 75 (57.3%) |
| 65 to 74 Years | 66 (94.3%) | 51 (72.9%) |
| 75 Years and over | 40 (95.2%) | 30 (71.4%) |
| Total | 449 (37.3%) | 914 (75.8%) |
Disability Status by Sex by Age in Atwater
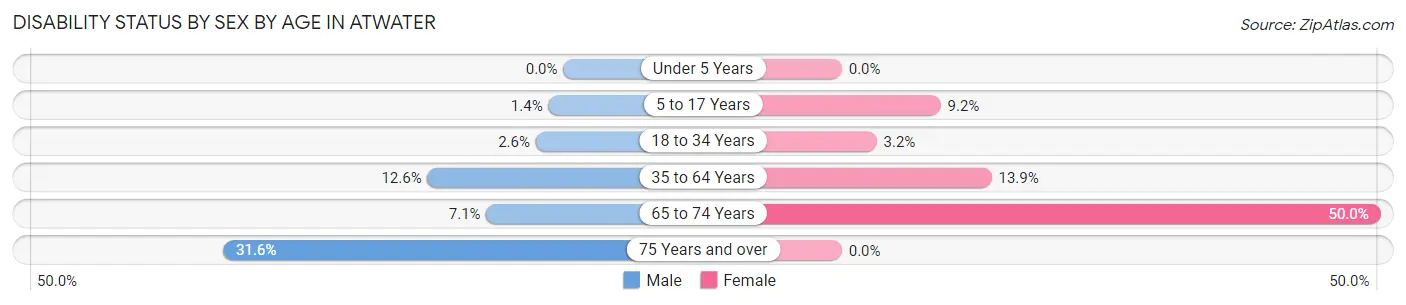
| Age Bracket | Male | Female |
| Under 5 Years | 0 (0.0%) | 0 (0.0%) |
| 5 to 17 Years | 3 (1.4%) | 10 (9.2%) |
| 18 to 34 Years | 4 (2.6%) | 3 (3.2%) |
| 35 to 64 Years | 28 (12.6%) | 31 (13.9%) |
| 65 to 74 Years | 2 (7.1%) | 21 (50.0%) |
| 75 Years and over | 6 (31.6%) | 0 (0.0%) |
Disability Class by Sex by Age in Atwater
Disability Class: Hearing Difficulty
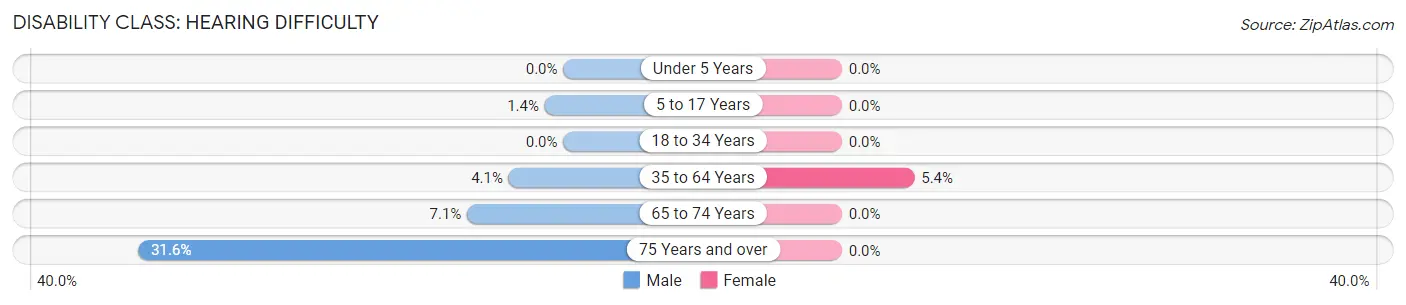
| Age Bracket | Male | Female |
| Under 5 Years | 0 (0.0%) | 0 (0.0%) |
| 5 to 17 Years | 3 (1.4%) | 0 (0.0%) |
| 18 to 34 Years | 0 (0.0%) | 0 (0.0%) |
| 35 to 64 Years | 9 (4.1%) | 12 (5.4%) |
| 65 to 74 Years | 2 (7.1%) | 0 (0.0%) |
| 75 Years and over | 6 (31.6%) | 0 (0.0%) |
Disability Class: Vision Difficulty
| Age Bracket | Male | Female |
| Under 5 Years | 0 (0.0%) | 0 (0.0%) |
| 5 to 17 Years | 0 (0.0%) | 0 (0.0%) |
| 18 to 34 Years | 0 (0.0%) | 0 (0.0%) |
| 35 to 64 Years | 0 (0.0%) | 0 (0.0%) |
| 65 to 74 Years | 0 (0.0%) | 0 (0.0%) |
| 75 Years and over | 0 (0.0%) | 0 (0.0%) |
Disability Class: Cognitive Difficulty
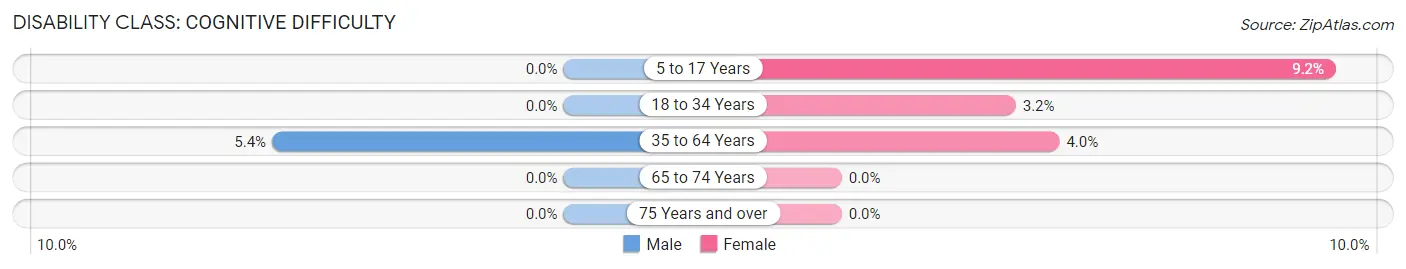
| Age Bracket | Male | Female |
| 5 to 17 Years | 0 (0.0%) | 10 (9.2%) |
| 18 to 34 Years | 0 (0.0%) | 3 (3.2%) |
| 35 to 64 Years | 12 (5.4%) | 9 (4.0%) |
| 65 to 74 Years | 0 (0.0%) | 0 (0.0%) |
| 75 Years and over | 0 (0.0%) | 0 (0.0%) |
Disability Class: Ambulatory Difficulty
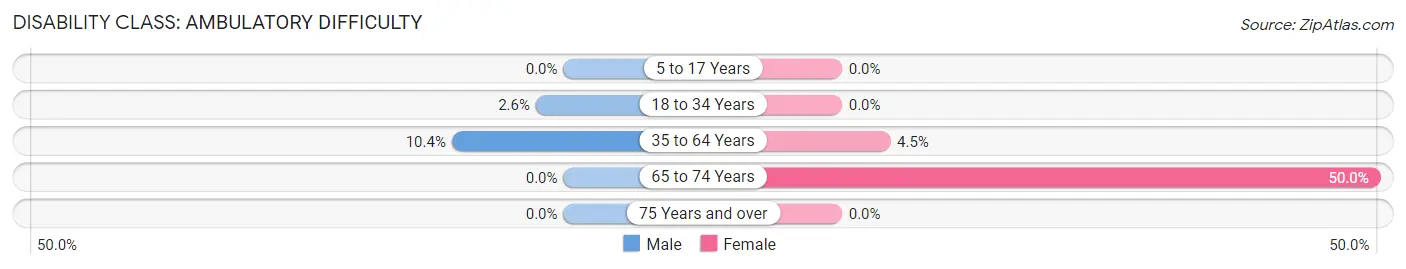
| Age Bracket | Male | Female |
| 5 to 17 Years | 0 (0.0%) | 0 (0.0%) |
| 18 to 34 Years | 4 (2.6%) | 0 (0.0%) |
| 35 to 64 Years | 23 (10.4%) | 10 (4.5%) |
| 65 to 74 Years | 0 (0.0%) | 21 (50.0%) |
| 75 Years and over | 0 (0.0%) | 0 (0.0%) |
Disability Class: Self-Care Difficulty
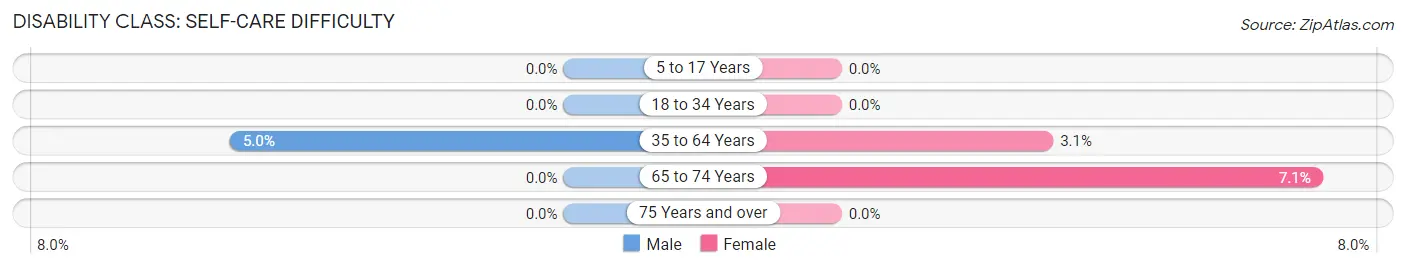
| Age Bracket | Male | Female |
| 5 to 17 Years | 0 (0.0%) | 0 (0.0%) |
| 18 to 34 Years | 0 (0.0%) | 0 (0.0%) |
| 35 to 64 Years | 11 (5.0%) | 7 (3.1%) |
| 65 to 74 Years | 0 (0.0%) | 3 (7.1%) |
| 75 Years and over | 0 (0.0%) | 0 (0.0%) |
Technology Access in Atwater
Computing Device Access in Atwater
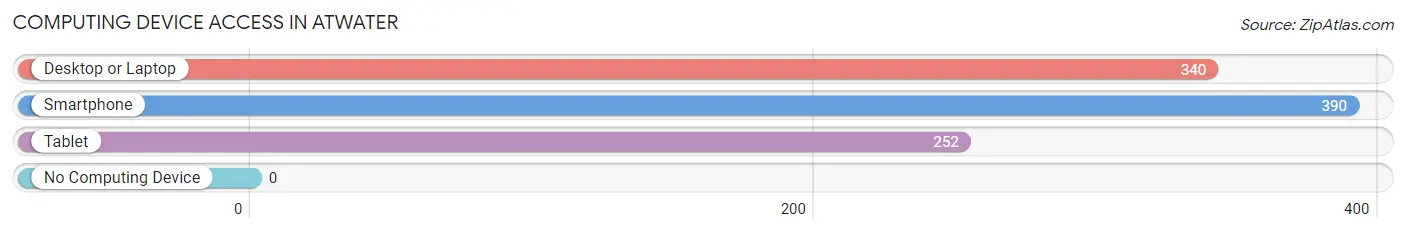
| Device Type | # Households | % Households |
| Desktop or Laptop | 340 | 81.7% |
| Smartphone | 390 | 93.8% |
| Tablet | 252 | 60.6% |
| No Computing Device | 0 | 0.0% |
| Total | 416 | 100.0% |
Internet Access in Atwater
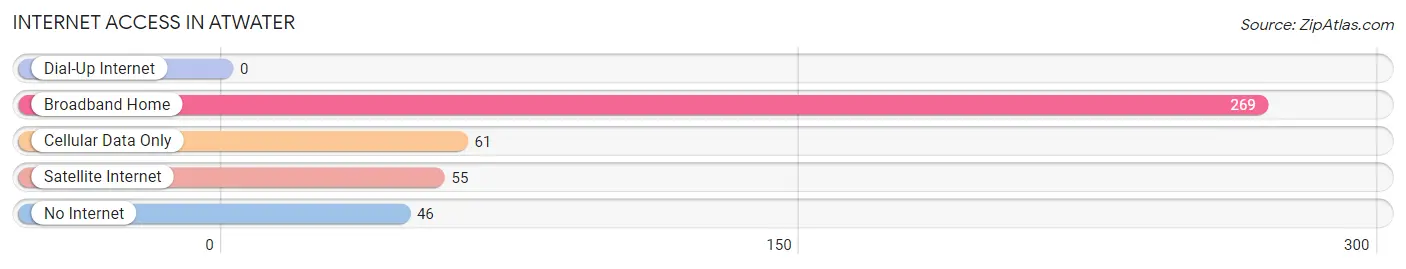
| Internet Type | # Households | % Households |
| Dial-Up Internet | 0 | 0.0% |
| Broadband Home | 269 | 64.7% |
| Cellular Data Only | 61 | 14.7% |
| Satellite Internet | 55 | 13.2% |
| No Internet | 46 | 11.1% |
| Total | 416 | 100.0% |
Atwater Summary
Atwater is a small city located in Kandiyohi County, Minnesota. It is situated on the banks of the Crow River, about 30 miles west of St. Cloud. The city has a population of 1,717 people, according to the 2010 census.
History
Atwater was founded in 1856 by a group of settlers from New York. The city was named after Atwater Kent, a prominent businessman from the area. The city was incorporated in 1872 and has since grown to become a thriving community.
Atwater has a rich history of industry and agriculture. In the late 1800s, the city was home to a number of sawmills, flour mills, and other businesses. The city was also home to a number of farms, which provided the city with much of its economic stability.
In the early 1900s, Atwater was home to a number of businesses, including a creamery, a cheese factory, and a canning factory. The city also had a number of churches, schools, and other institutions.
Geography
Atwater is located in the central part of Minnesota, about 30 miles west of St. Cloud. The city is situated on the banks of the Crow River, which flows through the city. The city is surrounded by rolling hills and farmland.
The climate in Atwater is typical of the Midwest, with cold winters and hot summers. The average temperature in the summer is around 75 degrees Fahrenheit, while the average temperature in the winter is around 20 degrees Fahrenheit.
Economy
Atwater’s economy is largely based on agriculture and manufacturing. The city is home to a number of farms, which produce a variety of crops, including corn, soybeans, and wheat. The city is also home to a number of manufacturing businesses, including a canning factory and a cheese factory.
Atwater is also home to a number of small businesses, including restaurants, retail stores, and other services. The city is also home to a number of churches, schools, and other institutions.
Demographics
Atwater has a population of 1,717 people, according to the 2010 census. The city has a median age of 38.7 years, and the median household income is $50,945. The city is predominantly white, with a small percentage of African Americans, Hispanics, and other ethnicities.
Atwater is a small city with a rich history and a vibrant economy. The city is home to a number of farms, businesses, and other institutions, and is a great place to live and work.
Common Questions
What is Per Capita Income in Atwater?
Per Capita income in Atwater is $27,673.
What is the Median Family Income in Atwater?
Median Family Income in Atwater is $85,804.
What is the Median Household income in Atwater?
Median Household Income in Atwater is $65,000.
What is Income or Wage Gap in Atwater?
Income or Wage Gap in Atwater is 8.0%.
Women in Atwater earn 92.0 cents for every dollar earned by a man.
What is Inequality or Gini Index in Atwater?
Inequality or Gini Index in Atwater is 0.35.
What is the Total Population of Atwater?
Total Population of Atwater is 1,210.
What is the Total Male Population of Atwater?
Total Male Population of Atwater is 658.
What is the Total Female Population of Atwater?
Total Female Population of Atwater is 552.
What is the Ratio of Males per 100 Females in Atwater?
There are 119.20 Males per 100 Females in Atwater.
What is the Ratio of Females per 100 Males in Atwater?
There are 83.89 Females per 100 Males in Atwater.
What is the Median Population Age in Atwater?
Median Population Age in Atwater is 31.2 Years.
What is the Average Family Size in Atwater
Average Family Size in Atwater is 3.9 People.
What is the Average Household Size in Atwater
Average Household Size in Atwater is 2.9 People.
How Large is the Labor Force in Atwater?
There are 661 People in the Labor Forcein in Atwater.
What is the Percentage of People in the Labor Force in Atwater?
78.0% of People are in the Labor Force in Atwater.
What is the Unemployment Rate in Atwater?
Unemployment Rate in Atwater is 8.6%.