Alden, MN Map & Demographics
Alden Map
Alden Overview
$38,348
PER CAPITA INCOME
$94,375
AVG FAMILY INCOME
$75,000
AVG HOUSEHOLD INCOME
31.8%
WAGE / INCOME GAP [ % ]
68.2¢/ $1
WAGE / INCOME GAP [ $ ]
0.35
INEQUALITY / GINI INDEX
633
TOTAL POPULATION
291
MALE POPULATION
342
FEMALE POPULATION
85.09
MALES / 100 FEMALES
117.53
FEMALES / 100 MALES
47.6
MEDIAN AGE
2.9
AVG FAMILY SIZE
2.5
AVG HOUSEHOLD SIZE
424
LABOR FORCE [ PEOPLE ]
78.1%
PERCENT IN LABOR FORCE
7.8%
UNEMPLOYMENT RATE
Alden Zip Codes
Alden Area Codes
Income in Alden
Income Overview in Alden
Per Capita Income in Alden is $38,348, while median incomes of families and households are $94,375 and $75,000 respectively.
| Characteristic | Number | Measure |
| Per Capita Income | 633 | $38,348 |
| Median Family Income | 187 | $94,375 |
| Mean Family Income | 187 | $105,760 |
| Median Household Income | 258 | $75,000 |
| Mean Household Income | 258 | $92,036 |
| Income Deficit | 187 | $0 |
| Wage / Income Gap (%) | 633 | 31.80% |
| Wage / Income Gap ($) | 633 | 68.20¢ per $1 |
| Gini / Inequality Index | 633 | 0.35 |
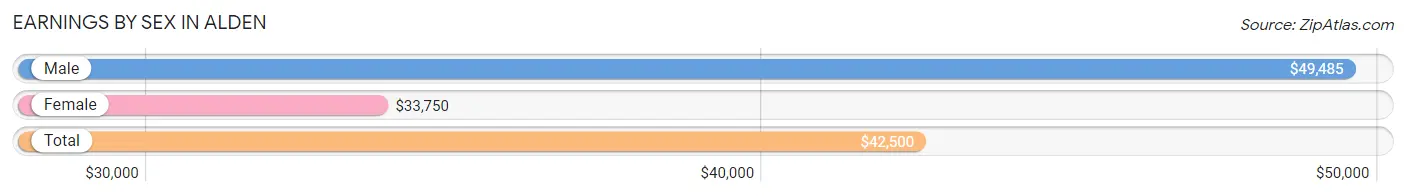
Earnings by Sex in Alden
Average Earnings in Alden are $42,500, $49,485 for men and $33,750 for women, a difference of 31.8%.
| Sex | Number | Average Earnings |
| Male | 205 (47.2%) | $49,485 |
| Female | 229 (52.8%) | $33,750 |
| Total | 434 (100.0%) | $42,500 |
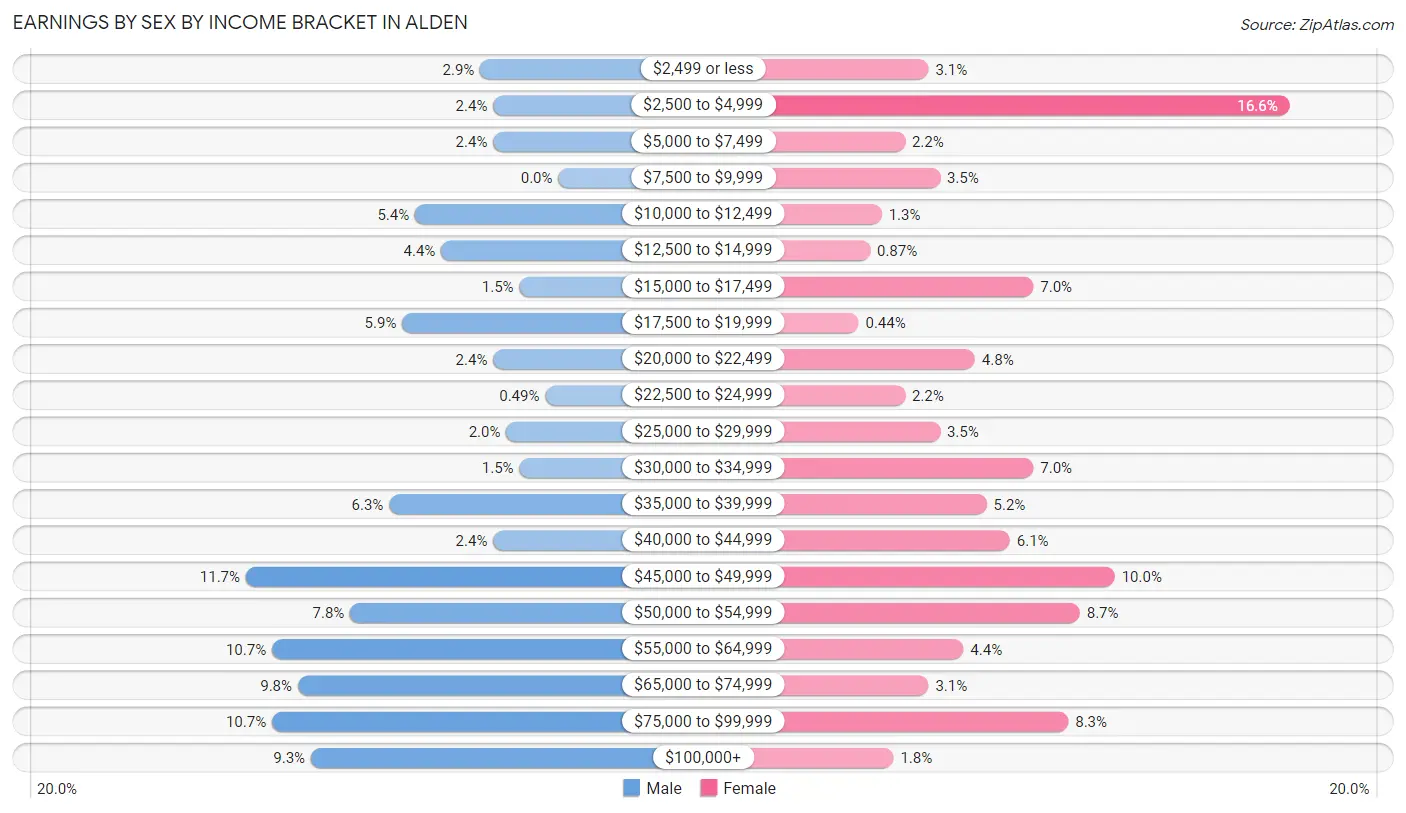
Earnings by Sex by Income Bracket in Alden
The most common earnings brackets in Alden are $45,000 to $49,999 for men (24 | 11.7%) and $2,500 to $4,999 for women (38 | 16.6%).
| Income | Male | Female |
| $2,499 or less | 6 (2.9%) | 7 (3.1%) |
| $2,500 to $4,999 | 5 (2.4%) | 38 (16.6%) |
| $5,000 to $7,499 | 5 (2.4%) | 5 (2.2%) |
| $7,500 to $9,999 | 0 (0.0%) | 8 (3.5%) |
| $10,000 to $12,499 | 11 (5.4%) | 3 (1.3%) |
| $12,500 to $14,999 | 9 (4.4%) | 2 (0.9%) |
| $15,000 to $17,499 | 3 (1.5%) | 16 (7.0%) |
| $17,500 to $19,999 | 12 (5.9%) | 1 (0.4%) |
| $20,000 to $22,499 | 5 (2.4%) | 11 (4.8%) |
| $22,500 to $24,999 | 1 (0.5%) | 5 (2.2%) |
| $25,000 to $29,999 | 4 (1.9%) | 8 (3.5%) |
| $30,000 to $34,999 | 3 (1.5%) | 16 (7.0%) |
| $35,000 to $39,999 | 13 (6.3%) | 12 (5.2%) |
| $40,000 to $44,999 | 5 (2.4%) | 14 (6.1%) |
| $45,000 to $49,999 | 24 (11.7%) | 23 (10.0%) |
| $50,000 to $54,999 | 16 (7.8%) | 20 (8.7%) |
| $55,000 to $64,999 | 22 (10.7%) | 10 (4.4%) |
| $65,000 to $74,999 | 20 (9.8%) | 7 (3.1%) |
| $75,000 to $99,999 | 22 (10.7%) | 19 (8.3%) |
| $100,000+ | 19 (9.3%) | 4 (1.8%) |
| Total | 205 (100.0%) | 229 (100.0%) |
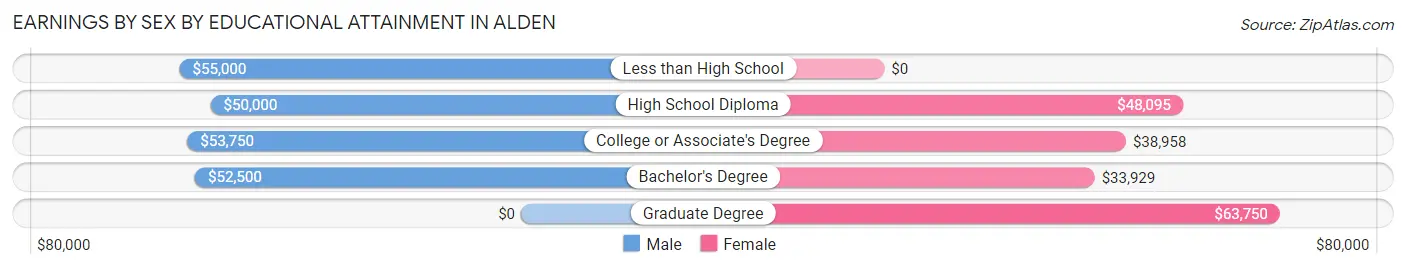
Earnings by Sex by Educational Attainment in Alden
Average earnings in Alden are $52,981 for men and $42,250 for women, a difference of 20.3%. Men with an educational attainment of less than high school enjoy the highest average annual earnings of $55,000, while those with high school diploma education earn the least with $50,000. Women with an educational attainment of graduate degree earn the most with the average annual earnings of $63,750, while those with bachelor's degree education have the smallest earnings of $33,929.
| Educational Attainment | Male Income | Female Income |
| Less than High School | $55,000 | $0 |
| High School Diploma | $50,000 | $48,095 |
| College or Associate's Degree | $53,750 | $38,958 |
| Bachelor's Degree | $52,500 | $33,929 |
| Graduate Degree | - | - |
| Total | $52,981 | $42,250 |
Family Income in Alden
Family Income Brackets in Alden
According to the Alden family income data, there are 48 families falling into the $100,000 to $149,999 income range, which is the most common income bracket and makes up 25.7% of all families.
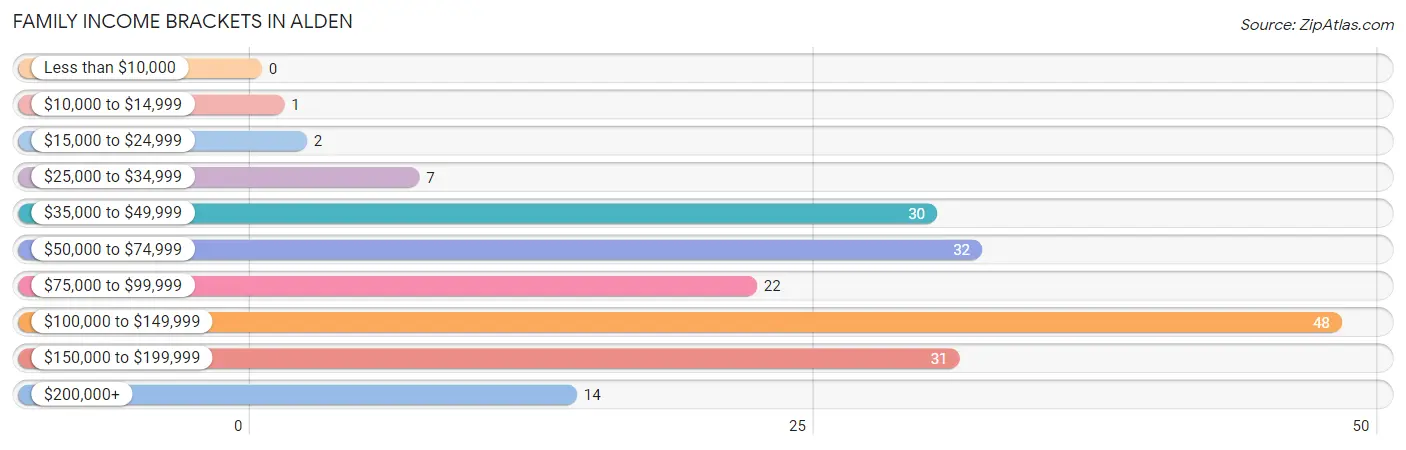
| Income Bracket | # Families | % Families |
| Less than $10,000 | 0 | 0.0% |
| $10,000 to $14,999 | 1 | 0.5% |
| $15,000 to $24,999 | 2 | 1.1% |
| $25,000 to $34,999 | 7 | 3.7% |
| $35,000 to $49,999 | 30 | 16.0% |
| $50,000 to $74,999 | 32 | 17.1% |
| $75,000 to $99,999 | 22 | 11.8% |
| $100,000 to $149,999 | 48 | 25.7% |
| $150,000 to $199,999 | 31 | 16.6% |
| $200,000+ | 14 | 7.5% |
Family Income by Famaliy Size in Alden
4-person families (28 | 15.0%) account for the highest median family income in Alden with $145,769 per family, while 4-person families (28 | 15.0%) have the highest median income of $36,442 per family member.
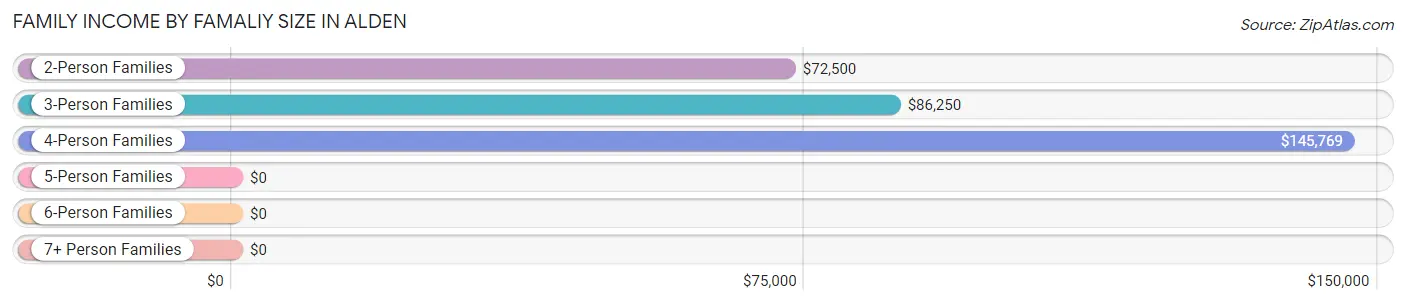
| Income Bracket | # Families | Median Income |
| 2-Person Families | 100 (53.5%) | $72,500 |
| 3-Person Families | 54 (28.9%) | $86,250 |
| 4-Person Families | 28 (15.0%) | $145,769 |
| 5-Person Families | 3 (1.6%) | $0 |
| 6-Person Families | 0 (0.0%) | $0 |
| 7+ Person Families | 2 (1.1%) | $0 |
| Total | 187 (100.0%) | $94,375 |
Family Income by Number of Earners in Alden
The median family income in Alden is $94,375, with families comprising 3+ earners (48) having the highest median family income of $146,154, while families with 1 earner (43) have the lowest median family income of $46,827, accounting for 25.7% and 23.0% of families, respectively.
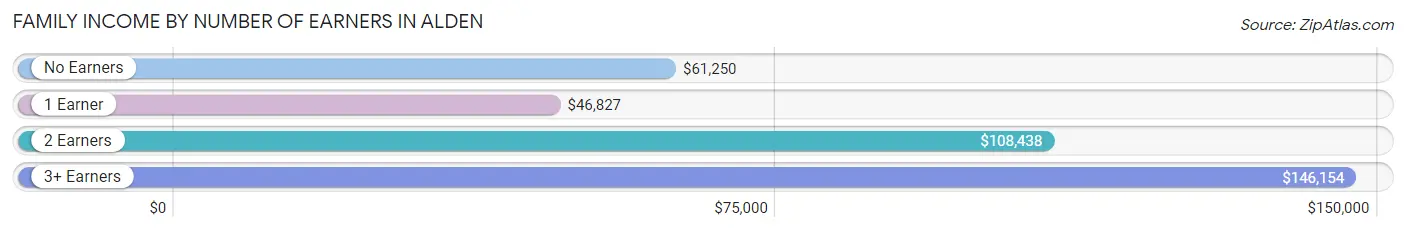
| Number of Earners | # Families | Median Income |
| No Earners | 21 (11.2%) | $61,250 |
| 1 Earner | 43 (23.0%) | $46,827 |
| 2 Earners | 75 (40.1%) | $108,438 |
| 3+ Earners | 48 (25.7%) | $146,154 |
| Total | 187 (100.0%) | $94,375 |
Household Income in Alden
Household Income Brackets in Alden
With 57 households falling in the category, the $50,000 to $74,999 income range is the most frequent in Alden, accounting for 22.1% of all households. In contrast, only 3 households (1.2%) fall into the less than $10,000 income bracket, making it the least populous group.
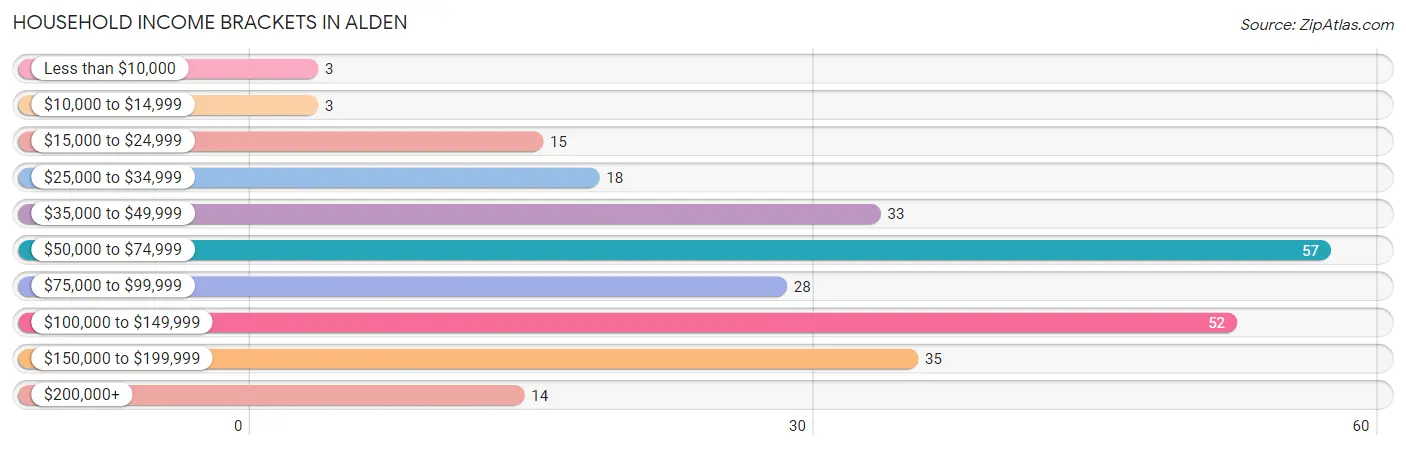
| Income Bracket | # Households | % Households |
| Less than $10,000 | 3 | 1.2% |
| $10,000 to $14,999 | 3 | 1.2% |
| $15,000 to $24,999 | 15 | 5.8% |
| $25,000 to $34,999 | 18 | 7.0% |
| $35,000 to $49,999 | 33 | 12.8% |
| $50,000 to $74,999 | 57 | 22.1% |
| $75,000 to $99,999 | 28 | 10.9% |
| $100,000 to $149,999 | 52 | 20.2% |
| $150,000 to $199,999 | 35 | 13.6% |
| $200,000+ | 14 | 5.4% |
Household Income by Householder Age in Alden
The median household income in Alden is $75,000, with the highest median household income of $105,625 found in the 45 to 64 years age bracket for the primary householder. A total of 131 households (50.8%) fall into this category. Meanwhile, the 15 to 24 years age bracket for the primary householder has the lowest median household income of $0, with 4 households (1.5%) in this group.
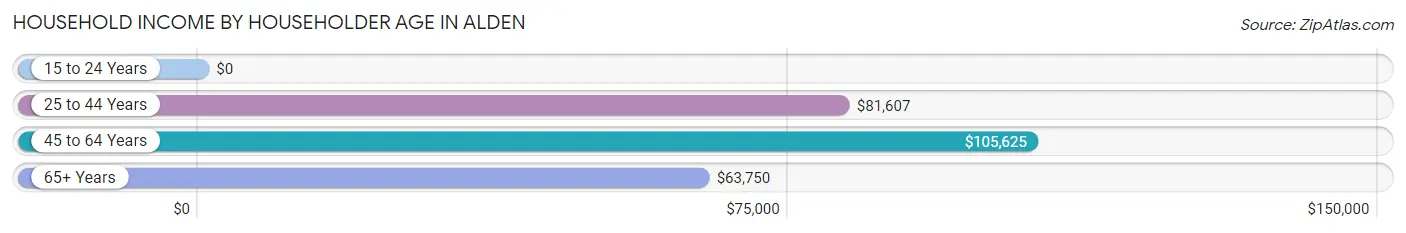
| Income Bracket | # Households | Median Income |
| 15 to 24 Years | 4 (1.5%) | $0 |
| 25 to 44 Years | 43 (16.7%) | $81,607 |
| 45 to 64 Years | 131 (50.8%) | $105,625 |
| 65+ Years | 80 (31.0%) | $63,750 |
| Total | 258 (100.0%) | $75,000 |
Poverty in Alden
Income Below Poverty by Sex and Age in Alden
With 4.5% poverty level for males and 2.9% for females among the residents of Alden, 45 to 54 year old males and 18 to 24 year old females are the most vulnerable to poverty, with 9 males (16.4%) and 4 females (10.5%) in their respective age groups living below the poverty level.
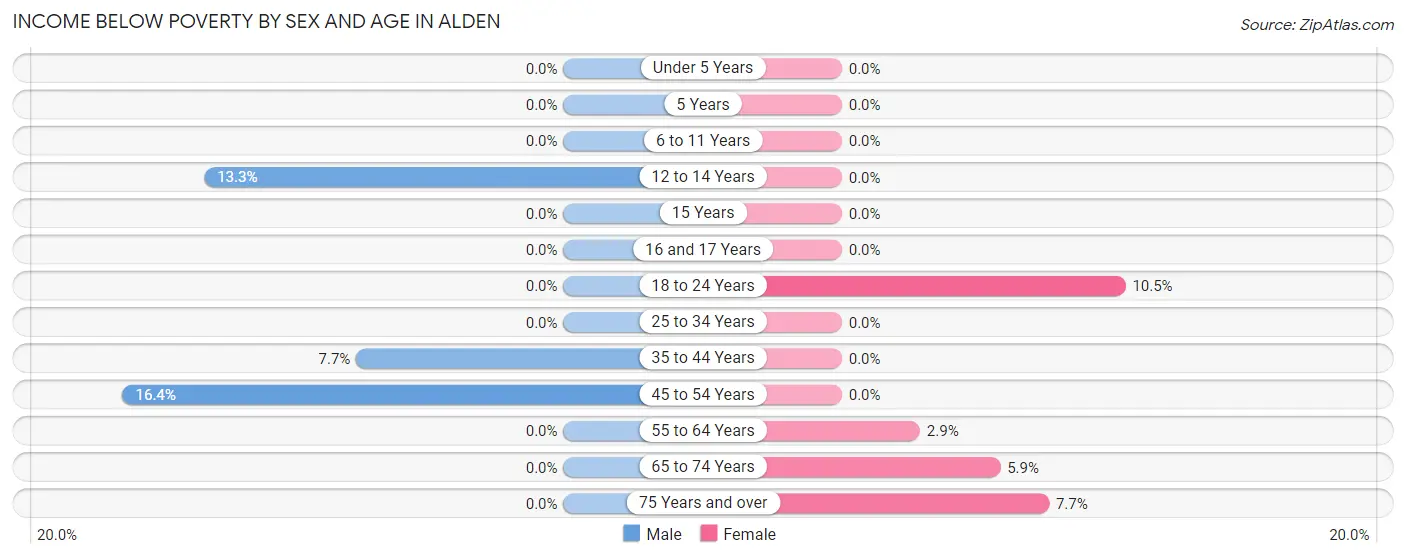
| Age Bracket | Male | Female |
| Under 5 Years | 0 (0.0%) | 0 (0.0%) |
| 5 Years | 0 (0.0%) | 0 (0.0%) |
| 6 to 11 Years | 0 (0.0%) | 0 (0.0%) |
| 12 to 14 Years | 2 (13.3%) | 0 (0.0%) |
| 15 Years | 0 (0.0%) | 0 (0.0%) |
| 16 and 17 Years | 0 (0.0%) | 0 (0.0%) |
| 18 to 24 Years | 0 (0.0%) | 4 (10.5%) |
| 25 to 34 Years | 0 (0.0%) | 0 (0.0%) |
| 35 to 44 Years | 2 (7.7%) | 0 (0.0%) |
| 45 to 54 Years | 9 (16.4%) | 0 (0.0%) |
| 55 to 64 Years | 0 (0.0%) | 2 (2.9%) |
| 65 to 74 Years | 0 (0.0%) | 3 (5.9%) |
| 75 Years and over | 0 (0.0%) | 1 (7.7%) |
| Total | 13 (4.5%) | 10 (2.9%) |
Income Above Poverty by Sex and Age in Alden
According to the poverty statistics in Alden, males aged under 5 years and females aged under 5 years are the age groups that are most secure financially, with 100.0% of males and 100.0% of females in these age groups living above the poverty line.
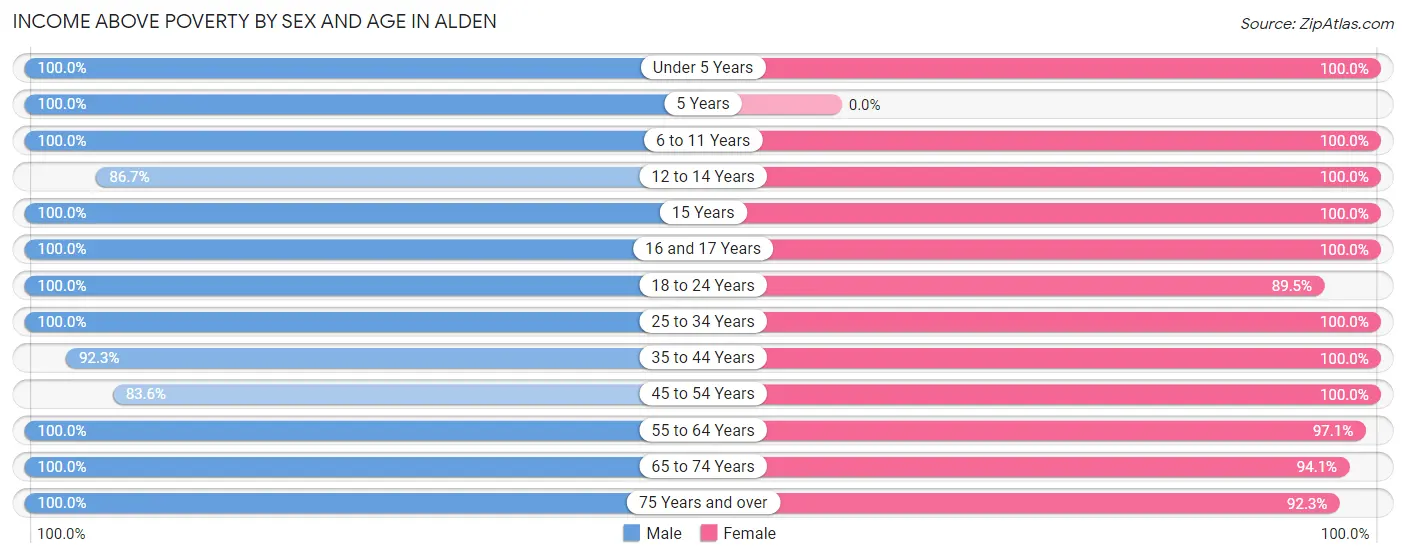
| Age Bracket | Male | Female |
| Under 5 Years | 6 (100.0%) | 8 (100.0%) |
| 5 Years | 3 (100.0%) | 0 (0.0%) |
| 6 to 11 Years | 2 (100.0%) | 23 (100.0%) |
| 12 to 14 Years | 13 (86.7%) | 16 (100.0%) |
| 15 Years | 12 (100.0%) | 5 (100.0%) |
| 16 and 17 Years | 5 (100.0%) | 6 (100.0%) |
| 18 to 24 Years | 25 (100.0%) | 34 (89.5%) |
| 25 to 34 Years | 21 (100.0%) | 24 (100.0%) |
| 35 to 44 Years | 24 (92.3%) | 51 (100.0%) |
| 45 to 54 Years | 46 (83.6%) | 38 (100.0%) |
| 55 to 64 Years | 55 (100.0%) | 67 (97.1%) |
| 65 to 74 Years | 42 (100.0%) | 48 (94.1%) |
| 75 Years and over | 24 (100.0%) | 12 (92.3%) |
| Total | 278 (95.5%) | 332 (97.1%) |
Income Below Poverty Among Married-Couple Families in Alden
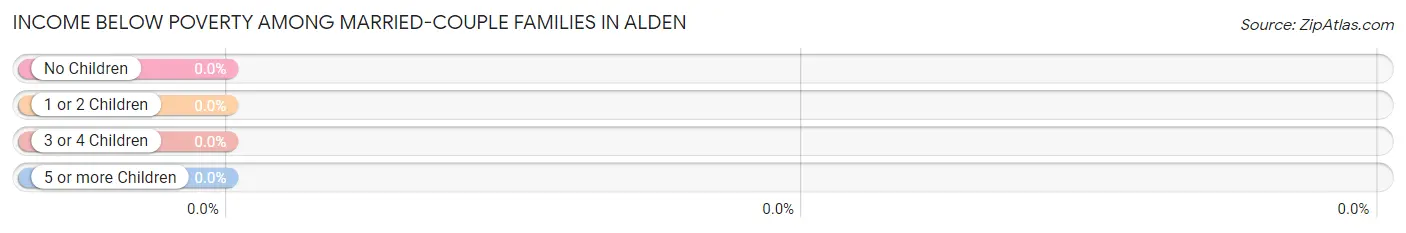
| Children | Above Poverty | Below Poverty |
| No Children | 114 (100.0%) | 0 (0.0%) |
| 1 or 2 Children | 24 (100.0%) | 0 (0.0%) |
| 3 or 4 Children | 3 (100.0%) | 0 (0.0%) |
| 5 or more Children | 0 (0.0%) | 0 (0.0%) |
| Total | 141 (100.0%) | 0 (0.0%) |
Income Below Poverty Among Single-Parent Households in Alden
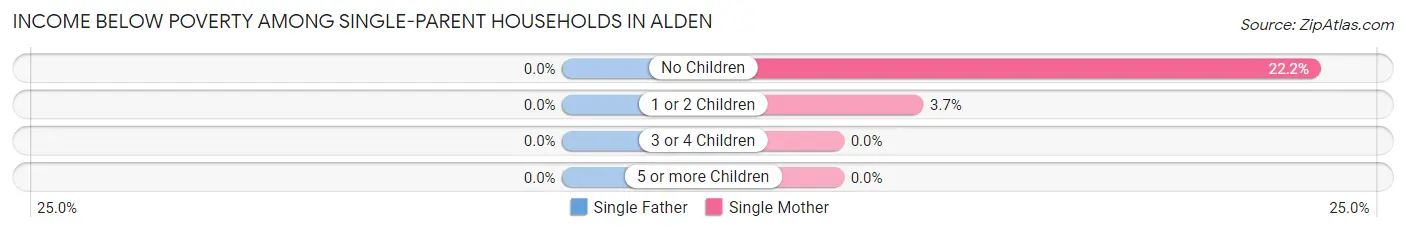
| Children | Single Father | Single Mother |
| No Children | 0 (0.0%) | 2 (22.2%) |
| 1 or 2 Children | 0 (0.0%) | 1 (3.7%) |
| 3 or 4 Children | 0 (0.0%) | 0 (0.0%) |
| 5 or more Children | 0 (0.0%) | 0 (0.0%) |
| Total | 0 (0.0%) | 3 (8.3%) |
Income Below Poverty Among Married-Couple vs Single-Parent Households in Alden
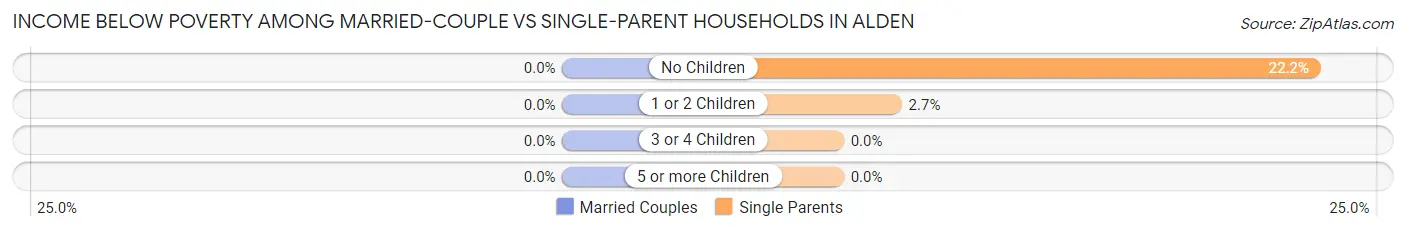
| Children | Married-Couple Families | Single-Parent Households |
| No Children | 0 (0.0%) | 2 (22.2%) |
| 1 or 2 Children | 0 (0.0%) | 1 (2.7%) |
| 3 or 4 Children | 0 (0.0%) | 0 (0.0%) |
| 5 or more Children | 0 (0.0%) | 0 (0.0%) |
| Total | 0 (0.0%) | 3 (6.5%) |
Race in Alden
The most populous races in Alden are White / Caucasian (607 | 95.9%), Two or more Races (24 | 3.8%), and Hispanic or Latino (23 | 3.6%).
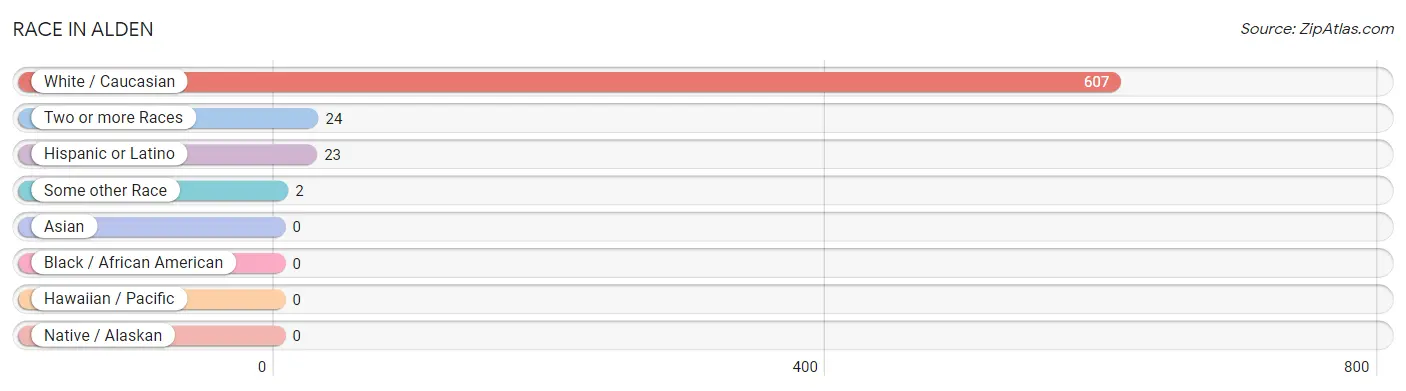
| Race | # Population | % Population |
| Asian | 0 | 0.0% |
| Black / African American | 0 | 0.0% |
| Hawaiian / Pacific | 0 | 0.0% |
| Hispanic or Latino | 23 | 3.6% |
| Native / Alaskan | 0 | 0.0% |
| White / Caucasian | 607 | 95.9% |
| Two or more Races | 24 | 3.8% |
| Some other Race | 2 | 0.3% |
| Total | 633 | 100.0% |
Ancestry in Alden
The most populous ancestries reported in Alden are German (308 | 48.7%), Norwegian (141 | 22.3%), Irish (116 | 18.3%), Swedish (55 | 8.7%), and English (47 | 7.4%), together accounting for 105.4% of all Alden residents.
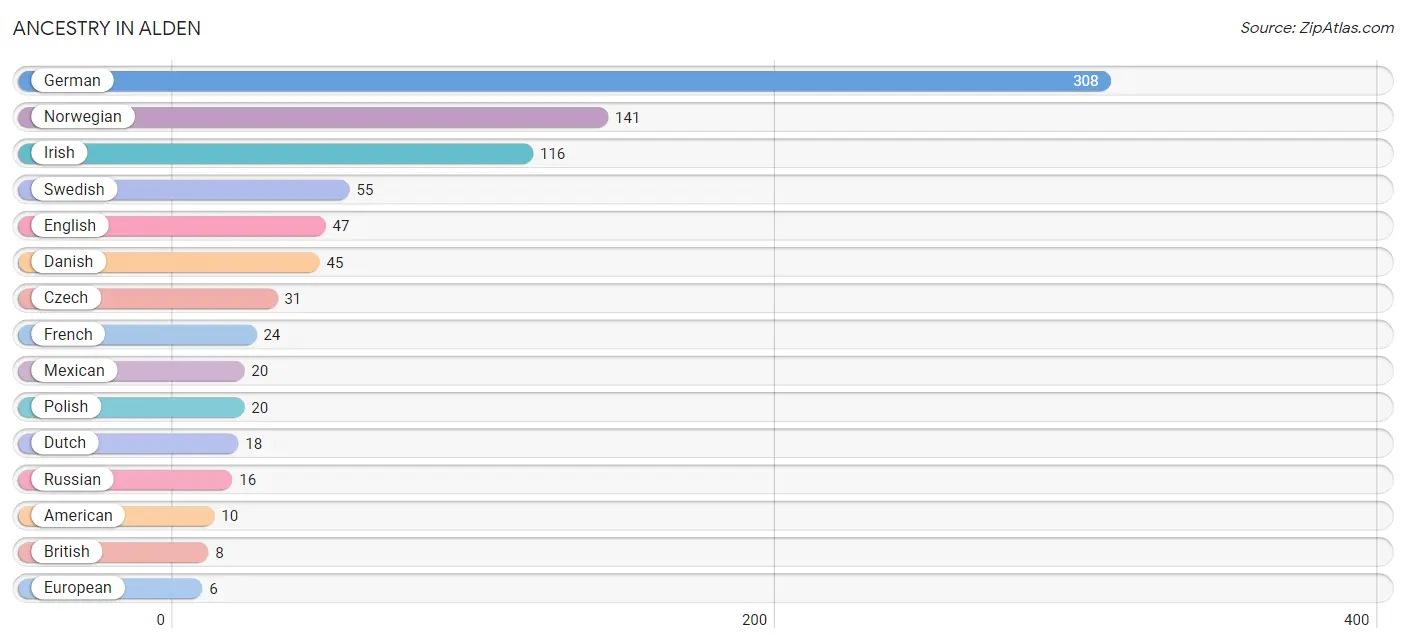
| Ancestry | # Population | % Population |
| American | 10 | 1.6% |
| Austrian | 2 | 0.3% |
| Belgian | 1 | 0.2% |
| British | 8 | 1.3% |
| Czech | 31 | 4.9% |
| Danish | 45 | 7.1% |
| Dutch | 18 | 2.8% |
| English | 47 | 7.4% |
| European | 6 | 0.9% |
| Finnish | 4 | 0.6% |
| French | 24 | 3.8% |
| French Canadian | 2 | 0.3% |
| German | 308 | 48.7% |
| Irish | 116 | 18.3% |
| Mexican | 20 | 3.2% |
| Northern European | 4 | 0.6% |
| Norwegian | 141 | 22.3% |
| Polish | 20 | 3.2% |
| Russian | 16 | 2.5% |
| Scandinavian | 4 | 0.6% |
| Scotch-Irish | 2 | 0.3% |
| Scottish | 3 | 0.5% |
| Swedish | 55 | 8.7% |
| Welsh | 4 | 0.6% | View All 24 Rows |
Immigrants in Alden

| Immigration Origin | # Population | % Population | View All 0 Rows |
Sex and Age in Alden
Sex and Age in Alden
The most populous age groups in Alden are 50 to 54 Years (29 | 10.0%) for men and 40 to 44 Years (47 | 13.7%) for women.
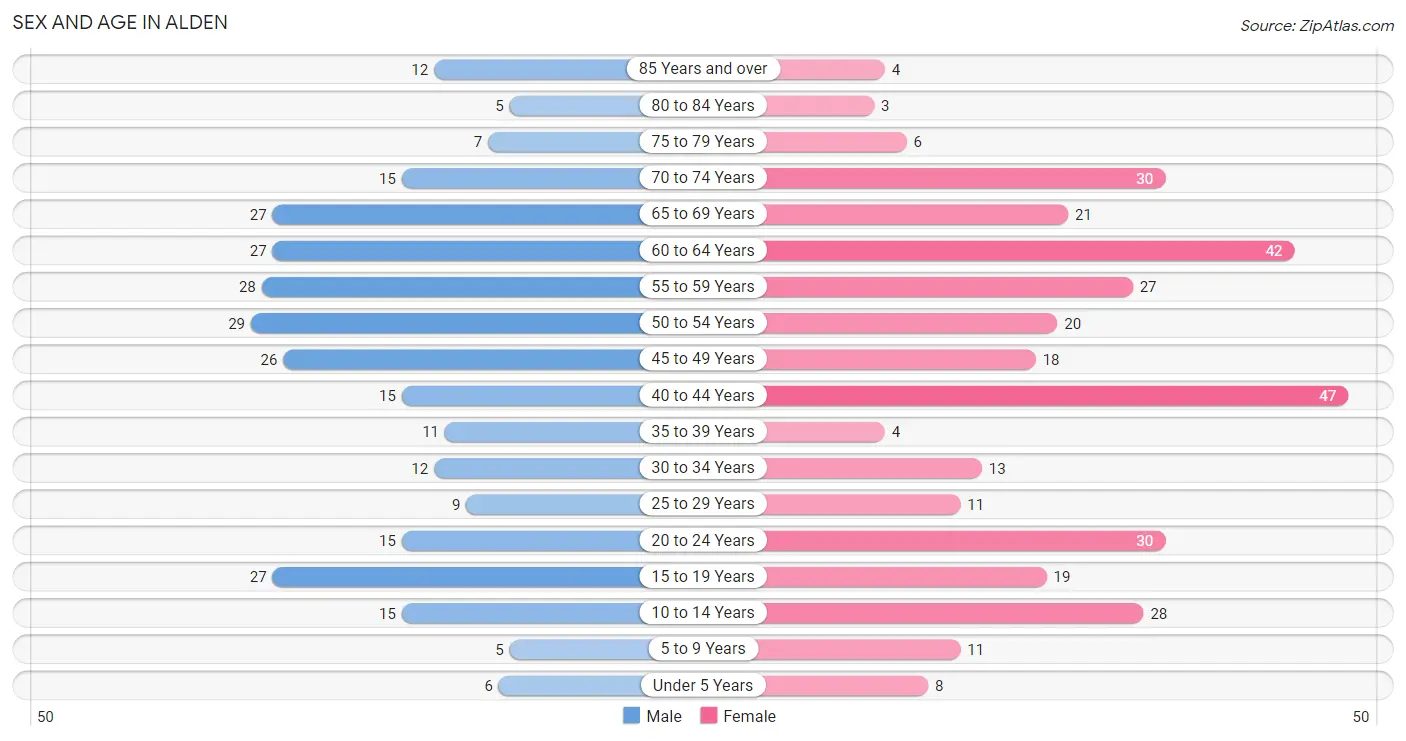
| Age Bracket | Male | Female |
| Under 5 Years | 6 (2.1%) | 8 (2.3%) |
| 5 to 9 Years | 5 (1.7%) | 11 (3.2%) |
| 10 to 14 Years | 15 (5.1%) | 28 (8.2%) |
| 15 to 19 Years | 27 (9.3%) | 19 (5.6%) |
| 20 to 24 Years | 15 (5.1%) | 30 (8.8%) |
| 25 to 29 Years | 9 (3.1%) | 11 (3.2%) |
| 30 to 34 Years | 12 (4.1%) | 13 (3.8%) |
| 35 to 39 Years | 11 (3.8%) | 4 (1.2%) |
| 40 to 44 Years | 15 (5.1%) | 47 (13.7%) |
| 45 to 49 Years | 26 (8.9%) | 18 (5.3%) |
| 50 to 54 Years | 29 (10.0%) | 20 (5.9%) |
| 55 to 59 Years | 28 (9.6%) | 27 (7.9%) |
| 60 to 64 Years | 27 (9.3%) | 42 (12.3%) |
| 65 to 69 Years | 27 (9.3%) | 21 (6.1%) |
| 70 to 74 Years | 15 (5.1%) | 30 (8.8%) |
| 75 to 79 Years | 7 (2.4%) | 6 (1.8%) |
| 80 to 84 Years | 5 (1.7%) | 3 (0.9%) |
| 85 Years and over | 12 (4.1%) | 4 (1.2%) |
| Total | 291 (100.0%) | 342 (100.0%) |
Families and Households in Alden
Median Family Size in Alden
The median family size in Alden is 2.93 persons per family, with single female/mother families (36 | 19.3%) accounting for the largest median family size of 3.94 persons per family. On the other hand, single male/father families (10 | 5.3%) represent the smallest median family size with 2.60 persons per family.
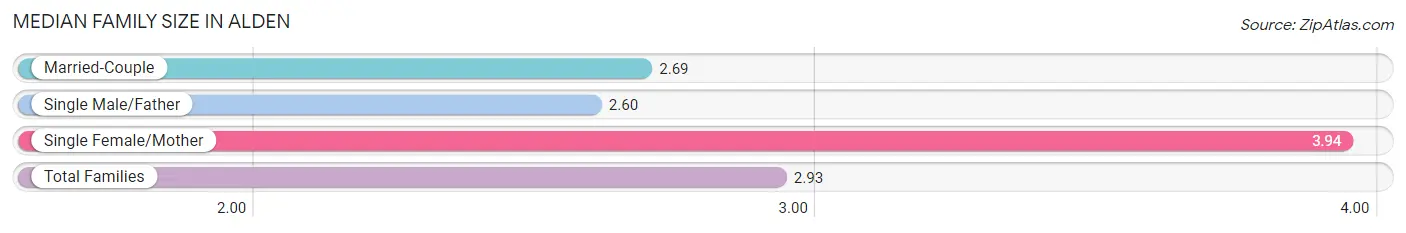
| Family Type | # Families | Family Size |
| Married-Couple | 141 (75.4%) | 2.69 |
| Single Male/Father | 10 (5.3%) | 2.60 |
| Single Female/Mother | 36 (19.3%) | 3.94 |
| Total Families | 187 (100.0%) | 2.93 |
Median Household Size in Alden
The median household size in Alden is 2.45 persons per household, with single female/mother households (36 | 14.0%) accounting for the largest median household size of 4.06 persons per household. non-family households (71 | 27.5%) represent the smallest median household size with 1.15 persons per household.
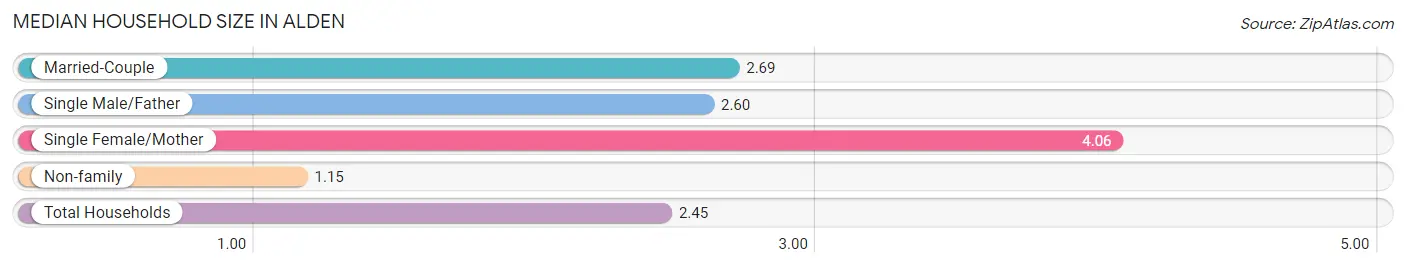
| Household Type | # Households | Household Size |
| Married-Couple | 141 (54.6%) | 2.69 |
| Single Male/Father | 10 (3.9%) | 2.60 |
| Single Female/Mother | 36 (14.0%) | 4.06 |
| Non-family | 71 (27.5%) | 1.15 |
| Total Households | 258 (100.0%) | 2.45 |
Household Size by Marriage Status in Alden
Out of a total of 258 households in Alden, 187 (72.5%) are family households, while 71 (27.5%) are nonfamily households. The most numerous type of family households are 2-person households, comprising 99, and the most common type of nonfamily households are 1-person households, comprising 57.
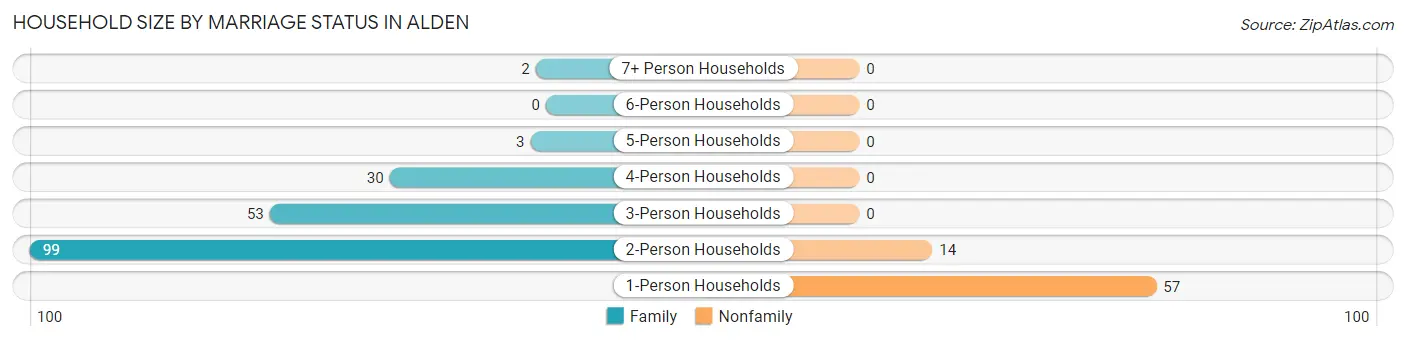
| Household Size | Family Households | Nonfamily Households |
| 1-Person Households | - | 57 (22.1%) |
| 2-Person Households | 99 (38.4%) | 14 (5.4%) |
| 3-Person Households | 53 (20.5%) | 0 (0.0%) |
| 4-Person Households | 30 (11.6%) | 0 (0.0%) |
| 5-Person Households | 3 (1.2%) | 0 (0.0%) |
| 6-Person Households | 0 (0.0%) | 0 (0.0%) |
| 7+ Person Households | 2 (0.8%) | 0 (0.0%) |
| Total | 187 (72.5%) | 71 (27.5%) |
Female Fertility in Alden
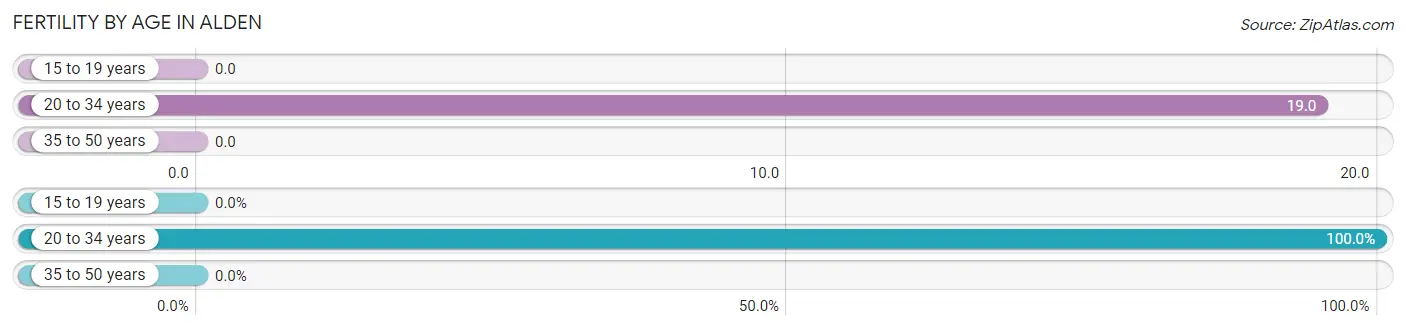
Fertility by Age in Alden
Average fertility rate in Alden is 7.0 births per 1,000 women. Women in the age bracket of 20 to 34 years have the highest fertility rate with 19.0 births per 1,000 women. Women in the age bracket of 20 to 34 years acount for 100.0% of all women with births.
| Age Bracket | Women with Births | Births / 1,000 Women |
| 15 to 19 years | 0 (0.0%) | 0.0 |
| 20 to 34 years | 1 (100.0%) | 19.0 |
| 35 to 50 years | 0 (0.0%) | 0.0 |
| Total | 1 (100.0%) | 7.0 |
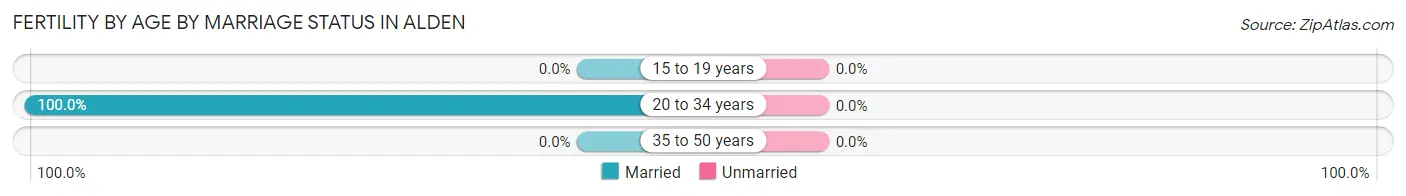
Fertility by Age by Marriage Status in Alden
| Age Bracket | Married | Unmarried |
| 15 to 19 years | 0 (0.0%) | 0 (0.0%) |
| 20 to 34 years | 1 (100.0%) | 0 (0.0%) |
| 35 to 50 years | 0 (0.0%) | 0 (0.0%) |
| Total | 1 (100.0%) | 0 (0.0%) |
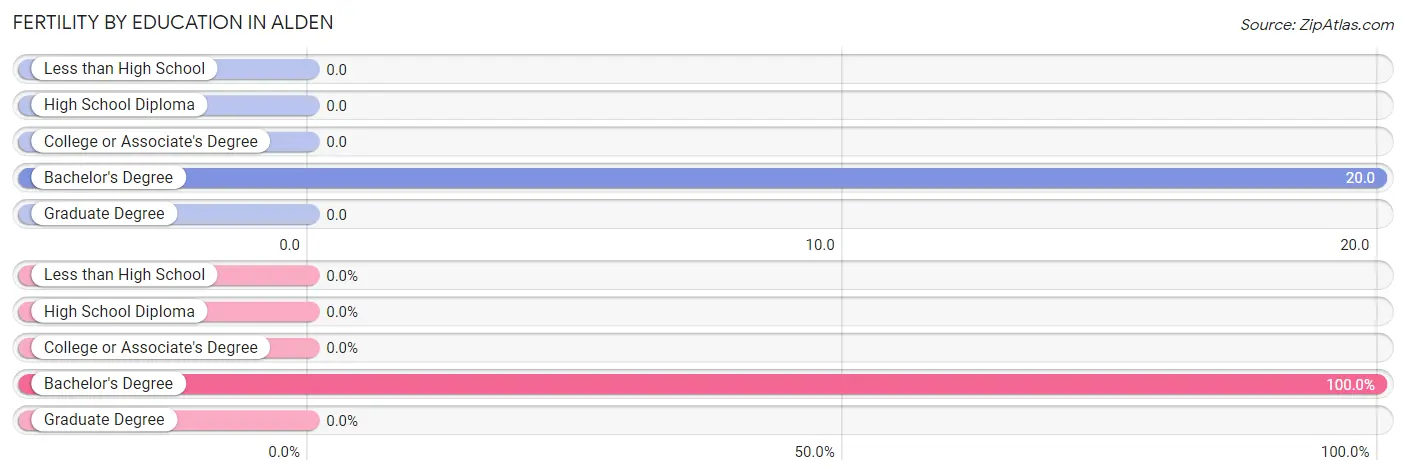
Fertility by Education in Alden
| Educational Attainment | Women with Births | Births / 1,000 Women |
| Less than High School | 0 (0.0%) | 0.0 |
| High School Diploma | 0 (0.0%) | 0.0 |
| College or Associate's Degree | 0 (0.0%) | 0.0 |
| Bachelor's Degree | 1 (100.0%) | 20.0 |
| Graduate Degree | 0 (0.0%) | 0.0 |
| Total | 1 (100.0%) | 7.0 |
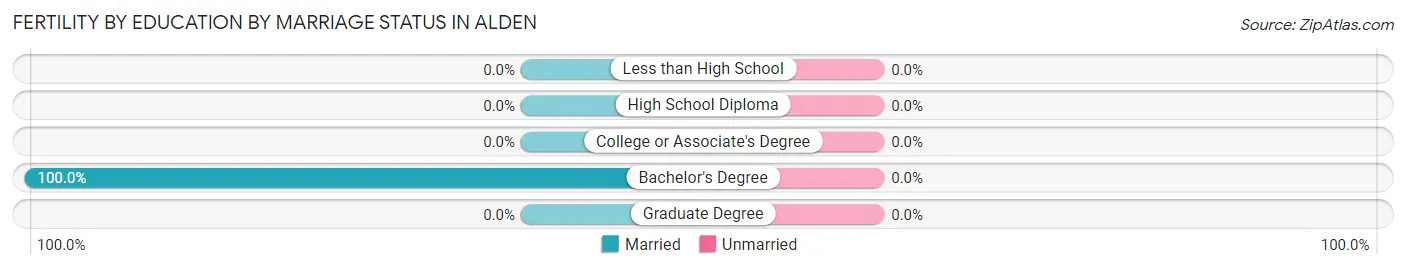
Fertility by Education by Marriage Status in Alden
| Educational Attainment | Married | Unmarried |
| Less than High School | 0 (0.0%) | 0 (0.0%) |
| High School Diploma | 0 (0.0%) | 0 (0.0%) |
| College or Associate's Degree | 0 (0.0%) | 0 (0.0%) |
| Bachelor's Degree | 1 (100.0%) | 0 (0.0%) |
| Graduate Degree | 0 (0.0%) | 0 (0.0%) |
| Total | 1 (100.0%) | 0 (0.0%) |
Employment Characteristics in Alden
Employment by Class of Employer in Alden
Among the 381 employed individuals in Alden, private company employees (267 | 70.1%), not-for-profit organizations (49 | 12.9%), and local government employees (32 | 8.4%) make up the most common classes of employment.
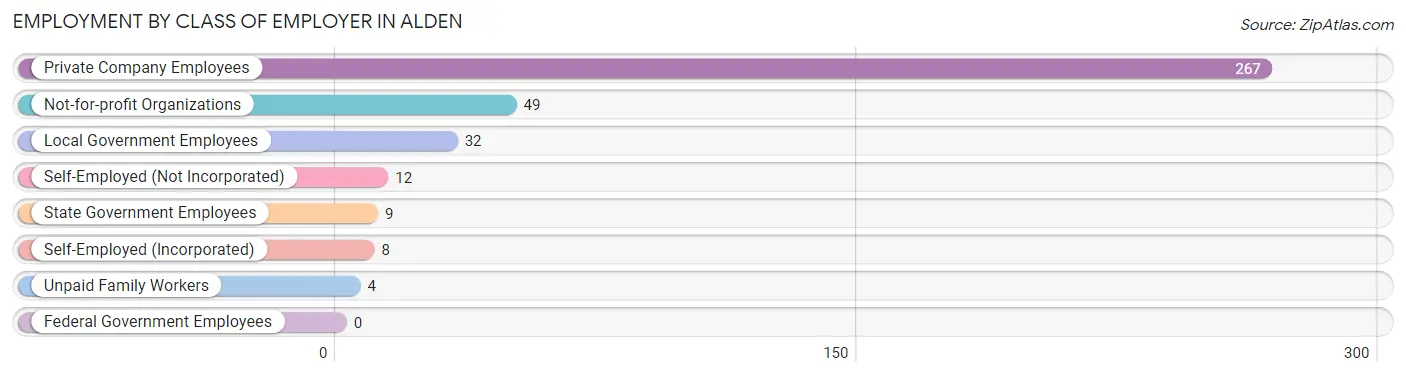
| Employer Class | # Employees | % Employees |
| Private Company Employees | 267 | 70.1% |
| Self-Employed (Incorporated) | 8 | 2.1% |
| Self-Employed (Not Incorporated) | 12 | 3.2% |
| Not-for-profit Organizations | 49 | 12.9% |
| Local Government Employees | 32 | 8.4% |
| State Government Employees | 9 | 2.4% |
| Federal Government Employees | 0 | 0.0% |
| Unpaid Family Workers | 4 | 1.1% |
| Total | 381 | 100.0% |
Employment Status by Age in Alden
According to the labor force statistics for Alden, out of the total population over 16 years of age (543), 78.1% or 424 individuals are in the labor force, with 7.8% or 33 of them unemployed. The age group with the highest labor force participation rate is 20 to 24 years, with 100.0% or 45 individuals in the labor force. Within the labor force, the 60 to 64 years age range has the highest percentage of unemployed individuals, with 37.5% or 21 of them being unemployed.
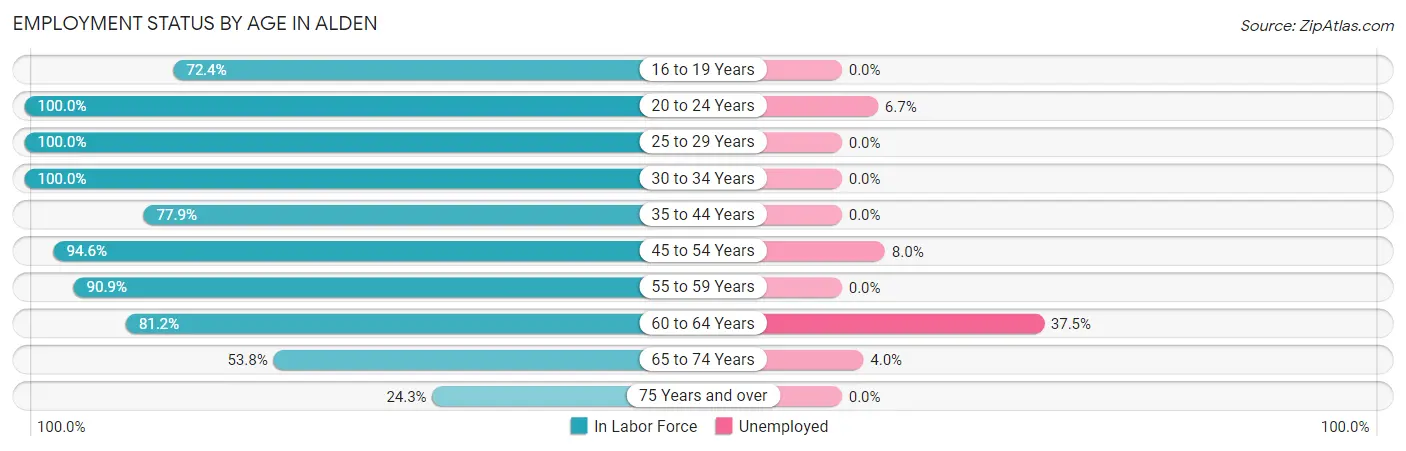
| Age Bracket | In Labor Force | Unemployed |
| 16 to 19 Years | 21 (72.4%) | 0 (0.0%) |
| 20 to 24 Years | 45 (100.0%) | 3 (6.7%) |
| 25 to 29 Years | 20 (100.0%) | 0 (0.0%) |
| 30 to 34 Years | 25 (100.0%) | 0 (0.0%) |
| 35 to 44 Years | 60 (77.9%) | 0 (0.0%) |
| 45 to 54 Years | 88 (94.6%) | 7 (8.0%) |
| 55 to 59 Years | 50 (90.9%) | 0 (0.0%) |
| 60 to 64 Years | 56 (81.2%) | 21 (37.5%) |
| 65 to 74 Years | 50 (53.8%) | 2 (4.0%) |
| 75 Years and over | 9 (24.3%) | 0 (0.0%) |
| Total | 424 (78.1%) | 33 (7.8%) |
Employment Status by Educational Attainment in Alden
According to labor force statistics for Alden, 88.2% of individuals (299) out of the total population between 25 and 64 years of age (339) are in the labor force, with 9.4% or 28 of them being unemployed. The group with the highest labor force participation rate are those with the educational attainment of college / associate degree, with 93.9% or 124 individuals in the labor force. Within the labor force, individuals with high school diploma education have the highest percentage of unemployment, with 12.3% or 13 of them being unemployed.
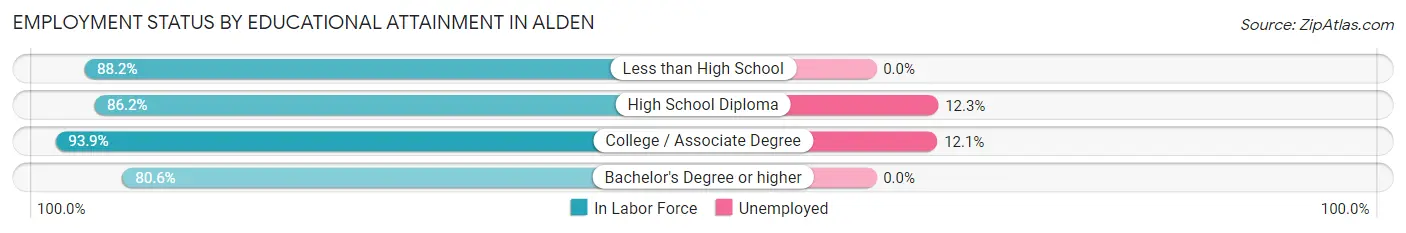
| Educational Attainment | In Labor Force | Unemployed |
| Less than High School | 15 (88.2%) | 0 (0.0%) |
| High School Diploma | 106 (86.2%) | 15 (12.3%) |
| College / Associate Degree | 124 (93.9%) | 16 (12.1%) |
| Bachelor's Degree or higher | 54 (80.6%) | 0 (0.0%) |
| Total | 299 (88.2%) | 32 (9.4%) |
Employment Occupations by Sex in Alden
Management, Business, Science and Arts Occupations
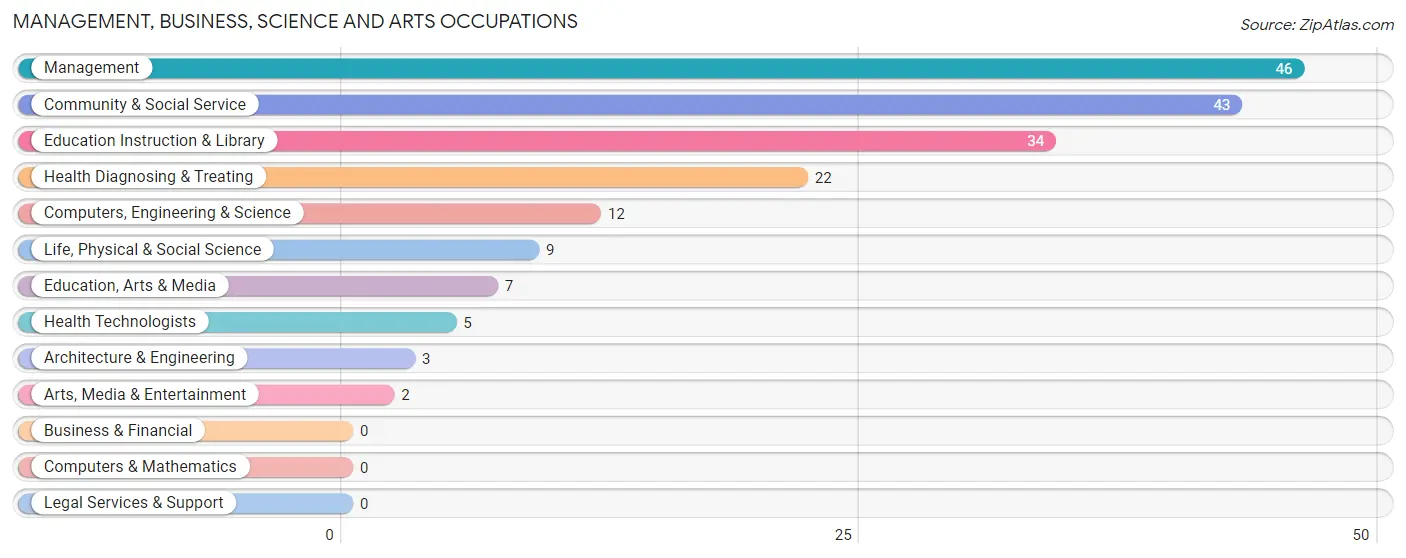
The most common Management, Business, Science and Arts occupations in Alden are Management (46 | 11.8%), Community & Social Service (43 | 11.0%), Education Instruction & Library (34 | 8.7%), Health Diagnosing & Treating (22 | 5.6%), and Computers, Engineering & Science (12 | 3.1%).
Management, Business, Science and Arts Occupations by Sex
Within the Management, Business, Science and Arts occupations in Alden, the most male-oriented occupations are Computers, Engineering & Science (100.0%), Architecture & Engineering (100.0%), and Life, Physical & Social Science (100.0%), while the most female-oriented occupations are Education, Arts & Media (100.0%), Arts, Media & Entertainment (100.0%), and Health Diagnosing & Treating (95.5%).
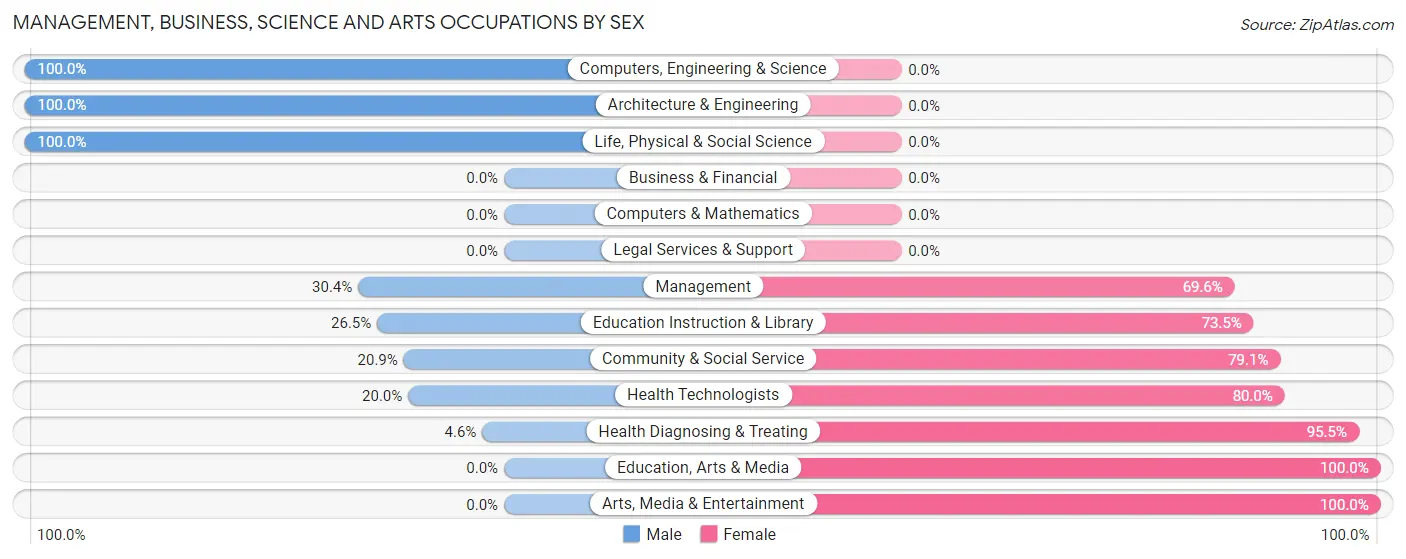
| Occupation | Male | Female |
| Management | 14 (30.4%) | 32 (69.6%) |
| Business & Financial | 0 (0.0%) | 0 (0.0%) |
| Computers, Engineering & Science | 12 (100.0%) | 0 (0.0%) |
| Computers & Mathematics | 0 (0.0%) | 0 (0.0%) |
| Architecture & Engineering | 3 (100.0%) | 0 (0.0%) |
| Life, Physical & Social Science | 9 (100.0%) | 0 (0.0%) |
| Community & Social Service | 9 (20.9%) | 34 (79.1%) |
| Education, Arts & Media | 0 (0.0%) | 7 (100.0%) |
| Legal Services & Support | 0 (0.0%) | 0 (0.0%) |
| Education Instruction & Library | 9 (26.5%) | 25 (73.5%) |
| Arts, Media & Entertainment | 0 (0.0%) | 2 (100.0%) |
| Health Diagnosing & Treating | 1 (4.5%) | 21 (95.5%) |
| Health Technologists | 1 (20.0%) | 4 (80.0%) |
| Total (Category) | 36 (29.3%) | 87 (70.7%) |
| Total (Overall) | 192 (49.1%) | 199 (50.9%) |
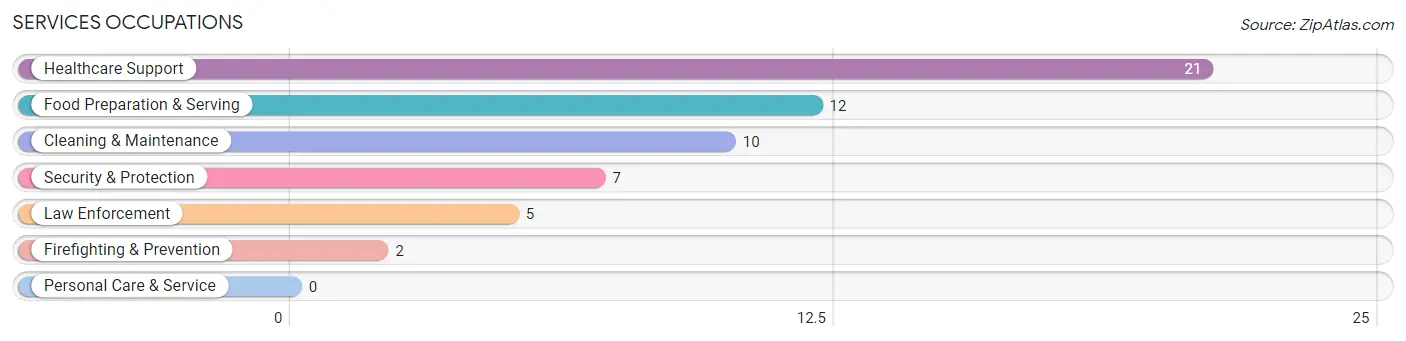
Services Occupations
The most common Services occupations in Alden are Healthcare Support (21 | 5.4%), Food Preparation & Serving (12 | 3.1%), Cleaning & Maintenance (10 | 2.6%), Security & Protection (7 | 1.8%), and Law Enforcement (5 | 1.3%).
Services Occupations by Sex
Within the Services occupations in Alden, the most male-oriented occupations are Security & Protection (100.0%), Firefighting & Prevention (100.0%), and Law Enforcement (100.0%), while the most female-oriented occupations are Food Preparation & Serving (100.0%), and Healthcare Support (80.9%).
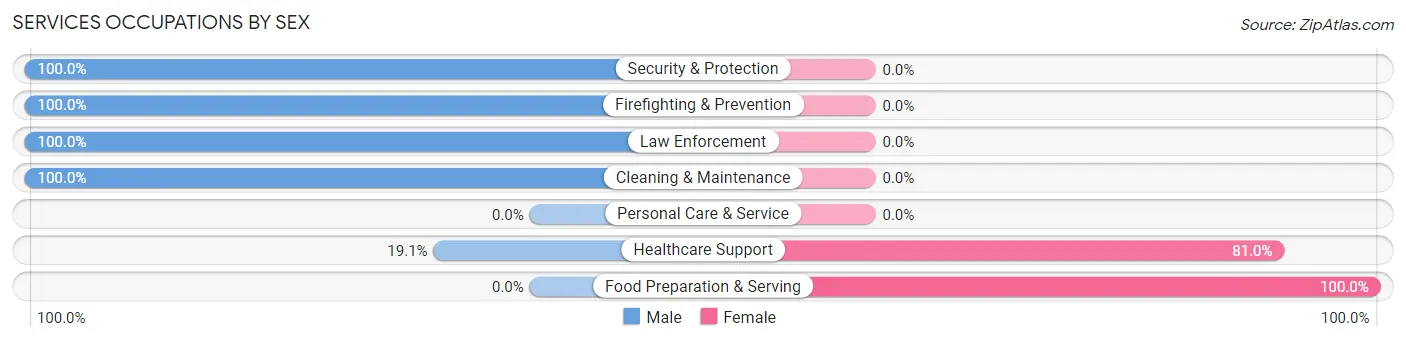
| Occupation | Male | Female |
| Healthcare Support | 4 (19.1%) | 17 (80.9%) |
| Security & Protection | 7 (100.0%) | 0 (0.0%) |
| Firefighting & Prevention | 2 (100.0%) | 0 (0.0%) |
| Law Enforcement | 5 (100.0%) | 0 (0.0%) |
| Food Preparation & Serving | 0 (0.0%) | 12 (100.0%) |
| Cleaning & Maintenance | 10 (100.0%) | 0 (0.0%) |
| Personal Care & Service | 0 (0.0%) | 0 (0.0%) |
| Total (Category) | 21 (42.0%) | 29 (58.0%) |
| Total (Overall) | 192 (49.1%) | 199 (50.9%) |
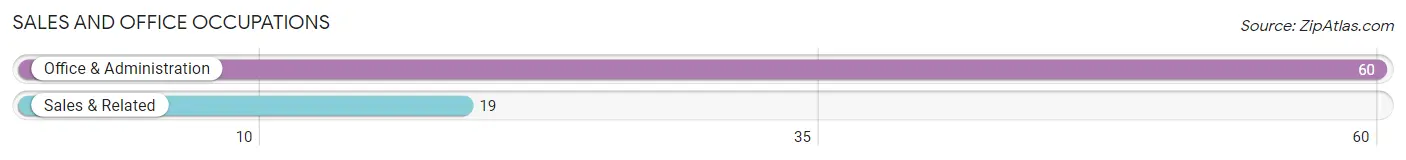
Sales and Office Occupations
The most common Sales and Office occupations in Alden are Office & Administration (60 | 15.3%), and Sales & Related (19 | 4.9%).
Sales and Office Occupations by Sex

| Occupation | Male | Female |
| Sales & Related | 8 (42.1%) | 11 (57.9%) |
| Office & Administration | 3 (5.0%) | 57 (95.0%) |
| Total (Category) | 11 (13.9%) | 68 (86.1%) |
| Total (Overall) | 192 (49.1%) | 199 (50.9%) |
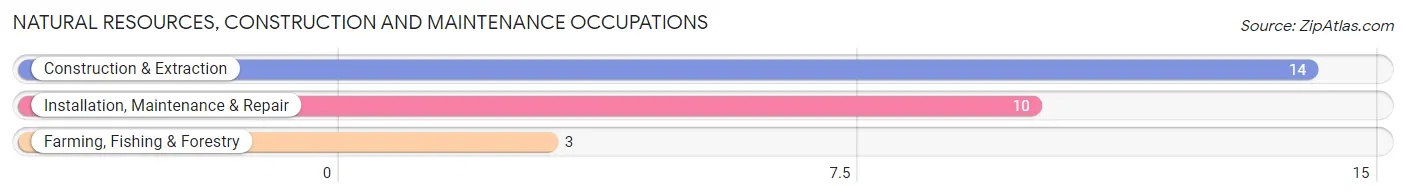
Natural Resources, Construction and Maintenance Occupations
The most common Natural Resources, Construction and Maintenance occupations in Alden are Construction & Extraction (14 | 3.6%), Installation, Maintenance & Repair (10 | 2.6%), and Farming, Fishing & Forestry (3 | 0.8%).
Natural Resources, Construction and Maintenance Occupations by Sex
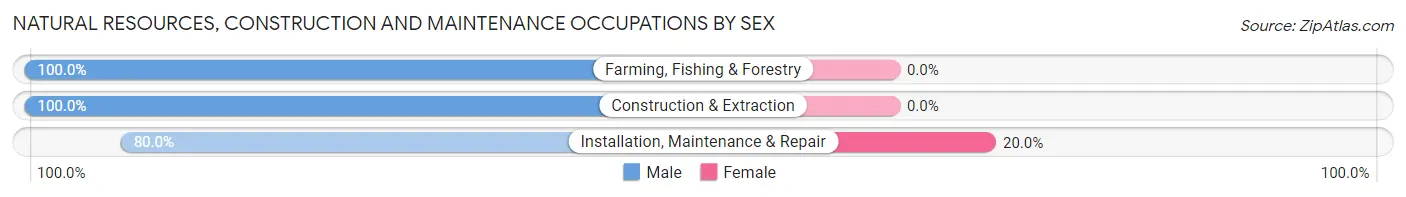
| Occupation | Male | Female |
| Farming, Fishing & Forestry | 3 (100.0%) | 0 (0.0%) |
| Construction & Extraction | 14 (100.0%) | 0 (0.0%) |
| Installation, Maintenance & Repair | 8 (80.0%) | 2 (20.0%) |
| Total (Category) | 25 (92.6%) | 2 (7.4%) |
| Total (Overall) | 192 (49.1%) | 199 (50.9%) |
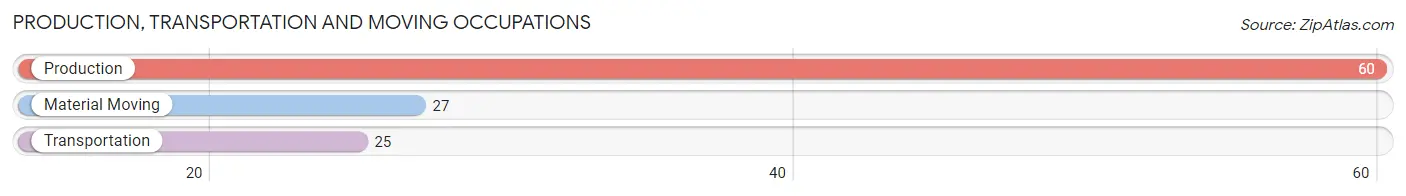
Production, Transportation and Moving Occupations
The most common Production, Transportation and Moving occupations in Alden are Production (60 | 15.3%), Material Moving (27 | 6.9%), and Transportation (25 | 6.4%).
Production, Transportation and Moving Occupations by Sex
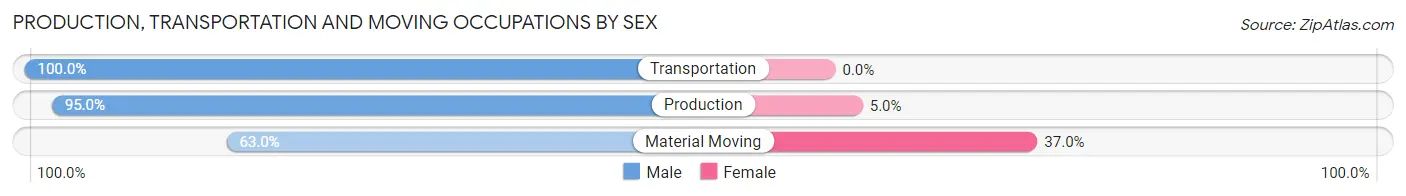
| Occupation | Male | Female |
| Production | 57 (95.0%) | 3 (5.0%) |
| Transportation | 25 (100.0%) | 0 (0.0%) |
| Material Moving | 17 (63.0%) | 10 (37.0%) |
| Total (Category) | 99 (88.4%) | 13 (11.6%) |
| Total (Overall) | 192 (49.1%) | 199 (50.9%) |
Employment Industries by Sex in Alden
Employment Industries in Alden
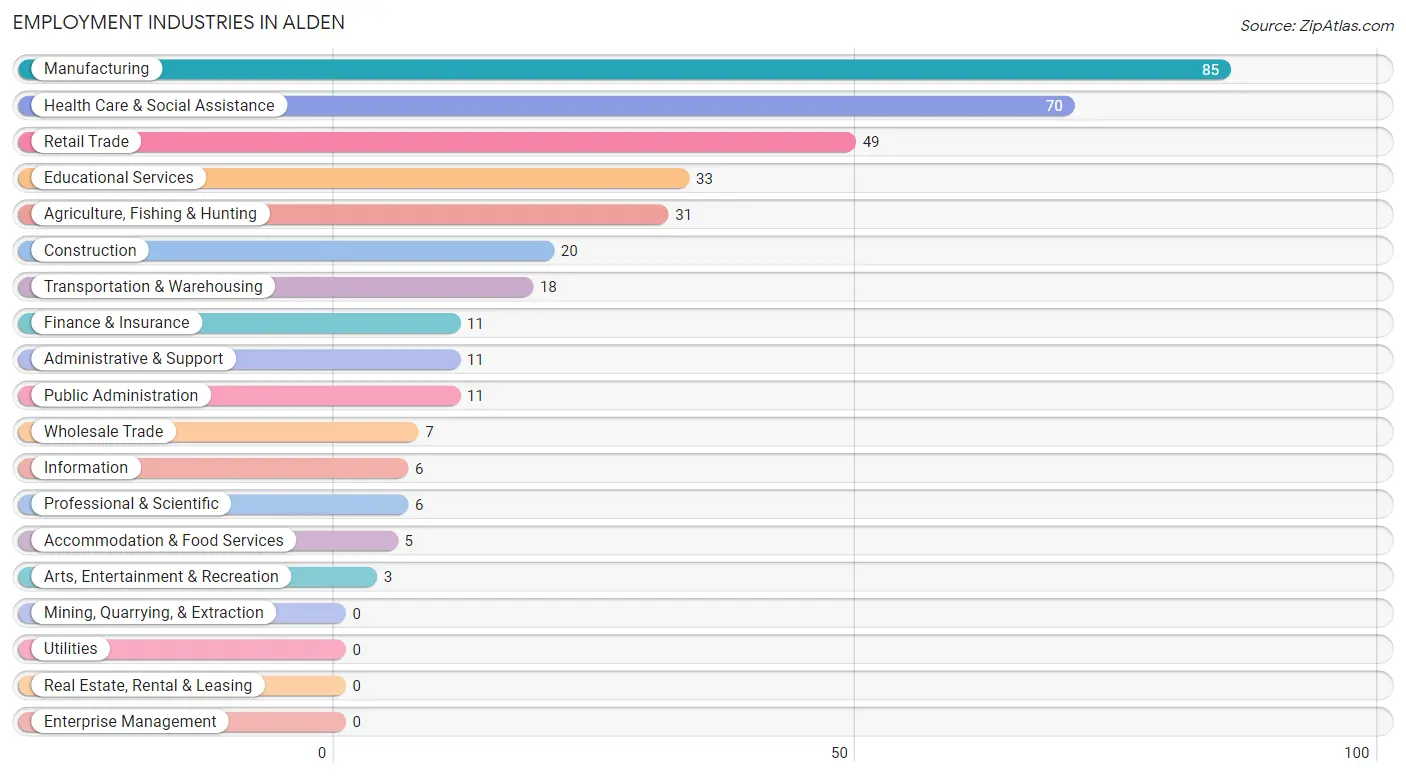
The major employment industries in Alden include Manufacturing (85 | 21.7%), Health Care & Social Assistance (70 | 17.9%), Retail Trade (49 | 12.5%), Educational Services (33 | 8.4%), and Agriculture, Fishing & Hunting (31 | 7.9%).
Employment Industries by Sex in Alden
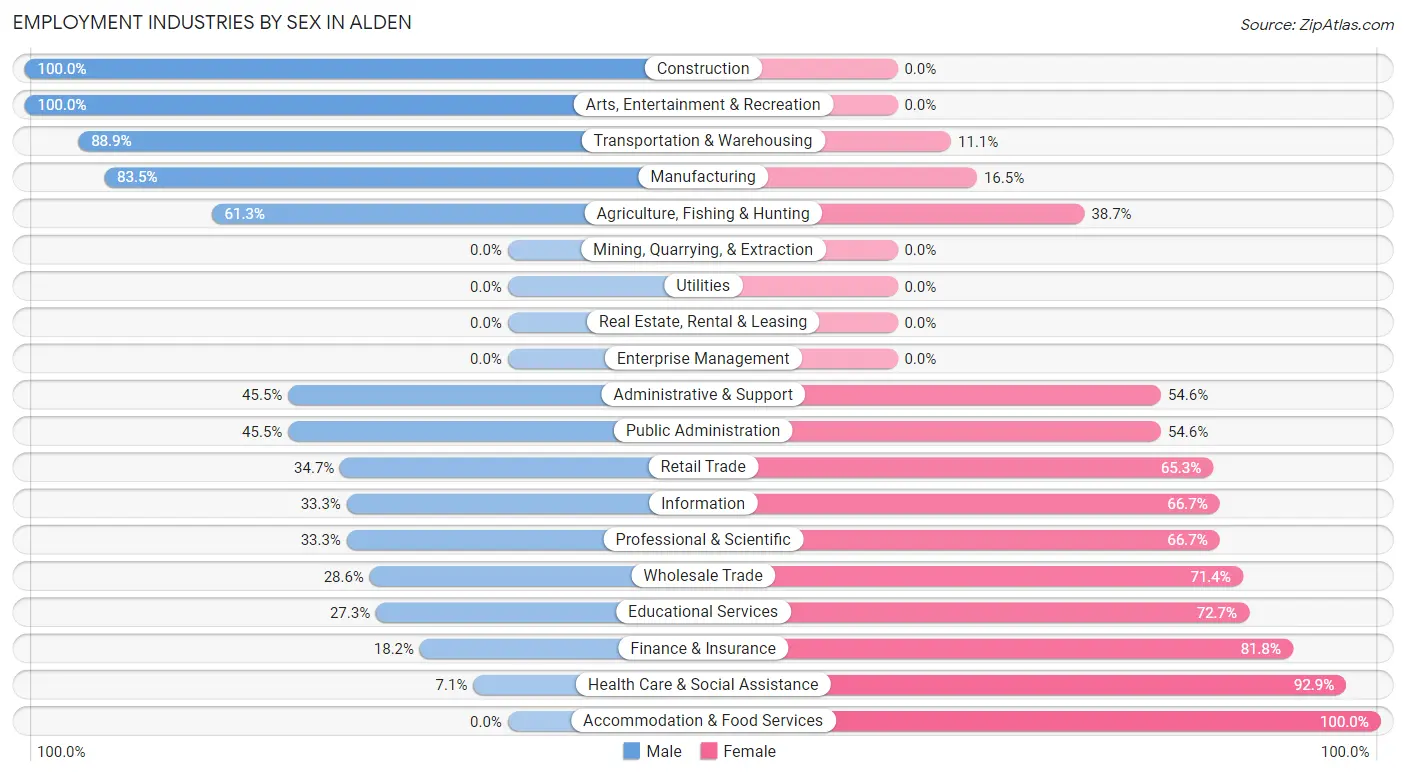
The Alden industries that see more men than women are Construction (100.0%), Arts, Entertainment & Recreation (100.0%), and Transportation & Warehousing (88.9%), whereas the industries that tend to have a higher number of women are Accommodation & Food Services (100.0%), Health Care & Social Assistance (92.9%), and Finance & Insurance (81.8%).
| Industry | Male | Female |
| Agriculture, Fishing & Hunting | 19 (61.3%) | 12 (38.7%) |
| Mining, Quarrying, & Extraction | 0 (0.0%) | 0 (0.0%) |
| Construction | 20 (100.0%) | 0 (0.0%) |
| Manufacturing | 71 (83.5%) | 14 (16.5%) |
| Wholesale Trade | 2 (28.6%) | 5 (71.4%) |
| Retail Trade | 17 (34.7%) | 32 (65.3%) |
| Transportation & Warehousing | 16 (88.9%) | 2 (11.1%) |
| Utilities | 0 (0.0%) | 0 (0.0%) |
| Information | 2 (33.3%) | 4 (66.7%) |
| Finance & Insurance | 2 (18.2%) | 9 (81.8%) |
| Real Estate, Rental & Leasing | 0 (0.0%) | 0 (0.0%) |
| Professional & Scientific | 2 (33.3%) | 4 (66.7%) |
| Enterprise Management | 0 (0.0%) | 0 (0.0%) |
| Administrative & Support | 5 (45.5%) | 6 (54.5%) |
| Educational Services | 9 (27.3%) | 24 (72.7%) |
| Health Care & Social Assistance | 5 (7.1%) | 65 (92.9%) |
| Arts, Entertainment & Recreation | 3 (100.0%) | 0 (0.0%) |
| Accommodation & Food Services | 0 (0.0%) | 5 (100.0%) |
| Public Administration | 5 (45.5%) | 6 (54.5%) |
| Total | 192 (49.1%) | 199 (50.9%) |
Education in Alden
School Enrollment in Alden
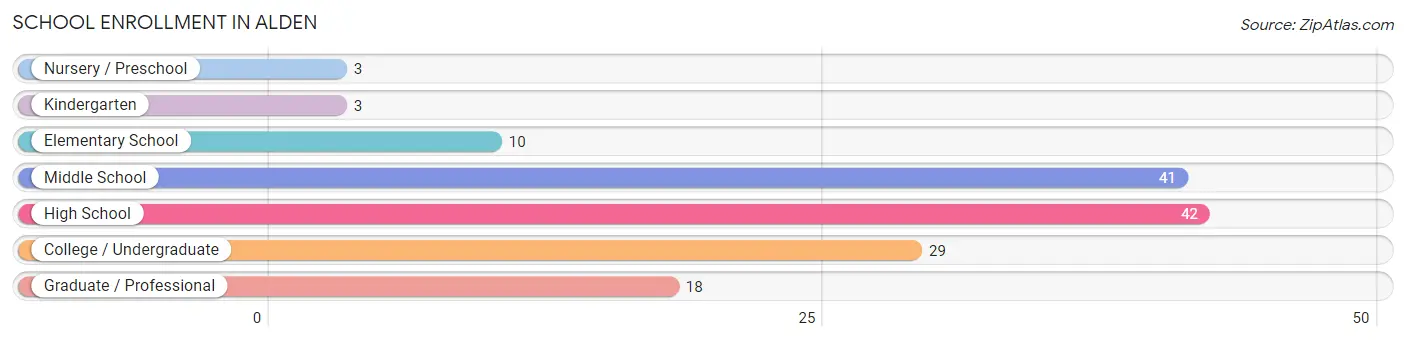
The most common levels of schooling among the 146 students in Alden are high school (42 | 28.8%), middle school (41 | 28.1%), and college / undergraduate (29 | 19.9%).
| School Level | # Students | % Students |
| Nursery / Preschool | 3 | 2.1% |
| Kindergarten | 3 | 2.1% |
| Elementary School | 10 | 6.9% |
| Middle School | 41 | 28.1% |
| High School | 42 | 28.8% |
| College / Undergraduate | 29 | 19.9% |
| Graduate / Professional | 18 | 12.3% |
| Total | 146 | 100.0% |
School Enrollment by Age by Funding Source in Alden
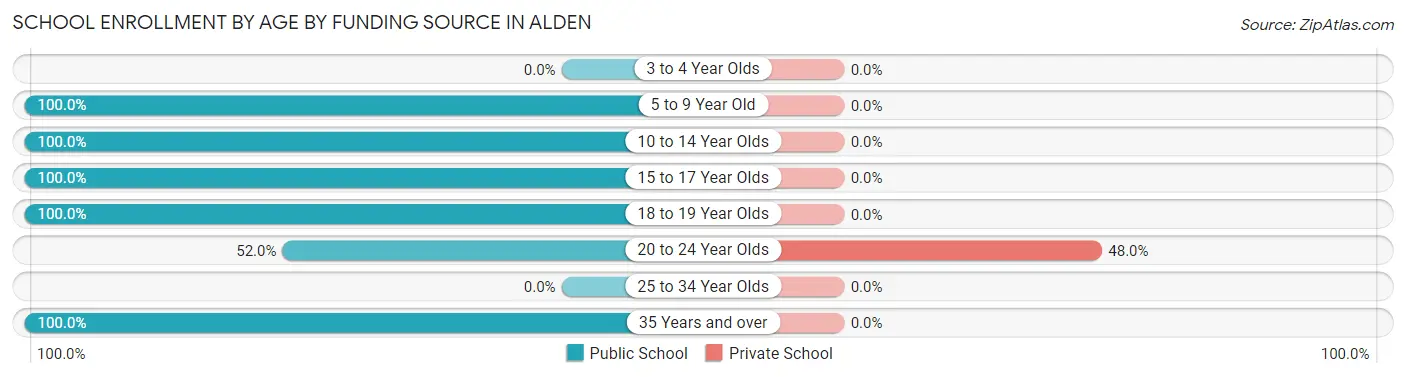
Out of a total of 146 students who are enrolled in schools in Alden, 12 (8.2%) attend a private institution, while the remaining 134 (91.8%) are enrolled in public schools. The age group of 20 to 24 year olds has the highest likelihood of being enrolled in private schools, with 12 (48.0% in the age bracket) enrolled. Conversely, the age group of 5 to 9 year old has the lowest likelihood of being enrolled in a private school, with 16 (100.0% in the age bracket) attending a public institution.
| Age Bracket | Public School | Private School |
| 3 to 4 Year Olds | 0 (0.0%) | 0 (0.0%) |
| 5 to 9 Year Old | 16 (100.0%) | 0 (0.0%) |
| 10 to 14 Year Olds | 43 (100.0%) | 0 (0.0%) |
| 15 to 17 Year Olds | 27 (100.0%) | 0 (0.0%) |
| 18 to 19 Year Olds | 13 (100.0%) | 0 (0.0%) |
| 20 to 24 Year Olds | 13 (52.0%) | 12 (48.0%) |
| 25 to 34 Year Olds | 0 (0.0%) | 0 (0.0%) |
| 35 Years and over | 22 (100.0%) | 0 (0.0%) |
| Total | 134 (91.8%) | 12 (8.2%) |
Educational Attainment by Field of Study in Alden
Business (22 | 25.0%), science & technology (15 | 17.1%), education (15 | 17.1%), social sciences (8 | 9.1%), and liberal arts & history (7 | 8.0%) are the most common fields of study among 88 individuals in Alden who have obtained a bachelor's degree or higher.
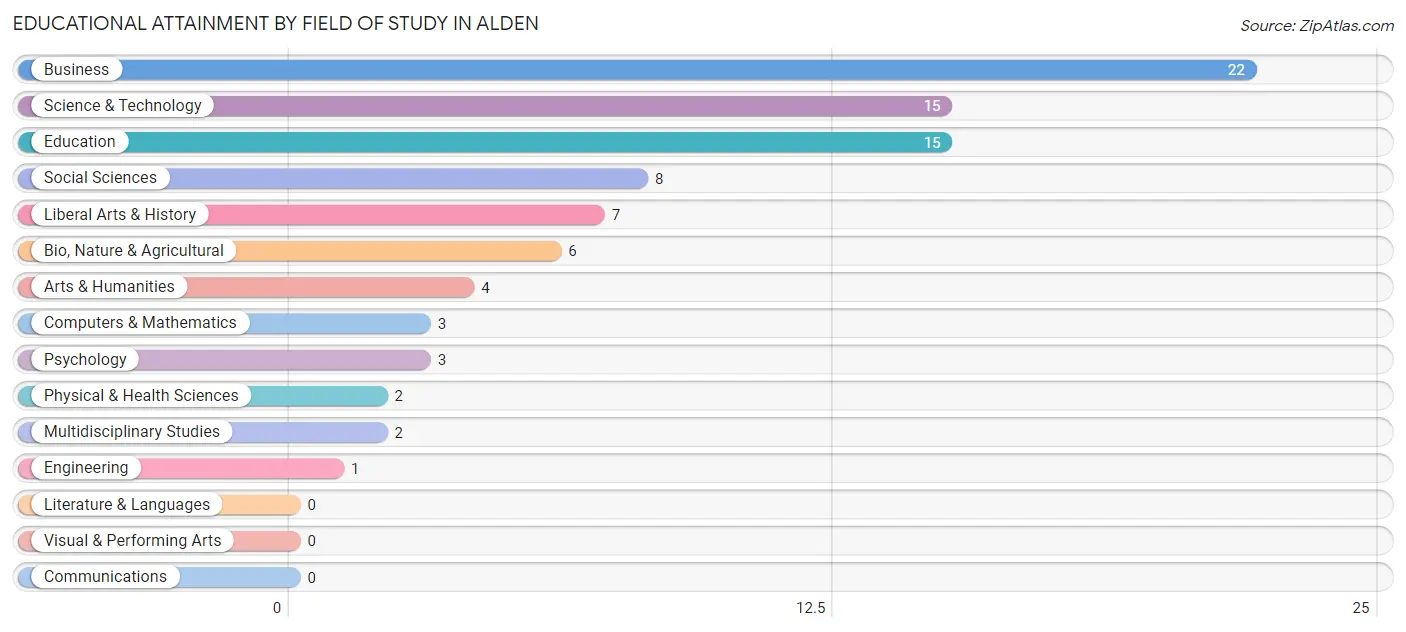
| Field of Study | # Graduates | % Graduates |
| Computers & Mathematics | 3 | 3.4% |
| Bio, Nature & Agricultural | 6 | 6.8% |
| Physical & Health Sciences | 2 | 2.3% |
| Psychology | 3 | 3.4% |
| Social Sciences | 8 | 9.1% |
| Engineering | 1 | 1.1% |
| Multidisciplinary Studies | 2 | 2.3% |
| Science & Technology | 15 | 17.1% |
| Business | 22 | 25.0% |
| Education | 15 | 17.1% |
| Literature & Languages | 0 | 0.0% |
| Liberal Arts & History | 7 | 8.0% |
| Visual & Performing Arts | 0 | 0.0% |
| Communications | 0 | 0.0% |
| Arts & Humanities | 4 | 4.5% |
| Total | 88 | 100.0% |
Transportation & Commute in Alden
Vehicle Availability by Sex in Alden
The most prevalent vehicle ownership categories in Alden are males with 2 vehicles (70, accounting for 38.0%) and females with 2 vehicles (33, making up 35.5%).
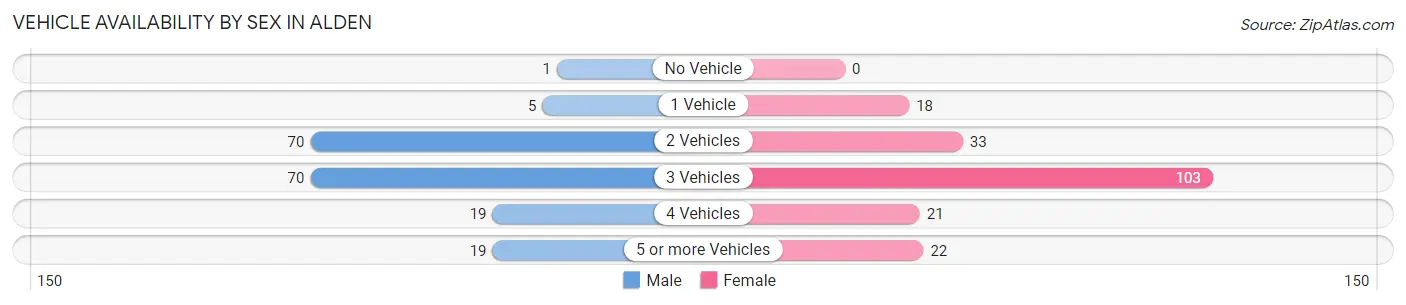
| Vehicles Available | Male | Female |
| No Vehicle | 1 (0.5%) | 0 (0.0%) |
| 1 Vehicle | 5 (2.7%) | 18 (9.1%) |
| 2 Vehicles | 70 (38.0%) | 33 (16.8%) |
| 3 Vehicles | 70 (38.0%) | 103 (52.3%) |
| 4 Vehicles | 19 (10.3%) | 21 (10.7%) |
| 5 or more Vehicles | 19 (10.3%) | 22 (11.2%) |
| Total | 184 (100.0%) | 197 (100.0%) |
Commute Time in Alden
The most frequently occuring commute durations in Alden are 20 to 24 minutes (73 commuters, 20.2%), 10 to 14 minutes (64 commuters, 17.7%), and 15 to 19 minutes (47 commuters, 13.0%).
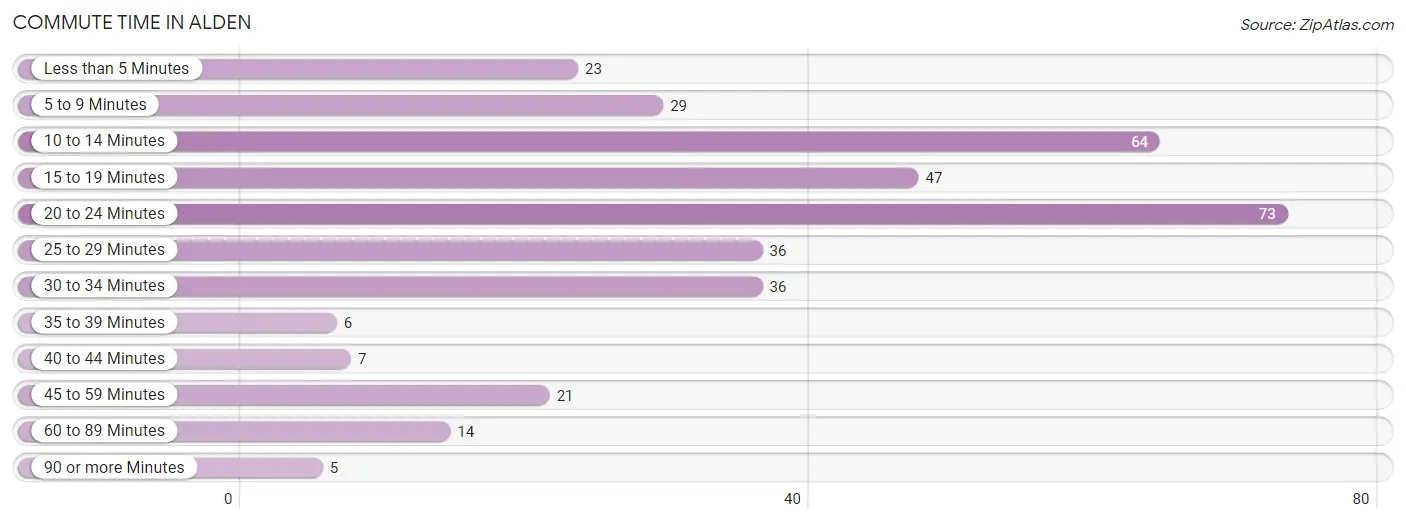
| Commute Time | # Commuters | % Commuters |
| Less than 5 Minutes | 23 | 6.4% |
| 5 to 9 Minutes | 29 | 8.0% |
| 10 to 14 Minutes | 64 | 17.7% |
| 15 to 19 Minutes | 47 | 13.0% |
| 20 to 24 Minutes | 73 | 20.2% |
| 25 to 29 Minutes | 36 | 10.0% |
| 30 to 34 Minutes | 36 | 10.0% |
| 35 to 39 Minutes | 6 | 1.7% |
| 40 to 44 Minutes | 7 | 1.9% |
| 45 to 59 Minutes | 21 | 5.8% |
| 60 to 89 Minutes | 14 | 3.9% |
| 90 or more Minutes | 5 | 1.4% |
Commute Time by Sex in Alden
The most common commute times in Alden are 10 to 14 minutes (44 commuters, 25.1%) for males and 20 to 24 minutes (49 commuters, 26.3%) for females.
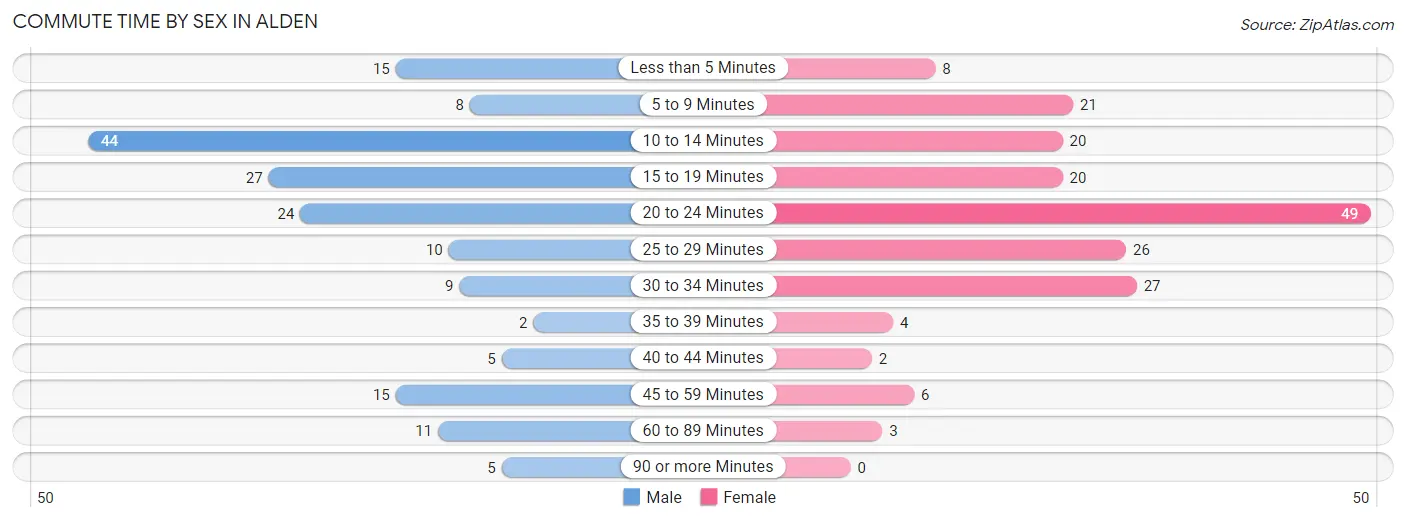
| Commute Time | Male | Female |
| Less than 5 Minutes | 15 (8.6%) | 8 (4.3%) |
| 5 to 9 Minutes | 8 (4.6%) | 21 (11.3%) |
| 10 to 14 Minutes | 44 (25.1%) | 20 (10.7%) |
| 15 to 19 Minutes | 27 (15.4%) | 20 (10.7%) |
| 20 to 24 Minutes | 24 (13.7%) | 49 (26.3%) |
| 25 to 29 Minutes | 10 (5.7%) | 26 (14.0%) |
| 30 to 34 Minutes | 9 (5.1%) | 27 (14.5%) |
| 35 to 39 Minutes | 2 (1.1%) | 4 (2.1%) |
| 40 to 44 Minutes | 5 (2.9%) | 2 (1.1%) |
| 45 to 59 Minutes | 15 (8.6%) | 6 (3.2%) |
| 60 to 89 Minutes | 11 (6.3%) | 3 (1.6%) |
| 90 or more Minutes | 5 (2.9%) | 0 (0.0%) |
Time of Departure to Work by Sex in Alden
The most frequent times of departure to work in Alden are 6:00 AM to 6:29 AM (25, 14.3%) for males and 7:30 AM to 7:59 AM (37, 19.9%) for females.
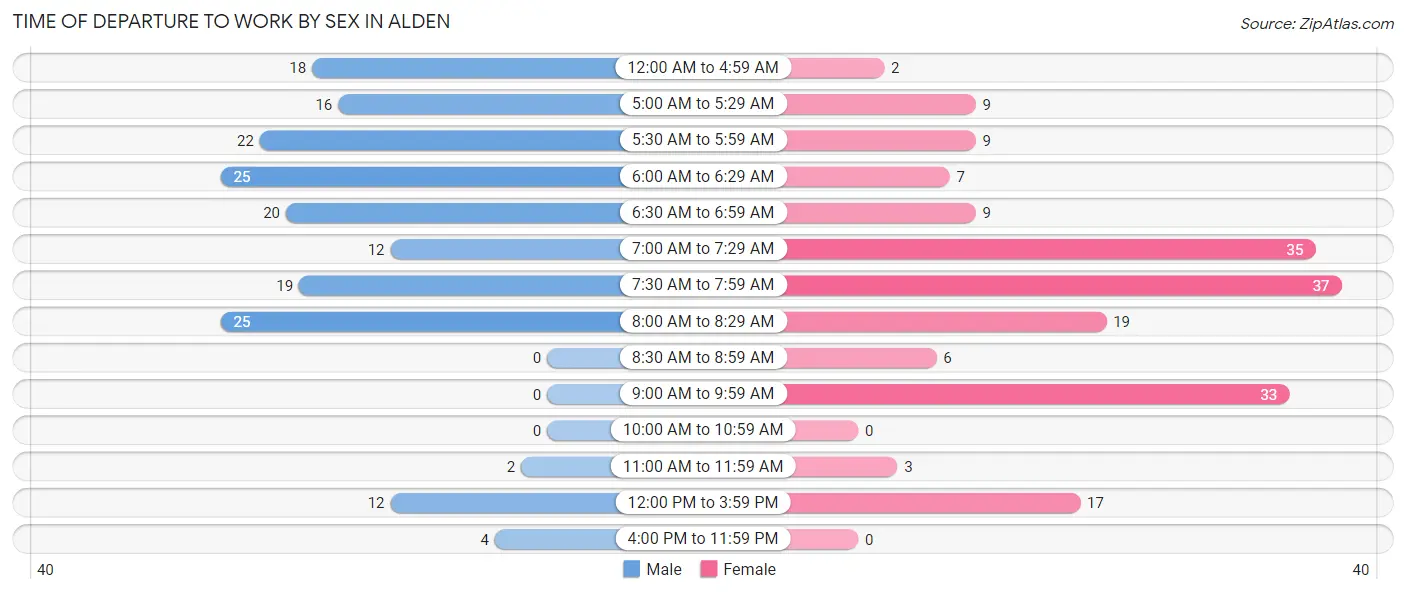
| Time of Departure | Male | Female |
| 12:00 AM to 4:59 AM | 18 (10.3%) | 2 (1.1%) |
| 5:00 AM to 5:29 AM | 16 (9.1%) | 9 (4.8%) |
| 5:30 AM to 5:59 AM | 22 (12.6%) | 9 (4.8%) |
| 6:00 AM to 6:29 AM | 25 (14.3%) | 7 (3.8%) |
| 6:30 AM to 6:59 AM | 20 (11.4%) | 9 (4.8%) |
| 7:00 AM to 7:29 AM | 12 (6.9%) | 35 (18.8%) |
| 7:30 AM to 7:59 AM | 19 (10.9%) | 37 (19.9%) |
| 8:00 AM to 8:29 AM | 25 (14.3%) | 19 (10.2%) |
| 8:30 AM to 8:59 AM | 0 (0.0%) | 6 (3.2%) |
| 9:00 AM to 9:59 AM | 0 (0.0%) | 33 (17.7%) |
| 10:00 AM to 10:59 AM | 0 (0.0%) | 0 (0.0%) |
| 11:00 AM to 11:59 AM | 2 (1.1%) | 3 (1.6%) |
| 12:00 PM to 3:59 PM | 12 (6.9%) | 17 (9.1%) |
| 4:00 PM to 11:59 PM | 4 (2.3%) | 0 (0.0%) |
| Total | 175 (100.0%) | 186 (100.0%) |
Housing Occupancy in Alden
Occupancy by Ownership in Alden
Of the total 258 dwellings in Alden, owner-occupied units account for 216 (83.7%), while renter-occupied units make up 42 (16.3%).
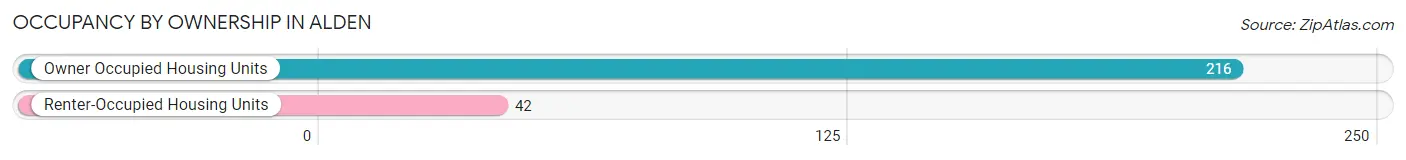
| Occupancy | # Housing Units | % Housing Units |
| Owner Occupied Housing Units | 216 | 83.7% |
| Renter-Occupied Housing Units | 42 | 16.3% |
| Total Occupied Housing Units | 258 | 100.0% |
Occupancy by Household Size in Alden
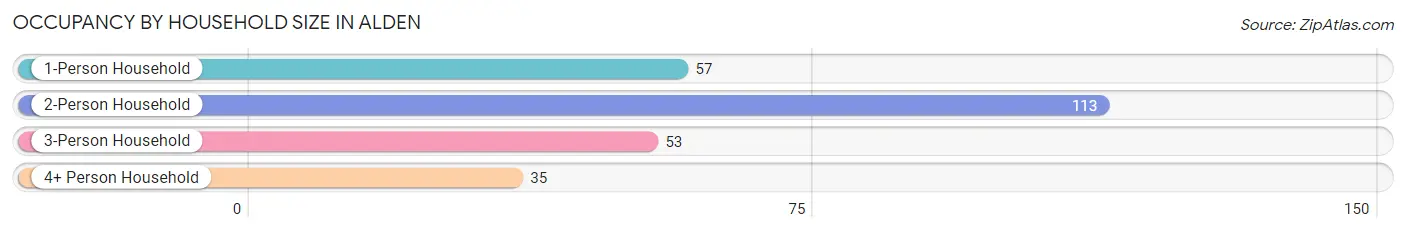
| Household Size | # Housing Units | % Housing Units |
| 1-Person Household | 57 | 22.1% |
| 2-Person Household | 113 | 43.8% |
| 3-Person Household | 53 | 20.5% |
| 4+ Person Household | 35 | 13.6% |
| Total Housing Units | 258 | 100.0% |
Occupancy by Ownership by Household Size in Alden
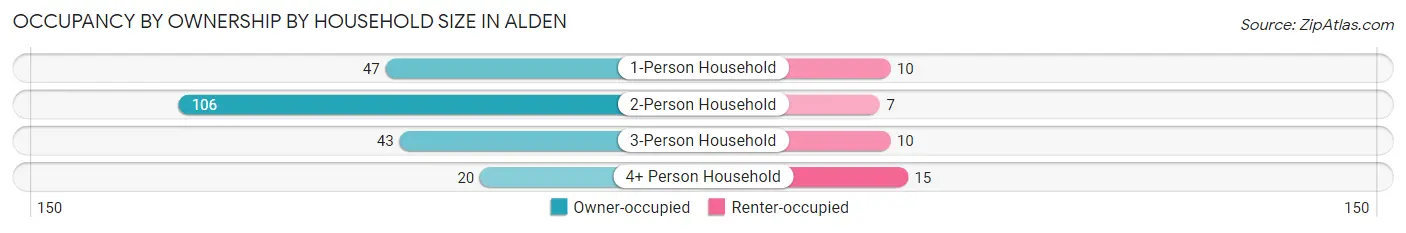
| Household Size | Owner-occupied | Renter-occupied |
| 1-Person Household | 47 (82.5%) | 10 (17.5%) |
| 2-Person Household | 106 (93.8%) | 7 (6.2%) |
| 3-Person Household | 43 (81.1%) | 10 (18.9%) |
| 4+ Person Household | 20 (57.1%) | 15 (42.9%) |
| Total Housing Units | 216 (83.7%) | 42 (16.3%) |
Occupancy by Educational Attainment in Alden
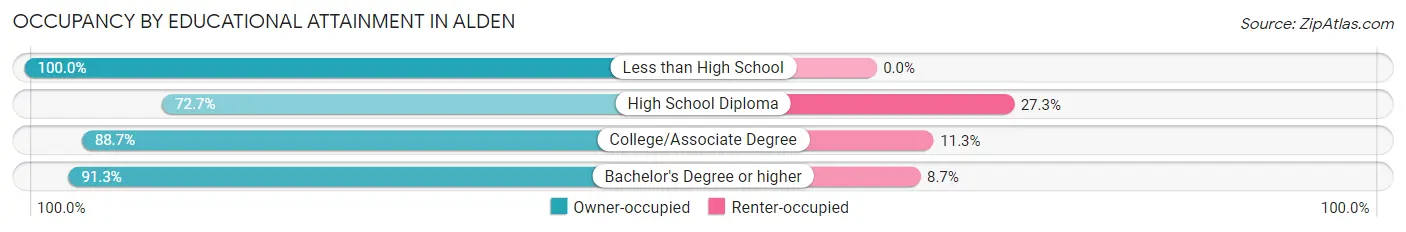
| Household Size | Owner-occupied | Renter-occupied |
| Less than High School | 16 (100.0%) | 0 (0.0%) |
| High School Diploma | 72 (72.7%) | 27 (27.3%) |
| College/Associate Degree | 86 (88.7%) | 11 (11.3%) |
| Bachelor's Degree or higher | 42 (91.3%) | 4 (8.7%) |
Occupancy by Age of Householder in Alden
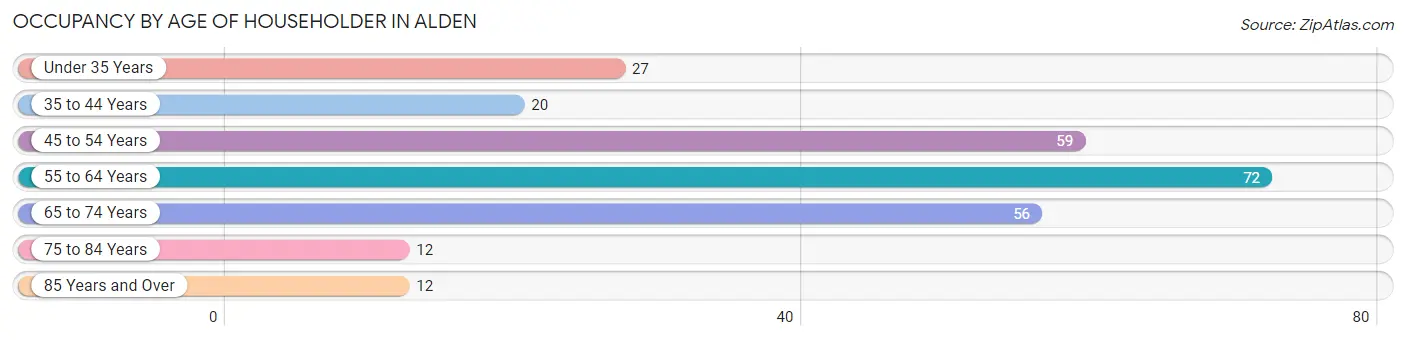
| Age Bracket | # Households | % Households |
| Under 35 Years | 27 | 10.5% |
| 35 to 44 Years | 20 | 7.7% |
| 45 to 54 Years | 59 | 22.9% |
| 55 to 64 Years | 72 | 27.9% |
| 65 to 74 Years | 56 | 21.7% |
| 75 to 84 Years | 12 | 4.6% |
| 85 Years and Over | 12 | 4.6% |
| Total | 258 | 100.0% |
Housing Finances in Alden
Median Income by Occupancy in Alden
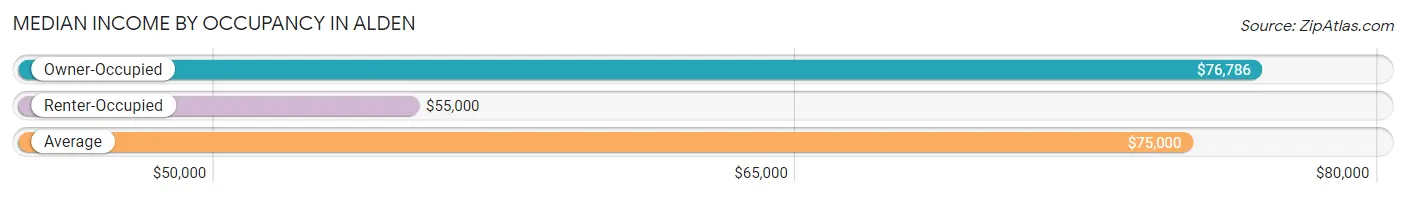
| Occupancy Type | # Households | Median Income |
| Owner-Occupied | 216 (83.7%) | $76,786 |
| Renter-Occupied | 42 (16.3%) | $55,000 |
| Average | 258 (100.0%) | $75,000 |
Occupancy by Householder Income Bracket in Alden
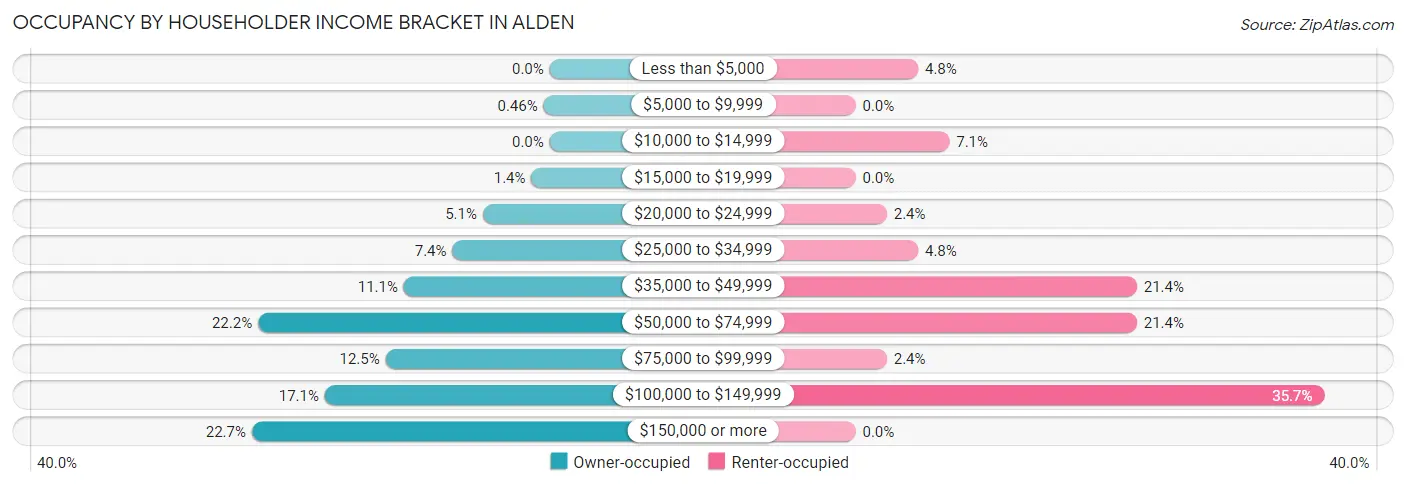
| Income Bracket | Owner-occupied | Renter-occupied |
| Less than $5,000 | 0 (0.0%) | 2 (4.8%) |
| $5,000 to $9,999 | 1 (0.5%) | 0 (0.0%) |
| $10,000 to $14,999 | 0 (0.0%) | 3 (7.1%) |
| $15,000 to $19,999 | 3 (1.4%) | 0 (0.0%) |
| $20,000 to $24,999 | 11 (5.1%) | 1 (2.4%) |
| $25,000 to $34,999 | 16 (7.4%) | 2 (4.8%) |
| $35,000 to $49,999 | 24 (11.1%) | 9 (21.4%) |
| $50,000 to $74,999 | 48 (22.2%) | 9 (21.4%) |
| $75,000 to $99,999 | 27 (12.5%) | 1 (2.4%) |
| $100,000 to $149,999 | 37 (17.1%) | 15 (35.7%) |
| $150,000 or more | 49 (22.7%) | 0 (0.0%) |
| Total | 216 (100.0%) | 42 (100.0%) |
Monthly Housing Cost Tiers in Alden
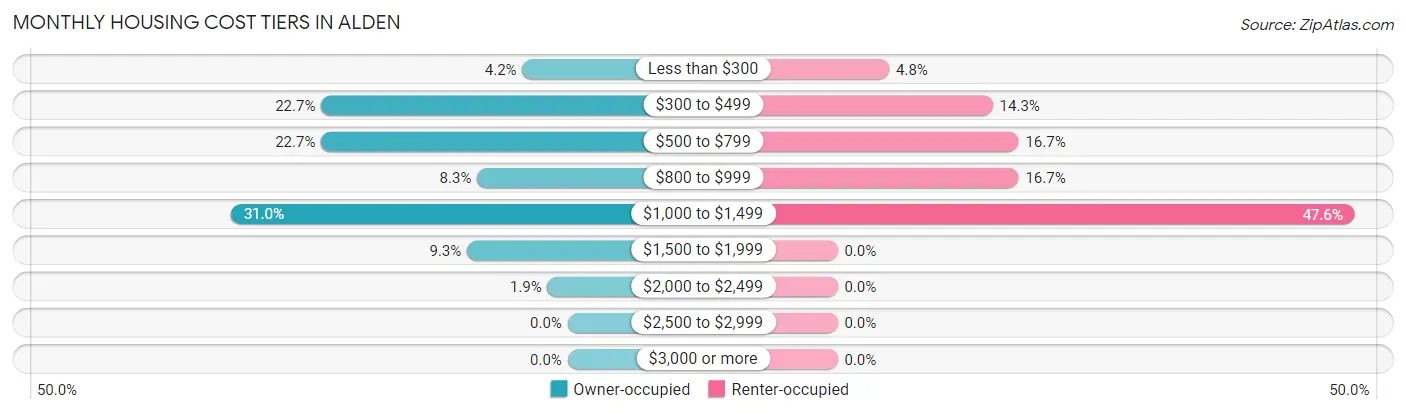
| Monthly Cost | Owner-occupied | Renter-occupied |
| Less than $300 | 9 (4.2%) | 2 (4.8%) |
| $300 to $499 | 49 (22.7%) | 6 (14.3%) |
| $500 to $799 | 49 (22.7%) | 7 (16.7%) |
| $800 to $999 | 18 (8.3%) | 7 (16.7%) |
| $1,000 to $1,499 | 67 (31.0%) | 20 (47.6%) |
| $1,500 to $1,999 | 20 (9.3%) | 0 (0.0%) |
| $2,000 to $2,499 | 4 (1.8%) | 0 (0.0%) |
| $2,500 to $2,999 | 0 (0.0%) | 0 (0.0%) |
| $3,000 or more | 0 (0.0%) | 0 (0.0%) |
| Total | 216 (100.0%) | 42 (100.0%) |
Physical Housing Characteristics in Alden
Housing Structures in Alden
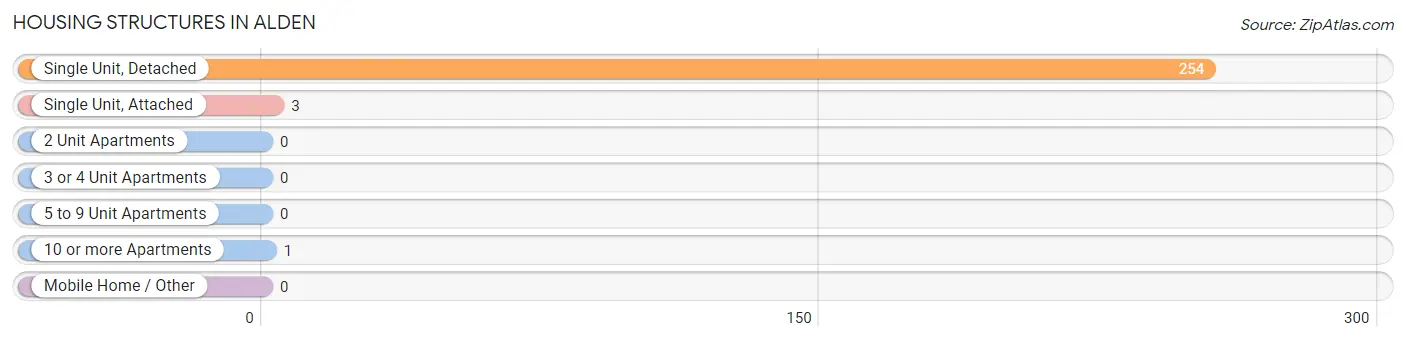
| Structure Type | # Housing Units | % Housing Units |
| Single Unit, Detached | 254 | 98.5% |
| Single Unit, Attached | 3 | 1.2% |
| 2 Unit Apartments | 0 | 0.0% |
| 3 or 4 Unit Apartments | 0 | 0.0% |
| 5 to 9 Unit Apartments | 0 | 0.0% |
| 10 or more Apartments | 1 | 0.4% |
| Mobile Home / Other | 0 | 0.0% |
| Total | 258 | 100.0% |
Housing Structures by Occupancy in Alden
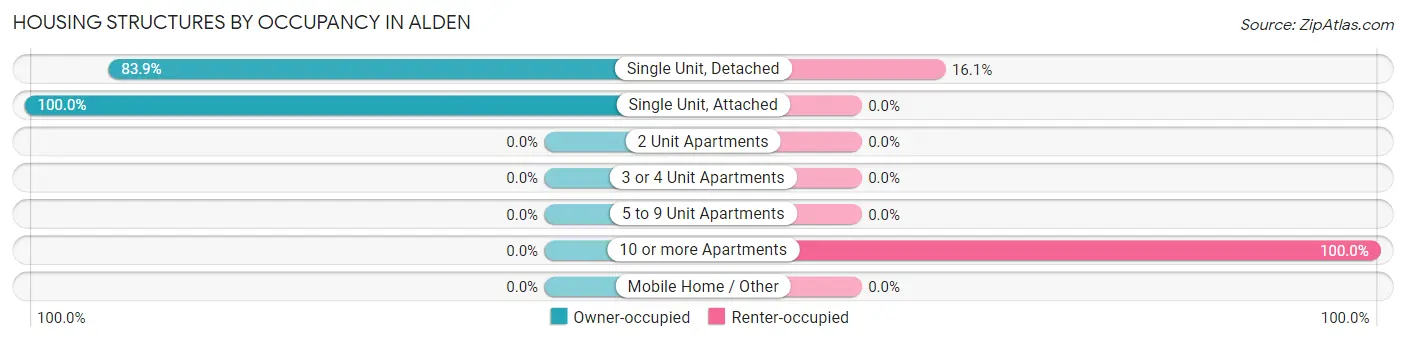
| Structure Type | Owner-occupied | Renter-occupied |
| Single Unit, Detached | 213 (83.9%) | 41 (16.1%) |
| Single Unit, Attached | 3 (100.0%) | 0 (0.0%) |
| 2 Unit Apartments | 0 (0.0%) | 0 (0.0%) |
| 3 or 4 Unit Apartments | 0 (0.0%) | 0 (0.0%) |
| 5 to 9 Unit Apartments | 0 (0.0%) | 0 (0.0%) |
| 10 or more Apartments | 0 (0.0%) | 1 (100.0%) |
| Mobile Home / Other | 0 (0.0%) | 0 (0.0%) |
| Total | 216 (83.7%) | 42 (16.3%) |
Housing Structures by Number of Rooms in Alden
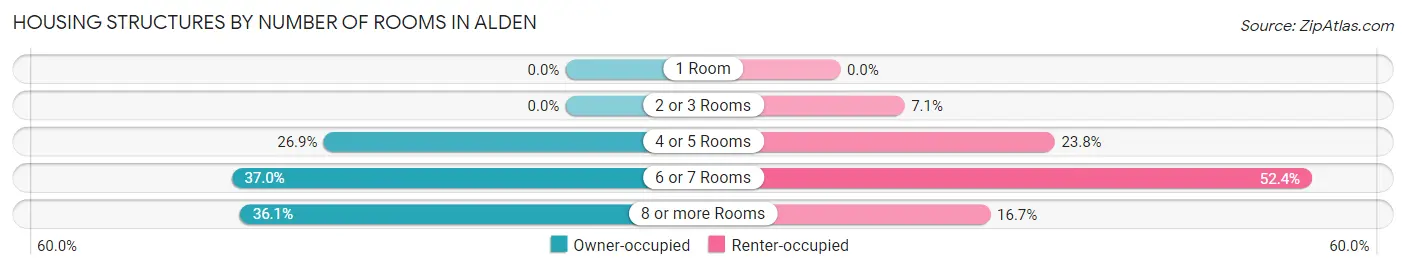
| Number of Rooms | Owner-occupied | Renter-occupied |
| 1 Room | 0 (0.0%) | 0 (0.0%) |
| 2 or 3 Rooms | 0 (0.0%) | 3 (7.1%) |
| 4 or 5 Rooms | 58 (26.9%) | 10 (23.8%) |
| 6 or 7 Rooms | 80 (37.0%) | 22 (52.4%) |
| 8 or more Rooms | 78 (36.1%) | 7 (16.7%) |
| Total | 216 (100.0%) | 42 (100.0%) |
Housing Structure by Heating Type in Alden
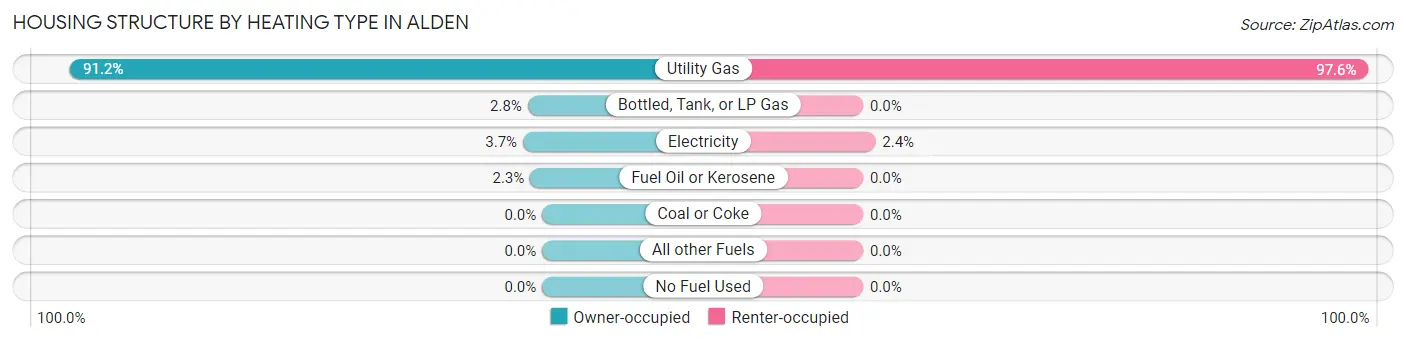
| Heating Type | Owner-occupied | Renter-occupied |
| Utility Gas | 197 (91.2%) | 41 (97.6%) |
| Bottled, Tank, or LP Gas | 6 (2.8%) | 0 (0.0%) |
| Electricity | 8 (3.7%) | 1 (2.4%) |
| Fuel Oil or Kerosene | 5 (2.3%) | 0 (0.0%) |
| Coal or Coke | 0 (0.0%) | 0 (0.0%) |
| All other Fuels | 0 (0.0%) | 0 (0.0%) |
| No Fuel Used | 0 (0.0%) | 0 (0.0%) |
| Total | 216 (100.0%) | 42 (100.0%) |
Household Vehicle Usage in Alden
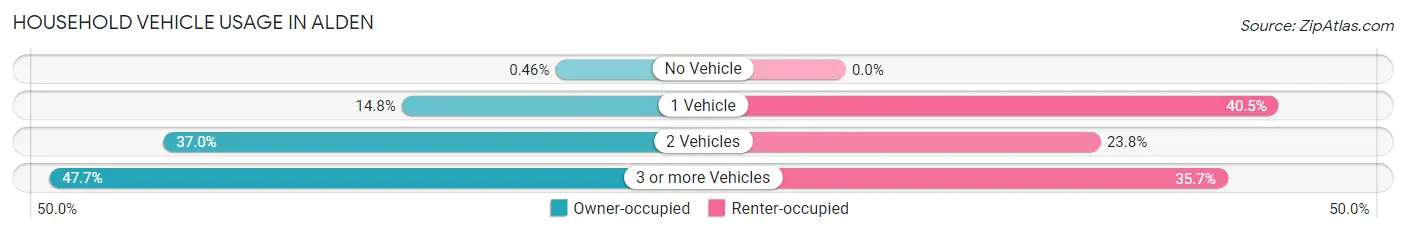
| Vehicles per Household | Owner-occupied | Renter-occupied |
| No Vehicle | 1 (0.5%) | 0 (0.0%) |
| 1 Vehicle | 32 (14.8%) | 17 (40.5%) |
| 2 Vehicles | 80 (37.0%) | 10 (23.8%) |
| 3 or more Vehicles | 103 (47.7%) | 15 (35.7%) |
| Total | 216 (100.0%) | 42 (100.0%) |
Real Estate & Mortgages in Alden
Real Estate and Mortgage Overview in Alden
| Characteristic | Without Mortgage | With Mortgage |
| Housing Units | 93 | 123 |
| Median Property Value | $101,100 | $118,500 |
| Median Household Income | $70,625 | $26 |
| Monthly Housing Costs | $452 | $0 |
| Real Estate Taxes | $1,523 | $2 |
Property Value by Mortgage Status in Alden
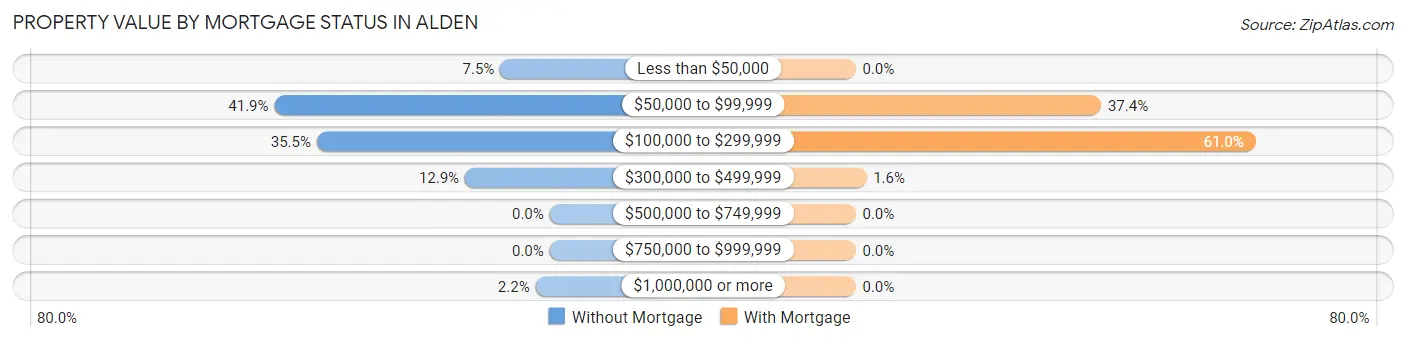
| Property Value | Without Mortgage | With Mortgage |
| Less than $50,000 | 7 (7.5%) | 0 (0.0%) |
| $50,000 to $99,999 | 39 (41.9%) | 46 (37.4%) |
| $100,000 to $299,999 | 33 (35.5%) | 75 (61.0%) |
| $300,000 to $499,999 | 12 (12.9%) | 2 (1.6%) |
| $500,000 to $749,999 | 0 (0.0%) | 0 (0.0%) |
| $750,000 to $999,999 | 0 (0.0%) | 0 (0.0%) |
| $1,000,000 or more | 2 (2.1%) | 0 (0.0%) |
| Total | 93 (100.0%) | 123 (100.0%) |
Household Income by Mortgage Status in Alden
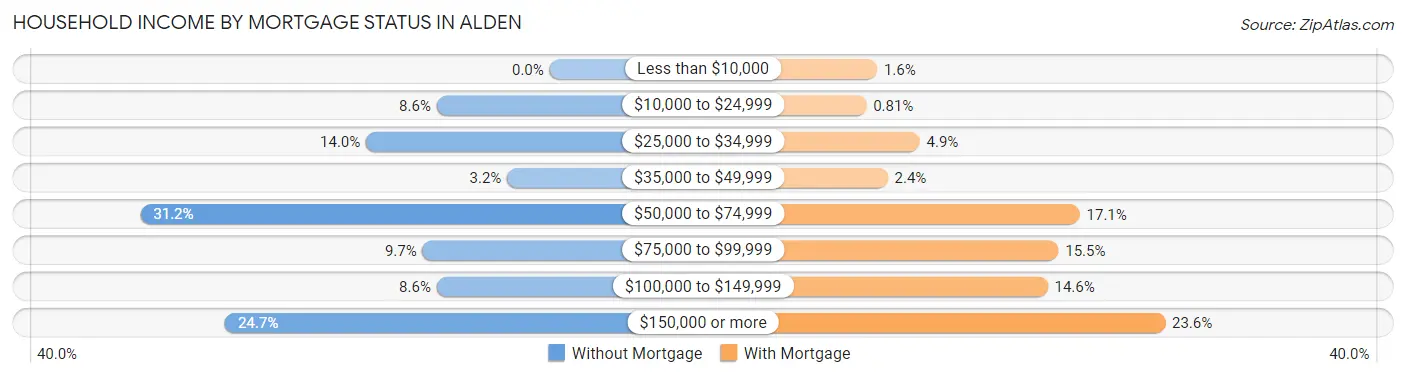
| Household Income | Without Mortgage | With Mortgage |
| Less than $10,000 | 0 (0.0%) | 2 (1.6%) |
| $10,000 to $24,999 | 8 (8.6%) | 1 (0.8%) |
| $25,000 to $34,999 | 13 (14.0%) | 6 (4.9%) |
| $35,000 to $49,999 | 3 (3.2%) | 3 (2.4%) |
| $50,000 to $74,999 | 29 (31.2%) | 21 (17.1%) |
| $75,000 to $99,999 | 9 (9.7%) | 19 (15.4%) |
| $100,000 to $149,999 | 8 (8.6%) | 18 (14.6%) |
| $150,000 or more | 23 (24.7%) | 29 (23.6%) |
| Total | 93 (100.0%) | 123 (100.0%) |
Property Value to Household Income Ratio in Alden
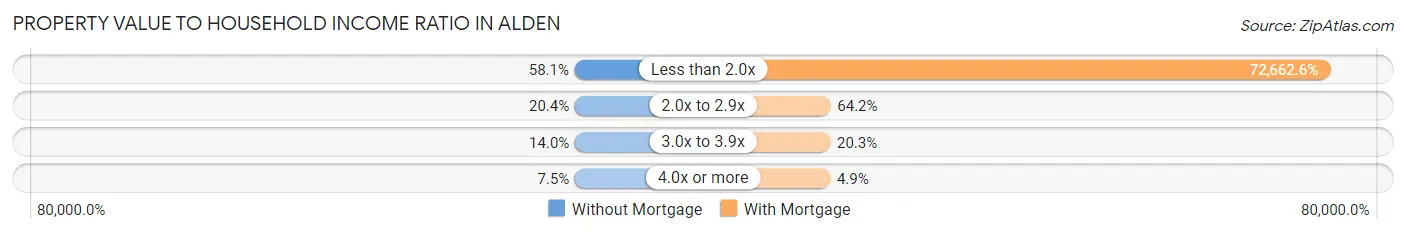
| Value-to-Income Ratio | Without Mortgage | With Mortgage |
| Less than 2.0x | 54 (58.1%) | 89,375 (72,662.6%) |
| 2.0x to 2.9x | 19 (20.4%) | 79 (64.2%) |
| 3.0x to 3.9x | 13 (14.0%) | 25 (20.3%) |
| 4.0x or more | 7 (7.5%) | 6 (4.9%) |
| Total | 93 (100.0%) | 123 (100.0%) |
Real Estate Taxes by Mortgage Status in Alden
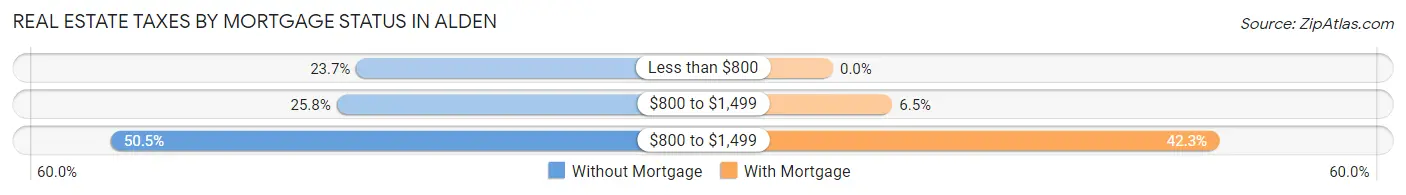
| Property Taxes | Without Mortgage | With Mortgage |
| Less than $800 | 22 (23.7%) | 0 (0.0%) |
| $800 to $1,499 | 24 (25.8%) | 8 (6.5%) |
| $800 to $1,499 | 47 (50.5%) | 52 (42.3%) |
| Total | 93 (100.0%) | 123 (100.0%) |
Health & Disability in Alden
Health Insurance Coverage by Age in Alden
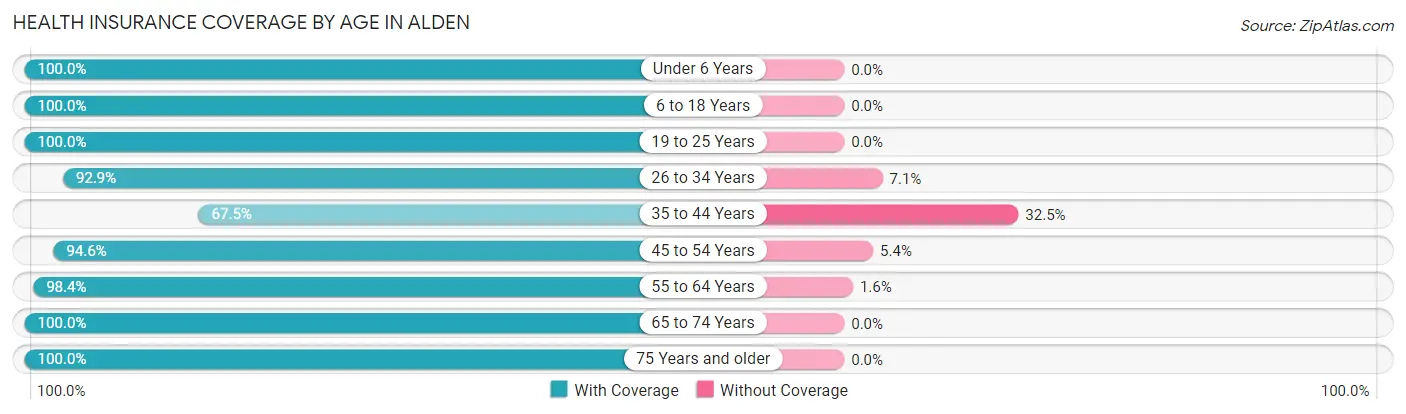
| Age Bracket | With Coverage | Without Coverage |
| Under 6 Years | 17 (100.0%) | 0 (0.0%) |
| 6 to 18 Years | 92 (100.0%) | 0 (0.0%) |
| 19 to 25 Years | 58 (100.0%) | 0 (0.0%) |
| 26 to 34 Years | 39 (92.9%) | 3 (7.1%) |
| 35 to 44 Years | 52 (67.5%) | 25 (32.5%) |
| 45 to 54 Years | 88 (94.6%) | 5 (5.4%) |
| 55 to 64 Years | 122 (98.4%) | 2 (1.6%) |
| 65 to 74 Years | 93 (100.0%) | 0 (0.0%) |
| 75 Years and older | 37 (100.0%) | 0 (0.0%) |
| Total | 598 (94.5%) | 35 (5.5%) |
Health Insurance Coverage by Citizenship Status in Alden
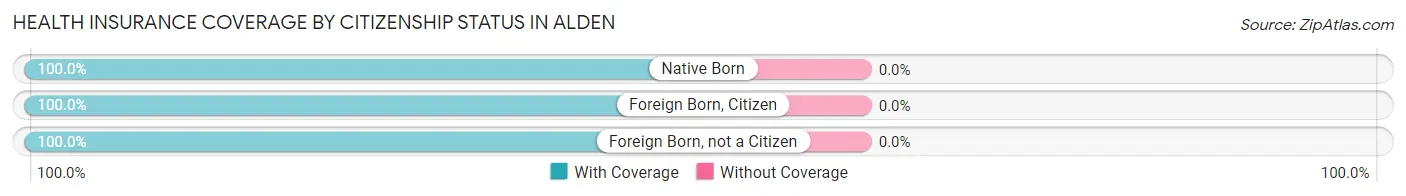
| Citizenship Status | With Coverage | Without Coverage |
| Native Born | 17 (100.0%) | 0 (0.0%) |
| Foreign Born, Citizen | 92 (100.0%) | 0 (0.0%) |
| Foreign Born, not a Citizen | 58 (100.0%) | 0 (0.0%) |
Health Insurance Coverage by Household Income in Alden
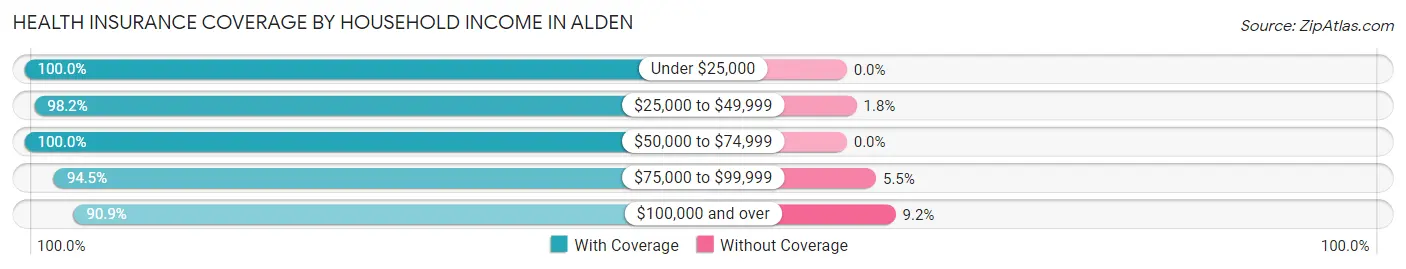
| Household Income | With Coverage | Without Coverage |
| Under $25,000 | 30 (100.0%) | 0 (0.0%) |
| $25,000 to $49,999 | 107 (98.2%) | 2 (1.8%) |
| $50,000 to $74,999 | 104 (100.0%) | 0 (0.0%) |
| $75,000 to $99,999 | 69 (94.5%) | 4 (5.5%) |
| $100,000 and over | 288 (90.8%) | 29 (9.1%) |
Public vs Private Health Insurance Coverage by Age in Alden
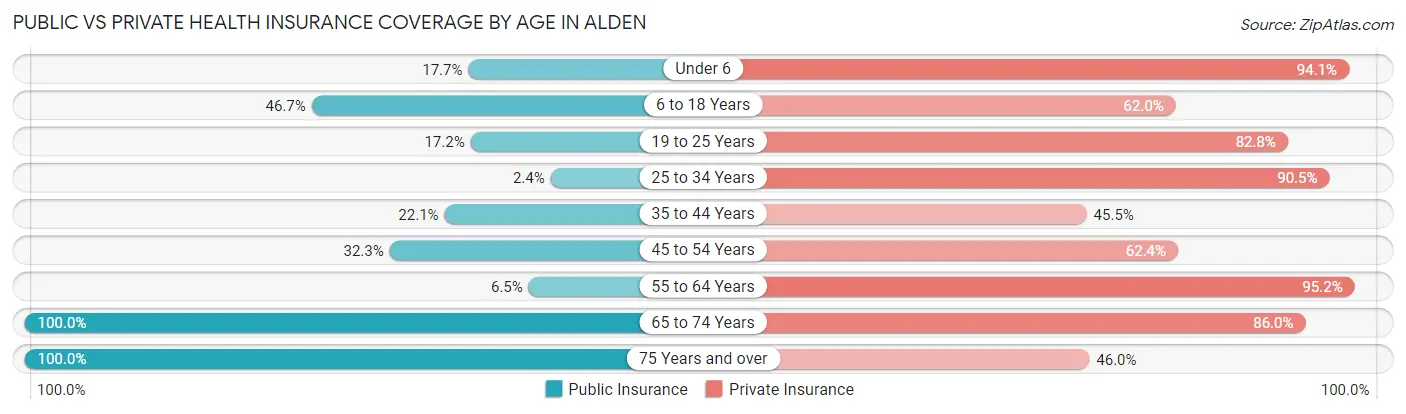
| Age Bracket | Public Insurance | Private Insurance |
| Under 6 | 3 (17.6%) | 16 (94.1%) |
| 6 to 18 Years | 43 (46.7%) | 57 (62.0%) |
| 19 to 25 Years | 10 (17.2%) | 48 (82.8%) |
| 25 to 34 Years | 1 (2.4%) | 38 (90.5%) |
| 35 to 44 Years | 17 (22.1%) | 35 (45.5%) |
| 45 to 54 Years | 30 (32.3%) | 58 (62.4%) |
| 55 to 64 Years | 8 (6.5%) | 118 (95.2%) |
| 65 to 74 Years | 93 (100.0%) | 80 (86.0%) |
| 75 Years and over | 37 (100.0%) | 17 (46.0%) |
| Total | 242 (38.2%) | 467 (73.8%) |
Disability Status by Sex by Age in Alden
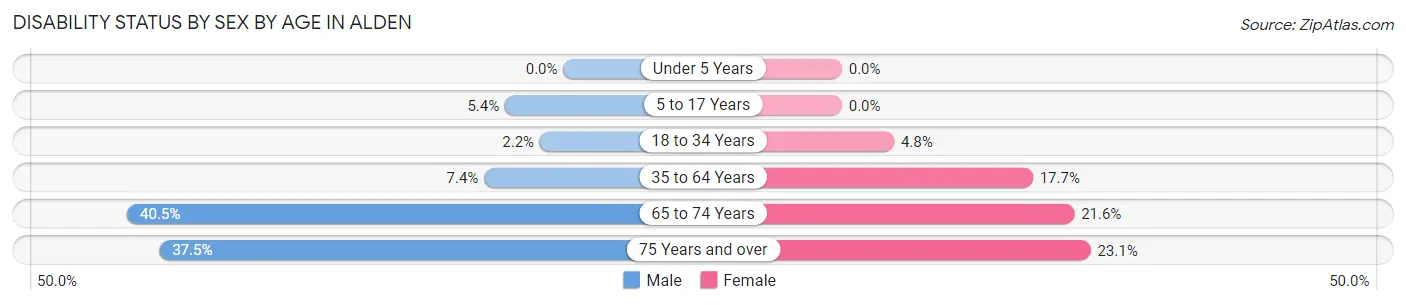
| Age Bracket | Male | Female |
| Under 5 Years | 0 (0.0%) | 0 (0.0%) |
| 5 to 17 Years | 2 (5.4%) | 0 (0.0%) |
| 18 to 34 Years | 1 (2.2%) | 3 (4.8%) |
| 35 to 64 Years | 10 (7.3%) | 28 (17.7%) |
| 65 to 74 Years | 17 (40.5%) | 11 (21.6%) |
| 75 Years and over | 9 (37.5%) | 3 (23.1%) |
Disability Class by Sex by Age in Alden
Disability Class: Hearing Difficulty
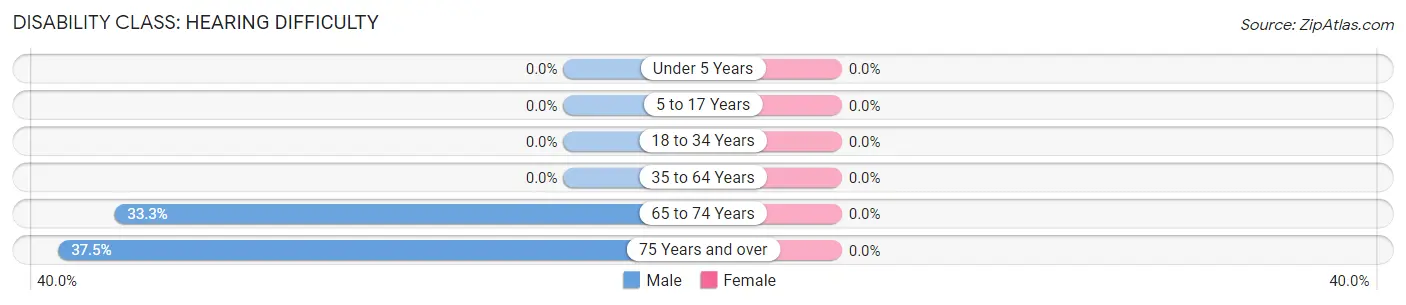
| Age Bracket | Male | Female |
| Under 5 Years | 0 (0.0%) | 0 (0.0%) |
| 5 to 17 Years | 0 (0.0%) | 0 (0.0%) |
| 18 to 34 Years | 0 (0.0%) | 0 (0.0%) |
| 35 to 64 Years | 0 (0.0%) | 0 (0.0%) |
| 65 to 74 Years | 14 (33.3%) | 0 (0.0%) |
| 75 Years and over | 9 (37.5%) | 0 (0.0%) |
Disability Class: Vision Difficulty
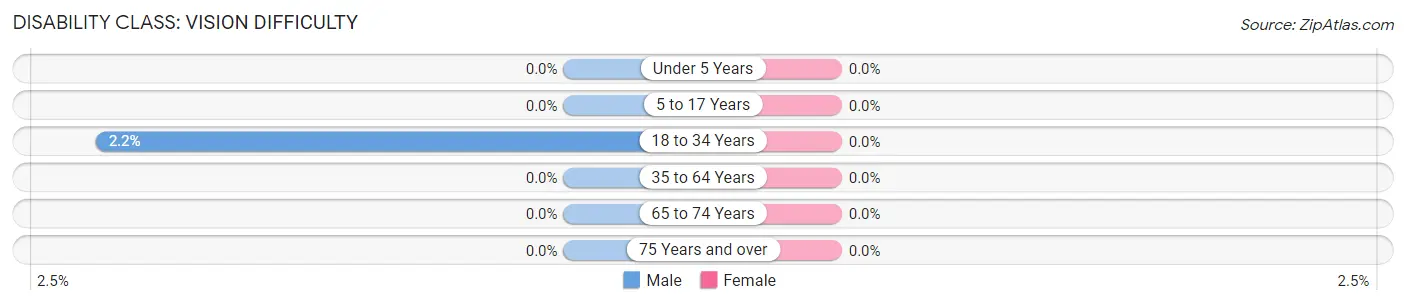
| Age Bracket | Male | Female |
| Under 5 Years | 0 (0.0%) | 0 (0.0%) |
| 5 to 17 Years | 0 (0.0%) | 0 (0.0%) |
| 18 to 34 Years | 1 (2.2%) | 0 (0.0%) |
| 35 to 64 Years | 0 (0.0%) | 0 (0.0%) |
| 65 to 74 Years | 0 (0.0%) | 0 (0.0%) |
| 75 Years and over | 0 (0.0%) | 0 (0.0%) |
Disability Class: Cognitive Difficulty
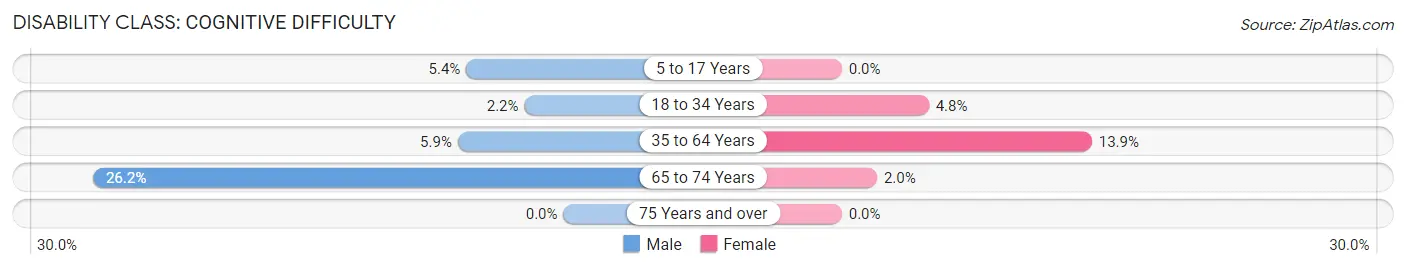
| Age Bracket | Male | Female |
| 5 to 17 Years | 2 (5.4%) | 0 (0.0%) |
| 18 to 34 Years | 1 (2.2%) | 3 (4.8%) |
| 35 to 64 Years | 8 (5.9%) | 22 (13.9%) |
| 65 to 74 Years | 11 (26.2%) | 1 (2.0%) |
| 75 Years and over | 0 (0.0%) | 0 (0.0%) |
Disability Class: Ambulatory Difficulty
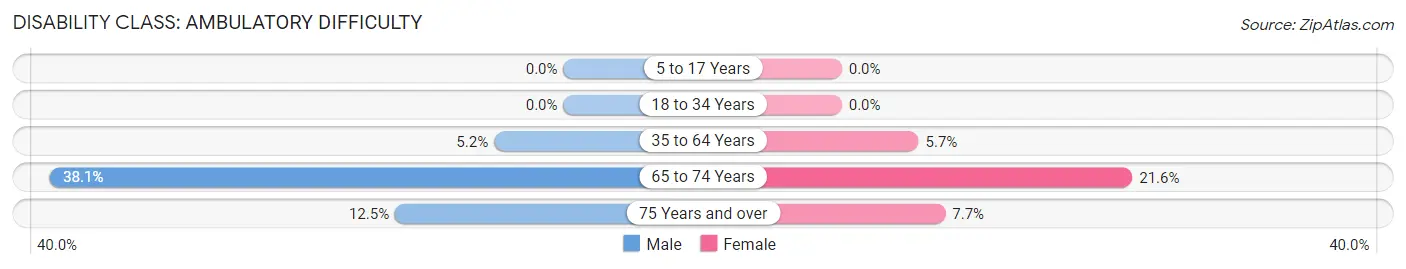
| Age Bracket | Male | Female |
| 5 to 17 Years | 0 (0.0%) | 0 (0.0%) |
| 18 to 34 Years | 0 (0.0%) | 0 (0.0%) |
| 35 to 64 Years | 7 (5.1%) | 9 (5.7%) |
| 65 to 74 Years | 16 (38.1%) | 11 (21.6%) |
| 75 Years and over | 3 (12.5%) | 1 (7.7%) |
Disability Class: Self-Care Difficulty
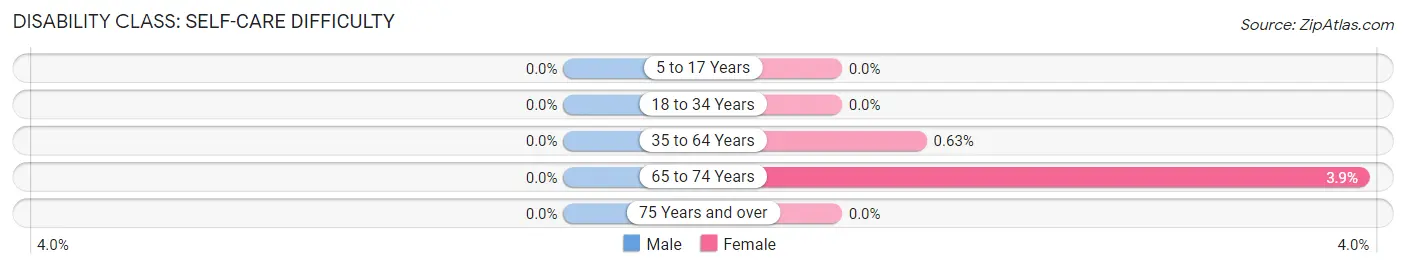
| Age Bracket | Male | Female |
| 5 to 17 Years | 0 (0.0%) | 0 (0.0%) |
| 18 to 34 Years | 0 (0.0%) | 0 (0.0%) |
| 35 to 64 Years | 0 (0.0%) | 1 (0.6%) |
| 65 to 74 Years | 0 (0.0%) | 2 (3.9%) |
| 75 Years and over | 0 (0.0%) | 0 (0.0%) |
Technology Access in Alden
Computing Device Access in Alden
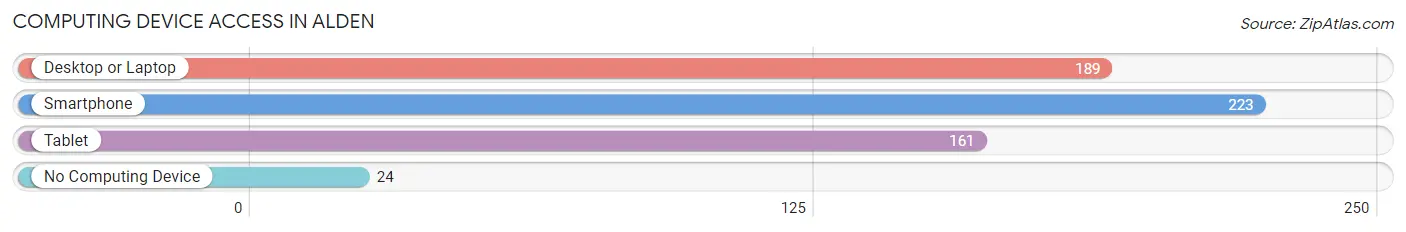
| Device Type | # Households | % Households |
| Desktop or Laptop | 189 | 73.3% |
| Smartphone | 223 | 86.4% |
| Tablet | 161 | 62.4% |
| No Computing Device | 24 | 9.3% |
| Total | 258 | 100.0% |
Internet Access in Alden
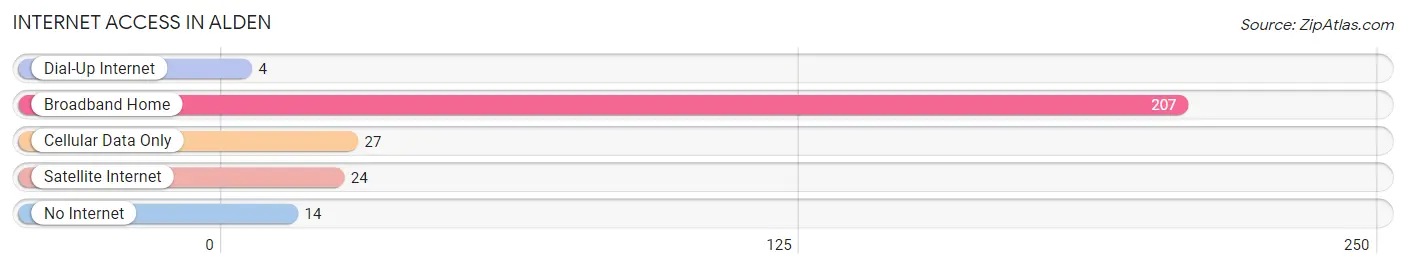
| Internet Type | # Households | % Households |
| Dial-Up Internet | 4 | 1.5% |
| Broadband Home | 207 | 80.2% |
| Cellular Data Only | 27 | 10.5% |
| Satellite Internet | 24 | 9.3% |
| No Internet | 14 | 5.4% |
| Total | 258 | 100.0% |
Alden Summary
Alden is a small city located in Freeborn County, Minnesota. It is situated on the western edge of the state, just south of the Iowa border. The city has a population of approximately 1,000 people and is part of the Albert Lea Metropolitan Statistical Area.
History
Alden was founded in 1856 by a group of settlers from New York. The city was named after Alden, New York, the hometown of the settlers. The city was incorporated in 1876 and has remained a small, rural community ever since.
The city was originally a farming community, but in the early 1900s, the economy shifted to manufacturing. The city was home to several factories, including a flour mill, a creamery, and a furniture factory. These factories provided employment for many of the city’s residents.
In the 1950s, the city began to experience a decline in its manufacturing industry. Many of the factories closed and the city’s population began to decline. In the late 1970s, the city began to experience a resurgence in its economy. The city was able to attract new businesses and industries, which helped to revitalize the city.
Geography
Alden is located in Freeborn County, Minnesota. The city is situated on the western edge of the state, just south of the Iowa border. The city is located on the banks of the Shell Rock River and is surrounded by rolling hills and farmland.
The city has a total area of 1.2 square miles, all of which is land. The city has a humid continental climate, with cold winters and hot, humid summers.
Economy
Alden’s economy is largely based on agriculture and manufacturing. The city is home to several factories, including a flour mill, a creamery, and a furniture factory. The city also has several small businesses, including restaurants, retail stores, and service providers.
The city is also home to several large employers, including the Freeborn County Medical Center and the Freeborn County Sheriff’s Office. The city is also home to several educational institutions, including the University of Minnesota-Alden and the Alden-Conger Public Schools.
Demographics
As of the 2010 census, the city had a population of 1,000 people. The racial makeup of the city was 97.2% White, 0.7% African American, 0.2% Native American, 0.2% Asian, 0.2% from other races, and 1.7% from two or more races. Hispanic or Latino of any race were 1.2% of the population.
The median income for a household in the city was $41,250, and the median income for a family was $50,000. The per capita income for the city was $20,845. About 8.2% of families and 10.2% of the population were below the poverty line, including 14.3% of those under age 18 and 6.7% of those age 65 or over.
Alden is a small city with a rich history and a diverse economy. The city has experienced a resurgence in recent years, with new businesses and industries moving into the area. The city is home to several large employers and educational institutions, and is a great place to live and work.
Common Questions
What is Per Capita Income in Alden?
Per Capita income in Alden is $38,348.
What is the Median Family Income in Alden?
Median Family Income in Alden is $94,375.
What is the Median Household income in Alden?
Median Household Income in Alden is $75,000.
What is Income or Wage Gap in Alden?
Income or Wage Gap in Alden is 31.8%.
Women in Alden earn 68.2 cents for every dollar earned by a man.
What is Inequality or Gini Index in Alden?
Inequality or Gini Index in Alden is 0.35.
What is the Total Population of Alden?
Total Population of Alden is 633.
What is the Total Male Population of Alden?
Total Male Population of Alden is 291.
What is the Total Female Population of Alden?
Total Female Population of Alden is 342.
What is the Ratio of Males per 100 Females in Alden?
There are 85.09 Males per 100 Females in Alden.
What is the Ratio of Females per 100 Males in Alden?
There are 117.53 Females per 100 Males in Alden.
What is the Median Population Age in Alden?
Median Population Age in Alden is 47.6 Years.
What is the Average Family Size in Alden
Average Family Size in Alden is 2.9 People.
What is the Average Household Size in Alden
Average Household Size in Alden is 2.5 People.
How Large is the Labor Force in Alden?
There are 424 People in the Labor Forcein in Alden.
What is the Percentage of People in the Labor Force in Alden?
78.1% of People are in the Labor Force in Alden.
What is the Unemployment Rate in Alden?
Unemployment Rate in Alden is 7.8%.