Zip Codes with the Highest Percentage of Population Employed in Health Diagnosing & Treating in Milford, MI
RELATED REPORTS & OPTIONS
Health Diagnosing & Treating
Milford
Compare Zip Codes
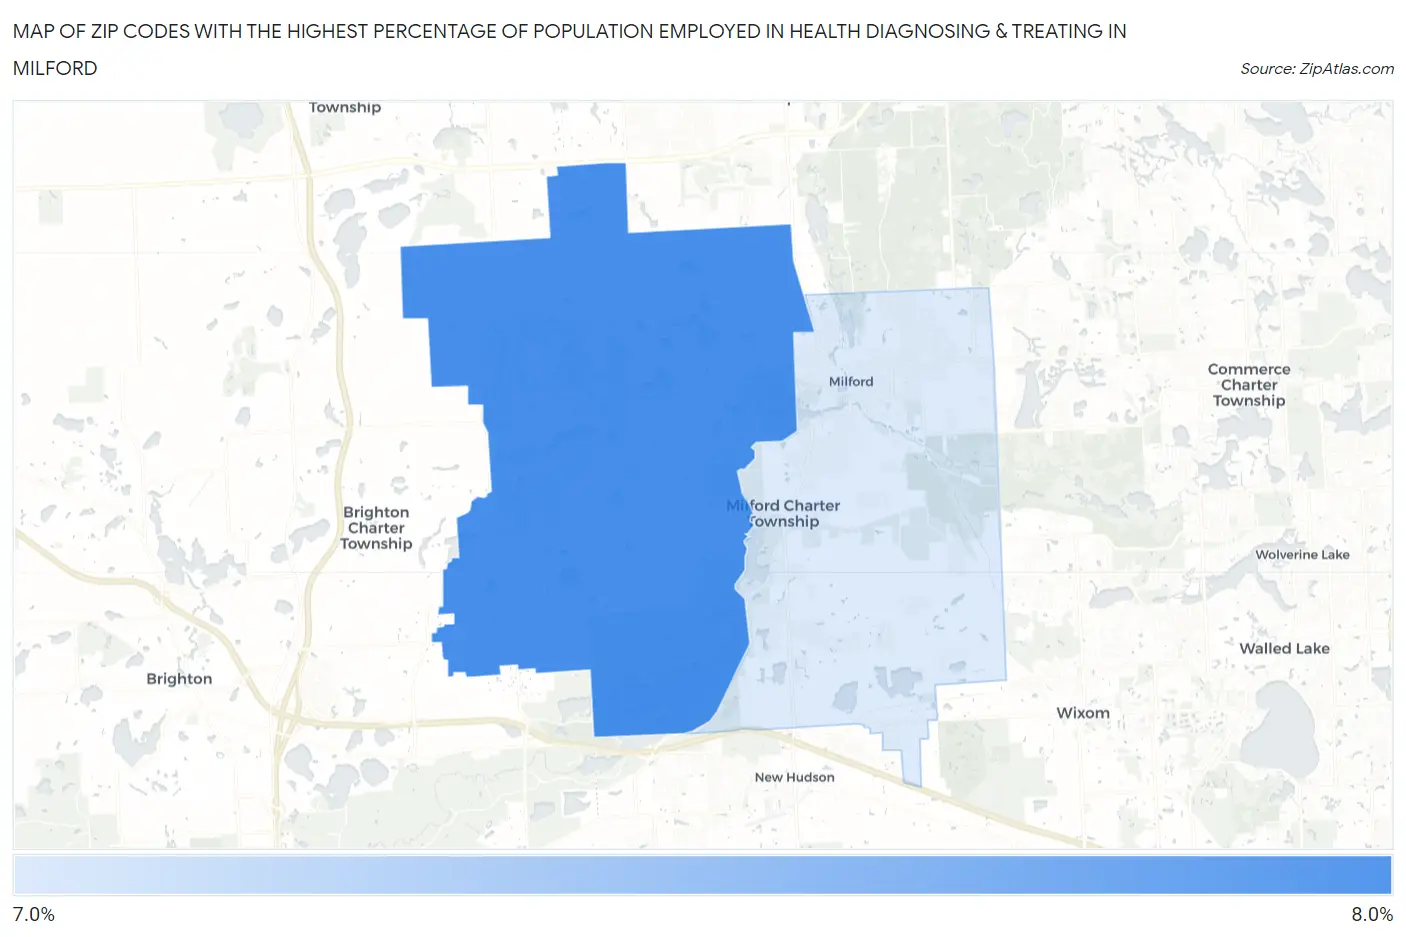
Map of Zip Codes with the Highest Percentage of Population Employed in Health Diagnosing & Treating in Milford
7.0%
7.5%
Zip Codes with the Highest Percentage of Population Employed in Health Diagnosing & Treating in Milford, MI
| Zip Code | % Employed | vs State | vs National | |
| 1. | 48380 | 7.5% | 6.6%(+0.869)#263 | 6.2%(+1.27)#8,764 |
| 2. | 48381 | 7.0% | 6.6%(+0.390)#320 | 6.2%(+0.791)#10,245 |
1
Common Questions
What are the Top Zip Codes with the Highest Percentage of Population Employed in Health Diagnosing & Treating in Milford, MI?
Top Zip Codes with the Highest Percentage of Population Employed in Health Diagnosing & Treating in Milford, MI are:
What zip code has the Highest Percentage of Population Employed in Health Diagnosing & Treating in Milford, MI?
48380 has the Highest Percentage of Population Employed in Health Diagnosing & Treating in Milford, MI with 7.5%.
What is the Percentage of Population Employed in Health Diagnosing & Treating in Milford, MI?
Percentage of Population Employed in Health Diagnosing & Treating in Milford is 7.3%.
What is the Percentage of Population Employed in Health Diagnosing & Treating in Michigan?
Percentage of Population Employed in Health Diagnosing & Treating in Michigan is 6.6%.
What is the Percentage of Population Employed in Health Diagnosing & Treating in the United States?
Percentage of Population Employed in Health Diagnosing & Treating in the United States is 6.2%.