Zip Codes with the Highest Percentage of Population Employed in Health Diagnosing & Treating in Traverse City, MI
RELATED REPORTS & OPTIONS
Health Diagnosing & Treating
Traverse City
Compare Zip Codes
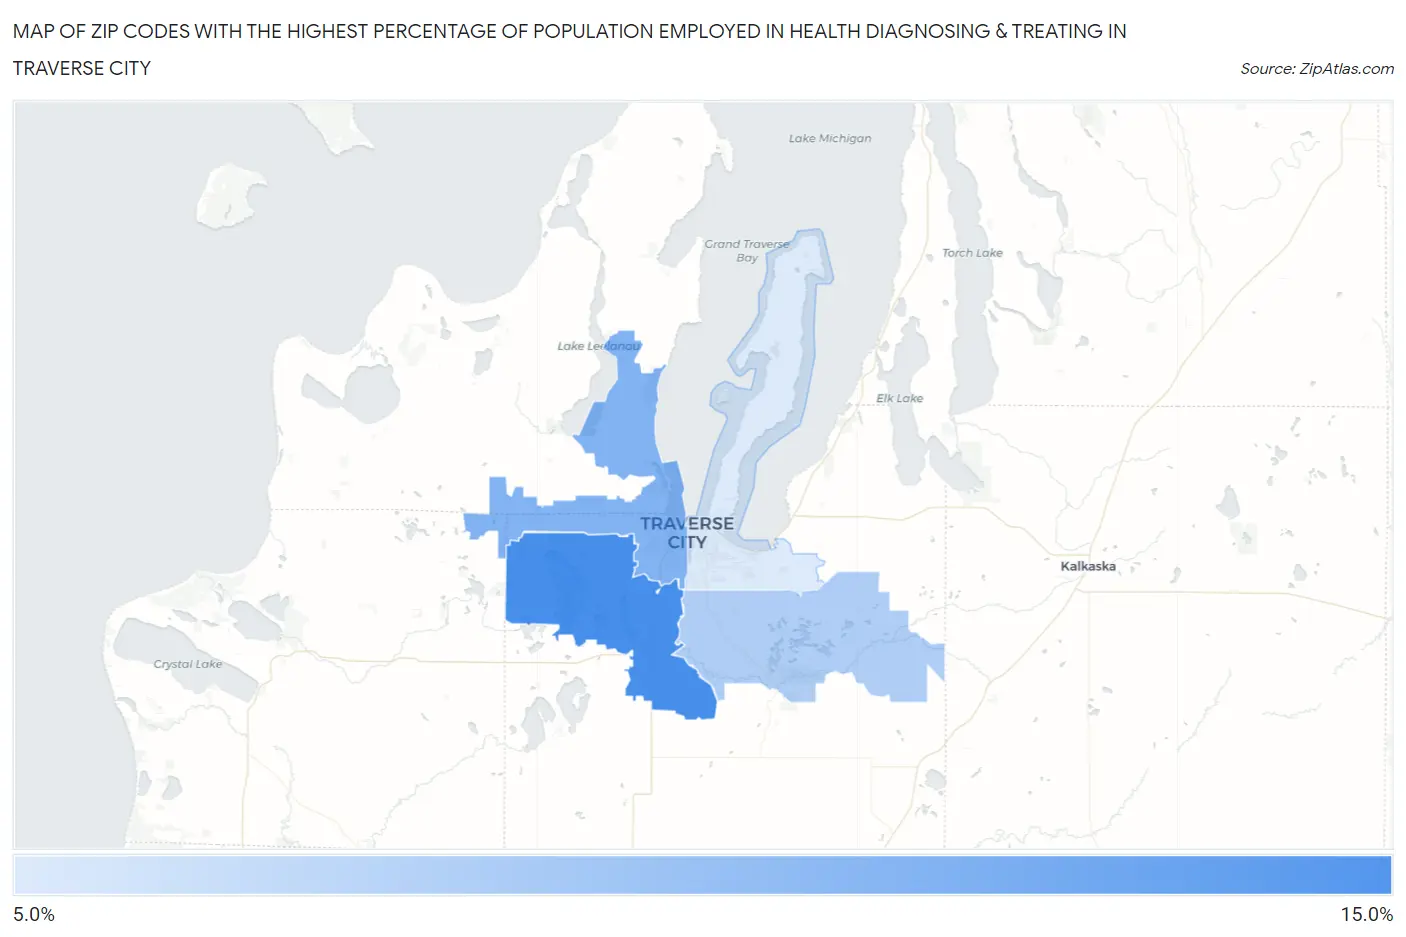
Map of Zip Codes with the Highest Percentage of Population Employed in Health Diagnosing & Treating in Traverse City
7.2%
11.2%
Zip Codes with the Highest Percentage of Population Employed in Health Diagnosing & Treating in Traverse City, MI
| Zip Code | % Employed | vs State | vs National | |
| 1. | 49685 | 11.2% | 6.6%(+4.55)#55 | 6.2%(+4.95)#2,743 |
| 2. | 49684 | 9.7% | 6.6%(+3.02)#100 | 6.2%(+3.43)#4,294 |
| 3. | 49696 | 8.4% | 6.6%(+1.79)#172 | 6.2%(+2.19)#6,454 |
| 4. | 49686 | 7.2% | 6.6%(+0.557)#299 | 6.2%(+0.958)#9,704 |
1
Common Questions
What are the Top 3 Zip Codes with the Highest Percentage of Population Employed in Health Diagnosing & Treating in Traverse City, MI?
Top 3 Zip Codes with the Highest Percentage of Population Employed in Health Diagnosing & Treating in Traverse City, MI are:
What zip code has the Highest Percentage of Population Employed in Health Diagnosing & Treating in Traverse City, MI?
49685 has the Highest Percentage of Population Employed in Health Diagnosing & Treating in Traverse City, MI with 11.2%.
What is the Percentage of Population Employed in Health Diagnosing & Treating in Traverse City, MI?
Percentage of Population Employed in Health Diagnosing & Treating in Traverse City is 7.4%.
What is the Percentage of Population Employed in Health Diagnosing & Treating in Michigan?
Percentage of Population Employed in Health Diagnosing & Treating in Michigan is 6.6%.
What is the Percentage of Population Employed in Health Diagnosing & Treating in the United States?
Percentage of Population Employed in Health Diagnosing & Treating in the United States is 6.2%.