Zip Codes with the Highest Percentage of Population Employed in Health Diagnosing & Treating in New Haven, MI
RELATED REPORTS & OPTIONS
Health Diagnosing & Treating
New Haven
Compare Zip Codes
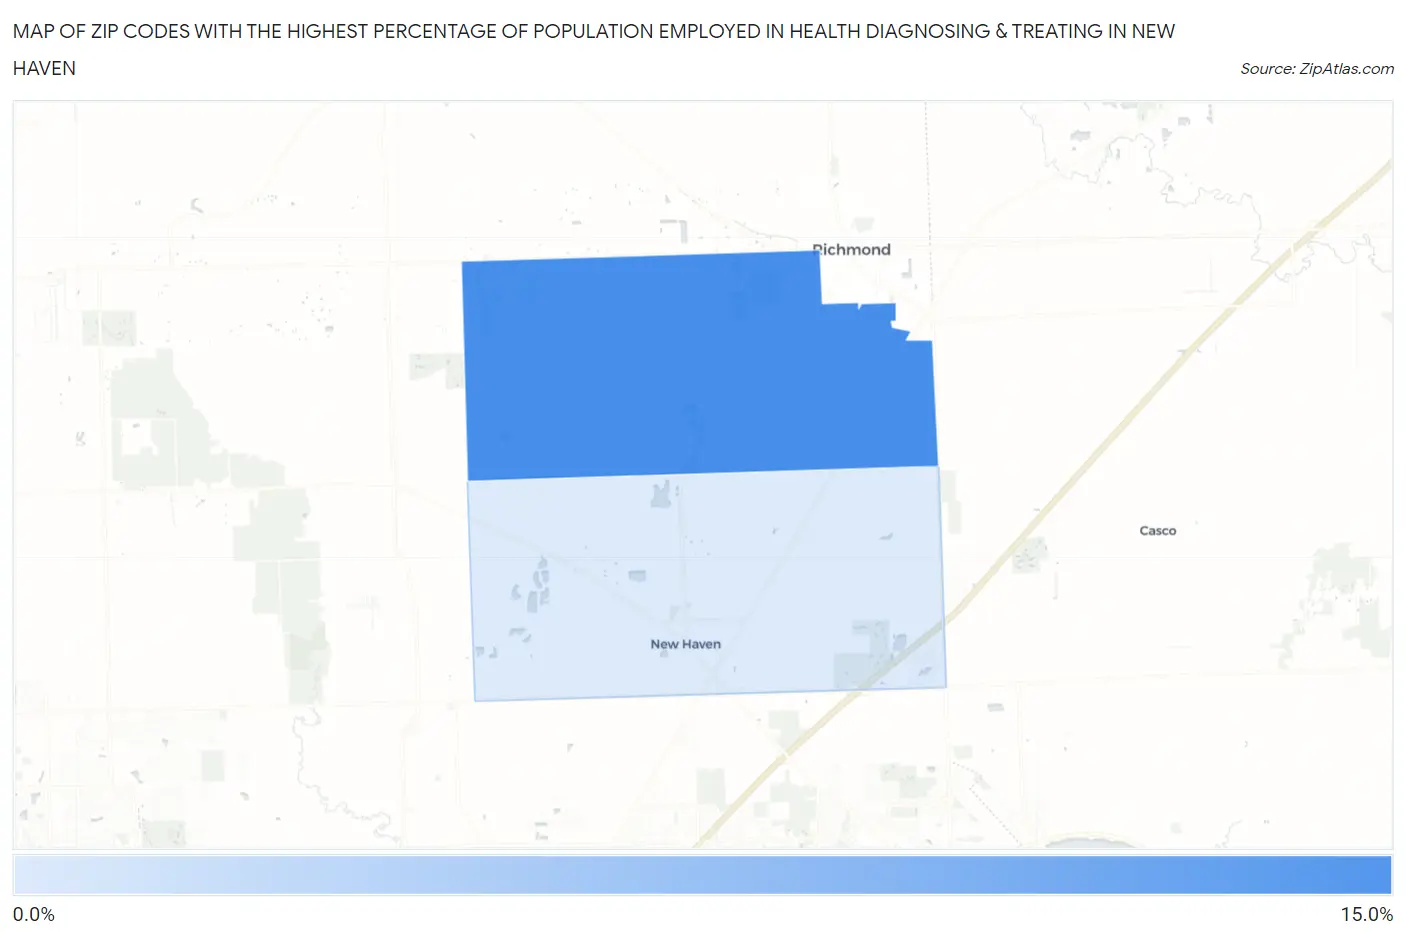
Map of Zip Codes with the Highest Percentage of Population Employed in Health Diagnosing & Treating in New Haven
2.0%
12.0%
Zip Codes with the Highest Percentage of Population Employed in Health Diagnosing & Treating in New Haven, MI
| Zip Code | % Employed | vs State | vs National | |
| 1. | 48050 | 12.0% | 6.6%(+5.32)#41 | 6.2%(+5.72)#2,238 |
| 2. | 48048 | 2.0% | 6.6%(-4.64)#884 | 6.2%(-4.24)#26,449 |
1
Common Questions
What are the Top Zip Codes with the Highest Percentage of Population Employed in Health Diagnosing & Treating in New Haven, MI?
Top Zip Codes with the Highest Percentage of Population Employed in Health Diagnosing & Treating in New Haven, MI are:
What zip code has the Highest Percentage of Population Employed in Health Diagnosing & Treating in New Haven, MI?
48050 has the Highest Percentage of Population Employed in Health Diagnosing & Treating in New Haven, MI with 12.0%.
What is the Percentage of Population Employed in Health Diagnosing & Treating in New Haven, MI?
Percentage of Population Employed in Health Diagnosing & Treating in New Haven is 2.2%.
What is the Percentage of Population Employed in Health Diagnosing & Treating in Michigan?
Percentage of Population Employed in Health Diagnosing & Treating in Michigan is 6.6%.
What is the Percentage of Population Employed in Health Diagnosing & Treating in the United States?
Percentage of Population Employed in Health Diagnosing & Treating in the United States is 6.2%.