Zip Codes with the Highest Percentage of Population Employed in Health Diagnosing & Treating in Clinton Township, MI
RELATED REPORTS & OPTIONS
Health Diagnosing & Treating
Clinton Township
Compare Zip Codes
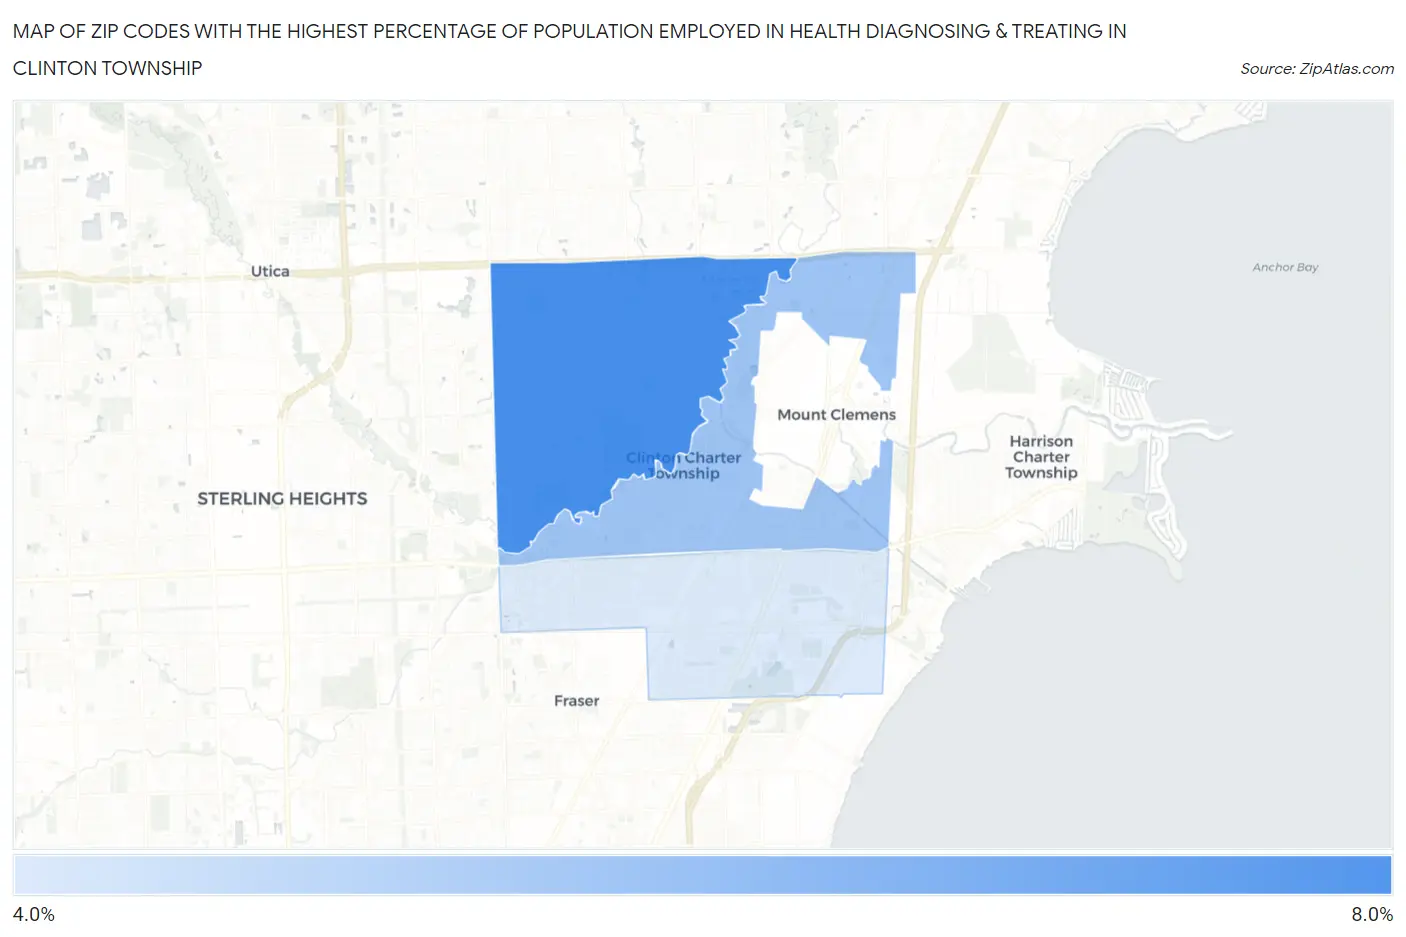
Map of Zip Codes with the Highest Percentage of Population Employed in Health Diagnosing & Treating in Clinton Township
4.8%
7.2%
Zip Codes with the Highest Percentage of Population Employed in Health Diagnosing & Treating in Clinton Township, MI
| Zip Code | % Employed | vs State | vs National | |
| 1. | 48038 | 7.2% | 6.6%(+0.517)#304 | 6.2%(+0.918)#9,830 |
| 2. | 48036 | 5.8% | 6.6%(-0.842)#467 | 6.2%(-0.441)#14,598 |
| 3. | 48035 | 4.8% | 6.6%(-1.80)#612 | 6.2%(-1.40)#18,327 |
1
Common Questions
What are the Top Zip Codes with the Highest Percentage of Population Employed in Health Diagnosing & Treating in Clinton Township, MI?
Top Zip Codes with the Highest Percentage of Population Employed in Health Diagnosing & Treating in Clinton Township, MI are:
What zip code has the Highest Percentage of Population Employed in Health Diagnosing & Treating in Clinton Township, MI?
48038 has the Highest Percentage of Population Employed in Health Diagnosing & Treating in Clinton Township, MI with 7.2%.
What is the Percentage of Population Employed in Health Diagnosing & Treating in Michigan?
Percentage of Population Employed in Health Diagnosing & Treating in Michigan is 6.6%.
What is the Percentage of Population Employed in Health Diagnosing & Treating in the United States?
Percentage of Population Employed in Health Diagnosing & Treating in the United States is 6.2%.