Zip Codes with the Highest Percentage of Population Employed in Computer & Mathematics in Farmington, MI
RELATED REPORTS & OPTIONS
Computer & Mathematics
Farmington
Compare Zip Codes
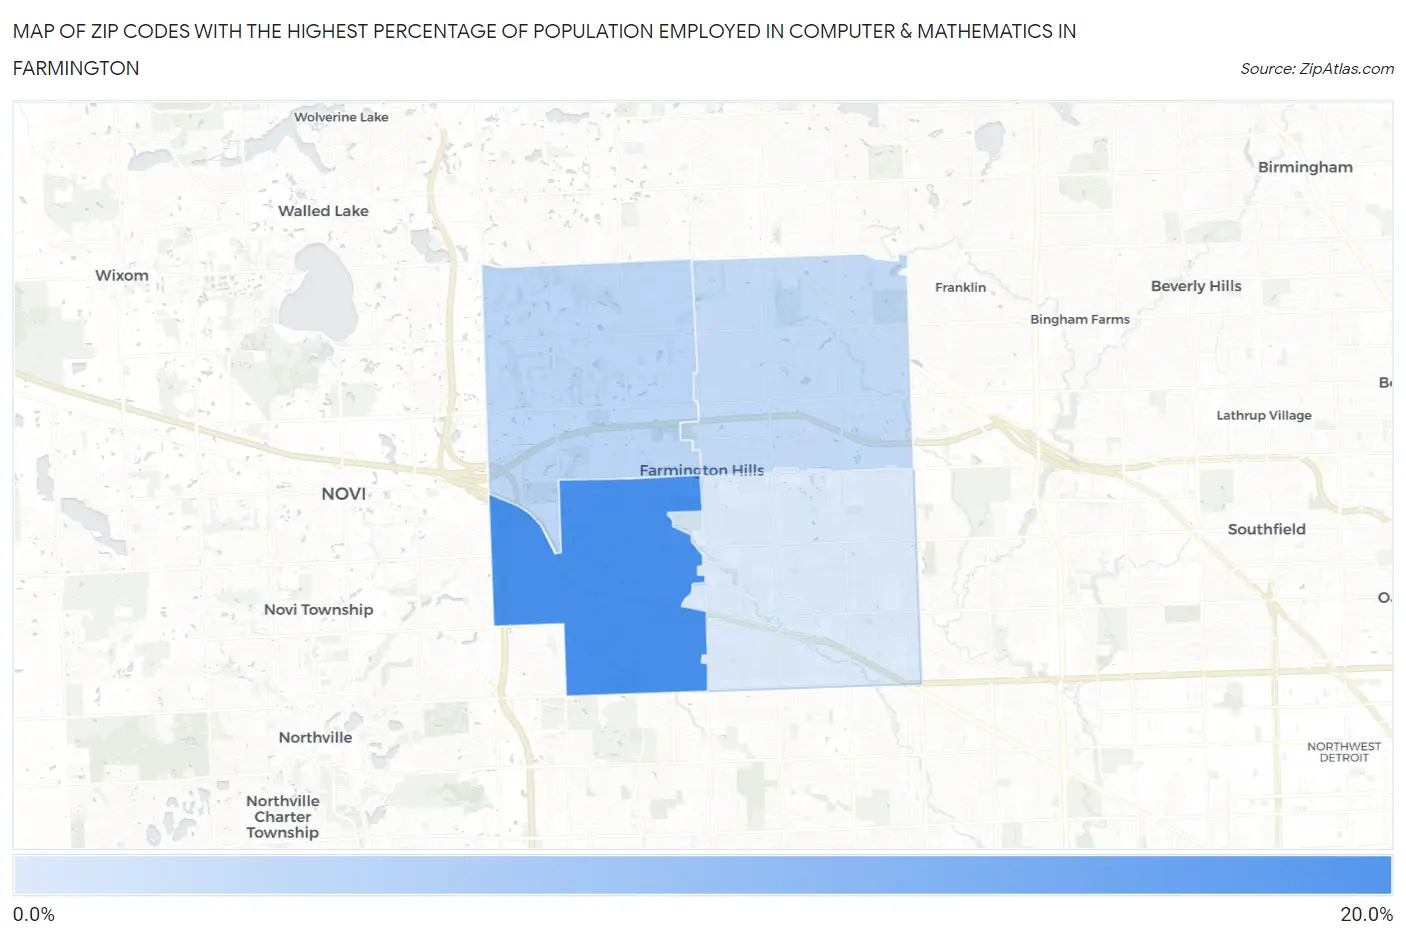
Map of Zip Codes with the Highest Percentage of Population Employed in Computer & Mathematics in Farmington
4.4%
16.4%
Zip Codes with the Highest Percentage of Population Employed in Computer & Mathematics in Farmington, MI
| Zip Code | % Employed | vs State | vs National | |
| 1. | 48335 | 16.4% | 2.9%(+13.5)#3 | 3.5%(+12.9)#202 |
| 2. | 48331 | 6.9% | 2.9%(+3.97)#31 | 3.5%(+3.37)#1,683 |
| 3. | 48334 | 6.4% | 2.9%(+3.51)#35 | 3.5%(+2.91)#1,980 |
| 4. | 48336 | 4.4% | 2.9%(+1.50)#92 | 3.5%(+0.898)#4,233 |
1
Common Questions
What are the Top 3 Zip Codes with the Highest Percentage of Population Employed in Computer & Mathematics in Farmington, MI?
Top 3 Zip Codes with the Highest Percentage of Population Employed in Computer & Mathematics in Farmington, MI are:
What zip code has the Highest Percentage of Population Employed in Computer & Mathematics in Farmington, MI?
48335 has the Highest Percentage of Population Employed in Computer & Mathematics in Farmington, MI with 16.4%.
What is the Percentage of Population Employed in Computer & Mathematics in Farmington, MI?
Percentage of Population Employed in Computer & Mathematics in Farmington is 13.4%.
What is the Percentage of Population Employed in Computer & Mathematics in Michigan?
Percentage of Population Employed in Computer & Mathematics in Michigan is 2.9%.
What is the Percentage of Population Employed in Computer & Mathematics in the United States?
Percentage of Population Employed in Computer & Mathematics in the United States is 3.5%.