Zip Codes with the Highest Percentage of Population Employed in Architecture & Engineering in Framingham, MA
RELATED REPORTS & OPTIONS
Architecture & Engineering
Framingham
Compare Zip Codes
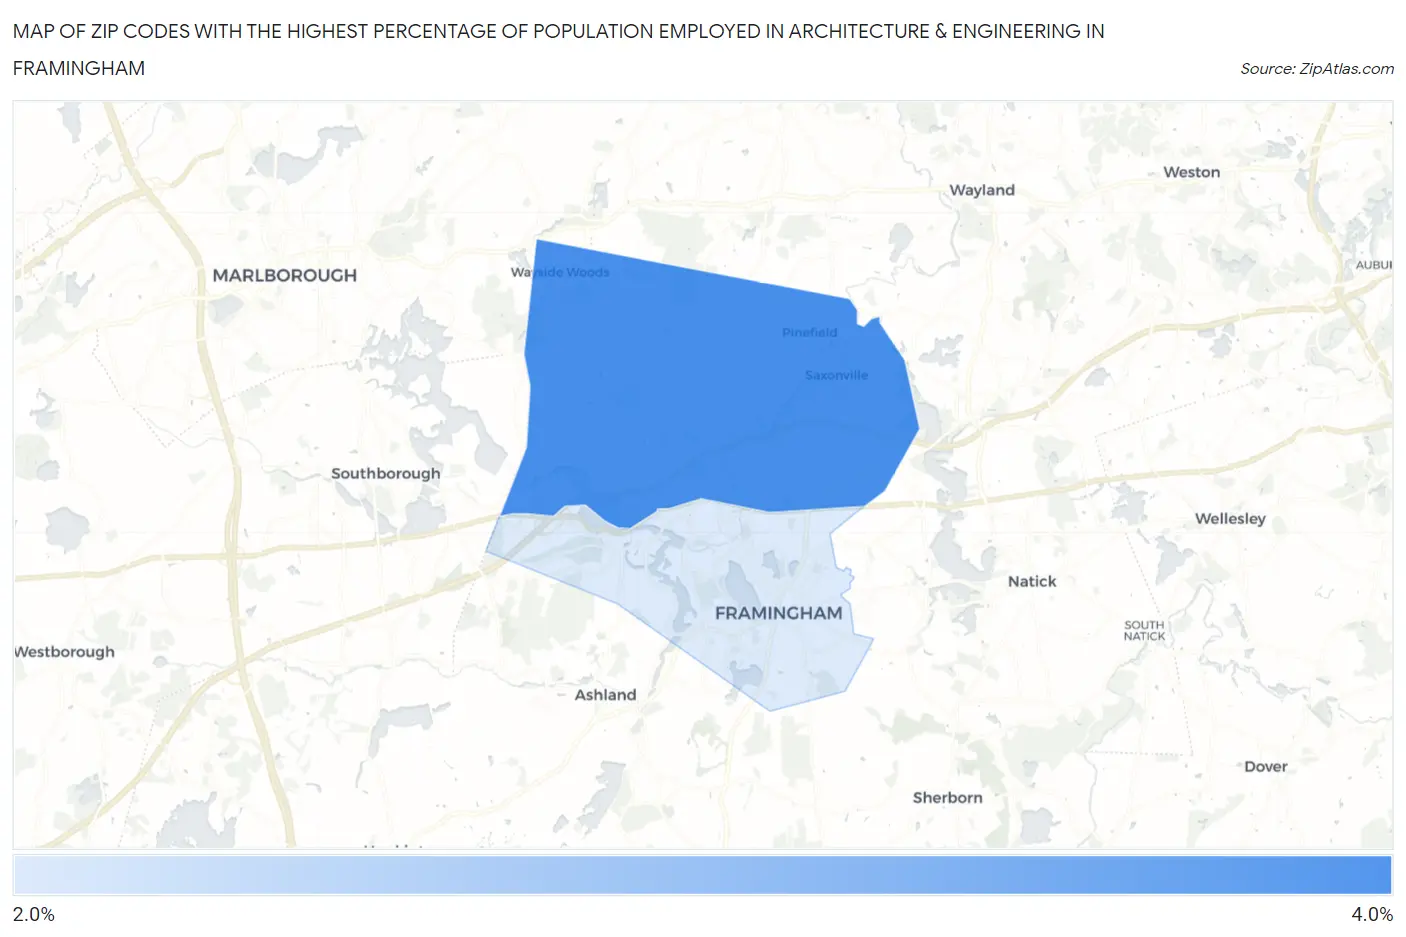
Map of Zip Codes with the Highest Percentage of Population Employed in Architecture & Engineering in Framingham
2.0%
3.3%
Zip Codes with the Highest Percentage of Population Employed in Architecture & Engineering in Framingham, MA
| Zip Code | % Employed | vs State | vs National | |
| 1. | 01701 | 3.3% | 2.7%(+0.628)#144 | 2.1%(+1.15)#4,191 |
| 2. | 01702 | 2.0% | 2.7%(-0.651)#286 | 2.1%(-0.127)#9,471 |
1
Common Questions
What are the Top Zip Codes with the Highest Percentage of Population Employed in Architecture & Engineering in Framingham, MA?
Top Zip Codes with the Highest Percentage of Population Employed in Architecture & Engineering in Framingham, MA are:
What zip code has the Highest Percentage of Population Employed in Architecture & Engineering in Framingham, MA?
01701 has the Highest Percentage of Population Employed in Architecture & Engineering in Framingham, MA with 3.3%.
What is the Percentage of Population Employed in Architecture & Engineering in Framingham, MA?
Percentage of Population Employed in Architecture & Engineering in Framingham is 2.6%.
What is the Percentage of Population Employed in Architecture & Engineering in Massachusetts?
Percentage of Population Employed in Architecture & Engineering in Massachusetts is 2.7%.
What is the Percentage of Population Employed in Architecture & Engineering in the United States?
Percentage of Population Employed in Architecture & Engineering in the United States is 2.1%.