Zip Codes with the Highest Percentage of Population Employed in Architecture & Engineering in Fall River, MA
RELATED REPORTS & OPTIONS
Architecture & Engineering
Fall River
Compare Zip Codes
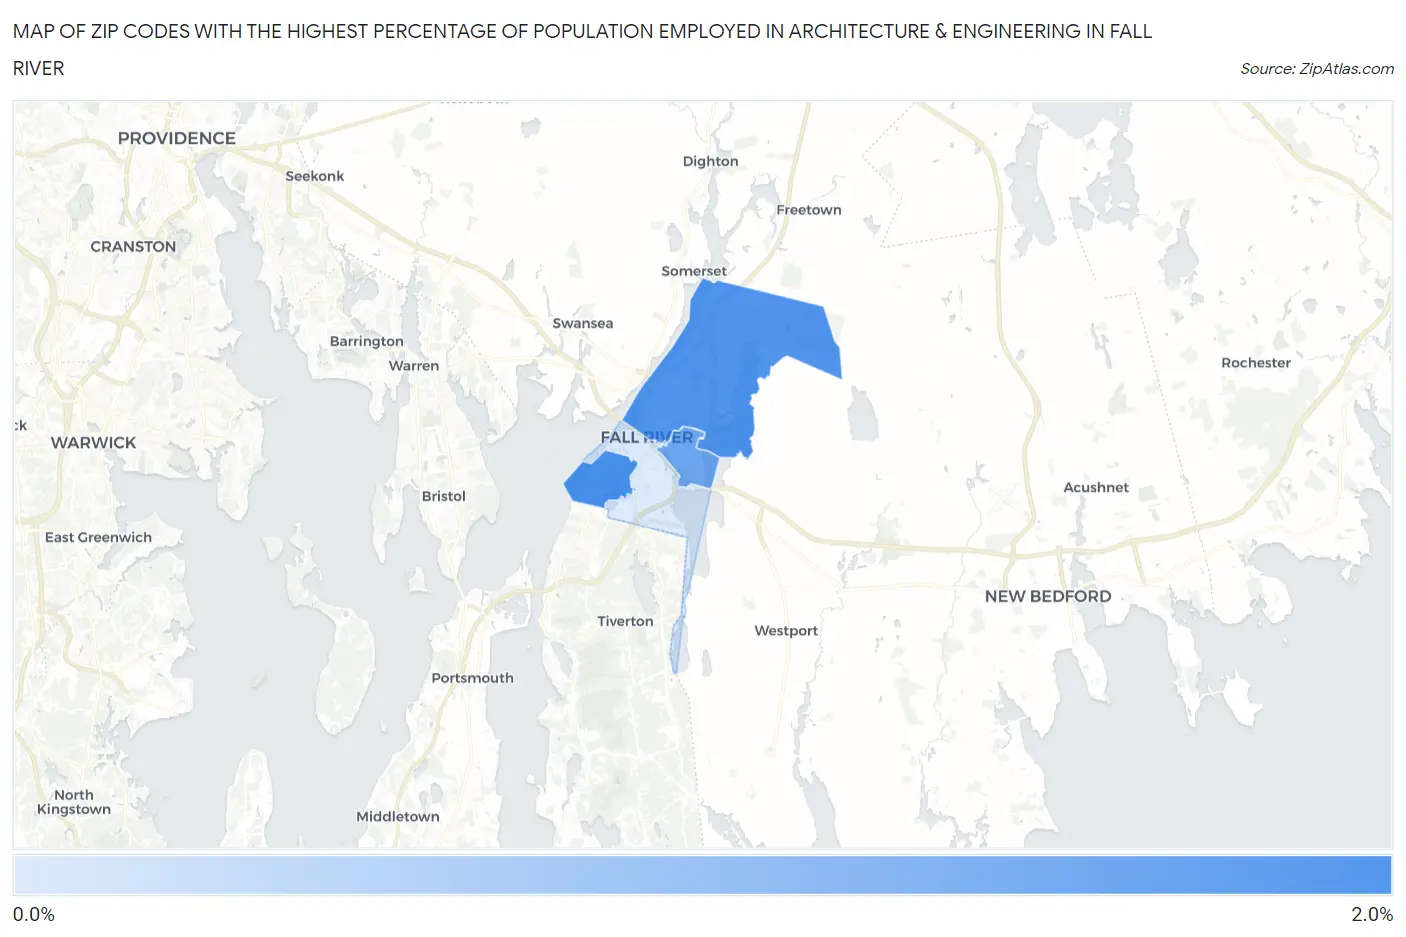
Map of Zip Codes with the Highest Percentage of Population Employed in Architecture & Engineering in Fall River
0.61%
1.9%
Zip Codes with the Highest Percentage of Population Employed in Architecture & Engineering in Fall River, MA
| Zip Code | % Employed | vs State | vs National | |
| 1. | 02724 | 1.9% | 2.7%(-0.739)#298 | 2.1%(-0.215)#10,023 |
| 2. | 02720 | 1.9% | 2.7%(-0.799)#309 | 2.1%(-0.275)#10,409 |
| 3. | 02723 | 1.6% | 2.7%(-1.06)#344 | 2.1%(-0.539)#12,120 |
| 4. | 02721 | 0.61% | 2.7%(-2.07)#448 | 2.1%(-1.54)#19,568 |
1
Common Questions
What are the Top 3 Zip Codes with the Highest Percentage of Population Employed in Architecture & Engineering in Fall River, MA?
Top 3 Zip Codes with the Highest Percentage of Population Employed in Architecture & Engineering in Fall River, MA are:
What zip code has the Highest Percentage of Population Employed in Architecture & Engineering in Fall River, MA?
02724 has the Highest Percentage of Population Employed in Architecture & Engineering in Fall River, MA with 1.9%.
What is the Percentage of Population Employed in Architecture & Engineering in Fall River, MA?
Percentage of Population Employed in Architecture & Engineering in Fall River is 1.5%.
What is the Percentage of Population Employed in Architecture & Engineering in Massachusetts?
Percentage of Population Employed in Architecture & Engineering in Massachusetts is 2.7%.
What is the Percentage of Population Employed in Architecture & Engineering in the United States?
Percentage of Population Employed in Architecture & Engineering in the United States is 2.1%.