Clarkson, KY Map & Demographics
Clarkson Map
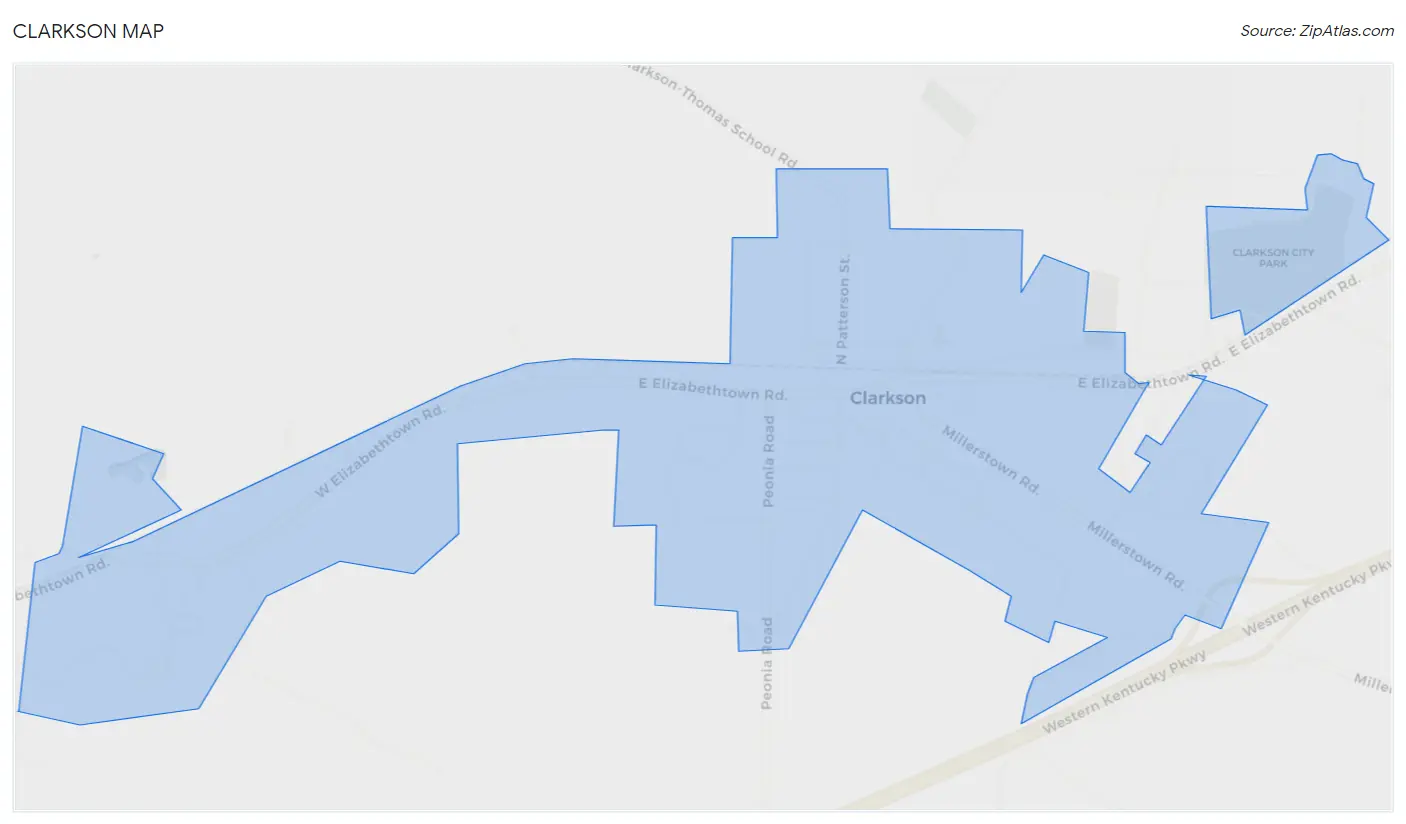
Clarkson Overview
$16,900
PER CAPITA INCOME
$29,500
AVG FAMILY INCOME
$21,250
AVG HOUSEHOLD INCOME
$16,288
FAMILY INCOME DEFICIT
0.57
INEQUALITY / GINI INDEX
1,218
TOTAL POPULATION
536
MALE POPULATION
682
FEMALE POPULATION
78.59
MALES / 100 FEMALES
127.24
FEMALES / 100 MALES
30.0
MEDIAN AGE
4.2
AVG FAMILY SIZE
3.1
AVG HOUSEHOLD SIZE
467
LABOR FORCE [ PEOPLE ]
61.0%
PERCENT IN LABOR FORCE
5.4%
UNEMPLOYMENT RATE
Clarkson Zip Codes
Clarkson Area Codes
Income in Clarkson
Income Overview in Clarkson
Per Capita Income in Clarkson is $16,900, while median incomes of families and households are $29,500 and $21,250 respectively.
| Characteristic | Number | Measure |
| Per Capita Income | 1,218 | $16,900 |
| Median Family Income | 246 | $29,500 |
| Mean Family Income | 246 | $58,839 |
| Median Household Income | 398 | $21,250 |
| Mean Household Income | 398 | $46,942 |
| Income Deficit | 246 | $16,288 |
| Wage / Income Gap (%) | 1,218 | 0.00% |
| Wage / Income Gap ($) | 1,218 | 100.00¢ per $1 |
| Gini / Inequality Index | 1,218 | 0.57 |
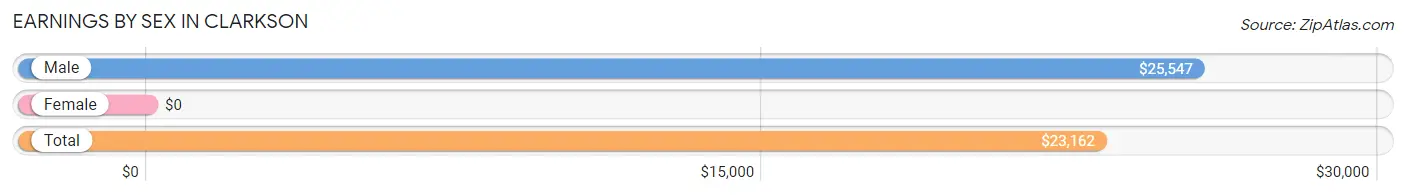
Earnings by Sex in Clarkson
| Sex | Number | Average Earnings |
| Male | 243 (52.0%) | $25,547 |
| Female | 224 (48.0%) | $0 |
| Total | 467 (100.0%) | $23,162 |
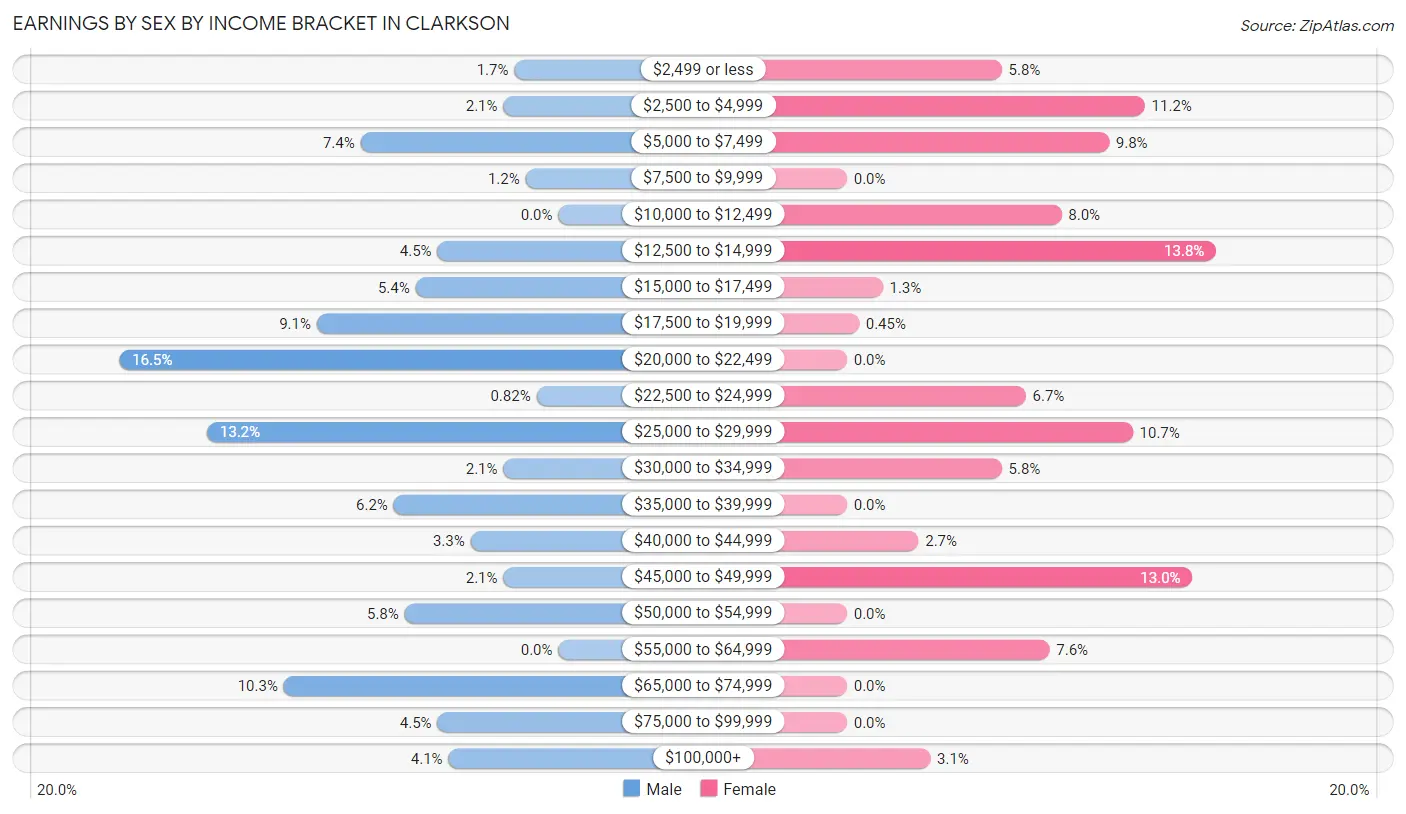
Earnings by Sex by Income Bracket in Clarkson
The most common earnings brackets in Clarkson are $20,000 to $22,499 for men (40 | 16.5%) and $12,500 to $14,999 for women (31 | 13.8%).
| Income | Male | Female |
| $2,499 or less | 4 (1.7%) | 13 (5.8%) |
| $2,500 to $4,999 | 5 (2.1%) | 25 (11.2%) |
| $5,000 to $7,499 | 18 (7.4%) | 22 (9.8%) |
| $7,500 to $9,999 | 3 (1.2%) | 0 (0.0%) |
| $10,000 to $12,499 | 0 (0.0%) | 18 (8.0%) |
| $12,500 to $14,999 | 11 (4.5%) | 31 (13.8%) |
| $15,000 to $17,499 | 13 (5.3%) | 3 (1.3%) |
| $17,500 to $19,999 | 22 (9.0%) | 1 (0.4%) |
| $20,000 to $22,499 | 40 (16.5%) | 0 (0.0%) |
| $22,500 to $24,999 | 2 (0.8%) | 15 (6.7%) |
| $25,000 to $29,999 | 32 (13.2%) | 24 (10.7%) |
| $30,000 to $34,999 | 5 (2.1%) | 13 (5.8%) |
| $35,000 to $39,999 | 15 (6.2%) | 0 (0.0%) |
| $40,000 to $44,999 | 8 (3.3%) | 6 (2.7%) |
| $45,000 to $49,999 | 5 (2.1%) | 29 (13.0%) |
| $50,000 to $54,999 | 14 (5.8%) | 0 (0.0%) |
| $55,000 to $64,999 | 0 (0.0%) | 17 (7.6%) |
| $65,000 to $74,999 | 25 (10.3%) | 0 (0.0%) |
| $75,000 to $99,999 | 11 (4.5%) | 0 (0.0%) |
| $100,000+ | 10 (4.1%) | 7 (3.1%) |
| Total | 243 (100.0%) | 224 (100.0%) |
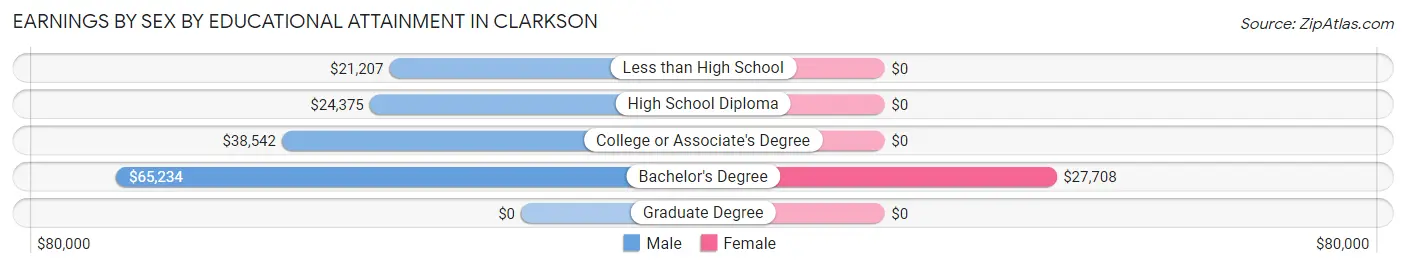
Earnings by Sex by Educational Attainment in Clarkson
| Educational Attainment | Male Income | Female Income |
| Less than High School | $21,207 | $0 |
| High School Diploma | $24,375 | $0 |
| College or Associate's Degree | $38,542 | $0 |
| Bachelor's Degree | $65,234 | $27,708 |
| Graduate Degree | - | - |
| Total | $25,625 | $0 |
Family Income in Clarkson
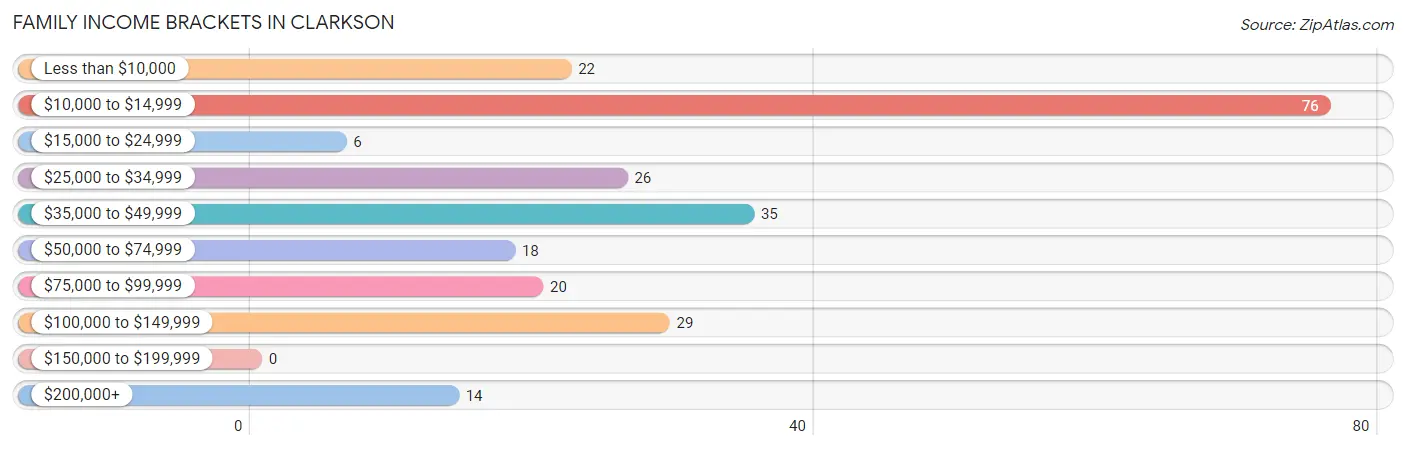
Family Income Brackets in Clarkson
According to the Clarkson family income data, there are 76 families falling into the $10,000 to $14,999 income range, which is the most common income bracket and makes up 30.9% of all families.
| Income Bracket | # Families | % Families |
| Less than $10,000 | 22 | 8.9% |
| $10,000 to $14,999 | 76 | 30.9% |
| $15,000 to $24,999 | 6 | 2.4% |
| $25,000 to $34,999 | 26 | 10.6% |
| $35,000 to $49,999 | 35 | 14.2% |
| $50,000 to $74,999 | 18 | 7.3% |
| $75,000 to $99,999 | 20 | 8.1% |
| $100,000 to $149,999 | 29 | 11.8% |
| $150,000 to $199,999 | 0 | 0.0% |
| $200,000+ | 14 | 5.7% |
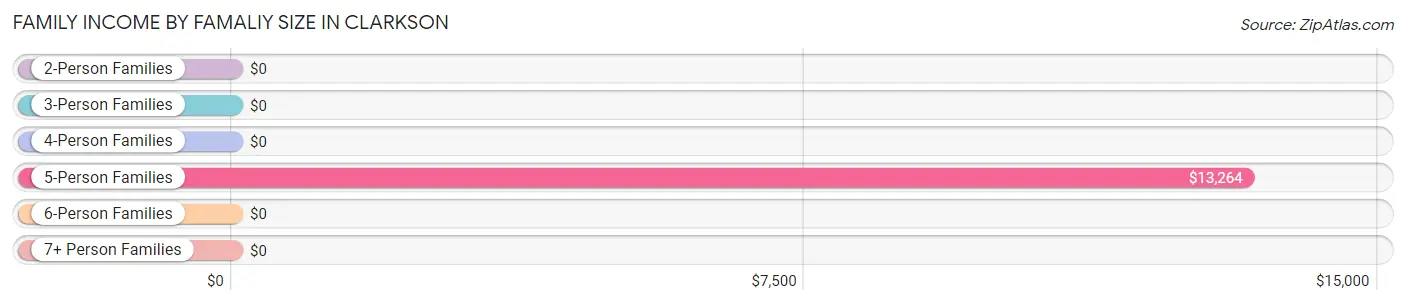
Family Income by Famaliy Size in Clarkson
5-person families (33 | 13.4%) account for the highest median family income in Clarkson with $13,264 per family, while 5-person families (33 | 13.4%) have the highest median income of $2,653 per family member.
| Income Bracket | # Families | Median Income |
| 2-Person Families | 85 (34.5%) | $0 |
| 3-Person Families | 51 (20.7%) | $0 |
| 4-Person Families | 69 (28.1%) | $0 |
| 5-Person Families | 33 (13.4%) | $13,264 |
| 6-Person Families | 8 (3.3%) | $0 |
| 7+ Person Families | 0 (0.0%) | $0 |
| Total | 246 (100.0%) | $29,500 |
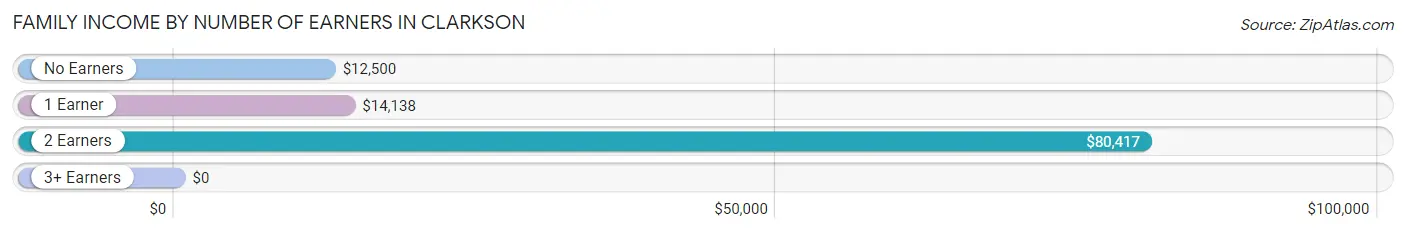
Family Income by Number of Earners in Clarkson
| Number of Earners | # Families | Median Income |
| No Earners | 36 (14.6%) | $12,500 |
| 1 Earner | 102 (41.5%) | $14,138 |
| 2 Earners | 93 (37.8%) | $80,417 |
| 3+ Earners | 15 (6.1%) | $0 |
| Total | 246 (100.0%) | $29,500 |
Household Income in Clarkson
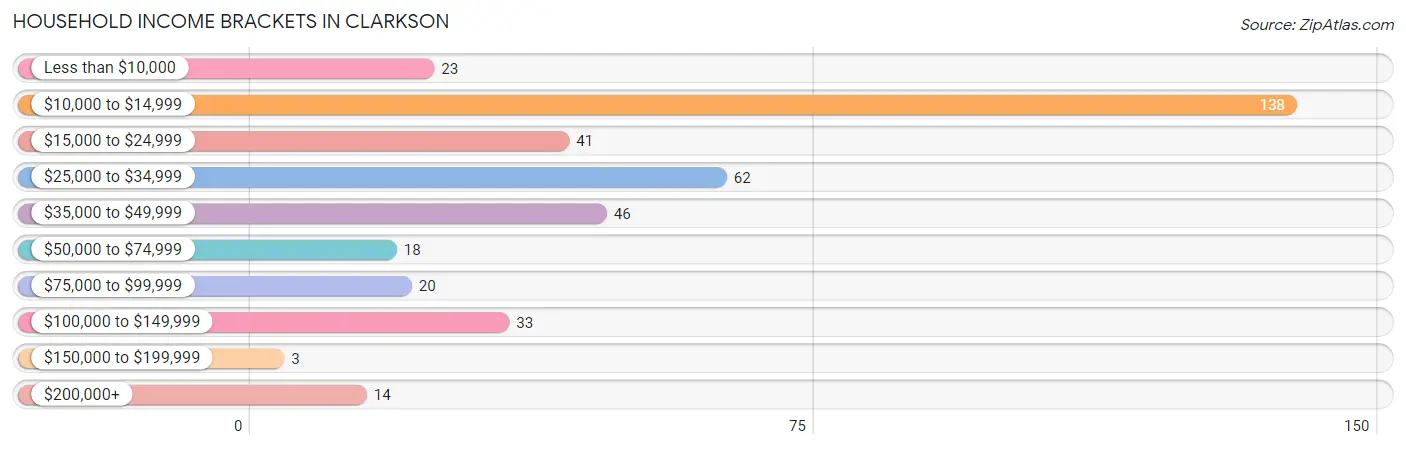
Household Income Brackets in Clarkson
With 138 households falling in the category, the $10,000 to $14,999 income range is the most frequent in Clarkson, accounting for 34.7% of all households. In contrast, only 3 households (0.7%) fall into the $150,000 to $199,999 income bracket, making it the least populous group.
| Income Bracket | # Households | % Households |
| Less than $10,000 | 23 | 5.8% |
| $10,000 to $14,999 | 138 | 34.7% |
| $15,000 to $24,999 | 41 | 10.3% |
| $25,000 to $34,999 | 62 | 15.6% |
| $35,000 to $49,999 | 46 | 11.6% |
| $50,000 to $74,999 | 18 | 4.5% |
| $75,000 to $99,999 | 20 | 5.0% |
| $100,000 to $149,999 | 33 | 8.3% |
| $150,000 to $199,999 | 3 | 0.8% |
| $200,000+ | 14 | 3.5% |
Household Income by Householder Age in Clarkson
The median household income in Clarkson is $21,250, with the highest median household income of $30,568 found in the 25 to 44 years age bracket for the primary householder. A total of 185 households (46.5%) fall into this category. Meanwhile, the 15 to 24 years age bracket for the primary householder has the lowest median household income of $0, with 18 households (4.5%) in this group.
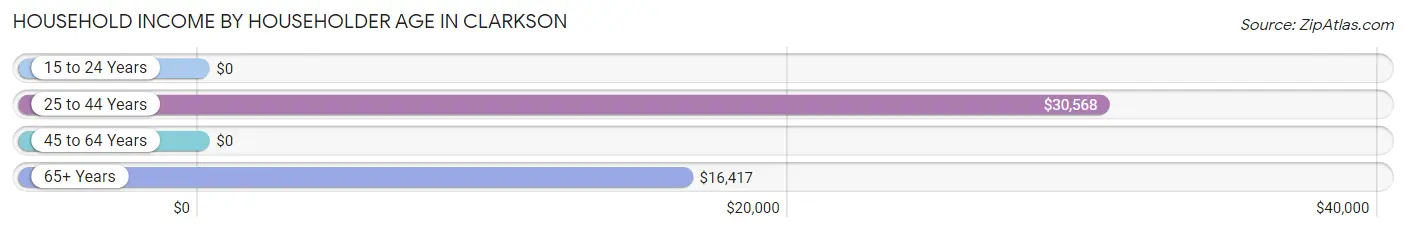
| Income Bracket | # Households | Median Income |
| 15 to 24 Years | 18 (4.5%) | $0 |
| 25 to 44 Years | 185 (46.5%) | $30,568 |
| 45 to 64 Years | 76 (19.1%) | $0 |
| 65+ Years | 119 (29.9%) | $16,417 |
| Total | 398 (100.0%) | $21,250 |
Poverty in Clarkson
Income Below Poverty by Sex and Age in Clarkson
With 30.4% poverty level for males and 46.8% for females among the residents of Clarkson, 15 year old males and 5 year old females are the most vulnerable to poverty, with 4 males (100.0%) and 16 females (100.0%) in their respective age groups living below the poverty level.
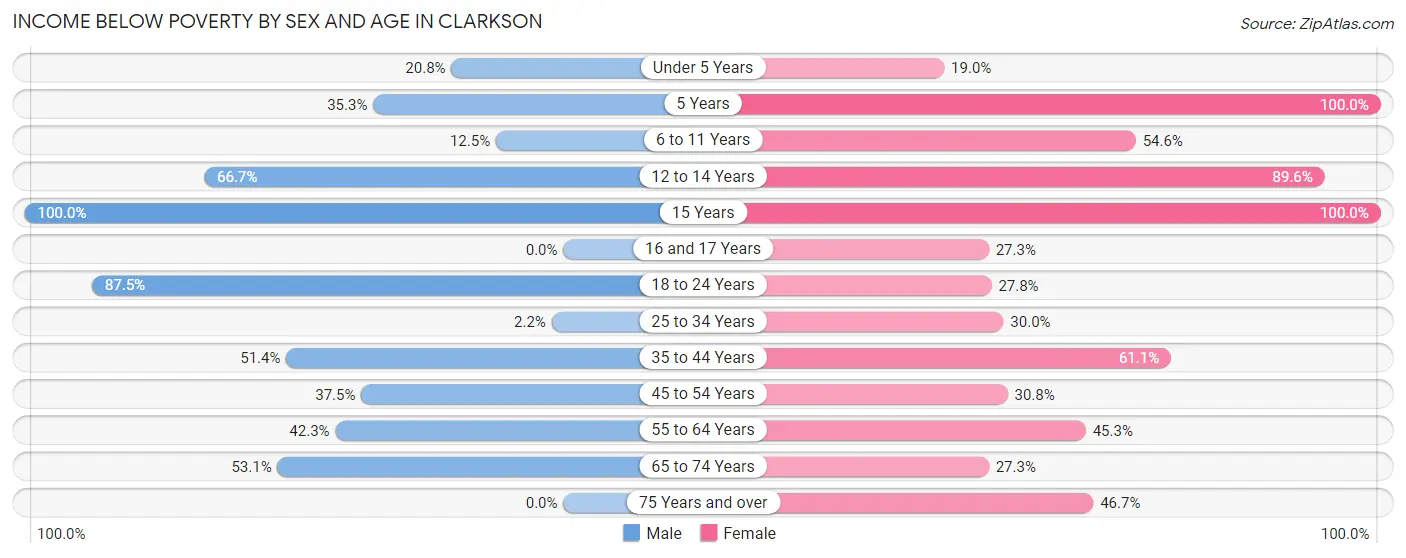
| Age Bracket | Male | Female |
| Under 5 Years | 16 (20.8%) | 19 (19.0%) |
| 5 Years | 6 (35.3%) | 16 (100.0%) |
| 6 to 11 Years | 3 (12.5%) | 54 (54.5%) |
| 12 to 14 Years | 18 (66.7%) | 69 (89.6%) |
| 15 Years | 4 (100.0%) | 3 (100.0%) |
| 16 and 17 Years | 0 (0.0%) | 6 (27.3%) |
| 18 to 24 Years | 7 (87.5%) | 5 (27.8%) |
| 25 to 34 Years | 3 (2.2%) | 33 (30.0%) |
| 35 to 44 Years | 54 (51.4%) | 44 (61.1%) |
| 45 to 54 Years | 12 (37.5%) | 8 (30.8%) |
| 55 to 64 Years | 11 (42.3%) | 24 (45.3%) |
| 65 to 74 Years | 26 (53.1%) | 3 (27.3%) |
| 75 Years and over | 0 (0.0%) | 35 (46.7%) |
| Total | 160 (30.4%) | 319 (46.8%) |
Income Above Poverty by Sex and Age in Clarkson
According to the poverty statistics in Clarkson, males aged 16 and 17 years and females aged under 5 years are the age groups that are most secure financially, with 100.0% of males and 81.0% of females in these age groups living above the poverty line.
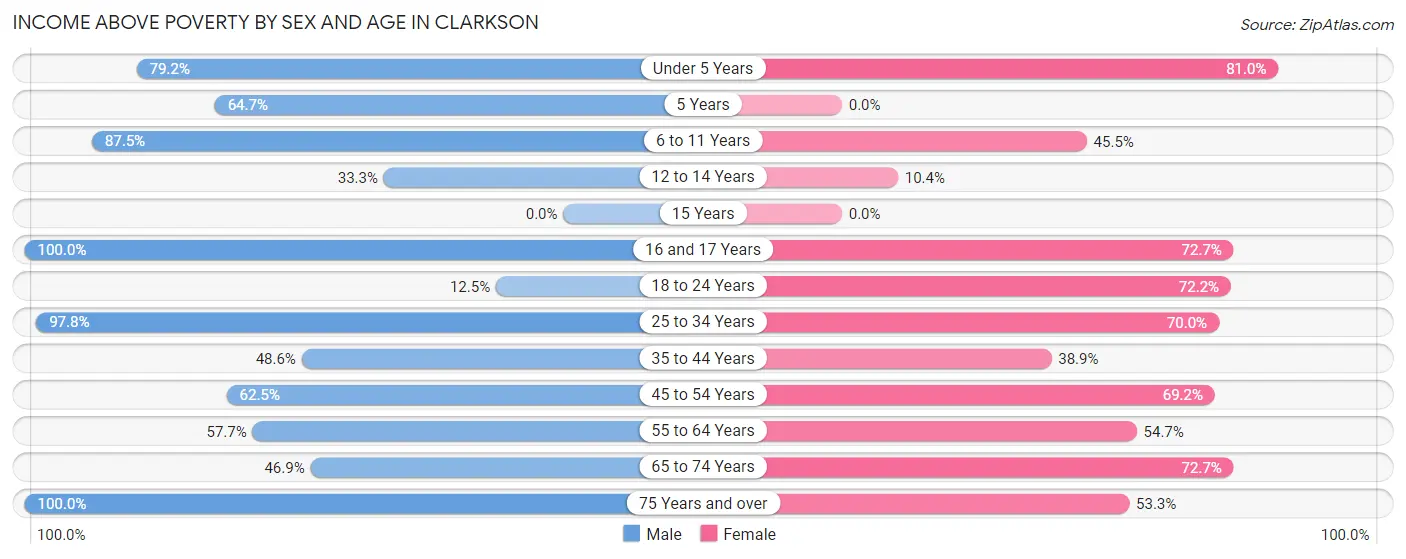
| Age Bracket | Male | Female |
| Under 5 Years | 61 (79.2%) | 81 (81.0%) |
| 5 Years | 11 (64.7%) | 0 (0.0%) |
| 6 to 11 Years | 21 (87.5%) | 45 (45.5%) |
| 12 to 14 Years | 9 (33.3%) | 8 (10.4%) |
| 15 Years | 0 (0.0%) | 0 (0.0%) |
| 16 and 17 Years | 3 (100.0%) | 16 (72.7%) |
| 18 to 24 Years | 1 (12.5%) | 13 (72.2%) |
| 25 to 34 Years | 135 (97.8%) | 77 (70.0%) |
| 35 to 44 Years | 51 (48.6%) | 28 (38.9%) |
| 45 to 54 Years | 20 (62.5%) | 18 (69.2%) |
| 55 to 64 Years | 15 (57.7%) | 29 (54.7%) |
| 65 to 74 Years | 23 (46.9%) | 8 (72.7%) |
| 75 Years and over | 17 (100.0%) | 40 (53.3%) |
| Total | 367 (69.6%) | 363 (53.2%) |
Income Below Poverty Among Married-Couple Families in Clarkson
The poverty statistics for married-couple families in Clarkson show that 21.2% or 32 of the total 151 families live below the poverty line. Families with 3 or 4 children have the highest poverty rate of 66.7%, comprising of 8 families. On the other hand, families with no children have the lowest poverty rate of 13.7%, which includes 10 families.
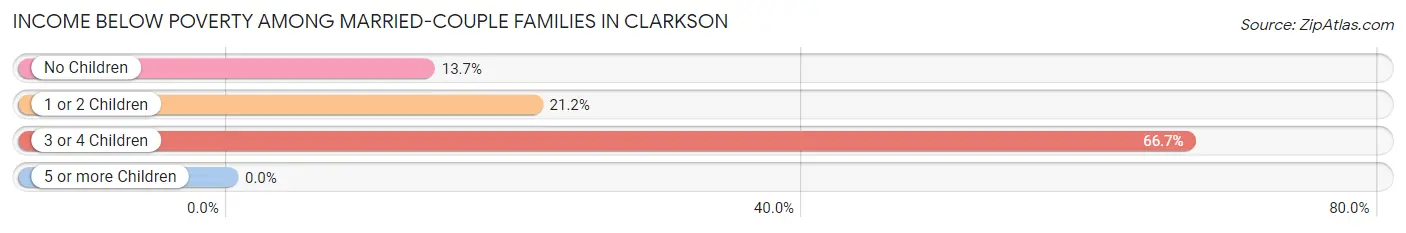
| Children | Above Poverty | Below Poverty |
| No Children | 63 (86.3%) | 10 (13.7%) |
| 1 or 2 Children | 52 (78.8%) | 14 (21.2%) |
| 3 or 4 Children | 4 (33.3%) | 8 (66.7%) |
| 5 or more Children | 0 (0.0%) | 0 (0.0%) |
| Total | 119 (78.8%) | 32 (21.2%) |
Income Below Poverty Among Single-Parent Households in Clarkson
According to the poverty data in Clarkson, 61.1% or 11 single-father households and 77.9% or 60 single-mother households are living below the poverty line. Among single-father households, those with 1 or 2 children have the highest poverty rate, with 6 households (66.7%) experiencing poverty. Likewise, among single-mother households, those with 3 or 4 children have the highest poverty rate, with 29 households (100.0%) falling below the poverty line.
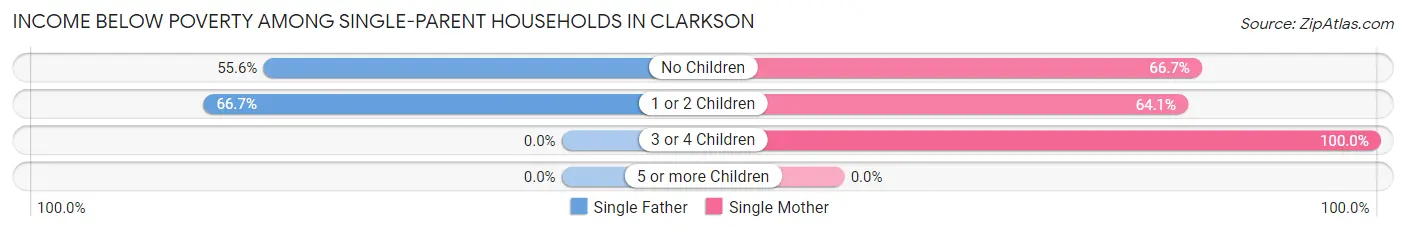
| Children | Single Father | Single Mother |
| No Children | 5 (55.6%) | 6 (66.7%) |
| 1 or 2 Children | 6 (66.7%) | 25 (64.1%) |
| 3 or 4 Children | 0 (0.0%) | 29 (100.0%) |
| 5 or more Children | 0 (0.0%) | 0 (0.0%) |
| Total | 11 (61.1%) | 60 (77.9%) |
Income Below Poverty Among Married-Couple vs Single-Parent Households in Clarkson
The poverty data for Clarkson shows that 32 of the married-couple family households (21.2%) and 71 of the single-parent households (74.7%) are living below the poverty level. Within the married-couple family households, those with 3 or 4 children have the highest poverty rate, with 8 households (66.7%) falling below the poverty line. Among the single-parent households, those with 3 or 4 children have the highest poverty rate, with 29 household (100.0%) living below poverty.
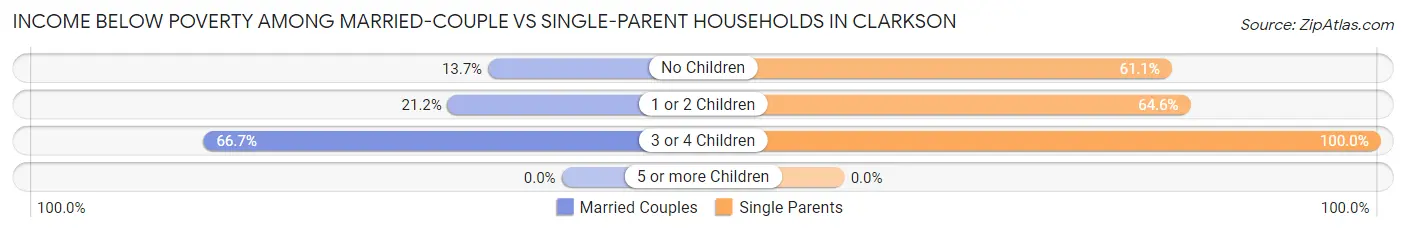
| Children | Married-Couple Families | Single-Parent Households |
| No Children | 10 (13.7%) | 11 (61.1%) |
| 1 or 2 Children | 14 (21.2%) | 31 (64.6%) |
| 3 or 4 Children | 8 (66.7%) | 29 (100.0%) |
| 5 or more Children | 0 (0.0%) | 0 (0.0%) |
| Total | 32 (21.2%) | 71 (74.7%) |
Race in Clarkson
The most populous races in Clarkson are White / Caucasian (1,122 | 92.1%), Asian (76 | 6.2%), and Hispanic or Latino (62 | 5.1%).
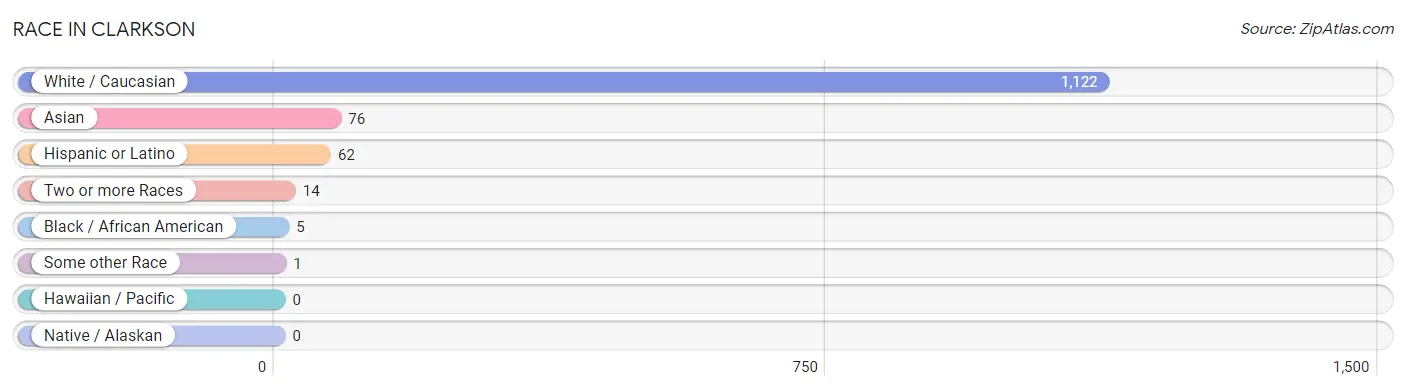
| Race | # Population | % Population |
| Asian | 76 | 6.2% |
| Black / African American | 5 | 0.4% |
| Hawaiian / Pacific | 0 | 0.0% |
| Hispanic or Latino | 62 | 5.1% |
| Native / Alaskan | 0 | 0.0% |
| White / Caucasian | 1,122 | 92.1% |
| Two or more Races | 14 | 1.1% |
| Some other Race | 1 | 0.1% |
| Total | 1,218 | 100.0% |
Ancestry in Clarkson
The most populous ancestries reported in Clarkson are American (205 | 16.8%), Irish (196 | 16.1%), German (124 | 10.2%), English (62 | 5.1%), and Mexican (61 | 5.0%), together accounting for 53.2% of all Clarkson residents.
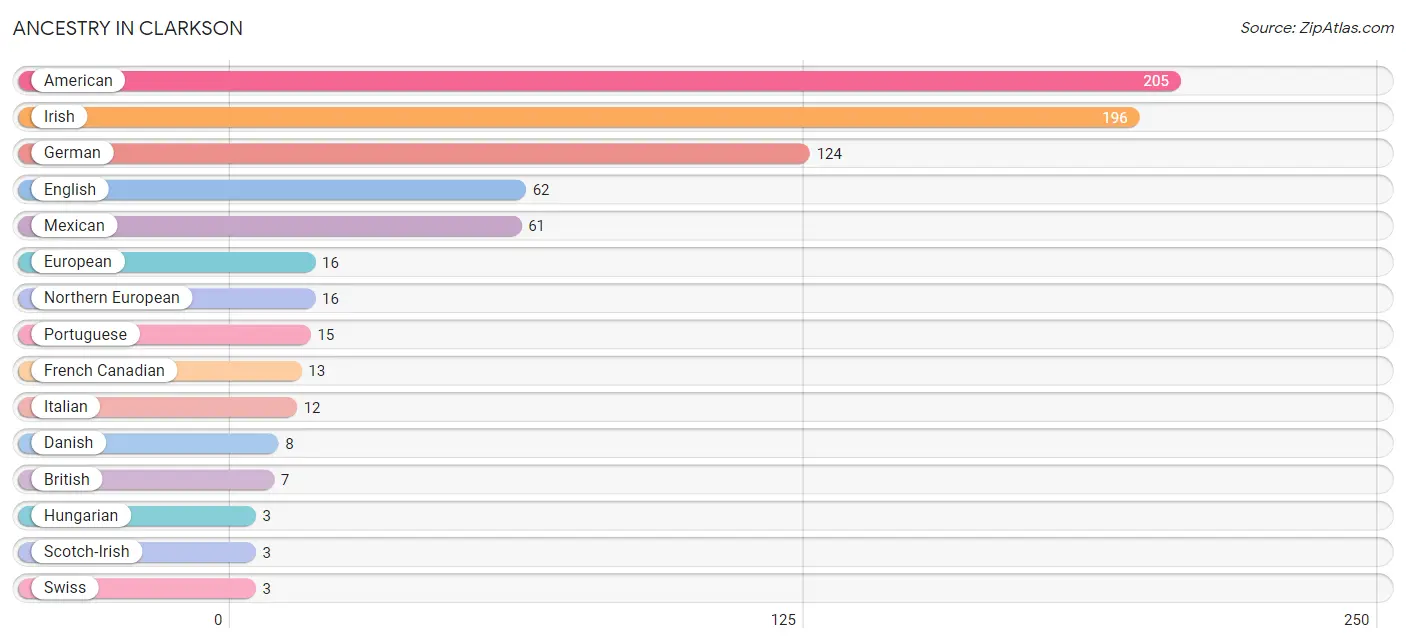
| Ancestry | # Population | % Population |
| American | 205 | 16.8% |
| British | 7 | 0.6% |
| Danish | 8 | 0.7% |
| English | 62 | 5.1% |
| European | 16 | 1.3% |
| French Canadian | 13 | 1.1% |
| German | 124 | 10.2% |
| Hungarian | 3 | 0.3% |
| Irish | 196 | 16.1% |
| Italian | 12 | 1.0% |
| Mexican | 61 | 5.0% |
| Northern European | 16 | 1.3% |
| Portuguese | 15 | 1.2% |
| Scotch-Irish | 3 | 0.3% |
| Swiss | 3 | 0.3% | View All 15 Rows |
Immigrants in Clarkson
The most numerous immigrant groups reported in Clarkson came from Asia (2 | 0.2%), South Central Asia (2 | 0.2%), and Sri Lanka (2 | 0.2%), together accounting for 0.5% of all Clarkson residents.
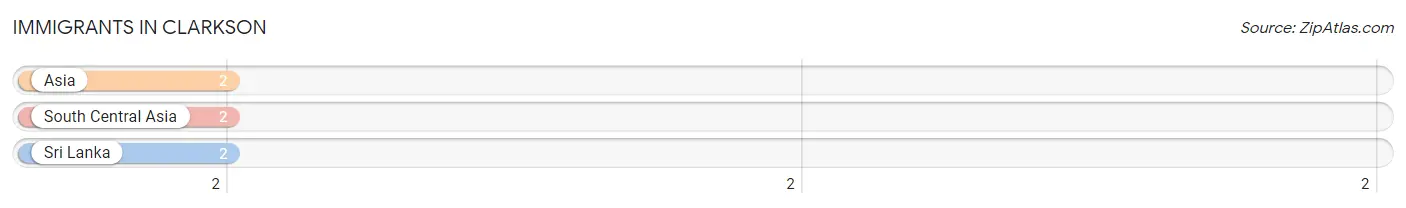
| Immigration Origin | # Population | % Population |
| Asia | 2 | 0.2% |
| South Central Asia | 2 | 0.2% |
| Sri Lanka | 2 | 0.2% | View All 3 Rows |
Sex and Age in Clarkson
Sex and Age in Clarkson
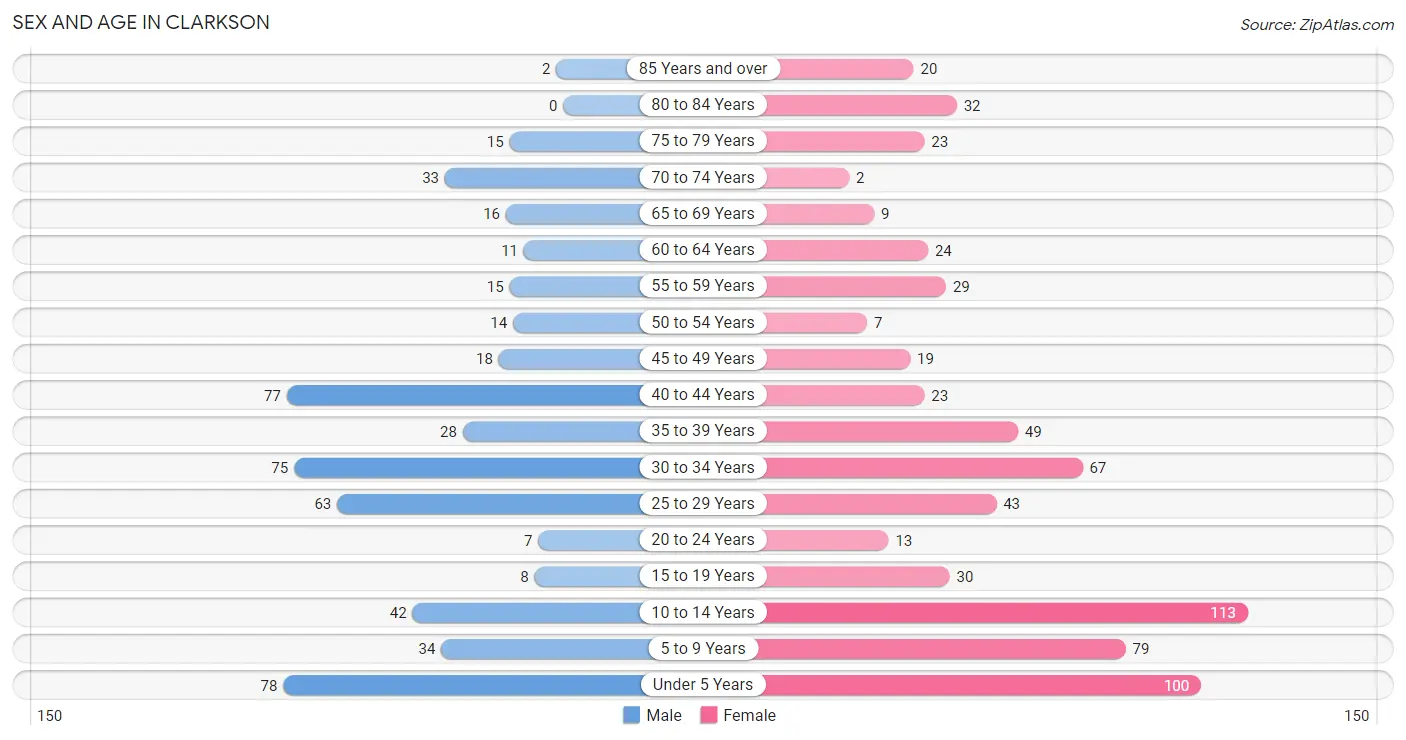
The most populous age groups in Clarkson are Under 5 Years (78 | 14.5%) for men and 10 to 14 Years (113 | 16.6%) for women.
| Age Bracket | Male | Female |
| Under 5 Years | 78 (14.5%) | 100 (14.7%) |
| 5 to 9 Years | 34 (6.3%) | 79 (11.6%) |
| 10 to 14 Years | 42 (7.8%) | 113 (16.6%) |
| 15 to 19 Years | 8 (1.5%) | 30 (4.4%) |
| 20 to 24 Years | 7 (1.3%) | 13 (1.9%) |
| 25 to 29 Years | 63 (11.7%) | 43 (6.3%) |
| 30 to 34 Years | 75 (14.0%) | 67 (9.8%) |
| 35 to 39 Years | 28 (5.2%) | 49 (7.2%) |
| 40 to 44 Years | 77 (14.4%) | 23 (3.4%) |
| 45 to 49 Years | 18 (3.4%) | 19 (2.8%) |
| 50 to 54 Years | 14 (2.6%) | 7 (1.0%) |
| 55 to 59 Years | 15 (2.8%) | 29 (4.3%) |
| 60 to 64 Years | 11 (2.1%) | 24 (3.5%) |
| 65 to 69 Years | 16 (3.0%) | 9 (1.3%) |
| 70 to 74 Years | 33 (6.2%) | 2 (0.3%) |
| 75 to 79 Years | 15 (2.8%) | 23 (3.4%) |
| 80 to 84 Years | 0 (0.0%) | 32 (4.7%) |
| 85 Years and over | 2 (0.4%) | 20 (2.9%) |
| Total | 536 (100.0%) | 682 (100.0%) |
Families and Households in Clarkson
Median Family Size in Clarkson
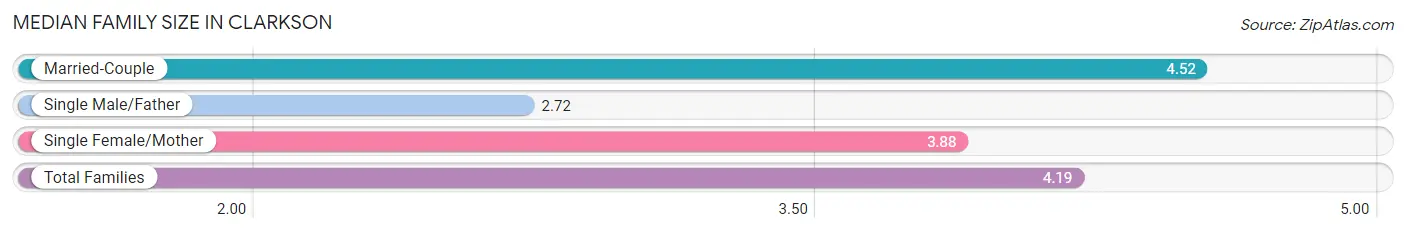
The median family size in Clarkson is 4.19 persons per family, with married-couple families (151 | 61.4%) accounting for the largest median family size of 4.52 persons per family. On the other hand, single male/father families (18 | 7.3%) represent the smallest median family size with 2.72 persons per family.
| Family Type | # Families | Family Size |
| Married-Couple | 151 (61.4%) | 4.52 |
| Single Male/Father | 18 (7.3%) | 2.72 |
| Single Female/Mother | 77 (31.3%) | 3.88 |
| Total Families | 246 (100.0%) | 4.19 |
Median Household Size in Clarkson
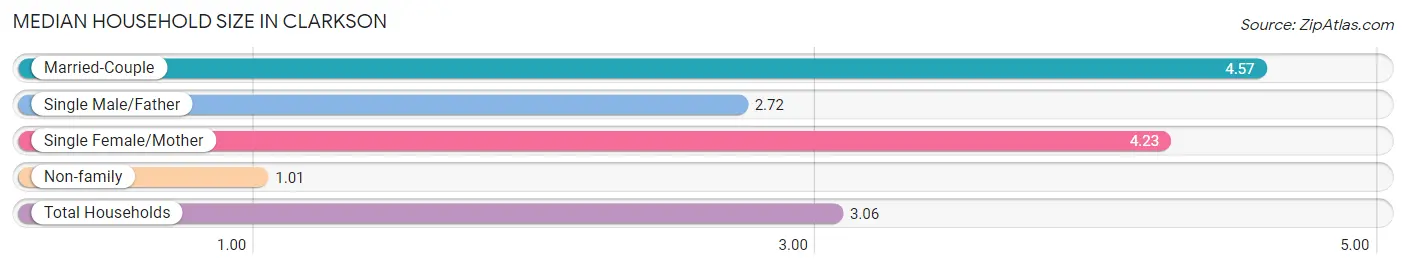
The median household size in Clarkson is 3.06 persons per household, with married-couple households (151 | 37.9%) accounting for the largest median household size of 4.57 persons per household. non-family households (152 | 38.2%) represent the smallest median household size with 1.01 persons per household.
| Household Type | # Households | Household Size |
| Married-Couple | 151 (37.9%) | 4.57 |
| Single Male/Father | 18 (4.5%) | 2.72 |
| Single Female/Mother | 77 (19.4%) | 4.23 |
| Non-family | 152 (38.2%) | 1.01 |
| Total Households | 398 (100.0%) | 3.06 |
Household Size by Marriage Status in Clarkson
Out of a total of 398 households in Clarkson, 246 (61.8%) are family households, while 152 (38.2%) are nonfamily households. The most numerous type of family households are 2-person households, comprising 81, and the most common type of nonfamily households are 1-person households, comprising 147.
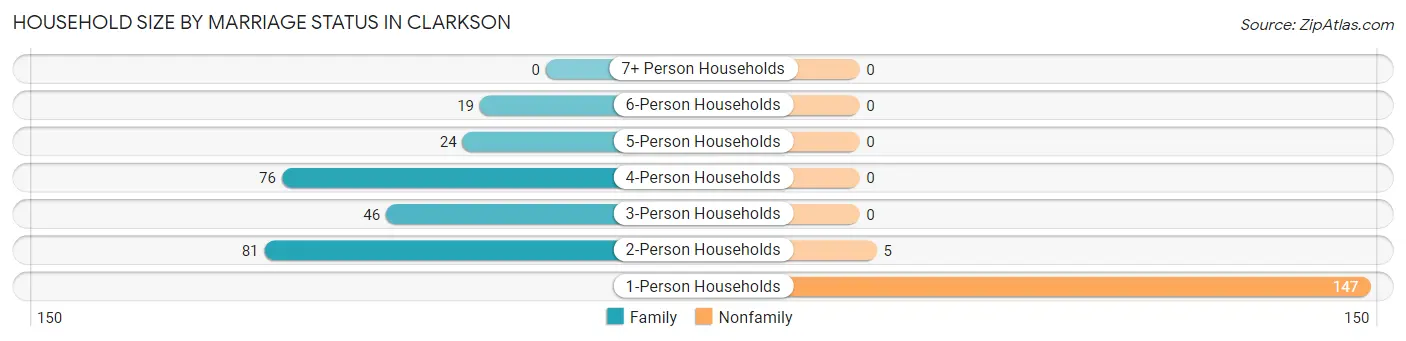
| Household Size | Family Households | Nonfamily Households |
| 1-Person Households | - | 147 (36.9%) |
| 2-Person Households | 81 (20.3%) | 5 (1.3%) |
| 3-Person Households | 46 (11.6%) | 0 (0.0%) |
| 4-Person Households | 76 (19.1%) | 0 (0.0%) |
| 5-Person Households | 24 (6.0%) | 0 (0.0%) |
| 6-Person Households | 19 (4.8%) | 0 (0.0%) |
| 7+ Person Households | 0 (0.0%) | 0 (0.0%) |
| Total | 246 (61.8%) | 152 (38.2%) |
Female Fertility in Clarkson
Fertility by Age in Clarkson
Average fertility rate in Clarkson is 66.0 births per 1,000 women. Women in the age bracket of 35 to 50 years have the highest fertility rate with 132.0 births per 1,000 women. Women in the age bracket of 35 to 50 years acount for 75.0% of all women with births.
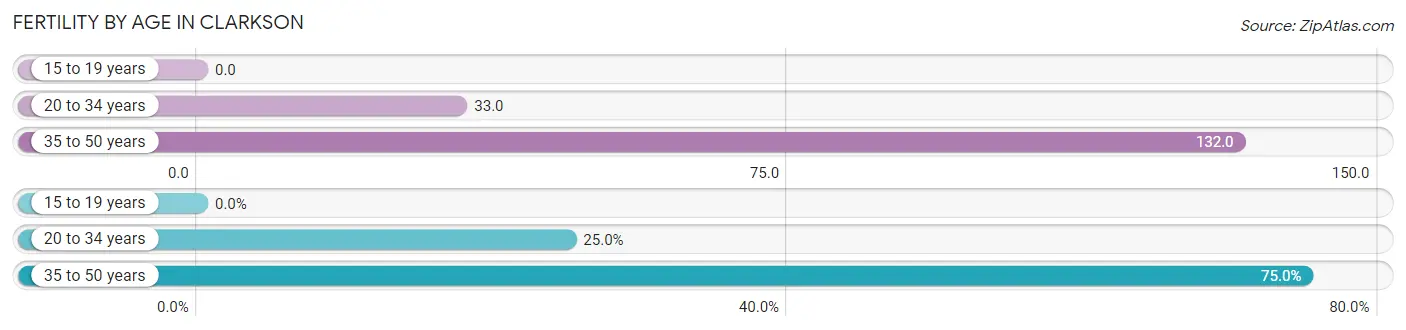
| Age Bracket | Women with Births | Births / 1,000 Women |
| 15 to 19 years | 0 (0.0%) | 0.0 |
| 20 to 34 years | 4 (25.0%) | 33.0 |
| 35 to 50 years | 12 (75.0%) | 132.0 |
| Total | 16 (100.0%) | 66.0 |
Fertility by Age by Marriage Status in Clarkson
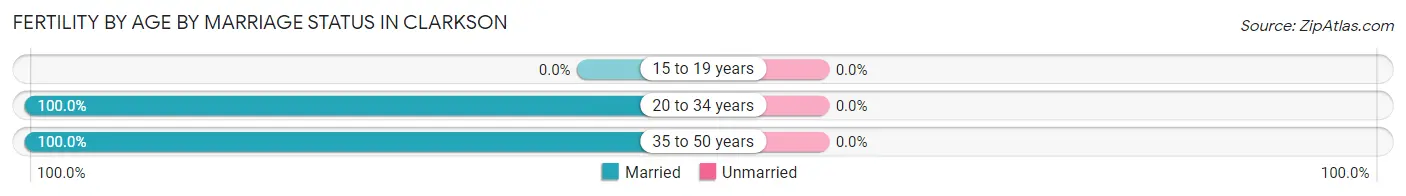
| Age Bracket | Married | Unmarried |
| 15 to 19 years | 0 (0.0%) | 0 (0.0%) |
| 20 to 34 years | 4 (100.0%) | 0 (0.0%) |
| 35 to 50 years | 12 (100.0%) | 0 (0.0%) |
| Total | 16 (100.0%) | 0 (0.0%) |
Fertility by Education in Clarkson
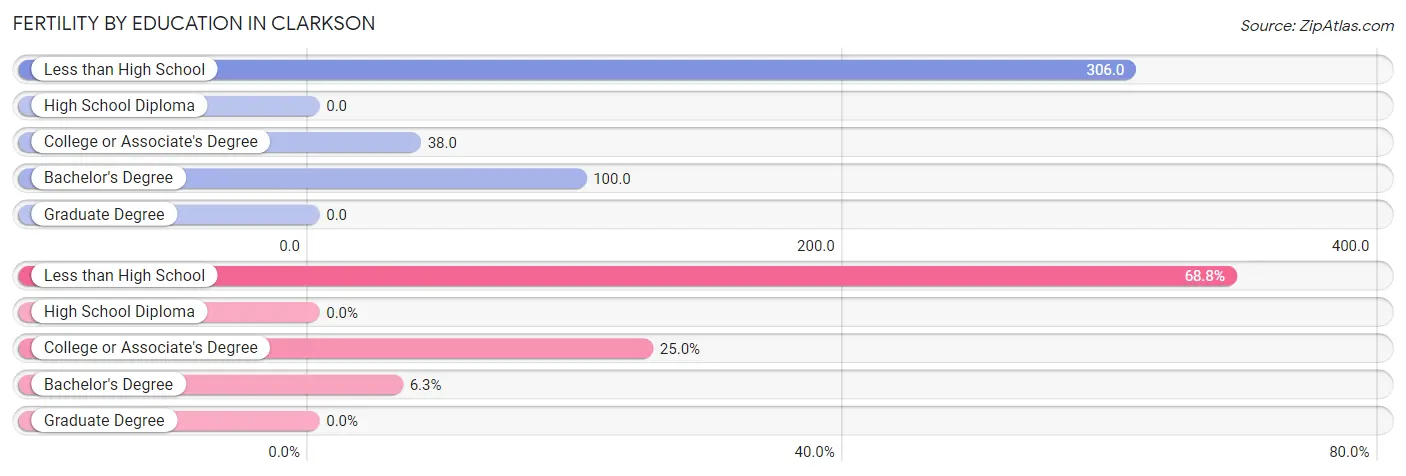
| Educational Attainment | Women with Births | Births / 1,000 Women |
| Less than High School | 11 (68.8%) | 306.0 |
| High School Diploma | 0 (0.0%) | 0.0 |
| College or Associate's Degree | 4 (25.0%) | 38.0 |
| Bachelor's Degree | 1 (6.2%) | 100.0 |
| Graduate Degree | 0 (0.0%) | 0.0 |
| Total | 16 (100.0%) | 66.0 |
Fertility by Education by Marriage Status in Clarkson
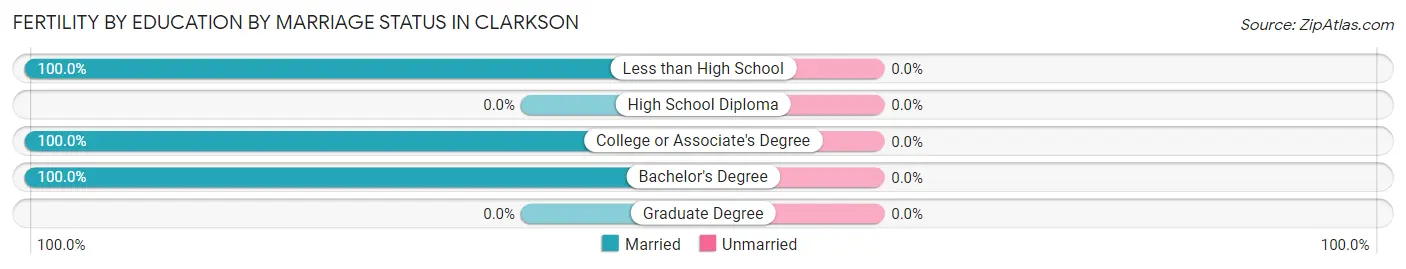
| Educational Attainment | Married | Unmarried |
| Less than High School | 11 (100.0%) | 0 (0.0%) |
| High School Diploma | 0 (0.0%) | 0 (0.0%) |
| College or Associate's Degree | 4 (100.0%) | 0 (0.0%) |
| Bachelor's Degree | 1 (100.0%) | 0 (0.0%) |
| Graduate Degree | 0 (0.0%) | 0 (0.0%) |
| Total | 16 (100.0%) | 0 (0.0%) |
Employment Characteristics in Clarkson
Employment by Class of Employer in Clarkson
Among the 435 employed individuals in Clarkson, private company employees (375 | 86.2%), self-employed (not incorporated) (18 | 4.1%), and state government employees (13 | 3.0%) make up the most common classes of employment.
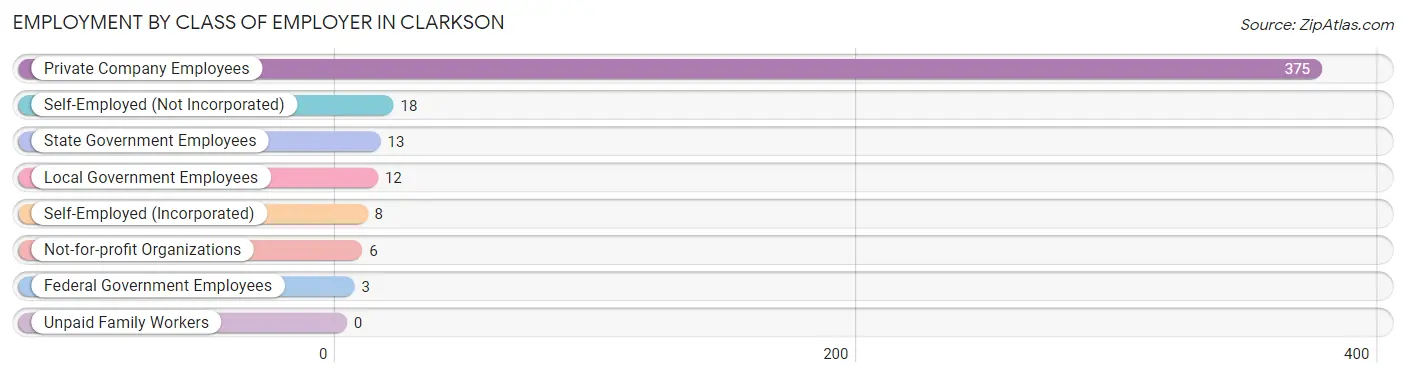
| Employer Class | # Employees | % Employees |
| Private Company Employees | 375 | 86.2% |
| Self-Employed (Incorporated) | 8 | 1.8% |
| Self-Employed (Not Incorporated) | 18 | 4.1% |
| Not-for-profit Organizations | 6 | 1.4% |
| Local Government Employees | 12 | 2.8% |
| State Government Employees | 13 | 3.0% |
| Federal Government Employees | 3 | 0.7% |
| Unpaid Family Workers | 0 | 0.0% |
| Total | 435 | 100.0% |
Employment Status by Age in Clarkson
According to the labor force statistics for Clarkson, out of the total population over 16 years of age (765), 61.0% or 467 individuals are in the labor force, with 5.4% or 25 of them unemployed. The age group with the highest labor force participation rate is 25 to 29 years, with 99.1% or 105 individuals in the labor force. Within the labor force, the 55 to 59 years age range has the highest percentage of unemployed individuals, with 13.3% or 2 of them being unemployed.
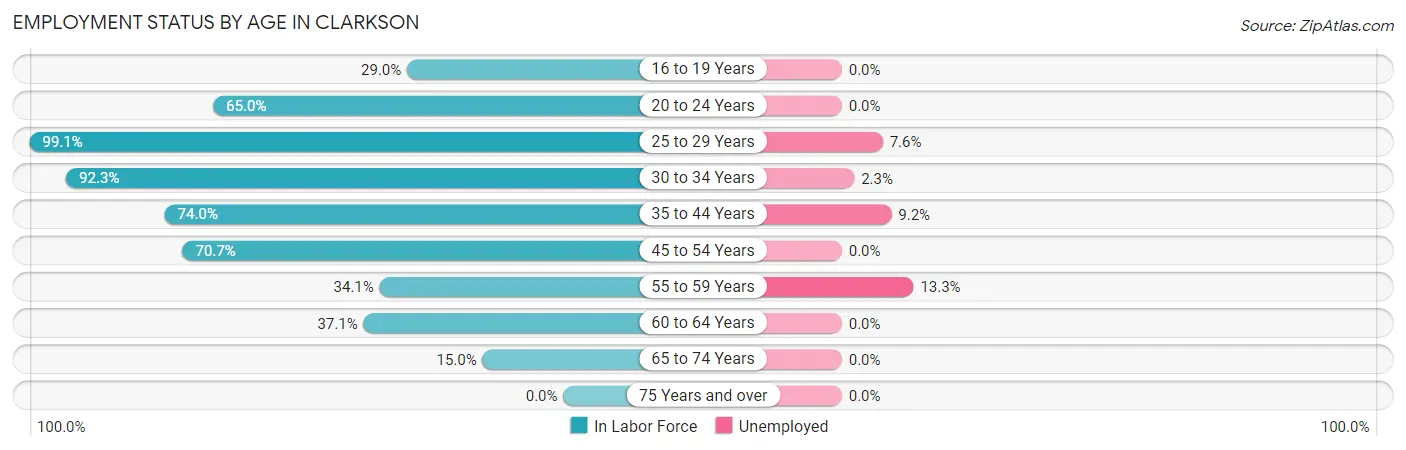
| Age Bracket | In Labor Force | Unemployed |
| 16 to 19 Years | 9 (29.0%) | 0 (0.0%) |
| 20 to 24 Years | 13 (65.0%) | 0 (0.0%) |
| 25 to 29 Years | 105 (99.1%) | 8 (7.6%) |
| 30 to 34 Years | 131 (92.3%) | 3 (2.3%) |
| 35 to 44 Years | 131 (74.0%) | 12 (9.2%) |
| 45 to 54 Years | 41 (70.7%) | 0 (0.0%) |
| 55 to 59 Years | 15 (34.1%) | 2 (13.3%) |
| 60 to 64 Years | 13 (37.1%) | 0 (0.0%) |
| 65 to 74 Years | 9 (15.0%) | 0 (0.0%) |
| 75 Years and over | 0 (0.0%) | 0 (0.0%) |
| Total | 467 (61.0%) | 25 (5.4%) |
Employment Status by Educational Attainment in Clarkson
According to labor force statistics for Clarkson, 77.6% of individuals (436) out of the total population between 25 and 64 years of age (562) are in the labor force, with 5.7% or 25 of them being unemployed. The group with the highest labor force participation rate are those with the educational attainment of bachelor's degree or higher, with 94.7% or 71 individuals in the labor force. Within the labor force, individuals with college / associate degree education have the highest percentage of unemployment, with 9.2% or 12 of them being unemployed.
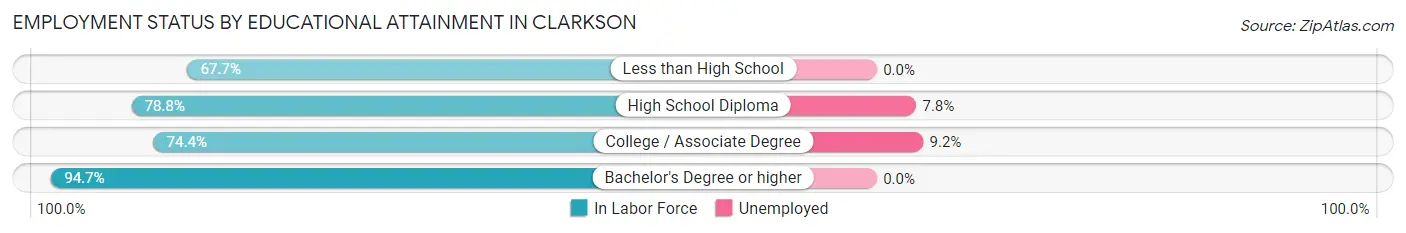
| Educational Attainment | In Labor Force | Unemployed |
| Less than High School | 67 (67.7%) | 0 (0.0%) |
| High School Diploma | 167 (78.8%) | 17 (7.8%) |
| College / Associate Degree | 131 (74.4%) | 16 (9.2%) |
| Bachelor's Degree or higher | 71 (94.7%) | 0 (0.0%) |
| Total | 436 (77.6%) | 32 (5.7%) |
Employment Occupations by Sex in Clarkson
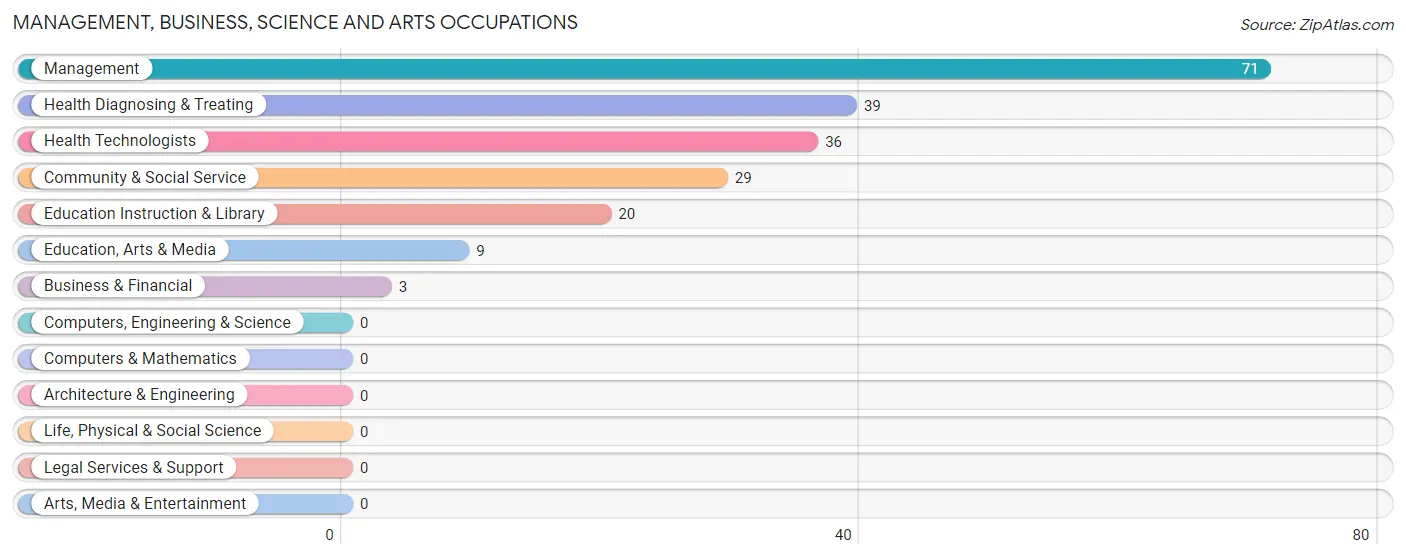
Management, Business, Science and Arts Occupations
The most common Management, Business, Science and Arts occupations in Clarkson are Management (71 | 16.1%), Health Diagnosing & Treating (39 | 8.8%), Health Technologists (36 | 8.1%), Community & Social Service (29 | 6.6%), and Education Instruction & Library (20 | 4.5%).
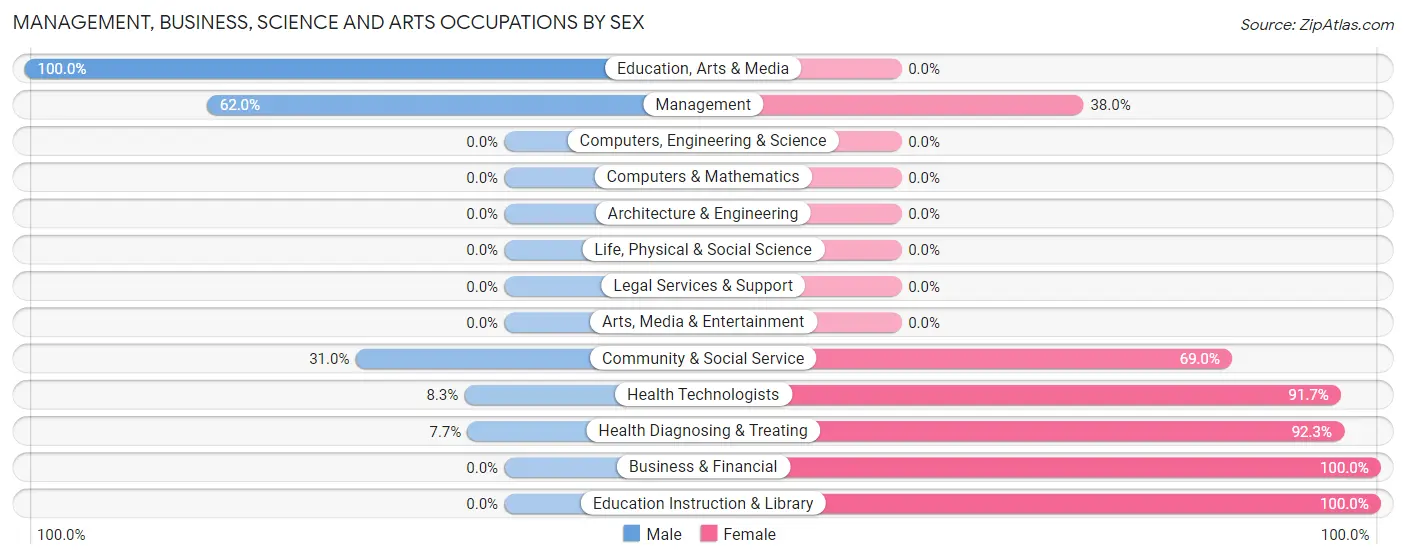
Management, Business, Science and Arts Occupations by Sex
Within the Management, Business, Science and Arts occupations in Clarkson, the most male-oriented occupations are Education, Arts & Media (100.0%), Management (62.0%), and Community & Social Service (31.0%), while the most female-oriented occupations are Business & Financial (100.0%), Education Instruction & Library (100.0%), and Health Diagnosing & Treating (92.3%).
| Occupation | Male | Female |
| Management | 44 (62.0%) | 27 (38.0%) |
| Business & Financial | 0 (0.0%) | 3 (100.0%) |
| Computers, Engineering & Science | 0 (0.0%) | 0 (0.0%) |
| Computers & Mathematics | 0 (0.0%) | 0 (0.0%) |
| Architecture & Engineering | 0 (0.0%) | 0 (0.0%) |
| Life, Physical & Social Science | 0 (0.0%) | 0 (0.0%) |
| Community & Social Service | 9 (31.0%) | 20 (69.0%) |
| Education, Arts & Media | 9 (100.0%) | 0 (0.0%) |
| Legal Services & Support | 0 (0.0%) | 0 (0.0%) |
| Education Instruction & Library | 0 (0.0%) | 20 (100.0%) |
| Arts, Media & Entertainment | 0 (0.0%) | 0 (0.0%) |
| Health Diagnosing & Treating | 3 (7.7%) | 36 (92.3%) |
| Health Technologists | 3 (8.3%) | 33 (91.7%) |
| Total (Category) | 56 (39.4%) | 86 (60.6%) |
| Total (Overall) | 229 (51.8%) | 213 (48.2%) |
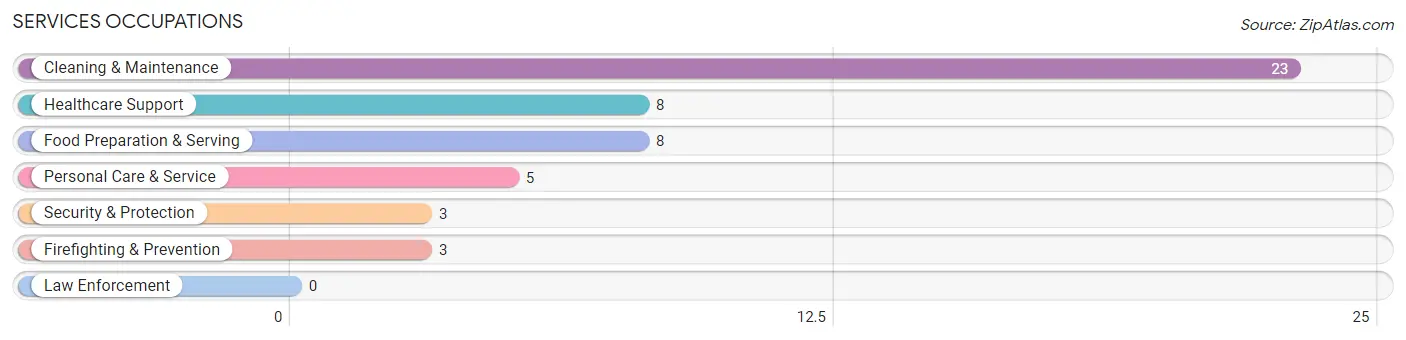
Services Occupations
The most common Services occupations in Clarkson are Cleaning & Maintenance (23 | 5.2%), Healthcare Support (8 | 1.8%), Food Preparation & Serving (8 | 1.8%), Personal Care & Service (5 | 1.1%), and Security & Protection (3 | 0.7%).
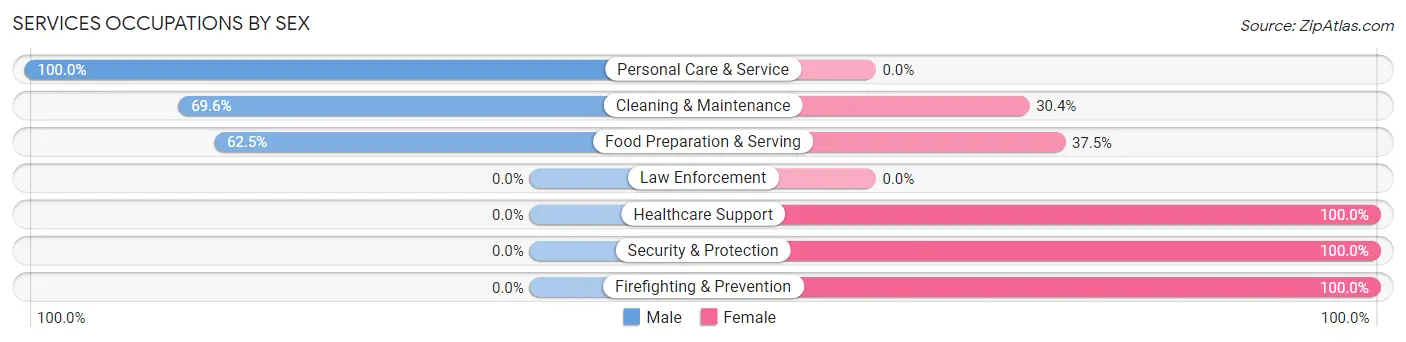
Services Occupations by Sex
Within the Services occupations in Clarkson, the most male-oriented occupations are Personal Care & Service (100.0%), Cleaning & Maintenance (69.6%), and Food Preparation & Serving (62.5%), while the most female-oriented occupations are Healthcare Support (100.0%), Security & Protection (100.0%), and Firefighting & Prevention (100.0%).
| Occupation | Male | Female |
| Healthcare Support | 0 (0.0%) | 8 (100.0%) |
| Security & Protection | 0 (0.0%) | 3 (100.0%) |
| Firefighting & Prevention | 0 (0.0%) | 3 (100.0%) |
| Law Enforcement | 0 (0.0%) | 0 (0.0%) |
| Food Preparation & Serving | 5 (62.5%) | 3 (37.5%) |
| Cleaning & Maintenance | 16 (69.6%) | 7 (30.4%) |
| Personal Care & Service | 5 (100.0%) | 0 (0.0%) |
| Total (Category) | 26 (55.3%) | 21 (44.7%) |
| Total (Overall) | 229 (51.8%) | 213 (48.2%) |
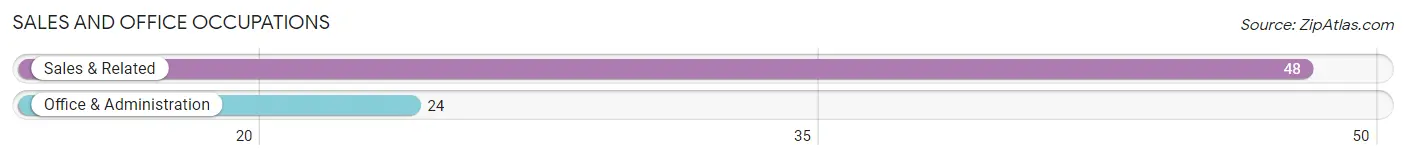
Sales and Office Occupations
The most common Sales and Office occupations in Clarkson are Sales & Related (48 | 10.9%), and Office & Administration (24 | 5.4%).
Sales and Office Occupations by Sex
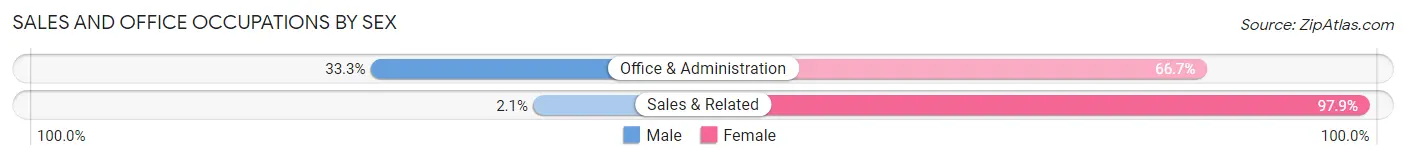
| Occupation | Male | Female |
| Sales & Related | 1 (2.1%) | 47 (97.9%) |
| Office & Administration | 8 (33.3%) | 16 (66.7%) |
| Total (Category) | 9 (12.5%) | 63 (87.5%) |
| Total (Overall) | 229 (51.8%) | 213 (48.2%) |
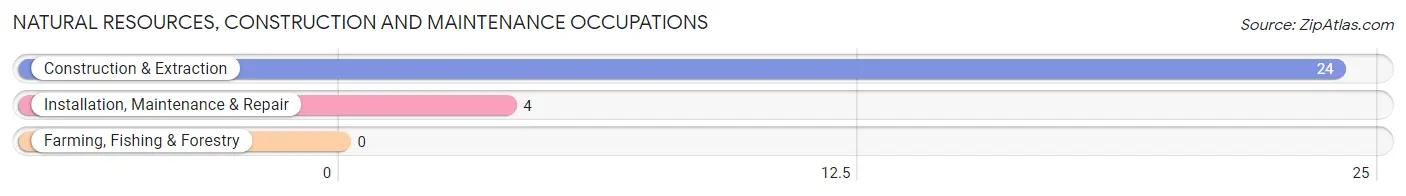
Natural Resources, Construction and Maintenance Occupations
The most common Natural Resources, Construction and Maintenance occupations in Clarkson are Construction & Extraction (24 | 5.4%), and Installation, Maintenance & Repair (4 | 0.9%).
Natural Resources, Construction and Maintenance Occupations by Sex
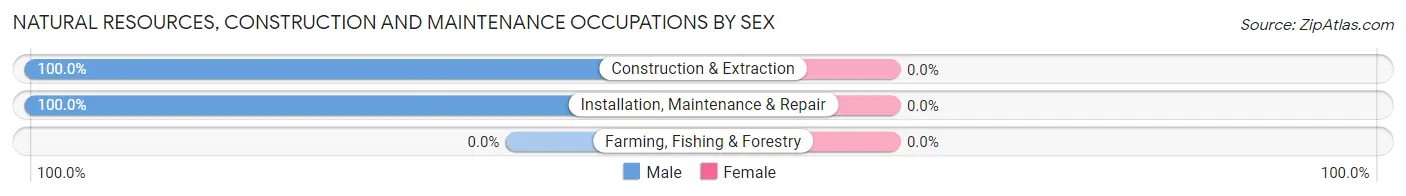
| Occupation | Male | Female |
| Farming, Fishing & Forestry | 0 (0.0%) | 0 (0.0%) |
| Construction & Extraction | 24 (100.0%) | 0 (0.0%) |
| Installation, Maintenance & Repair | 4 (100.0%) | 0 (0.0%) |
| Total (Category) | 28 (100.0%) | 0 (0.0%) |
| Total (Overall) | 229 (51.8%) | 213 (48.2%) |
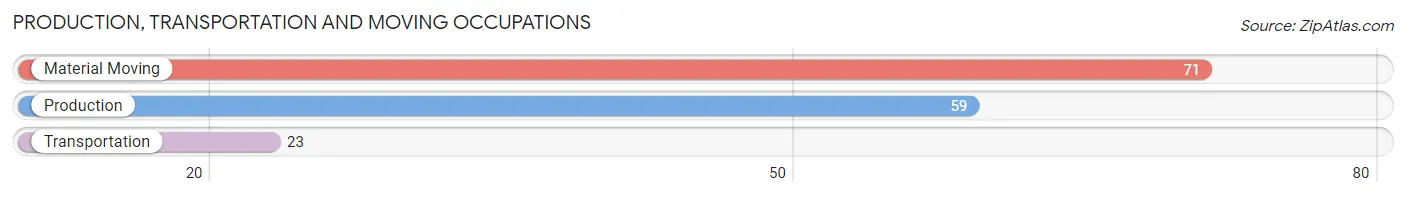
Production, Transportation and Moving Occupations
The most common Production, Transportation and Moving occupations in Clarkson are Material Moving (71 | 16.1%), Production (59 | 13.4%), and Transportation (23 | 5.2%).
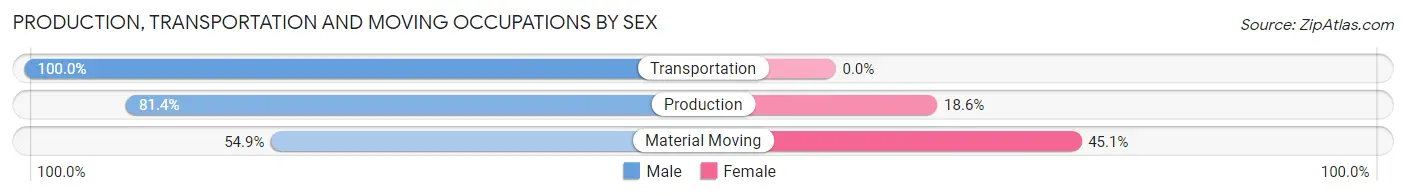
Production, Transportation and Moving Occupations by Sex
| Occupation | Male | Female |
| Production | 48 (81.4%) | 11 (18.6%) |
| Transportation | 23 (100.0%) | 0 (0.0%) |
| Material Moving | 39 (54.9%) | 32 (45.1%) |
| Total (Category) | 110 (71.9%) | 43 (28.1%) |
| Total (Overall) | 229 (51.8%) | 213 (48.2%) |
Employment Industries by Sex in Clarkson
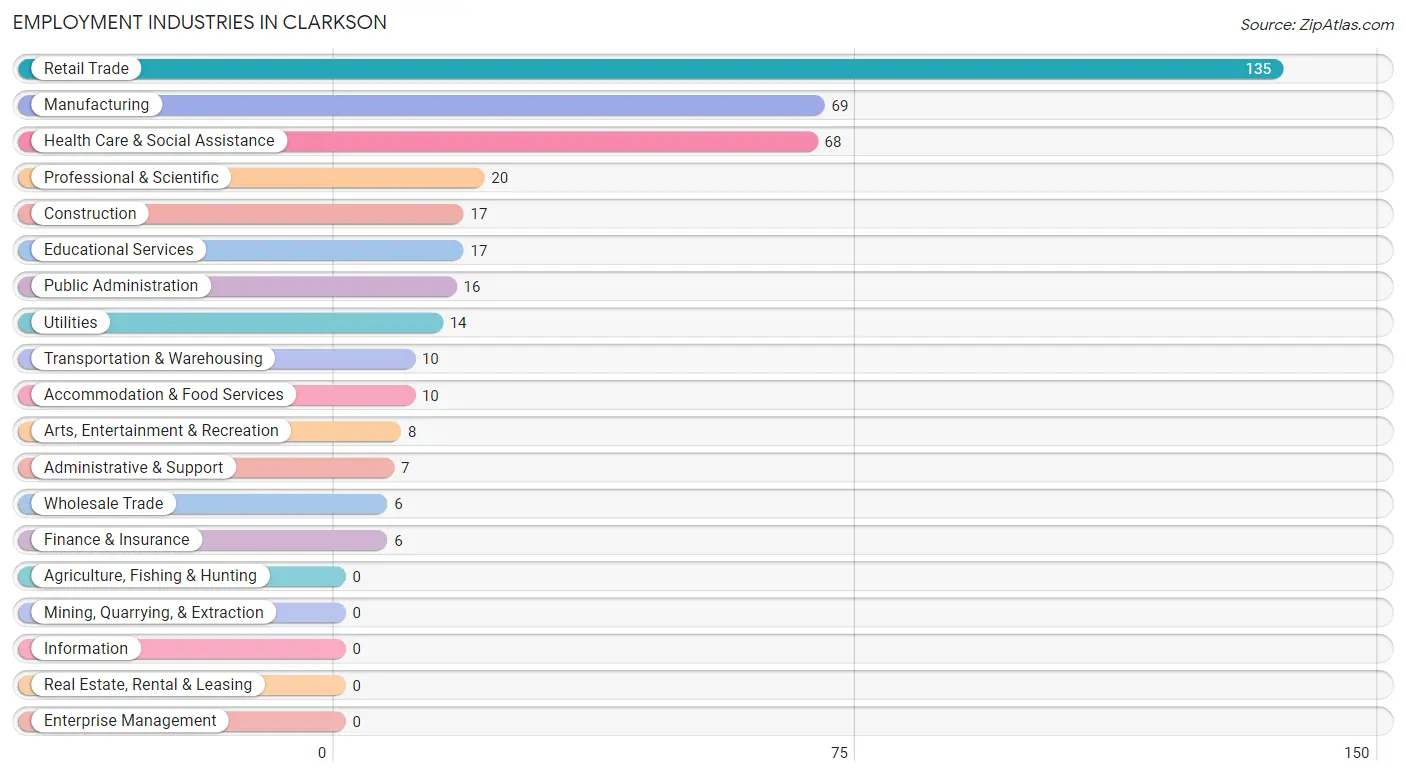
Employment Industries in Clarkson
The major employment industries in Clarkson include Retail Trade (135 | 30.5%), Manufacturing (69 | 15.6%), Health Care & Social Assistance (68 | 15.4%), Professional & Scientific (20 | 4.5%), and Construction (17 | 3.8%).
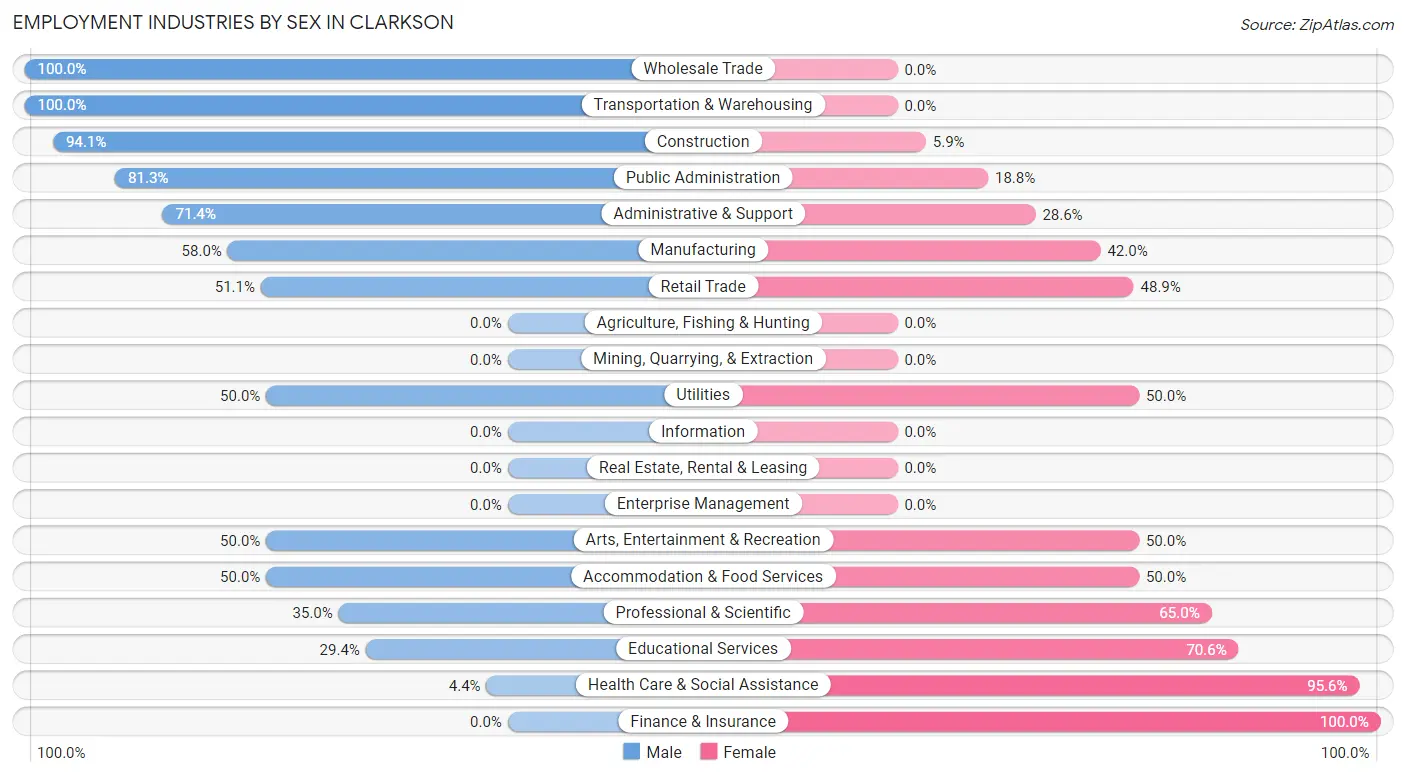
Employment Industries by Sex in Clarkson
The Clarkson industries that see more men than women are Wholesale Trade (100.0%), Transportation & Warehousing (100.0%), and Construction (94.1%), whereas the industries that tend to have a higher number of women are Finance & Insurance (100.0%), Health Care & Social Assistance (95.6%), and Educational Services (70.6%).
| Industry | Male | Female |
| Agriculture, Fishing & Hunting | 0 (0.0%) | 0 (0.0%) |
| Mining, Quarrying, & Extraction | 0 (0.0%) | 0 (0.0%) |
| Construction | 16 (94.1%) | 1 (5.9%) |
| Manufacturing | 40 (58.0%) | 29 (42.0%) |
| Wholesale Trade | 6 (100.0%) | 0 (0.0%) |
| Retail Trade | 69 (51.1%) | 66 (48.9%) |
| Transportation & Warehousing | 10 (100.0%) | 0 (0.0%) |
| Utilities | 7 (50.0%) | 7 (50.0%) |
| Information | 0 (0.0%) | 0 (0.0%) |
| Finance & Insurance | 0 (0.0%) | 6 (100.0%) |
| Real Estate, Rental & Leasing | 0 (0.0%) | 0 (0.0%) |
| Professional & Scientific | 7 (35.0%) | 13 (65.0%) |
| Enterprise Management | 0 (0.0%) | 0 (0.0%) |
| Administrative & Support | 5 (71.4%) | 2 (28.6%) |
| Educational Services | 5 (29.4%) | 12 (70.6%) |
| Health Care & Social Assistance | 3 (4.4%) | 65 (95.6%) |
| Arts, Entertainment & Recreation | 4 (50.0%) | 4 (50.0%) |
| Accommodation & Food Services | 5 (50.0%) | 5 (50.0%) |
| Public Administration | 13 (81.2%) | 3 (18.8%) |
| Total | 229 (51.8%) | 213 (48.2%) |
Education in Clarkson
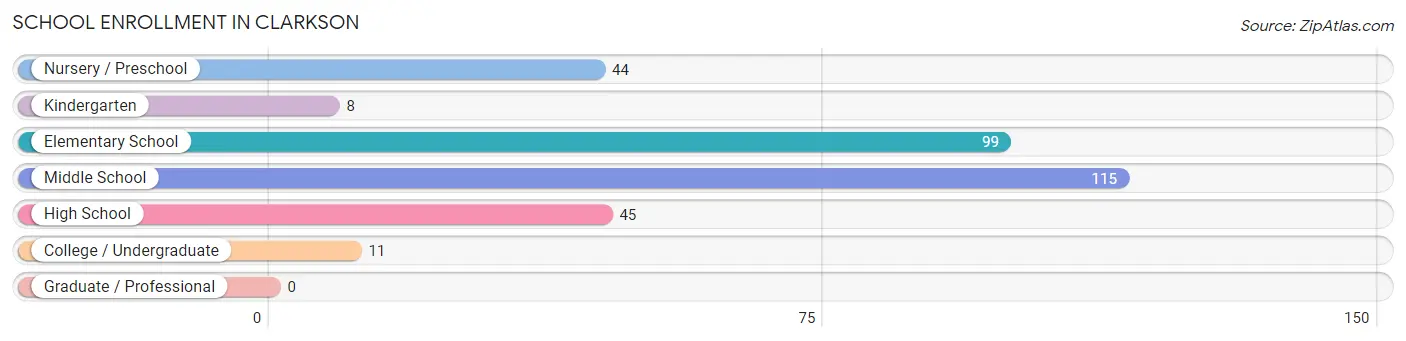
School Enrollment in Clarkson
The most common levels of schooling among the 322 students in Clarkson are middle school (115 | 35.7%), elementary school (99 | 30.7%), and high school (45 | 14.0%).
| School Level | # Students | % Students |
| Nursery / Preschool | 44 | 13.7% |
| Kindergarten | 8 | 2.5% |
| Elementary School | 99 | 30.7% |
| Middle School | 115 | 35.7% |
| High School | 45 | 14.0% |
| College / Undergraduate | 11 | 3.4% |
| Graduate / Professional | 0 | 0.0% |
| Total | 322 | 100.0% |
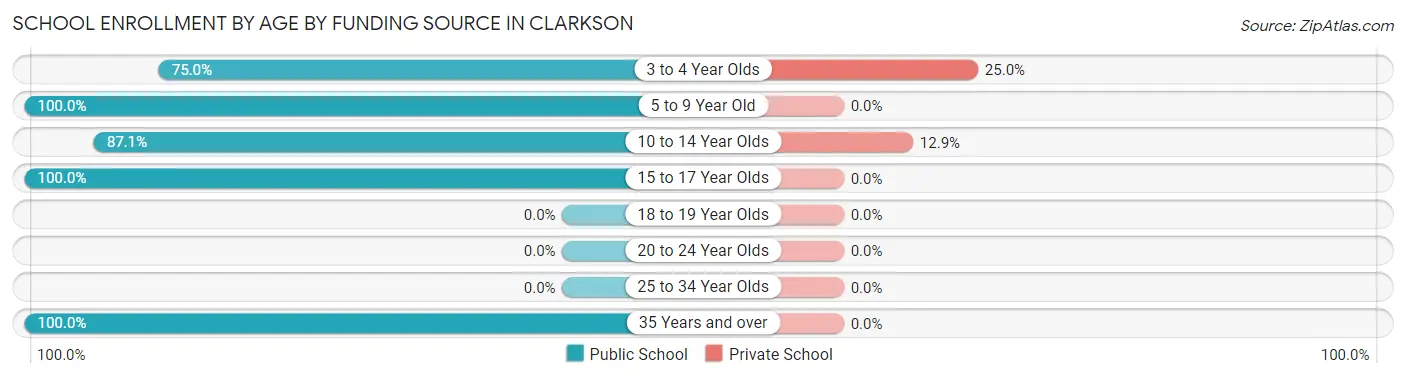
School Enrollment by Age by Funding Source in Clarkson
Out of a total of 322 students who are enrolled in schools in Clarkson, 27 (8.4%) attend a private institution, while the remaining 295 (91.6%) are enrolled in public schools. The age group of 3 to 4 year olds has the highest likelihood of being enrolled in private schools, with 7 (25.0% in the age bracket) enrolled. Conversely, the age group of 5 to 9 year old has the lowest likelihood of being enrolled in a private school, with 96 (100.0% in the age bracket) attending a public institution.
| Age Bracket | Public School | Private School |
| 3 to 4 Year Olds | 21 (75.0%) | 7 (25.0%) |
| 5 to 9 Year Old | 96 (100.0%) | 0 (0.0%) |
| 10 to 14 Year Olds | 135 (87.1%) | 20 (12.9%) |
| 15 to 17 Year Olds | 32 (100.0%) | 0 (0.0%) |
| 18 to 19 Year Olds | 0 (0.0%) | 0 (0.0%) |
| 20 to 24 Year Olds | 0 (0.0%) | 0 (0.0%) |
| 25 to 34 Year Olds | 0 (0.0%) | 0 (0.0%) |
| 35 Years and over | 11 (100.0%) | 0 (0.0%) |
| Total | 295 (91.6%) | 27 (8.4%) |
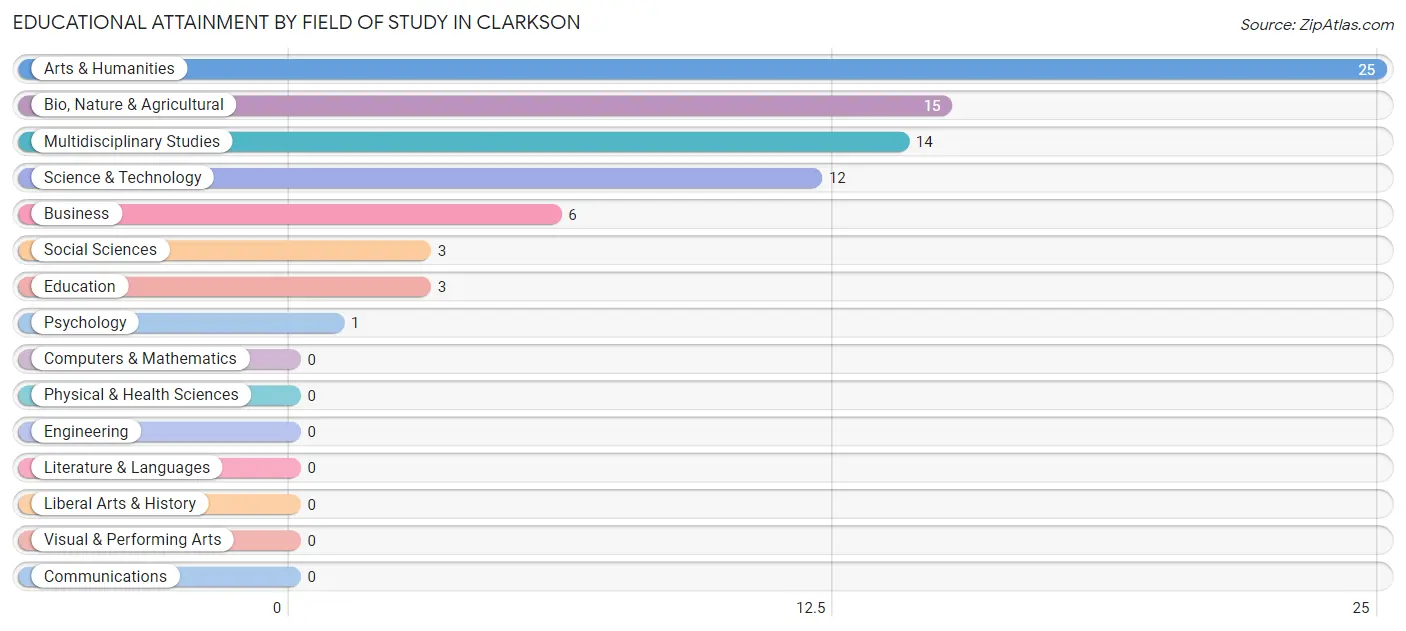
Educational Attainment by Field of Study in Clarkson
Arts & humanities (25 | 31.7%), bio, nature & agricultural (15 | 19.0%), multidisciplinary studies (14 | 17.7%), science & technology (12 | 15.2%), and business (6 | 7.6%) are the most common fields of study among 79 individuals in Clarkson who have obtained a bachelor's degree or higher.
| Field of Study | # Graduates | % Graduates |
| Computers & Mathematics | 0 | 0.0% |
| Bio, Nature & Agricultural | 15 | 19.0% |
| Physical & Health Sciences | 0 | 0.0% |
| Psychology | 1 | 1.3% |
| Social Sciences | 3 | 3.8% |
| Engineering | 0 | 0.0% |
| Multidisciplinary Studies | 14 | 17.7% |
| Science & Technology | 12 | 15.2% |
| Business | 6 | 7.6% |
| Education | 3 | 3.8% |
| Literature & Languages | 0 | 0.0% |
| Liberal Arts & History | 0 | 0.0% |
| Visual & Performing Arts | 0 | 0.0% |
| Communications | 0 | 0.0% |
| Arts & Humanities | 25 | 31.7% |
| Total | 79 | 100.0% |
Transportation & Commute in Clarkson
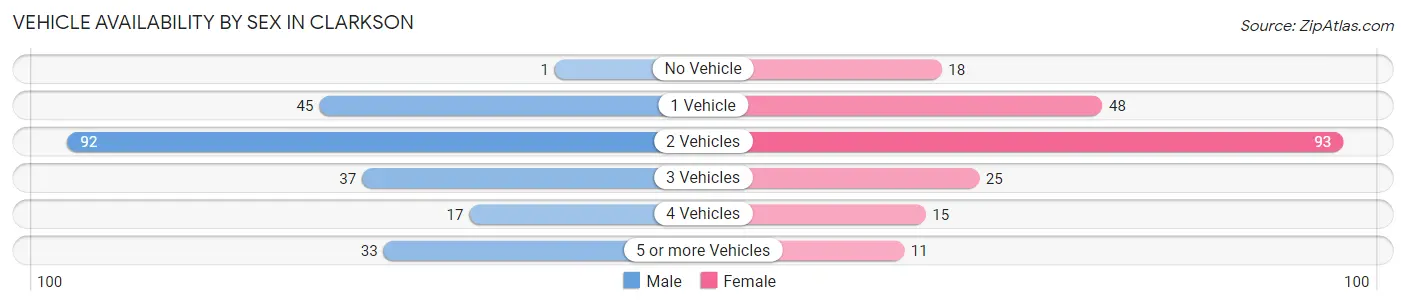
Vehicle Availability by Sex in Clarkson
The most prevalent vehicle ownership categories in Clarkson are males with 2 vehicles (92, accounting for 40.9%) and females with 2 vehicles (93, making up 43.8%).
| Vehicles Available | Male | Female |
| No Vehicle | 1 (0.4%) | 18 (8.6%) |
| 1 Vehicle | 45 (20.0%) | 48 (22.9%) |
| 2 Vehicles | 92 (40.9%) | 93 (44.3%) |
| 3 Vehicles | 37 (16.4%) | 25 (11.9%) |
| 4 Vehicles | 17 (7.6%) | 15 (7.1%) |
| 5 or more Vehicles | 33 (14.7%) | 11 (5.2%) |
| Total | 225 (100.0%) | 210 (100.0%) |
Commute Time in Clarkson
The most frequently occuring commute durations in Clarkson are 10 to 14 minutes (137 commuters, 32.2%), 5 to 9 minutes (54 commuters, 12.7%), and 45 to 59 minutes (40 commuters, 9.4%).
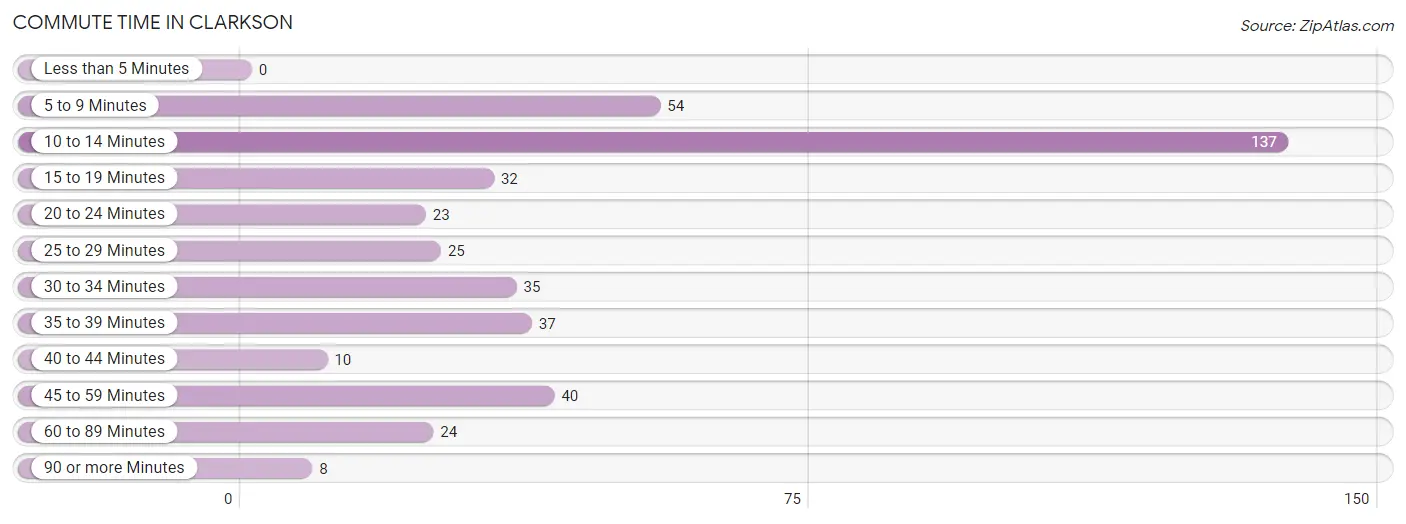
| Commute Time | # Commuters | % Commuters |
| Less than 5 Minutes | 0 | 0.0% |
| 5 to 9 Minutes | 54 | 12.7% |
| 10 to 14 Minutes | 137 | 32.2% |
| 15 to 19 Minutes | 32 | 7.5% |
| 20 to 24 Minutes | 23 | 5.4% |
| 25 to 29 Minutes | 25 | 5.9% |
| 30 to 34 Minutes | 35 | 8.2% |
| 35 to 39 Minutes | 37 | 8.7% |
| 40 to 44 Minutes | 10 | 2.4% |
| 45 to 59 Minutes | 40 | 9.4% |
| 60 to 89 Minutes | 24 | 5.7% |
| 90 or more Minutes | 8 | 1.9% |
Commute Time by Sex in Clarkson
The most common commute times in Clarkson are 10 to 14 minutes (79 commuters, 36.6%) for males and 10 to 14 minutes (58 commuters, 27.8%) for females.
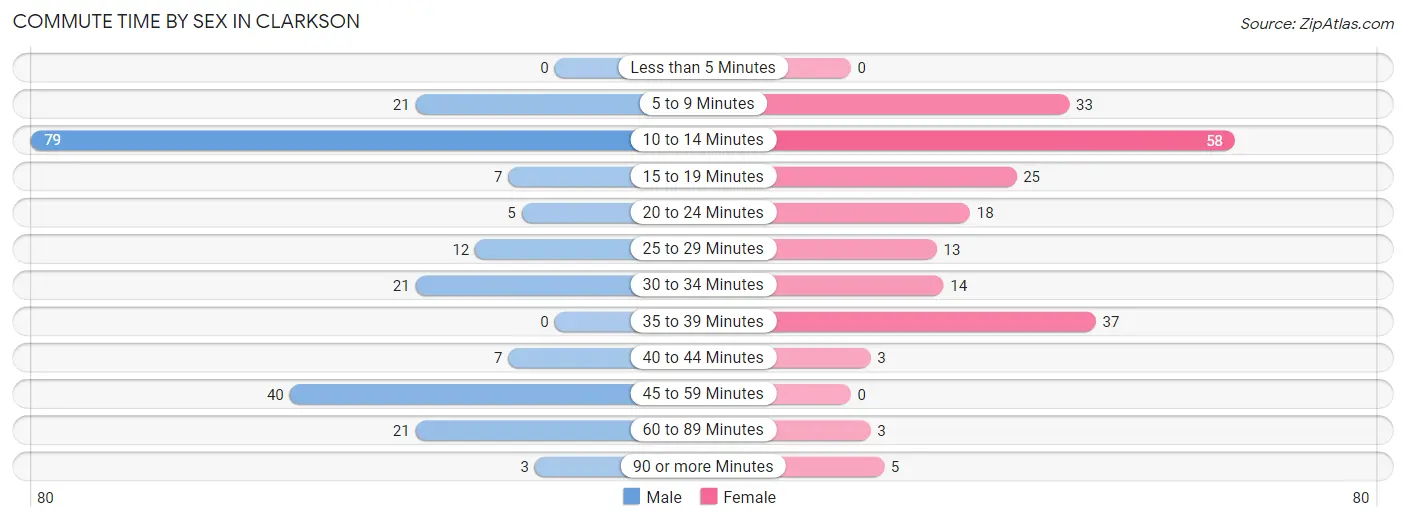
| Commute Time | Male | Female |
| Less than 5 Minutes | 0 (0.0%) | 0 (0.0%) |
| 5 to 9 Minutes | 21 (9.7%) | 33 (15.8%) |
| 10 to 14 Minutes | 79 (36.6%) | 58 (27.8%) |
| 15 to 19 Minutes | 7 (3.2%) | 25 (12.0%) |
| 20 to 24 Minutes | 5 (2.3%) | 18 (8.6%) |
| 25 to 29 Minutes | 12 (5.6%) | 13 (6.2%) |
| 30 to 34 Minutes | 21 (9.7%) | 14 (6.7%) |
| 35 to 39 Minutes | 0 (0.0%) | 37 (17.7%) |
| 40 to 44 Minutes | 7 (3.2%) | 3 (1.4%) |
| 45 to 59 Minutes | 40 (18.5%) | 0 (0.0%) |
| 60 to 89 Minutes | 21 (9.7%) | 3 (1.4%) |
| 90 or more Minutes | 3 (1.4%) | 5 (2.4%) |
Time of Departure to Work by Sex in Clarkson
The most frequent times of departure to work in Clarkson are 6:30 AM to 6:59 AM (50, 23.2%) for males and 5:00 AM to 5:29 AM (40, 19.1%) for females.
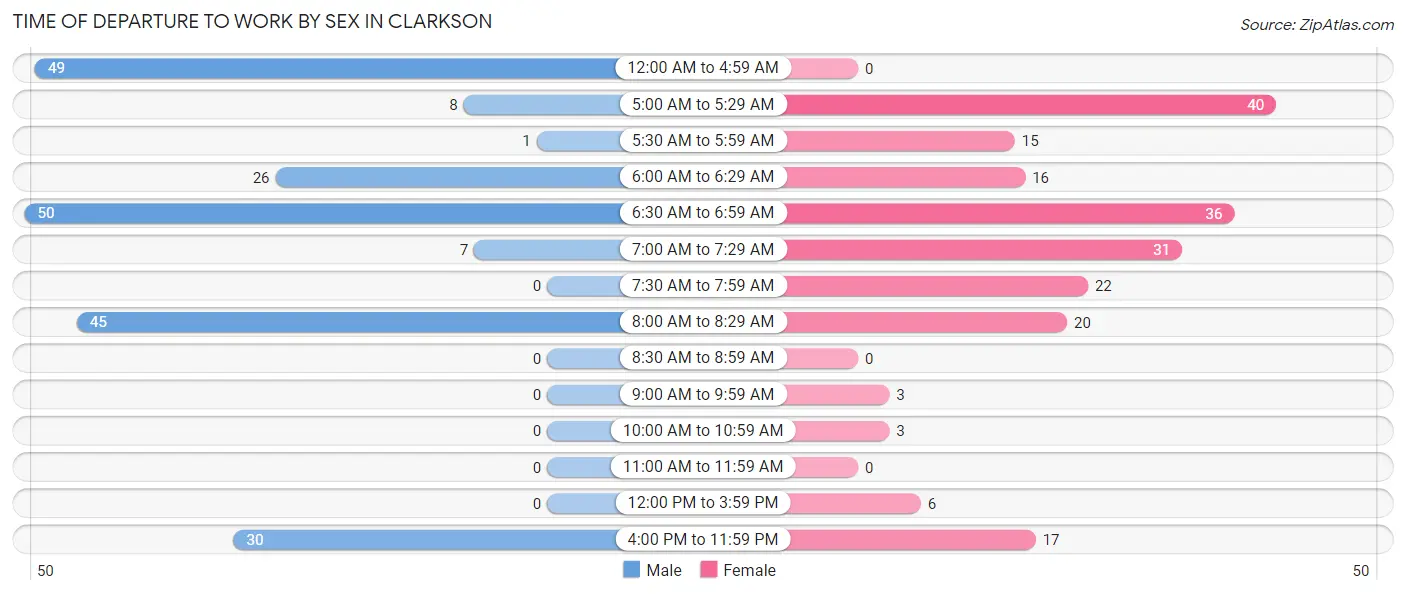
| Time of Departure | Male | Female |
| 12:00 AM to 4:59 AM | 49 (22.7%) | 0 (0.0%) |
| 5:00 AM to 5:29 AM | 8 (3.7%) | 40 (19.1%) |
| 5:30 AM to 5:59 AM | 1 (0.5%) | 15 (7.2%) |
| 6:00 AM to 6:29 AM | 26 (12.0%) | 16 (7.7%) |
| 6:30 AM to 6:59 AM | 50 (23.2%) | 36 (17.2%) |
| 7:00 AM to 7:29 AM | 7 (3.2%) | 31 (14.8%) |
| 7:30 AM to 7:59 AM | 0 (0.0%) | 22 (10.5%) |
| 8:00 AM to 8:29 AM | 45 (20.8%) | 20 (9.6%) |
| 8:30 AM to 8:59 AM | 0 (0.0%) | 0 (0.0%) |
| 9:00 AM to 9:59 AM | 0 (0.0%) | 3 (1.4%) |
| 10:00 AM to 10:59 AM | 0 (0.0%) | 3 (1.4%) |
| 11:00 AM to 11:59 AM | 0 (0.0%) | 0 (0.0%) |
| 12:00 PM to 3:59 PM | 0 (0.0%) | 6 (2.9%) |
| 4:00 PM to 11:59 PM | 30 (13.9%) | 17 (8.1%) |
| Total | 216 (100.0%) | 209 (100.0%) |
Housing Occupancy in Clarkson
Occupancy by Ownership in Clarkson
Of the total 398 dwellings in Clarkson, owner-occupied units account for 165 (41.5%), while renter-occupied units make up 233 (58.5%).
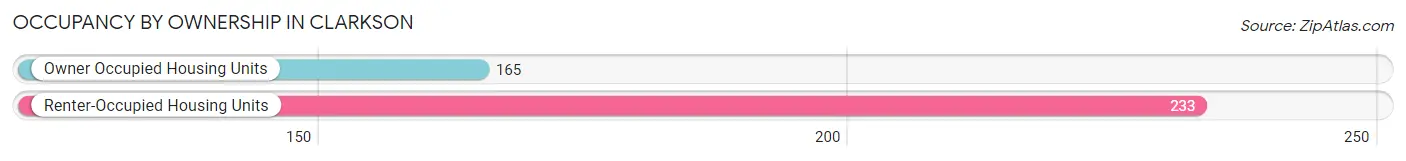
| Occupancy | # Housing Units | % Housing Units |
| Owner Occupied Housing Units | 165 | 41.5% |
| Renter-Occupied Housing Units | 233 | 58.5% |
| Total Occupied Housing Units | 398 | 100.0% |
Occupancy by Household Size in Clarkson
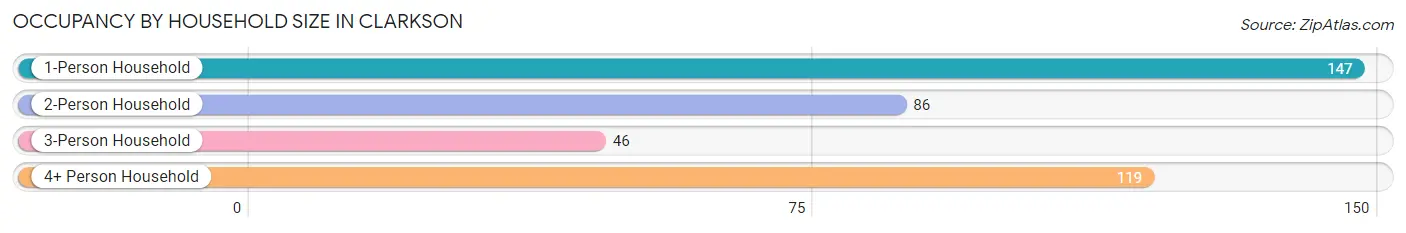
| Household Size | # Housing Units | % Housing Units |
| 1-Person Household | 147 | 36.9% |
| 2-Person Household | 86 | 21.6% |
| 3-Person Household | 46 | 11.6% |
| 4+ Person Household | 119 | 29.9% |
| Total Housing Units | 398 | 100.0% |
Occupancy by Ownership by Household Size in Clarkson
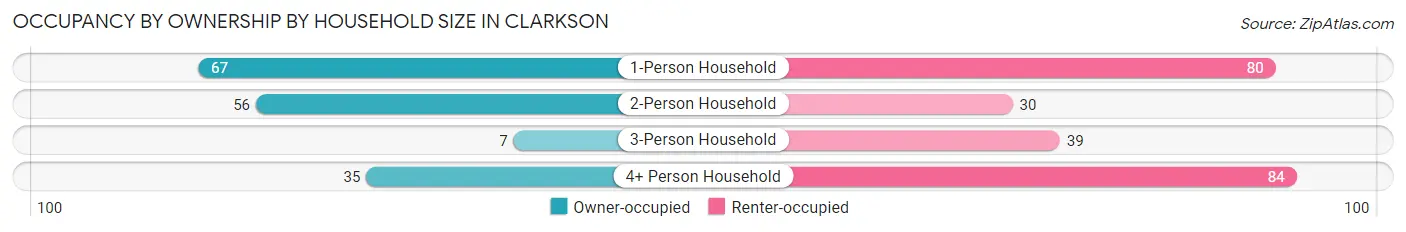
| Household Size | Owner-occupied | Renter-occupied |
| 1-Person Household | 67 (45.6%) | 80 (54.4%) |
| 2-Person Household | 56 (65.1%) | 30 (34.9%) |
| 3-Person Household | 7 (15.2%) | 39 (84.8%) |
| 4+ Person Household | 35 (29.4%) | 84 (70.6%) |
| Total Housing Units | 165 (41.5%) | 233 (58.5%) |
Occupancy by Educational Attainment in Clarkson
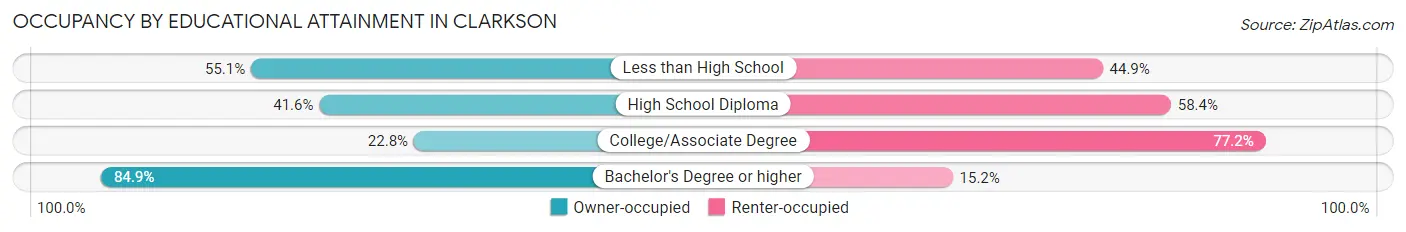
| Household Size | Owner-occupied | Renter-occupied |
| Less than High School | 27 (55.1%) | 22 (44.9%) |
| High School Diploma | 84 (41.6%) | 118 (58.4%) |
| College/Associate Degree | 26 (22.8%) | 88 (77.2%) |
| Bachelor's Degree or higher | 28 (84.9%) | 5 (15.1%) |
Occupancy by Age of Householder in Clarkson
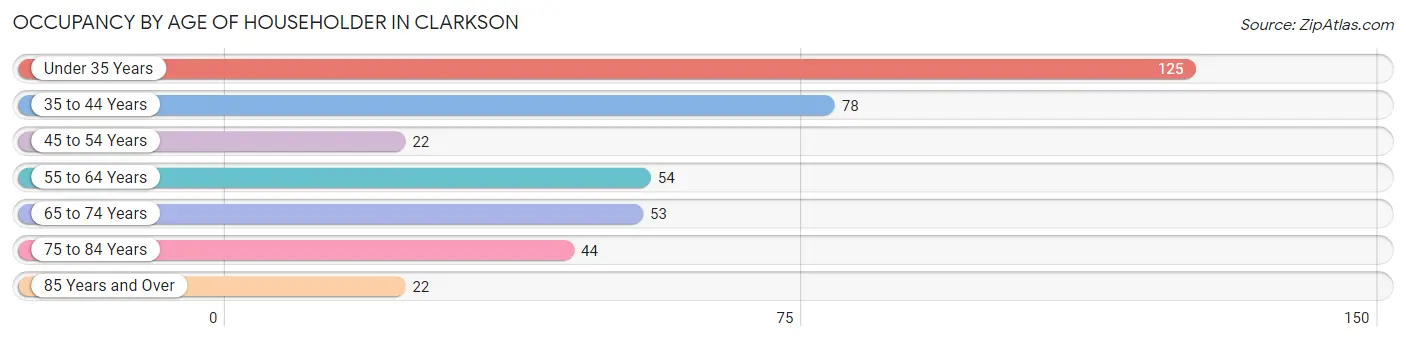
| Age Bracket | # Households | % Households |
| Under 35 Years | 125 | 31.4% |
| 35 to 44 Years | 78 | 19.6% |
| 45 to 54 Years | 22 | 5.5% |
| 55 to 64 Years | 54 | 13.6% |
| 65 to 74 Years | 53 | 13.3% |
| 75 to 84 Years | 44 | 11.1% |
| 85 Years and Over | 22 | 5.5% |
| Total | 398 | 100.0% |
Housing Finances in Clarkson
Median Income by Occupancy in Clarkson
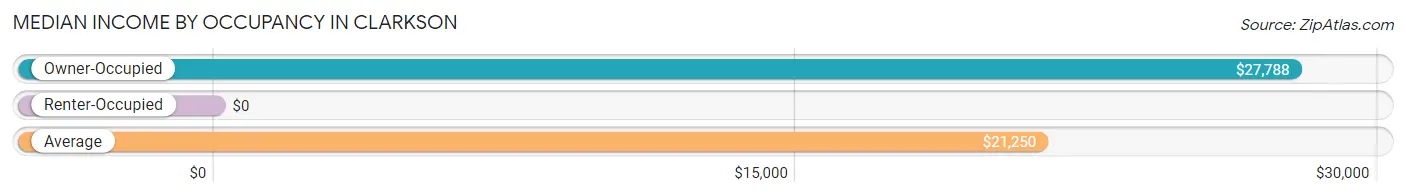
| Occupancy Type | # Households | Median Income |
| Owner-Occupied | 165 (41.5%) | $27,788 |
| Renter-Occupied | 233 (58.5%) | $0 |
| Average | 398 (100.0%) | $21,250 |
Occupancy by Householder Income Bracket in Clarkson
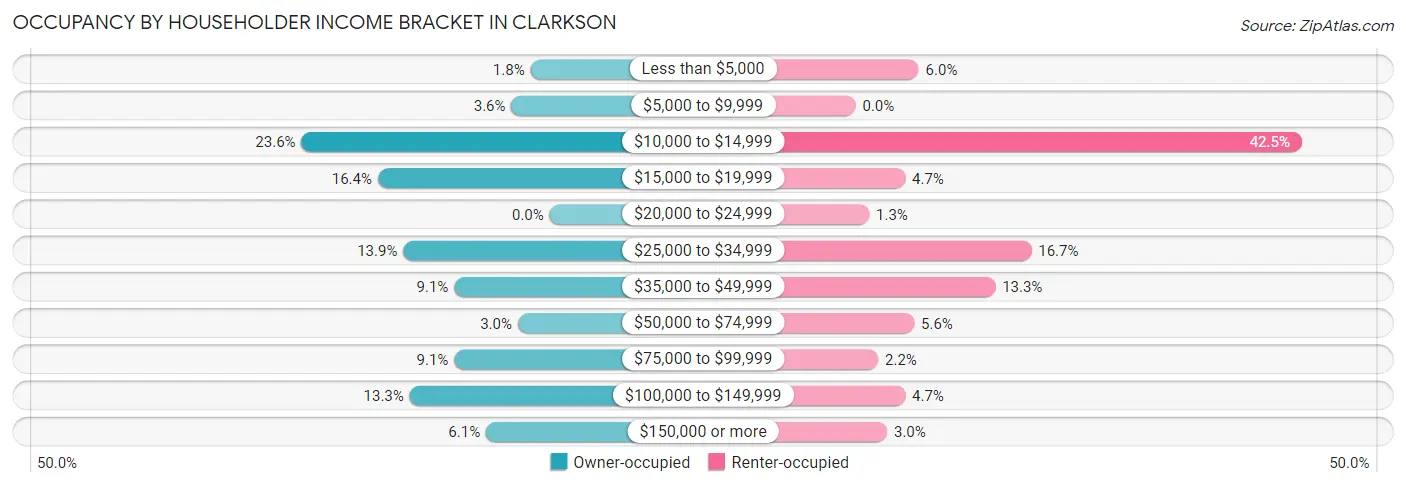
| Income Bracket | Owner-occupied | Renter-occupied |
| Less than $5,000 | 3 (1.8%) | 14 (6.0%) |
| $5,000 to $9,999 | 6 (3.6%) | 0 (0.0%) |
| $10,000 to $14,999 | 39 (23.6%) | 99 (42.5%) |
| $15,000 to $19,999 | 27 (16.4%) | 11 (4.7%) |
| $20,000 to $24,999 | 0 (0.0%) | 3 (1.3%) |
| $25,000 to $34,999 | 23 (13.9%) | 39 (16.7%) |
| $35,000 to $49,999 | 15 (9.1%) | 31 (13.3%) |
| $50,000 to $74,999 | 5 (3.0%) | 13 (5.6%) |
| $75,000 to $99,999 | 15 (9.1%) | 5 (2.1%) |
| $100,000 to $149,999 | 22 (13.3%) | 11 (4.7%) |
| $150,000 or more | 10 (6.1%) | 7 (3.0%) |
| Total | 165 (100.0%) | 233 (100.0%) |
Monthly Housing Cost Tiers in Clarkson
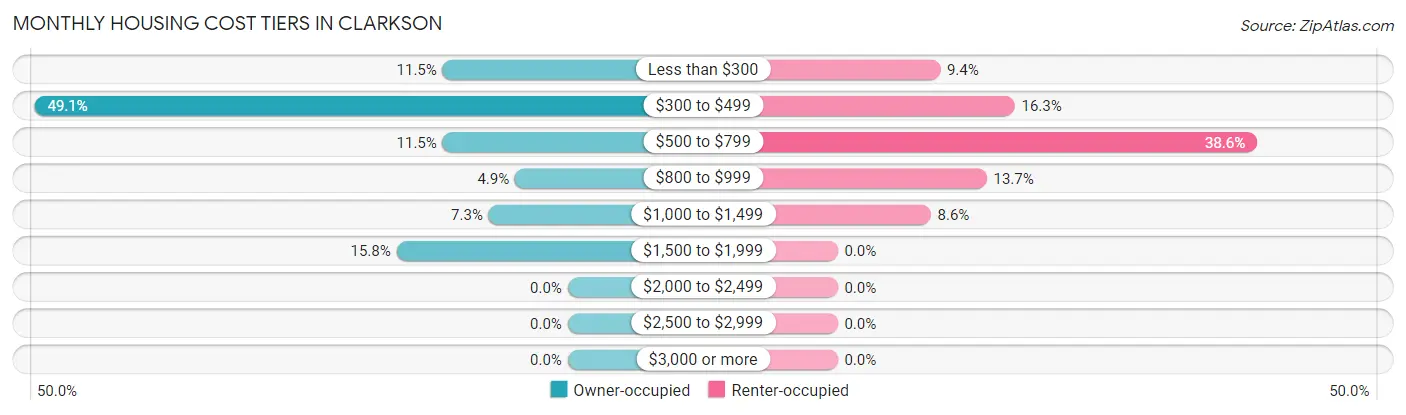
| Monthly Cost | Owner-occupied | Renter-occupied |
| Less than $300 | 19 (11.5%) | 22 (9.4%) |
| $300 to $499 | 81 (49.1%) | 38 (16.3%) |
| $500 to $799 | 19 (11.5%) | 90 (38.6%) |
| $800 to $999 | 8 (4.9%) | 32 (13.7%) |
| $1,000 to $1,499 | 12 (7.3%) | 20 (8.6%) |
| $1,500 to $1,999 | 26 (15.8%) | 0 (0.0%) |
| $2,000 to $2,499 | 0 (0.0%) | 0 (0.0%) |
| $2,500 to $2,999 | 0 (0.0%) | 0 (0.0%) |
| $3,000 or more | 0 (0.0%) | 0 (0.0%) |
| Total | 165 (100.0%) | 233 (100.0%) |
Physical Housing Characteristics in Clarkson
Housing Structures in Clarkson
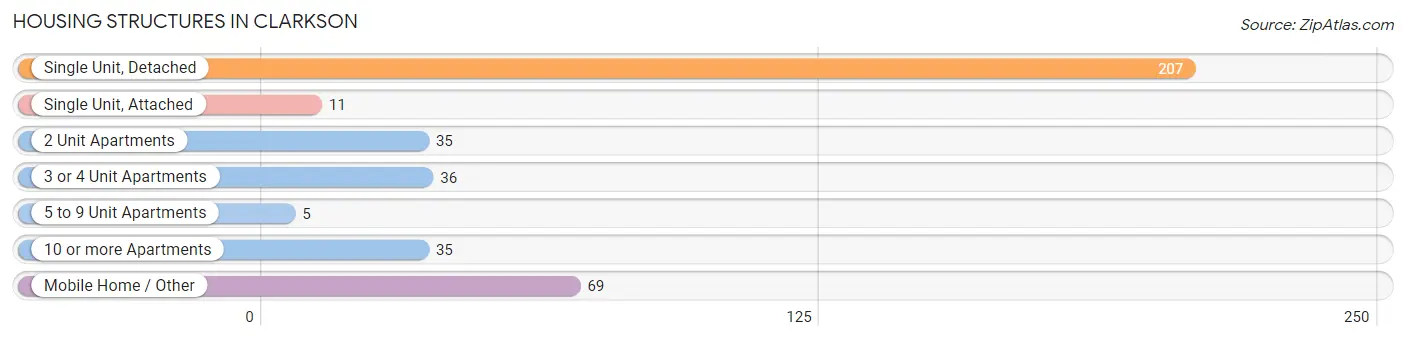
| Structure Type | # Housing Units | % Housing Units |
| Single Unit, Detached | 207 | 52.0% |
| Single Unit, Attached | 11 | 2.8% |
| 2 Unit Apartments | 35 | 8.8% |
| 3 or 4 Unit Apartments | 36 | 9.0% |
| 5 to 9 Unit Apartments | 5 | 1.3% |
| 10 or more Apartments | 35 | 8.8% |
| Mobile Home / Other | 69 | 17.3% |
| Total | 398 | 100.0% |
Housing Structures by Occupancy in Clarkson
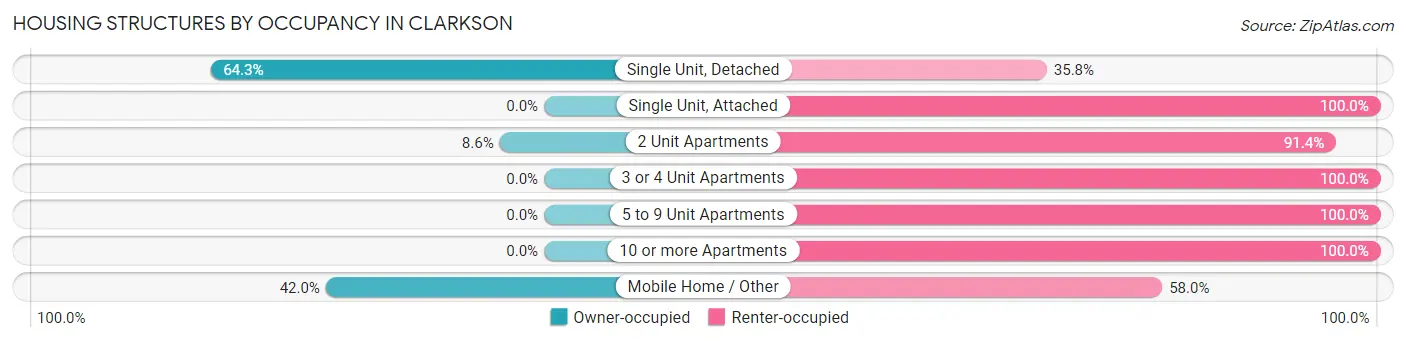
| Structure Type | Owner-occupied | Renter-occupied |
| Single Unit, Detached | 133 (64.2%) | 74 (35.7%) |
| Single Unit, Attached | 0 (0.0%) | 11 (100.0%) |
| 2 Unit Apartments | 3 (8.6%) | 32 (91.4%) |
| 3 or 4 Unit Apartments | 0 (0.0%) | 36 (100.0%) |
| 5 to 9 Unit Apartments | 0 (0.0%) | 5 (100.0%) |
| 10 or more Apartments | 0 (0.0%) | 35 (100.0%) |
| Mobile Home / Other | 29 (42.0%) | 40 (58.0%) |
| Total | 165 (41.5%) | 233 (58.5%) |
Housing Structures by Number of Rooms in Clarkson
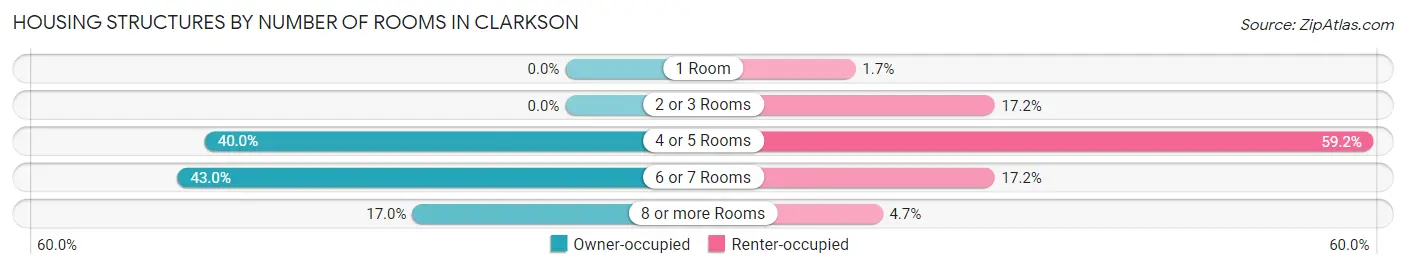
| Number of Rooms | Owner-occupied | Renter-occupied |
| 1 Room | 0 (0.0%) | 4 (1.7%) |
| 2 or 3 Rooms | 0 (0.0%) | 40 (17.2%) |
| 4 or 5 Rooms | 66 (40.0%) | 138 (59.2%) |
| 6 or 7 Rooms | 71 (43.0%) | 40 (17.2%) |
| 8 or more Rooms | 28 (17.0%) | 11 (4.7%) |
| Total | 165 (100.0%) | 233 (100.0%) |
Housing Structure by Heating Type in Clarkson
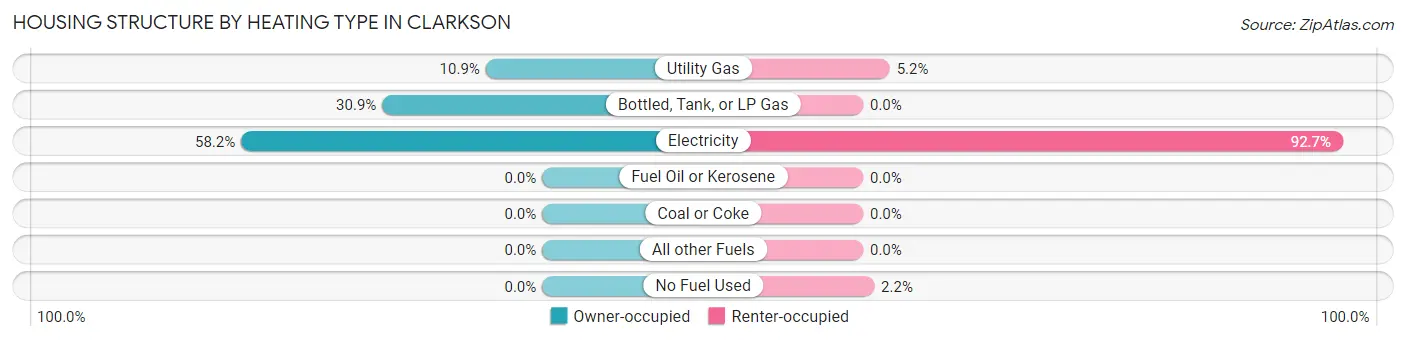
| Heating Type | Owner-occupied | Renter-occupied |
| Utility Gas | 18 (10.9%) | 12 (5.1%) |
| Bottled, Tank, or LP Gas | 51 (30.9%) | 0 (0.0%) |
| Electricity | 96 (58.2%) | 216 (92.7%) |
| Fuel Oil or Kerosene | 0 (0.0%) | 0 (0.0%) |
| Coal or Coke | 0 (0.0%) | 0 (0.0%) |
| All other Fuels | 0 (0.0%) | 0 (0.0%) |
| No Fuel Used | 0 (0.0%) | 5 (2.1%) |
| Total | 165 (100.0%) | 233 (100.0%) |
Household Vehicle Usage in Clarkson
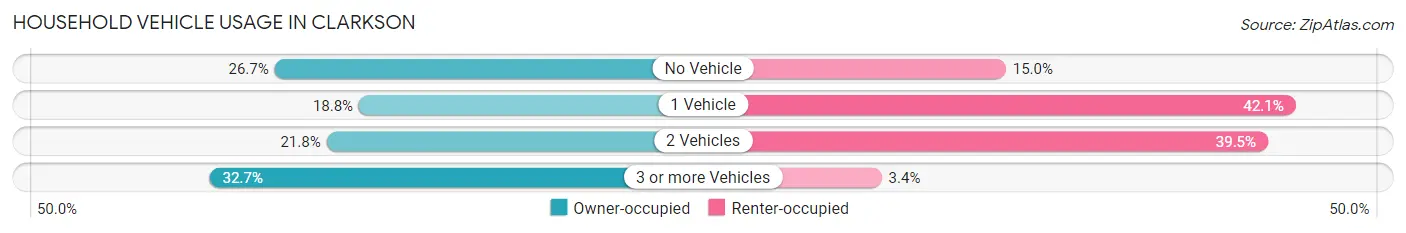
| Vehicles per Household | Owner-occupied | Renter-occupied |
| No Vehicle | 44 (26.7%) | 35 (15.0%) |
| 1 Vehicle | 31 (18.8%) | 98 (42.1%) |
| 2 Vehicles | 36 (21.8%) | 92 (39.5%) |
| 3 or more Vehicles | 54 (32.7%) | 8 (3.4%) |
| Total | 165 (100.0%) | 233 (100.0%) |
Real Estate & Mortgages in Clarkson
Real Estate and Mortgage Overview in Clarkson
| Characteristic | Without Mortgage | With Mortgage |
| Housing Units | 117 | 48 |
| Median Property Value | $90,300 | $179,200 |
| Median Household Income | $16,875 | $3 |
| Monthly Housing Costs | $427 | $0 |
| Real Estate Taxes | $467 | $0 |
Property Value by Mortgage Status in Clarkson
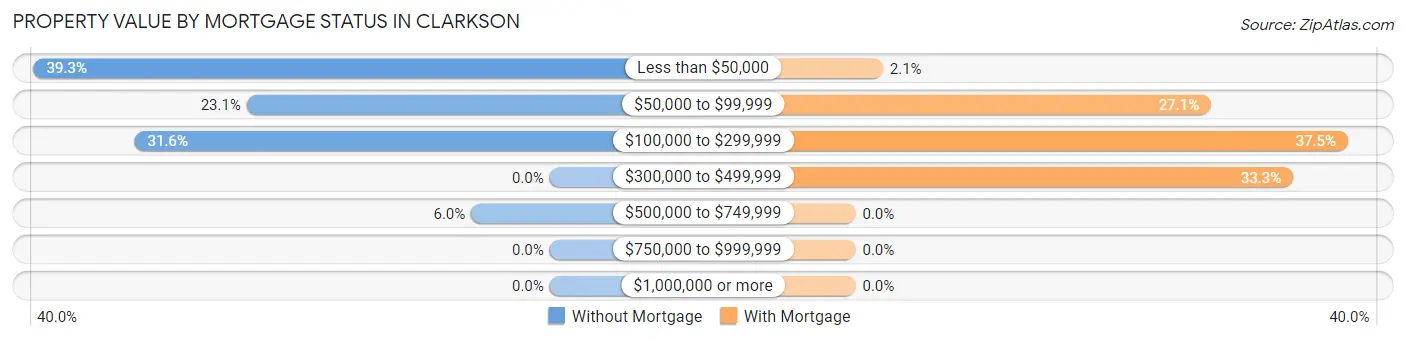
| Property Value | Without Mortgage | With Mortgage |
| Less than $50,000 | 46 (39.3%) | 1 (2.1%) |
| $50,000 to $99,999 | 27 (23.1%) | 13 (27.1%) |
| $100,000 to $299,999 | 37 (31.6%) | 18 (37.5%) |
| $300,000 to $499,999 | 0 (0.0%) | 16 (33.3%) |
| $500,000 to $749,999 | 7 (6.0%) | 0 (0.0%) |
| $750,000 to $999,999 | 0 (0.0%) | 0 (0.0%) |
| $1,000,000 or more | 0 (0.0%) | 0 (0.0%) |
| Total | 117 (100.0%) | 48 (100.0%) |
Household Income by Mortgage Status in Clarkson
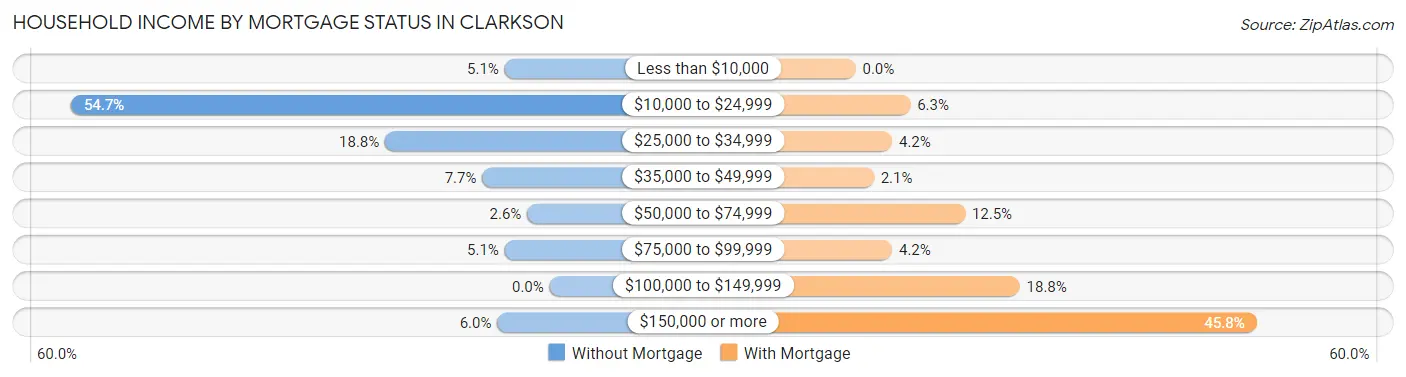
| Household Income | Without Mortgage | With Mortgage |
| Less than $10,000 | 6 (5.1%) | 0 (0.0%) |
| $10,000 to $24,999 | 64 (54.7%) | 3 (6.2%) |
| $25,000 to $34,999 | 22 (18.8%) | 2 (4.2%) |
| $35,000 to $49,999 | 9 (7.7%) | 1 (2.1%) |
| $50,000 to $74,999 | 3 (2.6%) | 6 (12.5%) |
| $75,000 to $99,999 | 6 (5.1%) | 2 (4.2%) |
| $100,000 to $149,999 | 0 (0.0%) | 9 (18.8%) |
| $150,000 or more | 7 (6.0%) | 22 (45.8%) |
| Total | 117 (100.0%) | 48 (100.0%) |
Property Value to Household Income Ratio in Clarkson
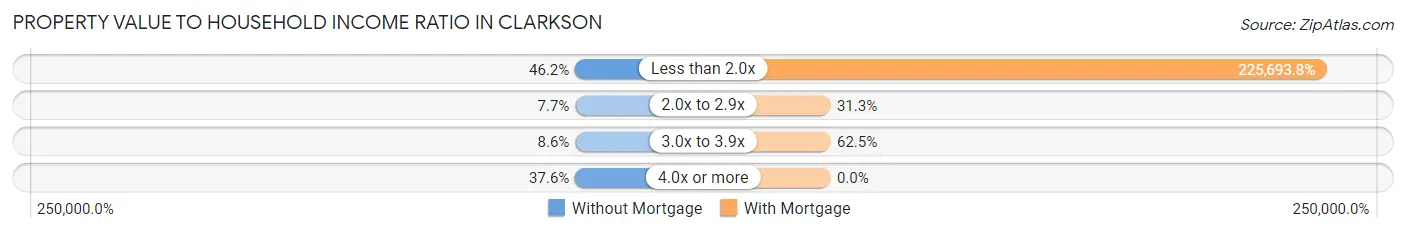
| Value-to-Income Ratio | Without Mortgage | With Mortgage |
| Less than 2.0x | 54 (46.2%) | 108,333 (225,693.8%) |
| 2.0x to 2.9x | 9 (7.7%) | 15 (31.2%) |
| 3.0x to 3.9x | 10 (8.6%) | 30 (62.5%) |
| 4.0x or more | 44 (37.6%) | 0 (0.0%) |
| Total | 117 (100.0%) | 48 (100.0%) |
Real Estate Taxes by Mortgage Status in Clarkson
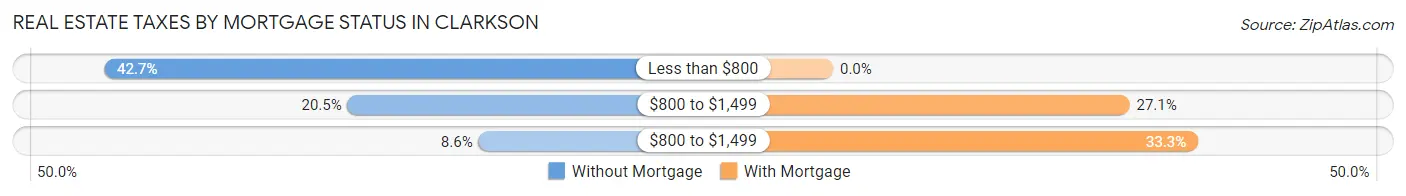
| Property Taxes | Without Mortgage | With Mortgage |
| Less than $800 | 50 (42.7%) | 0 (0.0%) |
| $800 to $1,499 | 24 (20.5%) | 13 (27.1%) |
| $800 to $1,499 | 10 (8.6%) | 16 (33.3%) |
| Total | 117 (100.0%) | 48 (100.0%) |
Health & Disability in Clarkson
Health Insurance Coverage by Age in Clarkson
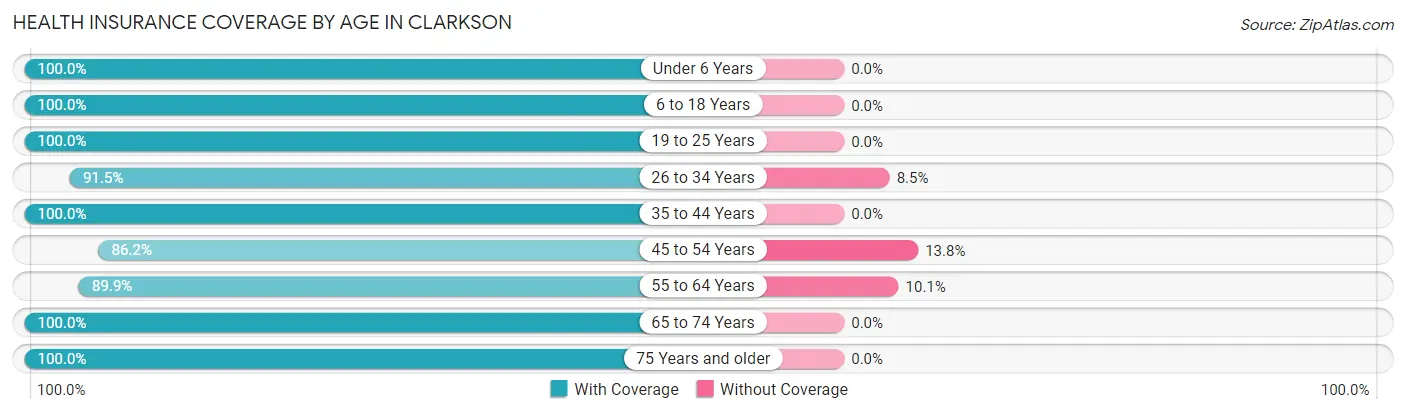
| Age Bracket | With Coverage | Without Coverage |
| Under 6 Years | 211 (100.0%) | 0 (0.0%) |
| 6 to 18 Years | 273 (100.0%) | 0 (0.0%) |
| 19 to 25 Years | 20 (100.0%) | 0 (0.0%) |
| 26 to 34 Years | 227 (91.5%) | 21 (8.5%) |
| 35 to 44 Years | 177 (100.0%) | 0 (0.0%) |
| 45 to 54 Years | 50 (86.2%) | 8 (13.8%) |
| 55 to 64 Years | 71 (89.9%) | 8 (10.1%) |
| 65 to 74 Years | 60 (100.0%) | 0 (0.0%) |
| 75 Years and older | 92 (100.0%) | 0 (0.0%) |
| Total | 1,181 (97.0%) | 37 (3.0%) |
Health Insurance Coverage by Citizenship Status in Clarkson
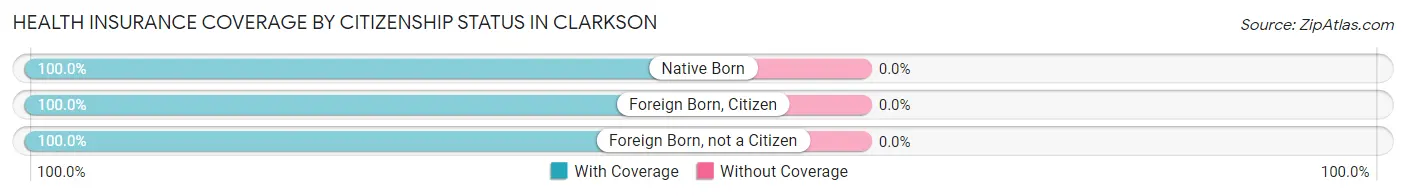
| Citizenship Status | With Coverage | Without Coverage |
| Native Born | 211 (100.0%) | 0 (0.0%) |
| Foreign Born, Citizen | 273 (100.0%) | 0 (0.0%) |
| Foreign Born, not a Citizen | 20 (100.0%) | 0 (0.0%) |
Health Insurance Coverage by Household Income in Clarkson
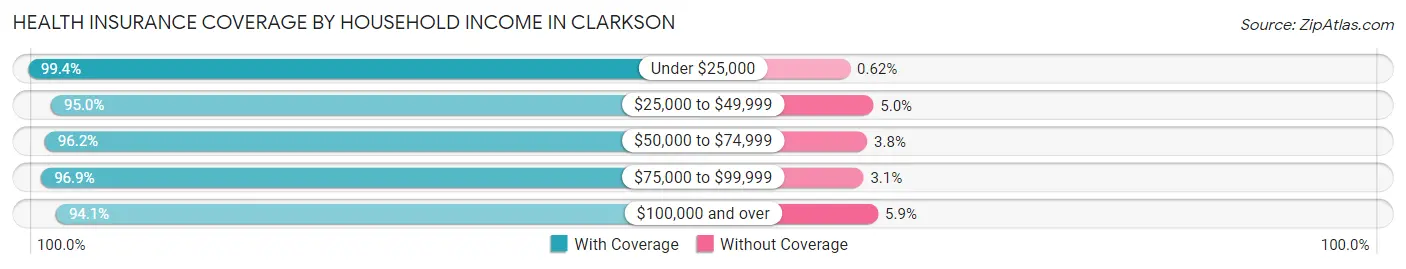
| Household Income | With Coverage | Without Coverage |
| Under $25,000 | 484 (99.4%) | 3 (0.6%) |
| $25,000 to $49,999 | 344 (95.0%) | 18 (5.0%) |
| $50,000 to $74,999 | 101 (96.2%) | 4 (3.8%) |
| $75,000 to $99,999 | 124 (96.9%) | 4 (3.1%) |
| $100,000 and over | 128 (94.1%) | 8 (5.9%) |
Public vs Private Health Insurance Coverage by Age in Clarkson
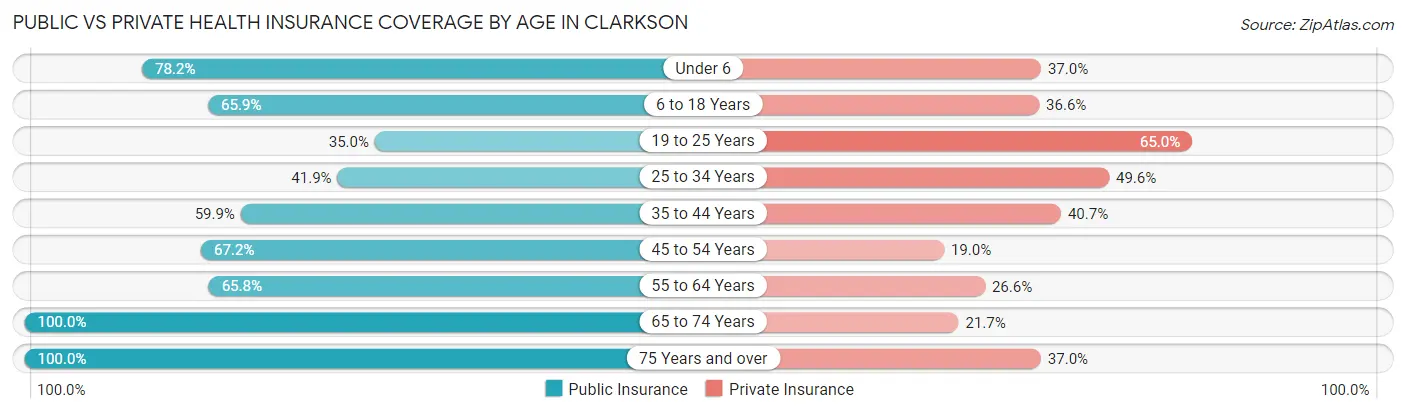
| Age Bracket | Public Insurance | Private Insurance |
| Under 6 | 165 (78.2%) | 78 (37.0%) |
| 6 to 18 Years | 180 (65.9%) | 100 (36.6%) |
| 19 to 25 Years | 7 (35.0%) | 13 (65.0%) |
| 25 to 34 Years | 104 (41.9%) | 123 (49.6%) |
| 35 to 44 Years | 106 (59.9%) | 72 (40.7%) |
| 45 to 54 Years | 39 (67.2%) | 11 (19.0%) |
| 55 to 64 Years | 52 (65.8%) | 21 (26.6%) |
| 65 to 74 Years | 60 (100.0%) | 13 (21.7%) |
| 75 Years and over | 92 (100.0%) | 34 (37.0%) |
| Total | 805 (66.1%) | 465 (38.2%) |
Disability Status by Sex by Age in Clarkson
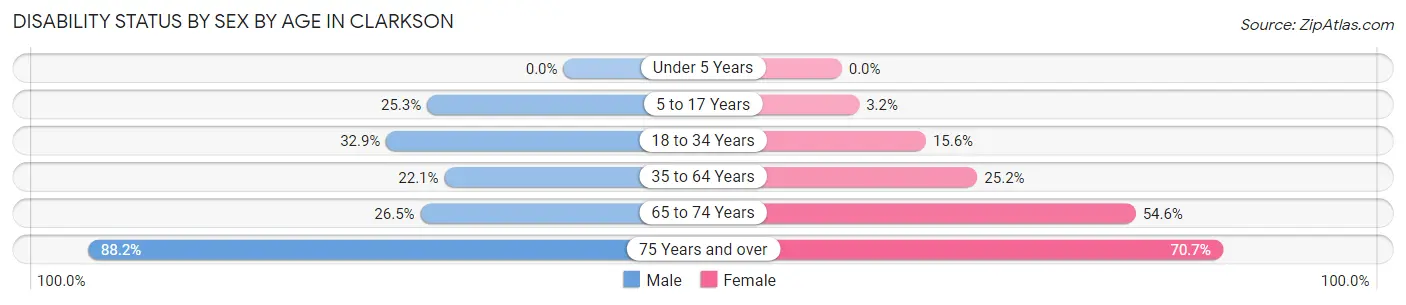
| Age Bracket | Male | Female |
| Under 5 Years | 0 (0.0%) | 0 (0.0%) |
| 5 to 17 Years | 21 (25.3%) | 7 (3.2%) |
| 18 to 34 Years | 48 (32.9%) | 20 (15.6%) |
| 35 to 64 Years | 36 (22.1%) | 38 (25.2%) |
| 65 to 74 Years | 13 (26.5%) | 6 (54.5%) |
| 75 Years and over | 15 (88.2%) | 53 (70.7%) |
Disability Class by Sex by Age in Clarkson
Disability Class: Hearing Difficulty
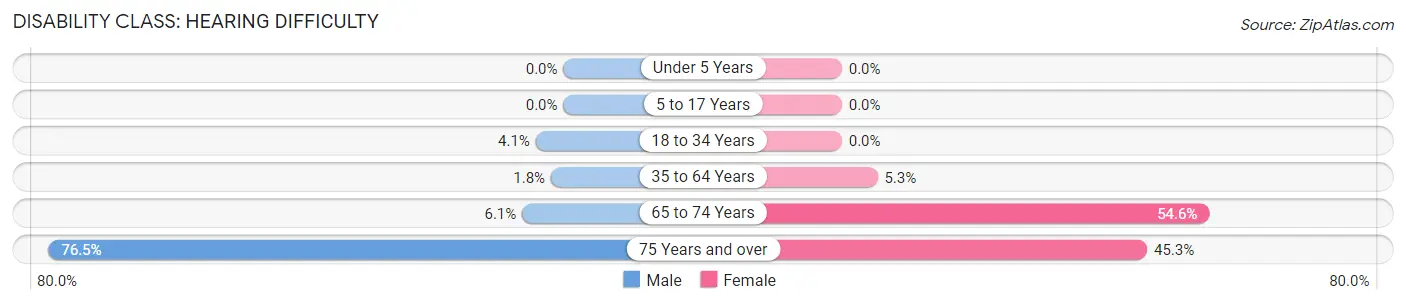
| Age Bracket | Male | Female |
| Under 5 Years | 0 (0.0%) | 0 (0.0%) |
| 5 to 17 Years | 0 (0.0%) | 0 (0.0%) |
| 18 to 34 Years | 6 (4.1%) | 0 (0.0%) |
| 35 to 64 Years | 3 (1.8%) | 8 (5.3%) |
| 65 to 74 Years | 3 (6.1%) | 6 (54.5%) |
| 75 Years and over | 13 (76.5%) | 34 (45.3%) |
Disability Class: Vision Difficulty
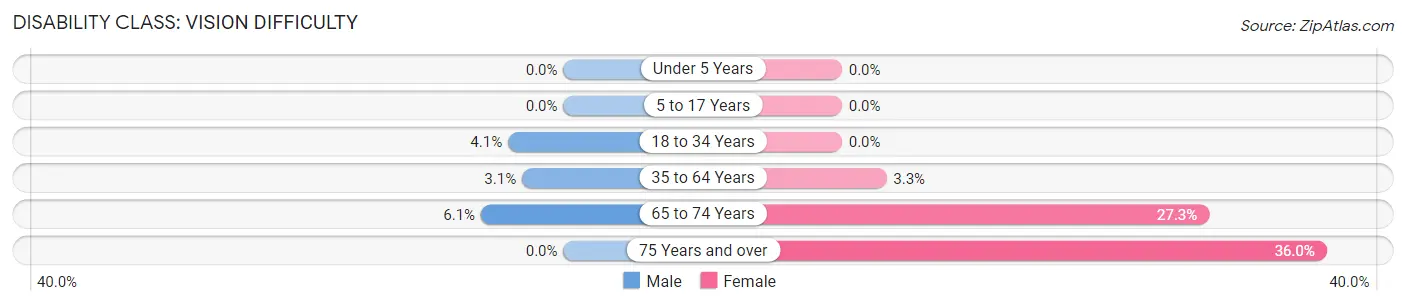
| Age Bracket | Male | Female |
| Under 5 Years | 0 (0.0%) | 0 (0.0%) |
| 5 to 17 Years | 0 (0.0%) | 0 (0.0%) |
| 18 to 34 Years | 6 (4.1%) | 0 (0.0%) |
| 35 to 64 Years | 5 (3.1%) | 5 (3.3%) |
| 65 to 74 Years | 3 (6.1%) | 3 (27.3%) |
| 75 Years and over | 0 (0.0%) | 27 (36.0%) |
Disability Class: Cognitive Difficulty
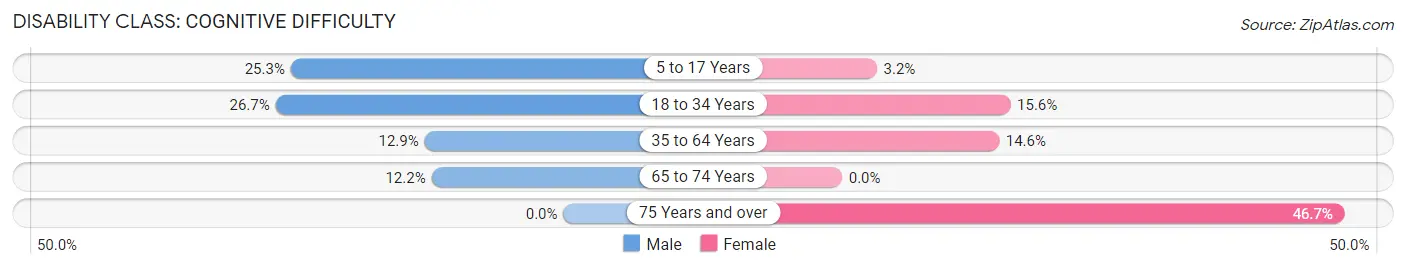
| Age Bracket | Male | Female |
| 5 to 17 Years | 21 (25.3%) | 7 (3.2%) |
| 18 to 34 Years | 39 (26.7%) | 20 (15.6%) |
| 35 to 64 Years | 21 (12.9%) | 22 (14.6%) |
| 65 to 74 Years | 6 (12.2%) | 0 (0.0%) |
| 75 Years and over | 0 (0.0%) | 35 (46.7%) |
Disability Class: Ambulatory Difficulty
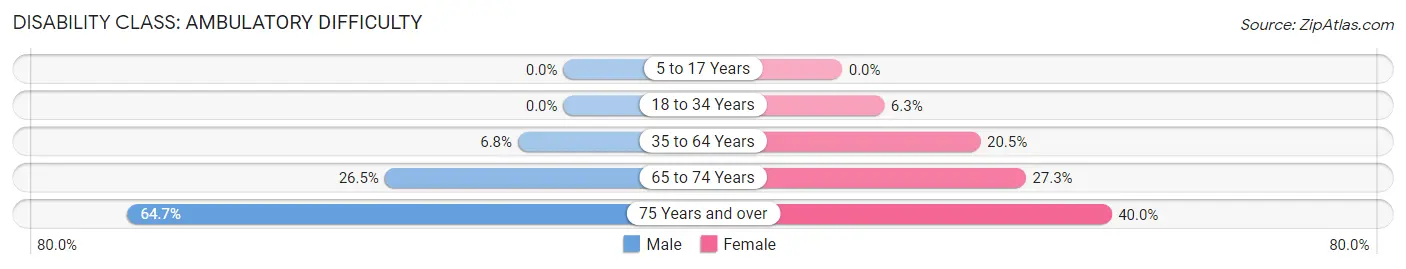
| Age Bracket | Male | Female |
| 5 to 17 Years | 0 (0.0%) | 0 (0.0%) |
| 18 to 34 Years | 0 (0.0%) | 8 (6.2%) |
| 35 to 64 Years | 11 (6.8%) | 31 (20.5%) |
| 65 to 74 Years | 13 (26.5%) | 3 (27.3%) |
| 75 Years and over | 11 (64.7%) | 30 (40.0%) |
Disability Class: Self-Care Difficulty
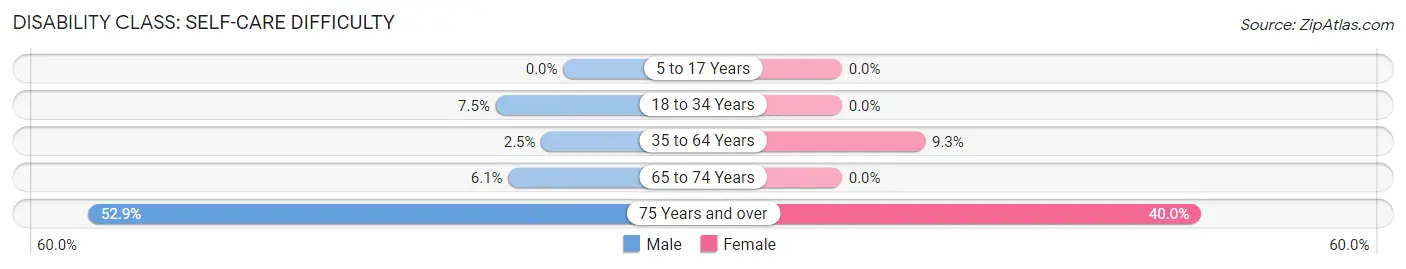
| Age Bracket | Male | Female |
| 5 to 17 Years | 0 (0.0%) | 0 (0.0%) |
| 18 to 34 Years | 11 (7.5%) | 0 (0.0%) |
| 35 to 64 Years | 4 (2.5%) | 14 (9.3%) |
| 65 to 74 Years | 3 (6.1%) | 0 (0.0%) |
| 75 Years and over | 9 (52.9%) | 30 (40.0%) |
Technology Access in Clarkson
Computing Device Access in Clarkson
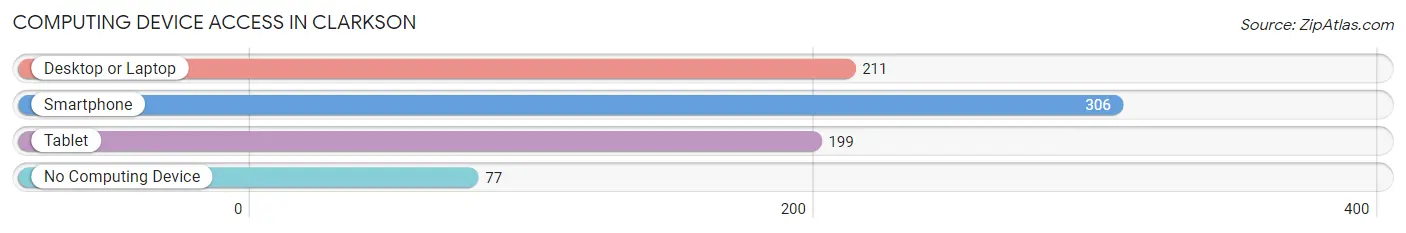
| Device Type | # Households | % Households |
| Desktop or Laptop | 211 | 53.0% |
| Smartphone | 306 | 76.9% |
| Tablet | 199 | 50.0% |
| No Computing Device | 77 | 19.4% |
| Total | 398 | 100.0% |
Internet Access in Clarkson
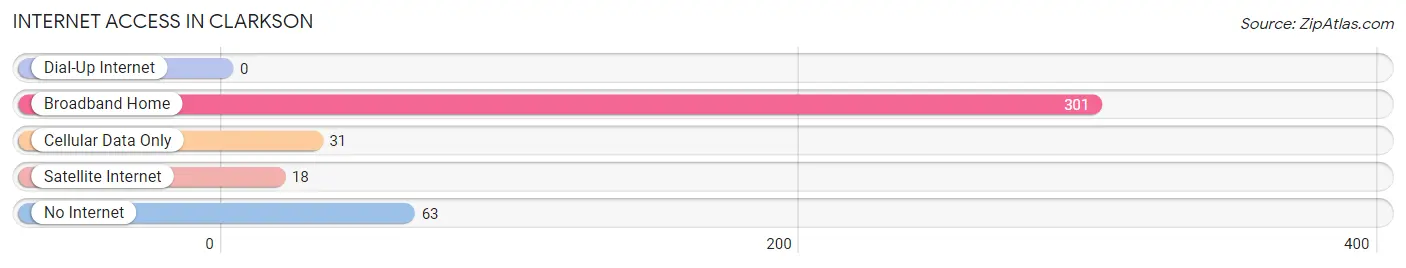
| Internet Type | # Households | % Households |
| Dial-Up Internet | 0 | 0.0% |
| Broadband Home | 301 | 75.6% |
| Cellular Data Only | 31 | 7.8% |
| Satellite Internet | 18 | 4.5% |
| No Internet | 63 | 15.8% |
| Total | 398 | 100.0% |
Clarkson Summary
Clarkson, Kentucky is a small city located in Grayson County, Kentucky. It is situated in the western part of the state, approximately 40 miles from Louisville. The city has a population of approximately 1,500 people and is the county seat of Grayson County.
Geography
Clarkson is located in the western part of Grayson County, Kentucky. It is situated on the banks of the Ohio River, which forms the border between Kentucky and Indiana. The city is located at the intersection of US Highway 62 and Kentucky Route 79. The city is surrounded by rolling hills and farmland, and is located in the heart of the Bluegrass region.
The climate in Clarkson is humid subtropical, with hot summers and mild winters. The average annual temperature is around 60 degrees Fahrenheit, with an average high of around 80 degrees in the summer and an average low of around 40 degrees in the winter. The average annual precipitation is around 45 inches.
Economy
The economy of Clarkson is largely based on agriculture and manufacturing. The city is home to several large manufacturing plants, including a paper mill, a steel mill, and a plastics plant. The city also has a large agricultural sector, with many farms located in the surrounding area.
The city also has a thriving tourism industry, with many visitors coming to the area to enjoy the natural beauty of the area. The city is home to several parks, including the Grayson County Park, which offers camping, fishing, and other outdoor activities.
Demographics
As of the 2010 census, the population of Clarkson was 1,500. The racial makeup of the city was 97.3% White, 0.7% African American, 0.2% Native American, 0.2% Asian, 0.2% from other races, and 1.6% from two or more races. Hispanic or Latino of any race were 0.7% of the population.
The median income for a household in the city was $31,250, and the median income for a family was $37,500. Males had a median income of $30,000 versus $21,250 for females. The per capita income for the city was $15,845. About 11.2% of families and 13.2% of the population were below the poverty line, including 16.7% of those under age 18 and 8.3% of those age 65 or over.
Conclusion
Clarkson, Kentucky is a small city located in Grayson County, Kentucky. It is situated in the western part of the state, approximately 40 miles from Louisville. The city has a population of approximately 1,500 people and is the county seat of Grayson County. The economy of Clarkson is largely based on agriculture and manufacturing, and the city also has a thriving tourism industry. The racial makeup of the city is predominantly White, with a small percentage of African American, Native American, Asian, and other races. The median income for a household in the city is $31,250, and the per capita income for the city is $15,845.
Common Questions
What is Per Capita Income in Clarkson?
Per Capita income in Clarkson is $16,900.
What is the Median Family Income in Clarkson?
Median Family Income in Clarkson is $29,500.
What is the Median Household income in Clarkson?
Median Household Income in Clarkson is $21,250.
What is Family Income Deficit in Clarkson?
Family Income Deficit in Clarkson is $16,288.
Families that are below poverty line in Clarkson earn $16,288 less on average than the poverty threshold level.
What is Inequality or Gini Index in Clarkson?
Inequality or Gini Index in Clarkson is 0.57.
What is the Total Population of Clarkson?
Total Population of Clarkson is 1,218.
What is the Total Male Population of Clarkson?
Total Male Population of Clarkson is 536.
What is the Total Female Population of Clarkson?
Total Female Population of Clarkson is 682.
What is the Ratio of Males per 100 Females in Clarkson?
There are 78.59 Males per 100 Females in Clarkson.
What is the Ratio of Females per 100 Males in Clarkson?
There are 127.24 Females per 100 Males in Clarkson.
What is the Median Population Age in Clarkson?
Median Population Age in Clarkson is 30.0 Years.
What is the Average Family Size in Clarkson
Average Family Size in Clarkson is 4.2 People.
What is the Average Household Size in Clarkson
Average Household Size in Clarkson is 3.1 People.
How Large is the Labor Force in Clarkson?
There are 467 People in the Labor Forcein in Clarkson.
What is the Percentage of People in the Labor Force in Clarkson?
61.0% of People are in the Labor Force in Clarkson.
What is the Unemployment Rate in Clarkson?
Unemployment Rate in Clarkson is 5.4%.